accademia nazionale dei lincei -...
TRANSCRIPT
ACCADEMIA NAZIONALE DEI LINCEIEstratto dai Rendiconti della Classe di Scienze fisiche, matematiche e naturali
Serie VIII, voI. LXXV,fase. 3~4- Ferie 1983 (Settembre-Ottobre)
Geodesia. - Planning and optimization oJ geodetic networks Jordetermining Jault movements. Nota (••) di PAOLO BALDI (•.••), MARCO
UNGUENDOLI (•••.••) e PAOLO GASPERINI (""""), presentata dal Corrisp. E.BOSCHI.
RIASSUNTO.- Le possibilità di applicazione delie moderne tecniche di ottlmlZzazione delle reti geodetiche, istituite per lo studio delle deformazioni del suolo in areesismiche, vengono analizzate prendendo in considerazione vari parametri, quali la preciilione, l'affidabilità, i costi e le indicazioni disponibili a priori sulle caratteristiche delfenomeno geofisico che si intende studiare.
INTRODUCTION
One of the aims that geophysics sets itself is to study recent crustal deformation activity at tectonic plate boundaries or in seismic areas, accumulatingquantitative data relating to as many of the parameters that characterize thespatial, temporal and energy spectra of these movements, and to deduce fromthis information the nature of deep crustal processes. Study of movementsin seismicaIly dangerous regions or near active faults and volcanoes wiII makeit possible to relate the surface effects to the stress pattern inside the crust.
This research may be carried out using geodetic methods, i.e. a set of techniques designed to measure lengths, directions, heights, gravity accelerationintensity and direction, as well as the variation of these quantities over time.
The degree of accuracy that may reasonably be attributed to geodeticallymeasured crustal deformations depends on the amount of time intervening bet-'ween measurements, on the rate of motion and on the precision of the measuring technique used.
There are a lot of problems that mayarise during geodetic data analysis;in seismic areas, for example, it is necessary to distinguish between deformations that are directly and temporaIIy related to the seismic event and, on theother hand, slow displacements which can be recorded over a lengthy period bothbefore and after the earthquake (Rikitake, 1976; Meissner, 1978). Whereas
(••) Pervenuta all' Accademia il 29 ottobre 1983.(•.••) Dipartimento di Fisica, Settore Geofisica. Università di Bologna.
(""") Istituto di Topografia, Geodesia e Geofisica Mineraria. Università di Bologna.
(•.•••.••) Istituto Nazionale di Geofisica. Roma.
128 Atti Aee. Lineei Rend. fis. - S. VIII, voI. LXXV, Ferie 1983, fase. 3-4
pre-seismic and co-seismic strain accumulation are general1y related to accumulating stress field and sudden faulting, the time-dependent deformation whichfollows the sudden slip on large earthquake faults may be related to the viscousrelaxation of the asthenosphere. Furthermore, it is necessary to take into account alI the processes which distort the strains and tilts produced by stres,>esin the earth, such as inhomogeneities in e1astic constants, cavities and topography, which give rise to deviations from the values theoretically obtainableon the basis of simple earth models.
CO-SEISMIC DEFORMATIONS
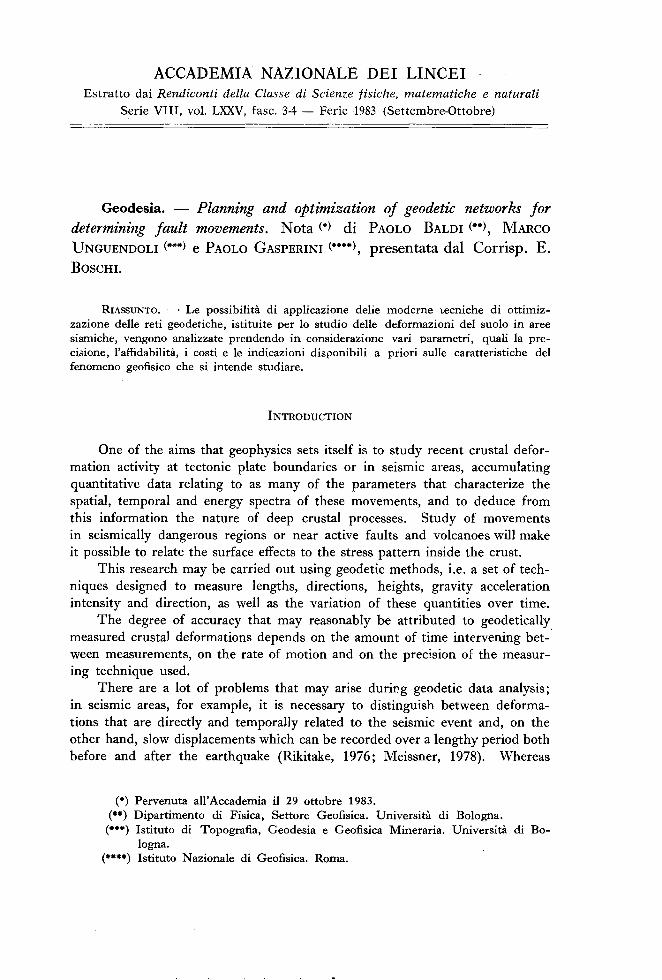
Important features of the earthquake mechanism include the size and shapeof the rupture surface, its orientation, the faulting motion on this surface, and
;,//".77 '"
/
"7
"7"/ " I>
/ '''"' Q
X
r---/44.4
r-
/-~/IL-.LLo.
L.." ,(,~ y
z
Fig. 1. - Vertieal and horizontal eomponents of displaeement, for a finite reetangularstrike-slip fauIt.
the time history of the processo Seismic data, in generai, provide informationabout seismic source mechanisms; geodetic surveys could provide importantadvances in our knowledge of earthquake source models.
Theoretical expressions for surface and subsurface deformations accompanying faulting, obtained on the basis of the elastic theory of dislocation (Chinnery, 1961; Maruyama, 1964), have been given by Press (1965), Mansinha and
ux
;cI:l:l:>t'"
.Sl
~Cz2l%l
ZooC~;cCl:>-'""1:1
l%l
:ll52
.•..•
~::I::I
~.I:l::II:l..
%....
~.~.I:l•...c·
.::1
~C'l
$"l
Y(km)
d=5km0= 25 km8= 75°
.... ----40 50
d=5km0= 15 km9= 75°
20lO
d=Okm
/O=15km
9= 90°d=5km0= 15 km
/'9=50°0'"'
0.2
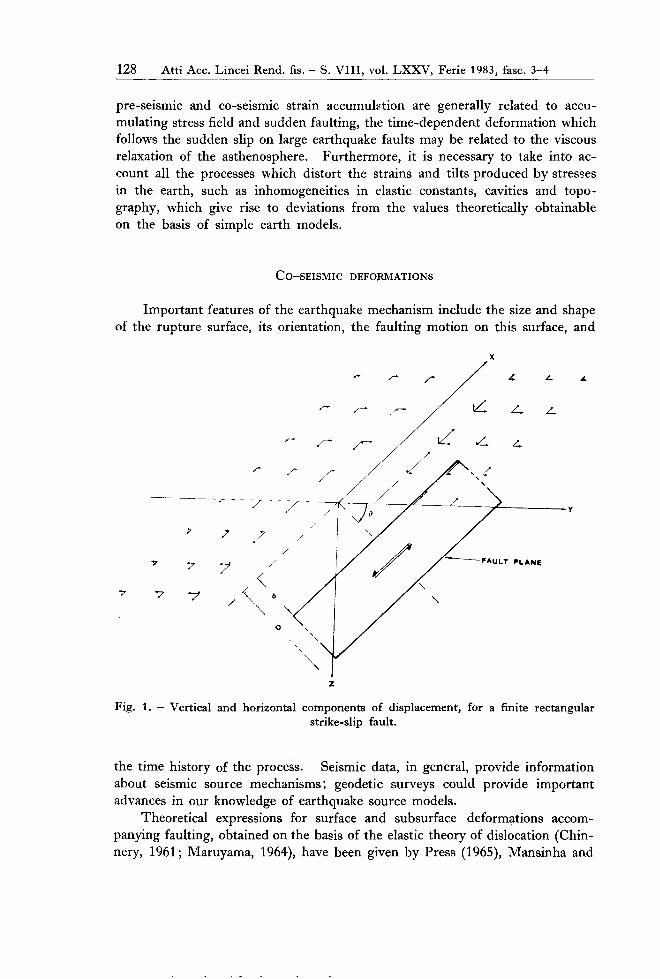
Fig. 2. - Ux component of displacement for different·parameters of a strike-slip fault. The displacement is given as afraction of the slip of the fault.
-N-o
130 Atti Acc. Lincei Rend. fis. - S. VIII, voI. LXXV, Ferie 1983, fase. 3-4
0.5
E
IZW~W()«...Ja..Cf)
Cl
.8
.6
.4
.2
b
T=0.5
~
357DEPTH (km)
a
0.2
E
IZW~W()«...Ja..Cf)
B
2 3DISTANCE FROM FAULT (km)
c
2 3DISTANCE FROM FAULT (km)
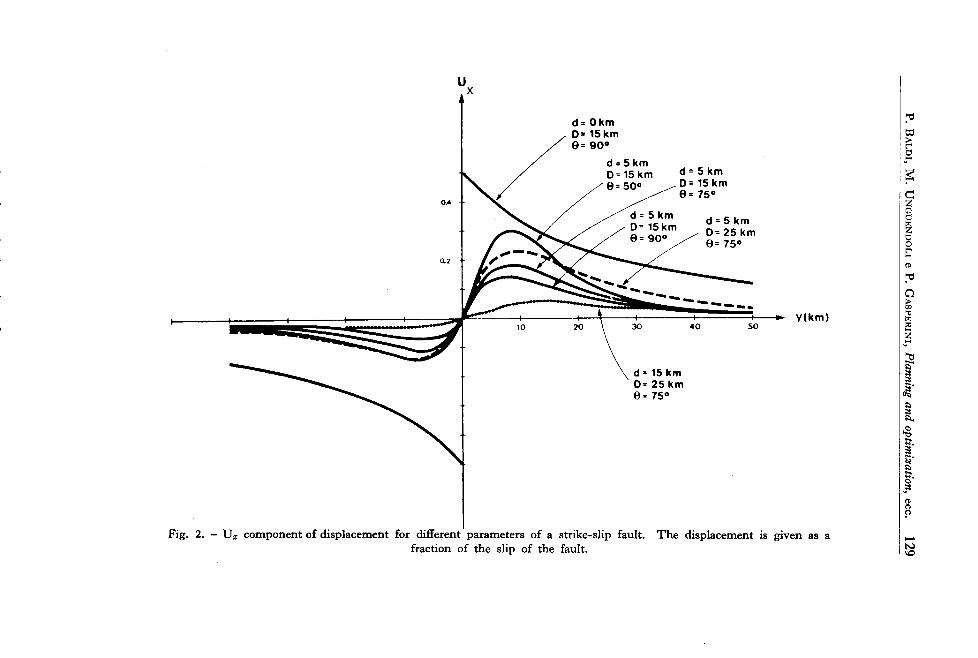
Fig. 3. - Normalized shear modulus as a function of depth (a); surface displacementas a function of distance from the fault: (b) surface fault case; (c) buried case. (Mahrer
and Nur, 1979).
Smyle (1971) and others. For example, the vertical and horizontal displacement components are derived for a finite rectangular strike-slip fault in a uniform elastic half-space with the geometry shown in fig. 1. In particular the
P. BALDI, M. UNGUENDOLI e P. GASPERINI, Planning and optimization, ecc. 131
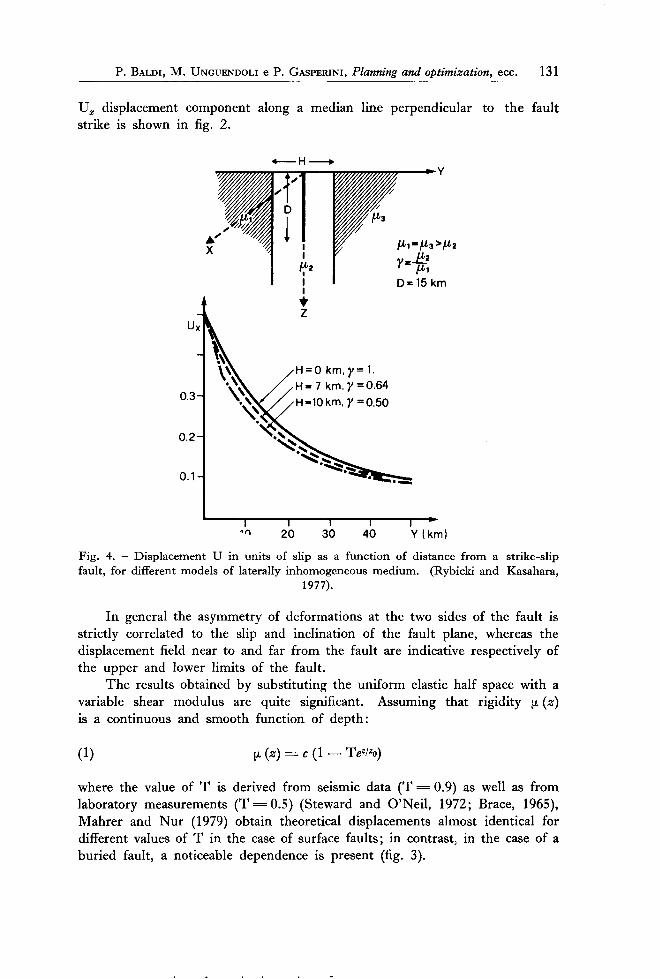
Ux displacement component along a median line perpendicular to the faultstrike is shown in fig. 2.
-H_y
II~2III•Z
Ux
0.3
0.2
0.1
H=O km, y= 1.H-7 km, y =0.64H-l0km, y =0.50
.....••
Fig. 4. - Displacement U in units of slip as a function of distance from a strike-slipfauIt, for different models of laterally inhomogeneous medium. (Rybicki and Kasahara,
1977).
In generaI the asymmetry of deformations at the two sides of the fault isstrictly correlated to the slip and inclination of the fault pIane, whereas thedisplacement field near to and far from the fault are indicative respectively ofthe upper and lower limits of the fault.
The results obtained by substituting the uniform elastic half space with avariable shear modulus are quite significant. Assuming that rigidity !l. (z)is a continuous and smooth function of depth:
(1) !l. (z) == c (1 - Tez/zo)
where the value of T is derived from seismic data (T = 0.9) as well as fromlaboratory measurements (T = 0.5) (Steward and O'Neil, 1972; Brace, 1965),Mahrer and Nur (1979) obtain theoretical displacements almost identical fordifferent values of T in the case of surface faults; in contrast, in the case of aburied fault, a noticeable dependence is present (fig. 3).
132 Atti Aee. Lineei Rend. fis. - S. VIII, voI. LXXV, Ferie 1983, fase. 3-4
For a model of a fault In a laterally inhomogeneous medium and in particular when a low rigidity zone is present around the fault, a strong distorsionof the strain field is introduced (fig. 4).
GEODETIC MEASUREMENTS
A series of high-precision levelling surveys is the most fruitful method farinvestigating vertical land movements; using this technique, it is possible toexamine in detail and with a high degree of accuracy (s.e. of height difference 1.
(mm) fj5(Km)) the displacements, even over sizeable regions.Vertical control networks should be planned bearing in mind a considerable
number of geophysical parameters, such as the area affected by the deformation,the characteristics of the displacement and its supposed magnitude, the densityof the bench-mark, also taking into account the high cost of measurements,the various possible level routes and the degree of accuracy expected.
As far as the accuracy of the measurements is concerned, there are in theoryno problems, given that high precision levelling only gives rise to errors that areproportionately negligible both in terms of the size of the co-seismic deformations, as well as in terms of background noise. The measurement of slowdeformations, such as pre-seismic and post-seismic ones, is a conceptuallydifferent problem, given that the accumulation of stress can cause surface deformations varying in intensity, distribution and speed.
It is therefore necessary, when planning the net, to bear in mind, not onlythe importance of a homogeneous distribution of datum points throughout thezone in question, and of the optimal configuration of the net itself, but alsothe costs and execution time involved which may make it impossible to repeatthe survey frequently. Problems which may arise in network adjustement,caused by vertical crustal movemeDt~ active during the period in which thesurvey is carried out, are overcome by combining this technique w:th continuoustilt components recorded by tiltmeters (Savage et al., 1979), and tidegauges.
Gravity remeasurements may to some extent substitute a levelling survey:the accuracy of the results thus obtained is less satisfactory but costs are lowerand less time is involved. Simultaneous monitoring of elevation and gravitational change can contribute further elements to the interpretation of the phenomena in question (Baldi and Postpischl, 1981). GeneraUy speaking, the gravityvariation corresponding to a vertical displacement caused by an accumulatingstress field in a seismic area, could be expressed as the sum of the free air andthe Bauguer effect plus the gravity contribution made by the subsurface densitychange related to the volumetric strain (Walsh and Rice, 1979).
The use of modern microgravimeters (e.g. LaCoste Romberg MOD. D)makes it possible to achieve extremely accurate results; standard errors smallerthan 5.10-8 mfsec2 may be obtained with very well constrained gravity nets(Marson and Morelli, 1979; Baldi and Marson, 1981). Improvement in theaccuracy of this technique depends to a very large extent an the elimination
P. BALDI, M. UNGUENDOLI e P. GASPERINI, Planning and optimization, ecc. 133
of effects caused by the earth tide, tidal loading, locaI water table level andatmospheric mass movements.
Horizontal crustal deformations may be measured by means of surveyin which angles and distances are involved; electromagnetic distance-measuringinstruments can determine distances to an accuracy of 1 ppm or less, accordingto tre ability to estimate the average propagation speed of light in the atmosphere, using meteorological measurements (Owens, 1967; Baldi and Unguendoli, 1982) or by means of the simultaneous measurement of optical path lengthat two or three different wavelengths (Slater and Hugget, 1976).
With a view to developing adequa te geodetic networks, some criteria, such2S accuracy, reliabiJity and expense need to be considered as regards the optimization of the net. Such optimization is usually classified in four differentorders, starting from a parametric adjustment based on the observation equation:
(2) Ax-d=v
which, by means of a least square solution and following the free adjustmentscheme, gives:
(3) x = (AT PA)+ AT P d
with the co-variance matrix:
(4)
where A is the configuration matrix, P the weight matrix, ero is the variance ofthe unit weight and ( )+ denotes the Moore-Penrose inverse.
In the case of planimetric networks, for example, disregarding the " Zeroorder design " relating to the optimal reference system, the optimization processis carried out by means of "First, Second and Third order design ", whichrelate respectively to the configuration of the net and the observational pian,to the search for an optimal distribution of observation weights, and to the improvement of the net by the inclusion of additional points and/or observations(Schmitt, 1982).
As regard the " First order design ", the theoretical approach is severelyconstrained by topograhy and by information relating to the geophysical phenomenon in questiono On the basis of point distribution, measurements shouldbe planned while seeking the greatest reliability and precision possible, withoutforgetting the question of cost. The most practical approach is the interactivesimulation.
One of the criteria used to evaIuate the reliability of a net, that is to sayits resistance to gross observation errors, is based on the analysis of the diagonalelements r of the matrix R, where:
(5) R = AQxx AT P - I .
134 Atti Aee. Lineei Rend. fis. - S. VIII, voI. LXXV, Ferie 1983, fase. 3-4
These elements may vary from O to 1; good reliability can be obtained forhigh values of r i, as well as with a homogeneous distribution of such valuesthroughout the entire net (Winner, 1981).
Once the network has been drawn up and the theoretical aspect of themeasurements established, it is possible to take steps to improve the accuracyof the single measurements, with a view to obtaining a better overall networkdesigno This may be done by seeking a method of weighting the measurementsthemselves which responds more satisfactorily to the needs for which the measurements are taken (Second order design).
In effect, the analytic approach is founded on the solution of the followingequation, as it relates to P:
(6)
in which the criterion matrix Q must be defined in advance.In generaI, a geodetic net ought to tend towards homogeneity and isotropy.
In this case, the Q is normally constructed using the Tailor-Karman structuresolution (Grafarend, 1972, Wimmer, 1981) the simplest case of which may bereduced to the equation:
(7) Q=I
where I is the unit matrix, involving the drawback that the co-vanancebetween the coordinates is assumed to be zero.
A different approach, which appear to yield results more in line with realneeds, consists in the use of the singular value decomposition of the matrix Qof the net:
(8)
where the diagonal matrix À contains the eigenvalues of Qxx, and V is thematrix of the corresponding orthonormalized eigenvectors. A possible derivation of the criterion matrix might consist in contracting the eigenvalue spectrum, without changing the eigenvectors, with a consequent diminution in thesemiaxes of the error ellipses. A different approach, of particular interest inthe study of deformations, might be that of obtaining a variation in the orientations of the semiaxes of the error ellipses, by rotating the eigenvectors matrix V(Crosilla, 1982). In any case this method is severely limited by the shape ofthe net, and therefore the results obtainable are generally negligible.
EXAMPLES
In the case of a fault. even supposing that the terrain is such as to permitone to choose the distribution of points in total freedom, there nevertheless
P. BALDI, M. UNGUENDOLI e P. GASPERINI, Planning and optimization, ecc. 135
xN
S'
S' ·w~
~
o~ll,)
$:lu"'Wc
/ I.. 1I~ I I~;: I 'J('i I l. t::.•..ll,)
E'13
<Il". .J~T"-./\Io~_Jo.
....o
ll,)
~S'
"'~M1E
;:\1\1 ll,)
.J:lurn.•..$:l
~T··/I Y.. X IIll,)
o •..- ~QIvibD
.~
~~;:
J;:e:
é=I~•. ~"'
>-. ,
136 Atti Aee. Lineei Rend. fis. - S. VIII, voI. LXXV, Ferie 1983, fase. 3-4
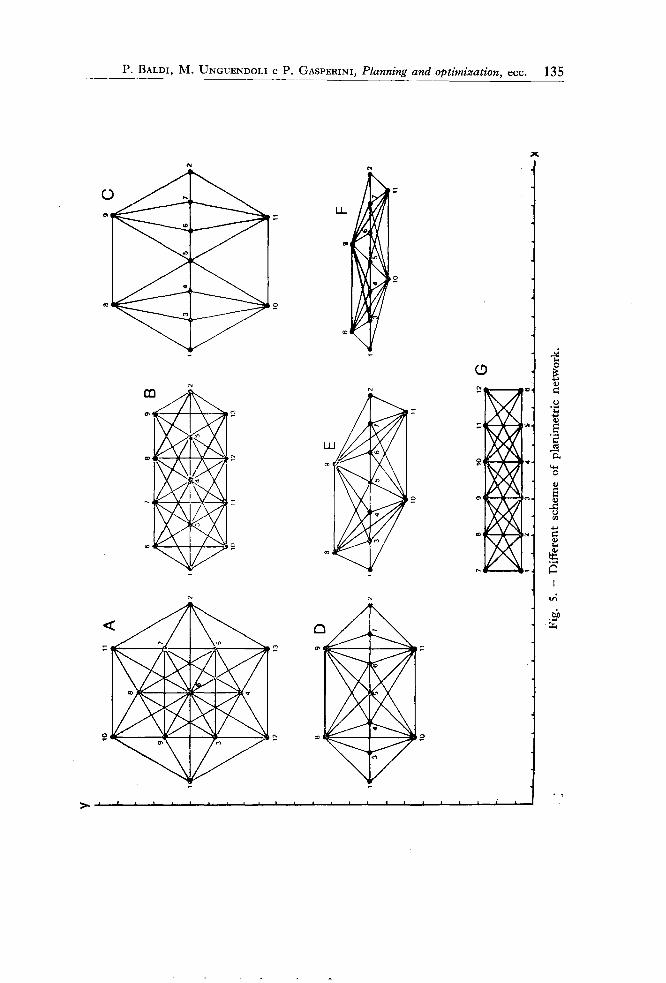
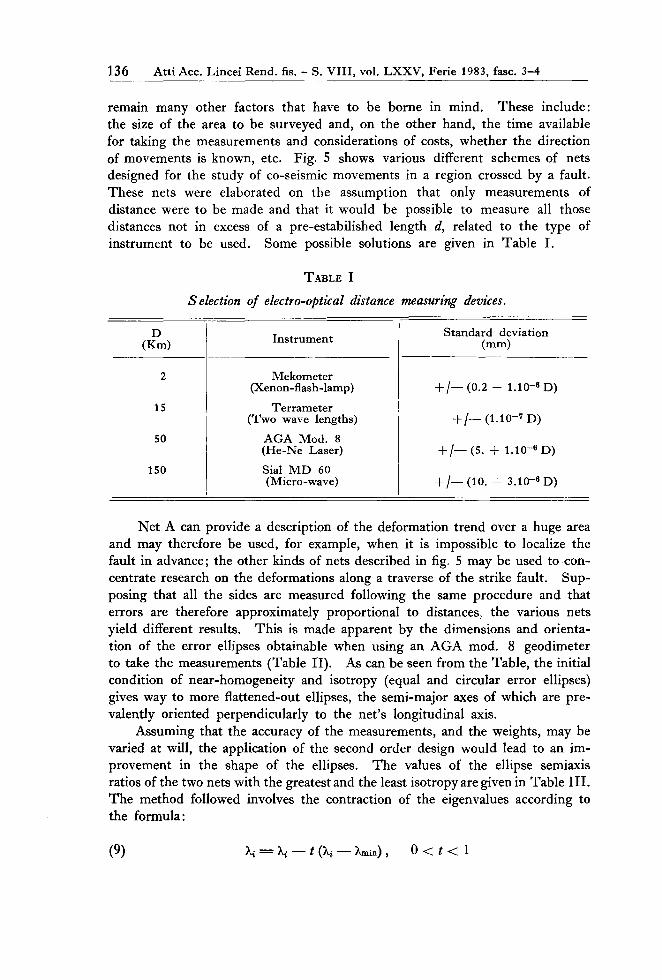
remain many other factors that have to be bome in mind. These include:the size of the area to be surveyed and, on the other hand, the time availablefor taking the measurements and considerations of costs, whether the directionof movements is known, etc. Fig. 5 shows various different schemes of netsdesigned for the study of co-seismic movements in a region crossed by a fauIt.These nets were elaborated on the assumption that only measurements ofdistance were to be made and that it would be possible to measure all thosedistances not in excess of a pre-estabilished length d, related to the type ofinstrument to be used. Some possible solutions are given in Table I.
TABLE IS election oJ electro-optical distance measuring devices.
D InstrumentIStandard deviation
(Km)(mm)
2
Mekometer(Xenon -flash -lamp) I+ /- (0.2 + 1.10-6 D)
15
I Terrameter !
(Two wave lengths)+/- (1.10-7 D)
SO
I AGA Mod. 8(Re-Ne Laser)
+/- (S. + 1.10-6 D)
150
Sia l MD 60(Miero-wave)
+/- (10. + 3.10-6 D)
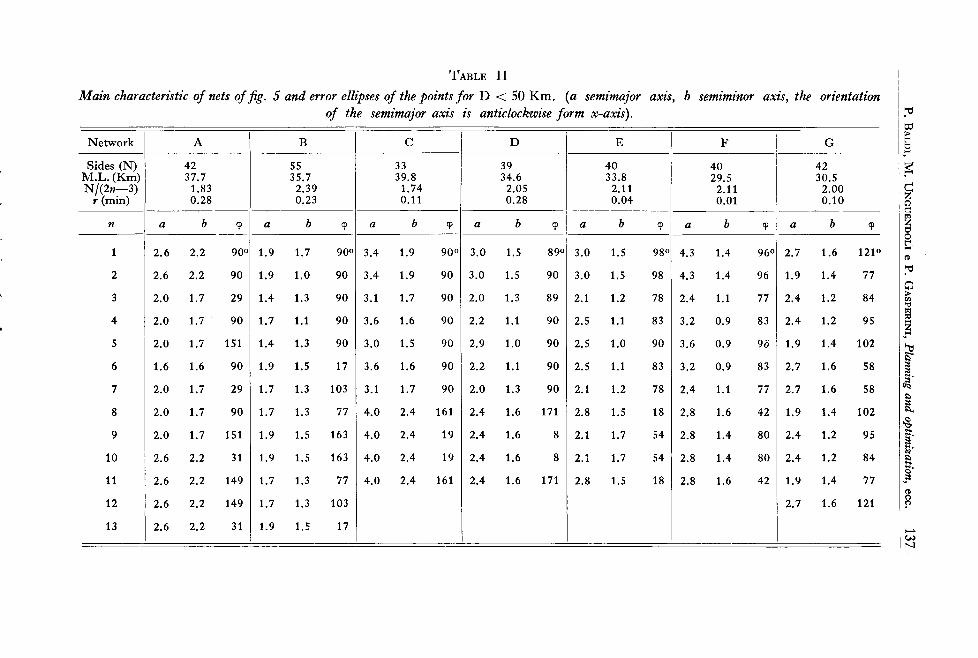
Net A can provide a description of the deformation trend over a huge areaand may therefore be used, for example, when it is impossible to localize thefault in advance; the other kinds of nets described in fig. 5 may be used to concentrate research on the deformations along a traverse of the strike fault. Supposing that aIl the sides are measured foIlowing the same procedure and thaterrors are therefore approximately proportional to distances the various netsyield different resuIts. This is made apparent by the dimensions and orientation of the error ellipses obtainable when using an AGA modo 8 geodimeterto take the measurements (Table II). As can be seen from the Table, the initialcondition of near-homogeneity and isotropy (equal and circular error ellipses)gives way to more flattened-out eIlipses, the semi-major axes of which are prevalently oriented perpendicularly to the net's longitudinal axis.
Assuming that the accuracy of the measurements, and the weights, may bevaried at wilI, the application of the second order design would lead to an improvement in the shape of the eIlipses. The values of the eIlipse semiaxisratios of the two nets with the greatest and the least isotropy are givenin Table 111.The method followed involves the contraction of the eigenvalues according tothe formula:
(9) À· = À· - t (À' -" .), , t 1\miD.,
~c::zCle~t:loC(1)
;O
q:>tn'O
~--~
~::!::!
~.!:l::!!:l..
.g•.•.
~.~.!:l•.•.c'~::!
(1)C'l!'
le
Network ABCI
D EFG
Sides (N)
425533!39 404042
M.L.(Km)37.735.739.834.633.829.530.5
N/(2n-3)1.832.391.742.052.112.112.00
r (min)0.280.230.110.280.040.010.10~----
------n
ab(jl
a b(jl
a b(jl
a b(jl
a b(jl
a b(jl
a b(jl
1
2.62.290°1.91.790°3.41.990°3.01.589°3.01.598°4.31.4
96°12.71.6
121°
2
2.62.2901.91.0903.41.9903.01.5903.01.5984.31.4961.91.477
3
2.01.7291.41.3903.11.7902.01.3892.11.2782.41.1772.41.284
4
2.01.7901.71.1903.61.6902.21.1902.51.1833.20.9832.41.295
5
2.01.71511.41.3903.01.5902.91.0902.51.0903.60.9951.91.4102
6
1.61.6901.91.5173.61.6902.21.1902.51.1833.20.9832.71.658
7
2.01.7291.71.31033.11.7902.01.3902.11.2782.41.1772.71.658
8
2.01.7901.71.3774.02.41612.41.61712.81.5182.81.6421.91.4102
9
2.01.71511.91.51634.02.4192.41.682.11.7542.81.4802.41.295
lO
2.62.2311.91.51634.02.4192.41.682.11.7542.81.4802.41.284
Il
2.62.21491.71.3774.02.41612.41.61712.81.5182.81.6421.91.477
12
2.62.21491.71.3103 2.71.6121
13
12.62.2311.91.517
\
TABLE IIMain characteristic oJ nets oJfig. 5 and error ellipses oJ the points Jor D < 50 Km. (a semimajor axis, b semiminor axis, the orientation
oJ the semimajor axis is anticlockwise Jorm x-axis). I ;Ot:l:l:>t"
sa
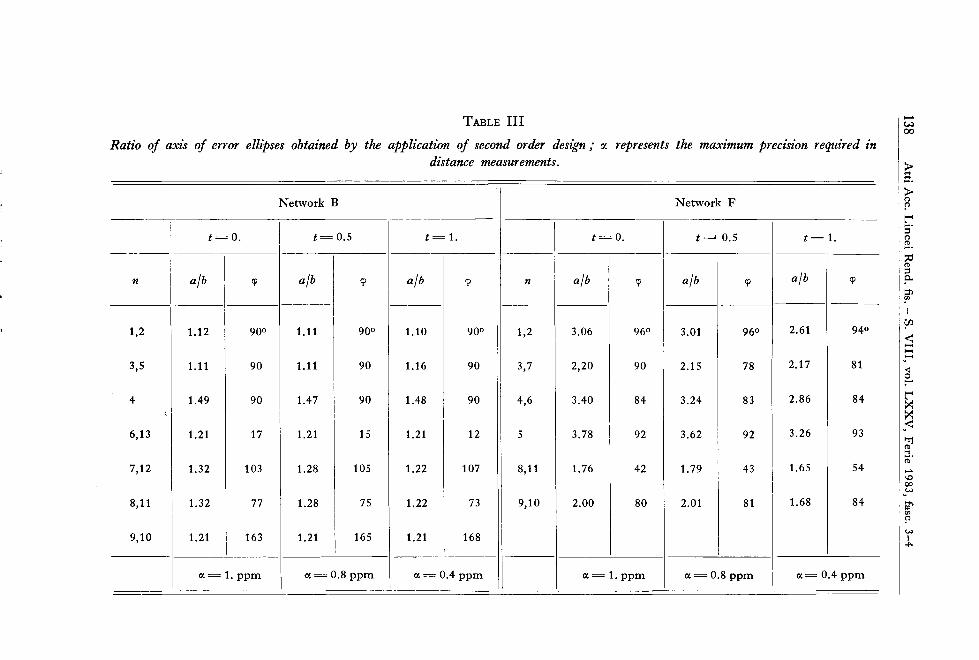
TABLE IIIRatio oj axis oj error ellipses obtained by the application oj second order design,. O( represents the maximum precision required in
distance measurements.
•.....•.w00
~:t.
3,
n
1,
4
6,
7,
8,
9,
Network B INetwork F-~I
I
t=O.t=0.5t= 1. t=O.
I
t ==i 0.5 t= 1.
I
a/b
tpa/btpa/btpna/btpa/btp
a/btp
I--
!~~
2
1.1290°1.1190°1.1090°1,23.0696°3.0196°2.6194°
5
1.11901.11901.16903,72,20902.15782.1781
,1.49
901.47901.48904,63.40843.24832.8684"
.I
13
1.21171.21151.211253.78923.62923.2693
12
1.321031.281051.221078,111.76421.7943i
1.65 54
I11
1.32771.28751.22739,102.00802.01811.6884
10
1.211631.211651.21168
ex= 1. pprn
ex= 0.8 pprnex= 0.4 pprnex= 1. pprnex= 0.8 pprnI
ex= 0.4 pprn >-(')r>
t"'S·(')~.:;e('1)
;:lp.;:n?'I
çn
<:--~-<:
?--
~
~~'Tj('1)...•
c;.\Cl00w
li!'rnr>
wI
"""
P. BALDI, M. UNGUENDOLI e P. GASPERINI, Planning and optimization, ecc. 139
p.1
0·5
2·' 2-l] H o 1-6
\.) 2'5
(,07 \ 0'\ \ 809 \ 2-l ]
4-7 "°8 "-I l 4'12\'7 \.\ I 2'8 2'126·\ o <Jo\)7011 8·\ 25-8 5'12 N ]olI
2-8 2·\ 2
0·1
SIDES
r ...11
11'\)
0·5
o
" ......
"." .
... . . •••. •.• 7·1 l 8-1 2
50. 5'1 2 3-7 3-1 \
~._- •••• , \.) 2'5 ',\2'. " ••• ,·7 ~i8] '"'U o M" •• ~.~ "~: \010 209 N]
'•••.. M \N]\ •••••• 607 10'\17·' 11'\ 2'-- ... - ..•
"\'"-' .,.....-----
0.1
155
130
SIDES
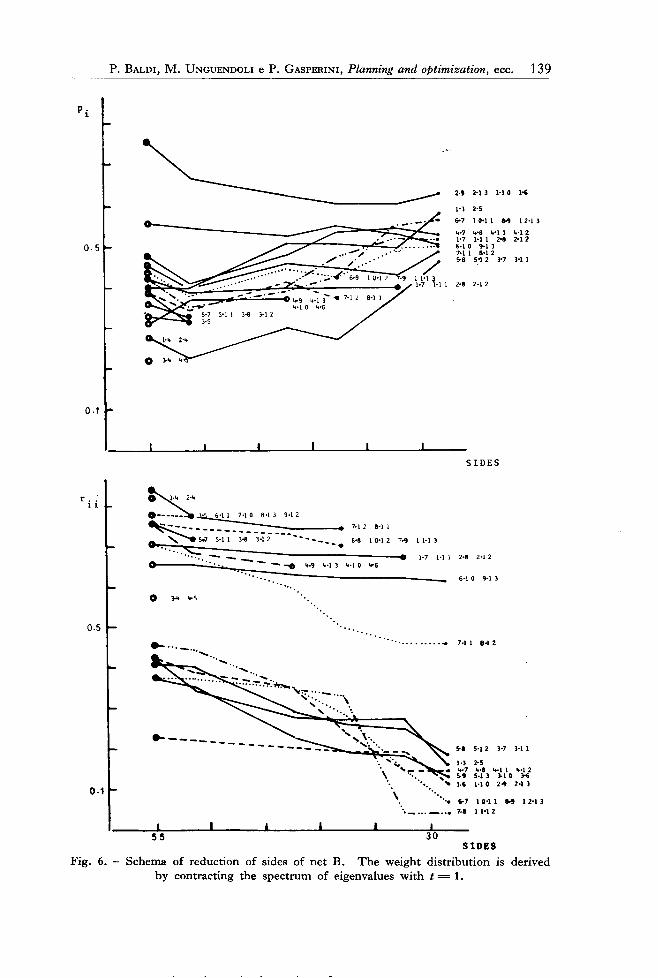
Fig. 6. - Schema of reduction of sides of net B. The weight distribution is derivedby contracting the spectrum of eigenvalues with t = 1.
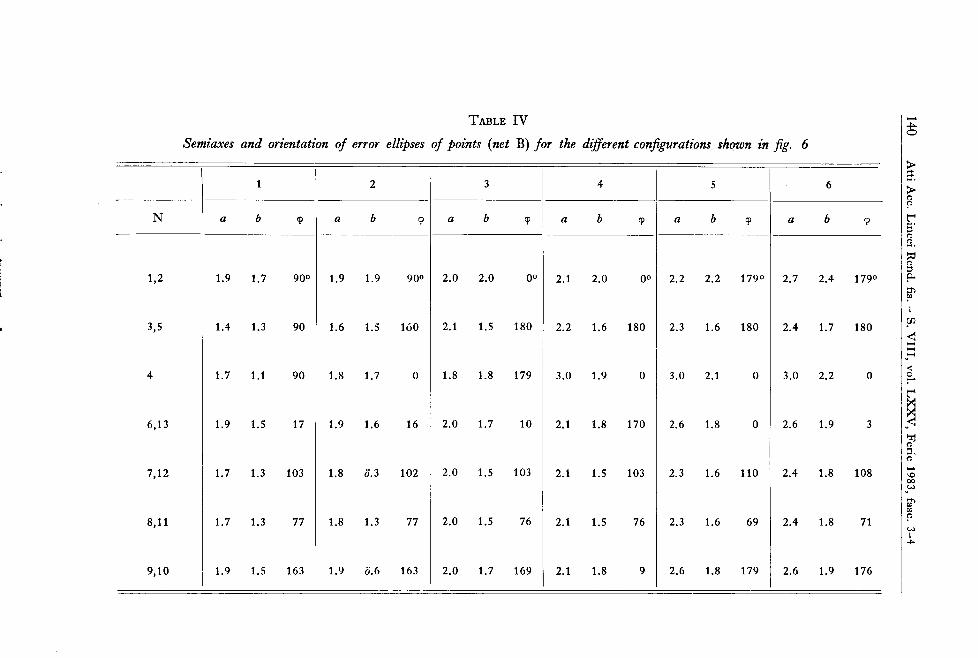
TABLE IV
Semiaxes and orientation oJ error ellipses oJ points (net B) Jor the different configurationsshown in fig. 6
12-I 3456
N
ab<p
ab<p
ab<p
ab<p
ab'P
ab'P
1,2
1.91.790°1.91.990°2.02.00°2.12.00°2.22.2179°2.72.4179°
3,5
1.41.3901.61.51602.11.51802.21.61802.31.61802.41.7180
4
1.71.1901.81.7O1.81.81793.01.9O3.02.1O3.02.2O
6,13
1.91.5171.91.6162.01.7102.11.81702.61.8O2.61.93
7,12
1.71.31031.80.31022.01.51032.11.51032.31.61102.41.8108
8,11
1.71.3771.81.3772.01.5762.11.5762.31.6692.41.871
9,10
I
1.91.51631.90.61632.01.71692.11.892.61.81792.61.9176
•....•+Cl
>...•::t.
>(')rt'"S'(')~.:::o('l)
::lp..
::l'lr'I
!lì
<:•.....•.....
.•....•
<:
~t'"
.~~...•
;;.--.o00w
S"fJJrwI
-l>-
P. BALDI, M. UNGUENDOLI e P. GASPERINI, Planning and optimization, ecc. 141
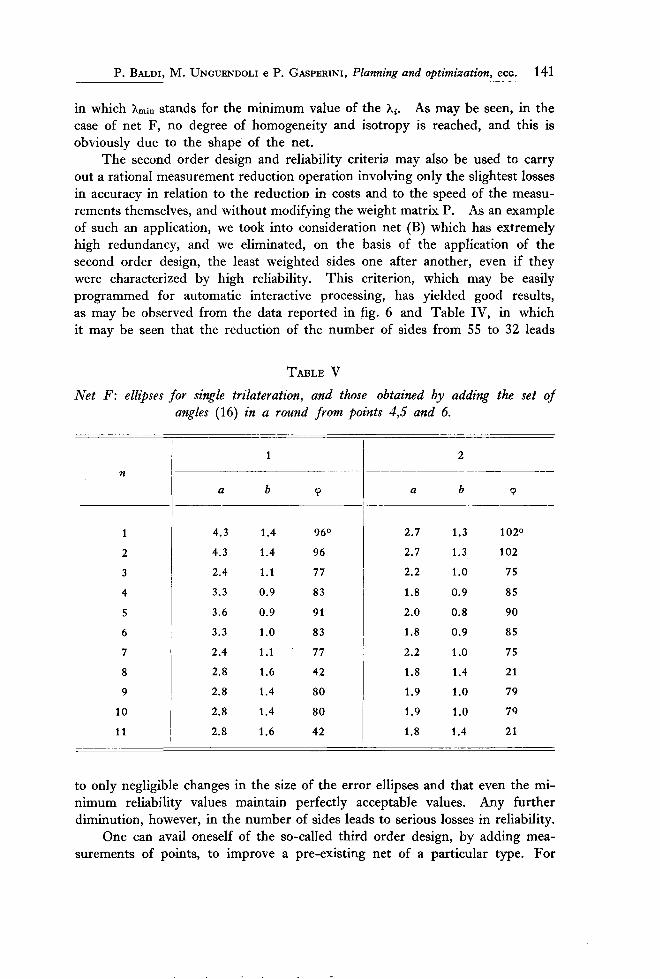
in which Àmin stands for the minimum value of the Ài. As may be seen, in thecase of net F, no degree of homogeneity and isotropy is reached, and this isobviously due to the shape of the net.
The second order design and reliability criteria may also be used to carryout a rational measurement reduction operation involving only the slightest lossesin accuracy in relation to the reduction in costs and to the speed of the measurements themselves, and without modifying the weight matrix P. As an exampleof such an application, we took into consideration net (B) which has extremelyhigh redundancy, and we eliminated, on the basis of the application of thesecond order design, the least weighted sides one after another, even if theywere characterized by high reliabiIity. This criterion, which may be easilyprogrammed for automatic interactive processing, has yielded good results,as may be observed from the data reported in fig. 6 and Table IV, in whichit may be seen that the reduction of the number of sides from 55 to 32 leads
TABLE V
Net F: ellipses Jor single trilateration, and those obtained by adding the set oJangles (16) in a round Jrom points 4,5 and 6.
n
1
2
3
4
5
6
7
8
9
10
11
1 2
~~~~--~-
--~._--~------a
b(Il abq;----
4.3
1.4960 2.71.31020
4.3
1.496 2.71.3102
2.4
1.177 2.21.075
3.3
0.983 1.80.985
3.6
0.991 2.00.890
3.3
1.083 1.80.985
2.4
1.177 2.21.075
2.8
1.642 1.81.421
2.8
1.480 1.91.079
2.8
1.480 1.91.079
2.8
1.642 1.81.421
to only negligible changes in the size of the error eIlipses and that even the minimum reliability values maintain perfectly acceptable values. Any furtherdiminution, however, in the number of sides leads to serious losses in reliability.
One can avail oneself of the so-calied third order design, by adding measurements of points, to improve a pre-existing net of a particular type. For

142 Atti Aee. Lineei Rend. fis. - S. VIII, voI. LXXV, Ferie 1983, fase. 3-4
example, type F of fig. 5, which is obviously unsuitable for accurate detectionof the normal movement component in the direction of its main trend, may beimproved by adding the set of angles in a round from points, 4, 5 and 6. Theresults of this computation are shown in Table V. This procedure is obviouslyof the empirical kind and can be pursued in the form of a series of attempts,dictated by experience and by trial and error.
CONCLUSION
All the current1y known methods of designing and optimizing geodeticnetworks have drawbacks which make them hard to apply to concrete problems;indeed, the choice of the configuration is greatly restricted by background factors such as topography, geology, costs, etc. The availability of a prioriknowledge concerning possible movements and their direction may help toidentify the most practical network possible from the geophysical and geodeticpoint of view.
If we consider the surface displacements accompanying faulting, the fieldmeasurements throughout the area in which one might expect elastic strainto build up may be too slow and expensive to perform; on the other hand, morefrequent measurements, more closely spaced sites distributed over a narrowarea perpendicular to the fault strike, the extension of the network to a considerable distance from the fracture zone, may make it possible to obtain a correctinterpretation of co-seismic deformation. As regards the measurements ofslow deformations, pre-seismic and post-seismic, varying in intensity, distribution and speed, the combination of the classical geodetic techniques withcontinuous tilt and strain recorded by tiltmeters and strain-meters may partially overcome the problems connected with frequent repetition of field measurements.
In any case a realistic approach to the planning of a net is to apply theinteractive method and trial and error procedure, taking into account, at thesame time, a11 environmental conditions as we11 as theoretical optimizationcriteria.
REFERENCES
BALDIP. and MARSONI. (1981) - Gravity and geodetic networks Jor the study oJ crustaldeJormations in seismic area. « Boll. Geod. Se. Aff. '>, 3.
BALDIP. and POSTPISCHLD. (1981) - Gravity Variations during pre-seismic crustal deJormations. « Il Nuovo Cimento '>, lO.
BALDIP. and UNGUENDOLIM. (1982) - Some problems in monitoring crustal deJormationby geodetic methods. « Quaterniones Geodesiae '>, 3.
BRACEW.F. (1965) - Some new measurements oJ linear compressiblity oJ rocks. «J. GeophysRes '>, 70.
CHIMNERYM.A. (1961) - The deJormation oJ the ground around surJaceJaults. « Bull. Seism.Soe. Am.~, 51.
P. BALDI,M. UNGUENDOLIe P. GASPERINI,Planning and optimization, ecc. 143
CROSILLAF. (1982) - A criterion matrix Jor the second order design oJ control networks.Proceedings of the Meeting on Survey Contro l Networks, AAIborg, ASPW, Miinchen.
GRAFARENDE. (1972) - Genavigkeitsmase geodatischer netze. Deutsche Geodatische Kommission, Reihe A, Heft 73, Miinchen.
HOLDAHLS.R. (1980) - Crustal movements and redefinition oJ heights. Proceedings NADSymposium, Ottawa.
MAHRERK.D. and NUR A. (1979) - Strike slip Jaulting in a downward varying crust. « l.Geophys. Res. l), 84.
MANSINHAL. and SMYLIED.E. (1971) - The displacement fields oJ inclined Jaults. « Bull.Seism. Soc. Am .•), 61.
MARUYAMAT. (1964) - Statistical elastic dislocation in an infinite and semi-infinite medium.'« Bull. Earthquake Res. Inst. l), Tokyo Univ., 42.
MARsoN I. and MORELLIC. (1979) - A microgravimetric network Jor studying local gravityvariations in North-eastern ltaly (Friuli) connected with earthquake activity: institution oJ the net. « Boll. Geod. Se. Aff. l), 2.
McHuGH S. and lOHNSTON M.l.S. (1979) - A review oJ Observations and dislocation modeling oJ some creep-related tilt perturbations Jrom Central CaliJornia. Proc. of thcInternationai Workshop on Monitoring Crustai Dynamics in Earthquake Zones,Strasbourg.
MEISSNERR. (1978) - What kind and what magnitude oJ creep movements take piace althe earth's surJace? Proc. of the European Workshop on Space Oceanography, Navigation and Geodynamics, Germany, ESASP-13 7.
OWENSl.C. (1967) - Optical reJractive index oJ air: dependence on pressure, temperatureand composition. « Appl. Opto l), 6.
PRESSF. (1965) - Displacements, strains and tilts at teleseismic distances. « l. Geophys.Res. l), 70.
RIKITAKEI. (1976) - Earthquake Prediction. Eisevier, Amsterdam, Niederiande.RYBIKI K. and KASAHARAK. (1977) - A Strike-slip Jault in a laterally inhomogeneous
medium, « Tectonophysics .), 42.SCHMITTG. (1982) - Optimisation oJgeodetic networks. « Review of Geophysics and Space
Physics '>, 4.SLATERL.E. and HUGGETTG.R. (1976) - A multiwavelength distance-measuring instrument
Jor geophysical experiments. « l. Geophys. Res. l), 35.STEWARTS.W. and O'NEIL M.E. (1972) - Seismic travel times and near surJace crustal
velocity structure bounding the San Andreas Fault zone near Parkfield, « California,U.S. Geol. Surv. Prof. Pap .•), 800-C, C117-C118.
WALSHl.B. and RICE l.R. (1979) - Local change in gravity resulting Jrom deJormation.« l. Geophys. Res. », 84.
WIMMERH. (1981) - Second order design oJgeodetic networks by an iterative approximationoJ a given criterion matrix, Proceedings of the IAG Symposium, Miinchen.
Aziende tipografiche Eredi Dott, G. Bardi S.r.l. - Roma 1984