ac 2007-9: engineering is elementary: children’s...
TRANSCRIPT
AC 2007-9: ENGINEERING IS ELEMENTARY: CHILDREN’S CHANGINGUNDERSTANDINGS OF ENGINEERING AND SCIENCE
Christine Cunningham, Museum of Science, BostonDr. Christine Cunningham works as the Vice President of Research at the Museum of Science,Boston. In her work, she oversees research and evaluation efforts related to engineering andscience learning and teaching in the Museum and in K-12 classrooms; a curriculum developmentproject, Engineering is Elementary: Engineering and Technology Lessons for Children; and anumber of teacher professional development programs about engineering and technology forteachers of kindergarten through community college. Her projects focus on making science andengineering more accessible to marginalized populations, especially women, underrepresentedminorities, and people with disabilities. She is particularly interested in the ways that the teachingand learning of engineering and science can change to include and benefit from a more diversepopulation. Christine received a joint BA and MA in Biology from Yale University and a PhD inScience Education from Cornell University.
Cathy Lachapelle, Museum of Science, BostonDr. Cathy Lachapelle currently leads the assessment efforts for the EiE curriculum, designingassessment instruments, pilot and field testing them, and conducting research on how children usethe EiE materials. She has worked on a number of research and evaluation projects related toK-16 engineering education. Cathy received her S.B. in cognitive science from MIT, and herPh.D. in Psychological Studies in Education from Stanford University.
© American Society for Engineering Education, 2007

Engineering is Elementary:
Children’s Changing Understandings of Science and Engineering
Abstract
Findings are presented from a research program conducted by the Engineering is Elementary
curriculum development project. Students participating in testing of the EiE curriculum materials
were given pre-assessments and post-assessments that included questions about general
engineering and technology concepts, engineering questions specific to particular units, and
questions on science topics relevant to particular units. A comparable control sample of students
who did not study EiE curriculum units was also assessed. Analysis of the data shows that
students participating in EiE performed significantly better on the post-assessments than on the
pre-assessments. They also performed significantly better than control students on the post-
assessments. The engineering, technology, and science understandings of students participating
in EiE significantly increased due to participation in EiE curriculum units.
Engineering is Elementary
Engineering is Elementary (EiE) is a curriculum designed to teach elementary students about
concepts in engineering and technology. The curriculum is made up of individual units each of
which is intended to supplement and enhance the teaching of a specific science topic. Ten (of
twenty planned) units have been distributed and tested in classrooms so far. Each unit is
organized around the design of a specific technology, and is associated with a field of
engineering: for example, one unit is named Water, Water Everywhere: Environmental
Engineering and Designing Water Filters. Each unit begins with a story about a child who solves
a problem using the engineering design process, learned from a relative or other mentor. The
stories are often set internationally, and feature a real or realistic technology in development, in
order to provide a context for the lessons. Each unit also includes lessons where students
investigate and test materials and processes for their designs, and culminates in a final design
challenge.
A complete description of the EiE curriculum and its goals can be found in these conference
proceedings, in the paper “Engineering is Elementary: An Engineering and Technology
Curriculum for Children”.
The Research Program
As we have developed these curriculum units, the EiE team has collected pre- and post-
assessments from students in classrooms field testing the units. Field testing classrooms come
from six states across the United States: California, Colorado, Florida, Minnesota,
Massachusetts, and New Jersey. In 2005-2006, we also collected pre- and post-assessments from
classrooms in one district in Massachusetts that did not complete any EiE units. The purpose of
data collection has been and continues to be twofold: (1) to learn more about what students
nationally know about engineering, technology, and the engineering design process and (2) to

evaluate the Engineering is Elementary curriculum in terms of its effect on students’
understanding of engineering, of technology, and of related science topics.
Previous research on young students’ understanding of engineering and technology concepts is
sparse2-4
though research to guide the growing field of engineering education K-12 has been
called for5-6
. The current study aims, in part, to close the gap.
In this paper, we show that EiE students have learned about science and engineering from two of
the ten EiE units currently available: Designing Hand Pollinators and Designing Water Filters.
The performance of EiE students on post-assessments is significantly better than their
performance on the pre-assessments. Where control data is available, we compare the
performance of EiE students to the performance of the control students on the assessments, and
show that EiE students perform significantly better than control.
Pre- and post-assessments consist of a variety of multiple-choice, fill-in-the-blank, and choose-
all-that-apply questions. Each participating EiE student received one assessment on general
engineering topics and another specific to each unit they studied. Control students received a
variety of questions from different unit assessments and from the general engineering
assessment. Each unit assessment includes both science and engineering questions that are
relevant to that unit. Where possible, pre-assessments were given in October or November, and
post-assessments in May or June of the same school year. However, due to the varying
circumstances of individual teachers, sometimes the pre-assessments were given later in the
school year or the post-assessments earlier. For example, some assessments were administered
by science specialists who saw their students for only a portion of the year. Others were
administered by teachers who first learned about the project and signed up to field test an EiE
unit in January. In all cases, pre-assessments were administered to EiE students before
instruction in any EiE unit and related science topics, and post-assessments were administered
after instruction was completed.
Because the time period between pre- and post-assessment is larger than just a few weeks,
maturation effects can be reasonably expected. One reason to include the control sample is to get
a measurement of what change we can expect on the post-assessment after four to six months. As
we will explain below, we often see significant improvement on the post-assessment by control
students, but this improvement is rarely as large as the improvements made by students who have
participated in EiE. Also, EiE students make more consistent significant improvements on
assessment questions than control students.
The Samples
Where possible, student responses (called EiE or Test below) were compared to responses from a
comparable control sample. EiE responses were drawn from a national sample consisting of
students from Massachusetts, New Jersey, Florida, Colorado, Minnesota, and California. Control
responses were collected from one district in Massachusetts. Though the samples were different
in some demographics—particularly as a larger proportion of the control sample receives free or
reduced lunch— preliminary post-hoc examination of the data has not shown evidence of
interaction effects.
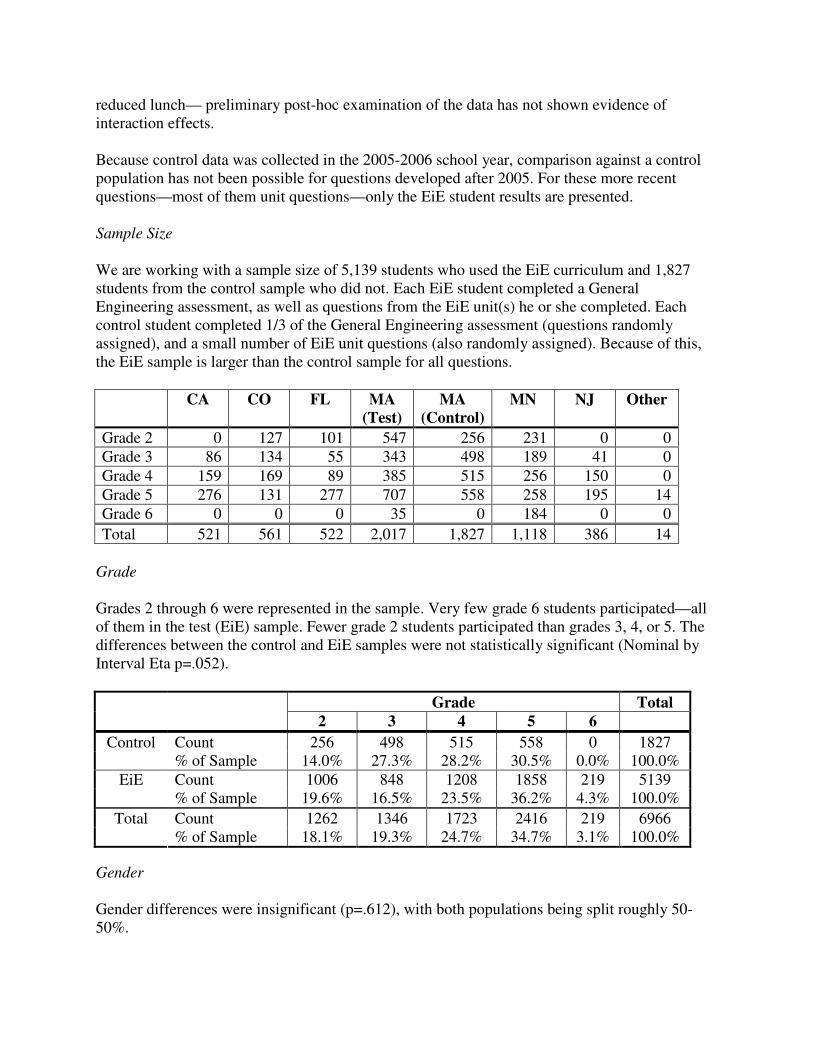
Because control data was collected in the 2005-2006 school year, comparison against a control
population has not been possible for questions developed after 2005. For these more recent
questions—most of them unit questions—only the EiE student results are presented.
Sample Size
We are working with a sample size of 5,139 students who used the EiE curriculum and 1,827
students from the control sample who did not. Each EiE student completed a General
Engineering assessment, as well as questions from the EiE unit(s) he or she completed. Each
control student completed 1/3 of the General Engineering assessment (questions randomly
assigned), and a small number of EiE unit questions (also randomly assigned). Because of this,
the EiE sample is larger than the control sample for all questions.
CA CO FL MA
(Test)
MA
(Control)
MN NJ Other
Grade 2 0 127 101 547 256 231 0 0
Grade 3 86 134 55 343 498 189 41 0
Grade 4 159 169 89 385 515 256 150 0
Grade 5 276 131 277 707 558 258 195 14
Grade 6 0 0 0 35 0 184 0 0
Total 521 561 522 2,017 1,827 1,118 386 14
Grade
Grades 2 through 6 were represented in the sample. Very few grade 6 students participated—all
of them in the test (EiE) sample. Fewer grade 2 students participated than grades 3, 4, or 5. The
differences between the control and EiE samples were not statistically significant (Nominal by
Interval Eta p=.052).
Grade Total
2 3 4 5 6
Count 256 498 515 558 0 1827 Control
% of Sample 14.0% 27.3% 28.2% 30.5% 0.0% 100.0%
Count 1006 848 1208 1858 219 5139 EiE
% of Sample 19.6% 16.5% 23.5% 36.2% 4.3% 100.0%
Count 1262 1346 1723 2416 219 6966 Total
% of Sample 18.1% 19.3% 24.7% 34.7% 3.1% 100.0%
Gender
Gender differences were insignificant (p=.612), with both populations being split roughly 50-
50%.
Free and Reduced Lunch
The Control sample has a significantly higher proportion of students receiving free or reduced
lunch (Goodman & Kruskal Tau-b p=.000). 69.1% of the Control sample reporting receives free
or reduced lunch, as compared to only 30.4% of the EiE sample reporting.
English Language Limited Proficiency
Of those reporting (n=1329), 7.3% of the Control students were classified as English Language
Limited Proficiency (ELLP). 4.8% of EiE students reporting (n=1817) were classified as ELLP.
This difference was significant (Phi Coefficient p=.004).
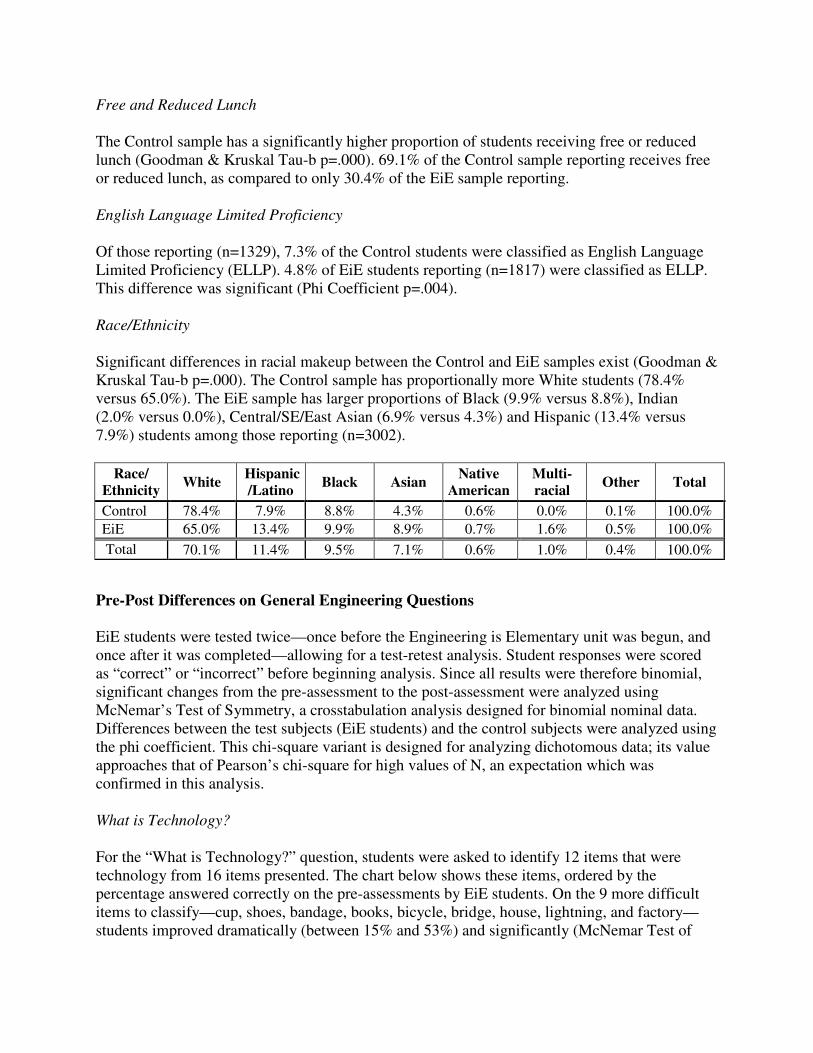
Race/Ethnicity
Significant differences in racial makeup between the Control and EiE samples exist (Goodman &
Kruskal Tau-b p=.000). The Control sample has proportionally more White students (78.4%
versus 65.0%). The EiE sample has larger proportions of Black (9.9% versus 8.8%), Indian
(2.0% versus 0.0%), Central/SE/East Asian (6.9% versus 4.3%) and Hispanic (13.4% versus
7.9%) students among those reporting (n=3002).
Race/
Ethnicity White
Hispanic
/Latino Black Asian
Native
American
Multi-
racial Other Total
Control 78.4% 7.9% 8.8% 4.3% 0.6% 0.0% 0.1% 100.0%
EiE 65.0% 13.4% 9.9% 8.9% 0.7% 1.6% 0.5% 100.0%
Total 70.1% 11.4% 9.5% 7.1% 0.6% 1.0% 0.4% 100.0%
Pre-Post Differences on General Engineering Questions
EiE students were tested twice—once before the Engineering is Elementary unit was begun, and
once after it was completed—allowing for a test-retest analysis. Student responses were scored
as “correct” or “incorrect” before beginning analysis. Since all results were therefore binomial,
significant changes from the pre-assessment to the post-assessment were analyzed using
McNemar’s Test of Symmetry, a crosstabulation analysis designed for binomial nominal data.
Differences between the test subjects (EiE students) and the control subjects were analyzed using
the phi coefficient. This chi-square variant is designed for analyzing dichotomous data; its value
approaches that of Pearson’s chi-square for high values of N, an expectation which was
confirmed in this analysis.
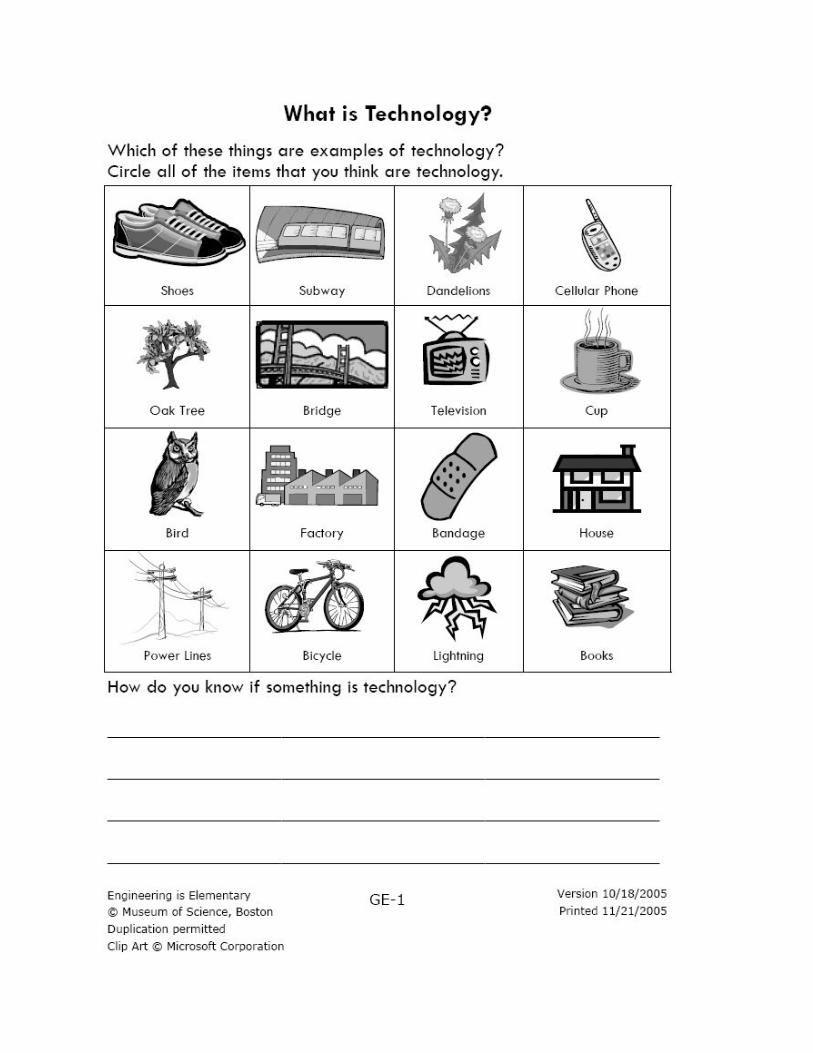
What is Technology?
For the “What is Technology?” question, students were asked to identify 12 items that were
technology from 16 items presented. The chart below shows these items, ordered by the
percentage answered correctly on the pre-assessments by EiE students. On the 9 more difficult
items to classify—cup, shoes, bandage, books, bicycle, bridge, house, lightning, and factory—
students improved dramatically (between 15% and 53%) and significantly (McNemar Test of
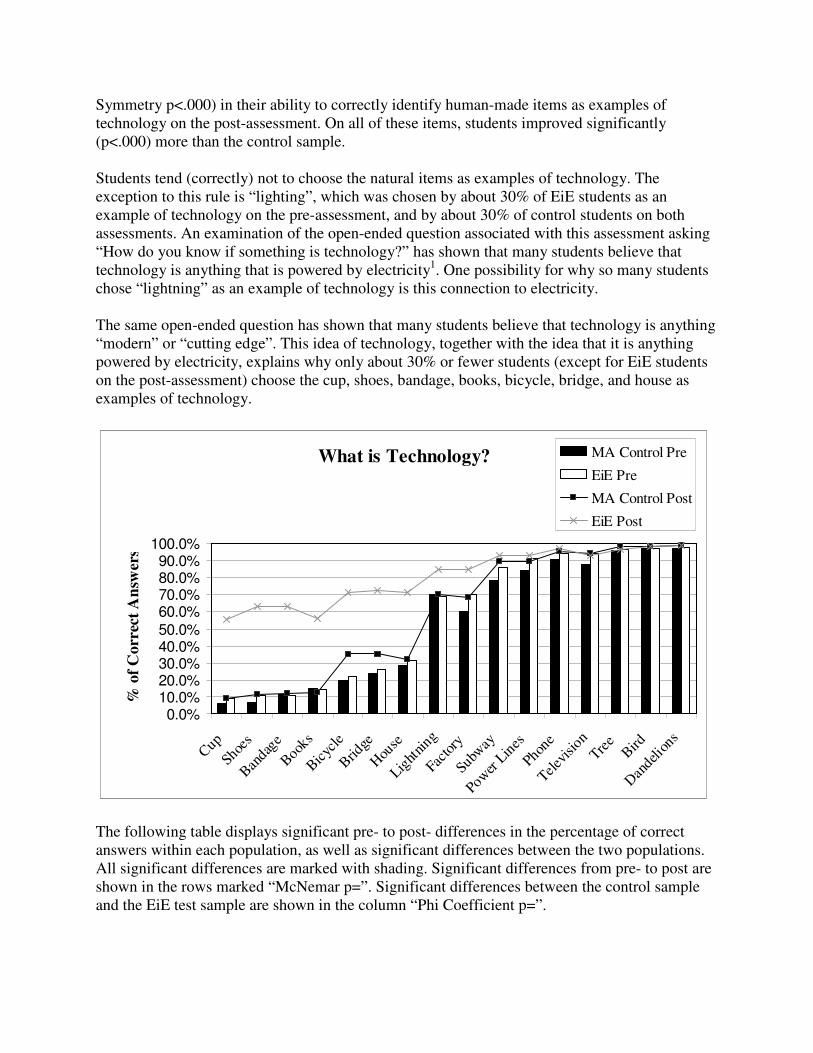
Symmetry p<.000) in their ability to correctly identify human-made items as examples of
technology on the post-assessment. On all of these items, students improved significantly
(p<.000) more than the control sample.
Students tend (correctly) not to choose the natural items as examples of technology. The
exception to this rule is “lighting”, which was chosen by about 30% of EiE students as an
example of technology on the pre-assessment, and by about 30% of control students on both
assessments. An examination of the open-ended question associated with this assessment asking
“How do you know if something is technology?” has shown that many students believe that
technology is anything that is powered by electricity1. One possibility for why so many students
chose “lightning” as an example of technology is this connection to electricity.
The same open-ended question has shown that many students believe that technology is anything
“modern” or “cutting edge”. This idea of technology, together with the idea that it is anything
powered by electricity, explains why only about 30% or fewer students (except for EiE students
on the post-assessment) choose the cup, shoes, bandage, books, bicycle, bridge, and house as
examples of technology.
What is Technology?
0.0%
10.0%
20.0%
30.0%
40.0%
50.0%
60.0%
70.0%
80.0%
90.0%
100.0%
Cup
Shoe
s
Ban
dage
Boo
ks
Bic
ycle
Brid
ge
Hou
se
Light
ning
Facto
ry
Subw
ay
Pow
er L
ines
Phone
Telev
isio
n
Tree
Bird
Dan
delio
ns
% o
f C
orr
ect
An
swer
s
MA Control Pre
EiE Pre
MA Control Post
EiE Post
The following table displays significant pre- to post- differences in the percentage of correct
answers within each population, as well as significant differences between the two populations.
All significant differences are marked with shading. Significant differences from pre- to post are
shown in the rows marked “McNemar p=”. Significant differences between the control sample
and the EiE test sample are shown in the column “Phi Coefficient p=”.
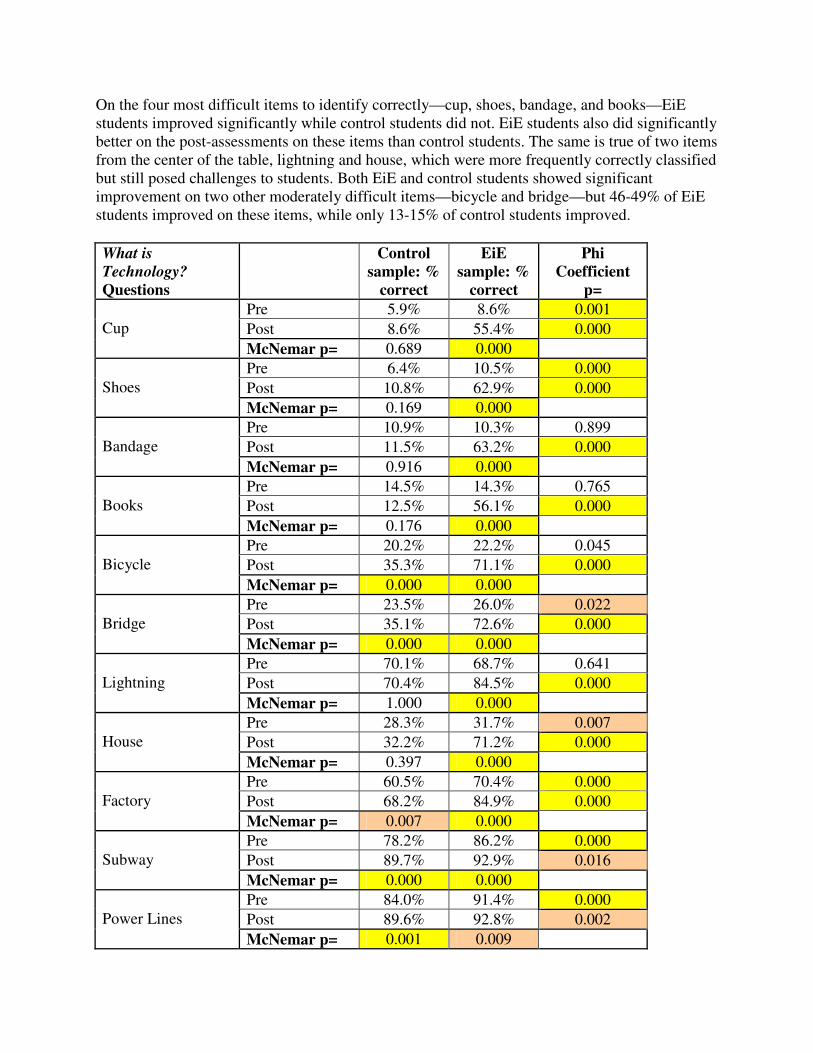
On the four most difficult items to identify correctly—cup, shoes, bandage, and books—EiE
students improved significantly while control students did not. EiE students also did significantly
better on the post-assessments on these items than control students. The same is true of two items
from the center of the table, lightning and house, which were more frequently correctly classified
but still posed challenges to students. Both EiE and control students showed significant
improvement on two other moderately difficult items—bicycle and bridge—but 46-49% of EiE
students improved on these items, while only 13-15% of control students improved.
What is
Technology?
Questions
Control
sample: %
correct
EiE
sample: %
correct
Phi
Coefficient
p=
Pre 5.9% 8.6% 0.001
Post 8.6% 55.4% 0.000 Cup
McNemar p= 0.689 0.000
Pre 6.4% 10.5% 0.000
Post 10.8% 62.9% 0.000 Shoes
McNemar p= 0.169 0.000
Pre 10.9% 10.3% 0.899
Post 11.5% 63.2% 0.000 Bandage
McNemar p= 0.916 0.000
Pre 14.5% 14.3% 0.765
Post 12.5% 56.1% 0.000 Books
McNemar p= 0.176 0.000
Pre 20.2% 22.2% 0.045
Post 35.3% 71.1% 0.000 Bicycle
McNemar p= 0.000 0.000
Pre 23.5% 26.0% 0.022
Post 35.1% 72.6% 0.000 Bridge
McNemar p= 0.000 0.000
Pre 70.1% 68.7% 0.641
Post 70.4% 84.5% 0.000 Lightning
McNemar p= 1.000 0.000
Pre 28.3% 31.7% 0.007
Post 32.2% 71.2% 0.000 House
McNemar p= 0.397 0.000
Pre 60.5% 70.4% 0.000
Post 68.2% 84.9% 0.000 Factory
McNemar p= 0.007 0.000
Pre 78.2% 86.2% 0.000
Post 89.7% 92.9% 0.016 Subway
McNemar p= 0.000 0.000
Pre 84.0% 91.4% 0.000
Post 89.6% 92.8% 0.002 Power Lines
McNemar p= 0.001 0.009
Pre 90.4% 94.0% 0.000
Post 95.5% 97.0% 0.034 Phone
McNemar p= 0.002 0.000
Pre 87.6% 94.2% 0.000
Post 93.9% 93.0% 0.507 Television
McNemar p= 0.001 0.277
Pre 96.0% 96.6% 0.289
Post 98.5% 96.4% 0.024 Tree
McNemar p= 0.064 0.488
Pre 97.1% 97.1% 0.929
Post 98.5% 98.5% 0.523 Bird
McNemar p= 0.263 0.000
Pre 97.1% 97.5% 0.404
Post 98.7% 98.6% 0.706 Dandelions
McNemar p= 0.263 0.000
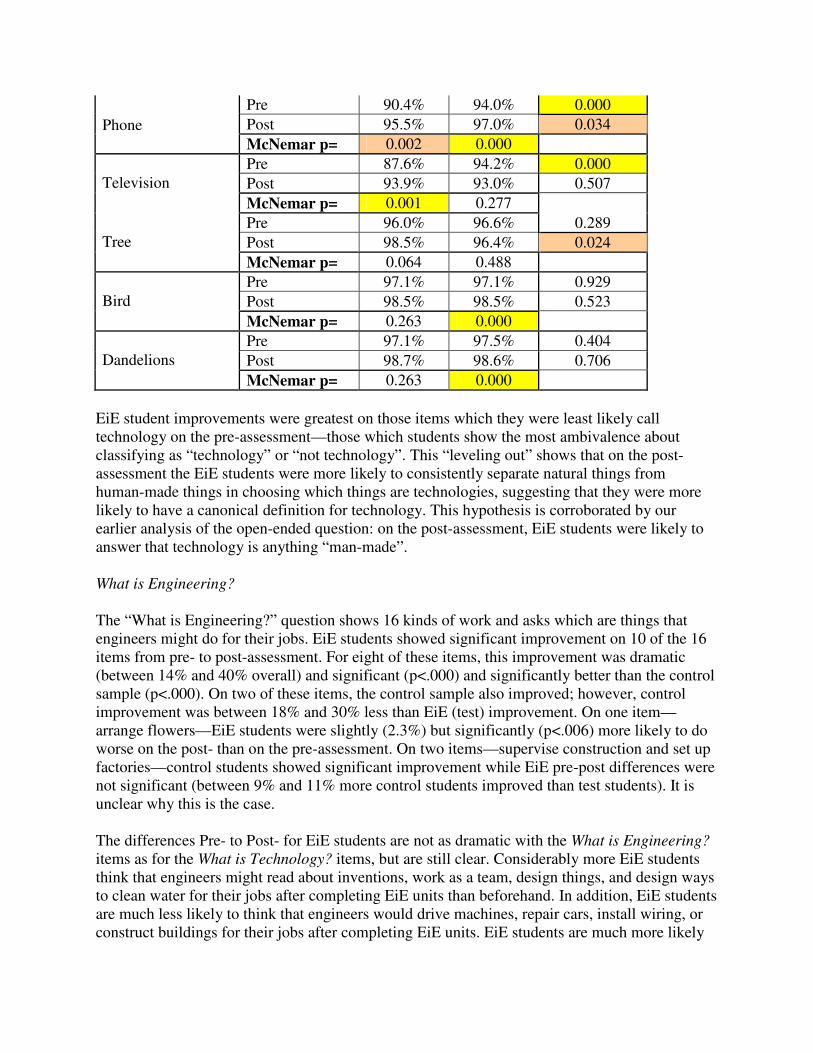
EiE student improvements were greatest on those items which they were least likely call
technology on the pre-assessment—those which students show the most ambivalence about
classifying as “technology” or “not technology”. This “leveling out” shows that on the post-
assessment the EiE students were more likely to consistently separate natural things from
human-made things in choosing which things are technologies, suggesting that they were more
likely to have a canonical definition for technology. This hypothesis is corroborated by our
earlier analysis of the open-ended question: on the post-assessment, EiE students were likely to
answer that technology is anything “man-made”.
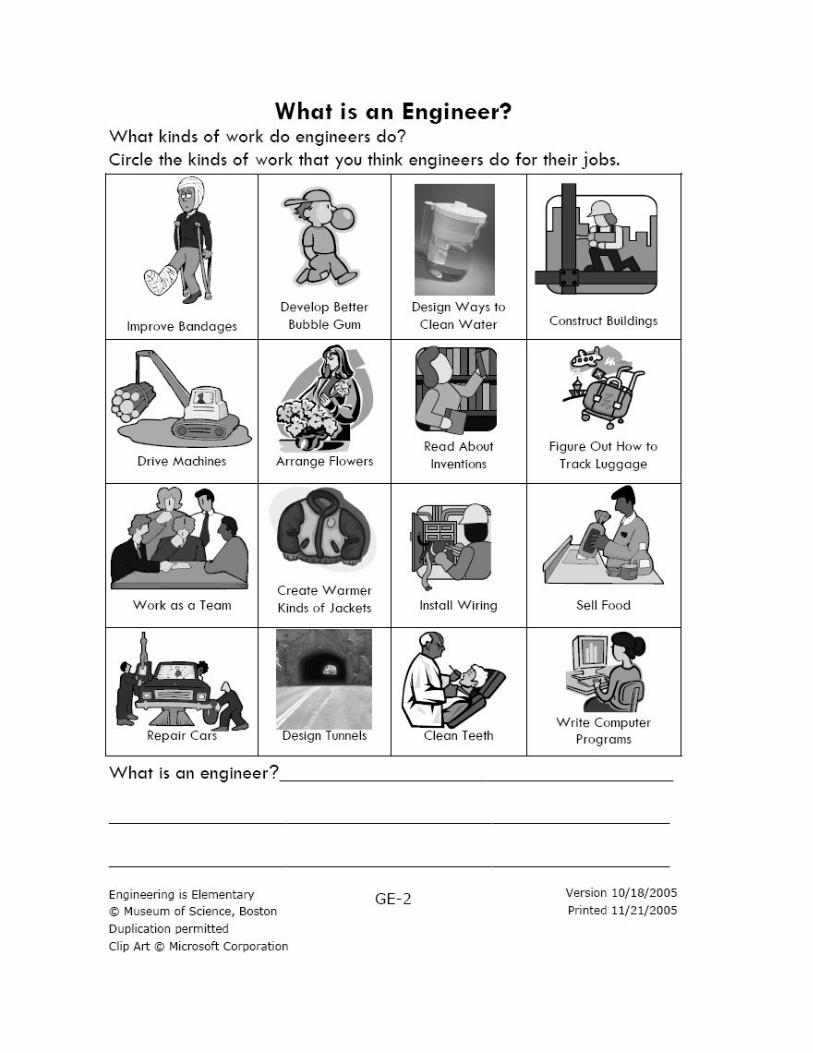
What is Engineering?
The “What is Engineering?” question shows 16 kinds of work and asks which are things that
engineers might do for their jobs. EiE students showed significant improvement on 10 of the 16
items from pre- to post-assessment. For eight of these items, this improvement was dramatic
(between 14% and 40% overall) and significant (p<.000) and significantly better than the control
sample (p<.000). On two of these items, the control sample also improved; however, control
improvement was between 18% and 30% less than EiE (test) improvement. On one item—
arrange flowers—EiE students were slightly (2.3%) but significantly (p<.006) more likely to do
worse on the post- than on the pre-assessment. On two items—supervise construction and set up
factories—control students showed significant improvement while EiE pre-post differences were
not significant (between 9% and 11% more control students improved than test students). It is
unclear why this is the case.
The differences Pre- to Post- for EiE students are not as dramatic with the What is Engineering?
items as for the What is Technology? items, but are still clear. Considerably more EiE students
think that engineers might read about inventions, work as a team, design things, and design ways
to clean water for their jobs after completing EiE units than beforehand. In addition, EiE students
are much less likely to think that engineers would drive machines, repair cars, install wiring, or
construct buildings for their jobs after completing EiE units. EiE students are much more likely
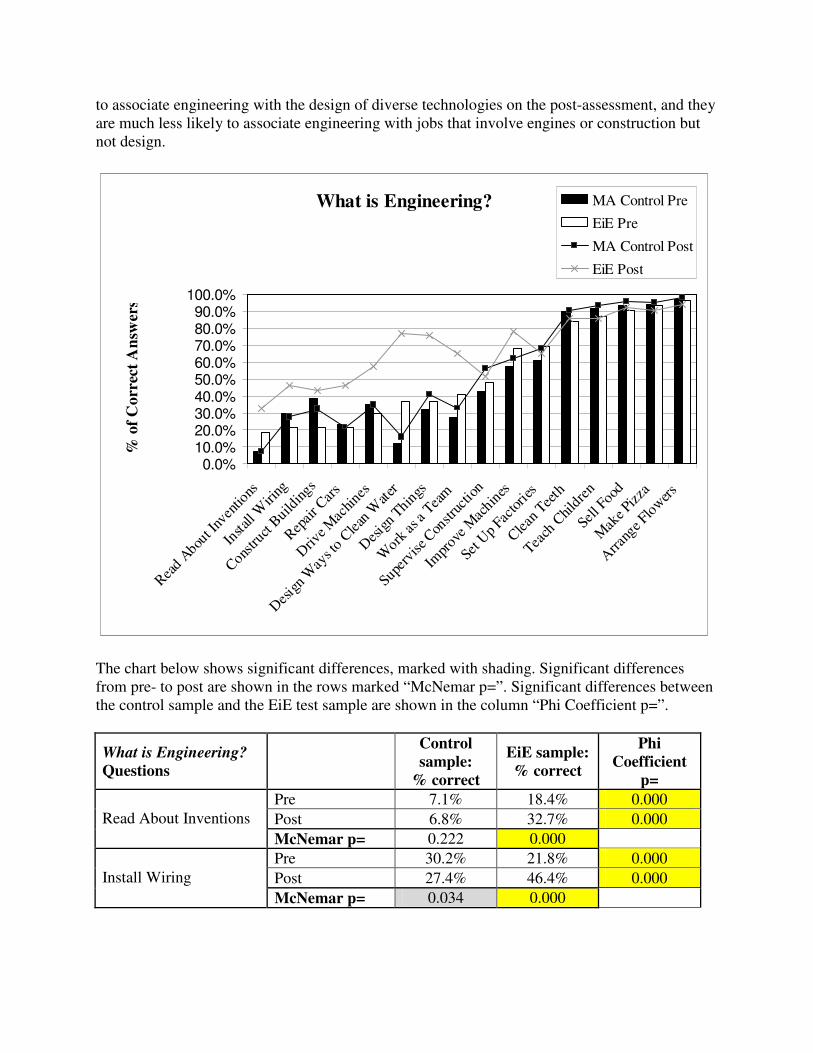
to associate engineering with the design of diverse technologies on the post-assessment, and they
are much less likely to associate engineering with jobs that involve engines or construction but
not design.
What is Engineering?
0.0%
10.0%
20.0%
30.0%
40.0%
50.0%
60.0%
70.0%
80.0%
90.0%
100.0%
Rea
d Abou
t Inv
entio
ns
Install W
iring
Cons
truct B
uild
ings
Rep
air C
ars
Driv
e M
achi
nes
Des
ign
Way
s to
Cle
an W
ater
Des
ign
Things
Wor
k as
a T
eam
Super
vise
Con
stru
ctio
n
Impr
ove
Mac
hine
s
Set U
p Fa
ctor
ies
Cle
an T
eeth
Teach
Chi
ldre
n
Sell
Food
Mak
e Pi
zza
Arran
ge Fl
ower
s
% o
f C
orr
ect
An
swer
s
MA Control Pre
EiE Pre
MA Control Post
EiE Post
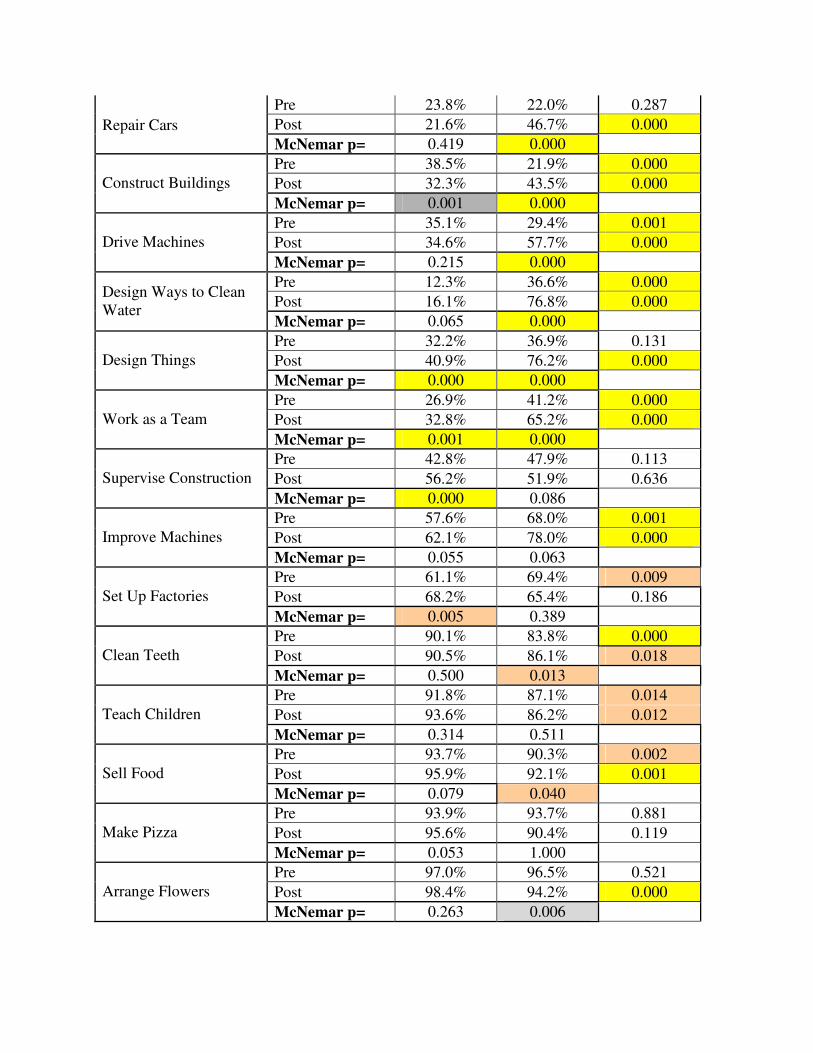
The chart below shows significant differences, marked with shading. Significant differences
from pre- to post are shown in the rows marked “McNemar p=”. Significant differences between
the control sample and the EiE test sample are shown in the column “Phi Coefficient p=”.
What is Engineering?
Questions
Control
sample:
% correct
EiE sample:
% correct
Phi
Coefficient
p=
Pre 7.1% 18.4% 0.000
Post 6.8% 32.7% 0.000 Read About Inventions
McNemar p= 0.222 0.000
Pre 30.2% 21.8% 0.000
Post 27.4% 46.4% 0.000 Install Wiring
McNemar p= 0.034 0.000
Pre 23.8% 22.0% 0.287
Post 21.6% 46.7% 0.000 Repair Cars
McNemar p= 0.419 0.000
Pre 38.5% 21.9% 0.000
Post 32.3% 43.5% 0.000 Construct Buildings
McNemar p= 0.001 0.000
Pre 35.1% 29.4% 0.001
Post 34.6% 57.7% 0.000 Drive Machines
McNemar p= 0.215 0.000
Pre 12.3% 36.6% 0.000
Post 16.1% 76.8% 0.000 Design Ways to Clean
Water McNemar p= 0.065 0.000
Pre 32.2% 36.9% 0.131
Post 40.9% 76.2% 0.000 Design Things
McNemar p= 0.000 0.000
Pre 26.9% 41.2% 0.000
Post 32.8% 65.2% 0.000 Work as a Team
McNemar p= 0.001 0.000
Pre 42.8% 47.9% 0.113
Post 56.2% 51.9% 0.636 Supervise Construction
McNemar p= 0.000 0.086
Pre 57.6% 68.0% 0.001
Post 62.1% 78.0% 0.000 Improve Machines
McNemar p= 0.055 0.063
Pre 61.1% 69.4% 0.009
Post 68.2% 65.4% 0.186 Set Up Factories
McNemar p= 0.005 0.389
Pre 90.1% 83.8% 0.000
Post 90.5% 86.1% 0.018 Clean Teeth
McNemar p= 0.500 0.013
Pre 91.8% 87.1% 0.014
Post 93.6% 86.2% 0.012 Teach Children
McNemar p= 0.314 0.511
Pre 93.7% 90.3% 0.002
Post 95.9% 92.1% 0.001 Sell Food
McNemar p= 0.079 0.040
Pre 93.9% 93.7% 0.881
Post 95.6% 90.4% 0.119 Make Pizza
McNemar p= 0.053 1.000
Pre 97.0% 96.5% 0.521
Post 98.4% 94.2% 0.000 Arrange Flowers
McNemar p= 0.263 0.006
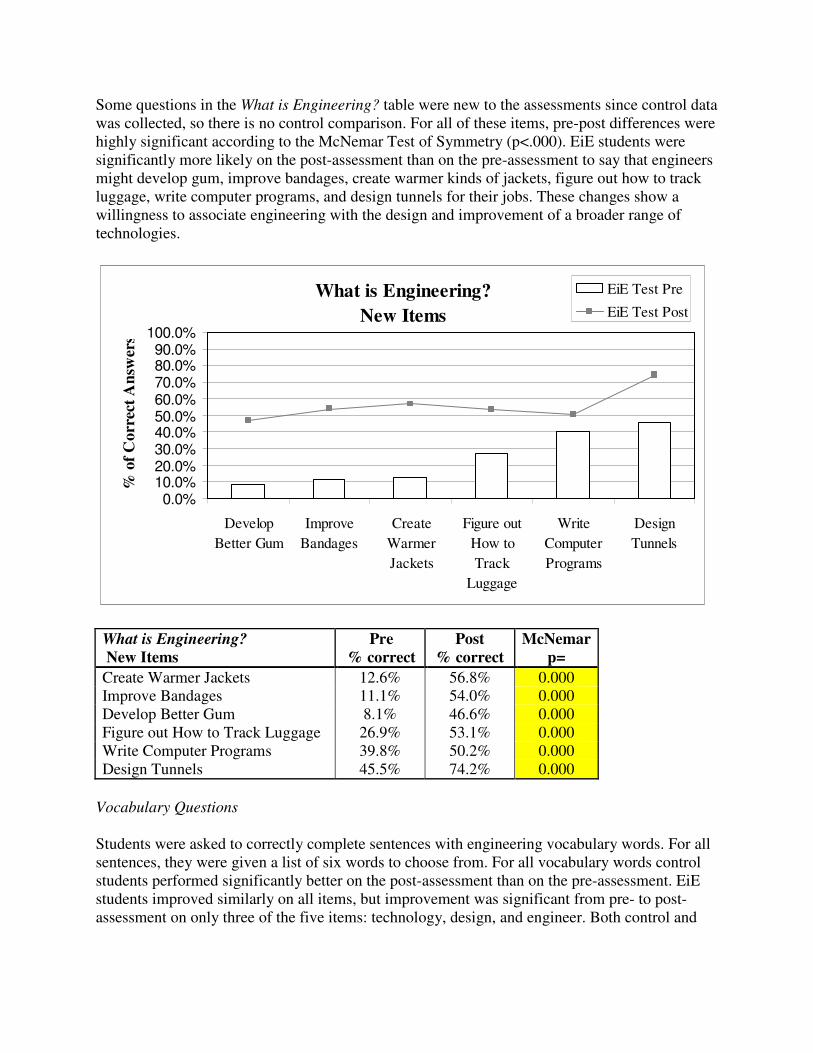
Some questions in the What is Engineering? table were new to the assessments since control data
was collected, so there is no control comparison. For all of these items, pre-post differences were
highly significant according to the McNemar Test of Symmetry (p<.000). EiE students were
significantly more likely on the post-assessment than on the pre-assessment to say that engineers
might develop gum, improve bandages, create warmer kinds of jackets, figure out how to track
luggage, write computer programs, and design tunnels for their jobs. These changes show a
willingness to associate engineering with the design and improvement of a broader range of
technologies.
What is Engineering?
New Items
0.0%
10.0%
20.0%
30.0%
40.0%
50.0%
60.0%
70.0%
80.0%
90.0%
100.0%
Develop
Better Gum
Improve
Bandages
Create
Warmer
Jackets
Figure out
How to
Track
Luggage
Write
Computer
Programs
Design
Tunnels
% o
f C
orr
ect
An
swer
s
EiE Test Pre
EiE Test Post
What is Engineering?
New Items
Pre
% correct
Post
% correct
McNemar
p=
Create Warmer Jackets 12.6% 56.8% 0.000
Improve Bandages 11.1% 54.0% 0.000
Develop Better Gum 8.1% 46.6% 0.000
Figure out How to Track Luggage 26.9% 53.1% 0.000
Write Computer Programs 39.8% 50.2% 0.000
Design Tunnels 45.5% 74.2% 0.000
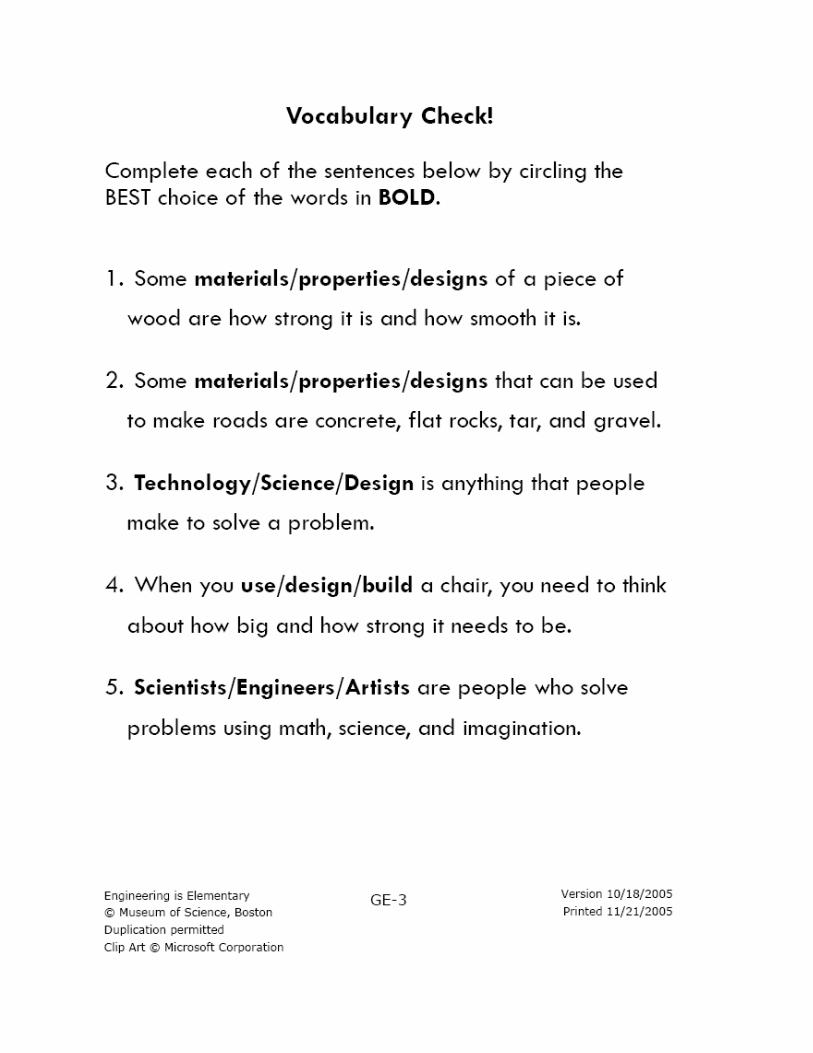
Vocabulary Questions
Students were asked to correctly complete sentences with engineering vocabulary words. For all
sentences, they were given a list of six words to choose from. For all vocabulary words control
students performed significantly better on the post-assessment than on the pre-assessment. EiE
students improved similarly on all items, but improvement was significant from pre- to post-
assessment on only three of the five items: technology, design, and engineer. Both control and

EiE students improved in their use of the word “technology”, but EiE students performed
significantly better on the post-assessment than control students (p<.011).
Vocabulary Questions:
Fill-in-the-Blank
0.0%
10.0%
20.0%
30.0%
40.0%
50.0%
60.0%
70.0%
80.0%
90.0%
100.0%
technology properties materials engineer design
% o
f C
orr
ect
An
swer
s
MA Control Pre
EiE Pre
MA Control Post
EiE Post
Vocabulary:
Fill-in-the-Blank
MA
Control EiE
McNemar
p=
Pre 56.7% 56.2% 0.929
Post 78.0% 72.1% 0.598 properties
0.000 0.108
Pre 63.4% 64.0% 0.900
Post 80.4% 80.9% 0.950 materials
0.000 0.108
Pre 55.2% 55.2% 0.997
Post 63.0% 77.3% 0.011 technology
0.020 0.002
Pre 89.3% 81.8% 0.035
Post 94.0% 94.1% 0.118 design
0.001 0.021
Pre 76.5% 74.2% 0.621
Post 83.7% 88.2% 0.179 engineer
0.003 0.004
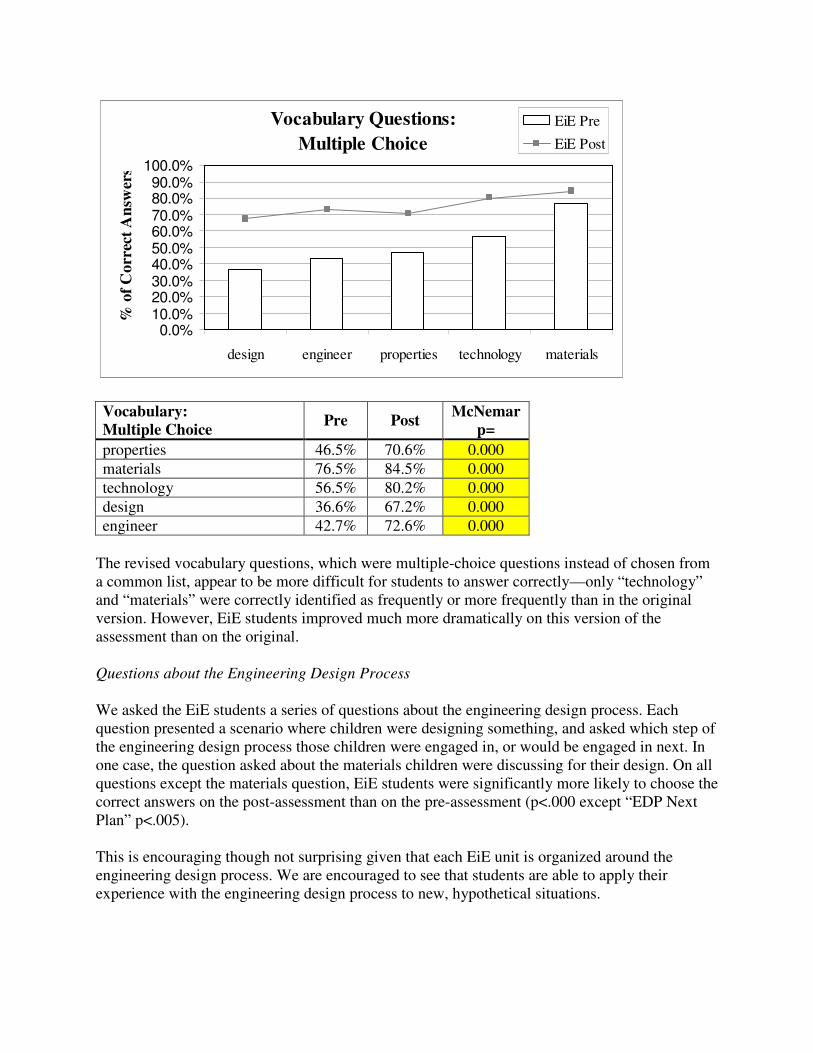
A newer version of the vocabulary assessment was designed to be multiple-choice. For each
sentence, students were given three words to choose from. EiE students were significantly more
likely (p=.000) to choose the correct vocabulary word on the post-assessment than on the pre-
assessment. Control students did not receive these questions so there is no comparison available.
Vocabulary Questions:
Multiple Choice
0.0%
10.0%
20.0%
30.0%
40.0%
50.0%
60.0%
70.0%
80.0%
90.0%
100.0%
design engineer properties technology materials
% o
f C
orr
ect
An
swer
sEiE Pre
EiE Post
Vocabulary:
Multiple Choice Pre Post
McNemar
p=
properties 46.5% 70.6% 0.000
materials 76.5% 84.5% 0.000
technology 56.5% 80.2% 0.000
design 36.6% 67.2% 0.000
engineer 42.7% 72.6% 0.000
The revised vocabulary questions, which were multiple-choice questions instead of chosen from
a common list, appear to be more difficult for students to answer correctly—only “technology”
and “materials” were correctly identified as frequently or more frequently than in the original
version. However, EiE students improved much more dramatically on this version of the
assessment than on the original.
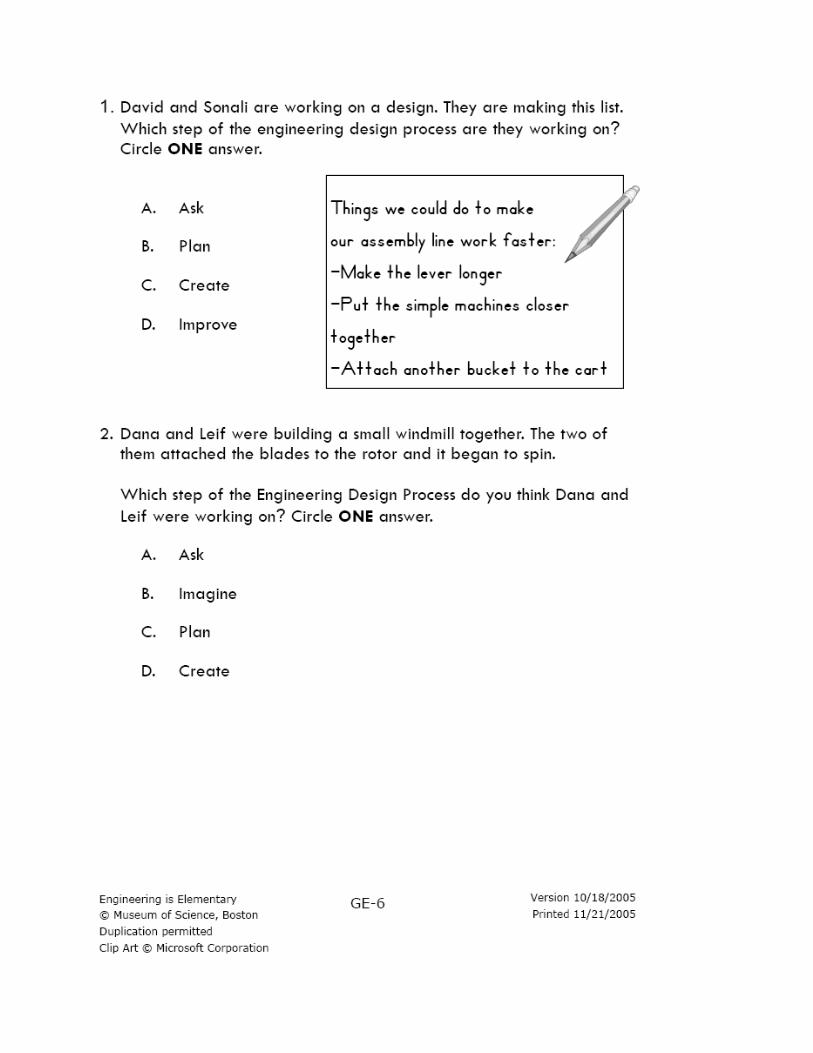
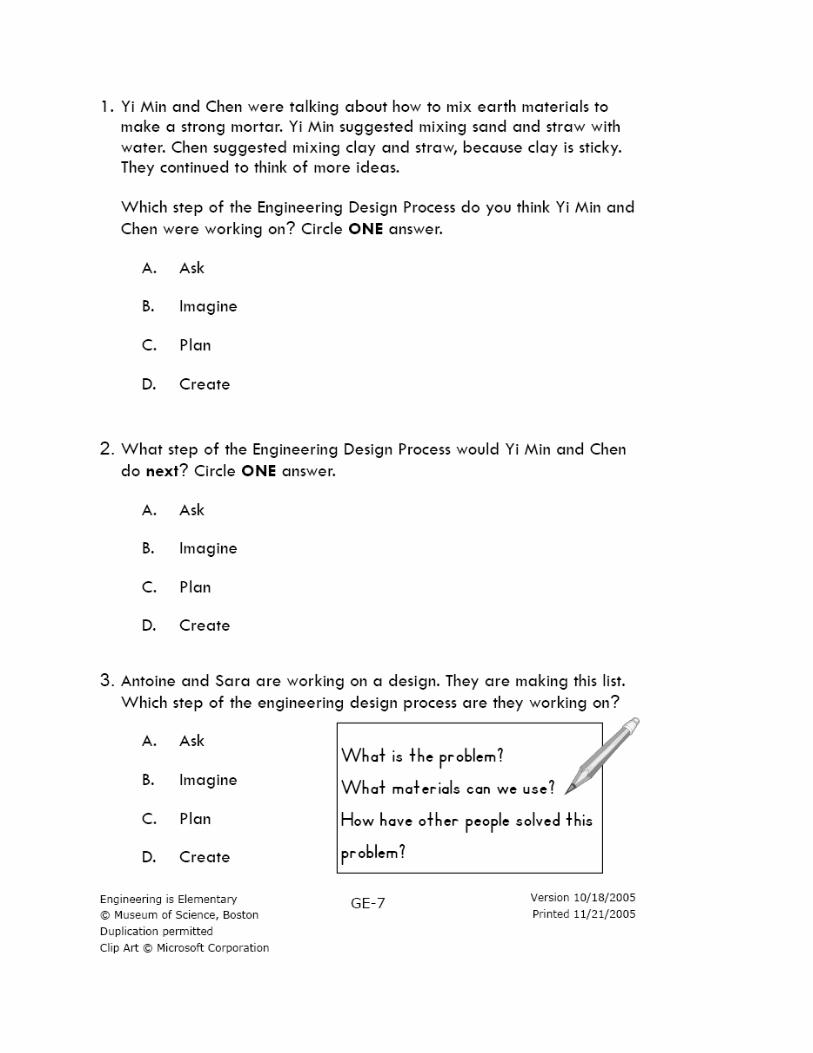
Questions about the Engineering Design Process
We asked the EiE students a series of questions about the engineering design process. Each
question presented a scenario where children were designing something, and asked which step of
the engineering design process those children were engaged in, or would be engaged in next. In
one case, the question asked about the materials children were discussing for their design. On all
questions except the materials question, EiE students were significantly more likely to choose the
correct answers on the post-assessment than on the pre-assessment (p<.000 except “EDP Next
Plan” p<.005).
This is encouraging though not surprising given that each EiE unit is organized around the
engineering design process. We are encouraged to see that students are able to apply their
experience with the engineering design process to new, hypothetical situations.

Engineering Design
Process Scenarios
0.0%
10.0%
20.0%
30.0%
40.0%
50.0%
60.0%
70.0%
80.0%
90.0%
100.0%
EDP
next plan
EDP
imagine
EDP
improve
EDP
next ask
EDP
plan
EDP
create
material
for chair
% o
f C
orr
ect
An
swer
sEiE Pre
EiE Post
Engineering Design Process
Scenarios Pre Post
McNemar
p=
EDP improve 46.3% 51.4% 0.000
EDP create 77.1% 86.9% 0.000
EDP imagine 39.8% 50.8% 0.000
EDP next plan 37.3% 49.0% 0.005
EDP next ask 60.1% 74.8% 0.000
material for chair 81.1% 86.6% 0.315
EDP plan 64.6% 77.9% 0.000
Results for the Designing Water Filters Unit Questions
Students participating in the Designing Water Filters EiE curriculum unit learned about
environmental engineering and the design of water filters. They identified pollutants in a series
of pictures of typical American neighborhood scenes, they tested a variety of materials for
filtering particulates and chemicals from water, and they designed their own water filters.
On the pre- and post-assessments these students were asked a variety of questions about water
filters, water filter materials, and environmental engineering. They were also asked a series of
science questions about water. EiE students performed significantly better on the post-
assessment than they did on the pre-assessment for nearly all of these questions. A copy of a later
version of the Designing Water Filters unit assessment can be found at the end of this paper.
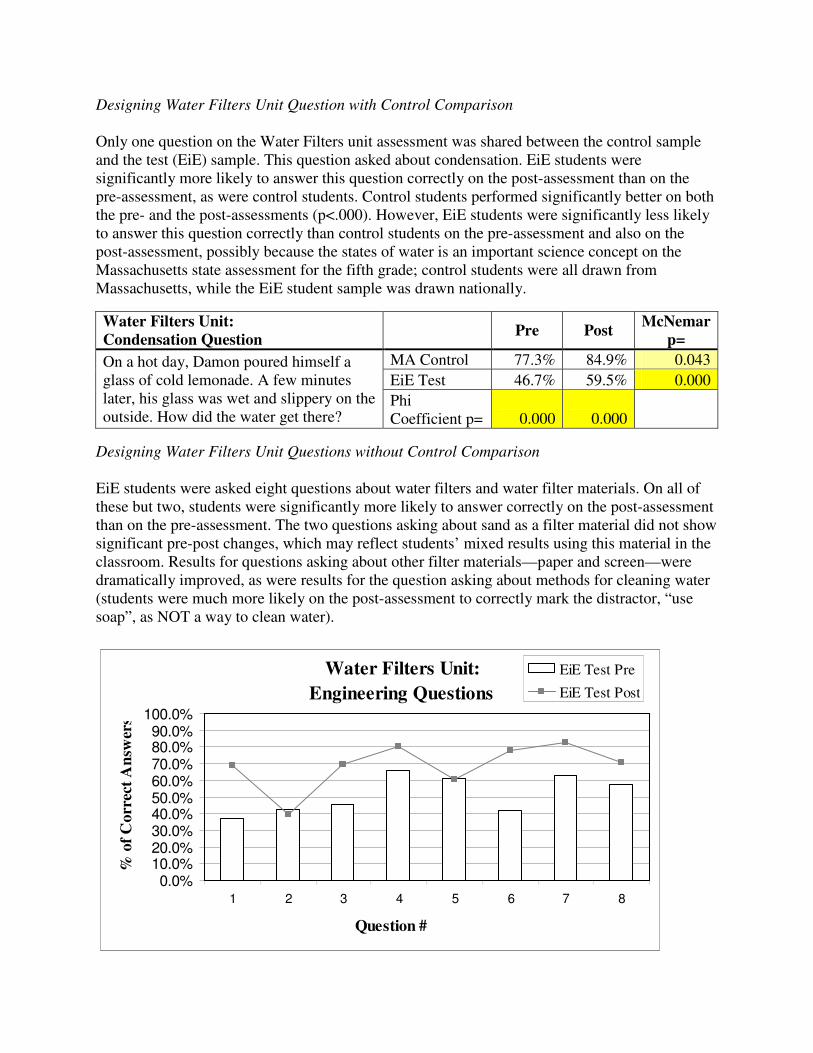
Designing Water Filters Unit Question with Control Comparison
Only one question on the Water Filters unit assessment was shared between the control sample
and the test (EiE) sample. This question asked about condensation. EiE students were
significantly more likely to answer this question correctly on the post-assessment than on the
pre-assessment, as were control students. Control students performed significantly better on both
the pre- and the post-assessments (p<.000). However, EiE students were significantly less likely
to answer this question correctly than control students on the pre-assessment and also on the
post-assessment, possibly because the states of water is an important science concept on the
Massachusetts state assessment for the fifth grade; control students were all drawn from
Massachusetts, while the EiE student sample was drawn nationally.
Water Filters Unit:
Condensation Question Pre Post
McNemar
p=
MA Control 77.3% 84.9% 0.043
EiE Test 46.7% 59.5% 0.000
On a hot day, Damon poured himself a
glass of cold lemonade. A few minutes
later, his glass was wet and slippery on the
outside. How did the water get there? Phi
Coefficient p= 0.000 0.000
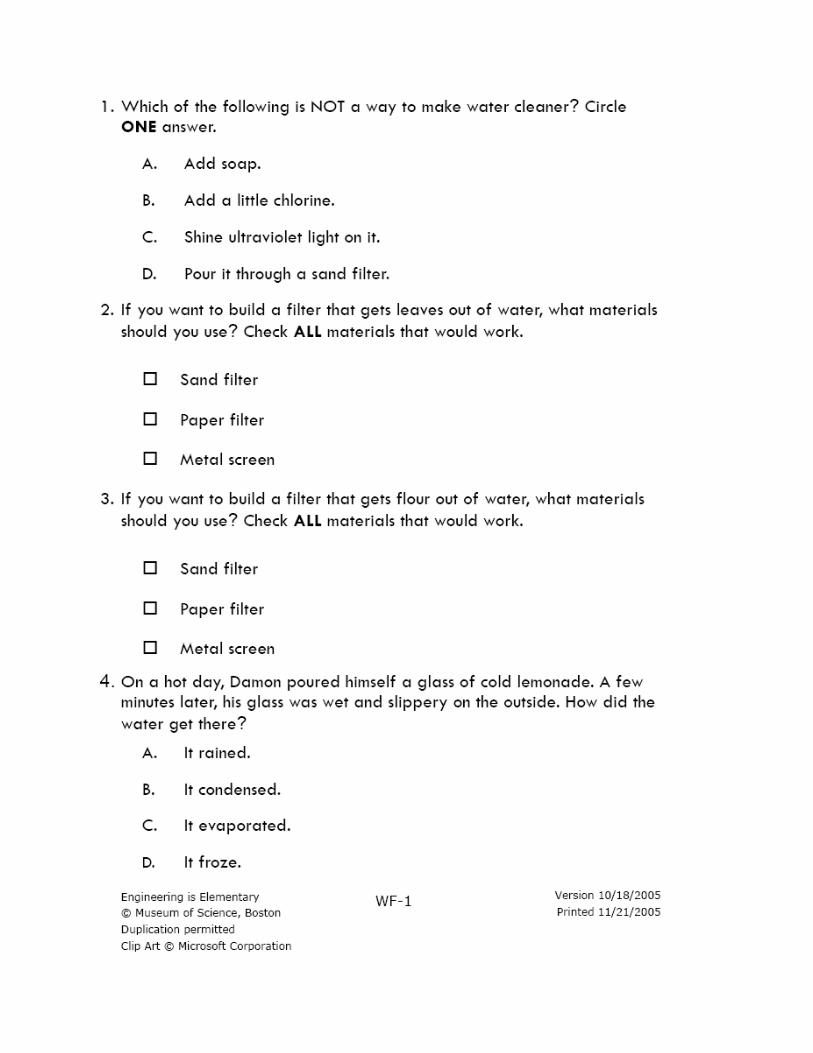
Designing Water Filters Unit Questions without Control Comparison
EiE students were asked eight questions about water filters and water filter materials. On all of
these but two, students were significantly more likely to answer correctly on the post-assessment
than on the pre-assessment. The two questions asking about sand as a filter material did not show
significant pre-post changes, which may reflect students’ mixed results using this material in the
classroom. Results for questions asking about other filter materials—paper and screen—were
dramatically improved, as were results for the question asking about methods for cleaning water
(students were much more likely on the post-assessment to correctly mark the distractor, “use
soap”, as NOT a way to clean water).
Water Filters Unit:
Engineering Questions
0.0%
10.0%
20.0%
30.0%
40.0%
50.0%
60.0%
70.0%
80.0%
90.0%
100.0%
1 2 3 4 5 6 7 8
Question #
% o
f C
orr
ect
An
swer
s
EiE Test Pre
EiE Test Post
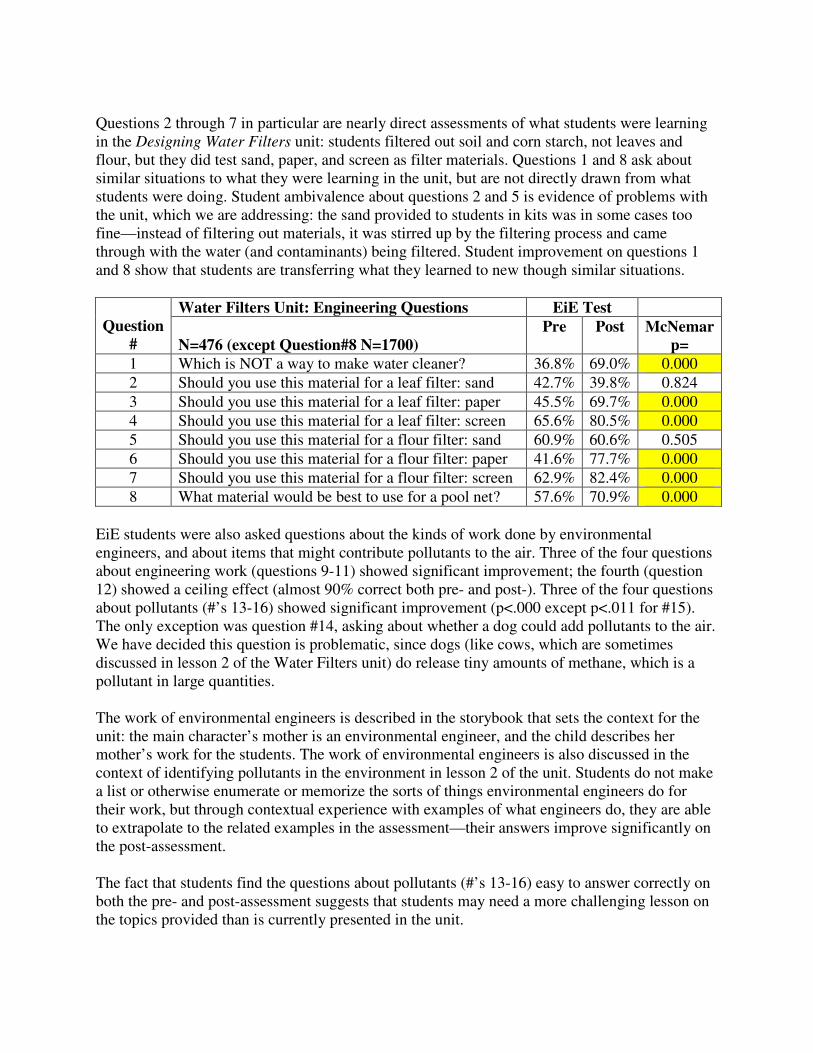
Questions 2 through 7 in particular are nearly direct assessments of what students were learning
in the Designing Water Filters unit: students filtered out soil and corn starch, not leaves and
flour, but they did test sand, paper, and screen as filter materials. Questions 1 and 8 ask about
similar situations to what they were learning in the unit, but are not directly drawn from what
students were doing. Student ambivalence about questions 2 and 5 is evidence of problems with
the unit, which we are addressing: the sand provided to students in kits was in some cases too
fine—instead of filtering out materials, it was stirred up by the filtering process and came
through with the water (and contaminants) being filtered. Student improvement on questions 1
and 8 show that students are transferring what they learned to new though similar situations.
Water Filters Unit: Engineering Questions EiE Test
Question
# N=476 (except Question#8 N=1700)
Pre Post McNemar
p=
1 Which is NOT a way to make water cleaner? 36.8% 69.0% 0.000
2 Should you use this material for a leaf filter: sand 42.7% 39.8% 0.824
3 Should you use this material for a leaf filter: paper 45.5% 69.7% 0.000
4 Should you use this material for a leaf filter: screen 65.6% 80.5% 0.000
5 Should you use this material for a flour filter: sand 60.9% 60.6% 0.505
6 Should you use this material for a flour filter: paper 41.6% 77.7% 0.000
7 Should you use this material for a flour filter: screen 62.9% 82.4% 0.000
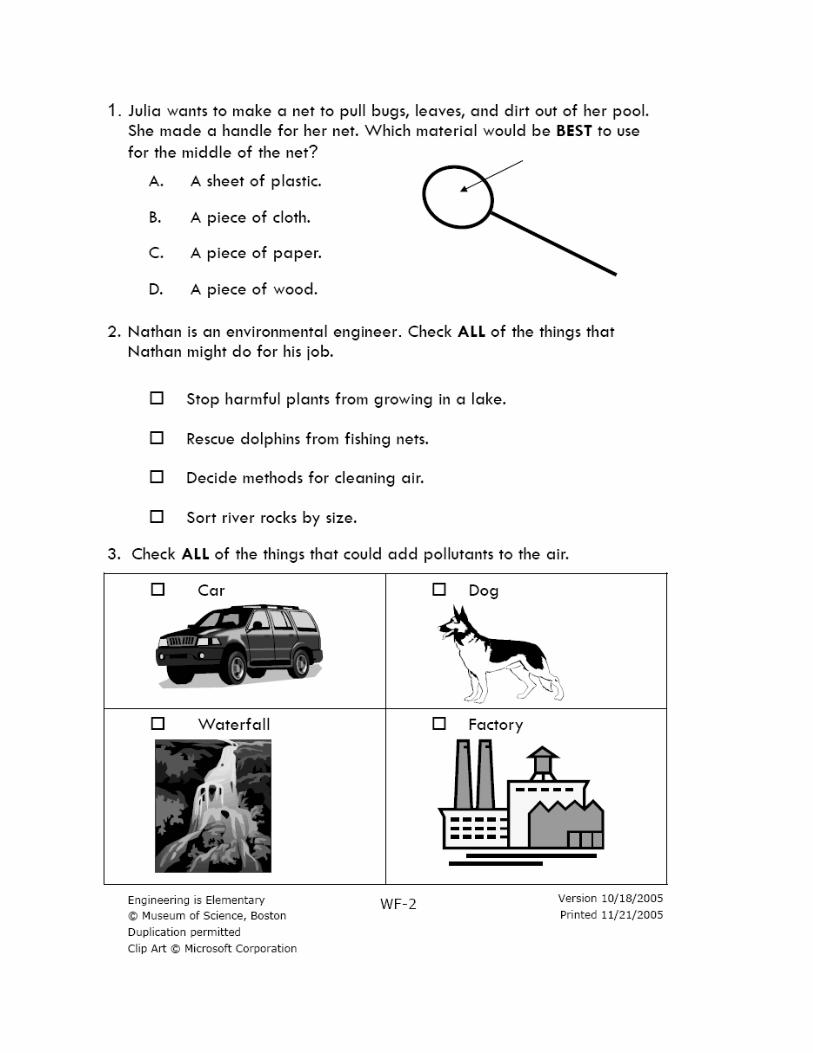
8 What material would be best to use for a pool net? 57.6% 70.9% 0.000
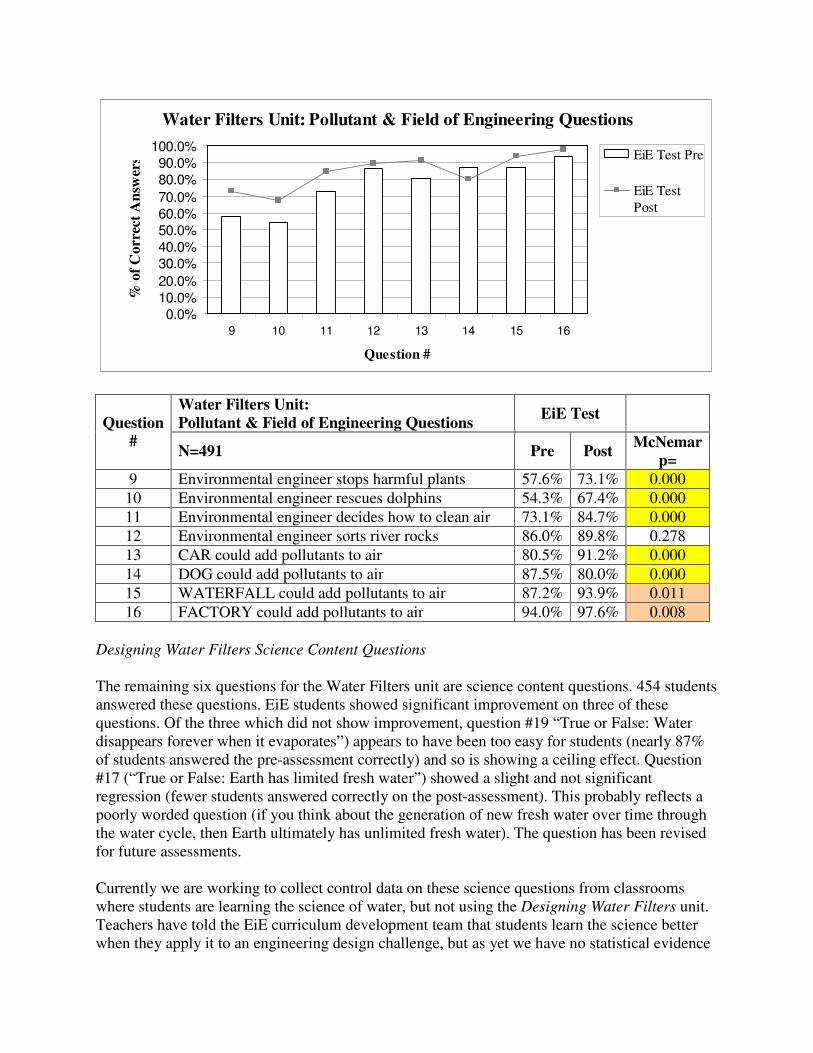
EiE students were also asked questions about the kinds of work done by environmental
engineers, and about items that might contribute pollutants to the air. Three of the four questions
about engineering work (questions 9-11) showed significant improvement; the fourth (question
12) showed a ceiling effect (almost 90% correct both pre- and post-). Three of the four questions
about pollutants (#’s 13-16) showed significant improvement (p<.000 except p<.011 for #15).
The only exception was question #14, asking about whether a dog could add pollutants to the air.
We have decided this question is problematic, since dogs (like cows, which are sometimes
discussed in lesson 2 of the Water Filters unit) do release tiny amounts of methane, which is a
pollutant in large quantities.
The work of environmental engineers is described in the storybook that sets the context for the
unit: the main character’s mother is an environmental engineer, and the child describes her
mother’s work for the students. The work of environmental engineers is also discussed in the
context of identifying pollutants in the environment in lesson 2 of the unit. Students do not make
a list or otherwise enumerate or memorize the sorts of things environmental engineers do for
their work, but through contextual experience with examples of what engineers do, they are able
to extrapolate to the related examples in the assessment—their answers improve significantly on
the post-assessment.
The fact that students find the questions about pollutants (#’s 13-16) easy to answer correctly on
both the pre- and post-assessment suggests that students may need a more challenging lesson on
the topics provided than is currently presented in the unit.
Water Filters Unit: Pollutant & Field of Engineering Questions
0.0%
10.0%
20.0%
30.0%
40.0%
50.0%
60.0%
70.0%
80.0%
90.0%
100.0%
9 10 11 12 13 14 15 16
Question #
% o
f C
orr
ect
An
swer
s EiE Test Pre
EiE Test
Post
Water Filters Unit:
Pollutant & Field of Engineering Questions EiE Test
Question
# N=491 Pre Post
McNemar
p=
9 Environmental engineer stops harmful plants 57.6% 73.1% 0.000
10 Environmental engineer rescues dolphins 54.3% 67.4% 0.000
11 Environmental engineer decides how to clean air 73.1% 84.7% 0.000
12 Environmental engineer sorts river rocks 86.0% 89.8% 0.278
13 CAR could add pollutants to air 80.5% 91.2% 0.000
14 DOG could add pollutants to air 87.5% 80.0% 0.000
15 WATERFALL could add pollutants to air 87.2% 93.9% 0.011
16 FACTORY could add pollutants to air 94.0% 97.6% 0.008
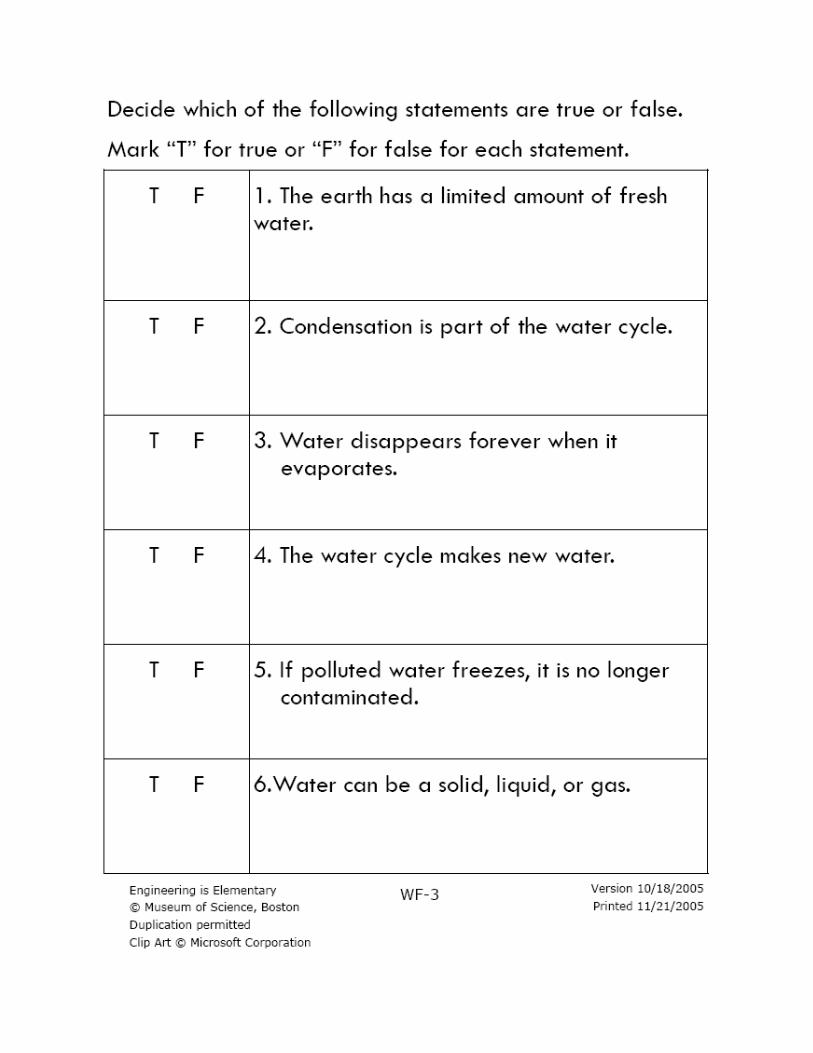
Designing Water Filters Science Content Questions
The remaining six questions for the Water Filters unit are science content questions. 454 students
answered these questions. EiE students showed significant improvement on three of these
questions. Of the three which did not show improvement, question #19 “True or False: Water
disappears forever when it evaporates”) appears to have been too easy for students (nearly 87%
of students answered the pre-assessment correctly) and so is showing a ceiling effect. Question
#17 (“True or False: Earth has limited fresh water”) showed a slight and not significant
regression (fewer students answered correctly on the post-assessment). This probably reflects a
poorly worded question (if you think about the generation of new fresh water over time through
the water cycle, then Earth ultimately has unlimited fresh water). The question has been revised
for future assessments.
Currently we are working to collect control data on these science questions from classrooms
where students are learning the science of water, but not using the Designing Water Filters unit.
Teachers have told the EiE curriculum development team that students learn the science better
when they apply it to an engineering design challenge, but as yet we have no statistical evidence

of this. By comparing students who study the science only with those who study both the science
and the engineering, we hope to find a definitive answer to this question.
Water Filters Unit:
Science Questions
0.0%
10.0%
20.0%
30.0%
40.0%
50.0%
60.0%
70.0%
80.0%
90.0%
100.0%
17 18 19 20 21 22
Question #
% o
f C
orr
ect
An
swer
s
EiE Test Pre
EiE Test
Post
Question
# Water Filters Unit: Science Questions Pre Post
McNemar
p=
17 Earth has limited fresh water 57.6% 56.2% 0.407
18 Condensation is part of the water cycle 73.9% 84.4% 0.012
19 Water disappears forever when it evaporates 86.5% 89.0% 0.470
20 The water cycle makes new water 38.2% 50.3% 0.001
21 Frozen water is no longer contaminated 73.3% 80.4% 0.062
22 Water can be a solid, liquid, or gas 74.2% 83.4% 0.000
Results for the Designing Hand Pollinators Unit Questions
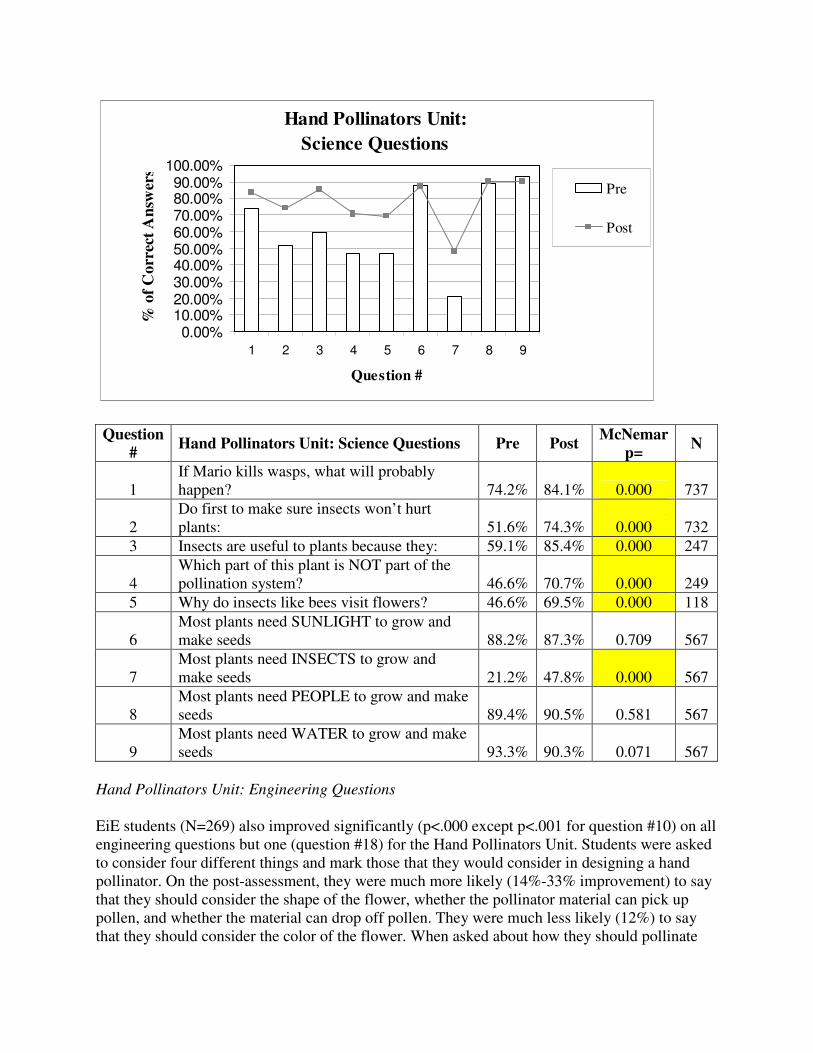
Hand Pollinators Unit: Science Questions
On all science questions for the Hand Pollinators Unit, EiE students either improved significantly
(p<.000) or the pre-assessment performance was too high (>88% correct) to permit significant
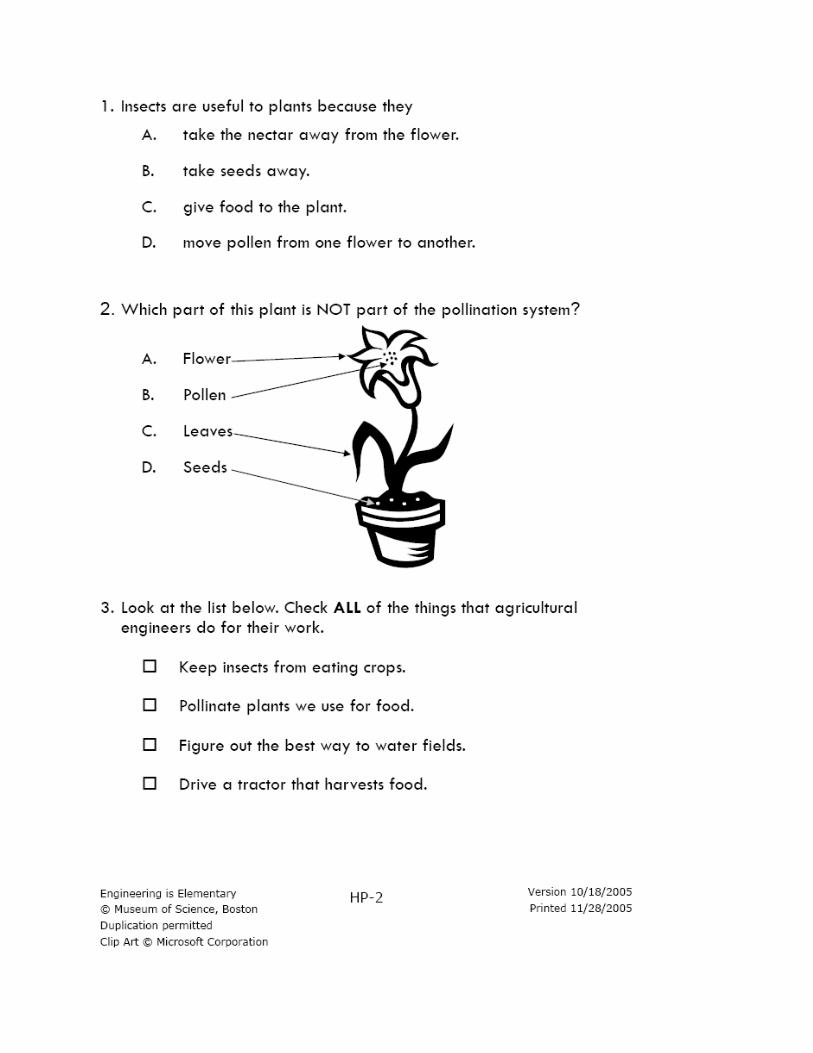
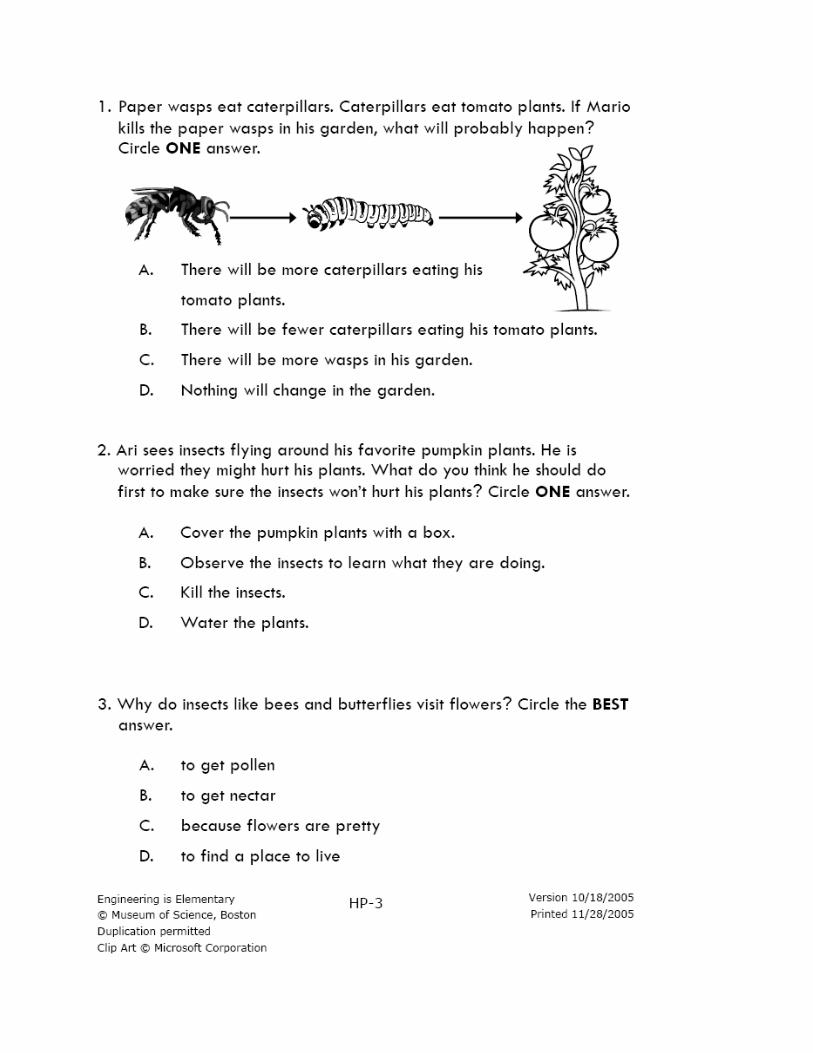
change. Students were asked a series of questions about the roles of insects, plants, and parts of
plants in the pollination process. Students were also asked to identify whether sunlight, insects,
people, and water are needed by plants to grow and make seeds. All of the questions regarding
the survival needs of plants were too easy for students except for the question regarding insects.
Hand Pollinators Unit:
Science Questions
0.00%
10.00%
20.00%
30.00%
40.00%
50.00%
60.00%
70.00%
80.00%
90.00%
100.00%
1 2 3 4 5 6 7 8 9
Question #
% o
f C
orr
ect
An
swer
s
Pre
Post
Question
# Hand Pollinators Unit: Science Questions Pre Post
McNemar
p= N
1
If Mario kills wasps, what will probably
happen? 74.2% 84.1% 0.000 737
2
Do first to make sure insects won’t hurt
plants: 51.6% 74.3% 0.000 732
3 Insects are useful to plants because they: 59.1% 85.4% 0.000 247
4
Which part of this plant is NOT part of the
pollination system? 46.6% 70.7% 0.000 249
5 Why do insects like bees visit flowers? 46.6% 69.5% 0.000 118
6
Most plants need SUNLIGHT to grow and
make seeds 88.2% 87.3% 0.709 567
7
Most plants need INSECTS to grow and
make seeds 21.2% 47.8% 0.000 567
8
Most plants need PEOPLE to grow and make
seeds 89.4% 90.5% 0.581 567
9
Most plants need WATER to grow and make
seeds 93.3% 90.3% 0.071 567
Hand Pollinators Unit: Engineering Questions
EiE students (N=269) also improved significantly (p<.000 except p<.001 for question #10) on all
engineering questions but one (question #18) for the Hand Pollinators Unit. Students were asked
to consider four different things and mark those that they would consider in designing a hand
pollinator. On the post-assessment, they were much more likely (14%-33% improvement) to say
that they should consider the shape of the flower, whether the pollinator material can pick up
pollen, and whether the material can drop off pollen. They were much less likely (12%) to say
that they should consider the color of the flower. When asked about how they should pollinate

flowers in their garden if the pollinating insect is not available, 93% of students answered on the
post-assessment that they would use a hand pollinator (a 36% increase). Questions 15-19 asked
about things that agricultural engineers might do for their jobs. Students showed significant
improvement (21-38%) on all of these questions except for “figure out the best way to water
fields”, which was not directly discussed in the unit.
Hand Pollinators Unit:
Engineering Questions
0.00%
10.00%
20.00%
30.00%
40.00%
50.00%
60.00%
70.00%
80.00%
90.00%
100.00%
10 11 12 13 14 15 16 17 18 19
Question #
% o
f C
orr
ect
An
swer
s
Pre
Post
Question
# Hand Pollinator Unit: Engineering Questions Pre Post
McNemar
p=
10
Consider SHAPE OF FLOWER when designing a
hand pollinator? 45.6% 59.8% 0.001
11
Consider COLOR OF FLOWER when designing a
hand pollinator? 66.0% 93.8% 0.000
12
Consider IF MATERIAL CAN PICK UP POLLEN
when designing a hand pollinator? 78.4% 90.7% 0.000
13
Consider IF MATERIAL CAN DROP OFF
POLLEN when designing a hand pollinator? 57.1% 89.6% 0.000
14
BEST way to pollinate flowers if insects are not
available: 56.3% 92.7% 0.000
15 An agricultural engineer’s job could involve: 18.4% 44.1% 0.000
16
Agricultural engineers might KEEP INSECTS
FROM EATING CROPS 52.8% 74.0% 0.000
17
Agricultural engineers might POLLINATE FOOD
PLANTS 33.8% 59.9% 0.000
18
Agricultural engineers might FIGURE OUT BEST
WAY TO WATER FIELDS 46.5% 49.1% 0.608
19
Agricultural engineers might DRIVE A TRACTOR
TO HARVEST FOOD 40.7% 78.4% 0.000
Conclusion
Engineering is Elementary students consistently showed improvement—frequently dramatic
improvement—on post-assessments designed to assess student understanding of science and
engineering concepts. Where comparison to a control sample is available, EiE students have, for
the most part, performed significantly better than the control students. These results show that
EiE students:
• Demonstrate a much clearer understanding of technology as human-made. They are much
more likely on the post-assessment than on the pre-assessment to choose all human-made
items as technology, even those which are not “cutting-edge” and do not use electricity. They
are also more likely to correctly identify technologies than the control sample.
• Demonstrate a much clearer understanding of the work of engineers as involving design and
teamwork. On the post-assessments, they are much more likely than control students—and
more likely than on their own pre-assessments—to choose such non-canonical jobs as
“develop better bubble gum” and “design ways to clean water” as the work of engineers, and
much less likely to choose technical or construction non-engineering jobs such as “install
wiring” and “repair cars”.
• Demonstrate a better grasp of relevant vocabulary, including the words “engineer”, “design”,
and “technology”.
• Demonstrate a clearer understanding on the post-assessment of the steps of the engineering
design process and what those steps look like in short scenarios.
• Demonstrate a clearer understanding of materials and their use in different water filtration
scenarios after completing the Designing Water Filters unit.
• Are much more likely to correctly identify the work of environmental engineers on the post-
assessment after completing the Designing Water Filters unit.
• Are much more likely to correctly answer science content questions relating to water after
completing the Designing Water Filters unit.
• Demonstrate a clearer understanding of the criteria for judging the effectiveness of a hand
pollinator design after completing the Designing Hand Pollinators unit.
• Are much more likely to correctly identify the work of agricultural engineers after
completing the Designing Hand Pollinators unit.
EiE students demonstrated on the post-assessment for the Designing Water Filters unit that they
learned a great deal about water, water filters, the materials used in water filtration, and the work
done by environmental engineers over the course of this unit. They demonstrated on the
Designing Hand Pollinators unit post-assessment that they learned a great deal about pollination,
the roles of flowers and insects in the pollination process, important characteristics of a
successful hand pollinator design, and the jobs of agricultural engineers. Though it can be argued
that learning about the properties of specific materials for water filtration and specific
characteristics of hand pollinators are not an essential part of a child’s education, we espouse the
view that it is through these specifics—which involve fun, educational activities—that students
learn the more broad, basic lessons about engineering, technology, and engineering design. From
the General Engineering assessments discussed earlier, we can see that this is true: students
successfully learned what engineering and technology are, and the order and characteristics of
the steps of the engineering design process.
An important goal of engineering education in the elementary grades is to introduce students to
the most basic concepts of the applied sciences:
• Objects and processes in the world can be categorized as natural or as human-made.
• Human-made objects and processes can be described as technologies.
• The engineering design process is a principled process that is both different from and similar
to the process of scientific discovery.
• Familiarity with materials and their properties is an important prerequisite of engineering
design.
• Engineering is a profession which takes skill, creativity, and knowledge of science and
mathematics, but which novices can begin to practice in an intellectually honest way, just as
they can practice scientific inquiry at an amateur level in an intellectually honest way.
• Engineering design can be fun, can help people, and is worth learning to do better.
• Technology and its design has enormous impact on people, societies, and the earth.
The goals of the Engineering is Elementary curriculum are to introduce students to these basic
concepts, and to give them a taste of the enormous variety of technologies and designs that
engineers work on. The research presented here gives strong evidence that many of these goals
are being met.
Next Steps
Our next steps will be to analyze data for the remaining eight units for which we have collected
data. We will continue to examine more closely the effects of gender, socioeconomic status, and
English proficiency on student performance. This year, we will also be collecting more control
data using the updated questions, so as to enable a more complete and robust analysis, and to
extend our analysis to a comparison of student learning of science topics in classrooms where
EiE is integrated and those where science is taught without engineering.
Bibliography
1. Cunningham, C.M., C.P. Lachapelle, and A. Lindgren-Streicher, Assessing Elementary School Students’
Conceptions of Engineering and Technology. Proceedings of the 2005 American Society for Engineering
Education Annual Conference and Exposition, 2005.
2. Rose, L.C., et al., The second installment of the ITEA/Gallup poll and what it reveals as to how Americans
think about technology. 2004, International Technology Education Association: p.12.
3. Sadler, P.M., H.P. Coyle, and M. Schwartz, Engineering competitions in the middle school classroom: Key
elements in developing effective design challenges. Journal of the Learning Sciences, 2000. 9(3): p.299-
327.
4. Davis, R.S., I.S. Ginns, and C.J. McRobbie, Elementary school students’ understandings of technology
concepts. Journal of Technology Education, 2002. 14(1): p.35-50.
5. Boser, R.A., J.D. Palmer, and M.K. Daugherty, Students attitudes toward technology in selected technology
education programs. Journal of Technology Education, 1998. 10(1): p. 4-19.
6. Lewis, T., Research in technology education—Some areas of need. Journal of Technology Education, 1999.
10(2): P. 41-55.