abc joint stock company dong nai, vietnam d … joint stock company dong nai, vietnam d-u-n-s:...
TRANSCRIPT

ABC JOINT STOCK COMPANY Dong Nai, Vietnam
D-U-N-S: 55-522-XXXX
Dun & Bradstreet (Vietnam) LLC Unit 2104, Floor 21, Saigon Trade Center, 37 Ton Duc Thang, District 1, Ho Chi Minh City, Vietnam T : (+84-8) 3911 7288 F : (+84-8) 3911 7289 E: [email protected] www.dnbvietnam.com

Vietnam Comprehensive Report
2
ABC HOA JOINT STOCK COMPANY Delivery Date: June 6, 2013
IDENTIFICATION & SUMMARY
Identification
DUNS: 55-522-XXXX
Legal Name: ABC JOINT STOCK COMPANY
Native Name: CONG TY CO PHAN ABC KHANG
Tradestyle ABC CAFÉ
Start date: 15 JANUARY 1976
Control date: 7 SEPTEMBER 2011
Address: XXXX, STREET 1, AN BINH WARD, BIEN HOA,
DONG NAI, VIETNAM Telephone: (84) (61) (383 XXXX) Telefax: (84) (61) (383 XXXX) Email Address: [email protected]
Web Address: www.abccafe.com.vn
Registration No: 3600261XXX
Tax No: 3600261XXX
Legal Form: JOINT STOCK COMPANY
CEO Name: MR. PHAM QUANG VU (GENERAL DIRECTOR)
(GENERAL DIRECTOR) Employees: 600 APPROX. (TOTAL)
Capital: VND265,791,350,000
SIC 2095-9905; 2095-9905; 2043-0000
Line Of Business: MANUFACTURES INSTANT COFFEE, ROASTED
COFFEE & CEREAL BREAKFAST FOODS
RISK EVALUATION
Risk Indicator 2
D&B Rating 5A2
Former Rating 5A3
Trend Good
CRI 2
PAYMENT INFORMATION
Payments Index 100
FINANCIAL SUMMARY
(LATEST AVAILABLE)
Sales/Turnover VND1,585,572 million
Tangible Net Worth VND711,845 million
Total Assets VND818,065 million
Net Profit After Tax VND211,113 million
CURRENCY All monetary amounts quoted in this report are shown in Vietnamese Dong (VND) unless otherwise stated.

Vietnam Comprehensive Report
3
Risk Assessment
The Dun & Bradstreet Rating of 5A2 indicates: A Financial Strength of VND437,432,000,000 and greater (based on Tangible Net Worth) and a Risk Indicator which is Good (low risk).
Commentary Subject Company’s Risk Indicator is 2, indicating Good risk.
Major factors influencing the Company’s Risk Indicator are as follows:
Long establishment (Since 1976)
Listed on the Vietnam Stock Exchange (HOSE): Coded ABC
Excellent payment
Key management more than 5 years experiences
Strong ownership background
Improved turnover and net profits
Increased accumulated profits
Lengthened collection but shortened payment periods
Strong liquidity standing (Current ratio > 1.20)
Lowly leveraged ( < 20%)
D&B Rating 5A2
Financial Strength 5A Based on tangible net worth
Risk Indicator 2 Good (Low risk)
Risk Indicator 2
D&B Rating Guide
D&B's Rating consists of 2 parts, the Financial Strength and the Composite Appraisal/Condition. Financial Strength is an
indication of the tangible net worth (that is, the shareholder's funds less any intangible assets). The Composite
Appraisal/Condition is linked to the level of risk and is an overall evaluation of credit worthiness. It takes into account the
financial condition and several factors such as trade reference history, legal structure, management experience and any
adverse listings.
Good

Vietnam Comprehensive Report
4
Credit Risk Index / CRI
Credit Risk Index is:
Legend CRI
1 Negligible Set terms to encourage growth 2 Minimal Risk Extend terms 3 Low Risk Proceed with confidence 4 Below Average Proceed but monitor 5 Above Average Review terms / seek guarantees 6 High risk Offer C.O.D. terms only -- Insufficient Data No Recommendation Possible (please note that this rating only server as a guide the credit risk of subject) METHODOLOGY
The Credit Risk Index (CRI) is calculated from a composite of weighted scores based on the information contained in this report. Subject has been scored among 11 Key Areas in its operations. A score is assigned for each area on a scale of 1 to 6 (1 representing lowest risk and 6 the most significant). Each score is first weighted according to that area's overall importance in credit analysis, and then aggregated and considered with other relevant influencing factor to derive at the CREDIT RISK INDEX. Adjustments are made to the score for any significant items detected. The credit risk score is always rounded up to the nearest figures. The following are the 11 key areas and their relative weight use in the CRI evaluation.
Key Area Weight (%)
A. Incidence of Slow Payments 22.50
B. Legal Structure 11.25
C. Length of Operation 3.75
D. Principals' Antecedents 7.50
E. Net Profit Growth 12.50
F. Net Worth Growth 10.00
G. Working Capital Growth 7.50
H. Sales Growth 5.00
I. Current Ratio 10.00
J. Debt-Equity Ratio 5.00
K. Net Worth 5.00
2
1 6

Vietnam Comprehensive Report
5
PAYMENT
D&B Payment Index: 100
Payment experiences reflect how bills are met in relation to the terms granted. In some instances payments beyond terms
can be the result of disputes over merchandise, skipped invoices, invoice misunderstandings or administrative errors. Each
experience shown represents a separate account reported by a supplier. Updated payment experiences replace those
previously reported. Amounts may be rounded to nearest figure in prescribed ranges.
The Payment Index figure is calculated from all available trade experiences within two years. The Payment Index gives a
high level indication of payment habits for the subject company and is represented by a percentage between 1 (slow
paying) and 100 (prompt paying). The Payment Index should not be used as a substitute for predictive scores.
Trade Payment Experiences Summary
Value Bands No of Exp
Total Value Within Terms
1-30 Days
31-60 Days
61-90 Days
91+ Days
>10,000,000,000 0 0 0% 0% 0% 0% 0%
1,000,000,001 - 10,000,000,000 2 4,271,000,000 100% 0% 0% 0% 0%
100,000,001 - 1,000,000,000 0 0 0% 0% 0% 0% 0%
10,000,001 - 100,000,000 0 0 0% 0% 0% 0% 0%
1,000,001 - 10,000,000 2 4,000,000 100% 0% 0% 0% 0%
<1,000,000 0 0 0% 0% 0% 0% 0%
TOTAL 4 4,275,000,000 100% 0% 0% 0% 0%
Trade Payment Experiences Details
Any amounts hereafter are in VND unless otherwise stated. Amounts may be rounded to nearest figure in prescribed ranges.
Date Paying Record Supplier Industry Terms Usually
Pays Maximum
Outstanding Current Balance
Beyond Terms
8-Oct-12 PROMPT Freight forwarding Net 30 2,000,000 2,000,000 0
30-Sep-12 PROMPT Net 0 2,104,000,000 2,167,000,000 0
30-Sep-12 PROMPT Freight forwarding Net 30 2,000,000 2,000,000 0
31-Jul-12 PROMPT Net 2,104,000,000 2,104,000,000 0

Vietnam Comprehensive Report
6
PRINCIPALS
Directors
1. Name : Mr. Pham Quang Vu
Position : General Director/ Vice Chairman
Nationality : Vietnamese
Year of Birth : 1959
Appointed Date : June 2010
Education : Bachelor of Economics
Email : [email protected]
Active in daily operations : Yes
Experience : Related experience since 1995
Employment history :
2004 -2010 : ABC JSC as Vice General Manager
1996 -2004 : ABC JSC as Manager
2. Name : Mr. Doan Dinh Thiem
Position : Chairman
Nationality : Vietnamese
Year of Birth : 1954
Appointed Date : 27 October 2010
Education : Doctorate of Economics
Active in daily operations : No
Experiece : Related experience since 1996
Employment history :
2004 -2008 : MINISTRY OF AGRICULTURE AND RURAL DEVELOPMENT OF VIETNAM
1996 -2004 : MINISTRY OF AGRICULTURE AND RURAL DEVELOPMENT OF VIETNAM
3. Name : Mr. Le Quang Chinh
Position : Investment & Construction Deputy General Director
Nationality : Vietnamese
Appointed Date : June 2010
Year of Birth : 1954
Education : Bachelor of Economics
Email : [email protected]
Active in daily operations : Yes
Employment history :
1997 -2004 : ABC JSC as Vice Manager

Vietnam Comprehensive Report
7
4. Name : Mr. Le Hung Dung
Position : Finance Deputy General Director/ Chief Accountant
Nationality : Vietnamese
Year of Birth : 1965
Appointed Date : June 2010
Education : Bachelor of Economics and Law
Active in daily operations : Yes
Employment history :
2005-Present : ABC JSC as Chief Accountant
1997 -2004 : ABC JSC as Deputy Manager
1988 -1997 : ABC JSC as Accountant
5. Name : Mr. Nguyen Thanh Tung
Position : Vice General Director/ Marketing Manager
Nationality : Vietnamese
Appointed Date : February 2012
Education : Graduated from University
Active in daily operations : Yes
6. Name : Mr. Nguyen Cong Trung
Year of Birth : 1976
Position : Director
Nationality : Vietnamese
Education : Bachelor of Law
Active in daily operations : Yes
Employment history :
2006 -2010 : VIETNAM COFFEE as Secretary
1999 -2006 : VIETNAM COFFEE as Administrator
7. Name : Mr. Nguyen Dang Quang
Year of Birth : 1963
Position : Director
Nationality : Vietnamese
Education : Doctorate of Physics
Master of Business Administration
Active in daily operations : No
Employment history :
2000-Present : MM GROUP CORPORATION as Chairman
1999 -2002 : ABC BANK as Vice Chairman
1995 -1998 : ABC BANK as Vice General Manager

Vietnam Comprehensive Report
8
8. Name : Mr. Truong Cong Thang
Year of Birth : 1973
Position : Director
Nationality : Vietnamese
Education : Bachelor of Economics
Active in daily operations : No
Other directorship :
D-U-N-S 55534XXXX MM CORPORATION as CEO
Employment history :
Unknown : XXX HOLDING CO.
Unknown : B & C COMPANY
9. Name : Mr. Bui Xuan Thoa
Year of Birth : 1955
Position : Director
Nationality : Vietnamese
Education : Bachelor
Experience : Related experience since 1979
Active in daily operations : No
Employment history :
2005 -2010 : ABC JSC as General Director
1989 -2004 : ABCJSC as Manager
10. Name : Mr. Do Van Nam
Year of Birth : 1955
Position : Director
Nationality : Vietnamese
Education : Bachelor of Economics
Experience : Related experience since 1978
Active in daily operations : No
11. Name : Mr. To Hai
Year of Birth : 1973
Position : Director
Nationality : Vietnamese
Education : Master of Banking
Active in daily operations : No
Employment history :
2002 -2003 : A SECURITIES COMPANY
2001 -2002 : B SECURITIES COMPANY
1997 -2000 : TELECOM NATIONAL

Vietnam Comprehensive Report
9
12. Name : Mr. Dinh Quang Hoan
Year of Birth : 1976
Position : Director
Nationality : Vietnamese
Education : Master of Economics
Active in daily operations : No
Key Executives
1. Name : Ms. Pham Thi Tham
Position : Office Manager-Administration
Nationality : Vietnamese
Education : Graduated from University
Email : [email protected] Active in daily operations : Yes
2. Name : Mr. Nguyen Thanh Tung Position : Marketing Manager Nationality : Vietnamese Appointed Date : February 2012 Education : Graduated from University Active in daily operations : Yes 3. Name : Mr. Le Hung Dung Position : Chief Accountant Nationality : Vietnamese Year of Birth : 1965 Appointed Date : June 2010 Education : Bachelor of Economics and Law Email : [email protected] Active in daily operations : Yes
BANKERS
Bank Name: JOINT STOCK COMMERCIAL BANK FOR FOREIGN TRADE OF VIETNAM Address: Dong Nai, Vietnam Bank Name: VIETCOMBANK Address: Ho Chi Minh City Branch Information in this report may not represent the full extent of subject's bank relationships.

Vietnam Comprehensive Report
10
HISTORY
Background Subject was established on 15 January 1975 ABC Coffee Factory. Later, the company changed its name and adopted the present name of ABC JOINT STOCK COMPANY. Meanwhile, the company’s legally registered Vietnamese name is CONG TY CO PHAN ABC. Subject also trading under its tradestyle, ABC CAFE. Subject is engaged in manufacturing of instant, roasted coffee and instant cereal mix. An establishment of about 38 years, Subject has been in this line of business since its commencement. Mr Pham Quang Vu, the General Director, currently heads the company and overall operations.
Legal Form The company was firstly registered on 6 May 1993 under the registration number 110763 with the legal form of GOVERNMENT ENTERPRISE. Later, on 29 December 2004, the company changed its legal structure to JOINT STOCK COMPANY under the Decree 64/2000/ND-CP dated 19 June 2000 and also changed its registration number to 4703000111. Finally, on 7 September 2011, the company was registered with the Ministry of Planning and Investment in Dong Nai Province under the registration number of 3600261XXX which is also the company’s tax number.
Capital Registered Capital: VND265,791,350,000 Paid-Up Capital: VND265,791,350,000 CHANGES IN CAPITAL The following changes were confirmed by the local registry office.
Date of Change : 16 September 2009 Capital Type : Paid-up Capital Nature of Change : Increased From : VND250,000,000,000 To : VND265,791,350,000
Shareholders and Shareholdings The following details represents the Full Shareholders List
Name Country % of Shareholdings
MM CORPORATION Vietnam 50.11
VIETNAM COFFEE Vietnam 37.30
PHAM QUANG VU Vietnam 1.13
CC JSC Vietnam 11.46
Total 100.00
Total of Shareholders: 4 Shareholder as at: 27 December 2012
This information provided by: Search at local registry and confirmed by the management

Vietnam Comprehensive Report
11
LINKAGE
Parent Name: MM CORPORATION Location: Floor 12, Kumho Asiana Plaza Saigon Building, No. 39 Le Duan Street, Ben Nghe Ward, District 1, Ho Chi Minh City, Vietnam DUNS: 55-534-XXXX Holds Shares in Subject: 50.11%
Affiliate(s) Name: VIETNAM COFFEE Location: 211-213-213A Tran Huy Lieu, Ward 8, Phu Nhuan District, Ho Chi Minh City, Vietnam DUNS: 55-522-XXXX Affiliate holds 37.3 % of shares / interest in subject. Name: CC JSC Location: 222A Tran Huy Lieu, Ward 8, Phu Nhuan District, Ho Chi Minh City, Vietnam DUNS: 55-511-XXXX Affiliate holds 11.46 % of shares / interest in subject.
BRANCHES Subject maintains 3 branches country wide.
No. 5, Ong Ich Khien Street, Ba Dinh Dist, Hanoi, Vietnam Location Type: Operations office Tax number: XXXXXXXXXX-001
No. 10, Hoang Du Khuong Street, Ward 12, Dist 10, Ho Chi Minh City, Vietnam Location Type: Operations office Tax number: XXXXXXXXXX-002
Lot C.I.II - 3+5+7, Long Thanh Industrial Zone, Long Thanh District, Dong Nai Province, Vietnam Location Type: Operations office and Factory/ Warehouse Tax number: XXXXXXXXXX-003
Vietnam Comprehensive Report
12
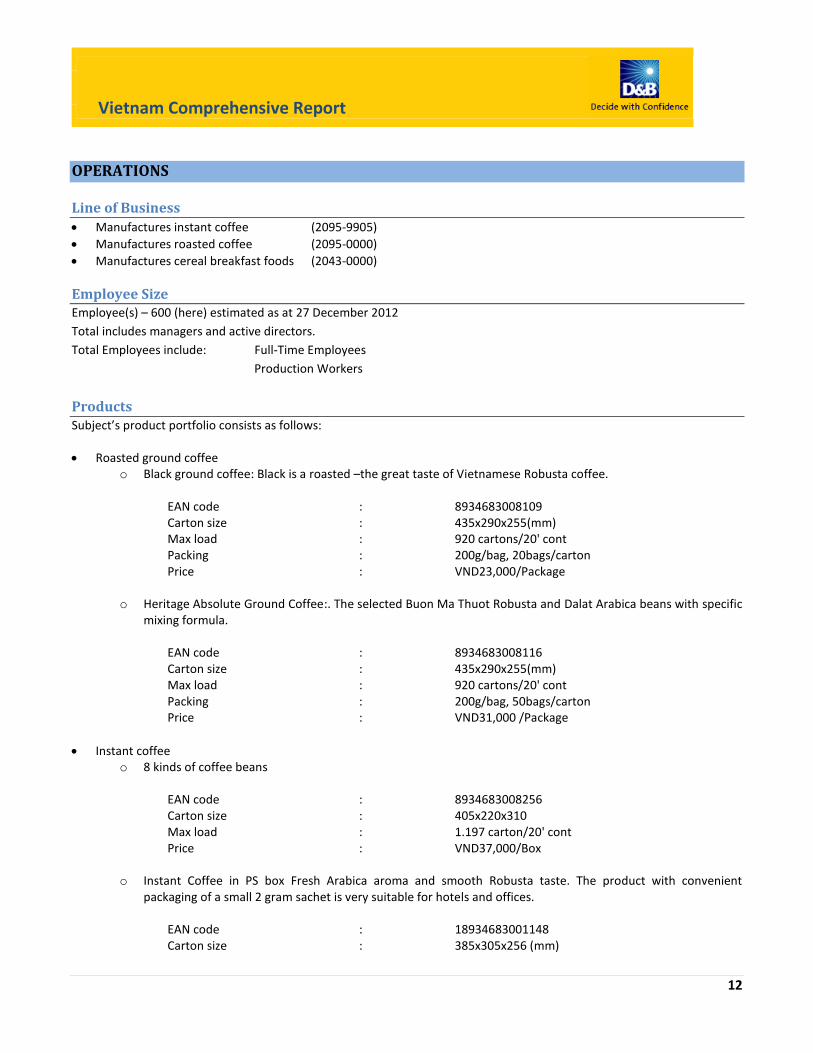
OPERATIONS
Line of Business
Manufactures instant coffee (2095-9905)
Manufactures roasted coffee (2095-0000)
Manufactures cereal breakfast foods (2043-0000)
Employee Size Employee(s) – 600 (here) estimated as at 27 December 2012
Total includes managers and active directors.
Total Employees include: Full-Time Employees
Production Workers
Products Subject’s product portfolio consists as follows:
Roasted ground coffee o Black ground coffee: Black is a roasted –the great taste of Vietnamese Robusta coffee.
EAN code : 8934683008109 Carton size : 435x290x255(mm) Max load : 920 cartons/20' cont Packing : 200g/bag, 20bags/carton Price : VND23,000/Package
o Heritage Absolute Ground Coffee:. The selected Buon Ma Thuot Robusta and Dalat Arabica beans with specific mixing formula.
EAN code : 8934683008116 Carton size : 435x290x255(mm) Max load : 920 cartons/20' cont Packing : 200g/bag, 50bags/carton Price : VND31,000 /Package
Instant coffee o 8 kinds of coffee beans
EAN code : 8934683008256 Carton size : 405x220x310 Max load : 1.197 carton/20' cont Price : VND37,000/Box
o Instant Coffee in PS box Fresh Arabica aroma and smooth Robusta taste. The product with convenient packaging of a small 2 gram sachet is very suitable for hotels and offices.
EAN code : 18934683001148 Carton size : 385x305x256 (mm)

Vietnam Comprehensive Report
Vietnam Comprehensive Report
13
Max load : 1.074 cartons/20' cont Packing : 2g/sachet, 20sachets/box, 45boxes/carton Price : VND26,000/Box
o Instant Coffee in paper box: Economical packaging. EAN code : 89346830011340 Carton size : 395x245x255 (mm) Max load : 1.309 cartons/20' cont Packing : 2g/sachet, 20sachets/box, 42boxes/carton Price : VND23,500/Box
Instant nutritious cereals
o Instant nutritious cereal 10 sachets per box EAN code : 8934683 0094688 Carton size : 460x316x250 (mm) Max load : 889 cartons/20' cont Packing : 28g/sachet, 10 sachets/box, 24 boxes/carton Price : VND25,300/Box
o ABC Instant Nutritious Cereal 20 sachets per bag EAN code : 893468300826 Carton size : 425x290x360 (mm) Max load : 4000 cartons/40' cont Packing : 20 sachets/Bag Price : VND50,000/Bag
DM instant nutritious cereal
o DM instant nutritious cereal 14 sachets per bag: The product is especially suitable for school age. EAN code : 8934683009598 Carton size : 435x270x305 (mm) Max load : 902 cartons/20' cont Packing : 28g/sachet, 14sachets/bag, 16bags/carton Price : VND41,000/Bag
o DM instant nutritious cereal 14 sachets per box: The product is especially suitable for school age. EAN code : 8936010490437 Carton size : 385x260x252 (mm) Max load : 1.280 cartons/20' cont Packing : 28g/sachet, 14sachets/box, 14boxes/carton Price : VND41,000/Box

Vietnam Comprehensive Report
Vietnam Comprehensive Report
14
Production Capacities
Instant Coffee - 3,200 tons per annum Instant Black Coffee powder - 3,200 tons per annum 3-in-1 coffee mixes - 21,000 tons per annum
Manufacturing costs
Total manufacturing costs account for about 80% of the selling price; therefore, any changes in green coffee and sugar
prices could impact significantly on the company’s profitability. However, the company holds substantial power to transfer
the increased costs to customers by increasing selling price. In 2008 and 2009 when there were shortages of coffee and
sugar due to bad weather, coupled with applying good inventory management, the company increased selling prices by
about 5% per annum and was able to preserve margins of 20% despite higher manufacturing costs.
Brand Name s Subject’s brand names are as follows:
ABC Cafe Black
ABC Cafe Heritage
ABC Espresso
ABC Gold
ABC Super
ABC Cafe 3-in-1
DM
Awards Checks indicated that the company was awarded with the following certifications:
Vietnam High Quality Product
Vietnamese Gold Star Award
ISO 9001:2000
Location Type of Occupation: Rented Premises Used As: Administrative Office, Sales Office, Operations Office, Plant and Warehouses. Location Area: Industrial Zone Mailing Address: Street 1, An Binh Ward, Bien Hoa, Dong Nai, Vietnam

Vietnam Comprehensive Report
Vietnam Comprehensive Report
15
CUSTOMERS
MAJOR CUSTOMERS METRO CASH & CARRY VIETNAM, Vietnam
BIG C SUPERMARKET, Vietnam
TRI MAI COMPANY LIMITED, Vietnam
I&T ENTERPRISE, United States of America
GROUP ASIA DRAGON RISE INTERNATION, Taiwan
SALES
Sales Territory LOCAL : 50%
OVERSEAS : 50%
Asia
Taiwan
Europe
United States of America
Selling Terms Local
Cash on Delivery
Bank transfer
Open Account
Overseas
Letter of Credit
Bank transfer
SUPPLIERS
D-U-N-S : 555340483 SAIGON PLASTIC JOINT STOCK COMPANY 242 Tran Phu Street, Ward 9 , Ho Chi Minh City, Vietnam
D-U-N-S : 555284298 BIEN HOA SUGAR JOINT STOCK COMPANY Road 1, Bien Hoa I Industrial Zone, Bien Hoa City, Dong Nai, Vietnam
D-U-N-S : 555343289 DUC NGUYEN COFFEE EXPORT IMPORT JOINT STOCK COMPANY Buon Me Thuot, Dak Lak, Vietnam

Vietnam Comprehensive Report
Vietnam Comprehensive Report
16
MINH TIEN COFFEE ENTERPRISE PTE. Vietnam
PT ANEKA COFFEE Indonesia
ADA RESOURCES SDN.BHD Malaysia
PT KIEVIT Indonesia
KERRY INGREDIENTS Malaysia
SPECIALTY INGREDIENT MANAGEMENT Indonesia
PURCHASE TERMS
Purchasing Territory LOCAL : 95%
OVERSEAS : 5%
Malaysia
Indonesia
The Netherlands
Purchasing Terms Local
Cash on Delivery
Bank transfer
Open Account Overseas
Letter of Credit
Bank transfer
LITIGATION
As Vietnam Government policy, legal suits filed against the company and any of its directors do not belong to public
domain, therefore there is no litigation information available for public inspection.

Vietnam Comprehensive Report
Vietnam Comprehensive Report
17
FINANCIAL INFORMATION
Financial Highlights
Overall, the company has shown an improved turnover trend. Sales increased tremendously from VND1.02 trillion in 2009 to VND1.30 trillion in 2010 before further up to VND1.59 trillion in 2011. Cost of sales increased from VND774.14 billion in 2009 to VND1.19 trillion in 2011. The trend observed for the cost of sales mirrors that of turnover. The cost of sales reached its high in 2011. Meanwhile, general operating expenses also increased from VND129.30 billion in 2009 to VND202.45 billion in 2011. Sales together with other non-operating income as well as extraordinary item have proved sufficient to fully cover cost of sales, general operating expenses, financial expenses and income tax incurred in 2011. Net profitability was sustained for three years, with continuously growth from VND98.04 billion in 2009 to VND161.56 billion in 2010 and later expanded to VND211.11 billion in 2011. The company enjoyed profitability in all the years as a result of its ability to control its costs. Gross profit margin has slided from 24.30% in 2009 to 20.96% in 2010 but later rose to its all time high of 24.73% in 2011 whereas pre-tax profit margin increased from 9.61% in 2009 to 14.72% in 2011. Similarly, net profit margin increased from 9.59% in 2009 to to 13.31% in 2011. Return wise, there were better results in 2011 compared to 2010. The company was more efficient in generating returns from both assets and equity invested. Current ratio rose from 0.80 in 2009 to 8.87 in 2011. Meanwhile, quick ratio also showed an increasing trend, increasing from 0.39 in 2009 to 4.11 in 2010 before rising to 5.94 in 2011. The improvement in both ratios was largely attributed to an increasing current assets position, which posted average increment of 80.76% as opposed to a 46.10% decrease by average in current liabilities for three financial years under review. To determine if the company can meet its short term debt obligations, the ratios should be compared to their respective benchmarks. The benchmarks for the current ratio and quick ratio are 1.20 and 1.00 respectively. Both the current and quick ratios surpass these. Therefore, the company may have sufficient liquid assets to meet its current debt obligations. Inventory conversion period increased from 49.76 days in 2009 to 58.09 days in 2011, implying that it took a longer time for the company to turn its stocks into sales. Payment period decreased to 6.28 days in 2011 as compared to 34.81 days in 2009. Meanwhile, collection period lengthened from 13.04 days in 2009 to 37.35 days in 2011. Both asset and fixed asset turnover ratios increased to 1.94 and 46.80 times respectively in 2011 from 1.62 and 4.02 times respectively in 2009. All in all, the company was more efficient to capitalizing on its assets to generate better returns. Total debt to asset ratio has been decreasing, posting at 10.87% in 2011. Therefore, the company has continued to rely on more equity than debt to fund its assets. The debt ratio in 2011 suggests that the company has undertaken a low level of total debt obligations.

Vietnam Comprehensive Report
Vietnam Comprehensive Report
18
Trend of Turnover & Profit After Tax
Trend of key balance sheet items
0
50,000
100,000
150,000
200,000
250,000
0
200,000
400,000
600,000
800,000
1,000,000
1,200,000
1,400,000
1,600,000
1,800,000
As at Dec 31, 2009 As at Dec 31, 2010 As at Dec 31, 2011
(V
ND
in m
illion
) (
VN
D i
n m
illi
on
)
Turnover Profit after Tax
0
100,000
200,000
300,000
400,000
500,000
600,000
700,000
800,000
900,000
-200,000
0
200,000
400,000
600,000
800,000
1,000,000
1,200,000
1,400,000
1,600,000
As at Dec 31, 2009 As at Dec 31, 2010 As at Dec 31, 2011
(V
ND
in m
illion
) (
VN
D i
n m
illi
on
)
Total Assets Working Capital Total Shareholder's Equity

Vietnam Comprehensive Report
Vietnam Comprehensive Report
19
The following financial information was obtained from Subject and these accounts are audited by KPMG Company Limited.
Comparatives
Fiscal Fiscal Fiscal 31-Dec-09 31-Dec-10 31-Dec-11
( VND in Millions) ( VND in Millions) ( VND in Millions)
Turnover 1,022,601 1,301,664 1,585,572
Pre-tax Profit 98,320 178,260 233,460
Net Worth 210,542 570,890 711,845
Fixed Assets 254,635 32,934 33,881
Total Assets 631,841 711,907 800,745
Current Assets 271,902 676,789 762,112
Current Liabilities 340,501 116,918 85,881
Working Capital (68,599) 559,871 676,231
Long Term Debt 80,798 24,099 3,019
Intangibles 68 17,320 17,320
Net Worth and Total Assets are tangible figures shown after the deduction of intangible assets.
Ratios
Dec 31, 2009 Dec 31, 2010 Dec 31, 2011
Gross Profit (Loss) Margin (%) 24.30 20.96 24.73
Pre-Tax Profit (Loss) Margin (%) 9.61 13.69 14.72
Net Profit (Loss) Margin (%) 9.59 12.41 13.31
Return on Assets (%) 15.52 22.16 25.81
Return on Equity (%) 46.55 27.47 28.95
Current Ratio 0.80 5.79 8.87
Quick Ratio 0.39 4.11 5.94
Cash Ratio 0.30 0.53 0.39
Accounts Receivable Turnover Ratio
(Times)
27.98 11.64 9.77
Accounts Payable Turnover Ratio
(Times)
10.49 16.58 58.08
Collection Period (Days) 13.04 31.37 37.35
Payment Period (Days) 34.81 22.01 6.28
Inventory Turnover Ratio (Times) 7.33 6.62 6.28
Inventory Conversion Period (Days) 49.76 55.17 58.09
Fixed Asset Turnover Ratio (Times) 4.02 39.52 46.80
Asset Turnover Ratio (Times) 1.62 1.78 1.94
Total Debt to Asset Ratio (%) 66.67 19.34 10.87
Total Debt to Equity Ratio (%) 200.04 23.97 12.19
Non-Current Debt to Equity Ratio (%) 38.36 4.10 0.41

Vietnam Comprehensive Report
Vietnam Comprehensive Report
20
Balance Sheet
As at Dec 31, 2009 As at Dec 31, 2010 As at Dec 31, 2011
( VND in Millions) ( VND in Millions) ( VND in Millions) Current Assets 271,902 676,789 762,112
Other Assets 105,372 19,504 22,072
Fixed Assets 254,635 32,934 33,881
Total Assets 631,909 729,227 818,065
Current Liabilities 340,501 116,918 85,881
Non-Current Liabilities 80,798 24,099 3,019
Total Liabilities 421,299 141,017 88,900
Working Capital (68,599) 559,871 676,231
Share Capital 250,000 265,791 265,791
Capital Reserves - 29,974 29,974
General Reserves - 132,326 168,271
Other Equity - 9,048 3,982
Accumulated Profit (Loss) (39,390) 151,071 261,147
Total Shareholder's Equity 210,610 588,210 729,165
As at 31 December 2011 Balance Sheet Breakdown (VND in Millions)
Cash & Bank 298,223
Account Payables 27,302
Inventory 252,328
Due to Customers 2,534
Account Receivables 162,235
Other Payables / Accruals 7,306
Other Current Assets 49,326
Deferred Taxation 27,194
Other Current Liabilities 21,545
Total Current Assets 762,112
Total Current Liabilities 85,881
Property, Plant & Equipment 173,572
Provisions 3,019
Less Acc. Depreciation (139,691)
Total Non-Current Liabilities 3,019
Total Fixed Assets 33,881
Capital 265,791
Deferred Expenditure 4,752
Capital Reserves 29,974
Total Other Assets 4,752
General Reserves 168,271
Other Equity 3,982
Intangibles 17,320
Retained Earnings (Loss) 261,147
Total Intangibles 17,320
Total Equity 729,165
Total Assets 818,065
Total Liabilities & Equity 818,065
Vietnam Comprehensive Report
Vietnam Comprehensive Report
21
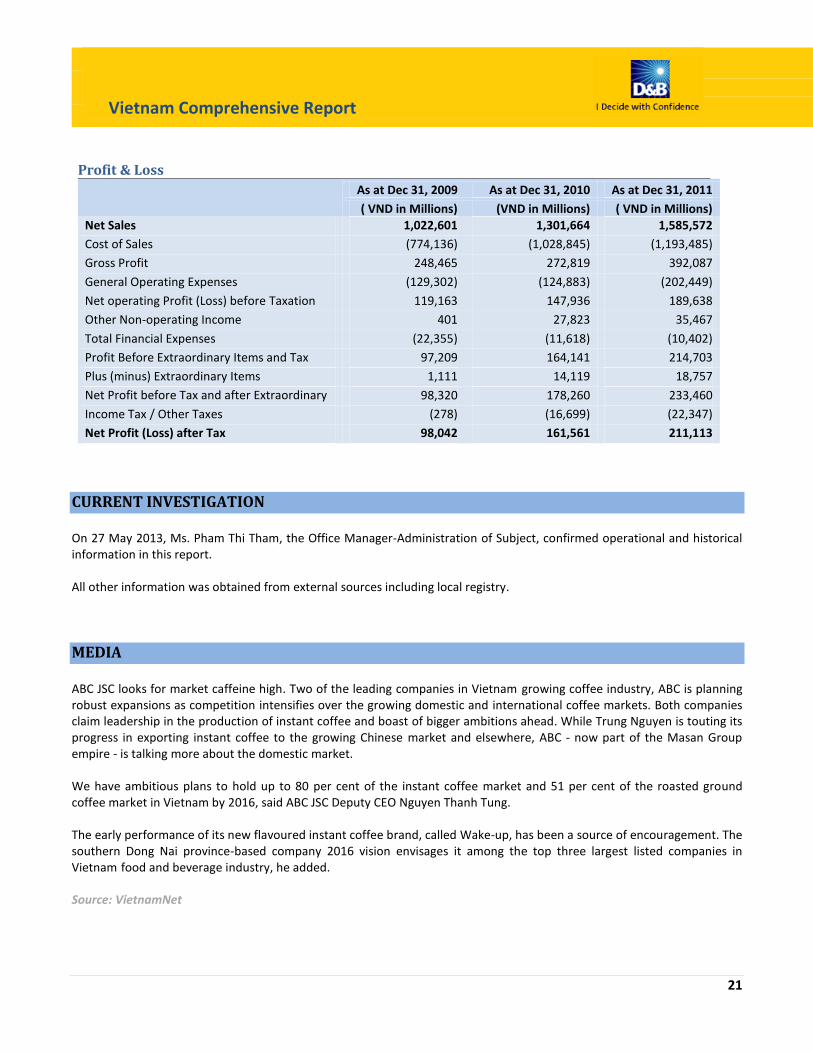
Profit & Loss
As at Dec 31, 2009 As at Dec 31, 2010 As at Dec 31, 2011
( VND in Millions) (VND in Millions) ( VND in Millions) Net Sales 1,022,601 1,301,664 1,585,572
Cost of Sales (774,136) (1,028,845) (1,193,485)
Gross Profit 248,465 272,819 392,087
General Operating Expenses (129,302) (124,883) (202,449)
Net operating Profit (Loss) before Taxation 119,163 147,936 189,638
Other Non-operating Income 401 27,823 35,467
Total Financial Expenses (22,355) (11,618) (10,402)
Profit Before Extraordinary Items and Tax 97,209 164,141 214,703
Plus (minus) Extraordinary Items 1,111 14,119 18,757
Net Profit before Tax and after Extraordinary
Items
98,320 178,260 233,460
Income Tax / Other Taxes (278) (16,699) (22,347)
Net Profit (Loss) after Tax 98,042 161,561 211,113
CURRENT INVESTIGATION On 27 May 2013, Ms. Pham Thi Tham, the Office Manager-Administration of Subject, confirmed operational and historical information in this report. All other information was obtained from external sources including local registry. MEDIA ABC JSC looks for market caffeine high. Two of the leading companies in Vietnam growing coffee industry, ABC is planning robust expansions as competition intensifies over the growing domestic and international coffee markets. Both companies claim leadership in the production of instant coffee and boast of bigger ambitions ahead. While Trung Nguyen is touting its progress in exporting instant coffee to the growing Chinese market and elsewhere, ABC - now part of the Masan Group empire - is talking more about the domestic market. We have ambitious plans to hold up to 80 per cent of the instant coffee market and 51 per cent of the roasted ground coffee market in Vietnam by 2016, said ABC JSC Deputy CEO Nguyen Thanh Tung. The early performance of its new flavoured instant coffee brand, called Wake-up, has been a source of encouragement. The southern Dong Nai province-based company 2016 vision envisages it among the top three largest listed companies in Vietnam food and beverage industry, he added. Source: VietnamNet

Vietnam Comprehensive Report
Vietnam Comprehensive Report
22
COUNTRY OVERVIEW
Economy As estimated, 2012’s GDP at 1994 constant prices rose 5.03% from 2011, of which it increased by 4.64% in 1st Quarter; by 4.80%in 2nd Quarter; by 5.05% in 3rd Quarter and by 5.44% in 4th Quarter. Of 5.03% general pace of the whole economy, the sector of agriculture, forestry and fishery rose 2.72%, contributed 0.44 point percent; the industry and construction by 4.52%, contributed 1.89 points percent; and the service by 6,42%, contributed 2.70 points percent. In 2012, PPI for agricultural, forest and fishing products rose 3.91% from 2011, of which PPI for agricultural products rose 1.05%; for forest products by 14.26% and for aquatic products by 13.78%. PPI for industrial products rose 9.32% from 2011, of which PPI for mining rose 19.10%; for manufacturing by 7.1%; for power by 9.9%; and for water supply by 14.45%. Raw materials price indexes (RMPI) for domestic production rose 9.04% from 2011. Transport charge indexes (TCI) rose 13.2% from 2011. Export price index decreased by 0.54% against 2011. Import price index decreased by 0.33% against 2011. December’s export turnovers were at an estimation of USD10.4 billion, rose 0.5% from November and by 15% against 2011. Generally, export turnovers in 2012 reached 114.6 billion USD, rose 18.3% from 2011, of which the domestic economic sector gained USD42.3 billion, increased by 1.3% and the FDI sector (including crude oil) USD72.3 billion, by 31.2% respectively. If crude oil were excluded export turnovers of the FDI sector this year would reach USD63.9 billion and rise 33.5% from 2011. If inflation were excluded, 2012’s export turnovers would increase by 18.9%. There was a change in structure of export turnovers in this year against last year: heavy industrial and mineral goods reached an estimation of USD51.7 billion, rose 49.9% and represented 45.1% (the figure in 2011 was 35.6%), mainly due to increase in turnovers of exported telephones and components, an estimation of USD6.2 billion (by 97.7%). Light industrial and handicraft goods gained USD39 billion, equal the figure in 2011 but their share in export turnovers declined from 40.3% in 2011 to 34.1% in 2012. Agricultural and forestry products gained USD17.7 billion, rose 18% from 2011 but their share in export turnovers was unchanged with 15.4% rate. Aquatic products reached USD6.2 billion, approximate to 2011 and their share declined from 6.3% in 2011 to 5.4% in2012. About markets for exportation in 2012, EU rose to be the largest one with USD20.3 billion, rose 22.5% from 2011 and represented 17.7% of total export turnovers. December’s import turnovers were at an estimation of USD10.6 billion, rose 6.5% from November and by 13% from 2011. 2012’s import turnovers reached USD114.3 billion, rose 7.1% from 2011, of which the domestic economic sector gained USD54 billion, decreased by 6.7%; the FDI sector reached USD60.3 billion, increased by 23.5%. This was the slowest pace since 2002 (excluding 2009). If inflammation were excluded, 2012’s import turnovers would rise 7.4% from 2011. The structure of import turnovers this year also had a change against 2011, the group of means of production reached an estimation of USD106.5 billion, represented the highest share of 93.2%, higher than 2011’s 90.6% pace, mainly as the density of the group of imported machinery, equipment and accessories related to assembling goods for exportation rose from 29% to 36.9%. The group of raw materials represented 56.3%, decreased against last year’s 61.6%; the group of consumer goods gained USD7.8 billion, represented 6.8%, decreased against last year’s 7.6%. About markets for importation, China was still the largest one with USD28.9 billion, rose 17.6% from 2011 and represented 25.3% of total import turnovers; following were ASEAN with USD21 billion, rose 0.3% and represented 18.3%; Republic of Korea USD15.6 billion, by 18.4% and 13.6%; Japan USD11.7 billion, by 12.2% and 10.2%; EU USd8.8 billion, by 13.3% and 7.7%; the United States USD4.7 billion, by 4.7% and 4.1% respectively.

Vietnam Comprehensive Report
Vietnam Comprehensive Report
23
2012’s trade surplus was USD284 million and this was the first year Viet Nam had trade surplus since 1993, of which the FDI sector had trade surplus of about USD12 billion, focusing on assembled goods. Contrarily, the domestic sector had trade deficit of USD11.7 billion. Source: General Statistics of Vietnam – Socio-economic Statistics Import and export by ASEAN countries in 2012
Source: General Statistics of Vietnam – Thematic Data (Import-Export Turnover) Import of goods in 2012 in Vietnam Exports of goods in 2012 in Vietnam (Values in USD million) (Values in USD million)
Value
Milk & dairy products 849
Source: General Statistics of Vietnam – Socio-economic Statistics (Import/Export)
Industry News Vietnam's coffee export market slowed on Tuesday as exporters sought to sell on par with London futures and buyers did not rush as their stocks were high, partly boosted by rising shipments so far this season, traders and the government said. Farmers slowing sales, anticipating prices to rise on reports that the crop this year will fall from a record high in 2011/2012, would also keep trade quiet, traders said. Vietnam, the world's second-largest producer after Brazil, has picked more than half of its 2012/2013 crop, but falling global prices also prompted growers to hold back sales. London's January contract eased $5, or 0.3 percent, to settle at $1,854 a tonne on Monday after dipping to $1,836, the lowest level for the second month since Feb. 6. Exporters were seeking to sell on par with London's January for Vietnamese beans grade 2, 5 percent black and broken, while bids were static at $50 a tonne.
01,000,0002,000,0003,000,0004,000,0005,000,0006,000,0007,000,0008,000,000
(USD
in t
ho
usa
nd
s)
Comparison of import and export values within ASEAN countries in 2012 (Prel.)
Export Import
Value
Coffee 3686
Vietnam Comprehensive Report
Vietnam Comprehensive Report
24
The January contract has now lost 15.5 percent since Vietnam's 2012/2013 crop year began on Oct. 1, while robusta prices have dropped at a slightly slower pace of about 12 percent in the same period. Prices in Daklak, the top growing province, eased to 37,400-38,000 dong ($1.79-$1.82) per kg on Tuesday, from 37,900-38,200 dong a week ago and 42,800 dong on Oct. 1. "The domestic market prices are sky-high," a trader in Ho Chi Minh City said. The crop year lasts from October to September of the following year. "Coffee is plentiful in warehouses now, so not many are buying yet," another trader in Ho Chi Minh City said. Growers have been selling slowly so far this year because they assumed the crop could shrink from the record high output of 2011/2012, traders said. The new crop could ease 9 percent from last year to 24.2 million bags, due to adverse weather, the U.S. Department of Agriculture attached in Vietnam has said. Vietnam exported an estimated 110,000 tonnes, or 1.83 million bags, of coffee in November, an increase of 55.6 percent from a year earlier, and exceeding market expectations, a government report said on Tuesday. Coffee exports in October and November would double to around 212,000 tonnes, or 3.53 million 60-kg bags, from 103,000 tonnes a year ago, the report said. The rising exports could push down global prices as the harvest peak led to ample supplies, traders said. Traders said old-crop beans would be nearly 150,000 tonnes, or 70 percent of the two-month shipment, suggesting the 2011/2012 crop produced 1.75 million tonnes, a record high. Vietnam had exported 1.6 million tonnes of coffee between October 2011 and this September, up 23 percent from the previous season, government data show. ($1=20,840 dong) Source: Reuters – 27 November 2012 Over 50 percent of the coffee material market was once controlled by foreign enterprises. At that time, pessimistic forecasts were given about the Vietnam’s coffee industry worth three billion dollars. However, Vietnamese coffee enterprises decided that they should not be defeated on the home market. In the 2010-2011 crop, Vietnam witnessed the bankruptcy and dissolution of a series of domestic coffee enterprises and the strong growth of foreign enterprises in the “opponent’s market.” Two years were enough for foreign enterprises to increase their market share from 10 percent to 50 percent. The enterprises attempted to control the material market, pushing domestic enterprises into deadlock. In the 2010-2011 crop, coffee had been sold out by farmers just by early the second quarter of 2011. However, the storehouses of domestic enterprises were empty, because the majority of coffee had been sold to foreign enterprises. As a result, domestic enterprises lacked materials for processing to fulfill the contracts signed before with foreign partners. Meanwhile, at that time, domestic enterprises did not receive the support from the local authorities, which believed that farmers had the right to sell coffee materials to those, who pay higher prices. At that time, foreign enterprises could easily gain the upper hand in the struggle to collect coffee materials. Since foreigners could borrow capital at low interest rates of 2-3 percent (Vietnamese had to pay 20 percent per annum), and they did not have to invest to grow the material areas, they could pay higher to farmers than Vietnamese enterprises. Nevertheless, according to Nguyen Nam Hai, General Director of Vinacafe, the foreigners’ market share has reduced from 50 percent to 30 percent. The public debt crisis in Europe is believed to be the main reason which has weakened foreign groups. Meanwhile, domestic enterprises, which have learnt the lesson from the defeat in the last coffee crop, have successfully joined forces to regain the material market share. The information has been confirmed by Do Ha Nam, Deputy Chair of the Vietnam Coffee and Cocoa Association (Vicofa) Do Ha Nam. Nam said that after some coffee enterprises incurred heavy losses in the 2010-2011crop, Vietnamese enterprises have regained their strength, becoming the key coffee exporters. Seventy percent of coffee exports in the 2011-2012 belong to domestic enterprises.

Vietnam Comprehensive Report
Vietnam Comprehensive Report
25
However, the good information is still not enough to the Vietnam’s coffee industry. Since the beginning of the year, local newspapers have continually named the coffee enterprises incurring heavy debts of up to trillions of dong. Vietnam has 150 enterprises exporting coffee products every year. The biggest exporter can export 200,000 tons, while small private businesses only export some hundreds of tons. BMT, which is considered the “eldest brother” in the coffee industry, has bogged down in big difficulties after three failure crops. In its golden age, in 2008-2009, the company led the top 10 Vietnamese coffee exporters, exporting 150,000 tons of coffee, earning 237 million dollars, holding 14.33 percent of the market share. However, the price fluctuations in the 2009-2010 crop then made the enterprise suffer. Many other coffee companies in the Central Highlands are facing the same problems: they have to borrow capital at sky high interest rates and cannot pay bank debts. Source: VietnamNet – 30 October 2012 The market research service provider AC Nielsen has clarified that the domestic instant coffee industry gained healthy revenue growth in this year’s first half and market leader was Nestle, not Trung Nguyen’s G7. This is the latest move made by Nielsen with an aim to clarify the information released by Trung Nguyen Coffee Corporation last week which the market researcher said to be misleading. The coffee maker last Wednesday held a press briefing to announce its dominance in local instant coffee market under a market survey by Nielsen. It stated G7 brand captured a dominating market share of 38% in 2011 and the figure rose to 40% in the first quarter of this year. However, Nielsen later denied the given information. “What has been said by Trung Nguyen is not our official information,” according to Nielsen. Trung Nguyen’s G7 only takes lead in 3 in 1 instant coffee sector, not the whole instant coffee industry, according to the survey result. The result was sent to Trung Nguyen Coffee Corporation but it was still embargoed. The market research firm confirmed it has yet to send any official document to confirm the final result with Trung Nguyen. It would create ambiguity when the firm reckoned the No.1 instant coffee brand was G7. “Such untrue information could adversely affect the reputation of Nielsen and other instant coffee brands,” said a representative of Nielsen. Local coffee powder and instant coffee sectors saw positive signs in the year’s first half. In particular, instant coffee market saw robust revenue growth in six big cities, mainly in HCMC. Nestle takes the lead in the domestic instant coffee market, followed by Trung Nguyen, and Vinacafe Bien Hoa, according to the latest release. Source: The Saigon Times – 10 July 2012
Vietnam Comprehensive Report
Vietnam Comprehensive Report
26
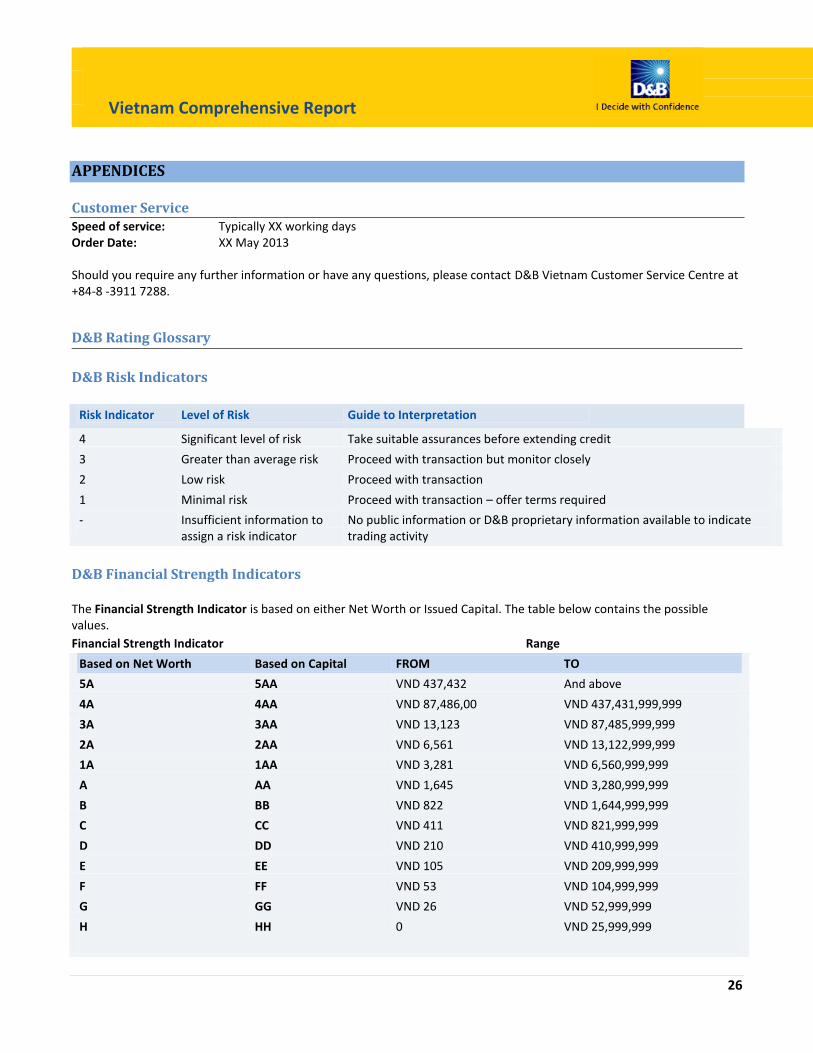
APPENDICES
Customer Service Speed of service: Typically XX working days Order Date: XX May 2013 Should you require any further information or have any questions, please contact D&B Vietnam Customer Service Centre at +84-8 -3911 7288.
D&B Rating Glossary
D&B Risk Indicators
Risk Indicator Level of Risk Guide to Interpretation
4 Significant level of risk Take suitable assurances before extending credit
3 Greater than average risk Proceed with transaction but monitor closely
2 Low risk Proceed with transaction
1 Minimal risk Proceed with transaction – offer terms required
- Insufficient information to
assign a risk indicator No public information or D&B proprietary information available to indicate trading activity
D&B Financial Strength Indicators The Financial Strength Indicator is based on either Net Worth or Issued Capital. The table below contains the possible values.
Financial Strength Indicator Range
Based on Net Worth Based on Capital FROM TO
5A 5AA VND 437,432 And above
4A 4AA VND 87,486,00 VND 437,431,999,999
3A 3AA VND 13,123 VND 87,485,999,999
2A 2AA VND 6,561 VND 13,122,999,999
1A 1AA VND 3,281 VND 6,560,999,999
A AA VND 1,645 VND 3,280,999,999
B BB VND 822 VND 1,644,999,999
C CC VND 411 VND 821,999,999
D DD VND 210 VND 410,999,999
E EE VND 105 VND 209,999,999
F FF VND 53 VND 104,999,999
G GG VND 26 VND 52,999,999
H HH 0 VND 25,999,999

Vietnam Comprehensive Report
Vietnam Comprehensive Report
27
Alternate Ratings Used
N Financial Strength is negative
O Financial Strength is undisclosed
NB New Business: Less than 24 months
NQ Out of Business: Business has ceased to trade
If both the Net Worth and the Issued Capital Figures are available then the Net Worth is always used to calculate the
Financial Strength.
Note: D&B Rating and CRI are valid for a period of 12 months subject to no changes in company’s activity. All Information contained in D&B report is obtained by D&B from the rated subject and third party sources. Although reasonable care has been taken to ensure that the information in the Report is true, such information is provided ‘as is’ without any warranty of any kind and D&B, in particular, makes no representation or warranty, express or implied, as to accuracy, timeliness or completeness of any such information. In providing this Rating and CRI, D&B does not underwrite the risks of any third party or that of the subject.
Financial Ratio Glossary
Key Business Ratios are used to identify irregularities in the status and future potential of a company.
Name Formula Explanation
Current Ratio (x)
Total Current Assets / Total Current Liabilities
This ratio shows the cover by current assets of short term creditors, and the higher the ratio the more assurance there is that payment of creditors can be met.
Current Liabilities to Net Worth (%)
(Total Current Liabilities / Tangible Net Worth) x100
This contrasts the funds that creditors are temporarily risking with a company with the funds permanently invested by the owners. The higher the ratio the less security for creditors. Care should be exercised when selling to any company with creditors of less than one year exceeding two thirds of net worth.
Asset Turnover (%)
(Turnover / Total Assets(including Intangibles)) x 100
This ratio measures how efficient the company's management has been in generating sales from the assets at its disposal. The measure can vary considerably from industry to industry and should therefore be judged according to the industry norm.
Profit Margin (%)
(Profit before Tax / Turnover) x 100
This reveals the profits earned per pound of sales and therefore measures the efficiency of the operation. This ratio is an indicator of the business' ability to withstand adverse conditions such as falling prices, rising costs or declining sales
Return on assets (%)
(Profit before Tax / Total Assets) x 100
This is the key indicator of profitability for a company it matches operational profits with the assets available to earn a return. Companies using their assets efficiently will have a relative high return while less well run businesses will have a relatively low return

Vietnam Comprehensive Report
Vietnam Comprehensive Report
28
CONFIDENTIALITY
Confidentiality
CONFIDENTIAL....THIS INFORMATION IS PROVIDED BY DUN & BRADSTREET SUBJECT TO THE TERMS AND CONDITIONS OF YOUR SUBSCRIPTION CONTRACT AND IS NOT TO BE DISCLOSED.
This report is forwarded to the Subscriber in strict confidence for the use by the
Subscriber as one factor to consider in connection with credit and other business
decisions. This report contains information compiled from information which Dun &
Bradstreet does not control and which has not been verified unless otherwise indicated
in this report. Dun & Bradstreet therefore cannot accept responsibility for the
accuracy, completeness or timeliness of the report. Dun & Bradstreet disclaims all
liability for any loss or damage arising out of or in anyway related to the contents of
this report. This material is confidential and proprietary to Dun & Bradstreet and/or
third parties and may not be reproduced, published or disclosed to others without the
express authorization of Dun & Bradstreet or the General Counsel of Dun & Bradstreet.
COPYRIGHT 2012 DUN & BRADSTREET. THIS REPORT MAY NOT BE REPRODUCED IN WHOLE OR IN PART IN ANY FORM OR MANNER WHATSOEVER.
Disclaimer
This material is confidential and proprietary to Dun & Bradstreet and Client (hereinafter referred to as “the Subscriber”) and may not be copied or otherwise reproduced, repackaged, further transmitted, transferred, disseminated, redistributed or resold, or stored for subsequent use for any such purpose, in whole or in part, in any form or any manner or by any means whatsoever, by any person without express authorization of Dun & Bradstreet (hereinafter referred to as ‘D&B’) or the General Counsel of Dun & Bradstreet. All information contained herein is obtained by D&B from sources believed by it to be accurate and reliable. Although reasonable care has been taken to ensure that the information herein is true, such information is provided ‘as is’ without any warranty of any kind and D&B, in particular, makes no representation or warranty, express or implied, as to the accuracy, timeliness or completeness of any such information. All information contained herein must be construed solely as statements of opinion and D&B shall not be liable for any loss incurred by users from any use of this report or its contents. D&B's information and opinion should not be the only criterion when making business decisions on subject of report. Data in this report should be considered as an additional factor together with others in order to reach a decision. In the course of its work/survey, D&B may have received information from the “Subject Company’’ being rated or graded, besides the fact that the report may also contain data/information available in the Public Domain or that made available through Secondary Sources.
Date of Report: June 6, 2013
-- End of Report --