aannual report 2009nnual report 2009 - grindrod ar 09 final.pdf · of thesen’s steamship company...
TRANSCRIPT

A n n u a l Re p o r t 20 0 9A n n u a l Re p o r t 20 0 9

VisionVisionContentsContents
OVERVIEWBusiness overview 1Geographic profi le 1Group history 2Strategic objectives and profi le 4Directorate 6
COMMENTARIESChairman’s report 12Chief executive offi cer’s report 14Financial director’s report 18Group fi nancial review 23Divisional reviews 28
SUSTAINABILITYSustainability review 58Corporate governance 59Audit committee report 65Remuneration report 67Risk management 74Social performance 78Corporate social investment 85Stakeholder engagement 87Environmental performance 89G3 Global Reporting Initiative content index 104
ANNUAL FINANCIAL STATEMENTSDirectors’ responsibility and approval 108Certifi cate by company secretary 108Independent auditor’s report 109Directors’ report 110Accounting policies 112Statements of fi nancial position 122Income statements 123Statements of comprehensive income 124Statements of cash fl ows 125Statements of changes in equity 126Segmental analysis 128Notes to the fi nancial statements 130Loan funds 174Interests in subsidiaries 175
SHAREHOLDERS INFORMATIONShare analysis of ordinary shareholders 178Share analysis of preference shareholders 179Share performance 180Notice of meeting 181Form of proxy attachedCorporate information 183Terms and expressions 184
The Grindrod group's vision is to create sustainable returns and long-term value for shareholders which is to be achieved through the contribution of the four divisions:
Shipping To be a signifi cant and profi table international shipowner and operator managing in excess of 150 ships.
Trading To be a sustainable commodity trading business which is a respected global participant.
Freight Services To be a dominant and profi table regional freight services provider focusing on infrastructural development.
Financial Services To grow Grindrod Bank to be a meaningful participant in the southern African fi nancial services arena.
MissionMissionShipping To provide worldwide, high quality shipping services through the ownership and operation of a diversifi ed fl eet of modern ships.
Trading To provide a global commodity trading service in agricultural, mineral and fuel products through end-to-end solutions by being an informed and trusted business partner.
Freight Services To be the fi rst choice provider of a broad range of regional freight services by integrating the group’s strategic infrastructure, assets and logistics and ships agency capabilities.
Financial Services To be a fast moving, medium size bank with a credit rating and status that attracts stable funding and generates an above average return on capital.

businessoverview commentaries sustainability
annual fi nancialstatements
shareholderinformation
Geographic profi leGeographic profi leBusiness overviewBusiness overview
Shi
pp
ing
Shi
pp
ing
Tra
din
g
Fre
ight
Se
rvic
es
Se
rvic
es
Fina
ncia
lS
erv
ice
sS
erv
ice
s
Angola
Argentina
Botswana
Brazil
Canada
China
Denmark
Ecuador
France
Hong Kong
Isle of Man
Japan
Malawi
Mauritius
Mozambique
Namibia
Peru
Singapore
South Africa
South Korea
Tanzania
The Netherlands
United Arab Emirates
United Kingdom
United States of America
Grindrod Limited is a holding company listed on the JSE Limited (JSE) and invests in subsidiaries, joint ventures and associates, operating in four business divisions, namely Shipping, Trading, Freight Services and Financial Services, which provide operating and marketing synergies both locally and internationally.
The group’s head offi ce is in Durban, South Africa and it has operations in 24 other countries as refl ected in the geographic profi le.
FFFre
ihh
ght
FFFre
ihh
ght
FiFinana
ncnciaia
FiFinana
ncnciaia
ll
page 1G
rindrod Limited / A
nnual Report 2009

2 pa
geG
rindr
od L
imite
d /
Ann
ual R
epor
t 200
9
G
RINDRO
D
19
10 - 2010years
C e l e b ra t i n g a ce n t u r y o f s h i p p i n g a n d C e l e b ra t i n g a ce n t u r y o f s h i p p i n g a n d f re i g h t l o g i s t i c s exce l l e n cefre i g h t l o g i s t i c s exce l l e n ce
THE YEAR 2010 MARKS GRINDROD’S CENTENARY
One hundred years ago, Captain John Grindrod started Grindrod & Company, a clearing and forwarding agency and marine surveying business. Twelve years later he and Leon Renaud purchased the 150 tonne steamer Frontier as she lay disabled on the Durban breakwater. Refl oated and re-equipped, she began trading to Port St Johns and East London carrying sugar, oil, timber, hides, wool and occasionally livestock. Their company, the SS Frontier Company was the predecessor of the founding company of Unicorn Shipping and the Grindrod group.
Nine years later Renaud, a leading Durban legal counsel, learned through the legal network of an old pilgrim ship, the Halal, which was lying in Aden pending sale by auction. Purchasing her for £9 355 under the name African Coasters (Pty) Limited, he renamed the 430 tonne ship Cecile Mapleson, his wife’s maiden name and with Grindrod & Company as ships agents began trading between Durban and Lourenço Marques (now Maputo).
On the death of Captain John Grindrod in 1930, his son, Walter Grindrod, born in Britain in 1903, took over the management of Grindrod & Company and became a very active protagonist of the coasting industry. An interest that was amplifi ed in 1931 when he became an alternate director on the board of SS Frontier Company.
When Leon Renaud died in 1934, his son Cecil joined the board of SS Frontier Company, rekindling with Walter Grindrod the business partnership their fathers had enjoyed. Within three years they had consolidated the operations of the SS Frontier Company and African Coasters.
The Second World War interrupted their hard work as both men joined the armed forces, but immediately on their return they set about expanding their fl eet, a programme led by Walter Grindrod, who became managing director of African Coasters in 1946.
Steeped in shipping from dinnertable discussions and a family life that revolved around the small vessels trading out of Durban, Murray Grindrod, son of Walter Grindrod, joined Grindrod in 1957. In his job he learnt the trade from the wharf side, becoming involved in the hiring of personnel, stevedoring and general ships husbandry. He also took every opportunity to study the operation of the ships at sea, which gave him a personal grasp of the trade and an affi nity with the people aboard. In 1960, he was appointed alternate director to his father.
Group historyGroup history
2 pa
ge
Grin
drod
Lim
ited
/ A
nnua
l Rep
ort 2
009
Cecile Mapleson

PLOTTING THE COURSE FOR GRINDROD
With the limited volumes of coastal cargoes being spread among three players and African Coasters needing an urgent injection of capital to replace their ageing fl eet, it was Murray Grindrod who persuaded his father and Cecil Renaud to seek fi nance elsewhere. Indeed, it was the team that he led that secured funding from Union Corporation, thus paving the way for the modernisation of the fl eet, the subsequent merger with Smith’s Coasters in 1966 to form Unicorn Shipping Lines and the acquisition of Thesen’s Steamship Company from Safmarine in the same year. The Unicorn brand has since been synonymous with local shipping.
Under Murray Grindrod’s leadership as managing director, Unicorn pioneered a fully cellular container service in 1971.
GRINDROD LISTS ON THE JSE
A personal sense of achievement for Murray Grindrod followed the acquisition of the majority shareholding from Union Corporation’s successor, Gencor in 1986 and then the listing of the group in the same year.
Mike Groves was appointed managing director of the newly listed Grindrod Unicorn group and a number of years later Ivan Clark became the group's chief operating offi cer, a move that culminated in his appointment as managing director in July 1999.
GROWTH STORY
A highlight of 1999 was the successful acquisition of Safmarine’s 40% interest in Unicorn Lines (Pty) Limited (which later changed its name to Unicorn Shipping (Pty) Limited) held by the Restis group of Greece.
The Grindrod Unicorn Group Limited changed its name to Grindrod Limited, incorporating a new brand and logo. Under the dynamic leadership of Ivan Clark and a new executive team together with a general rationalisation of structures, the group acquired several key companies in rapid succession including Island View Shipping. The shipping fl eet was increased at a low point in the market, land-based activities were expanded and trading businesses and the full shareholding in Grindrod Bank were acquired.
Grindrod today lists numerous proud achievements, including being named the top listed shipping company in the world in 2004 and 2005 and as the top listed company in South Africa for 2004 and 2005. In 2009, the group received the accolade as the number one JSE listed company over 10 years.
At the end of 2006 and after nearly 30 years' service, Ivan Clark retired as chief executive offi cer and was appointed deputy chairman and subsequently chairman when Murray Grindrod retired after 21 years as chairman and 50 years with the group. Alan Olivier was appointed Ivan Clark’s successor as chief executive offi cer and has recently had to steer the group through tough economic times.
INVESTING IN THE FUTURE – CHARTING NEW HORIZONS
Grindrod has committed employees, a strong balance sheet, limited debt, good liquidity, a low cost fl eet and diversifi ed freight and logistics operations. The Grindrod group is poised for future growth in all its divisions and looks forward to “Charting New Horizons” with all its stakeholders.
page 3G
rindrod Limited / A
nnual Report 2009
businessoverview commentaries sustainability
annual fi nancialstatements
shareholderinformation
Captain John Edward Grindrod
Pauli and Murray Grindrod at the launching of the fi rst South African
container ship, Berg
Steamer, Frontier (5)

4 pa
geG
rindr
od L
imite
d /
Ann
ual R
epor
t 200
9
Strategic objectives• grow drybulk ship operating business contract base with
reputable counterparties;
• improve product tanker operating capability and expand the bunker tanker business;
• monitor the international shipping market for distressed purchase opportunities both in the liquid and drybulk markets; and
• maintain good forward employment cover through reliable counterparties.
Strategic objectives and profi leStrategic objectives and profi le
CONTRIBUTION TOGROUP REVENUE
2009
CONTRIBUTION TO GROUP REVENUE
2009
CONTRIBUTION TO GROUP INCOME
2009*
CONTRIBUTION TO GROUP INCOME
2009*
SHIPPING
G
RINDRO
D
19
10 - 2010yearsyears
1000R20 335m
19,4%73,4%
G
RINDRO
D
19
10 - 2010yearsyears1000R4 918m
17,8%52,8%
G
RINDRO
D
19
10 - 2010yearsyears
1000R492m
G
RINDRO
D
19
10 - 2010yearsyears
1000R181m
Strategic objectives• source and develop value chain enhancements that
improve the offering to customers;
• expand into new products and markets;
• leverage intra-group synergies with Shipping and Freight Services; and
• focus on containment of costs and maintenance/improvement of margins.
ShippingShipping TradingTrading
* Excludes group cost

page 5G
rindrod Limited / A
nnual Report 2009
CONTRIBUTION TO GROUP REVENUE
2009
CONTRIBUTION TO GROUP REVENUE
2009
CONTRIBUTION TO GROUP INCOME
2009*
CONTRIBUTION TO GROUP INCOME
2009*
G
RINDRO
D
19
10 - 2010yearsyears
1000R136m
3,9%
23,9%
0,5%8,3%
G
RINDRO
D
19
10 - 2010yearsyears
1000 G
RINDRO
D
19
10 - 2010yearsyears
1000R222m R36m
businessoverview commentaries sustainability
annual fi nancialstatements
shareholderinformation
G
RINDRO
D
19
10 - 2010yearsyears1000R2 302m
Strategic objectives• leveraging growth opportunities created by the demand for
regional infrastructural logistics and transport investment;
• expansion and development of new terminal facilities;
• further development of rail service offering; and
• integration of strategic assets and supply chain capabilities.
Strategic objectives• continue the focus on lending in its traditional commercial
and industrial property segment and to balance the advances book with growth in new areas of invoice discounting and trade fi nance;
• with the formation of a specialist asset management division, to grow assets under management in the three core areas of private clients, investment products and institutional funds; and
• increase non-interest revenue through the integration of the expanded corporate fi nance team.
Freight ServicesFreight Services Financial ServicesFinancial Services
* Excludes group cost

6 pa
geG
rindr
od L
imite
d /
Ann
ual R
epor
t 200
9
Directorate –- Directorate –- non-executive directorsnon-executive directors
WALTER DAYSON GEACH (Advocate) (55)
BA LLB; MCom; CA(SA); FCIS
Independent non-executive director
Appointed July 2008
Advocate of the High Court of South Africa. Walter is a senior professor at the Graduate School of Business, University of KwaZulu-Natal. He previously served on the tax committee of the South African Institute of Chartered Accountants KZN and was a technical committee member of the South African Institute of Professional Accountants. He is the author of a number of books including Guide to the Companies Act and Regulations and Guide to the Close Corporations Act and Regulations.
Member of the audit committee.
IVAN ARTHUR JAMES CLARK (66)
CA(SA)
Non-executive chairman
Appointed June 1993
Chairman of Grindrod Bank Limited. Ivan was employed by the group in 1977 and has held various senior fi nancial and executive positions in the Shipping division. He served as group managing director/chief executive offi cer from 1999 to 2006, when he was appointed deputy chairman of the group. Appointed chairman on the retirement of W M Grindrod in 2007.
Member of the remuneration/nomination committee.
MKHUSELI RICHMAN FAKU (43)
BA (Law)
Non-executive director
Appointed December 2009
Group executive chairman and founder of Calulo Investments (Pty) Limited. Calulo has a 15% equity interest in Grindrod (South Africa) (Pty) Limited. Mkhuseli has extensive experience in the South African oil industry and has served on the boards of the South African Petroleum Industry Association, African Minerals and Energy Forum and World Petroleum Congress (South Africa). He is non-executive director of Total South Africa (Pty) Limited, Grindrod (South Africa) (Pty) Limited and director of various Calulo subsidiaries.
HASSEN ADAMS (57)
Pr Tech Eng (Civil Engineering)
Independent non-executive director
Appointed December 2000
Chairman of Grand Parade Investments Limited, SunWest International (Pty) Limited, Table Bay Hotel and GrandWest Casino. Hassen is a consulting engineer and chairman of ASCH Consulting Engineers and Proman Project Managers. He has diversifi ed business interests in engineering, project management, leisure, gaming and property developments.

page 7G
rindrod Limited / A
nnual Report 2009
IAN MICHAEL GROVES (64)
CA(SA)
Independent non-executive director
Appointed August 1986
Non-executive director of Value Group Limited, SA Corporate Real Estate Fund Managers Limited and Grindrod Bank Limited. Managing director of the group from 1986 to 1999. Mike has many years' experience in the shipping industry and in the role of non-executive director of listed companies.
Chairman of the audit committee.
Member of the remuneration/nomination committee.
ROBERT ANTHONY NORTON (70)
BA; MA; FIBSA
Independent non-executive director
Appointed August 1998
Non-executive director of Grindrod Bank Limited. Tony has considerable experience as an executive in commerce and is a past president of the JSE Limited.
Member of the audit committee.
Chairman of the remuneration/nomination committee.
MICHAEL JOHN HANKINSON (60)
CA(SA)
Independent non-executive director
Appointed December 2009
Chairman of the Spar Group Limited and Brandcorp Holdings (Pty) Limited. Non-executive director of Apollo Tyres Limited (Delhi), Transnet Limited, Sovereign Food Investments Limited and Illovo Sugar Limited. Mike is a former chief executive of Dunlop Tyres International (Pty) Limited and Romatex Limited.
SANDILE DONALD MUZIWENKOSI ZUNGU (42)
BSc (Mechanical Engineering); MBA
Independent non-executive director
Appointed December 2009
Chairman of Afl ease Gold Limited and non-executive director of Uranium One Africa Limited. Member of the Presidential Advisory Council on Broad-based Black Economic Empowerment and previous director of Barnard Jacobs Mellett Holdings Limited. Sandile established Zungu Investments Company (Pty) Limited in 2000.
NAMHLA THINA YVONNE SIWENDU (43)
BSocSC (Hons); LLB
Independent non-executive director
Appointed May 2008
Director and non-executive director of various companies. Thina was recently appointed to Woolworths Holdings Limited. She specialises in Corporate Governance Law and Regulation and is an attorney of the High Court of South Africa.
Resigned January 2010.
businessoverview commentaries sustainability
annual fi nancialstatements
shareholderinformation

Directorate –- Directorate –- executive directorsexecutive directors
JOHN GIFFORD JONES (59)
Executive director – Agencies
Appointed October 2002
Director of various subsidiary companies. John was employed in the group in 1969 and achieved 40 years' service in the past year. He has considerable experience in freight and ships agency businesses.
DAVID ANTHONY RENNIE (Captain) (49)
Executive director – Freight Services
Appointed October 2002
Director of major local subsidiaries, chairman of the Container Liner Operators Forum and co-chairman of the South African Container Terminals Advisory Board. Dave was previously managing director and is now a non-executive director of Ocean Africa Container Lines (Pty) Limited. He was employed in 1978 and has diverse seafaring and seafreight logistics experience.
ANTHONY FRASER STEWART (45)
CA(SA)
Financial director
Appointed August 2003
Director of major local and international subsidiary companies within the group. Tony was employed in 2000 and held various fi nancial management positions prior to his appointment as group fi nancial director.
ALAN KEITH OLIVIER (49)
CA(SA)
Chief executive offi cer
Appointed May 1999
Alan was employed in 1986 in the Shipping division and has held senior treasury and fi nancial positions as well as chief executive of Unicorn Shipping. Director of local and international subsidiary companies, including Grindrod Bank Limited. Deputy chairman of The United Kingdom Mutual Steamship Assurance Association (Bermuda) Limited.
8 pa
ge
Grin
drod
Lim
ited
/ A
nnua
l Rep
ort 2
009

page 9G
rindrod Limited / A
nnual Report 2009
businessoverview commentaries sustainability
annual fi nancialstatements
shareholderinformation
DAVID ANDREW POLKINGHORNE (45)
BCom; MA (Oxon)
Executive director – Financial Services
Appointed November 2006
Managing director of Grindrod Bank Limited and executive director of all Financial Services companies. David has extensive corporate and investment banking experience.
LAURENCE ROLAND STUART-HILL (46)
CA(SA)
Executive director – Shipping (Tankers)
Appointed May 1999
Director of major local and international subsidiary companies within the group. Director of Marine Shipping Mutual Insurance Company Limited (MSMI). Laurence was employed as treasury manager by Unicorn Lines in 1993 and promoted to fi nancial manager of Unicorn Tankers in 1996 and fi nancial director of Grindrod Limited in 1999. He headed up the group’s Freight Services division from 2002 to 2006 when he took responsibility of Unicorn Shipping.
JAMES BRENDAN McILMURRAY (66)
LLB (University of London)
Chief executive offi cer – Trading
Appointed 2008 to executive committee
Brendan has ten years' marketing experience in the mining industry with Union Corporation, Impala Platinum and Anglovaal and 30 years' experience in the trading industry. Brendan is the founding member and director of the Oreport group.
Member of the executive committee.
Brendan is not a director of Grindrod Limited.
TIMOTHY JOHN THEO McCLURE (Captain) (59)
DipM Law
Executive director – Shipping (Drybulk)
Appointed October 2002
Director of major local and international subsidiaries. Non-executive director of United Kingdom Freight Demurrage and Defence Association Limited. Tim is president of the South African branch of the Institute of Chartered Shipbrokers.

pag
e 10
Grin
drod
Lim
ited
/ A
nnua
l Rep
ort 2
009
10 p
age
Grin
drod
Lim
ited
/ A
nnua
l Rep
ort 2
009

page 11G
rindrod Limited / A
nnual Report 2009
businessoverview sustainability
annual fi nancialstatements
shareholderinformation

Chairman’s reportChairman’s report
Dear shareholder,
INTRODUCTION
I am privileged to be writing this chairman’s report in the year in which Grindrod celebrates its centenary. It was in 1910 that Captain John Edward Grindrod started the shipping and forwarding agents business, Grindrod & Company. The past 100 years have been a remarkable journey and we can marvel at the many achievements of the group as it is today.
As I highlighted in my last report, 2009 has turned out to be a most challenging year for Grindrod. Against the background of global economic turmoil and the intensifying recession, the accompanying massive decline in shipping rates severely impacted our business.
The contrast between 2008 and 2009 could not be starker. 2008 was a year of super profi ts at the height of a world shipping boom, whereas 2009 profi ts were achieved against a year of major economic collapse and uncertainty, particularly evident in the shipping and freight services industry in which we operate. This resulted in earnings falling 60% from R2,1 billion to R873 million for the year to 31 December 2009.
Clearly, the momentum of the company’s exceptional compound growth of 52% over the fi rst decade of the 21st century could not be sustained as the changed global environment drastically altered our business fundamentals. The protection of wealth and cash became a priority. Management immediately set about reviewing the group's strategy and implementing plans and it is pleasing to report that their quick and appropriate response to the challenges have gone a long way to protecting the group's assets and in particular its cash resources.
BALANCE SHEET
Cash is king in the current market and Grindrod made sure at the early signs of the crisis that it would be fi nancially secure to weather the storm. Critics could point to our unleveraged balance sheet, claiming it to be conservative, but this has held us in good stead. In uncertain economic times this is a preferable position to be in than that of high levels of gearing, which some global companies have had diffi culty in servicing. The board considered it more prudent to be debt free and able to protect Grindrod’s asset base, built up over many years, rather than pursuing an aggressive acquisition strategy at this time.
This approach also enabled management to remain focused on expediting its current business plan without diverting attention to introducing new operations into existing businesses in diffi cult times.
This strength differentiates Grindrod from its peers in an industry characterised by highly distressed shipping companies, many of whom posted substantial losses and some were required to raise capital and/or reschedule debt merely to stay in business.12
pag
e G
rindr
od L
imite
d /
Ann
ual R
epor
t 200
9

page 13G
rindrod Limited / A
nnual Report 2009
businessoverview commentaries sustainability
annual fi nancialstatements
shareholderinformation
OPERATING PERFORMANCEIn addition to cash and asset protection, the group was able to deliver an attributable profi t to ordinary shareholders of R873 million.
This was achieved mainly through following a conservative policy of increasing contract cover in the Shipping division. The diversifi cation strategy, pursued over the last ten years, clearly cushioned us from the severest impacts of the recession. This strategy has reaped rewards with land-based businesses, agencies, trading and banking operations, contributing nearly 50% of the 2009 earnings.
A fi nal dividend of 30 cents (interim 30 cents) per ordinary share has been declared which reduces dividend cover to 3,2 times from the previous policy of 3,5 times.
CORPORATE GOVERNANCEThe board welcomes the publication of new corporate governance compliance requirements in South Africa. The company has made solid progress in aligning itself with the requirements of the revised Code and Report on Governance for South Africa (King III), effective from 1 March 2010 and with the new Companies Act, expected to come into effect later this year.
SUSTAINABILITYIn terms of fi nancial sustainability the company was awarded top spot in the 2009 Top 100 Companies awards for best performance over ten years, achieving a 52% compound growth since 1999.
As I mentioned last year, the company remains committed to open and transparent dialogue with stakeholders in line with World’s Best Practice. We report our progress in terms of the G3 Guidelines of the Global Reporting Initiative (GRI) on page 104. During the 2009 annual review of the Johannesburg Stock Exchange (JSE's) Socially Responsible Investment (SRI) Index, Grindrod was initially recommended for exclusion. Pursuant to this, the JSE, in consultation with the data provider and the SRI Index Advisory Committee and in accordance with the SRI Index ground rules, reviewed the information in relation to the company and found suffi cient evidence regarding the company's progress on environmental management issues. Grindrod will therefore be reinserted into the SRI Index from late March 2010 on the basis of having made signifi cant year-on-year improvement in its environmental practices.
DIRECTORATETowards the end of last year we welcomed three additional non-executive appointments to the board. They are Messrs Mkhuseli Faku, Michael Hankinson and Sandile Zungu.
I am pleased with the wide fi elds of expertise and experience each of these new members brings to the board. I look forward to their, and indeed, every member’s constructive participation in the year ahead.
Ms Thina Siwendu resigned in January 2010 and I thank her for the contribution she made to the board.
The Grindrod board is now compliant with King III principles in terms of board structure. It comprises a majority of non-executive directors, the majority of whom are independent. The full board of directors is set out on pages 6 to 9 of this report.
LOOKING FORWARDThe board considered the downturn in global markets as an appropriate time for Grindrod to enter a consolidation and rationalisation phase. The group remains in excellent shape. When opportunities return, the group will be well positioned to consider them. The cautious approach to growth through acquisition and/or development of the existing asset base will continue for the time being.
Over recent months shipping markets have improved, but their future direction remains uncertain and the world economic recovery still has some distance to go.
IN CLOSINGAs we celebrate Grindrod’s 100th birthday we can be justifi ably proud to be associated with a group that has succeeded for so long and which has such promising prospects for the future. Grindrod has fi nancial security, good assets and products and fi rst class people who know the business. The group is steeped in tradition and bases its conduct on high ethical and moral standards. Grindrod has an excellent reputation refl ected in its profi le in world markets.
APPRECIATIONI extend my gratitude to my fellow directors for their diligent service. I thank the chief executive, Alan Olivier and the Grindrod team of employees for their outstanding efforts and hard work in a very diffi cult year. I look forward to their continued support and contributions into the future.
I A J ClarkChairman
Durban17 February 2010
page 13G
rindrod Limited / A
nnual Report 2009

Chief executive officer’s reportChief executive officer’s report
INTRODUCTIONThe group's 2009 results were recorded against the backdrop of a major global recession characterised by volatility and uncertainty in fi nancial, commodity and shipping markets, low trade volumes and increased credit and counterparty risk. These events signalled an end to an extended period of extraordinarily strong drybulk shipping markets with extremely weak markets in the fi rst half of the year. These markets did, however, improve from a low base in the second half of the year, mainly due to strong commodity demand from China.
In reaction to market conditions, Grindrod prepared for a diffi cult year, focusing efforts on key operational areas by:
• protecting the balance sheet through maintaining high levels of contract cover, managing counterparty risk and selectively selling ships to lock in value;
• reducing costs and improving effi ciencies to support the earnings base; and
• protecting customer relationships.
These actions, combined with a decision not to materially expand the shipping fl eet at the top of the market, positioned Grindrod well in the face of a world economic recession.
Furthermore, the overall strategy to diversify the group from shipping to a broader-based freight and logistics business supported group earnings during the year.
DIVISIONAL OVERVIEWThe poor economic climate impacted on all divisions in the group, particularly Shipping. After a very weak start to the year, drybulk shipping markets were stronger than initially anticipated through better than expected commodity demand driven mainly by Chinese infrastructural development as well as delays in the delivery of new ships. Tanker markets were weaker than anticipated due to a reduction in the consumption of petroleum products in the western economies as a result of the recession, together with a large fl eet growth.
South African commodity fl ows were impacted by an initial reduction in demand but more signifi cantly by the effect of the stronger Rand/US Dollar exchange rate, which made it diffi cult for exports in mining and manufacturing to compete. The recent signs of economic recovery
as refl ected in commodity prices has, however, improved this position with substantial demand for South African commodities, in particular, coal and iron ore, being experienced in the current year.
The decline in South African consumer demand resulted in lower container and consumer product volumes. This had a material impact on the group’s logistics businesses.
Shipping earnings declined by 74% from R1 862 million to R492 million on the back of the fall in shipping rates, the world economic collapse and lower profi ts from ship sales. The division was impacted by foreign exchange losses 14
pag
e G
rindr
od L
imite
d /
Ann
ual R
epor
t 200
9

due to a strong closing Rand/US Dollar exchange rate compared to a large gain in the prior year.
The Trading division’s earnings grew from R132 million to R181 million in 2009, increasing 37% due to improved volumes, better operating margins and reduced funding costs.
In spite of tough trading conditions, particularly in the logistics operations, Freight Services grew earnings by 17%, reporting profi ts of R222 million compared to R189 million in the previous year. A strong performance
was achieved by Ports and Terminals with Seafreight, Intermodal and Agencies also contributing positively to the division's result.
Financial Services grew earnings by 3% from R35 million to R36 million in a challenging environment with commendable performances across key portfolios and improved fee income.
As previously reported, the majority of the Freight Services’ South African-based businesses, operating through the subsidiary company Grindrod (South Africa) (Pty) Limited,
businessoverview commentaries sustainability
annual fi nancialstatements
shareholderinformation
page 15G
rindrod Limited / A
nnual Report 2009
page 15G
rindrod Limited / A
nnual Report 2009

16 p
age
Grin
drod
Lim
ited
/ A
nnua
l Rep
ort 2
009
Chief executive officer’s report Chief executive officer’s report (continued)(continued)
achieved black empowerment status in the fi rst quarter of 2009. The fi nalisation of the transaction, combined with other black economic empowerment (BEE) initiatives, resulted in Grindrod (South Africa) (Pty) Limited achieving a level 3 BEE rating.
Detailed reviews of segmental activities and performances are set out in the reviews on pages 28 to 55.
GROUP STRATEGYOver the past 18 months, considerable attention has been given to preserving the group’s balance sheet, which positions the group to take advantage of acquisition opportunities. No signifi cant opportunities became apparent during 2009. Projects to expand capacity in Ports and Terminals will continue, while strategic opportunities to complement the business model will be explored.
It remains a longer-term goal of the group to diversify its operations through investing in Trading, Freight Services and Financial Services. This objective has been substantially achieved with these businesses contributing close to 50% of group profi ts.
Each division has its own balance sheet and has been allocated equity to fund expansion. The group has committed capital expenditure of R2,3 billion over the next three years with a further R2,7 billion budgeted.
The group has a highly fl exible approach to capital allocation and has the ability to redeploy capital into the divisions or to projects offering the best prospects and returns to shareholders. In the event the group undertakes major projects outside its balance sheet capability, consideration may be given to raising additional capital.
MARKET OUTLOOK The drybulk shipping market experienced all-time low freight rates at the beginning of 2009. This was followed by an upward correction towards mid-year. The company’s primary market, the smaller handysize vessels, was far more stable as rates generally improved steadily throughout the year from this low base.
The outlook for the drybulk market for 2010 remains uncertain due to the industry’s large order book, particularly in the capesize sector, a signifi cant portion of which is, however, not expected to deliver. The strong demand for commodities in India and China is expected to continue to grow during 2010.
The tanker freight rates should be supported by increasing demand for oil particularly as a result of anticipated
growth in Eastern developing markets over the medium to longer term.
The South African economy stands to benefi t from improved commodity demand especially if the Rand/US Dollar exchange rate does not strengthen signifi cantly. This in turn should lead to an improved consumer demand, which is already refl ected in a recovery of the container freight market. Further growth is likely as the local economy recovers from the effects of the recession.
GROUP PROSPECTSThe global and local economies are in the process of recovering from the severe recession which was at its worst in the fi rst half of 2009. Improving economic activity, mainly driven by growth in China and India, has led to increasing commodity demand, generally higher commodity prices and a substantial rise in trade volumes. It is anticipated that all divisions will benefi t from the improving upward cycle.
There is some concern that the large number of new drybulk ships due for delivery in the short term could adversely affect the drybulk shipping market and consequently may negatively impact the results of the Shipping division, despite the benefi t of improving demand for commodities.
The outlook for Freight Services is positive, with the business expected to benefi t from increased volumes handled at the recently expanded drybulk terminals. Trading and Financial Services should maintain their current performances.
The group results are extremely sensitive to the Rand/US Dollar exchange rate and continued strength of the local currency will impact negatively on earnings. The converse will obviously apply if the currency weakens.
In spite of the uncertainties above, the group could benefi t from well timed use of its balance sheet to expand operations. Management expects to achieve acceptable returns on shareholders' funds for 2010.
SUSTAINABLE DEVELOPMENTIn accordance with our commitment to responsible corporate citizenship, the environment, climate change and the measurement of related aspects, including carbon emissions, have received increased focus during the year.
Grindrod continues to adapt and refi ne its reporting systems for sustainability data and is presently allocating additional resources to managing and improving performance against sustainable development objectives.

page 17G
rindrod Limited / A
nnual Report 2009
businessoverview commentaries sustainability
annual fi nancialstatements
shareholderinformation
Grindrod acknowledges that its various operations impact or potentially impact upon the environment in which they operate. It is the company’s policy to conserve natural resources, maximise eco-effi ciency, reduce waste and climate change impacts and prevent pollution throughout its operations.
MANAGEMENT AND EMPLOYEES
It is with regret that Tim McClure will be retiring in July 2010. Tim joined us when Island View Shipping was acquired in 1999 and has since made an invaluable contribution to the group’s performance. His position as chief executive offi cer of Drybulk Shipping will be fi lled by Martyn Wade who has
32 years' shipping experience. There have been no other changes to the group executive.
I look forward to the continued commitment of the group executive and would like to thank them and all employees for their contributions and hard work during a diffi cult year. I would also like to thank the chairman, Ivan Clark and the non-executive directors of the board for their support over the past year.
A K OlivierChief executive offi cer
Durban17 February 2010

18 p
age
Grin
drod
Lim
ited
/ A
nnua
l Rep
ort 2
009
Financial director’s reportFinancial director’s report
INTRODUCTION
Group revenue at R27,7 billion was 18% lower than the prior year due to
lower shipping charter rates and commodity prices during 2009. Although the
non-shipping operations reported improved profi tability, the effect of the lower
shipping revenue against a relatively fi xed-cost base reduced earnings before
interest, tax, depreciation and amortisation (EBITDA) to R1,4 billion from the
R3,0 billion reported in the previous year.
Higher depreciation and amortisation charges in 2009, as a result of capital
expenditure during 2008 and 2009, further negatively impacted profi tability
with operating income reducing to R1,1 billion, a 59% decline from 2008.
Operating margins, excluding the trading business, were 12,2% compared to
27,8% in the previous year.
The large non-trading item in the prior year relates mostly to impairments
of ships and the recognition of intangible assets. Net interest costs were
substantially lower due to the interest rates and borrowings being at lower
levels during the year. The strategy of holding US Dollar cash resources while
incurring high Rand funding costs, did, however, contribute to the group's
interest costs.
The group’s average tax rate increased from 9,7% to 16,5%, mainly due to
the larger earnings contribution from non-shipping businesses.
There has been a signifi cant change in earnings contribution from the Shipping
division, which has only contributed 56% of the group's earnings compared
to 86% in 2008.
A detailed review of segmental performance is set out in the reviews on
pages 28 to 55.
Dividend cover has been reduced from the historically applied 3,5 times to
3,2 times. This does not necessarily indicate a permanent shift in policy but it
is intended that this will be reviewed at each reporting period.
Group equity has decreased from R6,8 billion to R5,8 billion in 2009 mainly
due to the effect of the stronger Rand/US Dollar exchange rate but also due
to movements in the group’s hedging reserves. The exchange rate has had a
material impact on the group’s balance sheet.
Actions taken during the fi nancial crisis has ensured an extremely strong
fi nancial position with gearing at only 4% and strong liquidity. It is pleasing to note
that the market value of the group’s owned and chartered fl eet is R800 million
greater than book value (2008: R1 832 million). The decrease in comparison
to 2008 is due mainly to the lower value of the group’s tanker fl eet and
exchange rate.

page 19G
rindrod Limited / A
nnual Report 2009
businessoverview commentaries sustainability
annual fi nancialstatements
shareholderinformation
ORDINARY DIVIDEND/DISTRIBUTION PER SHARE (cents)
00 01 02 03 04 05 06 07 08 09
H1 H2
150
120
90
60
30
0
Total
Shipping
Trading
FreightS
ervices
FinancialS
ervices
Group
costs
2009 ATTRIBUTABLE INCOME BY DIVISION
R million
1 000
800
600
400
200
0
2008 ATTRIBUTABLE INCOME BY DIVISION
Total
Shipping
Trading
FreightS
ervices
FinancialS
ervices
Group
costs
R million
2 500
2 000
1 500
1 000
500
0
RETURN ON ORDINARY SHAREHOLDERS’ FUNDS (%)
Return on ordinary shareholders' funds
15% minimum benchmark
75,7 74,6
15,9
00 01 02 03 04 05 06 07 08 09
NET DEBT TO EBITDA (times)
00 01 02 03 04 05 06 07 08 09
2,7
1,0
2,1
1,1
0,7 0,60,4
0,6
(0,1)
0,2
Net debt to EBITDA 3 times minimum benchmark
R million
7 0006 0005 0004 0003 0002 0001 000
0(1 000)
105,5
(4,8)4,4
EQUITY/NET DEBT AND GEARING (%)
00 01 02 03 04 05 06 07 08 09
Equity Net (cash)/debt
(4(4 8)8)
53,3
33,0

20 p
age
Grin
drod
Lim
ited
/ A
nnua
l Rep
ort 2
009
Financial director’s report Financial director’s report (continued)(continued)
The allocation of equity to the group’s segments is represented below.
A detailed review of funding positions and returns are included in the segmental reviews.
As the group is made up of a number of independently operated segments, it is believed that analysts and investors should assess each of these separately and in particular, they should be compared to suitable peers in the relevant sectors, both locally and internationally. Although the operations are independent, the group is not managed as a conglomerate as there is a high level of integration between the various businesses. Consequently it is believed that there are substantial synergies that can be realised and the range of services provided allows for the diversifi cation of risk and maximising of shareholder returns. The group has included additional detailed information in the segmental reviews to enable analysts and investors to compile fair valuation assessments.
CAPITAL EXPENDITURE AND COMMITMENTSA summary of the group’s 2009 capital expenditure and commitments is set out below:
Capital expenditure2009
Rm2010
Rm2011
Rm2012
Rm
Totalcommitments
Rm
Shipping 827 858 635 85 1 578Trading 228 26 – – 26Freight Services 345 612 68 – 680Financial Services 5 – – – –Group 3 8 6 1 15
1 408 1 504 709 86 2 299
The group has suffi cient cash reserves, cash generated from operations and committed bank fi nancing facilities to fund approved capital expenditure.
During 2009, once some stability had returned to the fi nancial markets, the group reviewed its weighted average cost of capital (WACC) calculation and project hurdle rates to ensure they refl ected current market conditions and the market outlook.
The group has moved away from different benchmarks for each of its divisions and now has a single benchmark for low, medium and high risk projects. This will help ensure that capital is applied to the divisions where it will give the best returns on investment. Management continues to monitor the performance of the various divisions and will consider reallocating equity in order to maximise shareholders' returns.
The group’s maximum net debt/equity ratio benchmark is 100%, but a level of 75% is considered optimal and will be targeted. A further, secondary restriction in terms of a maximum net debt/EBITDA multiple of 3 times with an optimal level of 2,5 times will also be applied. The calculation of WACC is set out on page 21:
DIVISIONAL EQUITY (%)2009 2008
ShippingTrading
Freight ServicesFinancial Services
50
5
33
12
G
RINDRO
D
19
10 - 2010years
100
66
4
18
12
G
RINDRO
D
19
10 - 2010years
100

Cost of equity/required rate of return 15,0%Long-term cost of borrowings (5-year JIBAR + 200 bps) 10,7% After tax 7,4%WACC based on 75% debt/equity 12,0%
WACC HURDLE RATES BASED ON VARIOUS SCENARIOS
High risk
projects
Medium risk
projects
Low risk
projectsZAR 15% 12% 9%USD/EUR 10% 8% 6%Implied USD/EUR return on equity 15% 11% 8%
These benchmarks will be regularly reviewed and amended as market conditions change.
BORROWINGS, CASH FLOW AND LIQUIDITYCash generated from operations was R918 million compared to R3 353 million in 2008. Cash outfl ows included capital expenditure of R1 408 million and dividends of R540 million during the year. This resulted in a net cash position of R325 million at 31 December 2008 becoming a net debt position of R258 million at 31 December 2009 and a net debt/equity ratio of 4%. Net interest costs at R91 million, although decreasing by 48% from R175 million, remain material due to low interest earned on the substantial US Dollar cash resources while interest costs were incurred on Rand debt.
Detailed liquidity forecasts are regularly prepared which take into account the group’s capital commitments, available facilities and cash resources and have been “stressed” to assess the outcome of a worst-case scenario which still indicates a strong liquidity position over the medium-term. Management is continually seeking opportunities to further strengthen the position.
FOREIGN CURRENCY EXPOSURESAt 31 December 2009, the group had a net open US Dollar position of US$55 million which, when revalued, impacts on group earnings. This is in line with the current approved group policy of maintaining US Dollar income statement exposure between US$30 million and US$80 million. In addition, a further exposure of US$629 million relating to the group’s net asset value of US Dollar assets affects the balance sheet. Based on revalued asset values, the total exposure equates to US$737 million.
The group also has substantial exposure to the US Dollar through its US Dollar operating cash fl ows. In 2009, this amounted to R130 million which was converted at the average Rand/US Dollar exchange rate. It is not the group’s policy to hedge US Dollar operating cash fl ows generated by US Dollar-denominated businesses.
US Dollar fl ows in the Rand-denominated businesses are hedged but are still exposed to a certain amount of foreign currency risk as they are only able to be hedged once committed.
The Rand/US Dollar exchange rate signifi cantly impacts on the group’s results as illustrated below.
Effect of Rand/US Dollar exchange rate on 2009 earnings
Opening vs closing rate R50 million per R1/US$Average rate R130 million per R1/US$
Foreign currency exposure arising on Yen-denominated shipping capital commitments as at 31 December 2009 is JPY5,36 billion (US$58 million).
INTEREST RATE EXPOSURESAt 31 December 2009, 60% of the group’s Rand interest rate exposure was hedged at advantageous levels. This is in line with the approved group interest cover policy of 30% to 70% group Rand debt cover over two years. It is the policy of the group to maintain adequate cover on Rand debt to ensure that exposure to fl uctuating interest rates is minimised. The position is monitored closely by management.
page 21G
rindrod Limited / A
nnual Report 2009
businessoverview commentaries sustainability
annual fi nancialstatements
shareholderinformation
NET DEBT ANALYSIS
2009
Forex/other
Capital
expenditure
Interest/dividends/ taxation
Working
capital m
ovements
Net proceeds
on disposal of ships
Cash
generated from
operations
2008
325
1 131
756 (213)(792)
(1 408)
(57) (258)
Infl ows Outfl ows

22 p
age
Grin
drod
Lim
ited
/ A
nnua
l Rep
ort 2
009
Financial director’s report Financial director’s report (continued)(continued)
Due to the minimal US Dollar debt in the group, management has not considered hedging US Dollar interest rates in the short term. This position will be reviewed should the group increase US Dollar debt in the longer term.
RISK MANAGEMENTThe risks identifi ed as signifi cant to the group and the management of these risks are dealt with in the risk report on pages 74 to 77.
FINANCIAL CONTROLS AND SYSTEMSThe internal control systems are designed to provide reasonable assurance against material losses and misstatement of fi nancial results and are intended to manage all signifi cant risks. The safeguarding and prevention of misuse of assets is another important aspect of internal control.
Principle features of the group’s internal fi nancial controls are:
• an organisational structure comprising clearly defi ned reporting lines, responsibilities and levels of authority;
• policies, procedures and guidelines to ensure that best practice standards are achieved;
• a system of fi nancial planning, budgeting and reporting which enables performance to be monitored against predetermined objectives;
• an operating structure which requires that borrowings and other fi nancial facilities are approved in terms of a mandate by the board and that these remain within predetermined ratios;
• the review and approval of business plans and budgets by the board; and
• continuous updates of risk models that determine the fi nancial impact of capital expenditure and long-term charter of ships against predetermined board approval benchmarks in respect of gearing ratios and worst-case profi t scenarios.
INFORMATION TECHNOLOGYThe group continues to invest in information technology systems to extract effi ciencies and improve the value of information through the consolidation of systems and architecture. Major projects undertaken during the year include:
• consolidation of the old standalone software application servers (processing units) in a large virtual processor, effectively placing all software applications onto a single large computer and running management software that will dynamically allocate shared hardware resources to the application that needs the most at peak times, eliminating the previous need to ensure that each individual server had enough capacity to handle infrequent processing peaks;
• the Shipping division consolidated all global operations onto SAP (integrated accounting systems) and IMOS, which is a tailored package specifi cally designed for shipping operators, allowing the business to manage both ships (voyage planning and control), cargo booking and delivery execution; and
• Freight Services fi nalised its information technology strategy aimed at the consolidation of systems and implementing SAP fi nancial reporting systems across the division’s operating model.
ACCOUNTING POLICIESThe annual fi nancial statements comply with International Financial Reporting Standards as well as with Schedule 4 of the South African Companies Act and the disclosure requirements of the JSE Limited Listings Requirements.
The accounting policies are consistent with those applied in the fi nancial statements for the year ended 31 December 2008, except for the revised IAS 1 Presentation of Financial Statements and IFRS 8 Operating Segments, which were adopted in the current year. The cash fl ow for 2008 has been restated due to a reallocation in relation to IAS 7 Cash Flow Statements. The adoption of these new standards has resulted in certain disclosure reclassifi cations, but has not resulted in any changes in accounting policy.
CRITICAL JUDGEMENTS IN APPLYING THE GROUP’S ACCOUNTING POLICIES/KEY SOURCES OF ESTIMATION UNCERTAINTIESThese are dealt with in detail in the accounting policies section on page 112.
INTERNAL AUDIT APPROACHThe internal audit approach has been dealt with in the corporate governance report on page 59.
POST BALANCE SHEET EVENTSNo material changes have taken place in the affairs of the group subsequent to year-end, other than those reported in the chief executive offi cer’s report.
GROUP FINANCIAL REVIEWThe ten-year review of the group’s fi nancial position is set out on pages 23 to 27.
A F StewartFinancial director
Durban17 February 2010

page 23businessoverview commentaries sustainability
annual fi nancialstatements
shareholderinformation
Group financial reviewGroup financial review
TOTAL ASSETS (Rm)
00 01 02 03 04 05 06 07 08 09
1 6031 909 2 094
2 645
4 978
7 270
9 928
13 98412 631
1 904
Grindrod Lim
ited / Annual R
eport 2009
CASH AVAILABLE FROM OPERATIONS (Rm)
00 01 02 03 04 05 06 07 08 09
126 258 28 151568
1 239
654
1 904
4 076
400
RETURN ON NET ASSETS (%)
00 01 02 03 04 05 06 07 08 09
14,7
19,9
37,7 37,1
28,426,8
35,9
13,8
Return on net assets (%) 12% minimum benchmark
OPERATING MARGIN (%) (excluding Trading)
00 01 02 03 04 05 06 07 08 09
8,6 8,19,6
14,5
20,2
24,225,9
21,8
27,8
12,2
ATTRIBUTABLE INCOME (Rm)
00 01 02 03 04 05 06 07 08 09
74 127 165 240
546
8511 008
1 195
2 158
873
SHAREHOLDERS' FUNDS (Rm)
00 01 02 03 04 05 06 07 08 09
535 720 521 609 834
1 937
2 8253 378
6 713
5 738
TRADING PROFIT (EBITDA) (Rm)
00 01 02 03 04 05 06 07 08 09
212 206 268 335
678
1 0471 279
1 583
3 026
1 435
REVENUE (Rm)
00 01 02 03 04 05 06 07 08 09
1 449 1 762 2 139 1 927 2 974
7 449
12 507
17 947
33 737
27 692

24 p
age
Grin
drod
Lim
ited
/ A
nnua
l Rep
ort 2
009
Group financial review Group financial review (continued)(continued)
2009Rm
2008Rm
2007Rm
2006Rm
2005Rm
2004Rm
2003Rm
2002Rm
2001Rm
2000Rm
STATEMENT OF FINANCIAL POSITIONShips, property, terminals, vehicles and equipment 3 923 4 541 3 047 2 337 2 069 1 536 961 1 093 1 047 1 076Intangible assets 831 713 521 351 251 50 37 16 15 10Investments 367 367 307 337 178 201 265 310 271 173Loans and advances to bank customers 1 483 1 050 966 506 – – – – – – Liquid assets and short-term negotiables 104 139 229 174 – – – – – – Financial assets 102 141 92 21 1 – 50 – – – Recoverables on cancelled ships 239 – – – – – – – – – Deferred taxation 159 159 138 70 69 37 7 – – – Current assets 5 423 6 874 4 628 3 474 2 410 822 773 485 576 344
Total assets 12 631 13 984 9 928 7 270 4 978 2 645 2 094 1 904 1 909 1 603
Share capital, premium and equity reserve 49 13 199 515 498 8 84 81 120 174Reserves and accumulated profi t 5 689 6 700 3 179 2 310 1 439 826 525 440 600 361
Shareholders’ funds 5 738 6 713 3 378 2 825 1 937 834 609 521 720 535
Minority interest 98 62 61 (2) 7 8 7 3 2 –
Total equity 5 836 6 775 3 439 2 823 1 944 842 616 524 722 535Deferred taxation 22 19 33 24 20 4 2 12 – 20Interest-bearing loans 2 246 1 964 2 306 1 829 1 534 974 856 959 684 778Financial liabilities 181 37 49 12 83 50 76 – – – Other liabilities 4 346 5 189 4 101 2 582 1 397 775 543 409 503 270
Total funding 12 631 13 984 9 928 7 270 4 978 2 645 2 094 1 904 1 909 1 603
Net current assets/(liabilities) 1 691 2 491 679 453 301 (211) 9 (265) (70) (112)

page 25G
rindrod Limited / A
nnual Report 2009
businessoverview commentaries sustainability
annual fi nancialstatements
shareholderinformation
2009Rm
2008Rm
2007Rm
2006Rm
2005Rm
2004Rm
2003Rm
2002Rm
2001Rm
2000Rm
GROUP INCOME STATEMENTRevenue 27 692 33 737 17 947 12 507 7 449 2 974 1 927 2 139 1 762 1 449
Trading profi t 1 435 3 026 1 583 1 279 1 047 678 335 268 206 212Depreciation (292) (241) (218) (154) (122) (76) (55) (62) (65) (89)
Operating profi t before net interest and taxation 1 143 2 785 1 365 1 125 925 602 280 206 141 123Non-trading items 14 (164) 4 (39) 3 2 – (3) (2) 3Net interest paid (91) (175) (131) (71) (87) (62) (67) (37) (41) (62)
Profi t before share of associates' profi t 1 066 2 446 1 238 1 015 841 542 213 166 98 64Share of associate companies' profi t before taxation 76 66 63 128 89 53 32 19 16 10
Profi t before taxation 1 142 2 512 1 301 1 143 930 595 245 185 114 74Taxation (188) (243) (17) (76) (65) (48) (5) (19) 13 –
Profi t after taxation 954 2 269 1 285 1 067 865 547 240 166 127 74Minority interest (12) (20) (13) 5 1 (1) – (1) – –
Profi t for the year before preference dividends 942 2 249 1 272 1 072 866 546 240 165 127 74Preference dividends (69) (91) (77) (64) (15) – – – – –
Profi t attributable to ordinary shareholders 873 2 158 1 195 1 008 851 546 240 165 127 74Ordinary shareholders’ interest in non-trading items (16) 164 (4) (2) (2) 1 – 3 2 –
Headline earnings 857 2 321 1 191 1 006 849 547 240 168 129 74
GROUP CASH FLOWCash available from operations 400 4 076 1 904 654 1 239 568 151 28 258 126Dividends/distribution paid (461) (604) (331) (104) (201) (61) (30) (28) (25) (6)
Cash retained from operations (61) 3 472 1 573 550 1 038 507 121 – 233 120Proceeds on disposal of ships, property, terminals, vehicles and equipment, investments and other items 51 341 73 669 16 121 481 77 287 38
Cash available for investment (10) 3 813 1 646 1 219 1 054 628 602 77 520 158Cash invested (587) (2 175) (1 828) (1 084) (1 704) (581) (348) (237) (93) (62)
Net fi nance (raised)/repaid (597) 1 638 (182) 135 (650) 47 254 (160) 427 96

26 p
age
Grin
drod
Lim
ited
/ A
nnua
l Rep
ort 2
009
Group financial review Group financial review (continued)(continued)
Objectives 2009 2008 2007 2006 2005 2004
ORDINARY SHARE PERFORMANCENumber of ordinary shares in issue net of treasury shares (000’s)
454 203 450 252 455 459 449 179 461 626 454 610
Weighted average number of ordinary shares on which earnings per share are based (000’s)
452 278 453 640 452 934 455 719 458 490 450 220
Earnings per share (cents) 193 475,7 263,9 221,2 185,7 121,3
Headline earnings per share (cents) 189,6 511,7 263,1 220,8 185,3 121,4
Price/earnings ratio (times) 9,2 3,2 8,9 11,7 7,0 6,5
EV/EBITDA (times) 5,6 2,9 3,6 3,6 3,3 2,7
Dividend/distribution per share (cents) 60 136 78 66 52 35
Dividend/distribution cover (times) 3,2 3,5 3,4 3,4 3,5 3,4
Dividend yield (%) 3,4 8,9 3,3 2,6 4,0 4,4
EBITDA per share (cents) 317,3 665,4 349,7 280,7 228,4 150,6
EBITDA dividend/distribution cover (times) 5,3 4,9 4,5 4,3 4,4 4,3
Net worth per share at book value (cents) 1 122 1 340 590 461 314 183
PROFITABILITYOperating margin (%) 4,1 8,3 8,0 9,0 12,4 20,2
Operating margin excluding bulk product trading (%)
12,2 27,8 21,8 25,9 24,2 20,2
Return on net assets (%) 12minimum
13,8 35,9 26,8 28,4 37,1 37,7
Return on ordinary shareholders’ funds (%)
15minimum
15,9 50,2 50,8 57,2 74,6 75,7
Effective rate of taxation (%) 16,5 9,7 1,2 6,6 7,0 8,1
LEVERAGE AND LIQUIDITYTotal liabilities to total shareholders’ interests (%) 75,8 73,3 152 115,7 130,2 156,3
Net interest-bearing debt to total shareholders’ interests (%)
75maximum
4,4 (4,8) 28,5 19,7 33,0 53,3
Net debt to EBITDA (times) 3maximum
0,2 (0,1) 0,6 0,4 0,6 0,7
Debt service cover ratio 3,2 2,7 5,2 11,0 3,7 2,6
Interest cover (times) 3minimum
12,7 14,9 10,5 15,9 10,7 9,7
Current ratio 1 minimum
1,5 1,6 1,2 1,2 1,3 0,9
EMPLOYEESNumber of employees – subsidiaries 3 829 3 999 3 955 3 695 2 322 1 516
– joint ventures 648 651 1 375 1 448 2 248 1 180
Profi t per employee (R000) 210 499 257 229 247 259
Assets per employee (R000) 3 041 3 233 2 138 1 645 1 445 1 255
Prior year fi gures from 2004 have been adjusted for the 5:1 share split.

page 27G
rindrod Limited / A
nnual Report 2009
businessoverview commentaries sustainability
annual fi nancialstatements
shareholderinformation
2003 2002 2001 2000
480 685 472 483 496 645 570 845
477 710 480 862 527 675 570 400
50,2 34,4 24,1 13,0 Profi t attributable to ordinary shareholders divided by weighted average number of shares in issue during the year under review.
50,2 35,0 24,5 13,1 Headline earnings divided by weighted average number of shares in issue during the year under review.
4,7 4,1 4,2 4,7 Share price at end of year under review divided by earnings per share.
4,3 5,5 6,9 6,4 Total equity plus interest-bearing debt divided by earnings before interest, taxation, depreciation and amortisation (EBITDA).
12 8 5,6 4 Total ordinary dividend/distribution declared relating to the year under review.
4,2 4,2 4,1 3,3 Earnings per share divided by dividend/distribution per share.
5,0 5,7 5,5 6,6 Dividend per share divided by the share price at the end of the year under review (expressed as a percentage).
72,0 55,8 38,9 36,1 EBITDA divided by the weighted average number of shares on which earnings per share are based.
6,0 7,1 6,6 36,1 EBITDA per share divided by total ordinary dividend/distribution declared relating to the year under review.
127 110 145 94 Total equity less preference share equity divided by the total number of ordinary shares in issue net of treasury shares.
14,5 9,6 8,1 8,6 Operating profi t before interest and taxation, expressed as a percentage of revenue.
14,5 9,6 8,1 8,6 Operating profi t before interest and taxation, excluding Trading, expressed as a percentage of revenue excluding Trading revenue.
19,9 14,7 11,0 10,6 Operating profi t before interest and taxation, including non-trading items and share of associate companies' profi t, expressed as a percentage of average total assets excluding deferred taxation, less current liabilities, excluding short-term borrowings and current portion of long-term borrowings.
42,4 26,7 20,2 16,1 Profi t attributable to ordinary shareholders expressed as a percentage of average ordinary shareholders’ funds.
1,8 10,4 (11,2) 0,2
125,6 184,5 98,8 155,9 Other liabilities and interest-bearing debt (interest-bearing loans including Bank customer deposits after netting off bank balances, cash on deposit included in fi nancial assets, bank advances and liquid assets and short-term negotiables) expressed as a percentage of total shareholders' funds (ordinary shareholders' funds plus minority interest). In the prior year, other liabilities were netted off with fi nancial assets and fi nancial liabilities and interest-bearing debt was netted off with non-current assets held for sale as disclosed separately and included in inventory.
61,0 106,6 29,2 105,5 Interest-bearing loans, including Bank customer deposits after netting off bank balances, cash on deposit included in fi nancial assets, bank advances and liquid assets and short-term negotiables, expressed as a percentage of total shareholders' funds. In the prior year, interest-bearing debt was netted off with non-current assets held for sale as disclosed separately and included in inventory.
1,1 2,1 1,0 2,7 Interest-bearing loans divided by EBITDA.
1,7 2,7 0,5 0,9 Free cash fl ow divided by short-term and long-term debt repayments and interest paid.
4,2 5,6 3,4 2,0 Operating profi t before interest and taxation, including non-trading items divided by net interest paid.
1,0 0,6 1,0 0,9 Current assets divided by current liabilities excluding current portion of long-term borrowings.
1 139 965 822 1 113
889 835 850 397
150 120 102 56 Total revenue divided by the number of employees, including 50% of the joint venture employees.
1 321 1 377 1 531 1 222 Total assets divided by the number of employees, including 50% of the joint venture employees.

28 p
age
Grin
drod
Lim
ited
/ A
nnua
l Rep
ort 2
009
Divisional reviews - Divisional reviews - ShippingShipping
BUSINESS OVERVIEWThe division operates in three distinct segments as follows:
2009 KEY FEATURES• average earnings per day outperformed average spot market rates;
• substantially lower ship sale profi ts in 2009 of US$31 million (2008: US$62 million);
• foreign exchange loss in 2009 of US$5 million versus US$16 million profi t in the prior year;
• took delivery of three ships and sold six ships during the year (2008: sold fi ve ships);
• further reduced fl eet through cancellations; and
• increased contract cover.
Handysize
Panamax
Capesize
Mid-range
Small
Chemical
Parcel Service/Handymax
Tankers
Bunker tankers
Tankers(owned and long-term chartered)
Drybulk(owned and long-term chartered)
Ship operating activities

page 29G
rindrod Limited / A
nnual Report 2009
businessoverview commentaries sustainability
annual fi nancialstatements
shareholderinformation
FINANCIAL OVERVIEWShipping accounted for 56% of the group’s earnings for 2009.
2009 2008 Growth
Income statement Rm Rm % Comments
Revenue 4 918 7 069 (30)
Lower shipping rates/stronger Rand
EBITDA 774 2 388 (68)
Depreciation and amortisation (127) (95) (34)
Operating income 647 2 292 (72)
Attributable income 492 1 862 (74)
2009 2008
Statement of fi nancial position Rm Rm
Fixed assets/investments 2 785 3 058
Current assets 1 936 2 886
Net cash including debt 192 239
Total assets 4 913 6 183
Equity 2 903 3 842
Other liabilities 2 010 2 341
Total equity and liabilities 4 913 6 183
Key fi nancial ratios 2009 2008
Operating margin (%) 13 32
Debt/equity (0,07):1 (0,06):1
Return on ordinary shareholders’ equity (%) 17 48
Return on net assets (%) 16 43
Number of employees 399 375
Average number of ships operated
2009 2008
Owned 8 12
Long-term charter 27 25
Short-term charter 15 12
In addition to the above short-term charters, Island View Shipping operated an average of ten ships (2008: eight) on behalf of Atlas Trading and Shipping.
For the detailed statutory income statement, see the segmental analysis on page 128.

30 p
age
Grin
drod
Lim
ited
/ A
nnua
l Rep
ort 2
009
Divisional reviews - Divisional reviews - Shipping Shipping (continued)(continued)
FINANCIAL OVERVIEW (continued)An analysis of the divisional results are as follows:
Profi t from owned and long-term chartered ships
Bulk carriers Tankers 2009 2008Handysize Panamax Capesize Mid-range Chemical Small Total Total Growth %
Average number of owned/long-term chartered ships 17,3 2,0 2,9 7,8 4,0 0,7 34,7 36,7 (5)Average daily revenue (US$) 13 000 20 800 26 900 18 300 14 800 8 200 15 900 28 600 (44)(1)
Average daily cost (US$)(2) 8 500 9 400 18 900 14 600 14 600 10 400 11 500 11 700 2
Profi t (US$ million) 28,3 8,3 8,3 10,5 0,3 (0,7) 55 226 (76)
(US$ million)Profi t from ship operating activities 31 39 (21)Profi t from ship sales 31 62 (50)Shipbuilding costs (7) –Overheads/other expenses (28) (35) 20Foreign exchange (loss)/profi t (5) 16 (131)Funding costs/preference dividends/taxation (17) (44) 61Impairments/onerous contract provisions – (42) 100
60 222 (72)
(1) Average earnings declined by 44%, versus in excess of 60% decline in the market.(2) Included in daily costs is an interest charge of US$2 million (2008: US$1 million).
PROFIT (US$ million)AVERAGE NUMBER OF OWNED/
LONG-TERM CHARTERED VESSELS
Total
Sm
all
Chem
ical
Mid-range
Capesize
Panam
ax
Handysize
Total
Sm
all
Chem
ical
Mid-range
Capesize
Panam
ax
Handysize
17,328,3
2,0
8,3
2,9
8,37,8
10,5
4,0
0,3
0,7 (0,7)
34,755,0
page 31G
rindrod Limited / A
nnual Report 2009
businessoverview commentaries sustainability
annual fi nancialstatements
shareholderinformation
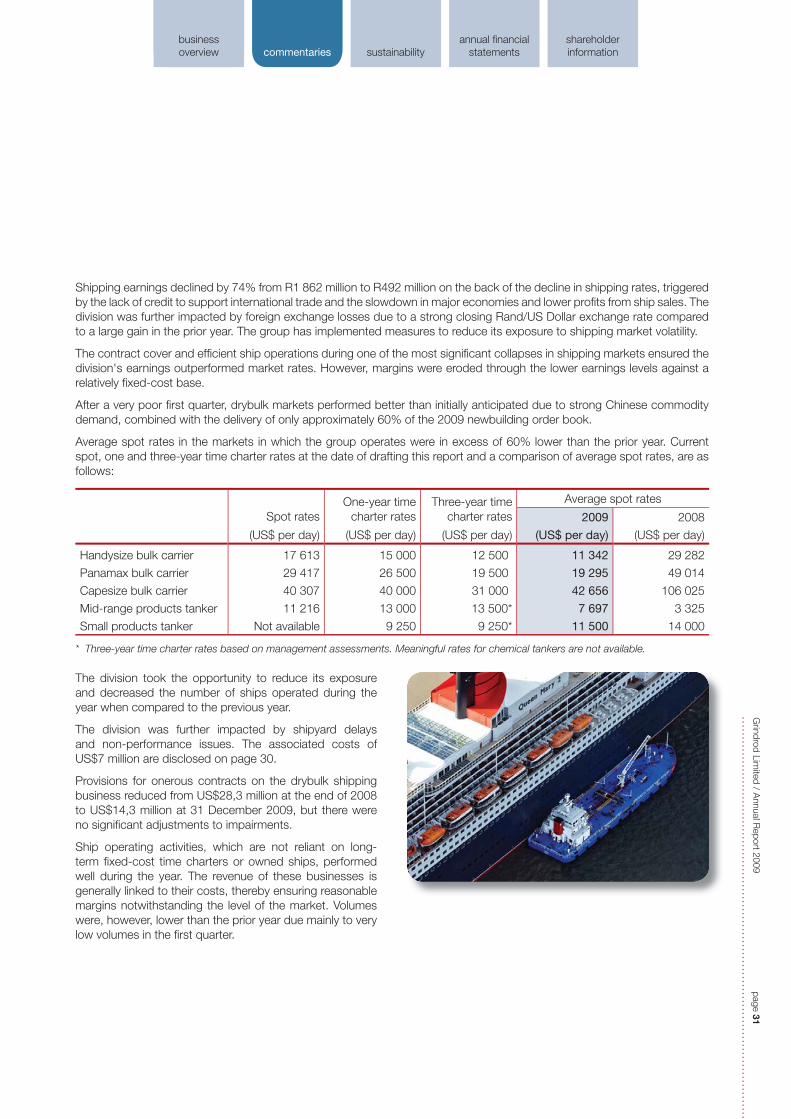
Shipping earnings declined by 74% from R1 862 million to R492 million on the back of the decline in shipping rates, triggered by the lack of credit to support international trade and the slowdown in major economies and lower profi ts from ship sales. The division was further impacted by foreign exchange losses due to a strong closing Rand/US Dollar exchange rate compared to a large gain in the prior year. The group has implemented measures to reduce its exposure to shipping market volatility.
The contract cover and effi cient ship operations during one of the most signifi cant collapses in shipping markets ensured the division's earnings outperformed market rates. However, margins were eroded through the lower earnings levels against a relatively fi xed-cost base.
After a very poor fi rst quarter, drybulk markets performed better than initially anticipated due to strong Chinese commodity demand, combined with the delivery of only approximately 60% of the 2009 newbuilding order book.
Average spot rates in the markets in which the group operates were in excess of 60% lower than the prior year. Current spot, one and three-year time charter rates at the date of drafting this report and a comparison of average spot rates, are as follows:
Spot ratesOne-year time
charter ratesThree-year time
charter rates
Average spot rates
2009 2008
(US$ per day) (US$ per day) (US$ per day) (US$ per day) (US$ per day)
Handysize bulk carrier 17 613 15 000 12 500 11 342 29 282
Panamax bulk carrier 29 417 26 500 19 500 19 295 49 014
Capesize bulk carrier 40 307 40 000 31 000 42 656 106 025
Mid-range products tanker 11 216 13 000 13 500* 7 697 3 325
Small products tanker Not available 9 250 9 250* 11 500 14 000
* Three-year time charter rates based on management assessments. Meaningful rates for chemical tankers are not available.
The division took the opportunity to reduce its exposure and decreased the number of ships operated during the year when compared to the previous year.
The division was further impacted by shipyard delays and non-performance issues. The associated costs of US$7 million are disclosed on page 30.
Provisions for onerous contracts on the drybulk shipping business reduced from US$28,3 million at the end of 2008 to US$14,3 million at 31 December 2009, but there were no signifi cant adjustments to impairments.
Ship operating activities, which are not reliant on long-term fi xed-cost time charters or owned ships, performed well during the year. The revenue of these businesses is generally linked to their costs, thereby ensuring reasonable margins notwithstanding the level of the market. Volumes were, however, lower than the prior year due mainly to very low volumes in the fi rst quarter.

32 p
age
Grin
drod
Lim
ited
/ A
nnua
l Rep
ort 2
009
Divisional reviews - Divisional reviews - Shipping Shipping (continued)(continued)
OPERATIONAL OVERVIEWThe Shipping division is made up of two key brands:
• Unicorn Shipping owns, charters and operates products tankers and chemical tankers; and
• Island View Shipping owns, charters and operates drybulk ships.
The operating segments can be described as follows:
• Tankers – long-term shipowning, chartering and operating of mid-range, small and chemical tankers;
• Drybulk – long-term shipowning, chartering and operating of handysize, panamax and capesize bulk carriers; and
• Ship operating activities – shorter-term operations, including tankers, bunker tankers, the Parcel Service and the Handymax/Islands Service.
TANKERS
2009 2008 Growth
Rm Rm %
Revenue 1 187 1 902 (38)
EBITDA 196 699 (72)
Depreciation and amortisation (84) (61) (38)
Operating income 113 637 (82)
Attributable income 5 517 (99)
Net debt including cash (231) (61) (279)
Unicorn Shipping operates products tankers and chemical tankers from its offi ces in the United Kingdom and South Africa. The United Kingdom offi ce houses its commercial operations whilst the South African offi ce focuses on the marine and technical aspects of the fl eet.
The division’s customer base consists of oil majors, blue-chip international chemical majors and large international operators. Accordingly, through well priced contracts, the fl eet has a high percentage of secure earnings for 2010.
The division mainly time charters out its fl eet of modern products and chemical tankers. It does, however, also employs some of its ships via joint services or pools. Its four chemical tankers are deployed through the Stolt Tankers Pool Inc.
SHIPPING
The above fi gures and graphs include the Tankers segment's portion of ship operating activities.
TANKER CONTRIBUTION TO SHIPPING EBITDA
2009 2008
25% 29%
G
RINDRO
D
19
10 - 2010years
100 G
RINDRO
D
19
10 - 2010years
100R196m R699m

page 33G
rindrod Limited / A
nnual Report 2009
businessoverview commentaries sustainability
annual fi nancialstatements
shareholderinformation
The following ship transactions took place during the year:
• delivery of a small products tanker (Breede);
• a products tanker (Wildebeest) was delivered, sold and chartered back for a two-year period;
• an ageing products tanker (Rainbow) in a 50/50 joint venture was sold and bareboat chartered back for a six-month period;
• a 50% share in a long-term charter of a products tanker (Eland) was terminated early when the owner exercised its right to sell. Unicorn shared in a portion of the profi ts on sale in terms of the charter agreement;
• the remaining handysize drybulk carrier (Kuiseb), owned by Unicorn, was sold;
• a long-term charter of a chemical tanker (Stolt Griqua), scheduled for delivery in 2012, was cancelled on request of the owner and against a settlement payment to Unicorn; and
• two newbuilding products tankers (Sable and Umzimvubu) were cancelled due to yard non-performance.
Subsequent to year-end, a 47 350 dwt long-term chartered products tanker (Leopard) was delivered and orders for three 16 500 dwt products tankers (Umvoti, Umgeni and Gamtoos) were cancelled. Management are, however, in discussions with the shipyard on the possible renegotiation of the cancelled contracts.
A further four small 16 500 dwt products tankers (Kowie, Kei, Gouritz and Zwartskops) are scheduled for delivery over the next two years.
DRYBULK
2009 2008 Growth
Rm Rm %
Revenue 3 731 5 167 (28)
EBITDA 578 1 689 (66)
Depreciation and amortisation (43) (34) (26)
Operating income 534 1 655 (68)
Attributable income 540 1 411 (62)
Net cash including debt 423 301
The Island View Shipping (IVS) division has as its core competency the shipping of drybulk cargoes worldwide. IVS is based in Singapore and has numerous offi ces worldwide including Canada, Dubai, Denmark, Japan, the Netherlands and South Africa.
75%
DRYBULK CONTRIBUTION TO SHIPPING EBITDA
2009 2008
71%G
RINDRO
D
19
10 - 2010years
100 G
RINDRO
D
19
10 - 2010years
100R578m R1 689m
The above fi gures and graphs include the Drybulk segment's portion of ship operating activities.

34 p
age
Grin
drod
Lim
ited
/ A
nnua
l Rep
ort 2
009
It focuses mainly on handysize, panamax and capesize bulk carriers. The division operates the vessels commercially and moved approximately 10,5 million tonnes of cargo in 2009 (2008: approximately 14 million tonnes). It enters into freighting contracts with blue chip shippers and counterparties.
Most of the fl eet is chartered in with charter periods varying from short-term voyage-based charters (30 to 45 days) to longer-term charters of up to seven years. The longer-term charters often have the right to acquire the vessels at predetermined prices.
The handysize fl eet is deployed into the market via a freighting agreement with partners J Lauritzen of Denmark.
The Cape and Panamax business performed well on the back of strong demand for large bulk ships. It continued to secure long-term freighting business to be carried by already contracted time chartered vessels. Two panamax ships are chartered out for an average of four years, providing locked-in margins and certainty of earnings in this sector.
The following ship transactions took place during the year:
• exercised fi ve purchase options (IVS Hunter, IVS Swift, IVS Nightjar, IVS Nightingale and Rosella (50%)), on its long-term chartered handysize bulk carriers, one of which was in a joint venture company;
• four of these ships (IVS Hunter, IVS Swift, IVS Nightingale and Rosella (50%)) were on-sold to third parties;
• a further handysize bulk carrier (IVS Kenso) was sold; and
• a supramax bulk carrier (Lepta Galaxy) was chartered in for a two-year period commencing early in 2009.
Subsequent to the year-end, the division exercised its purchase option on the IVS Kanda and acquired the ship.
Four handysize bulk carriers (IVS Knot, IVS Kingslet, IVS Sentosa and IVS Orchid), two Imabari handysize bulk carriers in a joint venture and a long-term chartered supramax bulk carrier, are scheduled for delivery over the next three years.
SHIP OPERATING ACTIVITIES
2009 2008 Growth Comments
Rm Rm %
Revenue 1 185 1 841 (36) Lower volumes/shipping rates
Gross profi t 258 327 (21) Lower volumes/shipping rates
Gross margin (%) 21 18 (17) Lower shipping rates
The above fi gures are included in the Tankers segment on page 32 and the Drybulk segment on page 33.
Ship operating activities consists primarily of Unicorn Calulo products tankers, Unicorn Calulo bunker tankers, the Parcel Service and the Handymax/Islands Services.
The Unicorn joint venture with Calulo Services (Pty) Limited, an empowered South African petrochemical group, consists of two companies, Unicorn Calulo Shipping Services (Pty) Limited, which focuses on tanker shipping on the South African coast, and Unicorn Calulo Bunker Services (Pty) Limited, which operates sophisticated bunker tankers in South African ports under long-term agreements with the South African oil majors.
Unicorn Calulo Shipping Services operates chartered-in products tankers on the South African coast for the local oil majors.
Unicorn Calulo Bunker Services took delivery of its third bunker tanker in 2010 for deployment in Durban. This tanker was built in Durban.
The Parcel Service employs an average of eight vessels per month on routes from southern Africa to the North West Continent, Asia, the Mediterranean, the United Kingdom and the United States of America. The service carries a wide variety of bulk cargoes including ferrochrome, chrome ore, alloys, mineral sands, concentrates, grains, vermiculite and fl uorspar. Key in this service is the ability of the division to segregate individual holds (i.e. parcelling). In addition, the division supplies a shipping service to the group's trading division.
Divisional reviews - Divisional reviews - Shipping Shipping (continued)(continued)

page 35G
rindrod Limited / A
nnual Report 2009
businessoverview commentaries sustainability
annual fi nancialstatements
shareholderinformation
The revenues and costs of the Parcel Service contracts of affreightment are predominantly market linked which reduces volatility of margins.
The Handymax/Islands Service provides bulk shipping services from Europe, South America and Australasia into South Africa and the Indian Ocean Islands.
FLEET OVERVIEW
OWNED AND LONG-TERM CHARTERED SHIPS
Contracted in at 31 December 2009
Bulk carriers Tankers
TotalHandysize Panamax Capesize Mid-range Chemical Small
2010Number (average)Cost (US$/day)
15,19 200
2,09 400
3,021 000
8,115 300
4,014 700
3,010 400
35,212 400
2011Number (average)Cost (US$/day)
16,99 400
2,09 400
3,526 200
5,213 700
4,014 700
6,210 800
37,812 400
2012Number (average)Cost (US$/day)
18,19 800
2,09 400
3,027 800
4,013 000
4,014 700
8,511 000
39,412 200
2013Number (average)Cost (US$/day)
18,59 900
2,09 500
3,028 100
4,013 200
4,014 800
8,511 100
40,012 300
Current fl eet 15,0 2,0 3,0 8,0 4,0 1.5 33,5*
Net number of ships to deliver
2010 1,0 – – (1,0) – 3,0 3,0
2011 2,0 – – (3,0) – 4,0 3,0
2012 0,5 – – – – – 0,5
2013 – – – – – – –
Fleet at end of 2013 18,5 2,0 3,0 4,0*** 4,0 8,5 40,0**
* Owned fl eet 7,5; chartered fl eet 26,0.** Owned fl eet 23,5; chartered fl eet 16,5.*** Three newbuilding orders cancelled, subsequent to year-end, are included in this fi gure. Management are, however, in discussion with
the shipyard on the possible renegotiation of these contracts. As a result the three ships are included in the above fi gure.
The group has reduced its committed fl eet from the 51 reported a year ago to the current 40 with the option to redeliver to owners nine of these chartered ships by the end of 2012, should this be warranted by market conditions.
Market value adjustments to fl eet book value Rm Comments
Excess of market value of owned fl eet and charters with purchase options over book value
241 Indicative ship values obtained in consultation with reputable ship brokers.
Book value of charters = PV @ 6,5% of capital element (i.e. excluding running costs) of charter commitments and purchase option price. Yen options valued at closing rate.
Market value of other long-term charters and contracts
558 Differential between market rates and Grindrod charter/contract rates. PV @ 6,5%.
799

36 p
age
Grin
drod
Lim
ited
/ A
nnua
l Rep
ort 2
009
Assumptions used in the market value adjustment calculation above are set out below. In some cases these are below book or contracted values, however, further impairments have not been required as value-in-use calculations justify the carrying values:
Average ship market value
Average market long-term charter rates
US$000 US$ per day
Bulk carriers – handysize 23 864 12 750 – panamax 37 500 17 128
– capesize 66 500 31 031
Tankers – mid–range 22 500 12 996– chemical 33 250 20 000– small 18 441 9 750
CONTRACT COVER AND CONTRACTED PROFITS
Contracted out at 31 December 2009
Bulk carriers Tankers
TotalHandysize Panamax Capesize Mid-range Chemical Small
2010Number (average) 11,8 2,0 2,5 7,1 2,0 1,5 26,9Revenue (US$/day) 10 800 22 600 35 100 19 300 17 000 10 400 16 600
2011Number (average) 3,0 2,0 2,3 1,7 1,5 1,1 11,6Revenue (US$/day) 11 800 24 000 42 100 19 600 17 600 10 600 21 700
2012Number (average) 1,8 2,0 2,0 – – – 5,8Revenue (US$/day) 12 900 24 000 44 500 – – – 27 700
2013Number (average) 0,5 1,4 1,0 – – – 2,9Revenue (US$/day) 20 000 25 200 52 300 – – – 33 600
Percentage Charters
Contract profi ts of fl eet fi xed (%) (US$m)
2010 76 432011 34 302012 17 242013 8 15
Notes: 1. In addition, ±6% of the fl eet is fi xed for 2014/2015.2. Variable volume contracts have been included at forecast volumes.3. There are no contracted ship sales for the period 2010 to 2013.
Divisional reviews - Divisional reviews - Shipping Shipping (continued)(continued)

page 37G
rindrod Limited / A
nnual Report 2009
businessoverview commentaries sustainability
annual fi nancialstatements
shareholderinformation
FLEET SUMMARY
Vessel name Owned Chartered-inAge of vessel
Option to purchase
Charter expiry date
Charter extension
expiry date
HANDYSIZE BULK CARRIERSDurban Bulker (50%) ✓ 5IVS Kanda ✓ 6 ✓ 2011 2014IVS Kawana ✓ 5 ✓ 2012 2015IVS Kestral ✓ 8 ✓ 2010 2012IVS Kingbird ✓ 3 ✓ 2014 2017IVS Kite ✓ 8 ✓ 2010 2012IVS Kittiwake ✓ 3 ✓ 2014 2017IVS Kwaito ✓ 6 ✓ 2011 2014IVS Kwela ✓ 8 ✓ 2010 2012IVS Lavender ✓ 6 2007 2010IVS Nightjar ✓ 6IVS Shikra ✓ 2 ✓ 2018 2021JA Aladdin Rainbow (50%) ✓ 11 2011Lake Triview (50%) ✓ 1Lauretta (50%) ✓ 6 ✓ 2011 2014Bumbi (50%) ✓ 6 ✓ 2011 2014Paola (50%) ✓ 6 ✓ 2011 2014Lepta Galaxy (Supramax bulk carrier) ✓ 8 2011
PANAMAX BULK CARRIERSIVS Pinotage ✓ 5 ✓ 2012IVS Merlot ✓ 5 ✓ 2012
CAPESIZE BULK CARRIERSAnangel Innovation ✓ 6 2014IVS Cabernet ✓ 3 ✓ 2017Mineral Belgium ✓ 5 2011
MID-RANGE PRODUCTS TANKERSHambisa ✓ 13 ✓ 2011Helix ✓ 13 2011Inyala ✓ 2Kudu (50%) ✓ 6 ✓ 2010Oliphant ✓ 6Rainbow (50%) ✓ 14Southern Unity ✓ 6 2010Torea ✓ 6Wildebeest ✓ 1 2011 2012
CHEMICAL TANKERSStolt Basuto ✓ 4 ✓ 2016 2022Stolt Pondo ✓ 3 ✓ 2017 2022Stolt Swazi ✓ 3 ✓ 2015 2021Stolt Zulu ✓ 4 ✓ 2016 2022
SMALL PRODUCTS TANKERSBerg (50%) ✓ 2Breede ✓ 1
Total owned fl eet 7,5Total chartered in 26,0
Total fl eet 33,5
Total number of purchase options on chartered fl eet 19,0 (eight vessels can be returned by 2012)
Handysize bulk carriers 15,0Panamax bulk carriers 2,0Capesize bulk carriers 3,0Mid-range products tankers 8,0Chemical tankers 4,0Small products tankers 1,5
Total fl eet 33,5

38 p
age
Grin
drod
Lim
ited
/ A
nnua
l Rep
ort 2
009
BUSINESS OVERVIEW
2009 KEY FEATURES• developed a presence in Singapore to service increasing Asian market;
• gross revenue declined by 15% due to generally softer commodity prices;
• volumes were up 7,7% to 7,09 million tonnes from 6,59 million tonnes in 2008, mainly through strong performances by the marine fuel and agricultural businesses;
• operating margins improved while the average operating margin per tonne was maintained at approximately US$4 per tonne; and
• signifi cant interest cost saving.
Divisional reviews - Divisional reviews - TradingTrading
Ferro alloys
Coal and metallurgical
coke
Ores
Iron andsteel product
Stainlesssteel
Maize
Wheat
Soya beanmeal
Soya beans
Rice
Marine fueloil
Diesel oil
Agricultural commodities
Mineralcommodities
Marinebunkers
The division operates three distinct segments as follows:

page 39G
rindrod Limited / A
nnual Report 2009
businessoverview commentaries sustainability
annual fi nancialstatements
shareholderinformation
FINANCIAL OVERVIEWThe division's earnings growth was not impacted on by the acquisition of the remaining 50% interests in the marine fuel and industrial raw materials businesses during 2008.
2009 2008 GrowthIncome statement Rm Rm % Comments
Revenue 20 335 24 022 (15) Generally softer commodity pricesEBITDA 256 230 11 Increased volumeOperating income 249 222 12 Increased volumeAttributable income 181 132 37 Increased volume and reduced funding cost
Statement of fi nancial position
Fixed assets/investments 446 282Current assets 2 089 2 839
Total assets 2 535 3 121
Equity 683 824Other liabilities 1 465 2 150Net debt including cash 387 147
Total equity and liabilities 2 535 3 121
Key fi nancial ratios
Margin (%) 1,22 0,92
Debt/equity 0,57:1 0,18:1
Return on ordinary shareholders' equity (%) 24 21
Return on net assets (%) 23 23
Number of employees 156 160
DIVISIONAL REVENUE (Rm)
VOLUMES TRADED (MMT)
OPERATING PROFIT PER MT TRADED
OPERATING PROFIT BEFORE INTEREST AND TAX (Rm)
24 022
20 335
08 09
222
249
08 09
6,59
7,09
08 09
$4
R34 R33
$4
08 09

40 p
age
Grin
drod
Lim
ited
/ A
nnua
l Rep
ort 2
009
OPERATIONAL OVERVIEW
AGRICULTURAL COMMODITIES
Atlas Trading and Shipping (Atlas) is a focused agricultural commodity trading business offering an enhanced end-to-end solution to customers. Atlas has offi ces in Singapore, South Africa, Ecuador and Peru.
Atlas specialises in the procurement and selling of a broad range of agricultural commodities such as wheat, maize, rice, soya beans and meal, as well as the physical handling of the commodities from source to destination.
All agricultural commodity markets were characterised by continued volatility. Whilst supply and demand still drives market movements, these are exacerbated by hedge fund activity. This has created opportunities for Atlas to improve its offering to customers by strengthening key customer and supplier relationships and simultaneously enhancing margins through innovative distribution channel management with resultant effi ciencies.
The establishment of a trading hub in Singapore has created a platform for the division to benefi t from exposure to the Asian markets. Liquidity issues arising from the credit crisis in 2008 have eased, but counterparty risk remains a key focus.
The focus for 2010 will remain on sourcing and investment in strategic origination projects and expanding the offering of products across the division. Representation in new markets, particularly in South America, Asia and in the rest of Africa, have commenced.
Sound management of counterparty exposure and market risk remain an imperative.
Plans for 2010 should result in further improvements. Growth will come from focusing on the core strengths of the business, encompassing regional exposure and expertise, strategic alliances, new products and expansion into new markets.
MINERAL COMMODITIES
Oreport is an international marketing organisation specialising in the worldwide procurement, movement and distribution of industrial raw materials.
Oreport has successfully grown its business through close relationships with long-term suppliers and its international network of customers and agents. The strategy of securing strategic alliances combined with investment in origination and processing assets remains a key objective. The establishment of the Asian trading hub is expected to enhance trading opportunities in new products and markets.
Steel production fell early in the year and then recovered, particularly in China where production ended the year 12% higher than 2008. The same pattern was evident in stainless steel where Chinese production increased by over 27% in 2009 on the back of strong demand. Oreport’s involvement in steel and stainless steel is changing from that of pure trading, where opportunities are declining, to that of a distributor with stakes being taken in warehousing and processing companies which will develop both opportunities and margins.
Divisional reviews - Divisional reviews - Trading Trading (continued)(continued)
page 41G
rindrod Limited / A
nnual Report 2009
businessoverview commentaries sustainability
annual fi nancialstatements
shareholderinformation
China showed increased demand for manganese and chrome alloy markets despite the reduction in global demand. Prices of manganese alloys increased during the year although chrome only improved about 10%. Coal prices were subdued for most of the year and opportunities were limited. Oreport was severely affected by supplier cutbacks due to the strong Rand. However, recent improvements in commodity prices have led to additional opportunities to expand its business.
The ongoing demand for raw materials in China offers Oreport the opportunity to refocus given the relatively poor conditions in other parts of the world. Supplier support coupled with strong market contacts allow for continued profi tability and growth. To support this, Oreport has opened an offi ce in Singapore with plans to expand this footprint to other developing markets which is expected to enhance trading opportunities.
MARINE BUNKERS
Cockett supplies marine fuel oil and diesel oil on a global basis through its international network with offi ces in Brazil, China, France, Hong Kong, Singapore, South Africa, South Korea and the United Kingdom.
Market conditions remain challenging with some key market players suffering the ill effects of counterparty exposure. Despite this, Cockett performed exceptionally well through focused efforts on physical supply, penetration into new markets, volume growth and sound counterparty risk management.
Cockett continues to identify and develop niche trading opportunities that are expected to increase volumes through new market and physical supply programmes.
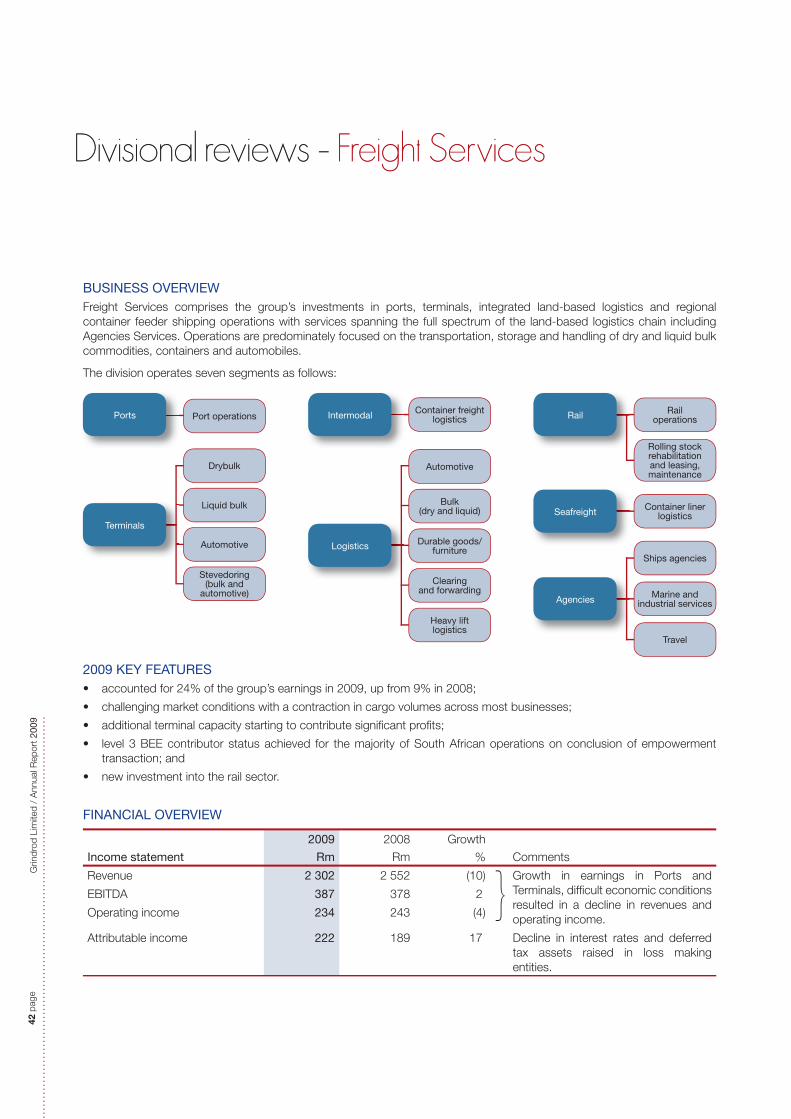
42 p
age
Grin
drod
Lim
ited
/ A
nnua
l Rep
ort 2
009
Divisional reviews - Divisional reviews - Freight ServicesFreight Services
BUSINESS OVERVIEWFreight Services comprises the group’s investments in ports, terminals, integrated land-based logistics and regional container feeder shipping operations with services spanning the full spectrum of the land-based logistics chain including Agencies Services. Operations are predominately focused on the transportation, storage and handling of dry and liquid bulk commodities, containers and automobiles.
The division operates seven segments as follows:
2009 KEY FEATURES• accounted for 24% of the group’s earnings in 2009, up from 9% in 2008;
• challenging market conditions with a contraction in cargo volumes across most businesses;
• additional terminal capacity starting to contribute signifi cant profi ts;
• level 3 BEE contributor status achieved for the majority of South African operations on conclusion of empowerment transaction; and
• new investment into the rail sector.
FINANCIAL OVERVIEW
2009 2008 Growth
Income statement Rm Rm % Comments
Revenue 2 302 2 552 (10) Growth in earnings in Ports and Terminals, diffi cult economic conditions resulted in a decline in revenues and operating income.
EBITDA 387 378 2
Operating income 234 243 (4)
Attributable income 222 189 17 Decline in interest rates and deferred tax assets raised in loss making entities.
Ports Port operations
Terminals
Drybulk
Liquid bulk
Automotive
Stevedoring(bulk and
automotive)
Intermodal Container freightlogistics
Logistics
Clearingand forwarding
Heavy lift logistics
Durable goods/ furniture
Bulk (dry and liquid)
Automotive
Seafreight Container linerlogistics
Agencies
Ships agencies
Marine and industrial services
Travel
Rail Rail operations
Rolling stock rehabilitation and leasing, maintenance

page 43G
rindrod Limited / A
nnual Report 2009
businessoverview commentaries sustainability
annual fi nancialstatements
shareholderinformation
Freight Services reported a 17% growth in attributable income to R222 million in 2009, with the improvement in profi tability driven by increased profi tability from the Ports and Terminals operations which benefi ted from the recent investment into the expansion of terminal capacities. This improvement in profi tability was achieved in spite of the diffi cult economic conditions which led to a decline in revenues of 10% and operating income of 4%. The Logistics operations in particular came under pressure with losses being reported for the year. The Intermodal and Seafreight operations, although affected by the weak market, traded largely in line with 2008.
For the detailed statutory income statement, see the segmental analysis on page 128.
Statement of fi nancial position
2009 2008
Rm Rm
Fixed assets/investments 2 067 2 033
Current assets 867 871
Total assets 2 934 2 904
Equity 1 918 1 549
Net debt including cash 159 65
Other liabilities 857 1 290
Total equity and liabilities 2 934 2 904
Key fi nancial ratios 2009 2008
Margin (%) 10,2 9,5
Debt/equity ratio 0,08:1 0,04:1
Return on ordinary
shareholders’ equity (%) 13 18
Return on net assets (%) 11 12
Number of employees 3 127 3 399
Average number of ships operated on charter 7 7
2008 ATTRIBUTABLE INCOME BY DIVISION (Rm)2009 ATTRIBUTABLE INCOME BY DIVISION (Rm)
Total
Other
Agencies
Seafreight
Rail
Intermodal
Logistics
Ports and
Terminals
250
200
150
100
50
0Total
Other
Agencies
Seafreight
Rail
Intermodal
Logistics
Ports and
Terminals
250
200
150
100
50
0
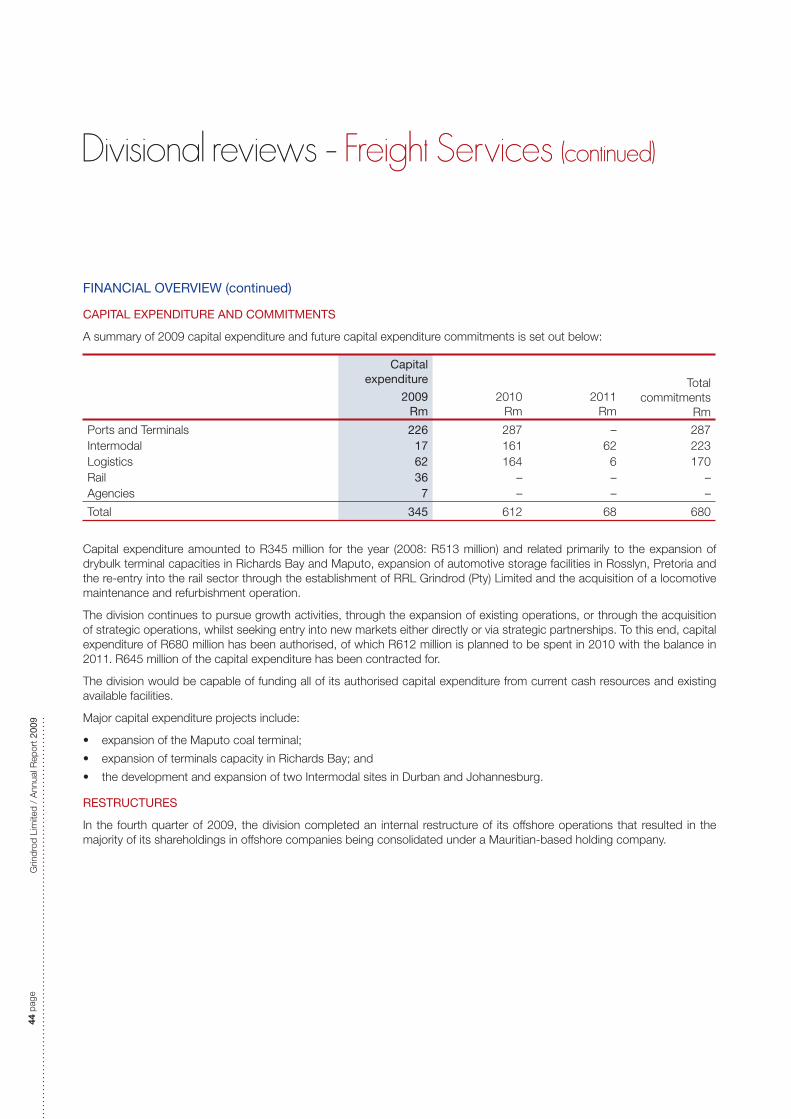
44 p
age
Grin
drod
Lim
ited
/ A
nnua
l Rep
ort 2
009
Divisional reviews - Divisional reviews - Freight Services Freight Services (continued)(continued)
FINANCIAL OVERVIEW (continued)
CAPITAL EXPENDITURE AND COMMITMENTS
A summary of 2009 capital expenditure and future capital expenditure commitments is set out below:
Capital expenditure Total
commitmentsRm
2009Rm
2010Rm
2011Rm
Ports and Terminals 226 287 – 287Intermodal 17 161 62 223Logistics 62 164 6 170Rail 36 – – –Agencies 7 – – –
Total 345 612 68 680
Capital expenditure amounted to R345 million for the year (2008: R513 million) and related primarily to the expansion of drybulk terminal capacities in Richards Bay and Maputo, expansion of automotive storage facilities in Rosslyn, Pretoria and the re-entry into the rail sector through the establishment of RRL Grindrod (Pty) Limited and the acquisition of a locomotive maintenance and refurbishment operation.
The division continues to pursue growth activities, through the expansion of existing operations, or through the acquisition of strategic operations, whilst seeking entry into new markets either directly or via strategic partnerships. To this end, capital expenditure of R680 million has been authorised, of which R612 million is planned to be spent in 2010 with the balance in 2011. R645 million of the capital expenditure has been contracted for.
The division would be capable of funding all of its authorised capital expenditure from current cash resources and existing available facilities.
Major capital expenditure projects include:
• expansion of the Maputo coal terminal;
• expansion of terminals capacity in Richards Bay; and
• the development and expansion of two Intermodal sites in Durban and Johannesburg.
RESTRUCTURES
In the fourth quarter of 2009, the division completed an internal restructure of its offshore operations that resulted in the majority of its shareholdings in offshore companies being consolidated under a Mauritian-based holding company.

page 45G
rindrod Limited / A
nnual Report 2009
OPERATIONAL OVERVIEW
PORTS AND TERMINALS
Ports and Terminals comprises the group’s investment in port concessions and terminal operations, which currently comprises the investment in the Maputo Port Development Company (MPDC) and port side terminals and stevedoring operations within various ports in the southern African region.
The results of MPDC are equity accounted as Grindrod has an effective 24,7% interest in MPDC.
2009 2008 Growth
Rm Rm %
Revenue 893 810 10
EBITDA 212 143 48
Operating income 173 93 86
Attributable income 164 47 248
Operating margin (%) 19,0 11,5 65
MPDC has a concession to redevelop and operate the port of Maputo, in partnership with international terminal operator Dubai Ports World (24,7%), the Government of Mozambique (49%) and local partners (1,6%).
Volumes through the port increased by 5,8% to 8,03 million tonnes in 2009 (2008: 7,5 million tonnes) driven by demand for coal, break bulk cargoes and containers with the volume growth achieved despite market weakness. MPDC plans to dredge the port in 2010 to increase the draft from the current 9,4 meters to 11,0 meters to allow for entry by panamax vessels which will increase the port handling capacity.
Capacity constraints in the South African ports are expected to continue despite planned expansion of these facilities by Transnet, with new capacity forecast to be taken up by an increase in commodity exports on the continuing recovery of commodity demand. Maputo is therefore seen as a key strategic port, being positioned the closest to Mpumalanga, Gauteng and Limpopo and is ideally situated to supplement capacity in the South African ports.
businessoverview commentaries sustainability
annual fi nancialstatements
shareholderinformation

46 p
age
Grin
drod
Lim
ited
/ A
nnua
l Rep
ort 2
009
Divisional reviews - Divisional reviews - Freight Services Freight Services (continued)(continued)
OPERATIONAL OVERVIEW (continued)
During 2009, Grindrod invested R215 million in the further expansion of its terminal capacities (2008: R272 million). A summary of the current status of developments and planned capacity increases are presented in the table below:
TerminalsUtilisation in
2009#
Current capacity
Planned capacity2010
Drybulk (tonnes) 5 660 636 11 970 000 13 950 000
Maputo coal terminal 1 981 129 4 000 000 6 000 000
Richards Bay 2 910 584 6 400 000 6 400 000
Maydon Wharf (Durban) 250 022 700 000 700 000
Walvis Bay (Namibia) 279 047 550 000 550 000
Maputo sized coal 239 853 250 000 650 000
Dar es Salaam (Tanzania)* – 70 000 –
Liquid bulk (m3) 112 654 340 000 340 000
Durban 47 172 260 000 260 000
Cape Town 65 482 80 000 80 000
Automotive (number of vehicles)
Maputo 10 045 52 000 52 000
* Exited in January 2010.# Physical utilisation only.
Capacity in the various drybulk terminals amounted to 11,97 million tonnes per annum as at 31 December 2009, with an additional 2,0 million tonnes per annum of capacity scheduled for completion during 2010.
Specifi c details of these expansions in 2009 are as follows:
• capacity in Richards Bay was expanded to 6,4 million tonnes per annum. The future planned expansion of capacity by an additional 1,2 million to 7,6 million tonnes per annum has been delayed pending an improvement in market conditions;
• capacity at the coal and magnetite terminal at Matola in the port of Maputo was expanded to 4 million tonnes per annum with the further expansion of the terminal capacity by an additional 2 million tonnes to 6 million tonnes per annum scheduled for completion by the end of 2010, with all additional export capacity contracted out to customers on a 75% take-or-pay basis;
• handling capacity at Walvis Bay was expanded by 130 000 tonnes per annum; and
• a sized coal export facility was established in the port of Maputo with a handling capacity of 250 000 tonnes per annum. The export capacity of the facility is in the process of being expanded to 650 000 tonnes per annum with completion expected by the end of 2010.

page 47G
rindrod Limited / A
nnual Report 2009
DRYBULK
Drybulk terminal operations are conducted in Walvis Bay, Durban, Richards Bay and Maputo. The operation in Dar es Salaam was discontinued during the year and a dedicated sized coal export facility was established in Maputo. Further expansions to the Maputo coal terminal and sized coal terminal are currently in progress. Plans for the further expansion of the Richards Bay coal export facility have been deferred pending an improvement in market conditions.
LIQUID BULK
Liquid bulk terminal operations are conducted in Durban (molasses) and Cape Town (multiproduct). Investigating on the feasibility of expanding existing capacity in both the Durban and Cape Town operations by an additional 105 000 m3 per annum in total is being considered.
Grindrod also has an option to acquire a 50% interest in a recently constructed multi-product terminal in Maputo, at cost, from Southcomm, an international trader in bulk liquid products. The Maputo terminal currently has a storage capacity of 10 000 m3. Feasibility studies are in progress to determine the viability of expanding storage capacity to 50 000 m3.
AUTOMOTIVE
Phase one of the Maputo car terminal was commissioned at the end of 2007 with an annual throughput capacity of 52 000 vehicles per annum. This terminal was constructed to accommodate volumes for the Rosslyn-based original equipment manufacturers (OEM) which, under normal market conditions, cannot be accommodated through the Durban car terminal. Volumes through the car terminal have remained below expectations due to a contraction in automotive volumes in South Africa.
It is planned to increase the capacity to 150 000 units.
Grindrod concluded the sale of a 30% interest in the Maputo car terminal to Höegh Autoliners, the owner and operator of one of the largest automotive shipping lines in the world.
businessoverview commentaries sustainability
annual fi nancialstatements
shareholderinformation
LIQUID BULK TERMINALS SOUTH AFRICA (m3 thousands)
47
260 260
65 80 80113
340 340
RichardsBay
TerminalsDurban
TotalSouth Africa
Utilisation in 2009 Current capacityPlanned capacity
DRYBULK TERMINALS OUTSIDE SOUTH AFRICA (tonnes millions)
Maputo WalvisBay
Mozambiquesized coal
Total outsideSouth Africa
Utilisation in 2009 Current capacityPlanned capacity
DRYBULK TERMINALSSOUTH AFRICA (tonnes millions)
RichardsBay
TerminalsDurban
TotalSouth Africa
Utilisation in 2009 Current capacityPlanned capacity

48 p
age
Grin
drod
Lim
ited
/ A
nnua
l Rep
ort 2
009
OPERATIONAL OVERVIEW (continued)
STEVEDORING
Grindrod conducts automotive stevedoring in the port of Durban, specialised pay loading and separation of bulk mineral cargoes in Richards Bay and a wide range of stevedoring in Walvis Bay (Namibia) through Grindrod’s 40% held associate company Erundu Stevedoring.
2009 2008 Growth
Rm Rm %
Revenue 544 511 6
EBITDA 65 66 –
Operating income 43 40 7
Attributable income 33 32 3
Operating margin (%) 7,0 7,8 (10)
Intermodal comprises the group’s container freight logistics operations with services ranging from the provision of depot facilities for the storage, handling and repair of general purpose, refrigerated and tank containers, the provision of warehousing services for cargo that is moved via containers, the road and rail transport of containers and container sales and leasing.
Despite a decline in container traffi c through South African ports of approximately 16% in 2009, Intermodal traded largely in line with 2008. This result was achieved through a combination of cost reduction, rationalisation and consolidation of operational sites and new business wins.
Further consolidation of sites and operations is planned for 2010 and 2011, with two proposed property developments to be undertaken in Durban and Johannesburg.
The development in Durban will involve the conversion of an existing facility to a multipurpose facility which will, in addition to the existing operations, also provide facilities for warehousing and the handling of bulk minerals. The development is expected to be completed in the fourth quarter of 2010.
The development in Johannesburg will involve the consolidation of two sites onto one owned property. The consolidated site will have facilities for the storage, handling, repair and washing of containers as well as provide for the warehousing of cargo and the handling of bulk minerals. The project is expected to be completed by the end of the third quarter of 2011.
Divisional reviews - Divisional reviews - Freight Services Freight Services (continued)(continued)

page 49G
rindrod Limited / A
nnual Report 2009
businessoverview commentaries sustainability
annual fi nancialstatements
shareholderinformation
2009 2008 Growth
Rm Rm %
Revenue 697 797 (12)
EBITDA 35 135 (74)
Operating income (22) 86 (125)
Attributable income (36) 30 (220)
Operating margin (%) (3,0) 10,8 (120)
Logistics comprises the group’s land-based transport, distribution and clearing and forwarding operations.
The signifi cant decline in profi tability in 2009 was driven primarily by the transport operations where trading in the durable goods, automotive and mineral sectors experienced sharp declines. The transport operations have been rationalised and restructured in light of lower market volumes with this restructuring expecting to result in a return to profi tability in 2010. Profi tability in the clearing and forwarding operations also came under pressure in 2009 as a result of a combination of declining volumes and the strength of the Rand.
AUTOMOTIVE
The automotive market declined further in 2009, with new vehicle sales declining 25%, following a 21% contraction in 2008. The export of new vehicles from South Africa also declined by 38% in 2009.
This market has led to the exit of a large number of operators in the automotive ferry industry during 2008 and 2009 which has resulted in Auto Carriers gaining market share. The business is therefore well placed to benefi t from the projected improvement in the domestic and international demand for new cars in 2010.
BULK TRANSPORTATION
Drybulk transportation of minerals and soft commodities remained depressed for much of 2009 as a result of global economic weakness and excess fl eet capacity being available which resulted in signifi cant pricing and volume pressure. Trading improved in the fourth quarter of 2009 on recovering demand for minerals and is expected to continue to improve in 2010.
Liquid bulk transportation also saw a marginal decline in volumes in 2009 as a result of general economic weakness, with pricing also coming under pressure. Trading is expected to continue to improve into 2010.
DURABLE GOODS/FURNITURE
Durable goods/furniture is a small distribution operation offering total supply chain solutions to the manufacturers, importers and retailers of offi ce, hospitality and domestic furniture within the Southern African region. The market segment in which this business operates remained under pressure during 2009 in line with weak consumer demand. The operation has been signifi cantly restructured.

50 p
age
Grin
drod
Lim
ited
/ A
nnua
l Rep
ort 2
009
Divisional reviews - Divisional reviews - Freight Services Freight Services (continued)(continued)
OPERATIONAL OVERVIEW (continued)
PERISHABLE CARGO AGENTS
Perishable Cargo Agents specialises in the clearing and forwarding of perishable products, predominately by air, both domestically and internationally, as well as providing an express freight consolidation service. Profi tability remained fl at in 2009 on the back of a decline in demand for perishable products internationally and a strong Rand persisting for most of the year.
The operation re-entered the seafreight market segment on the exit of the group from the seafreight joint venture with LauritzenCool Logistics S.A. in the second half of 2009.
HEAVY LIFT LOGISTICS
Vanguard Rigging (Pty) Limited is a 50% joint venture with the executive management team of the business. The company is regarded as a leader in its fi eld of heavy project logistics and engineering. Although business declined in 2009 in line with the scaling back of infrastructure projects, the business continues to offer attractive growth opportunities, particularly in the renewable energy sector where Vanguard Rigging (Pty) Limited has positioned itself to secure the installation of wind turbines in the southern African region and abroad.
CLEARING AND FORWARDING
The group’s clearing and forwarding business is a 50% joint venture with Röhlig and Co. Internationale, operating under the brand names of Röhlig-Grindrod (Pty) Limited and Kapele Freight and Logistics (Pty) Limited. The company is one of the largest freight forwarders and customs brokers in South Africa, enjoying strong relationships with a wide range of blue-chip importers and exporters. Volumes and profi tability declined in 2009 in line with global market weakness and the strength of the Rand.

page 51G
rindrod Limited / A
nnual Report 2009
2009 2008 Growth
Rm Rm %
Revenue 23 101 (77)
EBITDA 4 13 (7)
Operating income 3 11 (7)
Attributable income 1 35 (97)
Operating margin (%) 13,0 11,4 14
Grindrod re-entered the rail sector through the conclusion of a joint venture with Solethu Investments (Pty) Limited which resulted in the establishment of a BEE rail company, RRL Grindrod (Pty) Limited. This business provides locomotive leasing, rail operations and shunting services. In addition, a separate business was formed to house the locomotive fl eet which was subsequently enhanced through the acquisition of a business specialising in locomotive maintenance, refurbishment and rebuilds. Through these businesses and other strategic alliances, a holistic rail solution will be offered to customers. The business is well placed to grow off its existing base and through public-private-partnerships and concession opportunities should they become available.
2009 2008 Growth
Rm Rm %
Attributable income 45 45 –
Seafreight comprises Grindrod’s investment in seafreight operations, currently comprising the investment in Ocean Africa Container Lines (Pty) Limited (OACL), which is accounted for as an associate.
OACL is a 49% held joint venture with Safmarine, operating liner services in the southern African region between Nacala in the east and Luanda in the west.
Volumes handled in 2009 declined 16% to 145 698 TEU in line with the contraction in volumes in the southern African region with margins coming under pressure as freight rates declined. Despite the contraction in volumes and rates, OACL maintained profi tability levels in line with 2008 through the negotiation of lower charter rates on vessels, fl eet reductions, improved scheduling integrity and general operational effi ciencies.
Seafreight volumes are expected to remain under pressure in 2010, however, the business is expected to continue to benefi t from the ongoing cost savings initiatives and improved scheduling integrity.
businessoverview commentaries sustainability
annual fi nancialstatements
shareholderinformation

52 p
age
Grin
drod
Lim
ited
/ A
nnua
l Rep
ort 2
009
The Agencies division remains well positioned to continue its prominent position in southern Africa, representing many of the world's largest and most respected shipowners and operators in the world.
2009 2008 Growth
Rm Rm %
Revenue 268 178 51
EBITDA 23 17 35
Operating income 20 15 33
Attributable income 21 25 (16)
Operating margin (%) 7,5 8,4 (11)
Ships Agencies as predicted in the 2008 report, were adversely affected by a sharp decline in both volumes and freight rates, whilst the strengthening of the Rand further contributed to declining revenue on the liner side.
Volumes on certain trade routes declined to such a level that liner operators were forced to amend sailing schedules and in some cases withdraw from services that have been served for many years.
On a positive note the non-liner sections continued the good growth achieved in 2008 and again generated record revenue for the year with a number of new accounts secured, particularly in the coal export market to the Asian sub-continent and on the clearing and forwarding of export bulk cargoes.
Grindrod Travel suffered from the general cutback in business travel caused by the economic conditions, resulting in the closure of the Port Elizabeth branch and the rationalisation of a number of the operations.
The marine and industrial services business, previously known as Unilog, reported a solid performance despite the diffi cult trading conditions with the continued Rand strength making it more economical for many shipowners to source technical servicing and equipment from overseas, particularly Singapore.
Divisional reviews - Divisional reviews - Freight Services Freight Services (continued)(continued)

page 53G
rindrod Limited / A
nnual Report 2009
BUSINESS OVERVIEWThe division operates in fi ve segments as follows:
2009 KEY FEATURES• deposits at record levels;
• growth in earnings; and
• no bad debt.
FINANCIAL OVERVIEW
Income statement2009
Rm2008
RmGrowth
% CommentsRevenue 136 94 45 Interest margin pressure compensated for
by increased fee incomeEBITDA 54 46 17Operating income 52 45 16 Increased operating overheads and general
portfolio provision raised against advances book
Attributable income 36 35 3
Statement of fi nancial positionFixed assets/investments 111 133Bank loans, advances and liquid assets 1 571 1 197Current assets 82 45Net cash including debt 388 539Total assets 2 152 1 914 Equity 333 286Bank deposits 1 770 1 547Other liabilities 49 81Total equity and liabilities 2 152 1 914
Corporate banking
Corporate fi nance
Retail
Asset management
Treasury
Financial Services
Divisional reviews - Divisional reviews - Financial ServicesFinancial Services
businessoverview commentaries sustainability
annual fi nancialstatements
shareholderinformation

54 p
age
Grin
drod
Lim
ited
/ A
nnua
l Rep
ort 2
009
Divisional reviews - Divisional reviews - Financial Services Financial Services (continued)(continued)
FINANCIAL OVERVIEW (continued)
Key fi nancial ratios 2009 2008
Return on ordinary shareholder’s equity (%) 12 12
Capital adequacy ratio (%) 14,2 16,5
Number of employees 72 65
Consolidated Bank profi ts grew 3% year on year, largely attributable to strong fee income from property fi nance, corporate lending, corporate fi nance and treasury activities. Profi t growth before consolidation adjustments and general provision at Bank level was 15%.
The Bank remains well funded and strongly supported by a stable and growing deposit base. Consistently competitive money market rates have contributed to record deposit levels for treasury.
The ongoing conservative approach to credit and liquidity management has also resulted in no bad debts for the Bank. It achieved its aims of growing the lending book, while maintaining a capital adequacy ratio well above the regulatory requirement. The comfortable liquidity surplus, generated from increased deposit levels, will continue to allow the Bank to seek well priced lending.
The Bank has maintained its investment grade rating and its levels of assets under management despite a diffi cult economic climate.
OPERATIONAL REVIEW
Grindrod Bank Limited is a registered fi nancial services provider, regulated by the South African Reserve Bank. Established in 1994, the Bank has matured into a competitive niche bank.
The Bank will continue to acquire strong intellectual capital as it grows its operations in Durban, Cape Town and Johannesburg.
CORPORATE BANKING
The specialist lending division focuses primarily on the commercial and industrial property sectors and offers a range of fl exible fi nancial packages. These include corporate lending, specialised property solutions, trade fi nance and invoice discounting. Deals are evaluated and tailored on a case-by-case basis.
CORPORATE FINANCE
The corporate fi nance division continues to act as the sole southern African representative of M&A International, using this global network of specialists to advise mid-market companies on cross-border acquisition and disposal opportunities.
The division provides clients with the highest standard of independent, objective and innovative corporate fi nance advice and transaction execution services comprising: capital raising; listings and initial purchase offers; mergers and acquisitions; BEE advice; structured fi nance; regulatory compliance and private equity.
RETAIL
With its inclusion in the National Payments System (PASA and BankServ), the retail division offers card-based payment solutions to the South African wage earning population.

page 55G
rindrod Limited / A
nnual Report 2009
ASSET MANAGEMENT
Asset management encompasses three areas of the Bank’s business, namely private clients, institutional fund management and investment products.
Private clients
Grindrod private clients is a complete wealth management service with a successful history of managing the assets and structuring the fi nancial affairs of high net worth individuals, trusts, companies, educational institutions, charities and public organisations.
Institutional fund management
The division also runs institutional portfolios, with a specifi c focus on real estate securities portfolios. Responsibilities include all aspects of fund management and administration, benchmarking, providing clarity on the allocation of real estate securities within a portfolio and mapping investment objectives while determining an acceptable level of risk.
Investment products
Investment products manages a portfolio of unit trusts and structured products, which provide secure, liquid, high-yielding investments for individual and corporate clients.
The Grindrod Investments Trust invests in guaranteed preference shares (underwritten by A1+ rated banks and life assurance houses), providing a regular tax-exempt dividend yield.
The Grindrod Diversifi ed Preference Share Fund invests predominantly in listed preference shares. Capital values are not guaranteed and income is paid in the form of tax-exempt dividends.
The investment products division, housed within Grindrod Asset Management, expanded its product offering with the launch of the Grindrod Global Property Income Fund in April 2009. The South African domiciled unit trust fund invests in real estate assets and has exceeded expectations providing initial investors with a signifi cant return on investment. The division intends to continue its positive growth trend with the addition of new products during the course of 2010.
TREASURY
Treasury supports a variety of the Bank’s functions and products. As well as facilitating deposit growth and administration, it also runs a varied derivatives operation, which accesses broking instruments such as index futures and options, single stock futures and options, bonds, interest rate swaps, forward rate agreements (FRAs) and foreign exchange futures.
businessoverview commentaries sustainability
annual fi nancialstatements
shareholderinformation

pag
e 56
Grin
drod
Lim
ited
/ A
nnua
l Rep
ort 2
009
56 p
age
Grin
drod
Lim
ited
/ A
nnua
l Rep
ort 2
009

page 57G
rindrod Limited / A
nnual Report 2009
businessoverview
businessoverview
annual fi nancialstatements
shareholderinformation

58 p
age
Grin
drod
Lim
ited
/ A
nnua
l Rep
ort 2
009
Sustainabil i ty reviewSustainabil i ty review
Grindrod’s annual sustainability review forms part of the annual report, in line with the revised King Code and report on Governance for South Africa ("King iii"), which calls for greater integration of environmental, social and governance (ESG) considerations into fi nancial management and reporting.
The sustainability review covers Grindrod’s policies, practices and performance relating to its activities in these areas for the fi nancial year ending 31 December 2009 and covers all group company activities. Further reporting boundary considerations specifi c to environmental and climate change performance are outlined in the environmental performance section on page 89.
Certain aspects relevant to a sustainability review, such as the corporate profi le, strategy, governance and risk are not duplicated in this section as these are covered elsewhere in the annual report. The report has drawn on guidelines and criteria developed by the various agencies which set the standard for corporate sustainability (and in particular the Global Reporting Initiative’s G3 guidelines), but has also been adapted to address issues specifi c to the business and industry. A referenced GRI Index is found on page 104.
Signifi cant improvements were made in the measurement and reporting of sustainability key performance indicators (KPIs) across the ESG spectrum in the year under review. Where possible year-on-year trend data has been given, new sustainability KPIs have been introduced and data has been normalised and integrated with fi nancial information. Progress was also made with setting achievable and quantifi able environmental objectives and targets.
The services of an independent verifi cation agency have not been used for this report, although external environmental consultants were engaged to conduct selected internal verifi cation of environmental KPI data collated from Grindrod group companies.
Sustainability performance highlights include:
• re-admission to the JSE's Socially Responsible Investment (SRI) Index;
• strengthening the company’s ethics policies and practices, including the introduction of an Ethics Hotline, managed by Deloitte and Touche, a whistleblower facility introduced in April 2009 and a new fraud management strategy, which is now being rolled out across the group;
• signifi cant progress with the company’s broad-based black economic empowerment (B-BBEE) strategy; and
• improved allocation of company resources in terms of environmental and climate change risk management, including the establishment of the company’s fi rst group environmental and climate change committee (reporting to the CEO), the appointment of a senior-level health, safety and environment (HSE) manager within the Freight Services division; the commencement of an environmental risk audit programme covering all Freight Services division sites and accelerated implementation of ISO 14001 environmental management systems (EMS) within the Shipping and Freight Services divisions – the two divisions with the biggest direct impacts on the environment.
DISTRIBUTION OF WEALTH (%)
2009
G
RINDRO
D
19
10 - 2010years100
32
6
16
29
8
9
2008
G
RINDRO
D
19
10 - 2010years
1006
15
26
85
40
Employee remuneration and service benefi ts
Taxation on income
Providers of share capital
Providers of loan capital
Depreciation
Accumulated profi t

page 59G
rindrod Limited / A
nnual Report 2009
businessoverview commentaries
annual fi nancialstatements
shareholderinformationsustainability
Corporate governanceCorporate governance
INTRODUCTION
The Grindrod group has maintained and enhanced its good corporate governance standards and continues to review current and emerging trends both locally and internationally.
The board subscribes to the principles and code of conduct incorporated in King III and the JSE Limited (JSE) Listings Requirements. An apply or explain approach has been initiated in this report and the full extent of King III requirements will be covered in the 2010 report.
Grindrod has maintained its “good” rating in the 2009 Ernst & Young survey of annual reports of the Top 100 Listed Companies on the JSE.
BOARD OF DIRECTORS
The Grindrod board comprised 16 directors at 31 December 2009 and now stands at 15 following the resignation of N T Y Siwendu. Non-executive directors have a diversity of skills and commercial experience. Six of the eight non-executive directors are considered independent. Details of the non-executive and the executive directors are shown on pages 6 to 9 of this report.
The board meets at least four times a year and additional meetings are held whenever it is considered necessary. Two special board meetings were held in 2009. The responsibilities of the board are set out in a charter and the board is required to annually review its operations against the charter framework. The charter is available on the website. In assuming ultimate responsibility for effective control and leadership of the group the board takes responsibility for the following:
• ensures as far as possible that the group complies with all relevant laws, regulations and codes of business practice;
• defi nes levels of materiality, reserving specifi c powers to itself and delegating other matters to executive management in terms of a limits of authority framework;
• gives direction to all strategic matters and annually approves the group business plan;
• monitors implementation of the business plan by management;
• reviews performance of the various board committees established to assist in the discharge of its duties;
• monitors key risk and performance areas of the group and identifi es non-fi nancial issues relevant to the group;
• determines the policy and models applied to ensure the integrity of:
– risk management and internal controls;– director selection, orientation and evaluation;– executive and general remuneration; – external and internal communications; and
• ensures that there is appropriate succession planning at senior management level.
The quorum for board meetings is eight directors, however, meetings are generally planned well in advance and full attendance is always expected.
The role and function of chairman and chief executive offi cer are separate in the Grindrod group. The chairman,I A J Clark is a non-executive director, but is not considered independent due to his shareholding and unexercised share options which were awarded during his term as chief executive offi cer. The board is of the view that his vast shipping experience and overall business skills overwhelmingly outweigh any issues arising from his perceived lack of independence.
The board is supplied with all relevant information and has unrestricted access to all group information, records, documents and property, which enables the directors to adequately discharge their responsibilities. Information needs are well defi ned and non-executive directors have full access to management and the company secretary.
An induction programme is in place for new directors, which includes an induction book, consultation with each divisional executive and site visits. The cost of attending appropriate external training courses is paid by the company.
At each annual general meeting at least one third of the directors retire by rotation from the board. These retiring directors may offer themselves for re-election. By convention executive directors retire from the board at 60 or 63 years of age depending on their contracts, whilst non-executive directors retire at the annual general meeting following their 70th birthday.
R A Norton’s contract was extended in 2009 at the discretion of the board, after he had reached 70 years of age. He will retire at the forthcoming annual general meeting.
The boards of directors of major local and offshore operating subsidiaries comprise executive directors and senior management. The boards of major offshore operating

60 p
age
Grin
drod
Lim
ited
/ A
nnua
l Rep
ort 2
009
subsidiaries as well as that of Grindrod Bank Limited include independent non-executive directors.
The Grindrod executive committee is responsible for the operational and strategic management of the group. This team is led by the chief executive offi cer.
BOARD ATTENDANCE
The main board met six times during the year and attendance was as follows:
Special Special25 Feb 20 May 29 July 19 Aug 9 Oct 18 Nov
2009 2009 2009 2009 2009 2009H Adams ✓ ✓ � ✓ # �
I A J Clark ✓ ✓ ✓ ✓ ✓ ✓
M R Faku (appointed December 2009) n/a n/a n/a n/a n/a n/aW D Geach ✓ ✓ ✓ ✓ ✓ ✓
I M Groves ✓ � � ✓ # ✓
M J Hankinson (appointed December 2009) n/a n/a n/a n/a n/a n/aJ G Jones ✓ ✓ ✓ ✓ ✓ ✓
T J T McClure ✓ ✓ ✓ ✓ � ✓
R A Norton ✓ ✓ ✓ ✓ ✓ ✓
A K Olivier ✓ ✓ ✓ ✓ ✓ ✓
D A Polkinghorne ✓ ✓ ✓ ✓ ✓ ✓
D A Rennie ✓ ✓ ✓ ✓ ✓ ✓
N T Y Siwendu (resigned January 2010) ✓ ✓ ✓ ✓ ✓ �
A F Stewart ✓ ✓ ✓ ✓ ✓ ✓
L R Stuart-Hill ✓ ✓ ✓ ✓ ✓ ✓
S D M Zungu (appointed December 2009) n/a n/a n/a n/a n/a n/a
# Participation via a conference call facility.
INSIDER TRADINGIn line with best practice and the JSE Listings Requirements, no group director or employee who has price sensitive inside information on the group may deal directly or indirectly in Grindrod securities.
Directors and all group employees are not permitted to deal directly or indirectly in the shares of the company during:
• the period from the end of the interim and annual reporting periods, to the announcement of the interim and annual results; or
• any period when they are aware of any negotiations or details which may affect the share price; or• the time declared as a prohibited period in terms of the JSE Listings Requirements.
The company secretary communicates on a regular basis with the board on the status of dealing in the company’s shares.
Directors are required to notify the company secretary in writing immediately following any transaction involving the company’s shares. The trades are timeously disclosed to the JSE and they are tabled at the following board meeting.
SUCCESSION PLANNINGThe nomination committee annually reviews the board’s performance, structure, size and composition and makes recommendations to the board on succession, training and replacements.
Corporate governance Corporate governance (continued)(continued)

page 61G
rindrod Limited / A
nnual Report 2009
businessoverview commentaries
annual fi nancialstatements
shareholderinformationsustainability
DIRECTORS' INDEPENDENCEIn line with best practice, more than half the non-executive directors are independent. The remuneration/nomination committee reviewed the composition of the board and particularly the composition of non-executive directors and concluded that H Adams, W D Geach, M J Hankinson, I M Groves, R A Norton and S D M Zungu are independent non-executive directors of Grindrod as contemplated in sub-section 2.4.3 of the King Code of Corporate Practices and Conduct and paragraph 3.84(f) of the JSE Listings Requirements.
M R Faku represents the interest of the B-BBEE partners of Grindrod (South Africa) (Pty) Limited, which interest has the potential to compromise his independence. Reference is made to the chairman's status on page 59.
A brief curriculum vitae of each director of the company is published on pages 6 to 9.
BOARD COMMITTEESThe board has an executive committee, audit committee and a remuneration/nomination committee. Members and the chairmen of these committees are appointed by the board. The board has no separate risk committee, as this function is dealt with by the board as a whole with an annual meeting dedicated to a group risk assessment and quarterly risk updates.
For the purposes of good governance and in compliance with South African Reserve Bank requirements, Grindrod Bank has its own board committees which include:
• Audit and Compliance;• Remuneration;• Directors' Affairs;• Risk and Capital Management;• Credit Risk; and• Asset and Liability.
EXECUTIVE COMMITTEE
The executive committee comprises the seven executive directors and J B McIlmurray.
The board had delegated a wide range of matters relating to the company’s management to the executive committee including:
• fi nancial, strategic, operational, governance, risk and functional issues;
• formulation of the group strategy and policy; and• alignment of group initiatives.
The committee held four formal meetings during the year, with additional sessions convened to focus on strategy, the development of key management and succession planning. The committee assists the chief executive offi cer in guiding and managing the overall direction of the business of the company, monitors business performance and acts as a medium of communication and co-ordination between business units, group companies and the board. The executive committee also held a two-day strategic planning meeting with key operational management during 2009.
AUDIT COMMITTEE
The group audit committee performs the role of reviewing internal controls, risk management procedures and fi nancial results. I M Groves, an independent non-executive of the group, serves as chairman of the committee. The audit committee fulfi ls its responsibility in line with specifi c terms of reference and in terms of section 270A (f) of the Corporate Laws Amendment Act. A full audit committee report is set out on pages 65 to 66. The internal and external auditors have full access to the committee.
The audit committee met three times during the year and attendance was as follows:
23 Feb 19 June 18 Aug
2009 2009 2009
I M Groves (chairman) ✓ ✓ �
R A Norton ✓ ✓ ✓
W D Geach (appointed June 2009)
n/a ✓ ✓
The committee will in the future be elected by members at the annual general meeting in terms of the requirements of the new Companies Act.
REMUNERATION/NOMINATION COMMITTEE
The board has a remuneration/nomination committee to assist in governance matters related to executive remuneration, succession planning and identifi cation of suitable candidates to serve on the board. The chairman, R A Norton and members, who are all non-executive directors, are appointed by the board. The chief executive offi cer is not a member of the committee but attends meetings to provide feedback on individual performances and other relevant information.
The committee has formal terms of reference approved by the board and is responsible for the assessment and

62 p
age
Grin
drod
Lim
ited
/ A
nnua
l Rep
ort 2
009
approval of a broad remuneration strategy for the group. In particular, it reviews and determines the remuneration packages of the members of the executive committee, the fees for the non-executive directors and recommends the granting of cash-based notional share options to executive directors and senior employees. These details, together with an overview of remuneration and incentive philosophies, is set out in the remuneration report on page 69.
The committee is also responsible for identifying and nominating candidates for approval of the board as additional directors or to fi ll any board vacancies when they arise, taking skills, experience and demographics into account. In addition, the committee recommends directors, who retire in terms of the company’s articles of association, for re-election.
The remuneration/nomination committee met four times during the year and attendance was as follows:
24 Feb 20 May 19 Aug 18 Nov
2009 2009 2009 2009
R A Norton (chairman)
✓ ✓ ✓ ✓
I A J Clark ✓ ✓ ✓ ✓
I M Groves ✓ ✓ ✓ ✓
RISK MANAGEMENT
The board has not appointed a separate risk committee, however, it takes full responsibility for risk management. The full board is responsible for risk management and for implementing an effective process to identify risk, measure the potential impacts and to set risk tolerance levels. Further to the quarterly assessments of risk at board meetings, a separate annual meeting of the board is held which focuses on the review of the group risk management process and approves the group risk management plan for the following year.
RELATIONS WITH STAKEHOLDERSThe group communicates its strategy, performance and vision through regular presentations to investors, analysts, employees and other stakeholders. In addition, management regularly meet with major institutional investors and analysts. The group's website www.grindrod.co.za is also used for this purpose.
The 2009 interim results were presented in Johannesburg and Cape Town in August 2009 and the fi nal results were presented to the investment community in Johannesburg, Durban and Cape Town during February 2010.
CORPORATE SPONSORGrindrod Bank Limited acts as the company’s sponsors in compliance with the JSE Listings Requirements. In the case of major corporate actions, the services of an independent sponsor will be engaged.
COMPANY SECRETARYThe board considers the company secretary to be qualifi ed to perform his duties in accordance with applicable legislation and to be fi t and proper for the position. All directors have access to the advice and services of the company secretary who ensures compliance with applicable procedures and legislation.
GOING CONCERNThe directors are responsible for overseeing the preparation and the fi nal approval of the group interim and annual fi nancial statements. The auditors are responsible for auditing the fi nancial statements and providing their opinion thereon. The directors believe that suitable accounting policies, consistently applied and supported by reasonable and prudent judgements and estimates, have been used in the preparation of the fi nancial statements, which fairly present the state of the group. Appropriate accounting standards have been applied and adequate accounting records maintained. The going concern basis was adopted in preparing the annual fi nancial statements. The directors have no reason to believe that the group will not continue to be a going concern.
INTERNAL CONTROLSThe board is responsible for the group’s internal fi nancial and operational control systems. The internal control systems are designed to provide reasonable assurance against material misstatement and loss.
Corporate governance Corporate governance (continued)(continued)

page 63G
rindrod Limited / A
nnual Report 2009
businessoverview commentaries
annual fi nancialstatements
shareholderinformationsustainability
The principal features of the group’s internal fi nancial controls are covered in the fi nancial director’s report on page 22.
INTERNAL AUDIT
King III has re-affi rmed internal audit as a strategic function and an integral component of an organisation’s corporate governance framework. The Grindrod group is committed to good corporate governance and acknowledges the important role of an independent internal audit function in assisting the audit committee in discharging its responsibilities.
The Grindrod internal audit is mandated by and functions in terms of an approved charter which describes its purpose, authority and responsibilities. All internal audit activities are performed in compliance with International Internal Audit practice and the methodology and standards required by the SA Institute of Internal Auditors.
The primary objective of the Grindrod internal audit function is to assist management and the board in the effective execution of their responsibilities. This is achieved by providing reasonable assurance with regard to the effectiveness and adequacy of the controls in place to manage the risks facing the organisation.
A risk-based internal audit approved is fundamental in providing management and the board, via the audit committee, with an assessment of the adequacy, effi ciency and effectiveness of the control, governance and risk management processes.
Internal audit coverage plans are prepared annually together with management and approved by the audit committee. The methodology and risk-based approach used ensures that all businesses within the group receive adequate coverage and includes:
• generic coverage, consisting of the follow up of previous audit reports and management letters issued by external auditors, the completion of taxation, fraud and internal control risk assessments, fraud health checks and compliance with the group standards policy document and group approval framework;
• risk-based coverage whereby all businesses are included at least once during a three-year cycle and incorporating all the signifi cant auditable risks;
• new acquisitions and any businesses where senior management changes have occurred;
• capital project reviews, including the tendering process, procurement, expenditure, project management, fi nancial reporting and compliance with group approval framework;
• IT governance and post implementation reviews, where there has been a change or revision of systems;
• ethics line reporting and monitoring; and
• ad hoc reviews where there is a change in the risk profi le of any business or operation.
External service providers are used for certain specialist reviews including taxation, information technology and any other assignment requiring a particular skills set.
INFORMATION TECHNOLOGY GOVERNANCE
Information technology (IT) governance defi ned by King III focuses on four major areas:
• strategic alignment with business, including sustainability and “green IT” principles;
• value delivery of IT services and systems;
• risk management to safeguard IT assets and assure business continuity; and
• resource management optimising IT knowledge and infrastructure.
Grindrod has implemented a number of projects to achieve compliance and maintain high standards of corporate governance, such as:
• development and execution of IT strategies defi ned by the business;
• alignment of systems throughout the group to ensure ease of operation, improved reporting and ability to share knowledge;
• centralisation of IT facilities onto a large virtual system that has excellent properties for achieving environmental guidelines through reduced use of power and air conditioning; and
• well documented and tested disaster recovery plans.
There are a number of projects planned in 2010, which will ensure that the group’s IT systems meet and exceed basic requirements of governance and are aligned to operational strategic objectives.

64 p
age
Grin
drod
Lim
ited
/ A
nnua
l Rep
ort 2
009
Corporate governance Corporate governance (continued)(continued)
ETHICSThe group is committed to providing excellent services to customers and deem that a high standard of ethical behaviour is paramount to achieving this objective. The group’s Code of Ethics is endorsed by the Ethics Institute of South Africa, of which the company is an organisational member. (If any person has any questions, they can contact Ethics SA directly on telephone 012 342 2799.) The code is designed to raise ethical awareness, act as a guide in day-to-day decisions and to help assure customers and other stakeholders of the integrity of the group companies with which they deal. The code is to be reviewed and updated in 2010.
An important element of the induction process is to communicate to new employees the group’s values, standards and compliance procedures. The group’s core values include respect for company assets and the environment, operating with integrity, acting with professionalism in our service delivery to our customers, being fair in the way we treat people and accountability, which requires people to take full ownership of actions taken.
Employees or others can report unethical or risky behaviour to the custodian of the Grindrod Code of Ethics, the Grindrod Ethics Offi cer.
Postal address: PO Box 1, Durban, 4000
Telephone: +27 31 365 9116
E-mail: [email protected]
A whistleblower service was introduced in April 2009 and followed up with fraud awareness presentations across the spectrum of group activities. The service, Tip-offs Anonymous®, involves the professional services fi rm of Deloitte and Touche and is therefore independent of Grindrod.
Postal address: Tip-offs Anonymous, Freepost KZN 138, Umhlanga Rocks, 4320
Telephone: 0800 21 31 18 or +27 31 571 5329
E-mail: [email protected]
Website: www.tip-offs.com
ACCESS TO INFORMATIONGrindrod has complied with the requirements of the Promotion of Access to Information Act of 2000. The corporate manual is available on the website www.grindrod.co.za.

page 65G
rindrod Limited / A
nnual Report 2009
businessoverview commentaries
annual fi nancialstatements
shareholderinformationsustainability
REPORT IN TERMS OF SECTION 270A(F) OF THE SOUTH AFRICAN COMPANIES ACT, 1973, AS AMENDEDIn addition to having specifi c statutory responsibilities, the audit committee is a subcommittee of the board of directors. It assists the board through advising and making recommendations on fi nancial reporting, internal fi nancial controls, external and internal audit functions and statutory and regulatory compliance of the company.
TERMS OF REFERENCE
The audit committee has adopted formal terms of reference that have been approved by the board of directors and has executed its duties during the past fi nancial year in accordance with these terms of reference.
CompositionThe committee consists of three independent non-executive directors.
At 31 December 2009, the audit committee comprised:
Name Qualifi cations Appointed
I M Groves (chairman) CA(SA) Feb 1998
R A Norton BA, MA, FIBSA Aug 1999
W D Geach BA LLB, MCom, CA(SA), FCIS
Jun 2009
The chairman, chief executive offi cer, the group fi nancial director and representatives from the external auditors also attend the audit committee meetings. The internal and external auditors have unrestricted access to the audit committee. The group secretary serves as secretary to the committee.
MEETINGS
The audit committee held three meetings during the period. Attendance at these meetings is refl ected on page 61 of this report.
STATUTORY DUTIES
In the execution of its statutory duties during the past fi nancial year, the audit committee:
• nominated for appointment as auditor, Deloitte and Touche who, in our opinion, is independent of the company, and Andrew Waller as the responsible partner;
• determined the fees paid to Deloitte and Touche as disclosed in the notes of the annual report;
• determined Deloitte and Touche’s terms of engagement;
• believes that the appointment of Deloitte and Touche complies with the relevant provisions of the South African Companies Act and King III;
• approved all non-audit service contracts with Deloitte and Touche;
• received no complaints relating to the accounting practices and internal audit of the company, the content or auditing of its fi nancial statements, the internal fi nancial controls of the company and any other related matters;
• made submissions to the board on matters concerning the company’s accounting policies, fi nancial control, records and reporting; and
• concurred with the adoption of the going concern premise in the preparation of the fi nancial statements.
DELEGATED DUTIES
Internal fi nancial controls and internal audit
The committee has:
• reviewed and recommended the internal audit charter for approval;
• evaluated the independence, effectiveness and performance of the internal audit function/department and compliance with its mandate;
• reviewed the effectiveness of the company’s system of internal fi nancial control including receiving assurance from management, internal audit and external audit;
• reviewed signifi cant issues raised by the internal audit process; and
• reviewed policies and procedures for preventing and detecting fraud.
Based on the processes and assurances obtained, we believe that the internal fi nancial controls are effective.
The internal audit manager had unrestricted access to the audit committee chairperson.
REGULATORY COMPLIANCE
The audit committee has complied with all applicable legal, regulatory and other responsibilities.
Audit committee reportAudit committee report

66 p
age
Grin
drod
Lim
ited
/ A
nnua
l Rep
ort 2
009
EXTERNAL AUDIT
The committee has considered the independence of Deloitte and Touche and is satisfi ed that they were independent throughout the year. To fulfi l this responsibility, we reviewed:
• changes in key external audit staff in Deloitte and Touche’s audit plan;
• the arrangements for day-to-day management of the audit relationship;
• a report from Deloitte and Touche describing their policy to identify, report and manage any confl icts of interest; and
• the overall extent of non-audit services provided by Deloitte and Touche.
To assess the effectiveness of the external auditors, we reviewed:
• Deloitte and Touche’s fulfi lment of the agreed audit plan and variations from the plan; and
• the robustness and perceptiveness of Deloitte and Touche in their handling of the key accounting and audit judgements.
With regard to the oversight of the external audit process, we received:
• the areas of responsibility, associated duties and scope of the audit;
• Deloitte and Touche’s overall work plan for the year;
• major issues that arose during the audit and their resolution;
• key accounting and audit judgements;
• the levels of errors identifi ed during the audit; and
• recommendations made by Deloitte and Touche and management's responses to issues raised and the adequacy of management’s response.
Based on our satisfaction with the results of the activities outlined above, we have recommended to the board that Deloitte and Touche should be reappointed for 2010.
FINANCE FUNCTION
We believe that Anthony Fraser Stewart, the group fi nancial director, possesses the appropriate expertise and experience to meet his responsibilities in that position as required by the JSE.
We are satisfi ed with the:
• expertise and adequacy of resources within the fi nance function; and
• experience of the divisional fi nancial managers.
Based on the processes and assurance obtained, we believe that the accounting practices are effective.
FINANCIAL STATEMENTS
The audit committee recommends adoption of the annual fi nancial statements by the board.
On behalf of the audit committee.
I M GrovesChairman
Durban15 February 2010
Audit committee report Audit committee report (continued)(continued)

page 67G
rindrod Limited / A
nnual Report 2009
businessoverview commentaries
annual fi nancialstatements
shareholderinformationsustainability
Remuneration reportRemuneration report
REMUNERATION PHILOSOPHY AND POLICYGrindrod’s philosophy is to set appropriate remuneration levels to attract, retain and motivate competent, high performing employees that will successfully drive the achievement of its strategic objectives and grow sustainable shareholder value.
The supporting group policy ensures that rewards are commensurate with the contribution to the group’s performance in line with strategy and that this reward is competitive and appropriate as gauged against relevant local and international market benchmarks.
The executive and key managers' remuneration is therefore structured to include guaranteed remuneration and both short-term and long-term incentives to drive performance. The level of guaranteed remuneration aims to competitively attract high calibre leadership. The short-term incentive component rewards directors and management for achieving key performance indicator targets and/or exceptional performance and the long-term share incentive schemes serve to align directors and senior management to shareholder interests and act as a retention mechanism.
SENIOR MANAGEMENT REMUNERATION
The group aims to adhere to the broad guidelines of executive remuneration set out in King III. The overall principles applied consist of the following:
• establish appropriate and competitive balance between fi xed and variable remuneration structure to achieve performance excellence;
• establish a great performance oriented culture with a pay for performance approach that aligns with sustainable shareholder value;
• appropriately leverage market and industry benchmarks to ensure competitive remuneration aligned to market median; and
• drive sustainable business results through short-term and long-term performance driven incentives.
Remuneration consists of the following elements:
• the group has adopted a total cost of employment (TCOE) approach for salaried employees, replacing the cash plus benefi ts approach. The TCOE is guaranteed and includes the cost of a company expensed motor vehicle or travel allowance, retirement fund contributions, medical aid premiums and death and disability insurance;
• annual incentive bonus; and
• cash-based, share price linked performance bonus scheme (replaced old scheme which is still partly in place).
The incentive schemes reward exceptional performance and are structured around specifi c individual objectives.
The remuneration/nomination committee considers the remuneration of members of the executive committee.
Senior management’s terms and conditions include:
• notice periods are established to ensure continuity of operations:
– the group chief executive offi cer is on a twelve-month notice period;
– members of the executive have notice periods of six months;
– other key senior management are on three months' notice with the balance of management on a thirty-day notice period; and
• there are no deferred compensation plans.
GUARANTEED REMUNERATION
The remuneration structure is reviewed in February of each year by the remuneration/nomination committee. The group human resources function develops an advisory report including relevant industry practice, market survey data on remuneration for companies of similar size and profi le and guidance from credible remuneration consultants. This information is provided on page 73.
ANNUAL INCENTIVE SCHEME
All executives participate in the group’s executive incentive bonus scheme. The bonus is contractual and is paid annually subject to the achievement of group and divisional targets combined with key performance indicators agreed to by the chief executive and the remuneration committee.
In terms of the current scheme, executives may earn up to 100% of their total annual guaranteed remuneration. In respect of the year under review the company did not achieve its fi nancial targets and the average bonus paid represented 66% of TCOE. Employees in the Trading and certain sectors of the Financial Services businesses are incentivised through profi t sharing arrangements. Other senior management can generally earn short-term incentives of up to a maximum of 40% of their total annual guaranteed remuneration.

68 p
age
Grin
drod
Lim
ited
/ A
nnua
l Rep
ort 2
009
SHARE INCENTIVE SCHEMES
Share option scheme
Grindrod has a share option scheme as an incentive to the senior management employees of the group. At the annual general meeting in May 2009, it was resolved that the unissued shares in the share capital of the company reserved for the purpose of the share option scheme continue to be placed under the control of the directors. The aggregate number of shares which are reserved for the scheme, together with the shares under option, is90 000 000. These shares represent 3,3% of the authorised share capital and approximately 19,8% of the issued share capital as at 31 December 2009, excluding treasury shares.
After taking into account options which have lapsed and options withdrawn in respect of retired employees and employees who have left the group, the balance of the options which have been granted is 55 710 000 shares (equivalent to 12,3% of the issued share capital), of which 50 210 000 shares have been exercised and issued, leaving 5 500 000 shares (equivalent to 1,2% of the issued share capital excluding treasury shares) still under option in terms of the scheme at 31 December 2009. The options are exercisable at the market prices ruling on the dates the options were granted and vary from 128 cents to 1 251 cents per ordinary share and at varying dates before November 2015.
3 950 000 ordinary shares were allotted during the year in terms of the scheme for a consideration of R12 708 500.
Details of share options granted but not exercised are:
Date option granted Expiry date
Number of options
Subscription price (cents)
04.02.2003 04.02.2013 300 000 12826.11.2003 26.11.2013 1 450 000 23927.05.2004 27.05.2014 200 000 3823.11.2005 23.11.2015 3 550 000 1 251
5 500 000
This scheme has been closed with no new awards since 2005.
Share price linked option scheme
The group share price linked share option scheme was introduced in 2007 for executives and other key senior managers in place of the aforementioned share option scheme.
Whilst the rules of the new scheme are modelled on those of the option scheme, the important difference is that options under the new scheme are “cash settled” rather than “equity
settled”. One-third of the options become vested on each of the third, fourth and fi fth anniversaries of the relevant grant date. The options do not have an expiry date beyond the vesting date.
In terms of the rules of the new scheme, the grant price of an option is determined on the same basis as the settlement price, i.e. the average of the closing price of the previous seven trading days. The cash settlement amount of an option is equal to the difference between the weighted average price of Grindrod shares on the date upon which an option vests and the grant price. The participants will receive the amount due as a cash bonus.
The advantage to the company in adopting the new scheme include:
• no necessity to issue new shares when options are exercised, i.e. no share dilution;
• ease of administration; and
• tax effectiveness of the expense in the hands of the company.
The remuneration/nomination committee recommends the granting of options for approval by the board of Grindrod Limited.
Options granted to executive directors and senior management as at 31 December 2009 comprise:
Date option granted
Number of options
Price(cents)
2007 1 475 000 1 6252007 1 148 000 2 4002008 2 348 600 2 3502008 93 000 2 8222009 3 749 000 1 430
8 813 600
None of the options vested during 2009.
Grindrod Bank share price linked option scheme
In 2009, a Grindrod Bank share price linked scheme was introduced for Grindrod Bank executives and key employees. The scheme operates on the same principle as the Grindrod Limited share price linked option scheme, with the exception of the share price being based on a combined net asset value of Grindrod Bank and related fi nancial services entities as opposed to the Grindrod listed price.
NON-EXECUTIVE DIRECTORS’ REMUNERATION
The level of fees paid to non-executive directors is reviewed by the remuneration/nomination committee on an annual basis.
Remuneration report Remuneration report (continued)(continued)

page 69G
rindrod Limited / A
nnual Report 2009
businessoverview commentaries
annual fi nancialstatements
shareholderinformationsustainability
The recommendations are submitted to the Grindrod board for consideration and the fees are approved in advance by the shareholders at the annual general meeting. Various market surveys are utilised to determine the remuneration levels and reference is made to the fees paid by comparable listed companies.
Non-executive directors do not participate in the group’s incentive bonus plan or share option scheme, however, I A J Clark retired on 31 December 2006 and continues to hold options granted during his tenure as chief executive offi cer.
DIRECTORS’ EMOLUMENTS
The remuneration paid to directors of the company, whilst in offi ce, during the year ended 31 December 2009 is as follows:
Directors’fees
R000
Com-mittee
feesR000
Basicremu-
nerationR000
Per-formance
bonusR000
Retirement,medical
and otherbenefi ts
R000
ShareoptiongainsR000
Total2009R000
Total2008R000
Executive directorsJ G Jones 245 1 828 76 3 648 5 797 7 174T J T McClure 2 181 86 5 251 7 518 39 857A K Olivier 3 333 3 090 160 2 061 8 644 5 615D A Rennie 321 2 660 122 3 614 6 717 10 920A F Stewart 1 843 2 371 793 8 989 13 996 15 247L R Stuart-Hill 364 2 314 79 5 430 8 187 6 321
Non-executive directorsI A J Clark 300 33 84 7 179 7 596 4 702H Adams 128 128 113W D Geach* 179 22 201 51I M Groves 128 109 43 280 247S M Gounden (resigned May 2008)
52
N E Mtshotshisa(deceased February 2008)
15
R A Norton 128 75 203 177N T Y Siwendu (resigned January 2010)
128 25 153 76
From the company 59 420 90 567
Executive directorsJ G Jones 1 347 386 1 733T J T McClure 3 284 29 791** 465 33 540D A Polkinghorne 1 704 1 677 351 3 732 3 488D A Rennie 1 803 634 2 437A K Olivier*** 1 154 1 224 120 2 498 2 338L R Stuart-Hill 1 991 445 2 436
Non-executive directorsI A J Clark 68 11 79 71I M Groves 45 68 113 102R A Norton 45 105 150 135N T Y Siwendu (resigned January 2010)
70 70
From the subsidiaries 46 788 6 134Total emoluments 106 208 96 701
* Include fees paid for the period June to December 2008.** Part settlement of a profit share agreement which was entered into when acquiring Island View Shipping (2008: R32 465 244).*** Includes remuneration paid in terms of contract of employment with group company in United Kingdom.

70 p
age
Grin
drod
Lim
ited
/ A
nnua
l Rep
ort 2
009
Remuneration report Remuneration report (continued)(continued)
SHARE OPTION SCHEME AND SHARE PRICE LINKED OPTION SCHEMEDetails of share options and share price linked option shares granted to directors and not exercised are set out below. Details of these two schemes are shown on page 68.
SHARE OPTION SCHEME
DirectorOptions at
01.01.2009
Optionsexercisedduring the
year
Priceat whichoptions
exercised(cents)
Options at31.12.2009
Optionprice
(cents)Vesting
datesExpirydates
I A J Clark 100 000 100 000 110600 000 400 000 239 200 000 239 26.11.2010 26.11.2013300 000 100 000 380 100 000 380 27.05.2010 27.05.2014
100 000 380 27.05.2011 27.05.2014750 000 150 000 1 251 150 000 1 251 23.11.2009 23.11.2015
150 000 1 251 23.11.2010 23.11.2015150 000 1 251 23.11.2011 23.11.2015150 000 1 251 23.11.2012 23.11.2015
J G Jones 450 000 300 000 239 150 000 239 26.11.2010 26.11.2013500 000 100 000 1 251 23.11.2008 23.11.2015
100 000 1 251 23.11.2009 23.11.2015100 000 1 251 23.11.2010 23.11.2015100 000 1 251 23.11.2011 23.11.2015100 000 1 251 23.11.2012 23.11.2015
T J T McClure 600 000 400 000 239 200 000 239 26.11.2010 26.11.2013500 000 100 000 1 251 100 000 1 251 23.11.2009 23.11.2015
100 000 1 251 23.11.2010 23.11.2015100 000 1 251 23.11.2011 23.11.2015100 000 1 251 23.11.2012 23.11.2015
A K Olivier 600 000 200 000 239 200 000 239 26.11.2009 26.11.2013200 000 239 26.11.2010 26.11.2013
500 000 100 000 1 251 100 000 1 251 23.11.2009 23.11.2015100 000 1 251 23.11.2010 23.11.2015100 000 1 251 23.11.2011 23.11.2015100 000 1 251 23.11.2012 23.11.2015
D A Rennie 450 000 300 000 239 150 000 239 26.11.2010 26.11.2013500 000 100 000 1 251 23.11.2008 23.11.2015
100 000 1 251 23.11.2009 23.11.2015100 000 1 251 23.11.2010 23.11.2015100 000 1 251 23.11.2011 23.11.2015100 000 1 251 23.11.2012 23.11.2015
A F Stewart 320 000 320 000 110450 000 300 000 239 150 000 239 26.11.2010 26.11.2013500 000 100 000 1 251 23.11.2008 23.11.2015
100 000 1 251 23.11.2009 23.11.2015100 000 1 251 23.11.2010 23.11.2015100 000 1 251 23.11.2011 23.11.2015100 000 1 251 23.11.2012 23.11.2015
L R Stuart-Hill 600 000 400 000 239 200 000 239 26.11.2010 26.11.2013500 000 100 000 1 251 100 000 1 251 23.11.2009 23.11.2015
100 000 1 251 23.11.2010 23.11.2015100 000 1 251 23.11.2011 23.11.2015100 000 1 251 23.11.2012 23.11.2015
8 220 000 3 270 000 4 950 000

page 71G
rindrod Limited / A
nnual Report 2009
businessoverview commentaries
annual fi nancialstatements
shareholderinformationsustainability
SHARE PRICE LINKED OPTION SCHEME
DirectorOptions at
01.01.2009Options grantedduring the year
Options at31.12.2009
Option price(cents)
Vestingdates
A K Olivier 1 036 000 283 300 1 625 01.03.2010283 300 1 625 01.03.2011283 400 1 625 01.03.201262 000 2 350 01.03.201162 000 2 350 01.03.201262 000 2 350 01.03.2013
324 000 108 000 1 430 01.03.2012108 000 1 430 01.03.2013
108 000 1 430 01.03.2014A F Stewart 144 000 16 600 1 625 01.03.2010
16 600 1 625 01.03.201116 800 1 625 01.03.201231 300 2 350 01.03.201131 300 2 350 01.03.201231 400 2 350 01.03.2013
204 000 68 000 1 430 01.03.201268 000 1 430 01.03.201368 000 1 430 01.03.2014
L R Stuart-Hill 223 000 45 000 1 625 01.03.201045 000 1 625 01.03.201145 000 1 625 01.03.201229 300 2 350 01.03.201129 300 2 350 01.03.201229 400 2 350 01.03.2013
221 000 73 600 1 430 01.03.201273 600 1 430 01.03.201373 800 1 430 01.03.2014
T J T McClure 220 000 43 300 1 625 01.03.201043 300 1 625 01.03.201143 400 1 625 01.03.201230 000 2 350 01.03.201130 000 2 350 01.03.201230 000 2 350 01.03.2013
200 000 66 600 1 430 01.03.201266 600 1 430 01.03.201366 800 1 430 01.03.2014
D A Rennie 239 000 51 600 1 625 01.03.201051 600 1 625 01.03.201151 800 1 625 01.03.201228 000 2 350 01.03.201128 000 2 350 01.03.201228 000 2 350 01.03.2013
206 000 68 600 1 430 01.03.201268 600 1 430 01.03.201368 800 1 430 01.03.2014

72 p
age
Grin
drod
Lim
ited
/ A
nnua
l Rep
ort 2
009
Remuneration report Remuneration report (continued)(continued)
DirectorOptions at
01.01.2009Options grantedduring the year
Options at31.12.2009
Option price(cents)
Vestingdates
J G Jones 53 000 17 600 2 350 01.03.201117 600 2 350 01.03.201217 800 2 350 01.03.2013
167 000 55 600 1 430 01.03.201255 600 1 430 01.03.201355 800 1 430 01.03.2014
D A Polkinghorne 285 000 51 600 1 625 01.03.201051 600 1 625 01.03.201151 800 1 625 01.03.201243 000 2 350 01.03.201143 000 2 350 01.03.201244 400 2 350 01.03.2013
2 200 000 1 322 000 3 522 400
GRINDROD BANK LIMITED SHARE PRICE LINKED OPTION SCHEME
Options at Options granted Options at Option price VestingDirector 01.01.2009 during the year 31.12.2009 (cents) dates
D A Polkinghorne 447 000 149 000 466 01.03.2012149 000 466 01.03.2013149 000 466 01.03.2014
447 000 447 000
DIRECTORS’ INTERESTS IN THE COMPANYAt 31 December 2009, the directors held ordinary shares in the company as set out below:
Director2009
Benefi cial indirect2008
Benefi cial indirect
H Adams 100 000I A J Clark 5 119 900 12 369 900I M Groves 1 500 000 1 950 000M J Hankinson* 5 000 n/aT J T McClure(1) 1 410 000 1 910 000A K Olivier 1 634 250 2 334 250D A Rennie 600 000 1 020 000A F Stewart(2) 980 000 1 090 000L R Stuart-Hill(3) 628 500 1 987 195
Aggregate 11 877 650 22 761 345
* Appointed 15 December 2009.
SHARE PRICE LINKED OPTION SCHEME

page 73G
rindrod Limited / A
nnual Report 2009
businessoverview commentaries
annual fi nancialstatements
shareholderinformationsustainability
Zero cost collar options have been entered into in respect of the following shares included in the shareholdings on page 72:
Number of shares Put strike (R) Call strike (R) Maturity date
(1) 300 000 14,65 18,58 27 June 2011(2) 510 000 12,65 25,97 24 November 2010 320 000 15,57 25,38 30 November 2011(3) 500 000 23,09 28,59 18 March 2010
At 31 December 2009, the directors held preference shares in the company as set out below:
2009 2008Benefi cial Non-benefi cial Benefi cial Non-benefi cial
Director indirect indirect indirect indirect
I A J Clark 205 931 205 931I M Groves 15 000 15 000J G Jones 20 000 4 000 10 000 4 000D A Rennie 10 000 10 000L R Stuart-Hill 13 800 8 250T J T McClure 67 000 67 000
Aggregate 321 731 14 000 306 181 14 000
There were no direct benefi cial holdings in the current or prior year.
These ordinary and preference shareholdings were unchanged at 17 February 2010.
GENERAL REMUNERATIONGeneral remuneration levels for the group and respective companies are determined by market surveys for the particular industry sector in which they operate so as to maintain cost effective and competitive parity. These levels of basic remuneration are reviewed and as necessary revised annually.
Across the group, employment positions are evaluated using recognised evaluation systems in order to ensure the remuneration of a job is aligned to the relative value as compared to other jobs. Salary scales are determined using a unifi ed pay structure which identifi es a minimum and maximum range for each position and are reviewed annually. Movement along the salary scale within a job grade is driven by individual performance.
The group’s salary/wage bill including incentive bonuses and profi t share incentives for the reporting year and for 2008 per occupation level for temporary and permanent staff is tabled below:
R000 2009 2008Occupational level Permanent Temporary Total Permanent Temporary TotalTop management 92 592 18 421 111 013 112 061 6 615 118 676Senior management 194 026 13 014 207 040 281 091 9 535 290 626Middle management 178 693 16 338 195 031 113 741 6 046 119 787Skilled 242 017 12 359 254 376 216 809 8 989 225 798Semi-skilled 252 414 28 621 281 035 144 303 31 280 175 583Least skilled 29 996 12 798 42 794 52 098 2 946 55 044Total 989 738 101 551 1 091 289 920 103 65 411 985 514
The total payroll increased by R105 million for the year in comparison to 2008.

74 p
age
Grin
drod
Lim
ited
/ A
nnua
l Rep
ort 2
009
Risk managementRisk management
INTRODUCTIONThe board approves the group risk strategy policies in consultation with the executive directors and senior management and decides the group’s appetite or tolerance for the risks Grindrod will or will not take in the pursuit of its goals and objectives.
The board is responsible for risk management and for implementing an effective process to identify risk, measure its potential impact and initiate whatever is necessary to proactively manage such risks. A separate annual meeting of the board is held which focuses on the review of the group risk management process and quarterly risk management updates are tabled at board meetings.
Executive and operational management are accountable to the board for designing, implementing and monitoring the process of risk management and integrating it into the day-to-day activities of the group. Group risk management facilitates risk reviews at all subsidiary and joint venture companies. These include reviews of all risk areas, legal compliance, contracts and insurance policies. Matrices are compiled setting out the risks identifi ed at the risk reviews and grading these risks into high, medium and low risks. The controls in place are required to manage these risks and are detailed in this document. The internal audit function follows a risk based approach using the matrices to formulate audit coverage plans.
INSURANCEInsurance is only placed with reputable underwriters and brokers. Group insurance cover includes hull and
machinery, war risk, P&I, freight demurrage and defence, charterers liability, purchasers interest, cargo liability and comprehensive non-marine insurances.
NEW RISKSThe increasing diversity of operations has necessitated continual development and integration of risk management processes. Particular attention has been paid to new risks such as counterparty, piracy and fraud risks.
KING III CODE AND REPORT ON GOVERNANCEThe revised King Code and Report on Governance for South Africa ("King III") came into effect on 1 March 2010. The board has taken cognisance of King III in the context of, inter alia, risk management and has commissioned a process to ensure the group complies with all the appropriate provisions of King III in the forthcoming year. Grindrod will more formally address King III in its 2010 annual report.
For the fi rst time, King III has addressed the issue of corporate governance for information technology (IT). In the context of risk management, IT risks are required to form part of the company’s risk management and IT management should regularly demonstrate to the board that the company has adequate “business resilience” arrangements in place to recover from disaster. As reported below, Grindrod has centralised IT systems which are backed up with a disaster recovery plan, while the group’s wide area network communications platform is serviced by a fully backed up, outsourced virtual private network (VPN).

page 75G
rindrod Limited / A
nnual Report 2009
businessoverview commentaries
annual fi nancialstatements
shareholderinformationsustainability
The following risks have been identifi ed as signifi cant to the group:
Risk type Management of risk
STRATEGIC RISK • understanding the markets they operate in – sectorally, geographically and in global or regional business culture terms;
• obtaining information as full as is possible about the market situation and the market cycle;
• combined “through the cycle" experience base of Grindrod’s executive and management team;
• using an established supporting expertise base including fi nanciers, insurers, agents, brokers and legal advisors; and
• operating within set fi nancial limits, approval framework and board review.
MARKET RISKSubstantial decline in world shipping markets
• management continually assess shipping markets utilising their own experience and detailed research;
• risks are managed through careful timing of fi xed charters, timing of entry into markets, a solid contract base and diversifi cation of risk;
• the board has set risk measurement benchmarks and the group’s risk model refl ecting the exposure to shipping risk is updated quarterly. Furthermore, an annual review of the model’s assumptions and the benchmarks is also carried out; and
• the impact of the current crisis in the global economy and credit markets on shipping markets and specifi c strategies to manage this risk are discussed in the chief executive offi cer’s report.
Exposure to commodity price fl uctuations
• the Trading division uses derivatives, futures, contracts and other instruments on open positions to manage this risk; and
• a commodity position trading policy is in place which includes a value at risk measurement of all open positions, stress testing and stop losses.
Counterparty/credit risk • charter and contract counterparties are thoroughly investigated and third party advice is obtained to ensure that only well known, secure charterers are contracted;
• management regularly monitors all counterparties in order to assess their ability to perform on contracts;
• internal controls include a thorough credit approval process with regular management review;
• debtors are reviewed monthly by management;• selective use of credit guarantee insurance;• operating within set fi nancial limits;• signifi cant exposures require board approval; and• the effectiveness of controls is assessed through the group’s internal audit
process, as determined by the audit committee.
FINANCIAL RISKExchange/interest rate risk • the group’s exchange and interest rate policy is approved by the board;
• a detailed review of the group’s foreign exchange and interest rate exposure is reviewed quarterly by the board; and
• management performs an ongoing review of the group’s exchange and interest rate exposure.
Risk of non-compliance with loan covenants
• loan covenants are continually reviewed to ensure that current loans are well within loan covenant ratios.

76 p
age
Grin
drod
Lim
ited
/ A
nnua
l Rep
ort 2
009
Risk management Risk management (continued)(continued)
Risk type Management of risk
FINANCIAL RISK (continued)Fraud risk
• fraud risk factors and internal controls are regularly reviewed and assessed through the group’s risk management and internal audit process;
• a fraud risk management strategy was adopted and implemented in 2009 and is in the process of being rolled out across the group;
• as part of this strategy a fraud health check survey was conducted across the group and fraud awareness training was carried out at 51 locations across the country;
• the group fraud and corruption prevention policy and the fraud response plan are in the process of being re-drafted; and
• a Tip-offs Anonymous® hotline was introduced in 2009.Funding risk • the group has a detailed funding plan and liquidity gap analysis in order to facilitate
adequate funding for its expansion programme and to ensure that the group’s funding is at levels that result in an effi cient cost of capital, while maintaining an acceptable level of risk.
OPERATIONAL RISKPiracy • the Shipping division is continually updated as to incidents of piracy and high risk
trading areas;• loss of hire insurance has been increased and independent confi rmation has been
obtained that existing insurance covers are suffi cient in the event of a vessel and/or crew being hijacked and held for ransom; and
• a comprehensive company circular was issued in October 2009 for vessels that trade in or through Somalia and/or the Gulf of Aden areas. This circular sets out the risk mitigation strategy adopted by Grindrod Shipping to reduce the risk of attacks by pirates.
Financial claims from contractual exposures
• internal controls are in place to minimise claims for damages in respect of cargo claims and third party negligence; and
• insurance cover is in place in the event that a claim arises.Loss or breakdown of key assets • management plays a key role in ensuring that adequate insurance cover is held
for all key assets;• where necessary, such insurance has been extended to business interruption
cover; and• management also ensures that strategic spare parts for equipment are held in
storage and that high maintenance standards are upheld.Signifi cant off-hire or loss of a ship • the exposure to loss of charter income or revenue as the result of signifi cant off-
hire or loss of a ship is proactively managed by ensuring that high maintenance and safety standards are complied with and by using competent brokers and standard charterparty agreements;
• provision is also made in the budget process for possible off-hire to minimise the effect of any lost charter income on the group’s results;
• lost income as a result of the loss of an owned ship is not insured, but would generally be recovered as owned ships are insured in excess of replacement values; and
• insurance is in place to cover the value of ships on charter for which the group holds purchase options and newbuildings under construction.

page 77G
rindrod Limited / A
nnual Report 2009
businessoverview commentaries
annual fi nancialstatements
shareholderinformationsustainability
Risk type Management of risk
OPERATIONAL RISK (continued)Environmental, climate change and health and safety risks
• the application of high level safety standards and use of modern, high-specifi cation ships;
• environmental cover is insured under P&I policies and oil pollution has coverage of up to US$1 billion per vessel per incident;
• all environmental management efforts within group subsidiaries are guided by the board approved group-wide environmental policy. A more detailed review of the group’s environmental policy is set out in the environmental performance section;
• the board requires and monitors through bi-annual quality, health, safety, security and environmental reports that each of the subsidiaries strictly complies with this policy;
• subsidiary companies are required to formulate key environmental objectives with achievable targets and to report on performance against these targets for the year;
• climate change risk is managed through the newly appointed Group Environmental and Climate Change Committee. The current focus is on improving the accuracy and completeness of measuring greenhouse gas (GHG) emissions and formulating programmes to reduce emissions. Grindrod is also staying abreast with the International Maritime Organisation's (IMO) emission indexing working guidelines; and
• increased emphasis was placed on health and safety in Freight Services in 2009. This is detailed in the occupational health and safety report.
LEGAL RISK • operating companies rely on service providers such as auditors and attorneys as well as trade associations and classifi cation societies to keep them abreast of any signifi cant changes in legislation; and
• tax legislation and the numerous changes are regularly reviewed to ensure the group is in compliance with all relevant tax legislation. In addition, a detailed tax compliance review is carried out on a regular basis by internal audit.
ORGANISATIONAL RISKLoss of key staff • this risk is managed by ensuring competitive remuneration packages and long-
term incentives, a progressive work environment, career growth opportunities and succession planning.
Industrial action • this is managed by following the appropriate human resources and industrial relations procedures and encouraging a culture of open communication within the group. Further detail is set out in the labour relations section of the social performance report.
IT systems failure • centralised IT systems are backed up with a disaster recovery plan, while the group’s wide area network communications platform is serviced by a fully backed up, outsourced virtual private network (VPN);
• the group invests in appropriate computer technology to ensure that business units improve effi ciencies and remain globally competitive; and
• the targeted technology refresh cycle is between three to fi ve years, thus avoiding the accumulation of legacy systems throughout the group.
RISKS RELATING TO FINANCIAL SERVICES
• Grindrod Bank has a separate risk committee as required by the Banks Act, which has the responsibility to manage the risks facing the Bank. These include credit, liquidity, operational, market, compliance, reputational and insurance related risks; and
• a risk committee charter is in place which defi nes the role, objectives, responsibilities, duties and authority of the risk committee of the Bank.

78 p
age
Grin
drod
Lim
ited
/ A
nnua
l Rep
ort 2
009
Social performanceSocial performance
WORKFORCE PROFILE The resilience and success of Grindrod and its associated companies is underpinned by committed, competent and value orientated people that drive businesses from the front line to the boardroom. Living the following values and core beliefs are the key ingredients for the culture that supports achievement of the group's strategy:
• professionalism and brand ambassadors in working together to add value to clients and stakeholders;
• respect for one another, all stakeholders and the environment;
• integrity and honesty in managing relationships and partnerships;
• establish and promote a non-discriminatory environment that supports people’s rights and obligations;
• accountable for complying with laws, regulations, policies and Grindrod’s code of ethics; and
• commitment to add value and support development of South Africa and the other countries in which we operate.
There has been a decline in the workforce complement over the last three years due to restructures and consolidation of businesses. The rate of employee attrition during 2009 was 4%. The total number of employees has decreased from 5 245 at 31 December 2008 to 5 041 at 31 December 2009.
The table opposite refl ects the total workforce for Grindrod, as at 31 December 2009, including permanent and temporary employees in subsidiary, joint venture and associated companies.
HUMAN CAPITAL INITIATIVESGrindrod is launching projects informed by good industry practice to support the rapid growth and expansion plans.
Aligned to the group’s strategy, a “fi t for purpose” structure has been defi ned that optimises economies of scale at the group level and ensures regional/local relevance and presence.
As a critical step in moving to a fully transformational approach managing people’s performance and costs, including re-profi ling jobs, grading and remuneration alignments to fi rm up equity have been priority actions in 2009.
To support and enhance strategic governance and compliance with King III across the diverse companies within the group, a corporate exercise of streamlining and aligning policies has been launched and implementation will be rolled out during the second quarter of 2010.
Total workforce as at 31 December 2009:
Performance management is a critical business requirement as this helps align, manages and calibrate the contributions of each person in the organisation in line with the strategic goals.
FUNCTIONAL OVERVIEW
TALENT MANAGEMENT
In the area of talent management, specifi cally processes for attracting and developing, retaining and performance managing, our people resources have undergone signifi cant improvements.
Improved talent acquisition processes have been launched to help business leadership in selecting the right candidate which is the fi rst step of successful execution. The group has successfully implemented an electronic e-recruitment system which collates internal and external candidate matches to the vacant positions, minimising unnecessary
Country 2009 2008South Africa 3 893 4 000Botswana – 15Brazil 2 –Canada 1 –China 7 4Ecuador 2 2France 3 3India 1 –Isle of Man 2 –Japan – 1Mozambique 889 935Namibia 102 89Peru 8 7Philippines 23 53Poland 33 48Russia – 10Seychelles 1 –Singapore 20 18South Korea 3 3Tanzania 18 25The Netherlands 1 1United Arab Emirates 2 5United Kingdom 29 26United States of America 1 –Total 5 041 5 245

page 79G
rindrod Limited / A
nnual Report 2009
businessoverview commentaries
annual fi nancialstatements
shareholderinformationsustainability
external recruitment fees. A revised group induction has been developed to improve effectiveness of a new employee from day one, to embed our culture and support the potential for long-term career growth.
The group promotes an environment in which all employees are afforded equal developmental and promotional opportunities and to this end has supported initiatives aimed at promoting training, education and development. The principle of learning through experience, as well as formal training, is adhered to throughout the group. In addition, employees with professional qualifi cations are encouraged to keep abreast of developments in particular fi elds by attending seminars, conferences and training courses. Financial assistance is also given to employees to encourage further tertiary education and to update the professional skills quotient in the organisation.
The group is committed to ensuring equal opportunities for people from historically disadvantaged groups (comprising african, asian and coloured persons, women and the disabled). Employment equity reports are submitted in accordance with the Employment Equity Act, No. 55 of 1998 Goals have been established for business transformation and are incorporated into various talent processes such as acquisition, development and progression. Succession and progression processes have further been improved to build a sustainable pipeline of leadership talent from the frontline to directors.
LABOUR RELATIONS
The group follows the principle of consultation for the benefi t of management and employees. Freedom of association and dissociation is acknowledged and where employees have appropriate representation, recognition agreements are entered into. Where there is no registered trade union recognition, formal and informal communication forums have been established. These forums promote both upward and downward communication and provide employees with the opportunity to clarify any issues.
The group realises the effect that restructuring of operations can have on employees and ensures that extensive and effective consultations are conducted when this occurs. A limited number of restructuring initiatives were undertaken during the course of 2009.
The level of union membership in the South African-based companies was 30% in 2009 (28% in 2008). The majority of union members are concentrated in Freight Services. There are nine registered and one unregistered trade union representing the group’s employees.
There are currently three recognition agreements across the group. Certain business units within Freight Services fall within the confi nes of the statutory bargaining councils. There was a slight increase in the level of industrial action during 2009. Short span and sporadic work stoppages were experienced at some Freight Services operations but these were amicably resolved with minimal disruption.
DISCIPLINARY AND GRIEVANCE PROCEDURES
Behavioural standards are documented as conduct, performance or disciplinary codes and these are communicated to all employees. The group prefers measures that are progressive in correction rather than punitive. To this end, in minor cases of misconduct, a written warning is given, subject to an investigation of the facts, and the outcome is based on a balance of probabilities. For more serious offences which may warrant dismissal, a fair and unbiased disciplinary hearing is conducted. All employees involved in a disciplinary procedure are permitted representation by another employee of his/her choice. There is an appeal procedure for all forms of disciplinary action.
A formal grievance procedure exists to enable employees to communicate grievances to management and to obtain the earliest possible resolution. During the latter part of 2009, a series of training interventions were held for supervision and management on the skills of administering disciplinary action. These workshops will again be conducted in 2010.
BROAD-BASED BLACK ECONOMIC EMPOWERMENT (B-BBEE) AND EMPLOYMENT EQUITY
B-BBEE is an integral component of South African business and the group is committed to aligning its businesses with the national legislation in the area of sustainable business transformation and to the creation and development of an enabling environment, for effective implementation within the organisation.
The group ensures each business retains business focus, values, performance, customer satisfaction and increased shareholder value. Grindrod has adopted a long-term developmental approach to B-BBEE which is aligned with the Codes of Good Practice issued by the Department of Trade and Industry. Performance against the various elements of B-BBEE is measured by the generic balanced scorecard and/or specifi c industry scorecards. Certifi cates have been issued by an accredited rating agency. Scorecards are currently being updated based on 2009 fi nancials.

80 p
age
Grin
drod
Lim
ited
/ A
nnua
l Rep
ort 2
009
Social performance Social performance (continued)(continued)
Grindrod (South Africa) (Pty) Limited was placed second in the 2009 Olive Empowerment awards in the category Best Empowered Logistics Company and has a level 3 BEE contributor status.
The fi ve-year target for each of Grindrod’s South African companies is to attain a level 4 rating by 2012. The majority have achieved level 4 ratings in 2009 and some have surpassed the target having achieved a rating of 2 or 3. Efforts will continue towards the achievement of improved ratings.
A summary of the current status within the Grindrod group score cards are as follows:
Company/division BEE RatingKapele Freight and Logistics (Pty) Limited 1King and Sons 2Grindrod Automotive Services (Pty) Limited 2Grindrod (South Africa) (Pty) Limited 3Eyethu Ships Agencies (Pty) Limited 4Mitchell Cotts Maritime 4Voigt Shipping 4Röhlig-Grindrod (Pty) Limited 5Grindrod Bank Limited* AUnicorn Calulo Bunker Services (Pty) Limited #RRL Grindrod (Pty) Limited 1RRL Grindrod Locomotives (Pty) Limited 3Vanguard Rigging (Pty) Limited #Bay Stevedores (Pty) Limited #
# Not measured* Financial Services charter
An overview of the group’s activities in the various elements is as follows:
VERIFICATION PROGRAMME
Grindrod has established the necessary governance mechanisms and integrated processes across its companies to effi ciently administer and co-ordinate a group-wide B-BBEE verifi cation in its commitment to transformation and sustainable development.
The group has appointed a leading verifi cation agency to ensure transparency and rigorousness in this process. Score cards are being prepared based on fi nancial results and data as at 31 December 2009.
OWNERSHIPIn 2008, Unicorn announced the formation of a partnership with Calulo Services (Pty) Limited, an empowered South African petrochemical group. The joint venture consists of two companies, Unicorn Calulo Shipping Services (Pty) Limited, which focuses on tanker shipping on the South African coast and Unicorn Calulo Bunker Services (Pty) Limited, which operates sophisticated bunker tankers in South African ports under long-term agreements with the South African oil majors.
In 2009, the B-BBEE transaction resulted in the sale of 25% plus one share interest in Grindrod (South Africa) (Pty) Limited (GSA), which houses the majority of Grindrod's South African operations, to Calulo Petrochemicals (Pty) Limited (Calulo), receiving 15%, and Adopt-a-School Foundation (AAS), a section 21 company, receiving 10%.
Grindrod re-entered the rail sector through a joint venture with Solethu Investments (Pty) Limited, a BEE company, which resulted in the formation of RRL Grindrod (Pty) Limited and RRL Grindrod Locomotives (Pty) Limited.
MANAGEMENT CONTROLThe group strives to advance the external appointment and internal development of black senior management.
EMPLOYMENT EQUITYAll group companies have adopted an employment equity policy promoting equal opportunity and fair treatment in employment through the elimination of any discriminatory practices and prejudices. An environment has been created in which every employee has the opportunity for advancement. Employment equity consultation committees consisting of individuals from different races, genders and occupational levels have been established and meet on a regular basis. A developmental approach is being taken to affi rmative action with the focus on promoting education and training to assist persons from designated groups to occupy more skilled and responsible positions within the group. Employment equity reports have been submitted in accordance with the Employment Equity Act, No. 55 of 1998. Goals have been established for business transformation and are incorporated into various talent processes such as attraction, development and progression.
Succession and progression processes have further been improved to build a sustainable pipeline of leadership talent from the frontline to directors as referenced above.
In 2009, 84% (2008: 85%) of the workforce was composed of persons from designated groups of which 87% were

page 81G
rindrod Limited / A
nnual Report 2009
businessoverview commentaries
annual fi nancialstatements
shareholderinformationsustainability
black (2008: 73%). Amidst the nominal reduction in workforce numbers, there was a noticeable injection of people from designated groups into top, senior, middle management and skilled professional positions in 2009. Improvements are not easily visible to the total fi gures for transformation in 2009, due to the typical fl ux experienced amongst the semi-skilled to unskilled workforce levels.
The group’s current demographic profi le of permanent employees in South African companies per occupational level is tabled below:
• top management;
• senior management;
• middle management (professionally qualifi ed and experienced specialists and mid- management);
• skilled (skilled technical and academically qualifi ed workers, junior management, supervisors, foreman and superintendents);
• semi-skilled (semi-skilled and discretionary decision maker); and
• unskilled (unskilled and defi ned decision making).
Demographic profi le Designated Non-designated
Total
2009 Male Female White Foreign nationals
Occupational levels African Coloured Indian African Coloured Indian White Total Male Male Female
Top management 2 3 2 1 0 0 2 10 35 0 0 45
Senior management 5 3 14 2 1 3 15 43 99 5 2 149
Middle management 11 8 43 5 2 17 54 140 103 1 0 244
Skilled 309 78 160 32 63 93 189 924 205 11 2 1 142
Semi-skilled 647 124 173 91 69 101 102 1 307 63 15 4 1 389
Unskilled 281 22 6 56 3 0 0 368 3 0 0 371
Total 1 255 238 398 187 138 214 362 2 792 508 32 8 3 340
Percentage 38 7 12 4 4 6 11 84 15 1 0,2
2008
Total 1 164 273 432 183 145 212 387 2 896 498 23 5 3 433
Percentage 37 8 13 5 4 6 11 85 15 1 0,1

82 p
age
Grin
drod
Lim
ited
/ A
nnua
l Rep
ort 2
009
Social performance Social performance (continued)(continued)
SKILLS DEVELOPMENTThe group is committed to the development of all its employees and to this end supports initiatives aimed at promoting training, education and development.
The principle of learning through experience, as well as formal training, is adhered to throughout the group. Training needs are identifi ed and documented in the form of work place skills plans. These plans and implementation reports are submitted to the relevant Sector Education and Training Authorities (SETAs). Grants have been received from the various SETA chambers for training completed. The group spent R9 million on training and development of its employees in 2009. A total of 2 826 employees attended courses. The following table gives an overview of the type of formal training courses which employees attended and the number of participants within the group.
Course programmeTotal
attendeesBlack
(%)
Training spend
on black employees
(%)Computer skills 107 71 74Mobile hoist/driver 331 90 79Management and supervisory 76 87 75Adult basic education and training 25 100 100Continual professional development 200 75 75Regulatory 661 92 96Workplace effectiveness 1 145 89 93Shipping 281 66 64Grand total 2 826 86 72
Furthermore, the group is revising technical, soft skill and the leadership development programmes for roll out in 2010. In support of the national skills development strategy, the group has continued to engage candidates on learnership programmes. In 2009, a total of 2 826 candidates (of which 86% were black) completed the programmes. In addition, employees with professional qualifi cations are encouraged to keep abreast of developments in their particular fi elds by attending seminars, conferences and training courses.
Grindrod has been a prominent developer of local seafaring talent since 1965. On completion of approved maritime
studies at either the Durban Institute of Technology (DIT) or the Cape Technikon, cadets are selected for training to serve as future deck or engineering offi cers in the Unicorn fl eet. They undergo shipboard familiarisation and specialised ancillary training, as required in terms of the International Standards of Training, Certifi cation and Watch-keeping for Seafarers (STCW 95). Training is also undertaken on behalf of third parties such as the National Ports Authority. The Unicorn Seafarers Training School based in Durban continues to provide valuable support to the maritime industry and demonstrates the group’s commitment to skills development. The school is South African Maritime Safety Authority (SAMSA) accredited and individuals who successfully complete courses, receive certifi cates that are nationally and internationally recognised. During 2009, 1 723 seafarers completed courses at the school. This number included, amongst others, local and international categories of offi cers, ratings, cadets, auxiliary crew of cruise liners and yachtsmen. Courses included shipboard familiarisation, safety at sea, profi ciency in survival craft, rescue craft, fi rst aid at sea, petroleum tanker safety, chemical tanker safety, able seaman and oiler. All courses are recognised in terms of International Maritime Organisation (IMO) Standards of Training, Certifi cation and Watch-keeping (STCW).
The existing training school in Maydon Wharf, Durban, is currently operating at maximum capacity and Unicorn is investigating the possibility of establishing, in an alternative Durban location, a purpose-built marine training centre, which would include amongst other facilities, additional classrooms and lecturing facilities, a tanker liquid cargo simulator, marine fi re fi ghting, survival at sea, fi rst aid and rescue boat training facilities. Such a project would place the training school at the leading edge of STCW 95 marine training on the African east coast and would further strengthen the company’s commitment to skills development and job creation for South African seafarers.
Grindrod’s cadet training scheme commenced in the 1960s and has trained South African deck and engineering offi cers of all races since the mid 1970s. During this period, Unicorn has trained in excess of 528 merchant navy offi cers, many of whom have progressed beyond employment at sea to occupy key positions in the South African Maritime Safety Authority (SAMSA). Furthermore, Grindrod was the fi rst shipping company in South Africa to start training female cadets (of all races), for service as seagoing offi cers. The cadet academy is a signifi cant investment in skills with the cost of training an engineering cadet at R345 000 and a deck cadet at

page 83G
rindrod Limited / A
nnual Report 2009
businessoverview commentaries
annual fi nancialstatements
shareholderinformationsustainability
R215 000. There are currently 31 cadets undergoing training, of which 22 are black and two are female.
In addition to the training of cadets for employment in its own fl eet, Grindrod provides training berths at sea and manages the training of cadets on behalf of:
• Transnet National Ports Authority of South Africa;
• Namibian Ports Authority (Namport);
• De Beers Marine (Angola);
• Sonatide (Angola); and
• OPS/SBM (Angola).
In a joint project with the Internal Transport Workers Federation (ITF), a revised training and certifi cation programme was rolled out internationally. Unicorn Shipping re-trained and the South African Maritime Safety Authority (SAMSA) re-certifi cated over 100 personnel from a variety of coastal African countries. Without this intervention, these seafarers would have been unemployable due to certifi cation requirements. The group has embarked on the projects described above with the intention of contributing to the meaningful transformation of the local maritime industry; and supporting the New Partnership for African Development (NEPAD) initiative by assisting regional African countries with maritime training requirements.
PREFERENTIAL PROCUREMENTGroup companies continue to endeavour to direct any discretionary spend towards qualifying BEE enterprises. Progress has already been made in selection and appointment of service providers for back offi ce functions. Further efforts are being rolled out through revisions in the procurement process in each company within the group.
HUMAN RIGHTSGrindrod continued to uphold and respect employee human rights throughout its operations. Basic human rights are enshrined in company policy and in employment contracts. There is no child labour and forced labour within the group. There were no incidents of human rights violations during the year under review.
HIV/AIDSThe Group is committed to reducing the spread and minimising the impact of HIV/AIDS on our employees and our stakeholders. Across our companies, we promote non-discriminatory behaviour through our shared code of ethics and provide education to support safe and responsible
decisions. The culture of support and prevention is further reinforced through operational safety talks, display of posters in high employee traffi c areas and distribution of condoms in ablution facilities. We offer confi dential HIV/AIDS testing and counselling in many divisions with plans to further increase this for 2010 so as to assist HIV/AIDS infected employees to remain healthy and work productively for as long as possible.
Further to supporting employee's overall wellbeing and assisting in realising their potential, we are examining the rollout of a group wellness programme. The fl exibility of the system further enables attraction, retention and management of talent through providing numerous value adding services during an employee's tenure. The rollout is earmarked for early 2010.
OCCUPATIONAL HEALTH AND SAFETY Grindrod’s health and safety objectives and targets remain simple. Full compliance with applicable legislation with a target of zero incidents, within a culture of continual improvement. Progress was made in the year in review in standardising and improving reporting on health and safety performance and investment.
Total occupational health and safety investment during 2009 was R6,8 million, R8,9 million in 2008 and R4,5 million in 2007.
Occupational health and safety is managed in terms of site-level or ship-based integrated safety health and environment (SHE) or SHE and quality (SHEQ) management systems. Senior employees in the company are required to ensure that all legal requirements are complied with and this forms part of their personal assessment. Wherever applicable, health and safety committees are maintained at site level, with full staff representation. Major contractors (e.g. shipyards) are audited in terms of SHE performance on an ongoing basis. All serious incidents are reported to the board and dealt with in the most serious light, with full investigations conducted and appropriate remedial action taken, in all cases.
Performance for the year in review, by division, was as follows:
SHIPPING
The division improved on an already exemplary track record reporting only four medical treatment cases, with zero lost time incidents for the year. Following an injury, incident reports are circulated throughout the fl eet and discussed in “HSE Stops” (safety moments used for training and awareness).

84 p
age
Grin
drod
Lim
ited
/ A
nnua
l Rep
ort 2
009
Social performance Social performance (continued)(continued)
The division also participates in a lessons-learned scheme with companies in the oil and gas sector and other shipping companies.
KPIs 2009 2008
Health and safety R2 325 071 R5 576 817
Medical treatment cases 4 5
Lost time incidents 0 1
Fatalities 0 0
Injury frequency rate (per million man hours)
0 3,2
Spend: (difference year on year as a result of the completion of a large H&S audit programme in 2008)
FREIGHT SERVICES
Companies within the Freight division reported a total of 24 medical treatment cases, down from 79 in 2008. However, Grindrod deeply regrets the accidental deaths of four employees and a contract worker during the year. Three fatalities occurred during man/machine interface, one drowning and one fatal crush injury. Specifi c standards are being developed to manage mobile equipment, pedestrian safety with specifi c reference to the interface, working at heights and contractor management.
All of these incidents were thoroughly investigated and appropriate corrective action steps implemented though these were not group controlled companies.
In a concerted effort to signifi cantly improve health and safety performance within the division, the board approved the appointment during the year of a senior-level divisional health safety and environment (HSE) manager and the consolidation of health and safety strategies within the division, under this role.
Improvements under the new health and safety management structure completed during the year, include:
• improved resourcing of the health and safety function within this division;
• the completion of external assessments at six business units by Alexander Forbes to verify reported efforts;
• the development of improved policies and protocols at business units;
• improvements to accident reporting and investigations with set protocols that have specifi c reference to the setting and enforcing of sustainable recommendations to mitigate investigation fi ndings;
• the intensifi cation of health and safety training and awareness programmes; and
• accelerated rollout of ISO 18001 health and safety management system certifi cation within the division (two business units were certifi ed in 2009).
KPIs 2009 2008
Health and safety spend R4 366 734 R3 282 453
Medical treatment cases 24 79
Lost time incidents 52 29
Fatalities 5 3
Injury frequency rate (per million man hours)
7.07 Not calculated in 2008 for GFS
TRADING, FINANCIAL SERVICES AND GROUP DIVISIONS
Two medical treatment cases were reported in the year (zero in 2008). A total of R97 500 (R5 460 in 2008) was spent on health and safety audits and safety equipment within these offi ce-based divisions.

page 85G
rindrod Limited / A
nnual Report 2009
businessoverview commentaries
annual fi nancialstatements
shareholderinformationsustainability
Corporate social investmentCorporate social investment
INTRODUCTIONThe main focus of the corporate social investment (CSI) programme was again centred around education, which is regarded by the group as critical to the growth and prosperity of South Africa. This was one of the main drivers for the conclusion of the B-BBEE transaction with Adopt-a-School Foundation (AAS), which sees 100% of the CSI spend of Grindrod (South Africa) (Pty) Limited directed towards AAS initiatives. The group is, however, also involved in environmental, community welfare and health and business development programmes.
In some instances initiatives are managed at the business unit level and are appropriate to the circumstances of each business and community within which it operates.
The group spent approximately R2,3 million during 2009 on its CSI programmes (2008: R2,1 million).
In addition, Grindrod Bank spent R2,1 million in 2009 (2008: R1,9 million), mainly through discounted fees to private clients of the bank. These clients are involved in areas such as education, training, environment, arts and culture and health as defi ned in section 13 of the Financial Sector Charter. Also included in this amount was the monetary value of the time spent by staff on charitable organisations.
EDUCATION AND TRAININGA full report on the internal programmes related to education, training and development within the group is referred to in the schools development sub-section of the social performance report. In particular, a full bursary scheme is available to children of employees, both in respect of school and tertiary education, with a strong bias towards the previously disadvantaged candidates.
A number of bursaries were awarded to black pupils to attend carefully identifi ed high schools in KwaZulu-Natal. The performance of these children is being closely monitored in association with the management of these schools.
Grindrod continues to sponsor the Liberty Life/JSE Schools Challenge Project where school teams develop simulated investments on the market and compete on performance over a determined period of time.
Continuing on the educational focus, Grindrod, through its association with Project Build, completed an ablution block at Ukusakwabasha School in Bothas Hill and built a maritime centre at Sithengile High School just outside Durban. Grindrod also has a relationship with the
Simonstown Maritime School and during 2009, contributed towards the development of new hostel accommodation facilities.
Through the association with Adopt-a-School Foundation (AAS), Grindrod has been involved in the upliftment of King Shaka High School in Umlazi, KwaZulu-Natal which showed a dramatic increase in pass rates for computer studies as a direct result of the new computer laboratory which was built for the school in 2009.
The group has also been involved with the distribution of other educational material to schools and is a supporter of the Fathers Heart Foundation, an organisation operating in the Cato Manor area through practical caring and feeding of teenage orphan children. Another orphan care initiative is the sponsoring of home care and schooling costs for previous street children under the administration of the Durban-based I-Care organisation.
COMMUNITY, WELFARE AND HEALTHIn 2009, Grindrod announced its support for the Boundless Southern Africa Expedition led by Kingsley Holgate.
This four-month expedition crossed Africa from the Indian Ocean to the Atlantic, a 9 000 kilometre journey linking nine countries, seven transfrontier conservation areas, 30 national parks and nature reserves and the communities adjacent to these conservation areas.
This project was about uniting nine countries (Angola, Botswana, Lesotho, Mozambique, Namibia, South Africa, Swaziland, Zimbabwe and Zambia) into one tourist/adventure destination and uplifting the communities in and adjacent to these areas. Grindrod’s operational footprint extends into many of the countries who benefi ted from the project.
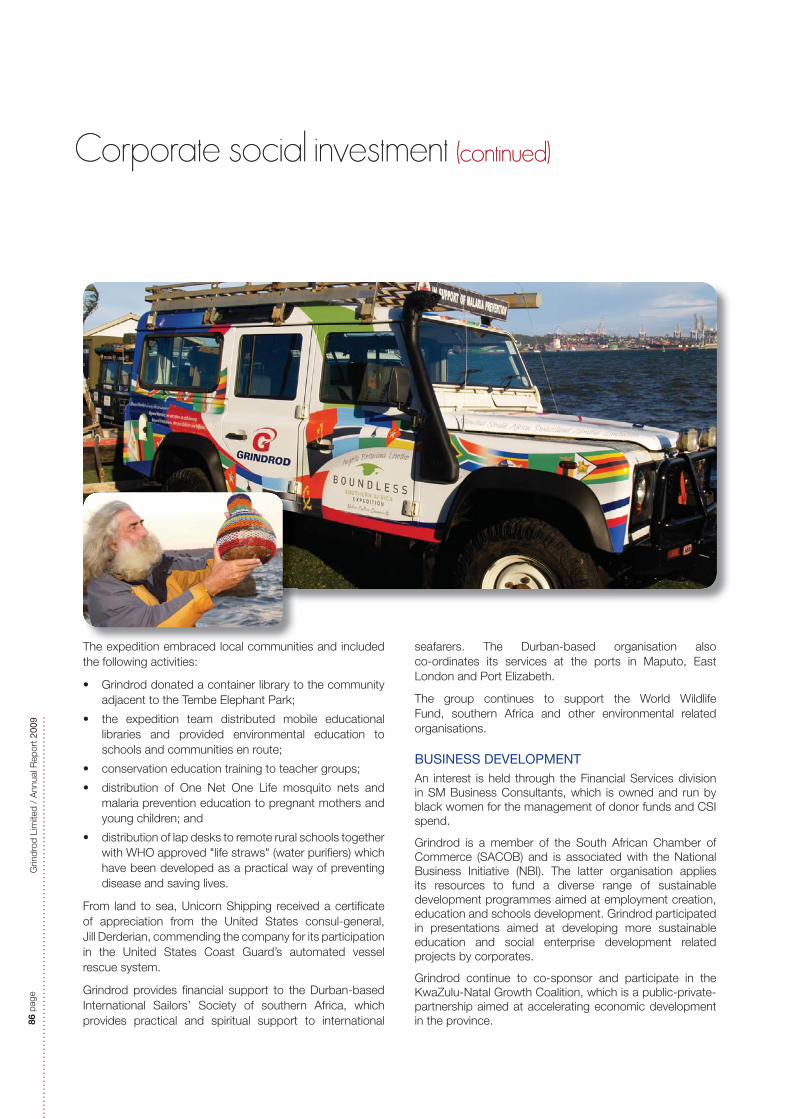
86 p
age
Grin
drod
Lim
ited
/ A
nnua
l Rep
ort 2
009
The expedition embraced local communities and included the following activities:
• Grindrod donated a container library to the community adjacent to the Tembe Elephant Park;
• the expedition team distributed mobile educational libraries and provided environmental education to schools and communities en route;
• conservation education training to teacher groups;
• distribution of One Net One Life mosquito nets and malaria prevention education to pregnant mothers and young children; and
• distribution of lap desks to remote rural schools together with WHO approved "life straws" (water purifi ers) which have been developed as a practical way of preventing disease and saving lives.
From land to sea, Unicorn Shipping received a certifi cate of appreciation from the United States consul-general, Jill Derderian, commending the company for its participation in the United States Coast Guard’s automated vessel rescue system.
Grindrod provides fi nancial support to the Durban-based International Sailors’ Society of southern Africa, which provides practical and spiritual support to international
seafarers. The Durban-based organisation also co-ordinates its services at the ports in Maputo, East London and Port Elizabeth.
The group continues to support the World Wildlife Fund, southern Africa and other environmental related organisations.
BUSINESS DEVELOPMENTAn interest is held through the Financial Services division in SM Business Consultants, which is owned and run by black women for the management of donor funds and CSI spend.
Grindrod is a member of the South African Chamber of Commerce (SACOB) and is associated with the National Business Initiative (NBI). The latter organisation applies its resources to fund a diverse range of sustainable development programmes aimed at employment creation, education and schools development. Grindrod participated in presentations aimed at developing more sustainable education and social enterprise development related projects by corporates.
Grindrod continue to co-sponsor and participate in the KwaZulu-Natal Growth Coalition, which is a public-private-partnership aimed at accelerating economic development in the province.
Corporate social investment Corporate social investment (continued)(continued)

page 87G
rindrod Limited / A
nnual Report 2009
businessoverview commentaries
annual fi nancialstatements
shareholderinformationsustainability
Stakeholder engagementStakeholder engagement
Grindrod continues to build and maintain sustainable relationships with a range of stakeholder groups, particularly in relation to long-term strategic direction and focus on sustainability practices.
The group has further improved relationships with key stakeholders as summarised below:
INVESTORS AND ANALYSTS
• results presentations to investors in Durban, Johannesburg and Cape Town;
• interim and annual results presentation available on our website;
• relevant information is available on our website as well as live SENS and share price feeds;
• local and international investor road shows and one-on-one meetings with major investors, institutions and analysts;
• electronic communication and engagement with a wide range of stakeholders; and
• signifi cant improvements in the disclosure in the annual and interim reports.
CUSTOMERS
• collective meetings with partners and key customers are held at least annually in Durban, Johannesburg and Cape Town;
• cross-marketing within the group is continuously explored and implemented;
• responses to enquiries received via the website;
• a quarterly newsletter, brochures and a corporate DVD have assisted in communicating the group services;
• participation in conferences, exhibitions and trade fairs which are relevant to the group's businesses;
• presentations at other local and international conferences;
• adverts, advertorials, editorials placed in publications relevant to our customer base; and
• one-on-one meetings both locally and internationally at operational level.
MEDIA
• press announcements;
• editorials in relevant publications;
• representatives from various publications are invited to investor feedback presentations, the annual general meeting and client functions; and
• interviews with the chief executive offi cer (print, television and radio).
GOVERNMENT AUTHORITIES
Meetings and discussions with:
• the South African Department of Trade and Industry regarding the proposed tonnage tax system;
• Government of Mozambique relating to the group’s Maputo port investments;
• Namport regarding the group’s Walvis Bay port investments;
• Transnet;
• PetroSA;
• South African Reserve Bank (SARB); and
• Financial Services Board (FSB).
NON-GOVERNMENTAL ORGANISATIONS, COMMUNITIES AND OTHER INDUSTRY INTEREST GROUPS
• Ethics Institute of South Africa;
• various non-governmental organisations (NGOs) for corporate social investment purposes;
• South African Association of Ship Operators and Agents (SAASOA) and Container Liner Operators Forum;
• various communities through corporate social investment programmes;
• Institute of Internal Auditors of South Africa;
• Institute of Directors;
• Institute of Risk Management of South Africa;
• Institute of Chartered Shipbrokers; and
• South African Institute of Chartered Accountants.

88 p
age
Grin
drod
Lim
ited
/ A
nnua
l Rep
ort 2
009
TRADE UNIONS• the group has committees and reporting structures
in place to engage with various unions and ongoing communication activities. Please refer to page 79 for further details.
STAFF• specialist committees (e.g. HSE committees, Group
Environmental and Climate Change Committee);
• internal newsletters, memoranda and the company intranet. Career section and job opportunities are posted on the website;
• cross-marketing functions in every region twice a year;
• an internal fraud awareness campaign commenced;
• country wide Tip-offs Anonymous® presentations to employees; and
• staff functions, strategic planning sessions and other initiatives on an operational level.
SUSTAINABILITY• Johannesburg Stock Exchange's (JSE's) Socially
Responsible Investment (SRI) Index;
• professional sustainability, HSE and climate change advisors, consultants and auditors; and
• International Maritime Organisation (IMO).
Results announcements, press releases and other updates are communicated to subscribers on the Grindrod website www.grindrod.co.za.
Stakeholder engagement Stakeholder engagement (continued)(continued)

page 89G
rindrod Limited / A
nnual Report 2009
businessoverview commentaries
annual fi nancialstatements
shareholderinformationsustainability
Environmental performanceEnvironmental performance
2009 HIGHLIGHTS Signifi cant progress, both structural (appointments, resourcing) and in terms of setting achievable and quantifi able objectives and targets, was made during the year with respect to managing the company’s environmental footprint.
Highlights, with more details in the sections below, include:
• establishment of Grindrod’s fi rst Group Environmental and Climate Change Committee reporting to the group chief executive offi cer. This committee introduces senior executive-level responsibility for Grindrod’s environmental impacts and climate change related issues;
• appointment of a senior-level health, safety and environment (HSE) manager in the Freight Services division;
• commencement of an environmental risk audit programme covering all Freight Services division sites;
• the Shipping division achieving, for the fourth year in a row, its target of zero signifi cant oil spills (more than one barrel of oil) for all ships under Grindrod’s control;
• the initiation of ISO 14001 environmental management systems (EMS) within the Shipping division and progress with implementation of ISO 14001 in the Freight Services division (two terminal operations received certifi cation);
• progress with setting achievable and quantifi able environmental objectives and targets; and
• using external environmental consultants to conduct selected internal verifi cation of environmental key performance indicator (KPI) data collated from Grindrod group companies for this report.
SCOPE AND METHODOLOGYGrindrod’s environmental reporting scope follows an equity share approach, accounting for environmental impacts from all operations, even where Grindrod has no control over operating policies, according to the company’s share of equity in the organisation. This approach refl ects economic interest and the extent of Grindrod’s rights to risks and rewards from each operation.
Grindrod is, as always, responsible for and reports on pollution prevention, solid and liquid waste management and water-use for ships that are owned and managed. However, accountability for fuel consumption and the associated greenhouse gas emissions, falls on the company chartering the vessel. The Shipping division in turn charters in and utilises vessels that are owned and managed by a third party. For these vessels Grindrod includes fuel use and associated air emissions in the scope of reporting, but does not maintain records of waste, nitrogen oxides (NOx), sulphur oxides (SOx), water and wastewater.
Measurement of, and reporting on, environmental KPI within Grindrod is guided by:
• the Global Reporting Initiative’s (GRI) environmental indicator guidelines (including the pilot sector supplement for the logistics and transportation industry);
• the JSE’s Socially Responsible Investment (SRI) Index environmental reporting requirements; and
• best practice within the global shipping and transport industries (Grindrod completed a second global peer sustainability reporting benchmarking exercise).
Environmental Management Systems (EMS) being developed within Grindrod are being driven by, and where appropriate certifi ed against, ISO 14001.
The measurement of, and reporting on, greenhouse gas (GHG) emissions was done in accordance with the international GHG Protocol and shipping GHG emissions are reported in line with the IMO’s CO2 emission indexing working guidelines. Grindrod will participate in the Carbon Disclosure Project (CDP) for the fi rst time in 2010.
PROGRESS WITH ACHIEVING ENVIRONMENTAL OBJECTIVES AND TARGETS
Group level environmental objectives and targets are set each year, in line with the group environmental policy (see company website www.grindrod.co.za). Progress in terms of commitments made last year and several new commitments made in 2009, is summarised in the pages that follow.

90 p
age
Grin
drod
Lim
ited
/ A
nnua
l Rep
ort 2
009
ESTABLISHING A CULTURE OF RESPONSIBILITY
In recognition that Grindrod’s environmental efforts are only as good as the commitment of the company’s people, Grindrod will promote environmental awareness and responsibility among employees and develop a culture of eco-effi ciency and ecological responsibility at Grindrod.
Performance and progress in 2009
Grindrod’s chief executive offi cer assumes overall responsibility for the group’s environmental performance. Grindrod’s chief executive offi cer has signed the group environmental policy and the group environmental and climate change committee reports to him. Environmental and climate change risk forms part of the mandate of the board level risk committee.
A group level environmental committee was established. The committee which now meets quarterly, comprises senior executives from within the group, with a mandate to oversee the implementation of the group environmental policy adopted by the board in 2008. The committee is chaired by the group company secretary and reports directly to the chief executive offi cer.
A full-time senior level health, safety and environment (HSE) manager was appointed within the Freight Services division, to match equivalent in place within the Shipping division.
Environmental training and awareness at all levels of the organisation was completed during the year, including:
• senior executives and managers received high level awareness training from external experts during 2009;
• seafarer training conducted by the Unicorn training school based in Durban includes HSE awareness and emergency response training that would reduce environmental impacts in the event of an accident or spill; and
• training continued onboard in terms of each vessel’s safety, health, environment and quality (SHEQ)system. Realistic emergency drills are carried out to test shipboard emergency response plans and shore management preparedness to deal with a variety of shipboard emergencies such as oil spills, collisions, fi re, fl ooding or grounding.
Planned improvements and new targets
The incorporation of environmental management performance indicators as part of senior personnel performance assessments is being considered by the Grindrod board for introduction before the end of 2010.
The rollout of ISO 14001 within the Freight Services and Shipping divisions will include ongoing environmental awareness training.
IMPROVING ENVIRONMENTAL DATA MANAGEMENT AND REPORTING
Improve on the accuracy and completeness of environmental data collection from the diverse group operations.
Performance and progress in 2009
Completeness in terms of identifying and understanding material sustainability aspects was improved by holding a workshop in November 2009 and business units identifying their top environmental risks and impacts. This led to a review of the detailed questionnaire/data sheet, sent out at the end of each year to collate environmental KPI – ensuring that the questions posed to, and the data collated from, business units covered material environmental risks and opportunities for the group.
This year, 44 environmental returns from 29 business units (covering 77 sites) were processed, compared to 20 returns from 20 business units in 2008.
Accuracy was improved by checking reported data for 2009 against 2008 data and any signifi cant variances were queried. Furthermore, where data was not provided or measured by a business unit, attempts were made to obtain or best estimate the data, if it was considered material.
Planned improvements and new targets
Remaining gaps in coverage (e.g. water-use, wastewater discharge and solid waste generation was incomplete) were highlighted by this year's environmental performance review. Further management effort will be focused on achieving 100% coverage throughout the group by 2012.
This reporting cycle also revealed that approximately 50% of environmental data is currently based on calculated estimates. The target is to improve the level of measured/verifi ed data to at least 80% by 2012.
Target of 100% coverage in terms of monitoring and reporting on ships emissions.
Grindrod monitors and reports water usage, waste generation and air pollution, NOx and SOx, on all owned vessels. However, Grindrod only operates one of its own vessels (the bunker tanker Southern Venture). The remainder are chartered out with clients being responsible for fuel consumption (and associated GHG emissions).
Environmental performanceEnvironmental performance (continued)(continued)

page 91G
rindrod Limited / A
nnual Report 2009
Most of the vessels that Grindrod operates are owned by a third party, or belong to a pool (shared ownership). Where Grindrod operates a vessel and pays for the fuel, whether the company owns the ship or not, Grindrod accounts for the associated GHG emissions.
Grindrod’s shipping carbon footprint (GHG emissions) for 2009 comprised fuel consumption on 89 chartered vessels and one owned vessel bunker tanker that the company operated.
Planned improvements and new targets
This year’s environmental review revealed is that some of Grindrod’s shipping clients apply a different scope and methodology to GHG reporting and are not accounting for fuel usage and/or associated GHG emissions in their reporting (i.e. Grindrod owns the vessel but clients pay for and use fuel).
Towards the end of 2009, Grindrod initiated discussions with the WRI’s GHG protocol team to provide insight and guidance to GHG reporting from the Shipping division, given the relative complexity of fuel usage within this division.
By 2012, the goal is to have 100% reporting of fuel and GHG emissions for all ships owned and/or operated by Grindrod and to extend infl uence over clients that are not accounting for fuel consumption and associated GHG emissions, to do so.
EXCEEDING LEGAL COMPLIANCE
Grindrod will at all times and in all jurisdictions meet and, where feasible, exceed environmental regulatory requirements, as well as all other industry requirements to which the company subscribes.
Performance and progress in 2009
All companies and sites are required to comply in full with all applicable environmental legislation and local by-laws.
There were no material incidents of, and fi nes or non-monetary sanctions for, non-compliance with applicable environmental regulations in any jurisdiction that the company operated in during the year under review.
The external environmental risk audit programme being undertaken within the Freight Services division is identifying non-compliances with local by-laws, the South African National Environmental Management Act, National Water Act and the new Waste Act. The division's new SHE manager is overseeing a management programme to
act on all fi ndings. Adequate allocation of resources for improvements at site level have been made.
As verifi ed by internal and external audits, all vessels operated by the Shipping division were once again fully compliant with MARPOL both with respect to solid and liquid waste, as well as Annex VI that deals with air pollution from ships and hold documents of compliance issued by the relevant maritime authorities in terms of IMO legislation.
Routine audits during the year ensured that all Grindrod ships were fully compliant with low sulphur fuel requirements for designated shipping areas (e.g. parts of the EU).
Planned improvements and new targets
Grindrod strives to maintain the record through continued management programmes and the introduction of formalised EMS systems now underway within the Shipping division.
ADOPT A SYSTEMATIC APPROACH
Environmental management will be conducted following a systematic approach, based on or, where appropriate compliant with ISO 14001. Where feasible, companies and vessels will develop integrated safety, health, environmental and quality management systems, that include regular audits.
Performance and progress in 2009
Good progress was made during the year with the development of environmental management systems (EMS) in both divisions that have the greatest environmental footprints/risks.
Within the Freight Services division, two terminals, Durban (Maydon Wharf) and Richards Bay, achieved ISO 14001 certifi cation during 2009. Following this, the Freight Services division will roll out formalised EMSs at all business units. An ISO 14001 gap assessment forms part of the environmental risk audit programmes that are currently being undertaken by external professionals within this division and will facilitate this process.
Building on the integrated SHEQ management systems (driven by ISO 9001: 2000) that have been in place on all company owned vessels for several years, the Shipping division formally adopted ISO 14001, with certifi cation within Unicorn Shipping scheduled for the fourth quarter of 2010.
businessoverview commentaries
annual fi nancialstatements
shareholderinformationsustainability

92 p
age
Grin
drod
Lim
ited
/ A
nnua
l Rep
ort 2
009
Environmental performance Environmental performance (continued)(continued)
All ships are subject to regular SHEQ audits by the company’s major oil customers, underwriters, certifi cation and other bodies. Fleet managers within the group also conduct stringent internal SHEQ audits on a half-yearly basis.
Planned improvements and new targets
The group has set a target of implementation of formalised EMSs based on ISO 14001 at all major land-based sites within the Freight Services division and on all ships owned and/or managed by the company within the Shipping division, by 2012.
MARINE BIODIVERSITY IMPACTS: OBJECTIVE AND TARGET – ZERO MATERIAL POLLUTION OF THE WORLD’S MARINE ECOSYSTEMS
Minimise impacts on marine ecosystems through rigorous onboard management systems, ongoing training and awareness and audits against international marine pollution prevention standards.
Performance and progress in 2009
Measures that Grindrod continues to have in place to prevent marine pollution and impact on marine biodiversity include:
• continued non-use of TBT or lead containing anti-fouling paint;
• all vessels under Grindrod’s control have ballast management plans which comply with IMO requirements, to minimise the potential impacts related to ballast water (spreading invasive marine organisms between ecosystems);
• a growing number of vessels under Grindrod’s control have signed up to and are certifi ed to the “Cleanship” standard (see http://www.cleanship.info/). These vessels are not allowed to dispose the waste (solid or liquid) whilst at sea. Two vessels (the Berg and Breede) received Bureau Veritas “Cleanship” notation in 2009;
• Grindrod maintained its policy of not transporting any hazardous waste; and
• a range of other measures are being undertaken on an ongoing basis to ensure full compliance with MARPOL (see “Exceeding legal compliance” section on page 96 and the sections below).
Planned improvements and new targets
Continuous improvements to onboard management systems (driven by the introduction of ISO 14001 on all
vessels), ongoing training, investment in safer ships and other measures being implemented will assist in keeping Grindrod’s excellent record of minimising impacts on marine ecosystems.
To minimise potential impacts to marine ecosystems as a result of collisions and groundings, 100% of oil and chemical tankers owned by Grindrod will have double hull constructions and/or to be constructed with materials designed to minimise corrosion and to promote robustness and longevity and to have onboard navigation and safety equipment that is the best available.
Performance and progress in 2009
All of Grindrod’s tankers are doubled-hulled. In four out of fi ve oil/chemical tankers, the fuel tanks are located away from the side of the ship, to provide extra protection (known as double hull effect). Tensile steel has been minimised on all tankers to reduce the chance of metal fatigue associated with high tensile steel.
Grindrod’s ships’ cargo tanks are divided into sections and bund containment is fi tted on all deck areas.
Planned improvements and new targets
All future purchases of tankers will be in compliance with this policy.
Ships' wastewater discharge and solid waste disposal whilst at sea to be in strict compliance with MARPOL.
Performance and progress in 2009
Ships' wastewater (galley wastewater, domestic/toilet and bilge water) is discharged directly into the sea while vessels are under way, in strict compliance with MARPOL.
Biodegradable waste generated in all ships is disposed of at sea or incinerated onboard, in strict compliance with MARPOL.
Solid waste and waste oils are separated on board and where possible incinerated, in strict compliance with the relevant provisions of MARPOL. Any waste that may contain heavy metals is not incinerated onboard.
All company run ships maintain garbage logs (for solid waste) and safe disposal receipts for any solid waste landed.
Planned improvements and new targets
Improving onboard management systems (driven by the introduction of ISO 14001 on all vessels) and regular audits will ensure ongoing compliance with MARPOL.
page 93G
rindrod Limited / A
nnual Report 2009
Zero signifi cant oil spills (more than one barrel of oil) for all ships under Grindrod’s control.
Performance and progress in 2009
The Shipping division achieved, for the fourth year in a row, this target. In one incident, a 200 litre para-xylene chemical spill was fully contained on board the vessel concerned.
Planned improvements and new targets
Strive to maintain record through continued management programmes and the introduction of formalised ISO 14001 EMSs.
LAND-BASED BIODIVERSITY IMPACTS: OBJECTIVE AND TARGET – ZERO MATERIAL POLLUTION OF TERRESTRIAL ECOSYSTEMS
Minimise impacts on terrestrial ecosystems through rigorous management systems, ongoing training and awareness and environmental risk audits of sites.
All new land-based developments to comply in full with environmental impact assessment (EIA) regulations and approval conditions.
Performance and progress in 2009
Continuous improvements to site level environmental management within the Freight Services division, which comprises more than 95% of land-based environmental risks to the group, are underway as a result of the division-wide environmental risk audits being conducted by external professionals and the rollout of ISO 14001 within this division.
Within the Freight Services division, an EIA was submitted to the South African Department of Environmental Affairs and Tourism (DEAT) in December 2009 regarding signifi cant expansions at the Richards Bay operations.
Planned improvements and new targets
Ongoing efforts driven by formalised EMSs at all land-based operations will improve the current handling and storage arrangements of materials that pose a pollution risk.
In the light of new legislation regarding contaminated land (as part of the new Waste Act), Grindrod has identifi ed that the company needs to improve its knowledge of the environmental status of any site that the company plans to occupy or purchase. Grindrod will develop a procedure requiring the completion of an environmental risk assessment prior to occupation or purchase of a site, as well as prior to exiting a site. This will be completed by the end of 2010.
USING NATURAL RESOURCES EFFICIENTLY AND MINIMISING WATER: REDUCING WATER-USE AND WASTEWATER GENERATION
Reduce water-use and wastewater effl uent discharge intensity by 10% by 2012.
Performance and progress in 2009
Total measured water usage for 2009 was 195 555 kilolitres compared to 125 000 kilolitres for 2008. The increase was due to expansions, particularly at the Richards Bay terminal and incomplete coverage in 2008, particularly within the Freight Services division. This resulted in water-use intensity increasing from 3.7 kilolitres per million Rand revenue in 2008 to 7.1 kilolitres per million Rand revenue in 2009 (with the marked drop in group revenue also contributing to this increase).
93% of this water footprint is generated by the Freight Services division, which uses large amounts of water to wash machinery, conveyor belts, containers and vehicles and this is where the majority of management effort will be aimed.
Most ships under Grindrod’s control have onboard systems that generate their own water up to 20 kilolitres per day (only approximately 8 kilolitres is required per day). Total ship-based water usage for ships under company control dropped from 3 500 kilolitres in 2008 to 550 kilolitres in 2009 although this was largely due to boundary and operational changes.
The majority of Grindrod's ships and all new generation ships purchased, have non-water-based vacuum operated sewerage treatment plants, minimising discharge of effl uent at sea.
Planned improvements and new targets
The goal remains to reduce water-use intensity (kilolitres per million Rand revenue) and the resulting wastewater effl uent discharged by 10% by the end of 2012, with 2010 being set as the baseline.
With this objective and target in place, the focus during 2010 will be to not only improve the accuracy and completeness of water monitoring within the Freight Services division, but also to incorporate water-use and wastewater effl uent discharge reduction programmes as part of the ISO 14001 environmental management systems being implemented in this division.
Detailed independent environmental risk audits have been initiated at Freight Services' land-based depots, scheduled for completion by June 2010. The audits are assisting in identifying improvement opportunities for both water usage and wastewater discharge reduction at the depots.
businessoverview commentaries
annual fi nancialstatements
shareholderinformationsustainability

94 p
age
Grin
drod
Lim
ited
/ A
nnua
l Rep
ort 2
009
Environmental performance Environmental performance (continued)(continued)
USING NATURAL RESOURCES EFFICIENTLY AND MINIMISING WASTE – SOLID WASTE REDUCTION
Improve material recycling to 10% of total solid waste by 2012.
Performance and progress in 2009
Approximately 96 tonnes (1.33% of total) of the total solid waste produced in 2009 (7 159 tonnes) was recycled.
Gaps in reporting of solid waste streams were identifi ed during this year's environmental review.
Planned improvements and new targets
The company is falling short on its commitment to increase material recycling and reducing solid waste going to landfi ll.
Improved recycling of solid waste streams is going to form a major part of the environmental management programmes that form part of the rollout of ISO 14001 within the group and in the Freight Services division in particular. Grindrod is confi dent that these efforts, will bear fruit and reduce the company’s landfi ll impacts.
USING NATURAL RESOURCES EFFICIENTLY AND MINIMISING WASTE – TRANSPORT RELATED AIR EMISSIONS: POLLUTION REDUCTION
Reduce ship-based sulphur oxide (SOx) and nitrous oxide (NOx) emissions per NM (nautical miles) travelled by 5% by 2015.
Similarly, reduce land-based SOx and NOx emissions per kilometre travelled by 5% by 2015.
Performance and progress in 2009
If complete combustion of heavy fuel oil, intermediate fuel oil and marine diesel oil in Grindrod ships and petrol and diesel in Grindrod land-based vehicles were to take place, only water and carbon dioxide (CO2) would be emitted. However, as such levels of effi ciency are not achievable in practice, trace amounts of unburnt hydrocarbons (HC), carbon monoxide (CO), nitrogen oxides (NOx), benzene, particles (PM), volatile organic components (VOC) and sulphur dioxide (SO2) are emitted in addition to water and CO2. These pollutants all contribute to air quality degradation and some of them are key greenhouse gases (see next section). Sulphur oxide (SOx) and nitrogen oxide (NOx) emissions are the two key pollutants resulting from the burning of fossil fuels and are used as the KPI for air pollution by Grindrod.
The consumption and emission of ozone-depleting refrigerant gases by Grindrod is negligible. Refrigerant gases used by ships and land-based operations is predominantly CFC-free R22 and R404A.
Efforts to date have focused on improving the reporting of ship and vehicle fuel usage within the group, being the source of 95% of air pollution for the group. Grindrod does not have any signifi cant stationary/site-based sources of air pollution.
While options are limited as the “cleanness” of fuels used both on land and at sea is out of the company’s control, Grindrod has committed to reducing normalised air pollution from these sources by 5% by 2015 (using SOx and NOx as the KPI and 2010 as the baseline).
A centralised fl eet management sub-division was established within the Freight Services division, with a central point of entry for new vehicles and spares purchases, maintenance and fuel consumption management. This division will also in future be responsible for assessing the use of bio-fuels.
SOx and NOx emissions from land-based vehicles has dropped signifi cantly as a result of the introduction of new fuel specifi cations in South Africa in recent years. From 2002, sulphur content in diesel has dropped from 5 500 ppm to 3 000 ppm and from 2005 sulphur content in ULP petrol has dropped from 1 000 ppm to 500 ppm. From 2006, lead was phased out completely from South African petrol and further reduction in permissible sulphur levels in diesel was introduced (down to 500 ppm).
Likewise, the Shipping division is starting to benefi t from the introduction of clean air legislation in a number of shipping jurisdictions (e.g. increasing parts of EU waters) and the resulting market availability of cleaner fuel in and around these jurisdictions.
Planned improvements and new targets
Besides market driven trends towards cleaner fuel availability, measures that the two divisions are undertaking and will undertake to meet these targets, are outlined below.
The Shipping division will meet this objective and target by:
• optimising vessels’ main engines for the most effi cient fuel consumption at 90% maximum continuous rating (implemented);
• fi tting diesel tune systems to ships' engines to optimise main engine performance so as to reduce fuel consumption and emissions (two ships were fi tted in 2009);

page 95G
rindrod Limited / A
nnual Report 2009
• fi tting vessels with power management systems that automatically match the electrical output to the demand in order to save energy, fuel and produce fewer emissions (underway); and
• fi tting dedicated low sulphur fuel oil tanks to vessels (three ships have been fi tted to date).
The Freight Services division (95% of land-based air emissions) will meet this objective and target by:
• ensuring all vehicles are maintained and serviced regularly to optimise engine effi ciency and reduce unnecessary exhaust emissions (underway and ongoing);
• regulating driver speed and routing to reduce consumption and maximise fuel effi ciency (underway and ongoing);
• ensuring payload on carriers is optimised to reduce number of trips needed to deliver required volume (underway and ongoing);
• purchasing more fuel effi cient vehicles and retrofi tting existing vehicles to improve fuel effi ciency;
• conduct a review of the company’s transport fl eet in terms of the status of exhaust catalytic converters and implement a retrofi t programme to replace any older catalytic converters; and
• setting a policy that all new diesel trucks purchased from 2010 are of the Euro 4 standard.
REDUCING CLIMATE CHANGE IMPACTS
Reduce ship-based GHG emissions (CO2-e) per tonne/NM by an average (across the fl eet) of 5% by 2015.
Reduce land-based GHG emissions per kilometre by an average (across the transport fl eet) by 5% by 2015.
Performance and progress in 2009
Mobile combustion of petroleum-based fuels in ships, vehicles, locomotives and site-based equipment such as front-end loaders and forklifts and the resulting CO2 emissions, comprises 96% of Grindrod’s total estimated carbon footprint (on page 98). Fuel is a major cost item for both marine and land-based operations within Grindrod. For this reason all staff are incentivised to look for and implement fuel (and therefore cost) savings and effi ciencies. These efforts go hand in hand with reducing normalised GHG emissions and air pollution.
Average per ship CO2 emissions effi ciency (as per IMO guidelines) dropped 25% from 12g CO2 per tonne. NM in 2008 to 9g CO2 per tonne. NM in 2009. Grindrod has committed to reducing this by a further 5% to 8.5g CO2 per tonne. NM by 2014 (i.e. using 2009 as the new base year).
Planned improvements and new targets
The same initiatives aimed at reducing air pollution (previous objective and target) will assist in reducing normalised GHG emissions from shipping and land-based transport.
2010 will serve as the base year for land-based GHG emissions effi ciency reductions. Grindrod will report GHG emissions per kilometre for the transport fl eet for the fi rst time in 2010 and has committed to reducing this by 5% by 2015.
Reduce total land-based electricity usage (and associated GHG emissions) by 5% by 2015.
Performance and progress in 2009
As the remaining 4% of the group’s carbon footprint comes from using electricity in buildings owned and/or used by the company, the company’s electricity effi ciency drive forms the second most important element of Grindrod’s climate change strategy.
Although total electricity usage for the group in 2009 increased by 11% compared to 2008, this was due to signifi cantly improved coverage in terms of reporting of electricity usage within the group.
Planned improvements and new targets
2008 remains the base year for the 5% reduction target. Energy effi ciency management plans form part of the rollout of ISO 14001 within the group and will facilitate the achievement of this goal.
In addition, the establishment of further normalised electricity-use reduction targets for offi ce based electricity usage (e.g. kWh per m2 of offi ce space or kWh per full time equivalent (FTE)) will be determined by the group environmental and climate change committee in 2010.
USING NATURAL RESOURCES EFFICIENTLY AND MINIMISING WASTE: REDUCE DEPENDENCY ON FOSSIL FUELS
Investigate alternative renewable fuel and energy options where feasible.
Performance and progress in 2009
The economic downturn hampered efforts to invest in alternative energy options.
During 2009, Unicorn Calulo Bunker Services conducted a review of fuel usage, including the use of biodiesel blends.
While fuel reduction devices have been fi tted, biodiesel was not found to be economically viable at this stage.
businessoverview commentaries
annual fi nancialstatements
shareholderinformationsustainability

96 p
age
Grin
drod
Lim
ited
/ A
nnua
l Rep
ort 2
009
Planned improvements and new targets
Future efforts will focus on further opportunities in terms of biofuels and alternatives to coal-fi red electricity (e.g. solar and wind).
ENVIRONMENTAL RISK INSURANCE
All of the above efforts signifi cantly lower Grindrod’s environmental risks. However, the company is also adequately covered by insurance in the event of a major shipping accident.
Performance and progress in 2009
Protection and Indemnity Club cover of US$1 billion is maintained for each ship, accident or collision for oil pollution and resultant environmental liabilities imposed by international convention, national legislation or common law.
Planned improvements and new targets
This level of insurance cover will be maintained.
Environmental performanceEnvironmental performance (continued)(continued)

page 97G
rindrod Limited / A
nnual Report 2009
ENVIRONMENTAL FOOTPRINT SUMMARY – GROUP KEY PERFORMANCE INDICATORS AND TRENDS
Key Performance Indicators 2009 2008 2007 Comments
Water and wastewater (kilolitres)
Water usage 195 555 125 000 100 000 Improved reporting, not comparable year on year
Liquid effl uent and process wastewater 166 000 – – Estimated
Water-use intensity (kilolitres per million Rand revenue)
7.1 3.7 – Improved reporting, expansion of Richards Bay terminal
Solid waste (tonnes)
General – to landfi ll 3 500 421 606 Improved reporting, not comparable year on year
Galley waste – disposed of at sea in accordance with MARPOL
10 37 – Reduction as a result of boundary and operational changes
Liquid and solid chemical waste (oils, solvents, sweepings, etc.) not recycled – disposed of as hazardous waste
3 553 57 – Improved reporting, not comparable year on year
Solid waste – recycled 96 – – 1.3% of total
Energy, fuel and air emissions
Total electricity usage (kWh) 16 776 000 15 093 464 14 587 579
Electricity usage on premises both owned and occupied by Grindrod (kWh) 6 934 514 – –
Diesel usage in all land-based vehicles(kilolitres) 20 063 18 671 4 867
Petrol usage in all land-based vehicles (kilolitres)
250 497 225 50% decrease – refl ects shift from petrol to diesel
Air pollution – SOx emitted (tonnes) 222 172 – Improved reporting
Air pollution – NOx emitted (tonnes) 41 38 –
Total estimated Scope 1 and 2 GHG emissions (tonnes CO2-e)*
327 276 450 000 760 000 Decrease largely due to boundary and operational changes
Total estimated GHG emissions including Scope 3 emissions (tonnes CO2-e)
335 767 Scope 3 not measured
Scope 3 not measured
Estimated GHG emissions intensity from Scope 1 and 2 emissions(gCO2-e per Rand revenue)
12.11 13 –
* See breakdown in table on page 98.
businessoverview commentaries
annual fi nancialstatements
shareholderinformationsustainability

98 p
age
Grin
drod
Lim
ited
/ A
nnua
l Rep
ort 2
009
GRINDROD GROUP GHG EMISSIONS 2009 BREAKDOWN
Scope 1 emissions (tonnes CO2-e) Percentage of total
Mobile combustion (of petroleum-based fuels in ships, vehicles, locomotives and site-based equipment such as front-end loaders and forklifts) 321 003 95.6
Stationary combustion 28
Refrigerant gas emissions 331
Scope 2 emissions
Electricity consumption in buildings owned and operated by Grindrod 5 914 1.8
Scope 3 emissions
Electricity consumption in buildings (operating leases from third parties) 8 485 2.5
Stationary combustion in buildings (operating leases from third parties) 6
Total 335 767
Notes:
1. The 2009 fi gures are for the whole group and cover 100% of the group in terms of the equity share approach adopted.2. The 2009 review revealed gaps in reporting of refrigerant gas usage, which will be rectifi ed in 2010, although it is unlikely that this will
increase the total footprint by more than 1%. 3. Emissions resulting from corporate fl ights and rental cars will be included in future estimates. This is also unlikely to increase the total
footprint by more than 1%.
CARBON FOOTPRINT CONTRIBUTION
Shipping Freight Services
66%
34%
G
RINDRO
D
19
10 - 2010years
100
Environmental performanceEnvironmental performance (continued)(continued)

page 99G
rindrod Limited / A
nnual Report 2009
DIVISIONAL ENVIRONMENTAL PERFORMANCE
SHIPPING
Grindrod’s Shipping division, which comprises Unicorn and Island View Shipping, contributes approximately 66% to Grindrod’s carbon footprint. Unicorn owns/part-owns several vessels, most of which are chartered out and used by third parties. Island View Shipping owns, charters in and operates vessels that are owned by third parties. The majority of the Shipping carbon footprint is from the vessels chartered in and utilised in the Parcel Service of Island View Shipping.
In terms of calculating Grindrod’s carbon footprint, the company applied the principle that where Grindrod accounts for fuel usage, the company accounts for the associated GHG emissions. Grindrod typically accounts for fuel in vessels that it operates. This means that the majority of the shipping carbon footprint is from the vessels chartered in by Island View Shipping. As Grindrod does not own these vessels, the company has little control over technological fuel effi ciency measures, which in turn signifi cantly limits the company’s ability to reduce GHG emissions and/or other pollutants.
However, in line with MARPOL (International Convention for the Prevention of Pollution from Ships) requirements, Grindrod keeps records of water consumption, solid waste and NOx and SOx emissions from all owned vessels. All vessels can generate potable water from sea water, and consumption is therefore kept to a minimum. Solid waste contributes 6% to the group’s total waste generation.
No marine pollution incidents were recorded for any vessels that Grindrod has operational control over.
Unicorn Calulo Bunker Services plans to reduce engine emissions by 20% by June 2010. This will be achieved by:
• conducting a baseline audit of engine and generator emissions (underway);
• reducing generator operating hours by utilisation of shore power where possible; and
• fi tment of fuel conditioning units on the engine and generator fuel supply lines to condition and clean fuel, improving combustion effi ciency and reducing emissions accordingly.
Air pollution including Greenhouse gases,NOx and SOxParticulates and ozone depleting substances
Disposal at sea:Biodegradable waste;Ballast water; Bilge water;Sewage and grey water
Fuel; Paint;Lubricants;Cleaning chemicals
Disposal on land:Solid waste; Hazardouswaste (paints, used oil,cleaning chemicals etc);Sewage;End-of-life ships
Key environmental inputs and outputs for Shipping division's marine activities
G
RINDRO
D
19
10 - 2010years
100
businessoverview commentaries
annual fi nancialstatements
shareholderinformationsustainability

100
page
Grin
drod
Lim
ited
/ A
nnua
l Rep
ort 2
009
ENVIRONMENTAL FOOTPRINT – SHIPPING
Key performance indicators 2009 2008 Comments
Water usage and wastewater discharged (kilolitres)
Water usage 548 3 467 Reduction as a result of boundary and operational changes (i.e. number of ships generating water during the year) as opposed to water conservation efforts per se)
Liquid effl uent and process wastewater 1 390 Not measured
Water-use intensity (kilolitres per million Rand revenue)
0.7 –
Liquid effl uent (domestic/toilet) – disposed of at sea in accordance with MARPOL 4 799 2 277
Solid and liquid chemical waste (tonnes)
Solid waste – general (to landfi ll) 50 84
Liquid chemical waste (oils, solvents, etc.) – disposed of at landfi ll sites as hazardous waste 219 Not measured
Galley waste – disposed of at sea in accordance with MARPOL 10 37
Solid waste – recycled 17 Not measured
Energy, fuel and air emissions
Total electricity usage (kWh) Included in group total fi gures (offi ces are located in Durban)
Total marine diesel oil consumed (kilolitres) 3 423 7 154
Total heavy fuel oil consumed (kilolitres) – 108 396
Total intermediate fuel oil (kilolitres) 65 000Included in
above fi gure
Air pollution – SOx emitted (tonnes) 214 164
Air pollution – NOx emitted (tonnes) 41 38
Total estimated GHG emissions in the shipping division (tonnes CO2-e) 215 677 380 000
Decrease largely due to boundary and operational changes
Average per-ship CO2 emissions effi ciency (as per IMO guidelines) (gCO2-e per tonne-NM) 9 12
For the chartered vessels operated in the Shipping division
Range per-ship CO2 emissions effi ciency (gCO2 per tonne-NM) 6 – 31 2 – 33
Estimated GHG emissions intensity from Scope 1 and Scope 2 emissions – Shipping division(gCO2-e per Rand revenue) 24 20
Note: Fuel consumption fi gures and total estimated GHG emissions are from 89 chartered in vessels and one owned – and does not include fuel/emissions from Grindrod owned vessels that are chartered out, where clients pay for fuel and are responsible for accounting for the resulting emissions.
Environmental performanceEnvironmental performance (continued)(continued)

page 101G
rindrod Limited / A
nnual Report 2009
FREIGHT SERVICESThis division comprises business units undertaking freight transport and business units supporting the freight transport industry in southern Africa. Grindrod Logistics undertakes road freight transport. There is also involvement in rail and seafreight transport. The other business units in the division provide the interface between sea and land freight transportation such as terminals, stevedoring and intermodal. The Freight Services division owns and operates over 1 100 road vehicles throughout southern Africa.
Environmental impacts and risks of the logistics business units include:
• fl eet maintenance: storage of oils and solvents and generation of oil-based hazardous waste;
• waste and effl uent during maintenance and washing of vehicles;
• storage of bulk fuel, refi lling and refuelling activities;
• use of refrigerant gases for the transport of perishable cargo;
• potential for accidents and associated fuel spillages en-route, especially with regards to bulk liquid transport; and
• waste tyres, end-of-life vehicles.
The business units providing a service to the freight industry (including terminals, stevedoring, intermodal) are the greatest water users, consuming 88% of the group’s total water consumption (182 589 kilolitres). Use of electricity, use and storage of oil, fuel, cleaning agents and generation of industrial waste and effl uent, are the other key environmental aspects associated with these business units.
During the year, the Freight Services division:
• established a divisional environmental committee reporting to the divisional CEO;
• appointed a senior-level health, safety and environment (HSE) manager;
• commenced an environmental risk audit programme covering all Freight Services division sites; and
• set a target of having all business units ISO 14001 certifi cation ready by July 2011.
Freight Services company Grindrod Logistics Perishable Cargo Agents (Grindrod PCA) participated in a world-fi rst initiative in 2009, whereby four South African perishable freight agents signed what is believed to be the fi rst CO2 compensation agreement. In terms of the agreement, led by Air France Cargo and KLM Cargo, Grindrod PCA compensated at least 50% of the CO2 emitted by the transportation of fruit during the months November and December 2009.
Air pollution including greenhouse gasesNOx, SOx particulates and ozone depleting substances
Fuel;Tyres;Lubricants;Offi ce-based resources (e.g. paper, electricity)Water
General and trade waste;Hazardous waste;Tyres;End-of-life vehicles;Trade effl uent and wastewater
Key environmental inputs and outputs for Freight Services division
G
RINDRO
D
19
10 - 2010years
100
businessoverview commentaries
annual fi nancialstatements
shareholderinformationsustainability

102
page
Grin
drod
Lim
ited
/ A
nnua
l Rep
ort 2
009
Environmental performance Environmental performance (continued)(continued)
ENVIRONMENTAL FOOTPRINT – FREIGHT SERVICES
Key performance indicators 2009 2008 Comment
Water usage and wastewater discharged (kilolitres)
Water usage 182 589 111 187
Liquid effl uent and process wastewater 164 000 Not measured Estimated – based on water consumption
Water-use intensity (kilolitres per million Rand revenue)
48.3 –
Solid and liquid chemical waste (tonnes)
Solid waste – general (to landfi ll) 3 400 295
Liquid and solid chemical waste (oils, solvents, sweepings, etc.) 3 334 297
Solid waste – recycled 76 Not measured
Energy, fuel and air emissions
Total electricity usage (kWh) 15 370 677 14 538 700
Diesel usage in land-based vehicles(kilolitres) 20 062 18 653
Petrol usage in land-based vehicles (kilolitres) 196 448
Air pollution – SOx emitted (tonnes) 8.42 7.83
GHG emissions from combustion of diesel and petrol in owned or operated mobile land sources (fl eet, locomotives, moving machinery, etc.) (tonnes CO2-e) 55 034 50 939
GHG emissions as per equity share from combustion of marine diesel oil and heavy fuel oil in seafreight (Ocean Africa Container Lines) (tonnes CO2-e) 50 239 Not measured
GHG emissions from combustion of petrol and diesel in back-up generators (of which some are Scope 3 emissions as they are operated on leased property under operating lease agreements) (tonnes CO2-e) 34 Not measured
GHG emissions from refrigerant gas use in the Perishable Cargo business unit (tonnes CO2-e) 299 Not measured
Scope 2 and Scope 3 emissions from use of purchased electricity (tonnes CO2-e)
Scope 2 – 5 914 Scope 3 – 8 417
Fleet fuel effi ciencies (kg CO2 per km)Auto Carriers – 1.18
Logistics Furniture – 0.89Bulk Transport – 1.36
Not measured
Estimated GHG emissions intensity from Scope 1 and Scope 2 emissions – Freight Services division(gCO2-e per Rand revenue) 44 54

page 103G
rindrod Limited / A
nnual Report 2009
TRADING
The Trading division (comprising Oreport, Cockett Marine Oil and Atlas Trading and Shipping) has offi ces in South Africa, the United Kingdom, France, Singapore, South Korea and China. All offi ces are leased under operating lease agreements.
The main direct environmental impacts are offi ce-based, such as electricity use, paper use, waste generation and greenhouse gas emissions from company cars. Offi ce activities also result in the generation of hazardous waste, including fl uorescent light bulbs and redundant electronic equipment (e-waste). Water consumption is generally covered in rental agreements and not measured.
Paper waste is a signifi cant source of waste. This year an estimated 30% of paper waste was recycled. The aim is to improve this to 100% by 2015.
Selected energy and GHG emissions for Trading division
Electricity consumption 114 587 kWh
GHG emissions from electricity, taking into account the different emission factors for electricity generation in each country of operation (all are Scope 3 emissions as all are from electricity used within an operating lease agreement).
67.8 tonnes CO2-e
GHG emissions from company vehicles
53.25 tonnes CO2-e
Note: Other KPIs have been incorporated in group totals.
FINANCIAL SERVICES AND HEAD OFFICE
Historically Grindrod used individual servers. Now a single data centre is used, which uses much less electricity and generates less heat.
The IT department undertakes assessments of power-saving attributes prior to acquiring new equipment.
Grindrod has identifi ed that there are not adequate facilities for receiving and handling e-waste in South Africa and is in discussions with HP to explore improved take-back possibilities. Grindrod’s IT department also facilitates used cartridge and paper recycling.
Selected environmental KPIs for head offi ce and Financial Services
Electricity consumption for Grindrod House, Grindrod Mews and Mansion House (Grindrod Durban head offi ce buildings)
1 290 736 kWh
GHG emissions from purchased electricity (Scope 2)
1 122 tonnes CO2-e
Water consumption 11 964 kl
Note: Other KPIs have been incorporated in group totals.
businessoverview commentaries
annual fi nancialstatements
shareholderinformationsustainability

104
page
Grin
drod
Lim
ited
/ A
nnua
l Rep
ort 2
009
G3 G3 GRIGRI content index content index
The Global Reporting Initiative (GRI) is a global multistakeholder network of thousands of experts worldwide, who participate in the GRI’s working groups and governance bodies to provide a universally accepted, trusted and credible framework for sustainability reporting. The following table provides a summary of Grindrod’s reporting against the criteria of the Global Reporting Initiative’s Sustainability Reporting Guidelines (www.globalreporting.org).
NR – Not reportedN/A – Not applicable
GRI reference Description Page number
Strategy and profi le1.1 CEO statement 14 – 171.2 Description of key impacts, risks and opportunities 74 – 77
Organisational profi le2.1 Name of the organisation 1 2.2 Primary brands, products and/or services 1 – 5 2.3 Operational structure of the organisation 4 – 52.4 Location of organisation's headquarters 12.5 Number of countries where the organisation operates 1 2.6 Nature of ownership and legal form 1 – 5 2.7 Markets served 1, 16, 28, 422.8 Scale of the reporting organisation 12.9 Signifi cant changes to company during the reporting period 14 – 16, 28, 42, 53 2.10 Awards received in the reporting period 80
Report parameters3.1 Reporting period 58 3.2 Date of most recent previous report Company website 3.3 Reporting cycle Annual 3.4 Contact point for questions regarding the report or its contents 185 3.5 – 3.11 Report scope and boundary 58, 89 3.12 GRI content index 104 – 105 3.13 Assurance 58, 66
Governance, commitments and engagement4.1 – 4.10 Corporate governance 59 – 64 4.11 – 4.13 Commitments to external initiatives 85 – 86 4.14 – 4.17 Stakeholder engagement 87 – 88
MANAGEMENT APPROACH AND PERFORMANCE INDICATORSEconomic performance
Management approach NR EC1 Direct economic value generated and distributed 58 EC2 Financial implications and other risks and opportunities for the organisation's activities due to
climate change95
EC3 Coverage of the organisation's defi ned benefi t plan obligations 58 EC4 Signifi cant fi nancial assistance received from government NREC5 Range of ratios of standard entry level wage compared to local minimum wage at signifi cant
locations of operationNR
EC6 Policy, practices and proportion of spending on locally-based suppliers at signifi cant locations of operation
NR
EC7 Procedures for local hiring and proportion of senior management hired from the local community 79 – 81EC8 Development and impact of infrastructure investments and services provided primarily for public
benefi t through commercial, in-kind, or pro bono engagement85 – 86
EC9 Understanding and describing signifi cant indirect economic impacts NR
Environmental performanceManagement approach 89
EN1 – EN2 Materials and recycling 94, 97, 100,102EN3 – EN7 Energy and energy conservation 95, 97, 100,102 EN8 – EN10 Water and water conservation 93, 97, 100,102 EN11 – EN15 Biodiversity and natural ecosystem impacts 92 – 93, 97, 100, 102EN16 – EN18 Greenhouse gas (GHG) emissions 95, 97, 100, 102EN19 Emissions of ozone-depleting substances 99EN20 NOx, SOx and other signifi cant air emissions 94 – 95, 97, 100, 102

page 105G
rindrod Limited / A
nnual Report 2009
businessoverview commentaries
annual fi nancialstatements
shareholderinformationsustainability
NR – Not reportedN/A – Not applicable
GRI reference Description Page number
Environmental performance (continued)EN21 Water discharge 93, 97, 100, 102EN22 Waste 94, 97, 100, 102EN23 Total number and volume of signifi cant spills 93EN24 Transport of hazardous waste 92EN25 Impacts to water bodies by discharges of water and run-off 92 – 93EN26 Initiatives to mitigate environmental impacts of products and services and extent of impact
mitigationNR
EN27 Packaging materials reclaimed 94, 97, 100, 102EN28 Fines and non-monetary sanctions for environmental non-compliance 91EN29 Environmental impacts of transporting products 92, 94, 99 –102EN30 Environmental protection expenditure NR
Social: Labour practices and decent workManagement approach 78
LA1 – LA2 Workforce composition 78, 81LA3 Employee benefi ts 78, 79, 82LA4 Collective bargaining agreements (trade unions) 79LA5 Minimum notice period(s) 79LA6 – LA9 Occupational health and safety 83 – 84LA10 – LA11 Training and skills development 82 – 83LA12 Employee performance and career development reviews 78 – 79LA13 Employee gender, age, minority group membership and other indicators of diversity 79 – 81LA14 Ratio of basic salary of men to women by employee category NR
Social: Human rights Management approach 78, 83
HR1 – HR9 Human rights disclosure 83
Social: SocietyManagement approach NR
SO1 Impacts of operations on communities NRSO2 Business units analysed for risks related to corruption 64SO3 Anti-corruption policies and procedure training 64SO4 Actions taken in response to incidents of corruption N/ASO5 Public policy positions and participation in public policy development and lobbying 87 – 88SO6 Contributions to political parties N/A (None)SO7 Legal actions for anti-competitive behaviour, anti-trust and monopoly practices and their
outcomesN/A
SO8 Fines and non-monetary sanctions for non-compliance with laws and regulations N/A (None)
Social: Product responsibility Management approach NR
PR1 Health and safety impacts of products and services NRPR2 Incidents of non-compliance with regulations and voluntary codes concerning health and safety
impacts of products and services during their life cycleNR (None)
PR3 Type of product and service information required by procedures and percentage of signifi cant products and services subject to such information requirements
NR
PR4 Incidents of non-compliance with regulations and voluntary codes concerning product and service information and labelling
NR (None)
PR5 Practices related to customer satisfaction, including results of surveys measuring customer satisfaction
87
PR6 Programmes for adherence to laws, standards and voluntary codes related to marketing communications
NR
PR7 Incidents of non-compliance with regulations and voluntary codes concerning marketing communications
NR (None)
PR8 Substantiated complaints regarding breaches of customer privacy and losses of customer data NR (None)PR9 Signifi cant fi nes for non-compliance with laws and regulations concerning the provision and use
of products and servicesNR (None)

pa
ge 1
06G
rindr
od L
imite
d /
Ann
ual R
epor
t 200
910
6 pa
ge
Grin
drod
Lim
ited
/ A
nnua
l Rep
ort 2
009

page 107G
rindrod Limited / A
nnual Report 2009
businessoverview commentary sustainability
shareholderinformation

108
page
Grin
drod
Lim
ited
/ A
nnua
l Rep
ort 2
009
Directors’ responsibi l i ty and approvalDirectors’ responsibi l i ty and approval
Certificate by company secretaryCertificate by company secretary
The directors of Grindrod Limited have pleasure in presenting the annual fi nancial statements for the year ended 31 December 2009.
In terms of the South African Companies Act, 1973, as amended, the directors are required to prepare annual fi nancial statements that fairly present the state of affairs and business of the company and of the group at the end of the fi nancial year and of the profi t or loss for that year. To achieve the highest standards of fi nancial reporting, these annual fi nancial statements have been drawn up to comply with International Financial Reporting Standards.
The annual fi nancial statements comprise:
• accounting policies; • statements of fi nancial position;• income statements;• statements of comprehensive income;• statements of changes in equity;• statements of cash fl ows;• segmental analysis; and• notes.
The reviews by the chairman, the chief executive offi cer, the fi nancial director and the detailed operational reports discuss the results of operations for the year and those matters which are material for an appreciation of the state of affairs and business of the company and of the Grindrod group.
Supported by the audit committee, the directors are satisfi ed that the internal controls, systems and procedures in operation provide reasonable assurance that all assets are safeguarded, that transactions are properly executed and recorded and that the possibility of material loss or misstatement is minimised. The directors have reviewed the appropriateness of the accounting policies and concluded that estimates and judgements are prudent. They are of the opinion that the annual fi nancial statements fairly present in all material respects the state of affairs and business of the company and the group at 31 December 2009 and of the profi t for the year to that date. The external auditors, who have unrestricted access to all records and information, as well as to the audit committee, concur with this statement.
In addition, the directors have also reviewed the cash fl ow forecast for the year to 31 December 2010 and believe that the Grindrod group has adequate resources to continue in operation for the foreseeable future. Accordingly, the annual fi nancial statements have been prepared on a going concern basis and the external auditors concur.
The annual fi nancial statements set out on pages 112 to 173 were approved by the board of directors on 17 February 2010 and were signed on their behalf by:
I A J Clark A K OlivierChairman Chief executive offi cer
In terms of section 268G(d) of the South African Companies Act, 1973, as amended (the Act), I certify that Grindrod Limited has lodged with the Registrar of Companies all such returns as are required of a public company in terms of the Act. Further, that such returns are true, correct and up to date.
C A S RobertsonCompany secretary
Durban17 February 2010

page 109G
rindrod Limited / A
nnual Report 2009
Independent auditor’s re[portIndependent auditor’s re[port
TO THE MEMBERS OF GRINDROD LIMITED
Report on the fi nancial statements We have audited the annual fi nancial statements and group annual fi nancial statements of Grindrod Limited which comprise the directors’ report, the audit committee report, the statement of fi nancial position and consolidated statement of fi nancial position as at 31 December 2009, the income statement and consolidated income statement, the statement of comprehensive income and the consolidated statement of comprehensive income, the statement of changes in equity and consolidated statement of changes in equity and statement of cash fl ows and consolidated statement of cash fl ows for the year then ended, a summary of signifi cant accounting policies and other explanatory notes, as set out on pages 112 to 173.
Directors’ responsibility for the fi nancial statementsThe company’s directors are responsible for the preparation and fair presentation of these fi nancial statements in accordance with International Financial Reporting Standards and in the manner required by the Companies Act of South Africa. This responsibility includes: designing, implementing and maintaining internal control relevant to the preparation and fair presentation of fi nancial statements that are free from material misstatement, whether due to fraud or error; selecting and applying appropriate accounting policies; and making accounting estimates that are reasonable in the circumstances.
Auditor’s responsibility Our responsibility is to express an opinion on these fi nancial statements based on our audit. We conducted our audit in accordance with International Standards on Auditing. Those standards require that we comply with ethical requirements and plan and perform the audit to obtain reasonable assurance whether the fi nancial statements are free from material misstatement.
An audit involves performing procedures to obtain audit evidence about the amounts and disclosures in the fi nancial statements. The procedures selected depend on the auditor’s judgement, including the assessment of the risks of material misstatement of the fi nancial statements, whether due to fraud or error. In making those risk assessments, the auditor considers internal control relevant to the entity’s preparation and fair presentation of the fi nancial statements in order to design audit procedures that are appropriate in the circumstances, but not for the purpose of expressing an opinion on the effectiveness of the entity’s internal control. An audit also includes evaluating the appropriateness of accounting policies used and the reasonableness of accounting estimates made by the directors, as well as evaluating the overall fi nancial statement presentation.
We believe that the audit evidence we have obtained is suffi cient and appropriate to provide a basis for our audit opinion.
Opinion In our opinion, the fi nancial statements present fairly, in all material respects, the fi nancial position of the company and the group as at 31 December 2009 and the results of their operations and their cash fl ows for the year then ended in accordance with International Financial Reporting Standards and in the manner required by the Companies Act of South Africa.
Deloitte and ToucheRegistered Auditors
Per A G WallerPartner
Durban17 February 2010
2 Pencarrow CrescentPencarrow ParkLa Lucia Ridge Offi ce EstateLa Lucia4051
National Executive: G G Gelink (Chief executive), A E Swiegers (Chief operating offi cer), G M Pinnock (Audit), D L Kennedy (Tax & legal and risk advisory), L Geeringh (Consulting), L Bam (Corporate fi nance), C R Beukman (Finance), T J Brown (Clients and markets), N T Mtoba (Chairman of the board), C R Qually (Deputy chairman of the board).
businessoverview commentaries sustainability
annual fi nancialstatements
shareholderinformation

110
page
Grin
drod
Lim
ited
/ A
nnua
l Rep
ort 2
009
Directors’ reportDirectors’ report
The directors have pleasure in presenting their annual report which forms part of the annual fi nancial statements of the company and of the group for the year ended 31 December 2009.
Nature of businessThe nature of the group’s business is set out under the group profi le on pages 1 to 5.
Financial resultsThe fi nancial results for the year ended 31 December 2009 are set out in detail on pages 122 to 173 of these annual fi nancial statements.
Year-end reviewThe year under review is fully covered in the chairman’s, the chief executive’s and the fi nancial director’s reviews.
Share capitalDetails of the authorised and issued shares are shown on page 147 and the share analysis is shown on pages 178 to 179. The directors propose that the authority granted to them to control the unissued shares be renewed.
The directors propose that the general authority granted to them to repurchase ordinary shares as opportunities present themselves be renewed at the forthcoming annual general meeting.
The issued share capital increased by 3 950 000 ordinary shares as a result of the allotment and issue of new shares in terms of the Grindrod Limited share option scheme during the year under review.
DividendsThe directors have declared a fi nal dividend of 30 cents per ordinary share (2008: 68 cents). Dividends paid or payable in respect of the year were as follows:
Date ofdeclaration
(cents)
Last day totrade cum-
dividend
Tradingex-dividend
commencesRecord
datePayment
date
Amountper share
(cents)
Interim 18.08.2009 04.09.2009 07.09.2009 11.09.2009 14.09.2009 30
Final 17.02.2010 05.03.2010 08.03.2010 12.03.2010 15.03.2010 30
The directors have also declared a dividend of 428 cents per preference share (2008: 623 cents) which will be paid on the same day as the fi nal dividend to ordinary shareholders referred to above.
DirectorsBrief curricula vitae of the current directors are given on pages 6 to 9. Details of directors’ remuneration and the share option schemes appear on pages 67 to 73.
Change in directorateMessrs M R Faku, M J Hankinson and S D M Zungu were appointed to the board as non-executive directors on 15 December 2009. Ms N T Y Siwendu resigned as a director on 1 January 2010.
According to the company’s articles of association, at the forthcoming annual general meeting, Messrs I M Groves, J G Jones, R A Norton, A F Stewart and L R Stuart-Hill retire by rotation. All are eligible and have offered themselves for re-election, with the exception of Mr R A Norton who has not made himself available for re-election and will retire on 19 May 2010.
Company secretary and registered offi ceThe company secretary is Mr C A S Robertson and his address and that of the registered offi ce are as follows:
Business address Postal addressQuadrant House PO Box 1115 Margaret Mncadi Avenue Durban 4000Durban 4000 South AfricaSouth Africa
page 111G
rindrod Limited / A
nnual Report 2009
Subsidiary companiesInformation on subsidiary and associate companies is contained on pages 137 to 138 and 177 respectively. Reviews of the businesses and performance of the main operating subsidiary companies are covered in the divisional reviews on pages 28 to 55.
International Financial Reporting Standards (IFRS)The company’s fi nancial statements were prepared in terms of International Financial Reporting Standards as issued by the International Accounting Standards Boards (IASB) and are consistent with those applied in the previous year, except for the adoption of the revised IAS 1 Presentation of Financial Statements and IFRS 8 Operating Segments. The adoption of these new standards has resulted in certain disclosure reclassifi cation, but has not resulted in any changes in accounting policy.
Going concernThe directors consider that the company has adequate resources to continue operating for the foreseeable future and that it is therefore appropriate to adopt the going concern basis in preparing the company’s fi nancial statements. The directors have satisfi ed themselves that the company is in a sound fi nancial position and that it has access to suffi cient borrowing facilities to meet its foreseeable cash requirements.
Major shareholdersShareholders holding benefi cially, directly or indirectly, in excess of 5% of the issued share capital of the company are detailed onpages 178 to 179 of the annual report.
Special resolutionsA renewal of authority for the company or its subsidiaries to repurchase its own shares was obtained at the 2009 annual general meeting.
There have been no special resolutions other than those referred to in this report passed by the company or its subsidiaries, the nature of which might be signifi cant to members in their appreciation of the state of affairs of the group.
Employee retirement benefi t plansDetails of the group’s employee retirement benefi t plans are separately disclosed in note 19.
Holding companyGrindrod Limited had no holding company at 31 December 2009.
AuditorsDeloitte and Touche will continue in offi ce in accordance with section 270 (2) of the South African Companies Act.
Subsequent eventsNo material change has taken place in the affairs of the group between the end of the fi nancial year and the date of this report.
businessoverview commentaries sustainability
annual fi nancialstatements
shareholderinformation

112
page
Grin
drod
Lim
ited
/ A
nnua
l Rep
ort 2
009
Accounting policiesAccounting policies
BASIS OF PREPARATIONAccounting frameworkThe fi nancial statements are prepared in accordance with International Financial Reporting Standards (IFRS) as issued by the International Accounting Standards Board using the historical cost convention except for certain fi nancial instruments that are stated at fair value.
The basis of preparation is consistent with the prior year, except for new and revised standards and interpretations adopted per note 1 to the fi nancial statements.
Underlying conceptsThe fi nancial statements are prepared on the going concern basis using accrual accounting.
Assets and liabilities and income and expenses are not offset unless specifi cally permitted by an accounting standard.
Financial assets and fi nancial liabilities are offset and the net amount reported only when a legally enforceable right to set off the amounts exists and the intention is either to settle on a net basis or to realise the asset and settle the liability simultaneously.
Changes in accounting policies are accounted for in accordance with the transitional provisions in the standards. If no such guidance is given, they are applied retrospectively, unless it is impracticable to do so, in which case they are applied prospectively.
Changes in accounting estimates are recognised in profi t or loss. Prior period errors are retrospectively restated unless it is impracticable to do so, in which case they are applied prospectively.
Recognition of assets and liabilitiesAssets are only recognised if they meet the defi nition of an asset, it is probable that future economic benefi ts associated with the asset will fl ow to the group and the cost or fair value can be measured reliably.
Liabilities are only recognised if they meet the defi nition of a liability, it is probable that future economic benefi ts associated with the liability will fl ow from the group and the cost or fair value can be measured reliably.
Financial instruments are recognised when the entity becomes a party to the contractual provisions of the instrument. Financial assets and liabilities as a result of fi rm commitments are only recognised when one of the parties has performed under the contract.
Derecognition of assets and liabilitiesFinancial assets are derecognised when the contractual rights to receive cash fl ows have been transferred or have expired or when substantially all the risks and rewards of ownership have passed.
All other assets are derecognised on disposal or when no future economic benefi ts are expected from their use.
Financial liabilities are derecognised when the relevant obligation has either been discharged, cancelled or expired.
Foreign currenciesThe functional currency of each entity within the group is determined based on the currency of the primary economic environment in which that entity operates. Transactions in currencies other than the entity’s functional currency are recognised at the rates of exchange ruling on the date of the transaction.
Monetary assets and liabilities denominated in such currencies are translated at the rates of exchange ruling at the statement of fi nancial position date.
Gains and losses arising on exchange differences are recognised in profi t or loss in the period in which they arise except for:
• exchange differences on foreign currency borrowings relating to assets under construction for future productive use, which are included in the cost of those assets when they are regarded as an adjustment to interest costs on those foreign borrowings;
• exchange differences on transactions entered into in order to hedge certain foreign currency risks; and• exchange differences on monetary items receivable or payable to a foreign operation for which settlement is neither planned nor likely to
occur, which are recognised initially in other comprehensive income and reclassifi ed from equity to profi t or loss on disposal of the net investment.
The fi nancial statements of entities within the group whose functional currencies are different to the group’s presentation currency, which is South African Rand, are translated as follows:
• assets, including goodwill and liabilities at exchange rates ruling on the statement of fi nancial position date;• income items, expense items and cash fl ows at the average exchange rates for the period; and• equity items at the exchange rate ruling when they arose.
Resulting exchange differences are recognised in other comprehensive income and accumulated in equity. On disposal of such a business unit, this reserve is recognised in profi t or loss.
Segmental reportingSegment accounting policies are consistent with those adopted for the preparation of the group fi nancial statements. The principal segments of the group have been identifi ed on a primary basis by business segment which is representative of the internal reporting used for management purposes as well as the source and nature of business risks and returns.
for the year ended 31 December 2009for the year ended 31 December 2009

page 113G
rindrod Limited / A
nnual Report 2009
All segment revenue and expenses are directly attributable to the segments. Segment assets include all operating assets used by a segment and consist principally of ships, property, terminals, vehicles and equipment, as well as current assets. Segment liabilities include all operating liabilities. These assets and liabilities are all directly attributable to the segments. All intra-segment transactions are eliminated on consolidation.
Events after the reporting period dateRecognised amounts in the fi nancial statements are adjusted to refl ect events arising after the statement of fi nancial position date that provide additional evidence of conditions that existed at such date. Events after the reporting period date that are indicative of conditions that arose after the reporting period date are dealt with by way of a note.
Comparative fi guresComparative fi gures are restated in the event of a change in accounting policy or a prior period error.
COMPANY FINANCIAL STATEMENTSSubsidiaries, associates and joint venturesInvestments in subsidiaries, associates and joint ventures in the separate fi nancial statements presented by the company are recognised at cost.
CONSOLIDATED FINANCIAL STATEMENTSInterests in subsidiariesThe consolidated fi nancial statements incorporate the assets, liabilities, income, expenses and cash fl ows of the company and all entities controlled by the company (its subsidiaries) as if they were a single economic entity. Control is achieved where the company has the power to govern the fi nancial and operating policies of the acquired entity so as to obtain benefi ts from its activities.
The results of subsidiaries acquired or disposed of during the year are included in the consolidated income statement and statement of comprehensive income from the effective date of acquisition or up to the effective date of disposal, as appropriate.
Where necessary, adjustments are made to the fi nancial statements of subsidiaries to bring the accounting policies used into line with those used by the group.
All material inter-company balances and transactions are eliminated.
Minority interests in the net assets of consolidated subsidiaries are shown separately from the group equity therein. It consists of the amount of those interests at acquisition plus the minorities’ subsequent share of changes in equity of the subsidiary. On acquisition, the minorities’ interest is measured at the proportion of the pre-acquisition fair values of the identifi able assets and liabilities acquired. Losses applicable to minorities in excess of their interest in the subsidiaries’ equity are allocated against the group’s interest except to the extent that the minorities have a binding obligation and the fi nancial ability to cover losses. Minorities are considered to be equity participants and all transactions with minorities are recorded directly within equity.
Interests in associate companiesAn associate is an entity over which the group has signifi cant infl uence and that is neither a subsidiary nor an interest in a joint venture. Signifi cant infl uence is the power to participate in the fi nancial and operating policy decisions of the investee but is not control or joint control over those policies. The consolidated fi nancial statements incorporate the assets, liabilities, income and expenses of associates using the equity method of accounting from the acquisition date to the disposal date, except when the investment is classifi ed as held for sale, in which case it is accounted for as non-current assets held for sale. The carrying amount of such investments is reduced to recognise any decline, other than a temporary decline, in the value of individual investments. Losses of associates in excess of the group’s interest are only recognised to the extent that the group has incurred legal or constructive obligations or made payments on behalf of the associate.
Goodwill arising on the acquisition of associates is accounted for in accordance with the accounting policy for goodwill as set out below and is included in the carrying amount of the associate.
Where a group entity transacts with an associate of the group, unrealised profi ts and losses are eliminated to the extent of the group’s interest in the relevant associate.
Interests in joint venturesA joint venture is a contractual arrangement whereby the group and other parties undertake an economic activity that is subject to joint control. The group reports its interests in jointly controlled entities using proportionate consolidation, except when the investment is classifi ed as held for sale, in which case it is accounted for as non-current assets held for sale and discontinued operations. The group’s share of the assets, liabilities, income and expenses of jointly controlled entities is combined with the equivalent items in the consolidated fi nancial statements on a line-by-line basis.
Any goodwill arising on the acquisition of the group’s interest in a jointly controlled entity is accounted for in accordance with the group’s accounting policy for goodwill arising on the acquisition of a subsidiary.
Where the group transacts with its jointly controlled entities, unrealised profi ts and losses are eliminated to the extent of the group’s interest in the joint venture.
businessoverview commentaries sustainability
annual fi nancialstatements
shareholderinformation

114
page
Grin
drod
Lim
ited
/ A
nnua
l Rep
ort 2
009
Accounting policiesAccounting policies (continued)(continued)
FINANCIAL STATEMENT ITEMSSTATEMENT OF FINANCIAL POSITIONShips, property, terminals, vehicles and equipmentShips are measured at cost less accumulated depreciation and any impairment losses. Cost comprises acquisition cost and costs directly related to the acquisition up until the time when the asset is ready for use, including interest expense incurred during the period. The market average useful life of a ship is estimated to range from 25 to 30 years at which point it would usually be scrapped. The group maintains a young fl eet compared to the market average and estimates useful life as 15 years from date of delivery for new ships. Ships are depreciated on a straight-line basis to an estimated residual value over their useful life to the group.
From time to time the group’s vessels are required to be dry-docked for inspection and re-licensing at which time major repairs and maintenance that cannot be performed while the vessels are in operation are generally performed. The group capitalises the costs associated with dry-docking as they occur by adding them to the cost of the vessel and amortises these costs on a straight-line basis over 2,5 years, which is generally the period until the next scheduled dry-docking.
In the cases where the dry-docking takes place earlier than 2,5 years since the previous one, the carrying amount of the previous dry-docking is derecognised. In the event of a vessel sale, the respective carrying values of dry-docking costs are derecognised together with the vessel’s carrying amount at the time of sale. At the date of acquisition of a vessel, management estimates the component of the cost that corresponds to the economic benefi t to be derived until the next scheduled dry-docking of the vessel under the ownership of the group and this component is depreciated on a straight-line basis over the remaining period to the estimated dry-docking date.
Terminals, vehicles and equipment are refl ected at cost and are depreciated over their estimated useful lives to estimated residual values, on a straight-line basis as follows:
Locomotives 15 yearsTerminals and machinery 5 - 20 yearsInformation technology equipment 3 - 5 yearsVehicles 3 - 10 years
Depreciation commences when the assets are ready for their intended use. Where signifi cant parts of an item have different useful lives to the item itself, these parts are depreciated over their estimated useful lives. The methods of depreciation, useful lives and residual values are reviewed annually.
Assets that are held for rental are initially classifi ed as ships, property, terminals, vehicles and equipment. When these assets cease to be rented and a decision is made to sell these assets, the carrying amount is transferred to current assets (inventories) as “held for sale”. Upon sale of the “held for sale” assets, the sales value is recorded in gross revenue and the related carrying value of these assets recorded in cost of sales.
Freehold land is refl ected at cost and not depreciated. Buildings are refl ected at cost and depreciated to estimated residual value over their useful life to the group, currently estimated at 50 years from the date of acquisition. Where the estimated residual value exceeds the cost, depreciation is not provided.
Properties in the course of construction for production, supply or administrative purposes, or for purposes not yet determined, are carried at cost, less any recognised impairment loss. Cost includes professional fees and, for qualifying assets, borrowing costs capitalised in accordance with the group’s accounting policy. Depreciation of these assets, on the same basis as other property assets, commences when the assets are ready for their intended use.
Expenditure relating to leasehold properties is capitalised and depreciated over the period of the lease, or 25 years, whichever is the lesser period.
Intangible assetsGoodwillGoodwill represents the future economic benefi ts arising from assets that are not capable of being individually identifi ed and separately recognised in a business combination and is determined as the excess of the cost of acquisition over the group’s interest in the net fair value of the identifi able assets, liabilities and contingent liabilities of the subsidiary, associate or joint venture recognised at the date of acquisition.
Goodwill is initially recognised as an asset at cost and is subsequently measured at cost less any accumulated impairment losses.
For the purpose of impairment testing, goodwill is allocated to each of the group’s cash-generating units expected to benefi t from the synergies of the combination. Cash-generating units to which goodwill has been allocated are tested for impairment annually, or more frequently when there is an indication that the unit may be impaired. If the recoverable amount of the cash-generating unit is less than the carrying amount of the unit, the impairment loss is allocated fi rst to reduce the carrying amount of any goodwill allocated to the unit and then to the other assets of the unit pro-rata on the basis of the carrying amount of each asset in the unit. An impairment loss recognised for goodwill is not reversed in a subsequent period.
On disposal of a subsidiary, associate or jointly controlled entity, the attributable amount of goodwill is included in the determination of the profi t or loss on disposal.
for the year ended 31 December 2009for the year ended 31 December 2009

page 115G
rindrod Limited / A
nnual Report 2009
Goodwill arising on acquisitions before the date of transition to IFRS has been retained at the previous SA GAAP amounts subject to being tested for impairment at that date.
If, on a business combination, the fair value of the group’s interest in the identifi able assets, liabilities and contingent liabilities exceeds the cost of acquisition, this excess is recognised in profi t or loss immediately.
Other intangible assetsAn intangible asset is an identifi able non-monetary asset without physical substance. It includes purchased long-term contracts and certain costs of purchase and installation of major information systems (including packaged software).
Intangible assets acquired separately are initially recognised at cost or at fair value if acquired as part of a business combination. If assessed as having an indefi nite useful life, it is not amortised but tested for impairment annually and impaired, if necessary. If assessed as having a fi nite useful life, it is amortised over its useful lives using a straight-line basis and tested for impairment if there is an indication that it may be impaired.
Deferred taxation assets and liabilitiesDeferred taxation is recognised on temporary differences between the carrying amounts of assets and liabilities in the fi nancial statements and the corresponding tax bases used in the computation of taxable profi t. Deferred taxation assets and liabilities are measured at the tax rates that are expected to apply in the period in which the liability is settled or the asset realised, based on tax rates that have been enacted or substantively enacted by the end of the reporting period.
A deferred taxation asset represents the amount of income taxes recoverable in future periods in respect of deductible temporary differences, the carry forward of unused tax losses and the carry forward of unused tax credits (including unused credits for secondary tax on dividends). Deferred taxation assets are only recognised to the extent that it is probable that taxable profi ts will be available against which deductible temporary differences can be utilised.
A deferred taxation liability represents the amount of income taxes payable in future periods in respect of taxable temporary differences. Deferred taxation liabilities are recognised for taxable temporary differences, unless specifi cally exempt.
Deferred taxation assets and liabilities are not recognised if the temporary difference arises from goodwill or from the initial recognition (other than in a business combination) of other assets and liabilities in a transaction that affects neither taxable income nor accounting profi t.
Deferred taxation assets and liabilities are offset when there is a legally enforceable right to offset current taxation assets against current taxation liabilities and it is the intention to settle these on a net basis.
Loans and advancesAdvances designated as loans and receivables are recognised at amortised cost using the effective interest rate method less any impairment. Fixed rate advances which have been hedged are held at fair value through profi t and loss and are remeasured to fair value through the income statement at each subsequent reporting date.
Exposures are considered past due where the facility has expired and the Bank is not considering renewal of the facility or where expected cash fl ows on the facility are more than one month in arrears. Past due exposures are considered impaired and a specifi c provision/impairment amount is raised based on the carrying amount less the expected realisable value of the security held, but as a minimum the amount should be equivalent to the regulatory requirement.
Advances are assessed for indicators of impairment and impairments are accounted for when there is objective evidence that the estimated future cash fl ows from the assets/advances have been negatively impaired by events occurring subsequent to initial recognition. The amount of the impairment is the difference between the asset’s carrying amount and the present value of estimated future cash fl ows, discounted at the original effective interest rate. Advances considered to be irrecoverable are written off to the extent that the loss can be reliably measured.
Non-current assets held for saleNon-current assets or disposal groups are classifi ed as held for sale if the carrying amount will be recovered principally through sale rather than through continuing use. This condition is regarded as met only when the sale is highly probable, the assets or disposal group are available for immediate sale in its present condition and management is committed to the sale which should be expected to qualify for recognition as a completed sale within one year from the date of the classifi cation.
Immediately prior to being classifi ed as held for sale the carrying amount of assets and liabilities are measured in accordance with the applicable standard. After classifi cation as held for sale it is measured at the lower of the carrying amount and fair value less costs to sell and therefore, not depreciated. An impairment loss is recognised in profi t or loss for any initial and subsequent write-down of the asset and disposal group to fair value less costs to sell. A gain for any subsequent increase in fair value less costs to sell is recognised in profi t or loss to the extent that it is not in excess of the cumulative impairment loss previously recognised.
Non-current assets or disposal groups that are classifi ed as held for sale are not depreciated.
InventoriesInventories are assets held for sale in the ordinary course of business, in the process of production for such sale or in the form of materials or supplies to be consumed in the production process or in the rendering of services.
businessoverview commentaries sustainability
annual fi nancialstatements
shareholderinformation

116
page
Grin
drod
Lim
ited
/ A
nnua
l Rep
ort 2
009
Inventories which include merchandise, bunkers on board ships and other consumable stores are valued at the lower of cost and net realisable value. Cost is determined on a weighted average and fi rst-in-fi rst-out basis. Spares on board ships are charged against income when issued to the ships.
When inventories are sold, the carrying amount is recognised as part of cost of sales. Any write-down of inventories to net realisable value and all losses of inventories or reversals of previous write-downs or losses are recognised in cost of sales in the period the write-down, loss or reversal occurs.
Agricultural and other commodities are valued at fair value less costs to sell. When such inventories are measured at fair value less costs to sell, changes in fair value less costs to sell are recognised in profi t or loss in the period of the change.
Financial assetsA fi nancial asset is an asset that is cash, an equity instrument of another entity, a contractual right to receive cash or another fi nancial asset from another entity, or to exchange fi nancial assets or fi nancial liabilities with another entity under conditions that are potentially favourable to the entity.
Financial assets are initially measured at fair value plus transaction costs. However, transaction costs in respect of fi nancial assets designated as held at fair value through profi t or loss are expensed.
Investments classifi ed as held-to-maturity fi nancial assets are measured at amortised cost less any impairment losses recognised to refl ect irrecoverable amounts.
Financial assets are accounted for at fair value through profi t or loss where the fi nancial asset is either classifi ed as held for trading or is designated as held at fair value through profi t or loss and are carried at fair value with any gains or losses being recognised in profi t or loss. Fair value, for this purpose, is market value if listed or a value arrived at by using appropriate valuation models if unlisted.
Investment banking portfolio assets are classifi ed as held for trading and are recognised on a settlement basis. These investments are initially measured at cost, including transaction costs and are re-measured to fair value at each subsequent reporting date. Changes in fair value are recognised in profi t or loss when they arise.
Trade and other receivables are classifi ed as loans and receivables and are measured at amortised cost less provision for doubtful debts, which is determined as set out under impairment of assets below. Items with extended terms are initially recorded at the present value of future cash fl ows and interest income is accounted for over the term until payment is received. Write-downs of these assets are expensed in profi t or loss.
Other investments are classifi ed as available-for-sale fi nancial assets. These investments are carried at fair value with any gains or losses being recognised directly in equity. Where the investment is disposed of or is determined to be impaired, the cumulative gain or loss previously recognised in equity is included in profi t or loss for the period. Fair value, for this purpose, is market value if listed or a value arrived at by using appropriate valuation models if unlisted.
Derivatives that are assets are measured at fair value, with changes in fair value being included in profi t or loss other than derivatives designated as cash fl ow hedges. The fair value of derivative assets is classifi ed as non-current assets if the remaining maturity of the instruments are more than and they are not expected to be realised within, 12 months.
Cash and cash equivalents are measured at fair value, with changes in fair value being included in profi t or loss.
Derivatives embedded in other fi nancial instruments or other non-fi nancial host contracts are treated as separate derivatives when their risk and characteristics are not closely related to those of the host contract and the host contract is not designated as held at fair value through profi t or loss.
Financial liabilitiesA fi nancial liability is a liability that is a contractual obligation to deliver cash or another fi nancial asset to another entity or to exchange fi nancial assets or fi nancial liabilities with another entity under conditions that are potentially unfavourable to the entity.
Financial liabilities are initially measured at fair value plus transaction costs. However, transaction costs in respect of fi nancial liabilities as held at fair value through profi t or loss are expensed.
Financial liabilities are accounted for at fair value through profi t or loss where the fi nancial liability is either held for trading or it is designated as held at fair value through profi t or loss.
Non-derivative fi nancial liabilities that are not designated on initial recognition as fi nancial liabilities held at fair value through profi t or loss or classifi ed as held for trading are measured at amortised cost. Items with extended terms are initially recorded at the present value of future cash fl ows.
Any difference between the proceeds (net of transaction costs) and the settlement or redemption of borrowings is recognised over the term of the borrowings in accordance with the accounting policy for borrowing costs (see accounting policy below).
Non-derivative fi nancial liabilities that are designated on initial recognition as fi nancial liabilities held at a fair value through profi t or loss or classifi ed as held for trading are measured at fair value, with changes in fair value being included in net profi t or loss.
Accounting policiesAccounting policies (continued)(continued)
for the year ended 31 December 2009for the year ended 31 December 2009

page 117G
rindrod Limited / A
nnual Report 2009
Derivatives embedded in other fi nancial instruments or other non-fi nancial host contracts are treated as separate derivatives when their risk and characteristics are not closely related to those of the host contract and the host contract is not designated as held at fair value through profi t or loss.
Post-employment benefi t obligationsThe group operates a defi ned benefi t pension plan as well as two defi ned contribution provident funds.
Current contributions to the group’s defi ned contribution funds are charged against income when incurred. The cost of providing benefi ts to the group’s defi ned benefi t plan and the obligation in respect of post-retirement medical aid are determined and provided using the projected unit credit actuarial valuation method. Contribution rates to the defi ned benefi t plan are adjusted for any unfavourable experience adjustments. Favourable experience adjustments are retained within the fund. Actuarial surpluses are brought to account in the group’s fi nancial statements only when it is clear that economic benefi ts will be available to the group.
The group’s estimated liability in respect of post-retirement medical benefi ts has been fully provided for in the statement of fi nancial position.
The group operates a share option scheme. The proceeds on share options are credited to share capital when exercised.
The expected cost of profi t-sharing and bonus payments is recognised as an expense when there is a legal or constructive obligation to make such payments as a result of past performance.
ProvisionsProvisions are recognised when the group has a present legal or constructive obligation, as a result of past events, for which it is probable that an outfl ow of economic benefi ts will be required to settle the obligation and a reliable estimate can be made for the amount of the obligation.
Provisions are measured at the expenditure required to settle the present obligation. Where the effect of discounting is material, provisions are measured at their present value using a pre-tax discount rate that refl ects the current market assessment of the time value of money and the risks for which future cash fl ow estimates have not been adjusted.
Onerous contractsFull provision is made for the present obligations of the unavoidable future costs of fulfi lling the terms of onerous ship charter contracts or contracts of affreightment to which the group is committed.
EquityDebt and equity instruments are classifi ed as either fi nancial liabilities or as equity based on the substance of the contractual arrangement. Equity instruments issued by the group are recorded at the proceeds received, net of direct issue costs.
INCOME STATEMENTRevenueRevenue represents the gross infl ow of economic benefi ts during the period arising in the course of the ordinary activities when those infl ows result in increases in equity, other than increases relating to contributions from equity participants. Included in revenue are net invoiced sales to customers for goods and services, ship sales, freight, charter-hire, handling fee revenue, dividends received, commodity sales, commission and fi nancial institution gross interest and fee income.
Revenue is measured at the amount received or receivable. Cash and settlement discounts, rebates, value added taxation and other indirect taxes are excluded from revenue. Where extended terms are granted, interest income is accounted for over the term until payment is received.
Revenue from the sale of goods is recognised when all of the following conditions are satisfi ed:
• the group has transferred to the buyer the signifi cant risks and rewards of ownership of the goods;• the group retains neither continuing managerial involvement to the degree usually associated with ownership nor effective control over
the goods sold;• the amount of revenue can be measured reliably;• it is probable that the economic benefi ts associated with the transaction will fl ow to the entity; and• the costs incurred or to be incurred in respect of the transaction can be measured reliably.
Charter-hire is recognised on a daily accrual basis. Freight revenue is recognised on completion of the voyage and for uncompleted voyages at year-end on the percentage completion basis. Results of uncompleted voyages are included based on estimated voyage result and voyage time elapsed. Anticipated losses for contracts arising on uncompleted voyages are provided for in full.
Where the group acts as agent and is remunerated on a commission basis, only the commission is included in revenue. Where the group acts as principal, the total value of business handled is included in revenue.
Fee income earned on origination of advances is deferred and recognised on a yield to maturity basis over the average life of the relevant advances. Where the receipt of knowledge-based fee income is deferred by contractual agreement the present value of the fee income is recognised upfront and the accretion is recognised over the duration of contractual receipt.
Dividend income from investments is recognised when the shareholders’ rights to receive payment have been established.
businessoverview commentaries sustainability
annual fi nancialstatements
shareholderinformation

118
page
Grin
drod
Lim
ited
/ A
nnua
l Rep
ort 2
009
Interest income is recognised on a time proportion basis which takes into account the effective yield on the asset. Interest income includes the amount of amortisation of any discount or premium.
Ship sales are recognised when the signifi cant risks and rewards of ownership have been transferred to the buyer.
Cost of salesWhen inventories and “held for sale” inventories are sold, the carrying amount is recognised as part of cost of sales. Any write-down of inventories to net realisable value and all losses of inventories or reversals of previous write-downs or losses are recognised in cost of sales in the period the write-down, loss or reversal occurs.
Employee benefi t costsThe cost of providing employee benefi ts is accounted for in the period in which the benefi ts are earned by employees.
The cost of short-term employee benefi ts is recognised in the period in which the service is rendered and is not discounted. The expected cost of short-term accumulating compensated absences is recognised as an expense as the employees render service that increases their entitlement or, in the case of non-accumulating absences, when the absences occur.
The expected cost of profi t-sharing and bonus payments is recognised as an expense when there is a legal or constructive obligation to make such payments as a result of past performance.
Borrowing costsBorrowing costs (net of investment income earned on the temporary investment of specifi c borrowings pending their expenditure on qualifying assets) directly attributable to the acquisition, construction or production of assets that necessarily take a substantial period of time to get ready for their intended use or sale, are added to the cost of those assets, until such time as the assets are substantially ready for their intended use or sale. All other borrowing costs are expensed in the period in which they are incurred.
Non-trading itemsNon-trading items cover those amounts that are not considered to be of an operating/trading nature and generally include re-measurements due to:
• impairments of goodwill and non-current assets;• gains and losses on the measurement to fair value less costs to sell (or on the disposal) of assets or disposal groups constituting
discontinued operations;• gains and losses on the measurement to fair value less costs to sell of non-current assets or disposal groups classifi ed as held for sale;• gains and losses on the disposal of property, terminals, vehicles and equipment;• recycling through profi t or loss of foreign currency translation reserves upon disposal of entities whose functional currencies are different
to the group’s presentation currency;• recycling through profi t or loss of fair value gains and losses previously recognised directly in equity upon the disposal of available-for-sale
fi nancial assets and realisation of hedges of a net investment in a foreign operation; and• the group’s proportionate share of exceptional items (determined on the same basis) of associates and joint ventures.
Re-measurements to fair value of other fi nancial instruments (including amounts recycled through profi t or loss under cash fl ow hedges that were previously recognised directly in equity) are not included in non-trading items.
TaxationThe charge for current taxation is based on the results for the year as adjusted for income that is exempt and expenses that are not deductible using tax rates that are applicable to taxable income.
Secondary taxation on companies (STC) is recognised as part of the current taxation charge when the related dividend is declared. Deferred taxation is recognised if dividends received in the current year can be offset against future dividend payments to the extent of the reduction of future STC.
Deferred taxation is recognised in profi t or loss except when it relates to items credited or charged directly to equity, in which case it is also recognised in equity.
TRANSACTIONS AND EVENTSHedge accountingIf a fair value hedge meets the conditions for hedge accounting, any gain or loss on the hedged item attributable to the hedged risk is included in the carrying amount of the hedged item and recognised in profi t or loss.
If a cash fl ow hedge meets the conditions for hedge accounting the portion of the gain or loss on the hedging instrument that is determined to be an effective hedge is recognised directly in equity and the ineffective and over-effective portions are recognised in profi t or loss. A hedge of the foreign currency risk of a fi rm commitment is designated and accounted for as a cash fl ow hedge.
If an effective hedge of a forecast transaction subsequently results in the recognition of a fi nancial asset or fi nancial liability, the associated gains or losses recognised in equity are transferred to income in the same period in which the asset or liability affects profi t or loss.
If a hedge of a forecast transaction subsequently results in the recognition of a non-fi nancial asset or non-fi nancial liability, the associated gains or losses recognised in equity are included in the initial measurement of the acquisition cost or other carrying amount of the asset or liability.
Accounting policiesAccounting policies (continued)(continued)
for the year ended 31 December 2009for the year ended 31 December 2009

page 119G
rindrod Limited / A
nnual Report 2009
If a hedge of a net investment in a foreign entity meets the conditions for hedge accounting, the portion of the gain or loss on the hedging instrument that is determined to be an effective hedge is recognised directly in equity and the ineffective portion is recognised in profi t or loss. On disposal of a foreign entity, the gain or loss recognised in equity is transferred to profi t or loss.
Hedge accounting is discontinued on a prospective basis when the hedge no longer meets the hedge accounting criteria (including when it becomes ineffective), when the hedge instrument is sold, terminated or exercised, when for cash fl ow hedges the forecast transaction is no longer expected to occur or when the hedge designation is revoked. Any cumulative gain or loss on the hedging instrument for a forecast transaction is retained in equity until the transaction occurs, unless the transaction is no longer expected to occur, in which case it is transferred to profi t or loss for the period.
DerivativesThe group enters into derivative fi nancial instruments in order to manage its exposure to interest rate and foreign exchange rate risks which have a cash fl ow impact. This includes forward exchange contracts, cross-currency and interest rate swaps, futures, options and forward freight swap agreements.
Derivatives are initially recognised at fair value at the date a derivative contract is entered into and are subsequently measured to their fair value at each statement of fi nancial position date. The resultant gain or loss is recognised in profi t or loss immediately unless the derivative is designated and effective as a hedging instrument, in which event the timing of the recognition in profi t or loss depends on the nature of the hedge relationship. The group designates certain derivatives as either hedges of the fair value of recognised assets or liabilities or fi rm commitments (fair value hedges), hedges of highly probable forecast transactions or hedges of foreign currency risk of fi rm commitments (cash fl ow hedges), or hedges of net investments in foreign operations.
Impairment of assetsAt each reporting date the carrying amount of tangible and intangible assets is assessed to determine whether there is any indication that those assets may have suffered an impairment loss. If any such indication exists, the recoverable amount of the asset is estimated in order to determine the extent of the impairment loss. Where it is not possible to estimate the recoverable amount of an individual asset, the recoverable amount of the cash-generating unit to which the asset belongs is estimated. Value in use, included in the calculation of the recoverable amount, is estimated taking into account future cash fl ows, forecast market conditions and the expected lives of the assets.
If the recoverable amount of an asset (or cash-generating unit) is estimated to be less than its carrying amount, its carrying amount is reduced to the higher of its recoverable amount and zero. The impairment loss is fi rst allocated to reduce the carrying amount of goodwill and then to the other assets of the cash-generating unit. Subsequent to the recognition of an impairment loss, the depreciation or amortisation charge for the asset is adjusted to allocate its remaining carrying value, less any residual value, over its remaining useful life.
Impairment losses on fi nancial assets as well as trade and other receivables are determined based on specifi c and objective evidence that assets are impaired and are measured as the difference between the carrying amount of the assets and the present value of the estimated future cash fl ows discounted at the effective interest rate computed at initial recognition.
Impairment losses are recognised in profi t or loss. If an impairment loss subsequently reverses, the carrying amount of the asset (or cash-generating unit) is increased to the revised estimate of its recoverable amount but limited to the carrying amount that would have been determined had no impairment loss been recognised in prior years. A reversal of an impairment loss is recognised in profi t or loss.
Goodwill and intangible assets with indefi nite useful lives or not available for use and the cash-generating units to which these assets have been allocated, are tested for impairment even if there is no indication of impairment. For the purpose of impairment testing, goodwill is allocated to each of the cash-generating units expected to benefi t from the synergies of the combination at inception of the combination. Impairment losses recognised on goodwill are not subsequently reversed. The attributable amount of goodwill is included in the profi t or loss on disposal when the associated business is sold.
LeasingClassifi cationLeases are classifi ed as fi nance leases or operating leases at the inception of the lease.
In the capacity of a lessorAmounts due from lessees under a fi nance lease are recognised as receivables at the amount of the group’s net investment in the lease, which includes initial direct costs. Finance lease income is allocated to accounting periods so as to refl ect a constant periodic rate of return on the group’s net investment outstanding in respect of the leases.
Rental income from operating leases is recognised on a straight-line basis over the term of the relevant lease.
In the capacity of a lesseeFinance leases are recognised as assets and liabilities of the group at the lower of the fair value of the asset and the present value of the minimum lease payments at the date of acquisition. Finance costs represent the difference between the total leasing commitments and the fair value of the assets acquired. Finance costs are charged to profi t or loss over the term of the lease and at interest rates applicable to the lease on the remaining balance of the obligations, unless they are directly attributable to qualifying assets, in which case they are capitalised in accordance with the group’s general policy on borrowing costs.
businessoverview commentaries sustainability
annual fi nancialstatements
shareholderinformation

120
page
Grin
drod
Lim
ited
/ A
nnua
l Rep
ort 2
009
Rentals payable under operating leases are charged to income on a straight-line basis over the term of the relevant lease. Benefi ts received and receivable as an incentive to enter into an operating lease are also spread on a straight-line basis over the lease term.
Government grantsGovernment grants towards staff re-training costs are recognised as income over the periods necessary to match them with the related costs and are deducted in reporting the related expense.
Government grants whose primary condition is that the group should purchase, construct or otherwise acquire non-current assets are recognised as deferred revenue in the statement of fi nancial position and transferred to profi t or loss on a systematic and rational basis over the useful lives of the related assets.
Discontinued operationsThe results of discontinued operations are presented separately in the income statement and the assets and liabilities associated with these operations are included with non-current assets held for sale in the statement of fi nancial position.
Share-based paymentsEquity-settled share optionsExecutive directors, senior executives and other employees have been granted equity-settled share options in terms of the Grindrod Limited Share Option Scheme.
Equity-settled share-based payments are measured at fair value (excluding the effect of non market-based vesting conditions) at the date of grant and recognised in profi t or loss on a straight-line basis over the vesting period, based on the estimated number of shares that will eventually vest and adjusted for the effect of non-market-based vesting conditions. Fair value is measured using a binomial pricing model.
Cash-settled share-based paymentShare appreciation rights granted to employees for services rendered or to be rendered are raised as a liability and recognised in profi t or loss immediately or, if vesting requirements are applicable, over the vesting period. The liability is remeasured annually until settled and any changes in value are recognised in profi t or loss. Fair value is measured using a binomial pricing model.
Treasury sharesTreasury shares are equity instruments of the company, held by the company or other members of the consolidated group.
All costs relating to the acquisition of treasury shares as well as gains or losses on disposal or cancellation of treasury shares are recognised directly in equity.
Financial guarantee contractsFinancial guarantee contracts are accounted for in terms of IFRS 4 Insurance Contracts and consequently are measured initially at cost and thereafter, in accordance with IAS 37 Provisions, Contingent Liabilities and Contingent Assets.
Judgements made by managementPreparing fi nancial statements in conformity with IFRS requires estimates and assumptions that affect reported amounts and related disclosures. Actual results could differ from these estimates.
Certain accounting policies have been identifi ed as involving particularly complex or subjective judgements or assessments, as follows:
Asset lives and residual valuesProperty, terminals, vehicles and equipment are depreciated over their useful life taking into account residual values, where appropriate. The actual lives of the assets and residual values are assessed annually and may vary depending on a number of factors. In reassessing asset lives, factors such as technological innovation, product life cycles and maintenance programmes are taken into account. Residual value assessments consider issues such as future market conditions, the remaining life of the asset and projected disposal values. Consideration is also given to the extent of current profi ts and losses on the disposal of similar assets.
Shipping maintains a young fl eet of ships and generally aims to replace vessels that are 15 years or older. As a result vessels are depreciated over 15 years to the expected residual value of a vessel of a similar age and specifi cation. Management reassess the depreciation period of vessels that surpass this limit with special consideration of the condition of the vessel and the purpose for which the vessel was retained in the fl eet. The estimated life is considered at each reporting period.
Residual values of the ships are reassessed by management at each reporting period based on the current shipping markets and the movement of the markets over the previous fi ve years, the age of the vessel, the specifi cations and the condition of the vessel. The current market related scrap values for demolitions in the Far East and India are used for older vessels.
Deferred taxation assetsDeferred taxation assets are recognised to the extent it is probable that taxable income will be available in future against which they can be utilised. Three-year business plans are prepared annually and approved by the boards of the company and its major operating subsidiaries. These plans include estimates and assumptions regarding economic growth, interest rates, infl ation and competitive forces.
Accounting policiesAccounting policies (continued)(continued)
for the year ended 31 December 2009for the year ended 31 December 2009

page 121G
rindrod Limited / A
nnual Report 2009
The plans contain profi t forecasts and cash fl ows and these are utilised in the assessment of the recoverability of deferred taxation assets. Deferred taxation assets are also recognised on STC credits to the extent it is probable that future dividends will be available to utilise these credits.
Management also exercises judgement in assessing the likelihood that business plans will be achieved and that the deferred taxation assets are recoverable.
Impairment of assetsGoodwill and intangible assets with indefi nite useful lives are considered for impairment at least annually. Property, terminals, vehicles and equipment and intangible assets are considered for impairment if there is a reason to believe that impairment may be necessary. Factors taken into consideration in reaching such a decision include the economic viability of the asset itself and where it is a component of a larger economic unit, the viability of that unit itself.
Ships (owned and leased) and ships under construction are considered for impairment at least annually.
Future cash fl ows expected to be generated by the assets or cash-generating units are projected, taking into account market conditions and the expected useful lives of the assets. The present value of these cash fl ows, determined using an appropriate discount rate, is compared to the current net asset value and, if lower, the assets are impaired to the present value. The impairment loss is fi rst allocated to goodwill and then to the other assets of a cash-generating unit.
Cash fl ows which are utilised in these assessments are extracted from formal three-year business plans which are updated annually.
Onerous contract provisionsFull provision is made for the present obligations of the unavoidable future costs of fulfi lling the terms of onerous ship charter contracts or contracts of affreightment to which the group is committed. Note 20 provides more detail on these provisions.
Management has estimated the onerous contract provisions based on expected ship running costs, fuel costs and freight rates for the remaining period of the charter contracts and contracts of affreightment. The estimates have been made with reference to the current expenditure and current freight rates and market projections from reputable business partners.
Post-employment benefi t obligationsPost-retirement defi ned benefi ts are provided for certain existing and former employees. Actuarial valuations are based on assumptions which include employee turnover, mortality rates, discount rates, expected long-term rate of return of retirement plan assets, health care infl ation cost and rates of increase in compensation costs.
Judgement is exercised by management, assisted by advisors, in adjusting mortality rates to take account of actual mortality rates within the schemes.
Key sources of estimation uncertaintyThe following are the key assumptions concerning the future and other key sources of estimation uncertainty at the reporting date, that have a signifi cant risk of causing a material adjustment to the carrying amount of assets and liabilities within the next fi nancial year:
Percentage completion of voyagesThe stage of completion of a voyage is determined by calculating the total number of actual days from the loading of the cargo at the commencement of a voyage to the period end, divided by the total estimated number of days from loading to discharging the cargo.
The duration of a voyage depends on the size of the vessel being loaded, cargo type and quantity, vessel speed as well as delays occasioned by weather or due congestion at load or discharge ports.
Fair value of derivative fi nancial instrumentsThe ship purchase option is revalued on a monthly basis over the period of the agreement to an estimated value of a vessel of a similar age and specifi cation at the contract end. This is dependent on management’s expectations and movements in the shipping markets. Note 9 provides more detail.
Valuations of forward freight agreements (FFAs)The FFAs are valued by comparing the strike price of the instrument against the estimated market spot earnings for the period that the instrument has been contracted for. Management makes use of projected market earnings from reliable shipping brokers in order to assess the expected profi ts or losses from the transaction. Note 9 provides more detail.
businessoverview commentaries sustainability
annual fi nancialstatements
shareholderinformation

Grin
drod
Lim
ited
/ A
nnua
l Rep
ort 2
009
122
page
Statements of financial positionStatements of financial posit ion at 31 December 2009at 31 December 2009
Group Company 2009 2008 2007 2009 2008 2007 Notes R000 R000 R000 R000 R000 R000
ASSETS Non-current assets Ships, property, terminals, vehicles and equipment 3 3 923 378 4 540 514 3 046 945 Intangible assets 4 830 663 713 046 521 063 Investments in subsidiaries 5 4 039 294 3 514 371 1 641 825Investments in joint venture 6 – – 40 252Investments in associates 7 283 068 316 746 236 420 Other investments 8 83 515 50 151 70 374 Derivative fi nancial assets 9 101 861 141 087 91 876 – – 9 600Recoverables on cancelled ships 10 238 589 – – Deferred taxation assets 11 159 088 159 352 138 069 428 7 059 –
Total non-current assets 5 620 162 5 920 896 4 104 747 4 039 722 3 521 430 1 691 677
Loans and advances to bank customers 12 1 483 314 1 049 761 965 964 Current assets Inventories 13 499 804 905 842 684 629 Trade and other receivables 14 2 973 607 3 529 510 2 543 336 1 188 371 1 643 139 814 568Taxation 19 745 33 681 4 227 – 3 665 –Liquid assets and short-term negotiable securities 15 104 092 138 553 228 938 Cash and cash equivalents 1 917 695 2 403 087 1 254 611 2 057 804 –
5 514 943 7 010 673 4 715 741 1 190 428 1 647 608 814 568Non-current assets classifi ed as held for sale 16 12 680 2 245 141 608
Total current assets 5 527 623 7 012 918 4 857 349 1 190 428 1 647 608 814 568
Total assets 12 631 099 13 983 575 9 928 060 5 230 150 5 169 038 2 506 245
EQUITY AND LIABILITIES Capital and reserves Share capital and premium 17 13 220 11 189 072 414 161 495 169 492 124Equity compensation reserve 35 771 12 817 9 868 14 786 12 831 9 868Non-distributable reserves 106 125 1 547 122 (339 286) Accumulated profi t 5 582 864 5 152 746 3 518 678 3 822 837 3 298 727 1 240 554
Interest of shareholders of Grindrod Limited 5 737 980 6 712 696 3 378 332 4 251 784 3 806 727 1 742 546Minority interest 98 146 62 315 60 643
Interest of all shareholders 5 836 126 6 775 011 3 438 975 4 251 784 3 806 727 1 742 546
Non-current liabilities Long-term borrowings 18 920 787 796 958 718 661 Provision for post-retirement medical aid 19 77 868 77 900 72 819 Provisions 20 104 347 98 508 40 893 Income received in advance 21 88 441 151 200 – Derivative fi nancial liabilities 9 25 104 36 528 48 562 Deferred taxation liabilities 11 22 277 18 527 33 224 – – 6 312
Total non-current liabilities 1 238 824 1 179 621 914 159 – – 6 312
Deposits from bank customers 22 1 756 126 1 507 046 1 397 073 Current liabilities Trade and other payables 23 2 345 218 3 035 205 2 417 934 977 463 1 362 311 748 885Provisions 20 10 411 101 048 17 743 Short-term borrowings and overdraft 18 1 145 774 938 927 1 349 280 Current portion of long-term liabilities 18 179 902 227 679 238 246 Current portion of income received in advance 21 29 480 37 800 – Taxation 84 045 181 238 64 077 903 – 8 502
3 794 830 4 521 897 4 087 280 978 366 1 362 311 757 387Non-current liabilities associated with assets classifi ed as held for sale 16 5 193 – 90 573
Total current liabilities 3 800 023 4 521 897 4 177 853 978 366 1 362 311 757 387
Total equity and liabilities 12 631 099 13 983 575 9 928 060 5 230 150 5 169 038 2 506 245

page 123G
rindrod Limited / A
nnual Report 2009
businessoverview commentaries sustainability
annual fi nancialstatements
shareholderinformation
Income statementsIncome statements for the year ended 31 December 2009for the year ended 31 December 2009
Group Company 2009 2008 2009 2008 Notes R000 R000 R000 R000
Revenue 24 27 692 041 33 736 910 1 333 104 2 754 919 Other income 25 374 227 559 070 16 860 20 884 Operating expenses 25 (26 631 346) (31 269 963) (43 040) (55 819)
Trading profi t 1 434 922 3 026 017 1 306 924 2 719 984 Depreciation and amortisation 25 (292 400) (240 942)
Operating profi t before interest and taxation 1 142 522 2 785 075 1 306 924 2 719 984 Non-trading items 26 13 881 (163 567) 2 627 11 671 Interest received 27 161 328 138 711 1 382 1 484 Interest paid 27 (252 695) (314 071) – (37)
Profi t before share of associates’ profi t 1 065 036 2 446 148 1 310 933 2 733 102 Share of associate companies’ profi t before taxation 76 465 66 076
Profi t before taxation 1 141 501 2 512 224 1 310 933 2 733 102 Taxation 28 (188 075) (243 030) (48 024) (48 814)
Profi t for the year 953 426 2 269 194 1 262 909 2 684 288
Attributable to: Grindrod Limited shareholders 941 786 2 248 782 1 262 909 2 684 288 Minority shareholders 11 640 20 412
953 426 2 269 194 1 262 909 2 684 288
Earnings per share (cents) 29 Basic 193,0 475,7 Diluted 192,1 469,2

124
page
G
rindr
od L
imite
d /
Ann
ual R
epor
t 200
9
Group Company 2009 2008 2009 2008 R000 R000 R000 R000
Profi t for the year 953 426 2 269 194 1 262 909 2 684 288
Other comprehensive income Exchange differences on translating foreign operations Exchange differences arising during the year (1 107 662) 1 373 214 Exchange differences arising on hedging of foreign operations (7 280) (50 934) Reclassifi cation adjustments relating to hedges of foreign
operations disposed of in the year (7 708) –
(1 122 650) 1 322 280 – –
Cash fl ow hedges (Losses)/gains arising during the year (316 551) 572 704 Reclassifi cation adjustments for amounts recognised in
profi t or loss 455 (2 328)
(316 096) 570 376 – –
Total comprehensive (loss)/income for the year (485 320) 4 161 850 1 262 909 2 684 288
Total comprehensive (loss)/income attributable to: Grindrod Limited shareholders (499 211) 4 140 799 1 262 909 2 684 288Minority shareholders 13 891 21 051
(485 320) 4 161 850 1 262 909 2 684 288
Statements of Statements of comprehensive incomecomprehensive income for the year ended 31 December 2009for the year ended 31 December 2009

page 125G
rindrod Limited / A
nnual Report 2009
businessoverview commentaries sustainability
annual fi nancialstatements
shareholderinformation
Group Company 2009 2008* 2009 2008 Notes R000 R000 R000 R000
OPERATING ACTIVITIES Cash receipts from charter-hire 1 291 284 2 747 866 Cash receipts from freight 2 378 269 2 590 718 Cash receipts from invoiced sales 2 011 958 2 208 591 Cash receipts from commodity sales 20 427 789 24 397 014 Interest income from fi nancial institution 172 678 202 660 Interest expense from fi nancial institution (133 426) (169 436) Dividend income from fi nancial institution 15 672 9 524 Corporate and structured fi nance fee income and other income 87 844 50 772 Handling fees and other revenue 51 097 294 217
Cash receipts from customers 26 303 165 32 331 926 Cash payments to suppliers and employees (25 385 418) (28 978 940) (1 163) (2 833)
Cash generated from/(absorbed by) operations 36.1 917 747 3 352 986 (1 163) (2 833)Interest received 161 328 138 711 1 382 1 484Interest paid (252 695) (314 071) – (37)Dividends received 78 893 3 035 1 313 721 2 735 806Dividends paid 36.2 (539 761) (607 429) (550 292) (620 451)Taxation paid (240 459) (176 571) (36 825) (74 354)
125 053 2 396 661 726 823 2 039 615Net proceeds on disposal of ships 756 728 959 235
Proceeds on disposal of ships 1 257 467 1 070 101 Cash payments on ship options exercised (500 739) (110 866)
Capital expenditure on ships (793 207) (1 310 419) Cash fl ows from operating activities of fi nancial institutions Advances to customers (433 555) (83 797) Liquid assets and short-term negotiable securities 34 461 90 385 Deposits from customers 249 081 109 973
Net cash fl ows (utilised in)/from operating activities (61 439) 2 162 038 726 823 2 039 615
INVESTING ACTIVITIES Property, terminals, vehicles and equipment acquired 36.3 (359 095) (513 997)
Replacement of property, terminals, vehicles and equipment (1 387) (1 805) Additions to property, terminals, vehicles and equipment (357 708) (512 192)
Acquisition of associate and other investments (10 319) – – (128 264)Acquisition of subsidiaries and joint ventures 36.4 (208 725) (334 085) Acquisition of intangible assets (36 283) (916) Proceeds on disposal of property, terminals, vehicles and equipment 39 346 277 405 Proceeds from disposal of investments 36.5 12 152 63 219 482 –Loans advanced to associate companies 27 386 (15 415) Net advances to subsidiaries (442 044) (1 913 592)
Net cash fl ows used in investing activities (535 538) (523 789) (441 562) (2 041 856)
FINANCING ACTIVITIES Proceeds from issue of ordinary share capital 13 209 3 045 12 709 3 045Repurchase of ordinary share capital – (212 936) (296 717) –Minority investment in subsidiary 3 780 – Loan from minorities 15 853 – Long-term borrowings raised 591 700 643 071 Payment of capital portion of long-term borrowings (447 341) (637 433) Short-term loan raised/(repaid) 381 783 (436 589)
Net cash fl ows from/(utilised in) fi nancing activities 558 984 (640 842) (284 008) 3 045
Net (decrease)/increase in cash and cash equivalents (37 993) 997 407 1 253 804Cash and cash equivalents at beginning of year 1 975 106 711 739 804 –Difference arising on translation (267 831) 265 960
Cash and cash equivalents at end of year 36.6 1 669 282 1 975 106 2 057 804
* Restated
Statements of cash flowsStatements of cash flows for the year ended 31 December 2009for the year ended 31 December 2009

126
page
G
rindr
od L
imite
d /
Ann
ual R
epor
t 200
9
Ordinary Preference Equity share share Share compensation capital capital premium reserve GROUP R000 R000 R000 R000
Balance at 31 December 2007 9 2 189 061 9 868 Share options exercised 3 045 Share-based payments 2 865 Repurchase of shares (192 106) Minority interest acquired Minority interest disposed Profi t for the year Other comprehensive income 84
Total comprehensive income – – – 84
Dividends paid
Balance at 31 December 2008 9 2 – 12 817
Share options exercised 13 209 Share-based payments 22 954 Minority interest acquired Profi t for the year Other comprehensive income
Total comprehensive income – – – –
Dividends paid
Balance at 31 December 2009 9 2 13 209 35 771
ANALYSIS OF HOLDING COMPANY AND SUBSIDIARY INTERESTSHolding company 9 2 414 150 14 786 Subsidiaries (400 941) 20 985
9 2 13 209 35 771
Preference Equity Share share Share compensation capital capital premium reserve COMPANY R000 R000 R000 R000
Balance at 31 December 2007 9 2 492 113 9 868 Share options exercised 3 045 Share-based payments 2 963 Total comprehensive income Dividends paid
Balance at 31 December 2008 9 2 495 158 12 831 Share options exercised 12 709 Repurchase of shares (93 717) Share-based payments 1 955 Total comprehensive income Dividends paid
Balance at 31 December 2009 9 2 414 150 14 786
Statements of changes in equityStatements of changes in equity at 31 December 2009at 31 December 2009

page 127G
rindrod Limited / A
nnual Report 2009
businessoverview commentaries sustainability
annual fi nancialstatements
shareholderinformation
General Foreign currency Interest of risk translation Hedging Accumulated shareholders of Minority Interest of
reserve reserve reserve profi t Grindrod Limited interest all shareholdersR000 R000 R000 R000 R000 R000 R000
5 525 20 776 (365 587) 3 518 678 3 378 332 60 643 3 438 975 3 045 3 045 2 865 2 865 (20 833) (212 939) (212 939) – (320) (320) – 532 532 2 248 782 2 248 782 20 412 2 269 194
(5 525) 1 372 491 519 442 5 525 1 892 017 639 1 892 656
(5 525) 1 372 491 519 442 2 254 307 4 140 799 21 051 4 161 850
(599 406) (599 406) (19 591) (618 997)
– 1 393 267 153 855 5 152 746 6 712 696 62 315 6 775 011
13 209 13 209 22 954 22 954 – 29 633 29 633 941 786 941 786 11 640 953 426 (1 117 621) (323 376) (1 440 997) 2 251 (1 438 746)
– (1 117 621) (323 376) 941 786 (499 211) 13 891 (485 320)
(511 668) (511 668) (7 693) (519 361)
– 275 646 (169 521) 5 582 864 5 737 980 98 146 5 836 126
3 822 837 4 251 784 275 646 (169 521) 1 760 027 1 486 196
– 275 646 (169 521) 5 582 864 5 737 980
Interest ofAccumulated shareholders of
profi t Grindrod LimitedR000 R000
1 240 554 1 742 546 3 045 2 963
2 684 288 2 684 288(626 115) (626 115)
3 298 727 3 806 727 12 709
(203 000) (296 717) 1 955
1 262 909 1 262 909(535 799) (535 799)
3 822 837 4 251 784

128
page
G
rindr
od L
imite
d /
Ann
ual R
epor
t 200
9
During the year, the group adopted IFRS 8 Operating Segments as per note 1. This has resulted in the identifi cation of the following fi ve main segments, namely Shipping, Trading, Freight Services, Financial Services and Group costs. These divisions are the basis on which the group reports its primary segment information. The principle services of each of these segments are described on pages 28 to 55 of the annual fi nancial statements.
Shipping Trading 2009 2008* 2009 2008* Business segments R000 R000 R000 R000
Revenue – external 4 918 406 7 069 205 20 335 439 24 022 393 Revenue – internal 152 817 485 490 334 711 2 558 690
Trading profi t (excluding amortisation) 774 174 2 387 638 255 743 230 429 Depreciation and amortisation (126 882) (95 337) (6 479) (8 491)
Operating profi t 647 292 2 292 301 249 264 221 938 Non-trading items 16 496 (195 511) (2 120) 170 Share of associate companies’ profi t – – – –
Segment result excluding net interest and taxation 663 788 2 096 790 247 144 222 108 Interest received 54 648 27 415 33 161 59 101 Interest paid (124 306) (119 976) (48 285) (110 283) Taxation (54 242) (70 604) (42 359) (25 066)
Profi t for the year 539 888 1 933 625 189 661 145 860 Minority interest 1 151 (4 129) 12 102
Profi t attributable to shareholders 541 039 1 929 496 189 673 145 962 Preference dividends (48 557) (67 132) (8 440) (14 120)
Profi t attributable to ordinary shareholders 492 482 1 862 364 181 233 131 842
Capital expenditure 826 722 1 352 782 228 135 279 118 Total segment assets 4 305 187 4 650 269 2 441 361 3 432 067
Segment assets excluding investments in associates 4 305 187 4 650 269 2 441 361 3 432 067 Investments in associates
Segment liabilities (1 402 000) (807 529) (1 758 570) (2 607 602)
The group’s fi ve divisions operate in six principal geographical areas – United States of America/Bermuda, South America, the Middle East, United Kingdom/Europe/Isle of Man, Singapore/Asia/Far East and southern Africa. Refer to the divisional report for detail on the various regions.
United States of America/ Bermuda South America 2009 2008 2009 2008 Geographic segments R000 R000 R000 R000
Revenue – External 420 851 527 386 685 879 851 872 Capital expenditure – – 86 39 Segment assets – – 119 585 216 533
United Kingdom/Europe/ Isle of Man Singapore/Asia/Far East 2009 2008 2009 2008 Geographic segments R000 R000 R000 R000
Revenue – External 6 857 376 9 008 149 9 938 161 8 261 351 Capital expenditure 376 593 978 220 585 769 481 074 Segment assets 3 555 837 3 954 677 2 292 720 1 855 383
* Restated.
Segmental analysisSegmental analysis at 31 December 2009at 31 December 2009

page 129G
rindrod Limited / A
nnual Report 2009
businessoverview commentaries sustainability
annual fi nancialstatements
shareholderinformation
Freight Services Financial Services Group costs Total2009 2008* 2009 2008* 2009 2008* 2009 2008*R000 R000 R000 R000 R000 R000 R000 R000
2 302 323 2 551 792 135 695 93 520 178 – 27 692 041 33 736 91041 792 67 469 1 982 – – – 531 302 3 111 649
387 239 378 102 54 193 46 409 (36 427) (16 561) 1 434 922 3 026 017(153 336) (135 310) (2 001) (1 804) (3 702) – (292 400) (240 942)
233 903 242 792 52 192 44 605 (40 129) (16 561) 1 142 522 2 785 075(2 147) 31 774 – – 1 652 – 13 881 (163 567)
76 465 65 951 – 125 – – 76 465 66 076
308 221 340 517 52 192 44 730 (38 477) (16 561) 1 232 868 2 687 58473 808 56 466 – (5 755) (289) 1 484 161 328 138 711
(100 638) (89 530) – 5 755 20 534 (37) (252 695) (314 071)(42 529) (91 504) (7 983) (2 541) (40 962) (53 314) (188 075) (243 029)
238 862 215 949 44 209 42 189 (59 194) (68 428) 953 426 2 269 195(3 776) (8 809) (8 709) (7 575) (318) – (11 640) (20 411)
235 086 207 140 35 500 34 614 (59 512) (68 428) 941 786 2 248 784(13 369) (18 486) – – 1 343 8 844 (69 023) (90 894)
221 717 188 654 35 500 34 614 (58 169) (59 584) 872 763 2 157 890
344 960 518 593 5 143 8 008 2 669 – 1 407 629 2 158 5013 641 104 3 636 675 2 199 676 1 920 489 43 771 344 075 12 631 099 13 983 575
3 358 036 3 319 929 2 199 676 1 920 489 43 771 344 075 12 348 031 13 666 829283 068 316 746 283 068 316 746
(1 723 755) (2 087 902) (1 866 877) (1 634 198) (43 771) (71 333) (6 794 973) (7 208 564)
Middle East2009 2008R000 R000
3 723 843 5 989 429– 167– 1 254 380
Southern Africa Total2009 2008 2009 2008R000 R000 R000 R000
6 065 931 9 098 723 27 692 041 33 736 910445 181 699 001 1 407 629 2 158 501
6 662 957 6 702 602 12 631 099 13 983 575

130
page
G
rindr
od L
imite
d /
Ann
ual R
epor
t 200
9
1. NEW STANDARDS AND INTERPRETATIONS 1.1 New standards and interpretations adopted The annual fi nancial statements have been prepared in accordance with International Financial Reporting Standards (IFRS) as
issued by the International Accounting Standards Board on a basis consistent with the prior year except for the adoption of the following new and amended standards and new interpretations:
IAS 1 (2007) Presentation of Financial Statements IAS 1 (2007) has introduced terminology changes (including revised titles for the fi nancial statements). In addition, the revised
standard has required the presentation of a third statement of fi nancial position as at 1 January 2008 if the group has applied a change in accounting policy. There has been no change in accounting policy in the year ended 31 December 2009. However, to remain comparative with future periods, the group has opted to consistently apply two years of comparative statements of fi nancial position. The application of the revised IAS 1 has affected only the disclosure of the annual fi nancial statements and has had no impact on earnings.
IFRS 8 Operating Segments The group has adopted IFRS 8 Operating Segments with effect from 1 January 2009. IFRS 8 requires operating segments to be
identifi ed on the basis of internal reports about components of the group that are regularly reviewed by the chief operating decision maker in order to allocate resources to the segments and to assess their performance. In contrast, the predecessor standard (IAS 14 Segment Reporting) required an entity to identify two sets of segments (business and geographical), using a risks and returns approach, with the entity’s system of internal fi nancial reporting to key management personnel serving only as the starting point for the identifi cation of such segments. As a result, following the adoption of IFRS 8, the identifi cation of the group’s reportable segments has changed. In prior years, costs relating to the maintenance of a JSE listing status and other costs necessary for the continuation of the group were allocated to the Shipping, Trading and Freight Services segments based on a 40:20:40 ratio. Management view these costs as not directly related to the segments and hence, in the current year such costs have remained in a segment called Group costs.
1.2 New standards and interpretations not yet adopted The following standards and interpretations are not yet effective and will be adopted in future years:
IFRS 3 Business Combinations (Revised) (IFRS 3) The revised IFRS 3 has been issued after completion of the International Accounting Standards Board’s second phase of its
business combinations project and is now largely aligned with US accounting. Consequential amendments were also made to IAS 27 Consolidated and Separate Financial Statements, IAS 28 Investments in Associates and IAS 31 Interests in Joint Ventures. The changes mainly relate to the treatment of acquisition costs (now to be expensed), contingent considerations, goodwill where minorities are involved, step acquisitions and partial disposals. The revised standards are effective from the year ending 31 December 2010 and the group is in the process of evaluating the effects of this standard.
IAS 17 Leases As part of Improvements to IFRSs 2009, issued in April 2009, the International Accounting Standards Board amended the
requirements of IAS 17 Leases regarding the classifi cation of leases of land. Prior to the amendment, IAS 17 Leases generally required leases of land with an indefi nite useful life to be classifi ed as operating leases. Following the amendment, leases of land are classifi ed as either “fi nance” or “operating” using the general principles of IAS 17. These amendments are effective for annual periods beginning on or after 1 January 2010 and the group is in the process of evaluating the effects of this amendment.
IFRS 2 Share-based Payments In June 2009, the IASB issued amendments to IFRS 2 Share-based Payments. These amendments clarify the scope of IFRS 2, as
well as the accounting for group cash-settled share-based payment transactions in the separate fi nancial statements of an entity receiving the goods or services when another group entity or shareholder has the obligation to settle the award.
There have been other statements which have been revised for disclosure items. The group has assessed these amendments and no material impact on the annual fi nancial statements is anticipated.
Notes to the Notes to the financial statementsfinancial statements for the year ended 31 December 2009for the year ended 31 December 2009
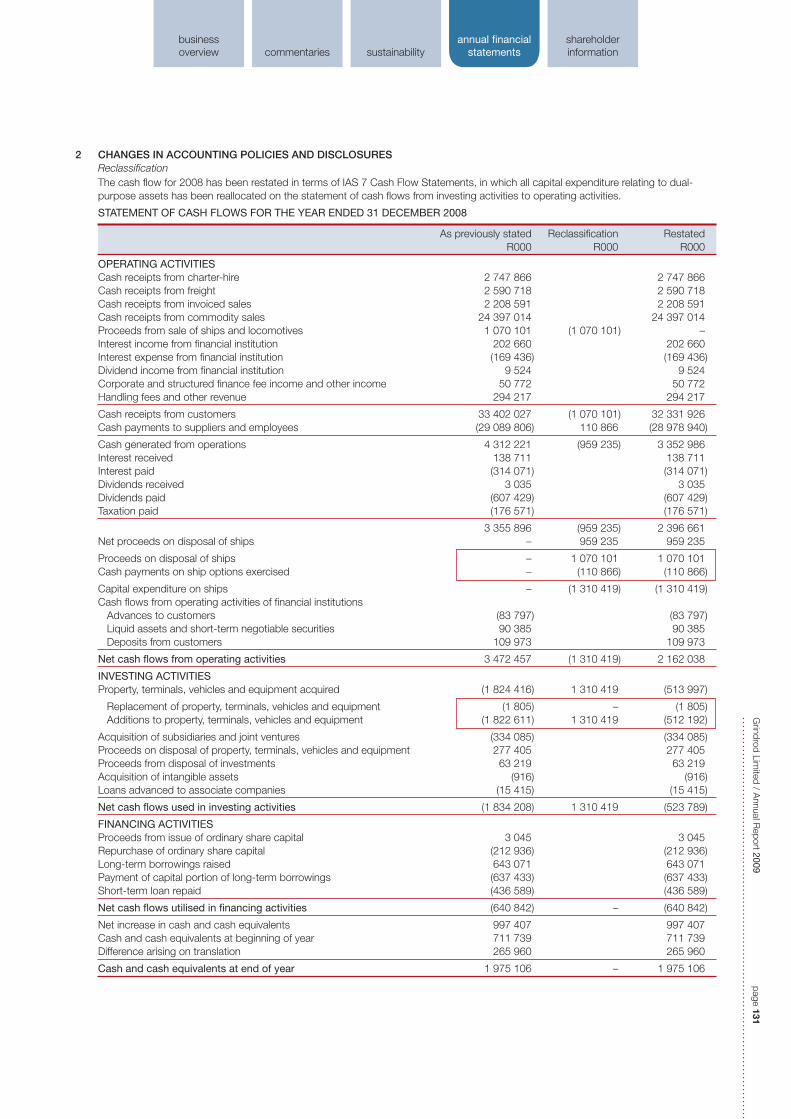
page 131G
rindrod Limited / A
nnual Report 2009
businessoverview commentaries sustainability
annual fi nancialstatements
shareholderinformation
2 CHANGES IN ACCOUNTING POLICIES AND DISCLOSURES Reclassifi cation The cash fl ow for 2008 has been restated in terms of IAS 7 Cash Flow Statements, in which all capital expenditure relating to dual-
purpose assets has been reallocated on the statement of cash fl ows from investing activities to operating activities.
STATEMENT OF CASH FLOWS FOR THE YEAR ENDED 31 DECEMBER 2008
As previously stated Reclassifi cation Restated R000 R000 R000
OPERATING ACTIVITIES Cash receipts from charter-hire 2 747 866 2 747 866 Cash receipts from freight 2 590 718 2 590 718 Cash receipts from invoiced sales 2 208 591 2 208 591 Cash receipts from commodity sales 24 397 014 24 397 014 Proceeds from sale of ships and locomotives 1 070 101 (1 070 101) – Interest income from fi nancial institution 202 660 202 660 Interest expense from fi nancial institution (169 436) (169 436) Dividend income from fi nancial institution 9 524 9 524 Corporate and structured fi nance fee income and other income 50 772 50 772 Handling fees and other revenue 294 217 294 217
Cash receipts from customers 33 402 027 (1 070 101) 32 331 926 Cash payments to suppliers and employees (29 089 806) 110 866 (28 978 940)
Cash generated from operations 4 312 221 (959 235) 3 352 986 Interest received 138 711 138 711 Interest paid (314 071) (314 071) Dividends received 3 035 3 035 Dividends paid (607 429) (607 429) Taxation paid (176 571) (176 571)
3 355 896 (959 235) 2 396 661 Net proceeds on disposal of ships – 959 235 959 235
Proceeds on disposal of ships – 1 070 101 1 070 101 Cash payments on ship options exercised – (110 866) (110 866)
Capital expenditure on ships – (1 310 419) (1 310 419) Cash fl ows from operating activities of fi nancial institutions Advances to customers (83 797) (83 797) Liquid assets and short-term negotiable securities 90 385 90 385 Deposits from customers 109 973 109 973
Net cash fl ows from operating activities 3 472 457 (1 310 419) 2 162 038
INVESTING ACTIVITIES Property, terminals, vehicles and equipment acquired (1 824 416) 1 310 419 (513 997)
Replacement of property, terminals, vehicles and equipment (1 805) – (1 805) Additions to property, terminals, vehicles and equipment (1 822 611) 1 310 419 (512 192)
Acquisition of subsidiaries and joint ventures (334 085) (334 085) Proceeds on disposal of property, terminals, vehicles and equipment 277 405 277 405 Proceeds from disposal of investments 63 219 63 219 Acquisition of intangible assets (916) (916) Loans advanced to associate companies (15 415) (15 415)
Net cash fl ows used in investing activities (1 834 208) 1 310 419 (523 789)
FINANCING ACTIVITIES Proceeds from issue of ordinary share capital 3 045 3 045 Repurchase of ordinary share capital (212 936) (212 936) Long-term borrowings raised 643 071 643 071 Payment of capital portion of long-term borrowings (637 433) (637 433) Short-term loan repaid (436 589) (436 589)
Net cash fl ows utilised in fi nancing activities (640 842) – (640 842)
Net increase in cash and cash equivalents 997 407 997 407 Cash and cash equivalents at beginning of year 711 739 711 739 Difference arising on translation 265 960 265 960
Cash and cash equivalents at end of year 1 975 106 – 1 975 106
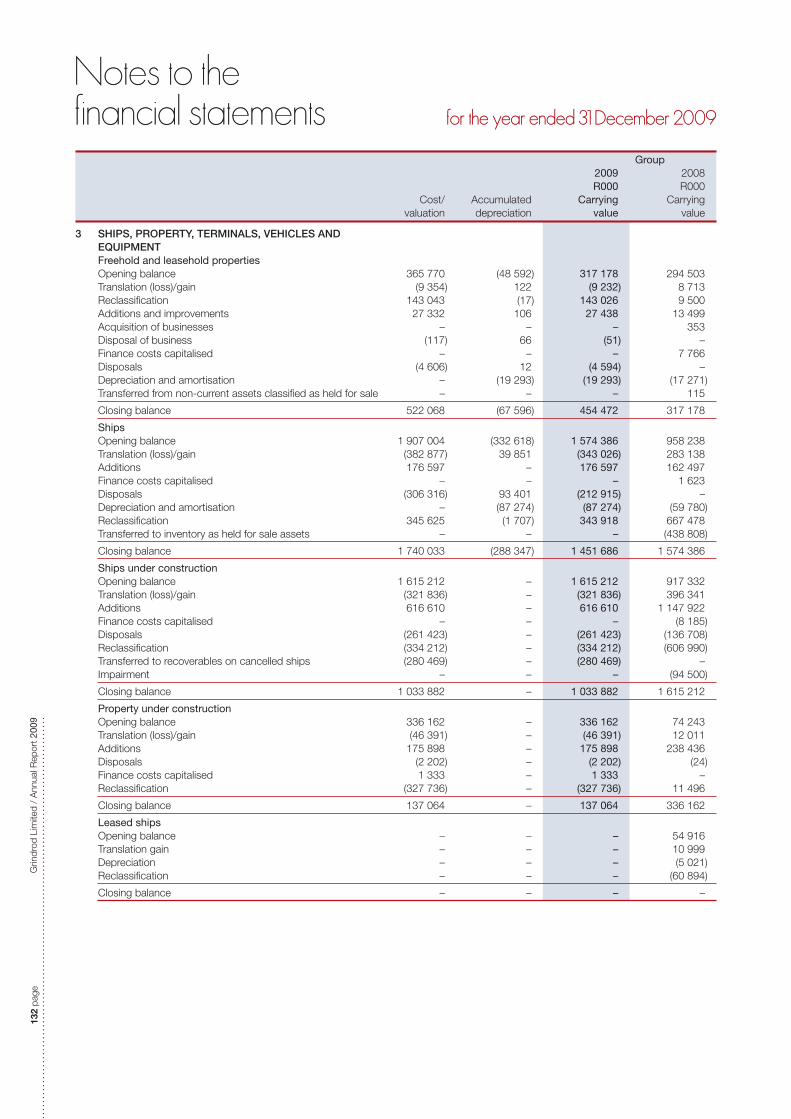
132
page
G
rindr
od L
imite
d /
Ann
ual R
epor
t 200
9
Group 2009 2008 R000 R000 Cost/ Accumulated Carrying Carrying valuation depreciation value value
3 SHIPS, PROPERTY, TERMINALS, VEHICLES AND EQUIPMENT
Freehold and leasehold properties Opening balance 365 770 (48 592) 317 178 294 503 Translation (loss)/gain (9 354) 122 (9 232) 8 713 Reclassifi cation 143 043 (17) 143 026 9 500 Additions and improvements 27 332 106 27 438 13 499 Acquisition of businesses – – – 353 Disposal of business (117) 66 (51) – Finance costs capitalised – – – 7 766 Disposals (4 606) 12 (4 594) – Depreciation and amortisation – (19 293) (19 293) (17 271) Transferred from non-current assets classifi ed as held for sale – – – 115
Closing balance 522 068 (67 596) 454 472 317 178
Ships Opening balance 1 907 004 (332 618) 1 574 386 958 238 Translation (loss)/gain (382 877) 39 851 (343 026) 283 138 Additions 176 597 – 176 597 162 497 Finance costs capitalised – – – 1 623 Disposals (306 316) 93 401 (212 915) – Depreciation and amortisation – (87 274) (87 274) (59 780) Reclassifi cation 345 625 (1 707) 343 918 667 478 Transferred to inventory as held for sale assets – – – (438 808)
Closing balance 1 740 033 (288 347) 1 451 686 1 574 386
Ships under construction Opening balance 1 615 212 – 1 615 212 917 332 Translation (loss)/gain (321 836) – (321 836) 396 341 Additions 616 610 – 616 610 1 147 922 Finance costs capitalised – – – (8 185) Disposals (261 423) – (261 423) (136 708) Reclassifi cation (334 212) – (334 212) (606 990) Transferred to recoverables on cancelled ships (280 469) – (280 469) – Impairment – – – (94 500)
Closing balance 1 033 882 – 1 033 882 1 615 212
Property under construction Opening balance 336 162 – 336 162 74 243 Translation (loss)/gain (46 391) – (46 391) 12 011 Additions 175 898 – 175 898 238 436 Disposals (2 202) – (2 202) (24) Finance costs capitalised 1 333 – 1 333 – Reclassifi cation (327 736) – (327 736) 11 496
Closing balance 137 064 – 137 064 336 162
Leased ships Opening balance – – – 54 916 Translation gain – – – 10 999 Depreciation – – – (5 021) Reclassifi cation – – – (60 894)
Closing balance – – – –
Notes to the Notes to the financial statementsfinancial statements for the year ended 31 December 2009for the year ended 31 December 2009

page 133G
rindrod Limited / A
nnual Report 2009
businessoverview commentaries sustainability
annual fi nancialstatements
shareholderinformation
Group 2009 2008 R000 R000 Cost/ Accumulated Carrying Carrying valuation depreciation value value
3 SHIPS, PROPERTY, TERMINALS, VEHICLES AND EQUIPMENT (continued)
Terminals, vehicles and equipment Opening balance 1 009 835 (352 854) 656 981 518 651 Translation (loss)/gain (49 075) 6 867 (42 208) 25 867 Reclassifi cation 175 583 (740) 174 843 (19 968) Additions 138 398 – 138 398 243 154 Acquisition of businesses 19 327 (1 493) 17 834 39 836 Impairment – (3 617) (3 617) – Disposals (31 382) 20 640 (10 742) (31 675) Disposal of businesses (569) 482 (87) (7 748) Depreciation – (129 179) (129 179) (110 497) Transfer to intangible assets – – – (1 933) Transferred to non-current assets classifi ed as held for sale (4 096) 1 778 (2 318) 1 294
Closing balance 1 258 021 (458 116) 799 905 656 981
Leased terminals, vehicles and equipment Opening balance 71 374 (30 779) 40 595 229 062 Translation loss (35) 26 (9) – Reclassifi cation 2 788 (2 677) 111 (622) Additions 16 158 – 16 158 17 721 Acquisition of businesses – – – 6 795 Disposals (1 893) 1 551 (342) (201 965) Depreciation – (10 144) (10 144) (10 660) Transferred to non-current assets classifi ed as held for sale – – – 263
Closing balance 88 392 (42 023) 46 369 40 595
Aggregate 4 779 460 (856 082) 3 923 378 4 540 514
Cost/ Accumulated Carrying 2008 GROUP valuation depreciation value
Freehold and leasehold properties 365 770 (48 592) 317 178 Ships 1 907 004 (332 618) 1 574 386 Ships under construction 1 615 212 – 1 615 212 Property under construction 336 162 – 336 162 Terminals, vehicles and equipment 1 009 835 (352 854) 656 981 Leased terminals, vehicles and equipment 71 374 (30 779) 40 595
5 305 357 (764 843) 4 540 514
Details of the freehold and leasehold properties are recorded in a register available for inspection at the registered offi ce of the company or its subsidiaries.
Certain assets are encumbered in respect of capitalised lease and loan liabilities, details of which are shown under loan funds on page 174.
Hull and machinery insurance in respect of loss or damage to owned and bareboat chartered ships is insured at replacement value and the sum insured is US$234,4 million (2008: US$366,3 million).
It is the policy of Grindrod and its subsidiaries to insure their property, terminals, vehicles and equipment at replacement value, however in certain circumstances asset cover is limited to market value. The sum insured is R1 810,6 million (2008: R1 613,6 million).
Impairment In the prior year, three ships were impaired. An over-age bulker was written down to its net realisable value and two newbuilding drybulk
ships were written down to their long-term value-in-use.

134
page
G
rindr
od L
imite
d /
Ann
ual R
epor
t 200
9
Group Accumulated 2009 2008 amortisation R000 R000 Cost/ and impairment Carrying Carrying valuation losses value value
4 INTANGIBLE ASSETS 4.1 Goodwill Opening balance 580 314 (20 841) 559 473 324 834 Translation (loss)/gain (83 971) – (83 971) 65 367 Recognised on acquisition of businesses 189 072 – 189 072 182 839 Disposals (533) – (533) (580) Impairment – (990) (990) (12 987)
Closing balance 684 882 (21 831) 663 051 559 473
Impairment testing of goodwill During the current year, a goodwill payment was made as a result of a fi nal settlement
reached in relation to the acquisition of a trading business. In addition, goodwill relating to International Logistics Lda was impaired as the entity has not been profi table.
The major portion of impairment losses in the prior year relates to goodwill of R8 032 000 associated with LCL Grindrod (Pty) Limited and R2 976 000 associated with King and Sons Mozambique Limitada. In the prior year, the group assessed the recoverable amount of goodwill and determined that the goodwill associated with LCL Grindrod (Pty) Limited and King and Sons Mozambique Limitada was impaired as both entities were incurring losses.
The remaining goodwill was assessed by reference to the value-in-use of the cash-generating units. Discount factors ranging between 8% to 15% per annum (2008: 10% to 16% per annum) were applied in the value-in-use model.
Allocation of goodwill to cash-generating units Goodwill has been allocated for impairment testing purposes to the underlying discreet
businesses as they represent separately identifi able cash-generating units. The following cash-generating units, being the lowest level of asset for which there are separately identifi able cash fl ows, have carrying amounts of goodwill that are considered signifi cant in comparison with the group’s total goodwill balance:
Shipping 22 125 37 169 Trading 336 714 192 353 Freight Services Grindrod Terminals 16 406 16 421 Grindrod Intermodal 25 080 25 080 Grindrod Logistics 79 903 79 761 Grindrod Rail 3 441 – Grindrod Port Holdings 149 716 191 969 Agencies 9 948 – Financial Services 19 718 16 720
663 051 559 473
Notes to the Notes to the financial statementsfinancial statements for the year ended 31 December 2009for the year ended 31 December 2009

page 135G
rindrod Limited / A
nnual Report 2009
businessoverview commentaries sustainability
annual fi nancialstatements
shareholderinformation
Group Accumulated 2009 2008 amortisation R000 R000 Cost/ and impairment Carrying Carrying valuation losses value value
4 INTANGIBLE ASSETS (continued) 4.2 Other intangible assets Opening balance 291 571 (137 998) 153 573 196 229 Translation (loss)/gain (27 955) 22 891 (5 064) 30 108 Reclassifi cation from ships, property, terminals,
vehicles and equipment 78 (30) 48 1 933 Additions 36 283 – 36 283 916 Recognised on acquisition of businesses – – – 24 771 Disposals (16 984) (621) (17 605) (11) Reversal/(raising) of impairment 46 887 – 46 887 (62 660) Amortisation – (46 510) (46 510) (37 713)
Closing balance 329 880 (162 268) 167 612 153 573
Aggregate 1 014 762 (184 099) 830 663 713 046
Signifi cant intangible assets Charterparty agreements Net present value of charterparty agreements acquired from a third party in 2005 33 344 29 281 Leases Intangible asset raised on acquisition of businesses in prior years in respect of the inherent
value attached to benefi cial lease agreements 33 832 58 341
Impairment testing of other intangible assets The prior year impairment loss relates to the charter party agreements acquired from a third party in 2005 and which was impaired
by R62 660 000 as a result of a decline in the shipping market rates. The remaining intangible assets were tested by reference to market values.
In the current year, an amount of R46 887 000 relating to the prior year impairment was reversed due to increased activities in shipping markets.
Company 2009 2008 R000 R000
5 INVESTMENTS IN SUBSIDIARIES Investments in subsidiaries 4 024 506 3 501 539 Share-based payments 14 788 12 832
4 039 294 3 514 371
Details of the investments in subsidiaries are shown on the schedule of interest in subsidiaries on page 175.
6 INVESTMENTS IN JOINT VENTURES Shares at cost – –
– –
Details of the investments in joint ventures are shown on page 162.

136
page
G
rindr
od L
imite
d /
Ann
ual R
epor
t 200
9
Effective Group holding 2009 2008 % R000 R000
7 INVESTMENTS IN ASSOCIATES Unlisted Ocean Africa Container Lines (Pty) Limited 165 651 165 651
Cost of investment 49 191 757 191 757 Distribution out of share premium (6 859) (6 859) Distribution out of pre-acquisition reserves (19 247) (19 247)
Moneyline 992 (Pty) Limited 9 846 9 846
Cost of investment 47 4 775 4 775 Loan account 5 071 5 071
Sociedade de Desenvolvimento de Porto de Maputo, SARL 75 308 88 598
Cost of investment 25 – – Loan account 75 308 88 598
Erundu Stevedoring (Pty) Limited – cost of investment 49 2 045 2 249 Iron Mineral Benefi ciation Services (Pty) Limited – cost of investment 10 10 020 – Other investments 2 272 Attributable share of accumulated profi t at the end of the year 20 253 52 048 Transferred to non-current assets held for sale (investments held at nil cost) (57) (1 918)
283 068 316 746
Directors’ valuation 389 422 432 897
Ocean Africa Container Lines (Pty) Limited is incorporated in the Republic of South Africa and provides shipping and logistical services.
The following fi nancial information is pertinent to the company:
Total assets 115 334 247 675 Total liabilities (65 697) (105 049) Share of current year’s profi ts 36 609 46 093
Moneyline 992 (Pty) Limited is incorporated in the Republic of South Africa and is an investment company.
The following fi nancial information is pertinent to the company:
Total assets 107 296 77 688 Total liabilities (66 824) (60 770) Share of current year’s profi ts 11 002 1 407
Sociedade de Desenvolvimento de Porto de Maputo, SARL is incorporated in Mozambique and owns the Maputo Port concession. The company is in an accumulated loss position.
The following fi nancial information is pertinent to the company:
Total assets 319 578 410 177 Total liabilities (467 825) (665 025) Share of current year’s profi ts – –
Erundu Stevedoring (Pty) Limited is incorporated in Namibia and provides stevedoring services.
The following fi nancial information is pertinent to the company:
Total assets 3 741 1 145 Total liabilities (486) (446) Share of current year’s profi ts 1 175 49
Iron Mineral Benefi ciation Services (Pty) Limited is incorporated in South Africa and manufactures iron.
The following fi nancial information is pertinent to the company:
Total assets 9 208 – Total liabilities (899) – Share of current year’s profi ts – –
Notes to the Notes to the financial statementsfinancial statements for the year ended 31 December 2009for the year ended 31 December 2009

page 137G
rindrod Limited / A
nnual Report 2009
businessoverview commentaries sustainability
annual fi nancialstatements
shareholderinformation
Group 2009 2008 R000 R000
8 OTHER INVESTMENTS Investment banking portfolio: Listed Held for trading Listed equities at fair value 19 235 19 185
The register of listed investments is available for inspection at the registered offi ce of Grindrod Bank Limited.
Financial investments Pension fund surplus recognised 34 382 29 357 Loans and receivables at amortised cost 30 765 1 609 Loans and receivables transferred to non-current assets held for sale (867) –
83 515 50 151
Directors’ valuation 83 515 50 151
Details of the pension fund are detailed in note 19.
9 FINANCIAL INSTRUMENTS The group’s fi nancial instruments consist mainly of cash deposits with banks, investments,
trade and other receivables and payables, bank borrowings and loans to and from subsidiaries. Derivative instruments are used by the group for hedging purposes. Such instruments include forward exchange contracts, cross-currency swaps, forward freight agreements, commodity and currency futures contracts, options and interest rate swap agreements.
FINANCIAL INSTRUMENTS BY CATEGORY The carrying value of the group’s fi nancial instruments by category are as follows:
Financial assets Loans and receivables 6 516 200 6 517 972 Held for trading 386 471 641 569 Derivative fi nancial instruments designated as cash fl ow hedges – 152 608
Total fi nancial assets 6 902 671 7 312 149 Total non-fi nancial assets 5 728 428 6 671 426
Total assets 12 631 099 13 983 575
Financial liabilities Held at amortised cost 6 532 931 6 707 936 Held for trading 150 527 300 863 Derivative fi nancial instruments designated as cash fl ow hedges (68 649) –
Total fi nancial liabilities 6 614 809 7 008 799 Total non-fi nancial liabilities and equity 6 016 290 6 974 776
Total liabilities and equity 12 631 099 13 983 575
The carrying value of the group fi nancial instruments approximate fair value.

138
page
G
rindr
od L
imite
d /
Ann
ual R
epor
t 200
9
9 FINANCIAL INSTRUMENTS (continued) DERIVATIVE FINANCIAL INSTRUMENTS 9.1 Forward exchange contracts The company (*) and group had entered into the following forward exchange contracts which are accounted for as fair value hedges
with gains/losses thereon taken to the income statement. The amounts represent the net Rand equivalents of commitments to purchase and sell foreign currencies. The average rates shown include the cost of forward cover.
The group entered into forward exchange contracts to hedge future commitments which included the purchase of certain ships which delivered in 2008 and the purchase of certain commodities in 2008. The exposure to Rand/US Dollar exchange rate fl uctuations has been designated and qualifi es as a hedge in line with the group’s accounting policy thereon.
Valuation technique Quoted forward points to the contract date are allocated to the spot rate at year-end and this rate is applied to the foreign currency
amount in order to determine the fair value of the derivative.
Group 2009 2008 R000 R000
Total change in fair value recognised in operating profi t 5 109 6 231
Details of these forward exchange contracts are as follows:
2009 2008 Asset/ Asset/ Average Contract value (liability) Average Contract value (liability) FOREIGN CURRENCY rate US$000 R000 R000 rate US$000 R000 R000
Purchase US Dollar 7,76 28 211 219 058 7 196 9,67 3 534 34 174 2 641 Purchase US Dollar 7,86 23 652 185 979 (6 966) 10,00 310 466 3 105 603 (17 496) Sell US Dollar 8,03 500 4 015 324 10,24 195 528 2 001 485 16 845 Sell US Dollar 7,45 10 050 74 853 (324) – – – – Sell US Dollar* – – – – 10,41 10 000 104 100 4 185
62 413 483 905 230 519 528 5 245 362 6 175
2009 2008 Asset/ Asset/ Average Contract value (liability) Average Contract value (liability) FOREIGN CURRENCY rate £000 R000 R000 rate £000 R000 R000
Purchase British Pound 12,45 38 372 477 558 (18) 15,49 87 579 1 356 321 (168) Sell British Pound 11,94 16 191 (3) – – – –
38 388 477 749 (21) 87 579 1 356 321 (168)
2009 2008 Asset/ Asset/ Average Contract value (liability) Average Contract value (liability) FOREIGN CURRENCY rate €000 R000 R000 rate €000 R000 R000
Purchase Euro – – – – 12,98 16 599 215 411 2 Purchase Euro 11,21 45 098 505 568 (21) 13,39 5 953 79 699 (74) Sell Euro 10,67 200 2 134 (62) – – – –
45 298 507 702 (83) 22 552 295 110 (72)
2009 2008 Asset/ Asset/ Average Contract value (liability) Average Contract value (liability) FOREIGN CURRENCY rate HK$000 R000 R000 rate HK$000 R000 R000
Purchase Hong Kong Dollar 1,05 101 106 (3) 0,78 100 78 (9)
2009 2008 Asset/ Asset/ Average Contract value (liability) Average Contract value (liability) FOREIGN CURRENCY rate €000 R000 R000 rate €000 R000 R000
Purchase Euro, sell US Dollar 1,65 14 470 23 890 (2 815) – – – –
Notes to the Notes to the financial statementsfinancial statements for the year ended 31 December 2009for the year ended 31 December 2009

page 139G
rindrod Limited / A
nnual Report 2009
businessoverview commentaries sustainability
annual fi nancialstatements
shareholderinformation
9 FINANCIAL INSTRUMENTS (continued) DERIVATIVE FINANCIAL INSTRUMENTS (continued) 9.2 Cross-currency swaps The group has entered into cross-currency swaps to manage currency risk.
Nominal value Nominal Nominal swapped 2009 2008 Currency currency currency Asset/ Asset/ swapped amount amount (liability) (liability) MATURITY DATE Currency with ‘000 ‘000 R000 R000
November 2009 GBP USD 3 903 6 723 – (3) January 2009 USD EUR 1 337 1 046 – (6 921) January 2009 USD EUR 591 471 – 74 January 2009 USD GBP 5 365 3 326 – (77) January 2009 USD GBP 2 322 1 551 – 2 570 January 2009 ZAR USD 408 39 – (502) January 2009 ZAR USD 168 17 – 10 1 January 2010 to 30 November 2010 GBP USD Various* Various* (117) – 1 January 2010 to 30 November 2010 GBP USD Various* Various* 600 – 1 January 2010 to 30 November 2010 USD GBP Various* Various* 36 – 1 January 2010 to 30 November 2010 EUR GBP 2 2 1 – 1 January 2010 to 30 November 2010 USD EUR 27 18 (3) – 1 January 2010 to 30 November 2010 ZAR USD 1 286 9 598 6 – June 2014 USD ZAR 10 000 61 346 7 495 21 792 December 2014 USD ZAR 10 000 57 725 11 011 26 158
19 029 43 101
* Nominal currency swap amounts range from GBP61 000 to GBP695 000 and USD43 000 to USD1 150 000.
9.3 Forward freight agreements The group has entered into a number of forward freight agreements which are designated as cash fl ow hedges, covering the
handysize (2008: handysize and capesize) ships to hedge against shipping market price risk. These are entered into in the normal course of business in order to hedge against open positions in the fl eet from contracts of affreightment (these FFA’s hedge sales are based on volumes shipped) and exposure on earnings for the handysize ships trading in a pool on the spot market. The basis for valuation of the FFA’s is set out in management’s critical judgements. At 31 December 2009, there were eight (2008: three) open forward freight agreements, designated as cash fl ow hedges, maturing as follows:
2009 2008 Strike Nominal Asset/ Asset/ price Quantity/ value (liability) (liability) SETTLEMENT PERIODS US$000 duration US$000 R000 R000
1 January 2009 to 31 December 2009 Handysize 19 750 365 days 7 209 – 41 183 1 January 2009 to 31 December 2009 Handysize 20 000 365 days 7 300 – 42 043 1 January 2009 to 31 December 2009 Handysize 28 000 365 days 10 220 – 69 382 1 January 2009 to 31 December 2010 Handysize 12 500 365 days 4 563 (18 413) – 1 January 2009 to 31 December 2010 Handysize 12 000 365 days 4 380 (19 752) – 1 January 2009 to 31 December 2010 Handysize 10 000 365 days 3 650 (3 147) – 1 January 2009 to 31 December 2010 Handysize 10 500 365 days 3 833 (3 309) – 1 January 2009 to 31 December 2010 Handysize 10 500 365 days 3 833 (3 317) – 1 January 2009 to 31 December 2010 Handysize 10 750 365 days 3 924 (6 014) – 1 January 2009 to 31 December 2010 Handysize 11 000 365 days 4 015 (5 343) – 1 January 2009 to 31 December 2010 Handysize 11 000 365 days 4 015 (2 653) –
56 942 (61 948) 152 608 Ineffective cash fl ow hedge – –
Effective cash fl ow hedge (61 948) 152 608

140
page
G
rindr
od L
imite
d /
Ann
ual R
epor
t 200
9
9 FINANCIAL INSTRUMENTS (continued) DERIVATIVE FINANCIAL INSTRUMENTS (continued) 9.3 Forward freight agreements (continued) At 31 December 2009, the sensitivity of the forward freight agreements to a US$1 000 movement in the shipping market prices
would have the following effect:
Group 2009 2008 R000 R000
US$1 000 increase Increase in FFA liability (15 389) (16 404) Decrease/(increase) in hedging reserve defi cit 15 389 (1 538) Decrease in profi t – 17 942
US$1 000 decrease Decrease in FFA liability 15 389 16 404 (Increase)/decrease in hedging reserve defi cit (15 389) 1 538 Increase in profi t – (17 942)
In addition to the above forward freight agreements the group has entered into additional forward freight agreements which are not treated as hedges:
2009 2008 Strike Nominal Asset/ Asset/ price Quantity/ value (liability) (liability) SETTLEMENT PERIODS US$000 duration US$000 R000 R000
1 October 2008 to 30 June 2009 2 470 5 500 mt 13 585 – (6 350) 1 October 2008 to 31 December 2009 89 406 450 days 40 233 – (19 728) 1 January 2009 to 31 March 2009 19 000 90 days 1 710 – (10 636) 1 January 2009 to 31 December 2009 10 100 365 days 3 687 – (2 544) 1 January 2009 to 31 December 2009 10 100 365 days 3 687 – 2 226 1 December 2009 to 30 April 2010 485 8 000 mt 3 880 1 459 – 1 December 2009 to 31 December 2010 15 545 440 days 6 840 17 277 –
73 622 18 736 (37 032)
9.4 Futures and options The group has entered into certain futures in order to commercially hedge the price risk in respect of commodity contracts which
mature between 1 January 2010 and 30 September 2010.
These contracts are not accounted for using hedge accounting and all fair value (gains)/losses are recognised in the income statement. Commodity inventory is valued at fair value less costs to sell with the fair value (gains)/losses also recognised in the income statement. Forward purchase and sales contracts are fair valued through the income statement.
Details of the group’s dealings in open futures and forward contracts at year-end are as follows:
2009 2008 Contract (Gain)/loss (Gain)/loss value recognised recognised COMMODITY Tonnage R000 R000 R000
White maize Purchase 711 13 149 285 295 White maize Purchase 16 000 33 759 – (4 361) Yellow maize Purchase 5 000 6 991 829 177 Yellow maize Sales 1 300 (1 925) (139) (612) Corn Sales 25 273 (23 672) 7 289 (9 422) Corn Purchase 2 447 118 398 – Soya bean meal Purchase 15 693 45 480 2 417 35 496 Soya bean meal Sales 646 (206) 170 – Soya bean Purchase 28 060 58 357 – 428 Soya bean Purchase 3 699 – – (2 116) Sunfl ower Purchase – 108 – (108) Rice Purchase – 22 22 – Wheat Sales 37 808 (48 576) 6 744 2 702 Wheat Purchase 28 568 50 570 (206) (907)
17 809 21 572 Mark to market settled through margin account (909) 3 200
Liability 16 900 24 772
Notes to the Notes to the financial statementsfinancial statements for the year ended 31 December 2009for the year ended 31 December 2009

page 141G
rindrod Limited / A
nnual Report 2009
businessoverview commentaries sustainability
annual fi nancialstatements
shareholderinformation
9 FINANCIAL INSTRUMENTS (continued) DERIVATIVE FINANCIAL INSTRUMENTS (continued) 9.4 Futures and options (continued)
2009 2008 (Gain)/loss (Gain)/loss Contract value recognised recognised FOREIGN CURRENCY US$000 R000 R000 R000
Purchase US Dollars 44 000 339 632 (101 861) – Mark to market settled through margin account 101 861 –
Liability – –
9.5 Forward contracts
2009 2008 Contract Asset/ Asset/ value (liability) (liability) COMMODITY Tonnage R000 R000 R000
Wheat Purchase 237 768 242 311 7 222 9 762 Wheat Purchase 25 295 44 576 (4 703) (66 663) Wheat Sales 46 133 (84 069) 8 795 11 484 Wheat Sales 281 277 (386 284) (8 041) (7 447) Soya bean meal Purchase 35 000 8 262 861 140 509 Soya bean meal Purchase 166 454 355 814 (4 519) – Soya bean meal Sales 62 335 (193 813) 14 596 21 509 Soya bean meal Sales 304 945 (228 222) (4 387) (40 455) Soya bean Purchase 1 002 3 561 – (72) Soya bean Sales 644 (2 066) (10) 31 Corn Purchase 137 551 57 390 (11 880) (11 236) Corn Sales 193 261 (224 498) 405 1 540 Corn Sales 50 000 (13 174) (2 487) – White maize Purchase 1 003 1 643 17 (549) White maize Sales 11 747 (17 814) (1 632) 1 160 Yellow maize Purchase 6 8 1 (142) Yellow maize Sales 9 403 (13 325) (1 472) 156 Sunfl ower Purchase 8 30 – 29 Sunfl ower Sales 32 152 – 36 Fuel Purchase 1 736 814 86 – Fuel Purchase 2 462 1 337 (153) – Fuel Sales 12 535 7 149 (1 777) – Other Purchases 2 168 6 788 870 (5 441) Other Sales 3 866 (7 902) 1 211 30 136 Other Sales 2 260 (7 569) (870) (39 416)
(7 867) 44 931
9.6 Interest rate swaps The company (*) and group have entered into the following interest rate swaps on Rand-denominated loans, whereby variable
interest rates have been fi xed as indicated below. The group (^) has entered into an interest rate swap which is designated as a cash fl ow hedge to manage the risk associated with fl uctuating interest rates. In addition the group’s subsidiary, Grindrod Bank Limited (#), enters into various interest rate swaps in the normal course of business. Grindrod Bank’s interest rate swaps fi x interest rates which are linked to JIBAR to rates between 10,38% per annum (2008: 13,72% per annum) and 17,60% per annum (2008: 14,54% per annum) and mature over the periods as indicated below:
2009 2008 Nominal Asset/ Asset/ Interest value (liability) (liability) MATURITY DATE rate R000 R000 R000
30 June 2009* Variable to 8,7% 250 000 – 2 048 30 June 2010 Variable to 9,9% 500 000 (6 737) (10 329) 30 June 2010 Variable to 9,8% 250 000 (3 224) (5 520) 30 December 2011 Variable to 9,9% 250 000 (2 982) (3 042) 30 December 2011^ Variable to 10,0% 232 000 (9 961) (12 397) Between January 2007 and February 2017# Various 139 692 (12 158) (16 120) Between January 2007 and February 2017# Various 21 698 – 1 065
(35 062) (44 295)

142
page
G
rindr
od L
imite
d /
Ann
ual R
epor
t 200
9
9 FINANCIAL INSTRUMENTS (continued) DERIVATIVE FINANCIAL INSTRUMENTS (continued) 9.7 Hedging details
Group 2009 2008 R000 R000
The abovementioned derivative’s hedging details are as follows: Ineffectiveness recognised in profi t or loss: Cash fl ow hedge – 1 378
2009 2008 Details of <3 3 – 6 6 – 12 >12 <3 3 – 6 6 – 12 >12 cash fl ow hedges months months months months months months months months
Financial asset – – – – 36 984 44 723 90 972 – Financial liability (26 604) (17 971) (17 369) – (7 799) (3 919) (3 850) (3 255)
2009 2008 Amount Amount recognised Amount recycled recognised Amount recycled in equity from equity into in equity from equity into
Hedging Income Asset/ Hedging Income Asset/ Reconciliation of cash fl ow reserve statement (liability) reserve statement (liability) hedge recognised in equity R000 R000 R000 R000 R000 R000
Opening balance (153 855) 365 587 Amount recognised in equity in
the current year 171 781 (125 232) Amount removed from equity
to income statement 143 860 (143 860) (442 816) 442 816 Deferred taxation arising on
interest rate swap 455 (455) (2 328) 2 328 Translation adjustments 7 280 50 934
Closing balance 169 521 (143 860) (455) (153 855) 442 816 2 328
Comprised of: Financial instruments 171 394 (151 527) Deferred taxation (1 873) (2 328)
169 521 (153 855)
9.8 Ship purchase option The group has the option to purchase a ship in 2011 at an agreed price of US$2 million. If the counterparty to the option elects not
to transfer the ship to the group upon exercise of the option, the group is entitled to receive a cash payment of US$13 million. As the estimated market price of the ship is in excess of US$15 million (the point at which it would become benefi cial to transfer the ship rather than settle in cash) at 31 December 2009, the fair value of the option has been calculated by discounting the expected cash receipt by the group.
Group 2009 2008 R000 R000
Ship purchase option 79 758 103 100
9.9 Property purchase option The group has the option to purchase a property on 31 December 2010 at an agreed price of R10,5 million. As the estimated
market price of the property is R12,7 million at 31 December 2009, the fair value of the option has been calculated as the difference between the market price and the agreed price. The market price was obtained from an external independent valuator and is based on the discounted future rentals expected to be generated by the property.
Group 2009 2008 R000 R000
Property purchase option 2 233 –
Notes to the Notes to the financial statementsfinancial statements for the year ended 31 December 2009for the year ended 31 December 2009

page 143G
rindrod Limited / A
nnual Report 2009
businessoverview commentaries sustainability
annual fi nancialstatements
shareholderinformation
9 FINANCIAL INSTRUMENTS (continued) DERIVATIVE FINANCIAL INSTRUMENTS (continued) 9.10 Derivative fi nancial instruments The derivative fi nancial instruments have been disclosed in the statement of fi nancial position as follows:
2009 2008 Hedging Financial Financial Hedging Financial Financial reserve assets liabilities reserve assets liabilities R000 R000 R000 R000 R000 R000
Forward currency exchange contracts on ships and other trading commitments (884) 7 520 (10 212) 7 239 23 673 (17 747)
Cross-currency swap – 19 149 (120) – 50 604 (7 503) Forward freight agreements (61 948) 18 736 (61 948) 152 608 154 834 (39 258) Futures and options (101 861) 18 153 (1 254) – 42 297 (17 526) Forward contracts – 34 064 (41 931) – 216 353 (171 421) Interest rate swaps (6 701) – (35 062) (8 320) 3 113 (47 408) Ship purchase option – 79 758 – – 103 100 – Property purchase option – 2 233 – – – –
(171 394) 179 613 (150 527) 151 527 593 974 (300 863)
Less portion due within one year included in trade and other payables/ (receivables) – (77 752) 125 423 – (452 887) 264 335
Long-term portion (171 394) 101 861 (25 104) 151 527 141 087 (36 528)
All of the above fi nancial instruments with the exception of the ship and property purchase options have been classifi ed as Level 1 fi nancial instruments, which indicates that the fair values of the instruments were determined with reference to quoted prices in active markets. The ship and property purchase options are classifi ed as Level 2 instruments which indicate that the fair value was determined with reference to inputs other than quoted prices.
Group 2009 2008 R000 R000
10 RECOVERABLES ON CANCELLED SHIPS Opening balance – – Transferred from ships, property, terminals, vehicles and equipment 280 469 – Impairment charged to income statement (30 391) – Interest raised on recoverable amount 24 052 – Translation loss (35 541) –
238 589 –
Group Company 2009 2008 2009 2008 R000 R000 R000 R000
11 DEFERRED TAXATION Deferred taxation analysed by major category: Capital allowances (113 692) (89 771) Other timing differences 84 092 106 681 – (317) Secondary taxation on companies credits 2 068 9 752 – 7 376 Estimated taxation losses 164 343 114 163
136 811 140 825 – 7 059
Reconciliation of deferred taxation: Opening balance 140 825 104 845 7 059 (6 312) Income statement effect 3 044 33 213 (6 631) 13 371 Transfer from non-distributable reserve (455) 939 Foreign currency translation adjustment (5 148) 1 604 Transferred to non-current liabilities associated with
assets classifi ed as held for sale (80) – (Disposal)/acquisition of businesses (1 375) 224
Closing balance 136 811 140 825 428 7 059
Comprising: Deferred taxation assets 159 088 159 352 428 7 059 Deferred taxation liabilities (22 277) (18 527)
136 811 140 825 428 7 059

144
page
G
rindr
od L
imite
d /
Ann
ual R
epor
t 200
9
Group 2009 2008 R000 R000
12 LOANS AND ADVANCES TO BANK CUSTOMERS Loans and receivables 1 330 072 898 100 Held at fair value through profi t or loss using year-end market related interest rate yield curves
to discount expected future cash fl ows 153 242 151 661
1 483 314 1 049 761
Loans and advances – companies and close corporations 1 156 651 758 174 Loans and advances – unincorporated businesses 63 965 61 207 Loans and advances – individuals 94 052 98 096 Property in possession 3 059 2 997 Preference shares 144 634 101 477 Interest accrued 12 343 12 230 Revaluation of loans held at fair value through profi t or loss 12 035 15 580 Less: impairments against advances (3 425) –
1 483 314 1 049 761
Advances are made at market related rates of interest and are secured with various types of collateral such as cash, mortgage bonds, shares, discounted invoices, guarantees and suretyships. This book is considered to be well secured and impairments have been raised where impairment indicators exist.
Contractual maturity analysis: Maturity on demand 295 941 143 939 Maturing within one month 107 496 35 916 Maturing after one month but within three months 11 621 124 961 Maturing after three months but within six months 89 794 32 308 Maturing after six months but within one year 150 177 35 532 Maturing after one year but within three years 397 424 332 188 Maturing after three years but within fi ve years 212 794 157 709 Maturing after fi ve years but within ten years 196 039 157 197 Maturing after ten years 1 075 2 201 Interest accrued 12 343 12 230 Revaluation of loans held at fair value through profi t or loss 12 035 15 580 Less impairment against advances (3 425) –
1 483 314 1 049 761
Maximum exposure to credit risk 1 486 739 1 049 761
Exposures with renegotiated terms – –
The maturity analysis of advances is based on the remaining contractual periods to maturity from the statement of fi nancial position date and does not take repayment profi les into account.
Sectoral analysis: Agriculture, hunting, forestry and fi shing 6 807 1 459 Mining and quarrying 17 618 17 669 Manufacturing 38 217 105 853 Construction 3 449 7 804 Wholesale and retail trade, repair of specifi ed items, hotels and restaurants 82 289 2 174 Transport, storage and communication 31 074 72 165 Financial intermediation and insurance 56 843 47 148 Real estate 826 591 505 880 Business services 88 380 123 533 Community, social and personal services 15 783 17 339 Private households 58 277 72 194 Other 257 986 76 543
1 483 314 1 049 761
Notes to the Notes to the financial statementsfinancial statements for the year ended 31 December 2009for the year ended 31 December 2009

page 145G
rindrod Limited / A
nnual Report 2009
businessoverview commentaries sustainability
annual fi nancialstatements
shareholderinformation
Group 2009 2008 R000 R000
12 LOANS AND ADVANCES TO BANK CUSTOMERS (continued) Geographical analysis: South Africa 1 483 314 1 049 761
Included in loans and advances are fi xed rate loans designated as held at fair value through profi t and loss:
Net book value of loans and advances held at fair value through profi t or loss 141 208 136 081 Revaluation of loans and advances held at fair value through profi t or loss 12 035 15 580 Less: Impairment of loans and advances held at fair value through profi t or loss – –
Fair value of loans and advances held at fair value through profi t or loss 153 243 151 661
Included in loans and advances are loans made to related parties at market related rates of interest:
Grindrod group companies – guarantees 2 895 2 895 Directors (directly and indirectly) – 40 647
2 895 43 542
Analysis of impairments: Impairments at the beginning of the year – 3 916 Net increase in impairments (3 425) (428) Written off against impairments – (3 488)
Impairments at the end of the year (3 425) –
Analysis of impaired loans and advances: Loans and advances classifi ed as special mention 16 391 39 544 Loans and advances displaying signifi cant weakness 4 257 1 796
Carrying amount of impaired loans and advances 20 648 41 340
Collateral held against impaired loans and advances 19 891 16 433
Sectoral analysis of impaired loans and advances: Construction – 71 Transport, storage and communication 39 – Manufacturing – 2 024 Community, social and personal services 2 365 1 517 Real estate 12 334 20 348 Private households – 10 416 Business services 1 653 6 964 Other 4 257 –
20 648 41 340
13 INVENTORIES Bunkers and other consumables 88 090 31 124 Commodities Agricultural 353 750 680 647 Other 8 837 42 394 Merchandise and containers 49 472 52 967 Held for sale assets – 98 710 Transferred to non-current assets classifi ed as held for sale (345) –
499 804 905 842
Reconciliation of held-for-sale assets – 98 710
Opening balance 98 710 151 939 Transferred from ships, property, terminals, vehicles and equipment 487 346 438 808 Transferred to receivables (75 921) – Additions 458 234 – Write-down to net realisable value – (65 406) Translation gain 30 679 38 976 Disposals (999 048) (465 607)
The fair value less costs to sell of the commodities inventory amounts to R353 866 000 (2008: R682 738 000).
Agricultural and other commodities, amounting to R339 474 000 (2008: R651 317 000) have been ceded to fi nancial institutions in order to secure available borrowing facilities of R420 442 000 (2008: R1 224 002 000).

146
page
G
rindr
od L
imite
d /
Ann
ual R
epor
t 200
9
Group Company 2009 2008 2009 2008 R000 R000 R000 R000
14 TRADE AND OTHER RECEIVABLES Trade debtors 2 384 850 2 253 441 3 – Less: allowances for doubtful debts (51 901) (37 932)
Net trade debtors 2 332 949 2 215 509 3 – Prepayments 57 630 92 680 15 527 Amounts due from subsidiaries 1 188 353 1 636 379 Loans to joint ventures Shareholders’ loans 40 533 46 896 Current portion of derivative fi nancial assets (note 9.10) 77 752 452 887 – 6 233 Other receivables 469 125 721 538 Transferred to non-current assets classifi ed as
held for sale (note 16) (4 382) –
2 973 607 3 529 510 1 188 371 1 643 139
Trade and other receivables, other than the current portion of fi nancial assets, are classifi ed as loans and receivables at amortised cost and their carrying amount approximates fair value. Trade and other receivables are predominately non-interest-bearing.
Included in the current portion of fi nancial assets are the following:
Forward exchange contracts on ships and other trading commitments 7 520 27 858 – 4 185
Cross-currency swaps 643 – Futures and options 16 903 39 097 Forward contracts 31 718 217 694 Interest rate swaps – 2 048 – 2 048 Forward freight agreements 18 735 109 175 Other 2 233 57 015
77 752 452 887 – 6 233
Reconciliation of allowances for doubtful debts Opening balance 37 932 22 834 Acquisition of businesses 4 158 4 348 Increase in allowance 12 235 15 266 Allowance utilised (2 424) (4 516)
Closing balance 51 901 37 932 – –
Concentrations of credit risk are limited due to the group’s customer base being large and unrelated. Due to this, the directors believe there is no further credit risk provision required in excess of the allowance for doubtful debts.
Trade debtors have been ceded to fi nancial institutions in order to secure overdraft facilities as follows: 1 340 210 1 598 757
Trading 1 188 419 1 355 696 Freight Services 151 791 243 061
The shareholders’ loans to joint ventures do not bear interest and there are no fi xed repayment terms.
Group 2009 2008 R000 R000
15 LIQUID ASSETS AND SHORT-TERM NEGOTIABLE SECURITIES Measured at amortised cost Preference shares 33 805 73 683 Statutory liquid assets Treasury bills – 4 492 Negotiable certifi cates of deposit 70 287 60 378
104 092 138 553
Notes to the Notes to the financial statementsfinancial statements for the year ended 31 December 2009for the year ended 31 December 2009

page 147G
rindrod Limited / A
nnual Report 2009
businessoverview commentaries sustainability
annual fi nancialstatements
shareholderinformation
Group 2009 2008 R000 R000
16 NON-CURRENT ASSETS CLASSIFIED AS HELD FOR SALE Ships, property, terminals, vehicles and equipment Leased terminals, vehicles and equipment 2 318 261 Investment in associate 57 1 918 Deferred taxation 80 – Other investments 867 – Inventory 345 – Trade and other receivables 4 382 – Bank and cash 4 631 66
12 680 2 245
NON-CURRENT LIABILITIES ASSOCIATED WITH ASSETS CLASSIFIED AS HELD FOR SALE Trade and other liabilities (5 193) –
(5 193) –
Business disposals The group has decided to dispose of certain businesses in its Freight Services division. The major classes of assets and liabilities
comprising the operations classifi ed as held for sale at the statement of fi nancial position date have been set out above, net of impairments recognised.
In the prior year, the group decided to dispose of two of its investments.
Group Company 2009 2008 2009 2008 R000 R000 R000 R000
17 SHARE CAPITAL AND PREMIUM Authorised 2 750 000 000 ordinary shares of 0,002 cent each
(2008: 2 750 000 000 ordinary shares of 0,002 cent each) 55 55 55 55 20 000 000 cumulative, non-redeemable, non-participating and non-convertible preference shares of 0,031 cent each (2008: 20 000 000 cumulative, non-redeemable, non-participating and non-convertible preference shares
of 0,031 cent each) 6 6 6 6
61 61 61 61
Issued 463 381 980 ordinary shares of 0,002 cent each
(2008: 478 476 210 shares of 0,002 cent each) 9 9 9 9 7 400 000 cumulative, non-redeemable, non-participating and non-convertible preference shares of 0,031 cent
each (2008: 7 500 000 cumulative, non-redeemable,non-participating and non-convertible preference
shares of 0,031 cent each) 2 2 2 2
Share premium 13 209 – 414 150 495 158
Balance at beginning of year – 189 061 495 158 492 113 Premium on shares issued 13 209 3 045 12 709 3 045 Net premium on shares acquired during the year by
group companies – (192 106) (93 717) –
Total issued share capital and premium 13 220 11 414 161 495 169
3 950 000 ordinary shares (2008: 3 520 000 ordinary shares) with a nominal value of R79,00 (2008: R71,00) were issued for R12 708 421 (2008: R3 045 700).
In the current year, 19 044 230 (2008: nil) ordinary shares and 100 000 preference shares were repurchased from a subsidiary for R287 567 877 (2008: nil) and R9 150 000 (2008: nil), respectively.
In the prior year, 8 776 542 ordinary shares with a nominal value of R175,53 and a share premium of R206 248 561 were purchased by a subsidiary of the group.
In the prior year, 100 000 preference shares with a nominal value of R31,00 and a share premium of R9 533 474 were purchased by a subsidiary of the group.
137 256 (2008: 137 256) cumulative, non-redeemable, non-participating and non-convertible preference shares with a nominal value of R42,55 (2008: R42,55) are held by a subsidiary of the group.
The unissued shares, to the extent of a maximum of 10% of the issued shares, are under the control of the directors until the forthcoming annual general meeting.
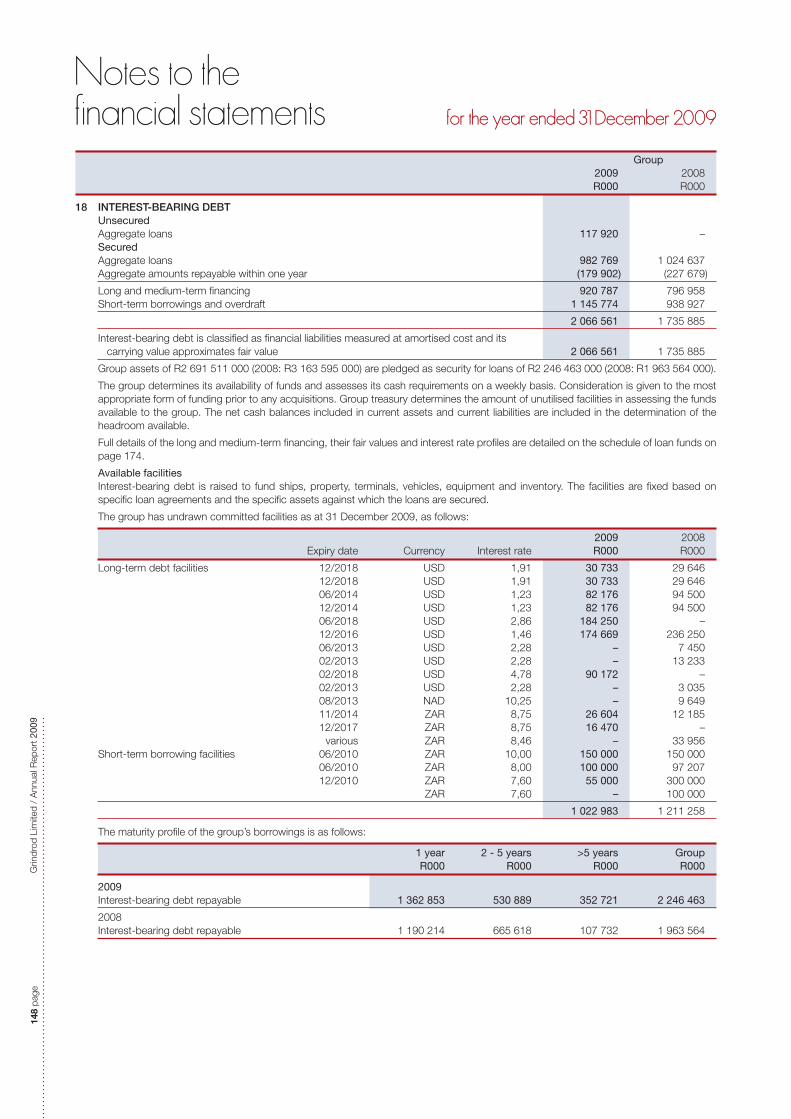
148
page
G
rindr
od L
imite
d /
Ann
ual R
epor
t 200
9
Group 2009 2008 R000 R000
18 INTEREST-BEARING DEBT Unsecured Aggregate loans 117 920 – Secured Aggregate loans 982 769 1 024 637 Aggregate amounts repayable within one year (179 902) (227 679)
Long and medium-term fi nancing 920 787 796 958 Short-term borrowings and overdraft 1 145 774 938 927
2 066 561 1 735 885
Interest-bearing debt is classifi ed as fi nancial liabilities measured at amortised cost and its carrying value approximates fair value 2 066 561 1 735 885
Group assets of R2 691 511 000 (2008: R3 163 595 000) are pledged as security for loans of R2 246 463 000 (2008: R1 963 564 000).
The group determines its availability of funds and assesses its cash requirements on a weekly basis. Consideration is given to the most appropriate form of funding prior to any acquisitions. Group treasury determines the amount of unutilised facilities in assessing the funds available to the group. The net cash balances included in current assets and current liabilities are included in the determination of the headroom available.
Full details of the long and medium-term fi nancing, their fair values and interest rate profi les are detailed on the schedule of loan funds on page 174.
Available facilities Interest-bearing debt is raised to fund ships, property, terminals, vehicles, equipment and inventory. The facilities are fi xed based on
specifi c loan agreements and the specifi c assets against which the loans are secured.
The group has undrawn committed facilities as at 31 December 2009, as follows:
2009 2008 Expiry date Currency Interest rate R000 R000
Long-term debt facilities 12/2018 USD 1,91 30 733 29 646 12/2018 USD 1,91 30 733 29 646 06/2014 USD 1,23 82 176 94 500 12/2014 USD 1,23 82 176 94 500 06/2018 USD 2,86 184 250 – 12/2016 USD 1,46 174 669 236 250 06/2013 USD 2,28 – 7 450 02/2013 USD 2,28 – 13 233 02/2018 USD 4,78 90 172 – 02/2013 USD 2,28 – 3 035 08/2013 NAD 10,25 – 9 649 11/2014 ZAR 8,75 26 604 12 185 12/2017 ZAR 8,75 16 470 – various ZAR 8,46 – 33 956 Short-term borrowing facilities 06/2010 ZAR 10,00 150 000 150 000 06/2010 ZAR 8,00 100 000 97 207 12/2010 ZAR 7,60 55 000 300 000 ZAR 7,60 – 100 000
1 022 983 1 211 258
The maturity profi le of the group’s borrowings is as follows:
1 year 2 - 5 years >5 years Group R000 R000 R000 R000
2009 Interest-bearing debt repayable 1 362 853 530 889 352 721 2 246 463
2008 Interest-bearing debt repayable 1 190 214 665 618 107 732 1 963 564
Notes to the Notes to the financial statementsfinancial statements for the year ended 31 December 2009for the year ended 31 December 2009

page 149G
rindrod Limited / A
nnual Report 2009
businessoverview commentaries sustainability
annual fi nancialstatements
shareholderinformation
Group 2009 2008 R000 R000
19 EMPLOYEE BENEFIT OBLIGATIONS 19.1 Provision for post-retirement medical aid The group subsidises the medical aid contributions of certain retired employees and has
an obligation to subsidise contributions of certain current employees when they reach retirement. The amounts recognised in the fi nancial statements in this respect are as follows:
Recognised liability at beginning of the year 77 900 72 819 Recognised as an expense in the current year 5 957 7 405
Interest on obligation 5 191 4 721 Current service cost 807 1 134 Actuarial (loss)/gain recognised (41) 2 070 Other – (520)
Contributions paid (5 989) (3 822) Acquisition on purchase of business – 1 498
Present value of unfunded obligations recognised as a liability at end of the year 77 868 77 900
There are no unrecognised actuarial gains or losses.
The principal actuarial assumptions applied in the determination of fair values include: Health care cost infl ation (%) 7,8 7,8 Discount rate (%) 8,8 8,8 Continuation at retirement (%) 75,0 75,0
An actuarial valuation was undertaken during 2009.
The effect of an increase or decrease of 1% in the assumed medical cost trend rates are as follows:
2009 2008 Effect of a 1% Effect of a 1% Effect of a 1% Effect of a 1% increase (decrease) increase (decrease)
Aggregate of the current service cost and interest cost (%) 14,6 (12,0) 14,6 (12,0)
Accrued liability at year-end (%) 13,6 (11,3) 13,6 (11,3)
The history of experience adjustments is as follows:
2009 2008 2007 2006 2005 2004
Present value of obligations 77 868 77 900 72 819 62 834 64 944 52 355 Fair value of plan assets – – – – – –
Present value of obligations in excess of plan assets 77 868 77 900 72 819 62 834 64 944 52 355
Experience adjustments on obligations – 1 567 5 075 30 925 (5 547) –

150
page
G
rindr
od L
imite
d /
Ann
ual R
epor
t 200
9
19 EMPLOYEE BENEFIT OBLIGATIONS (continued) 19.2 Retirement benefi t plans The group provides privately administered pension and provident funds for all permanent employees except those who belong to
an external fund, industry pension fund or provident scheme. All eligible employees are members of either defi ned benefi t or defi ned contribution plans which are governed by the South African Pension Funds Act,1956. An actuarial valuation was completed of the privately administered pension fund at 31 March 2007 taking into account the approval received from the Financial Services Board of the surplus apportionment process in terms of Section 15B(9) of the Pension Funds Act, No. 24 of 1956. Accordingly, the group has recognised the fund’s surplus.
The funded status of the pension fund is as follows:
Group 2009 2008 R000 R000
Actuarial value of assets 119 069 70 594 Present value of liabilities (72 137) (41 237) Unrecognised net gain (12 550) –
Actuarial surplus 34 382 29 357
The next actuarial valuations will be performed on 31 December 2010. The employer’s contribution to all retirement benefi t plans are charged against income when incurred.
The principal actuarial assumptions applied in the determination of fair values include:
Discount rate (%) 9,5 9,6 Salary increase (%) 6,8 6,2 Pension increase (%) 4,3 4,4
20 PROVISIONS Provision for onerous contracts Opening balance 199 556 54 613 Charged to income statement 48 613 273 876 Foreign exchange (gain)/loss (33 701) 9 961 Utilisation of provision (106 139) (138 894)
Closing balance 108 329 199 556 Current portion included under current liabilities (7 968) (101 048)
Non-current portion of onerous contract provisions 100 361 98 508
Provision for share price linked option scheme Opening balance – 4 023 Charged to income statement 6 505 12 438 Foreign exchange gain (76) – Expenses charged against provisions – (16 461)
Closing balance 6 429 – Current portion included under current liabilities (2 443) –
Non-current portion of share price linked option scheme 3 986 –
Aggregate 104 347 98 508
Onerous contracts Cash outfl ows in respect of the onerous contract provision are expected to arise over the
course of the relevant charter period based on current estimates of the loss arising from the contracts. The provision is classifi ed as a fi nancial liability measured at amortised cost and relates to the following specifi c items:
Product tanker charter 10 915 11 619 This represents payments that the company is obliged to make under non-cancellable onerous
operating ship charter agreements less revenue expected to be earned on the ship charters.
Contracts of affreightment and charters (capesize and handysize) 97 414 39 945 This represents scheduled contracts of affreightment on owned or long-term vessels, where the
expected costs exceed the expected revenues and the estimated costs of exiting certain future onerous contracts.
Charters – 147 992 This represents charter contracts where expected revenue exceeds the contracted cost of
chartering in certain vessels.
108 329 199 556
Provision for share price linked option scheme The share price linked option scheme provision relates to a remuneration scheme whereby certain employees of Grindrod Limited
are entitled to receive a cash settlement based on the excess of the market price of shares and an agreed upon strike price (refer to note 30).
Notes to the Notes to the financial statementsfinancial statements for the year ended 31 December 2009for the year ended 31 December 2009

page 151G
rindrod Limited / A
nnual Report 2009
businessoverview commentaries sustainability
annual fi nancialstatements
shareholderinformation
Group 2009 2008 R000 R000
21 INCOME RECEIVED IN ADVANCE Deposit received 117 921 189 000 Current portion included under current liabilities (29 480) (37 800)
88 441 151 200
The income received in advance is classifi ed as a fi nancial liability measured at amortised cost.
22 DEPOSITS FROM BANK CUSTOMERS Measured at amortised cost Call deposits 1 031 656 901 173 Notice and fi xed deposits 408 837 540 920 Prime linked notice deposits 294 268 46 483 Interest accrued 21 365 18 470
1 756 126 1 507 046
Amounts owed to depositors 1 574 839 1 225 460 Amounts owed to banks 181 287 281 586
1 756 126 1 507 046
Contractual maturity analysis: Withdrawable on demand 1 031 656 901 173 Maturing within one month 140 885 147 527 Maturing after one month but within six months 347 218 169 306 Maturing after six months 215 002 270 570 Interest accrued 21 365 18 470
1 756 126 1 507 046
The maturity analysis of deposits is based on their remaining contractual periods to maturity from the statement of fi nancial position date.
Sectoral analysis: Banks 181 287 281 586 Government and public sector 124 28 802 Individuals 690 432 240 942 Business sector 884 283 955 716
1 756 126 1 507 046
Geographical analysis: South Africa 1 756 126 1 507 046
Included in deposits are funds from related parties earning interest at market related rates: Directors (directly or indirectly) 102 255 91 737

152
page
G
rindr
od L
imite
d /
Ann
ual R
epor
t 200
9
Group Company 2009 2008 2009 2008 R000 R000 R000 R000
23 TRADE AND OTHER PAYABLES Trade creditors 1 337 486 1 604 213 281 32 Accrued expenses 553 583 774 190 4 252 5 059 Operating lease accrual 26 334 30 295 Loans from joint ventures Shareholders' loans 79 674 57 109 Other payables 195 495 252 247 966 1 099 Shareholders for dividends 32 416 52 816 32 416 46 910 Amounts due to subsidiaries 939 548 1 309 211 Current portion of derivative fi nancial liabilities (note 9.10) 125 423 264 335 Transferred to non-current liabilities associated with
assets classifi ed as held for sale (5 193) –
2 345 218 3 035 205 977 463 1 362 311
Trade and other payables, other than the current portion
of derivative fi nancial liabilities, are measured at amortised cost and their carrying amount approximates fair value. Trade and other payables are predominately non-interest bearing.
Included in the current portion of fi nancial liabilities are the following:
Forward exchange contracts on ships and other trading commitments (10 211) (21 782)
Cross-currency swaps (120) (4 848) Futures and options (1 254) (15 049) Forward contracts (41 930) (172 763) Other (9 960) (36 713) Forward freight agreements (61 948) (13 180)
(125 423) (264 335) – –
Shareholders’ loans comprising amounts due from joint venture parties do not bear interest and have no fi xed repayment terms.
Notes to the Notes to the financial statementsfinancial statements for the year ended 31 December 2009for the year ended 31 December 2009

page 153G
rindrod Limited / A
nnual Report 2009
businessoverview commentaries sustainability
annual fi nancialstatements
shareholderinformation
Group Company 2009 2008 2009 2008 R000 R000 R000 R000
24 REVENUE Revenue comprises net invoiced value of clearing and
forwarding, shipping and transport services, gross revenue earned from ship sales, seafreight, chartering, warehousing, depot operations, net interest and fee income of the fi nancial institution, ancillary services, investment income and revenue from sale of commodities and is analysed as follows:
Charter-hire 1 422 693 3 082 749 Freight revenue 2 378 269 2 590 718 Net invoiced sales 2 011 958 2 208 591 Sale of commodities 20 427 789 24 397 014 Ship sales 1 257 467 1 070 101 Net interest income of the fi nancial institution 39 252 33 224 Fee income of the fi nancial institution 87 844 50 772 Dividends received 15 672 9 524 1 313 721 2 735 806 Handling fee and other revenue 51 097 294 217 19 383 19 113
27 692 041 33 736 910 1 333 104 2 754 919
Analysis of the fi nancial institution’s net interest income included in above:
Interest income 172 678 202 660
Advances 115 517 120 651 Preference share dividends, advances portfolio 11 957 11 253 Balances at banks and short-term funds 34 029 47 626 Preference share dividends, negotiable securities portfolio 4 627 7 410 Other short-term securities 9 640 13 973 (Paid)/received on derivative instruments (3 092) 1 747
Interest expense 133 426 169 436
Call deposits 66 662 96 840 Notice and fi xed deposits 49 892 60 910 Other interest expense 2 485 – Prime linked notice deposits 14 387 11 686
Net interest income 39 252 33 224
Interest income calculated using the effective interest method 23 887 4 133
Interest income at fair value through profi t and loss 15 365 29 091
39 252 33 224

154
page
G
rindr
od L
imite
d /
Ann
ual R
epor
t 200
9
Group Company 2009 2008 2009 2008 R000 R000 R000 R000
25 OPERATING INCOME BEFORE INTEREST AND TAXATION
Other income Ship option write-up 1 183 3 517 Foreign exchange gains 95 711 344 137 17 029 23 296
On foreign currency exposure 89 531 336 506 17 029 23 296 On commodity trading 6 180 7 631
Pension fund surplus recognised 5 000 – Other sundry income 59 112 28 564 Option income 42 955 – Cancellation fees 47 950 – Net gains/(loss) on fi nancial instruments 122 316 182 852 (169) (2 412)
374 227 559 070 16 860 20 884
Operating expenses Voyage expenses 2 497 400 3 432 308
Charter-hire 2 007 784 2 165 845 Fuel 165 583 413 515 Port expenses 198 014 206 559 Provision for onerous voyage contracts 48 613 273 876 Other voyage expenses 77 406 372 513
Cost of sales 22 128 878 25 840 857
Agricultural commodities 6 708 681 7 914 411 Bunker fuels 11 811 505 14 011 778 Container handling and logistics 1 247 151 2 152 649 Merchandise 610 921 194 621 Ships 1 001 741 713 181 Other commodities 748 879 854 217
Distribution and selling costs 50 592 44 380 2 867 3 353 Staff costs 1 017 797 1 054 028 9 476 16 777 Foreign exchange losses 144 654 183 819 Other operating expenses 792 025 714 571 30 697 35 689
26 631 346 31 269 963 43 040 55 819
Depreciation and amortisation Amortisation Leasehold properties 5 279 5 654 Ships 5 004 7 461 Depreciation – owned assets Ships 75 933 52 319 Other 143 193 122 114 Depreciation – capitalised leased assets Ships 6 337 5 021 Other 10 144 10 660 Amortisation of intangible assets 46 510 37 713
292 400 240 942 – –
Notes to the Notes to the financial statementsfinancial statements for the year ended 31 December 2009for the year ended 31 December 2009

page 155G
rindrod Limited / A
nnual Report 2009
businessoverview commentaries sustainability
annual fi nancialstatements
shareholderinformation
Group Company 2009 2008 2009 2008 R000 R000 R000 R000
25 OPERATING INCOME BEFORE INTEREST AND TAXATION (continued)
The costs are arrived at after including: Auditors’ remuneration Audit fees – current year provision 21 984 20 703 2 720 2 138 Prior year underprovision 2 265 1 682 107 275 Fees for other services 6 225 5 374 327 146 Expenses 413 382
30 887 28 141 3 154 2 559
Operating lease rentals Land and buildings 193 392 146 514 Ships 2 010 266 2 203 127 Other 5 794 17 708
2 209 452 2 367 349 – –
Professional fees Administrative and managerial 38 580 38 499 Technical/projects 7 682 25 292
46 262 63 791 – –
Black economic empowerment costs 21 000 – Share-based payments 1 954 2 865 Amortisation of residual benefi ciary stream 463 960 Provision for credit losses/impairment against advances 757 (428)
26 NON-TRADING ITEMS Impairment of ships, property, terminals, vehicles and
equipment (3 617) (93 772) Impairment of investments (2 723) – (455) – Impairment of goodwill (990) (12 987) Impairment of intangible assets 46 886 (62 660) Impairment of cancelled ships (30 391) – Negative goodwill released 156 216 Profi t on disposal of investments 2 081 43 179 3 082 11 671 Profi t/(loss) on disposal of property, terminals, vehicles
and equipment 1 674 (1 631) Foreign exchange gains/(losses) realised from
non-distributable reserves on disposal of business 805 (35 912)
13 881 (163 567) 2 627 11 671
27 NET FINANCE COSTS Interest received 161 328 138 711 1 382 1 484 Net interest paid (252 695) (314 071) – (37)
Interest paid (254 028) (315 275) – (37) Interest capitalised 1 333 1 204
(91 367) (175 360) 1 382 1 447
Interest received is classifi ed as follows: Loans and receivables at amortised cost 161 328 122 446 1 382 1 484 Fair value through profi t and loss – 16 265
161 328 138 711 1 382 1 484
Interest paid is classifi ed as follows: Financial liabilities held at amortised cost (222 341) (280 761) – (37) Finance leases (30 354) (33 310)
(252 695) (314 071) – (37)
Net fi nance costs excludes interest from the fi nancial institution of the group.

156
page
G
rindr
od L
imite
d /
Ann
ual R
epor
t 200
9
Group Company 2009 2008 2009 2008 R000 R000 R000 R000
28 TAXATION South African normal taxation Current On income for the year (48 295) (162 615) (2 680) (9 649) Prior year (3 162) (11 928) 1 499 – Secondary taxation on companies (44 196) (62 764) (40 212) (52 537) Deferred On income for the year 12 848 3 303 745 5 884 Prior year (14 484) 19 269 – (106) On change of rate – (3 216) – 218 On secondary taxation on companies credits (11 996) 1 257 (7 376) 7 376 Foreign Current On income for the year (65 049) (20 009) Prior year (2 514) (1 077) Deferred On income for the year 16 676 11 342 Prior year – 1 258 Associate companies Current On income for the year (23 990) (17 850) Deferred On income for the year (3 913) –
(188 075) (243 030) (48 024) (48 814)
Effective rate of taxation % % % % Normal rate of taxation 28,0 28,0 28,0 28,0 Adjusted for: Current year tax losses utilised (0,7) (0,5) Exempt income (14,5) (6,5) (28,0) (28,0) Non-taxable foreign items (17,0) (24,9) Non-allowable items 14,2 10,8 Capital gains taxation – 0,3 Secondary taxation on companies 4,1 2,5 3,0 1,8 Deferred taxation on secondary taxation on companies
credits 1,1 (0,1) 1,0 – Change of rate – 0,1 Prior year 1,3 –
Effective rate of taxation 16,5 9,7 4,0 1,8
Subsidiary companies have estimated taxation losses of R650 803 000 (2008: R543 619 000) of which R500 245 000 (2008: R353 152 000) has been utilised in the calculation of deferred taxation.
The Shipping entities within the group operate under the United Kingdom tonnage taxation regime and the Singapore Approved International Shipping Enterprise Incentive (AIS) rules, for corporation taxation purposes. Under the UK regime, taxation is paid on the tonnage earned by the fl eet rather than on corporate income earned from shipping operations. The Singapore AIS regime exempts from corporate income taxes the profi ts of qualifying shipping activities. Non-qualifying activities are taxed at normal corporate income taxation rates.
Notes to the Notes to the financial statementsfinancial statements for the year ended 31 December 2009for the year ended 31 December 2009

page 157G
rindrod Limited / A
nnual Report 2009
businessoverview commentaries sustainability
annual fi nancialstatements
shareholderinformation
Group 2009 2008 R000 R000
29 EARNINGS PER SHARE Basic earnings reconciliation: Profi t attributable to Grindrod Limited shareholders 941 786 2 248 782 Less preference dividends (69 023) (90 892)
Profi t attributable to ordinary shareholders 872 763 2 157 890
Basic earnings per share is based on earnings of 872 763 2 157 890 and on the weighted average number of shares in issue for the year (000’s) 452 278 453 640 Diluted earnings per share is based on earnings of 872 763 2 157 890 and on the diluted weighted average number of shares in issue for the year (000’s) 454 436 459 930 Reconciliation of weighted average number of shares (000’s) Basic average number of shares in issue 452 278 453 640 Shares that will be issued for no value in terms of share option scheme 2 158 6 290
Diluted average number of shares in issue 454 436 459 930
Earnings per share (cents) Basic 193,0 475,7 Diluted 192,1 469,2 Headline earnings per share is based on headline earnings of 857 318 2 321 457 and on the weighted average number of shares in issue for the year (000’s) 452 278 453 640 Diluted headline earnings per share is based on headline earnings of 857 318 2 321 457 and on the weighted average number of shares in issue for the year (000’s) 454 436 459 930 Headline earnings per share (cents) Basic 189,6 511,7 Diluted 188,7 504,7
2009 Gross Net R000 R000
Headline earnings reconciliation: Earnings attributable to ordinary shareholders 872 763 Adjusted for: IAS 16 Impairment of Ships, Property, Terminals, Vehicles and Equipment 36 731 35 060 IAS 38 Impairment of Goodwill 990 990 IAS 38 (Reversal)/impairment of Intangible Asset in respect of Charters (46 886) (46 886) IFRS 3 Negative Goodwill Released (156) (156) IFRS 3 Profi t on disposal of investments (2 081) (2 081) IAS 16 Loss on Disposal of Property, Terminals, Vehicles and Equipment (1 674) (1 567) IAS 21 The Effect of Changes in Foreign Exchange Rates on Disposal of Business (805) (805)
Headline earnings (13 881) 857 318
2008 Gross Net R000 R000
Headline earnings reconciliation: Earnings attributable to ordinary shareholders 2 157 890 Adjusted for: IAS 16 Impairment of Ships, Property, Terminals, Vehicles and Equipment 93 772 93 772 IAS 16 Impairment of Goodwill 12 987 12 987 IAS 16 Impairment of Intangible Assets 62 660 62 660 IFRS 3 Negative Goodwill Released (216) (216) IFRS 3 Profi t on Disposal of Investments (43 179) (43 179) IAS 16 Loss on Disposal of Property, Terminals, Vehicles and Equipment 1 386 1 631 IAS 21 The Effect of Changes in Foreign Exchange Rates on Disposal of Business 35 912 35 912
Headline earnings 163 322 2 321 457

158
page
G
rindr
od L
imite
d /
Ann
ual R
epor
t 200
9
30 SHARE-BASED PAYMENTS 30.1 Equity-settled share option plan The company has a share option scheme for certain employees of the group. The options vest over a total period of seven years
from the option date as follows: – a fi fth of the options granted vest after three years; – a further fi fth of the options vest after four years; – a further fi fth of the options vest after fi ve years; – a further fi fth of the options vest after six years; and – a further fi fth of the options vest after seven years.
Options are exercisable at a price equal to the average quoted market price of the company’s shares on the date of grant. All options expire ten years after grant.
Options are forfeited if the employee leaves the group before the options vest.
Group Group 2009 2008 Weighted Weighted Number average Number average of share exercise of share exercise options price (cents) options price (cents)
Outstanding at the beginning of the year 9 450 000 653 12 970 000 369 Exercised during the year (3 950 000) 172 (3 520 000) 57
Outstanding at the end of the year 5 500 000 891 9 450 000 653
Exercisable at the end of the year 1 350 000 2 050 000
The weighted average share price at the date of exercise for the share options exercised during the year was R1,72 (2008: R0,57). Details of the options outstanding at the end of the year are disclosed in the directors’ report on page 110.
The fair values were calculated using a stochastic model based on the standard binomial options pricing model.
This model has been modifi ed to take into account early exercise opportunities and expected employee exercise behaviour.
The valuation was performed by independent actuaries. The inputs into the model were as follows:
Weighted average share price (cents) 1 253 Weighted average exercise price (cents) 1 253 Expected rolling volatility fi ve-year expected option lifetime (%) 43,64 six-year expected option lifetime (%) 39,45 seven-year expected option lifetime (%) 34,82 Expected option lifetime vesting periods three and four (years) 5 vesting periods fi ve and six (years) 6 vesting period seven (years) 7 Risk-free rate based on zero-coupon government bond yield fi ve-year expected option lifetime (%) 7,41 six-year expected option lifetime (%) 7,47 seven-year expected option lifetime (%) 7,52 Expected dividend yield (%) 3,38 Forfeiture rate per annum compound (%) 10,00
Expected volatility was determined by calculating an annualised standard deviation of the continuously compounded rates of return of the company’s share. The expected life used in the model has been adjusted, based on management’s best estimate, for the affects of employee turnover and exercise behaviour.
The group recognised expenses related to these equity-settled share-based payment transactions during the year, details of which have been disclosed on note 25.
30.2 Cash-settled share-based payments The group issues to certain employees share appreciation rights (SARs) that require the group to pay the intrinsic value of the SAR
to the employee at the date of exercise. The group has recorded liabilities of R6 108 000 (2008: nil).
The group recorded total expenses of R6 108 000 (2008: R12 438 000).
The fair values were calculated using a stochastic model based on the standard binomial options pricing model.
This model has been modifi ed to take into account early exercise opportunities and expected employee exercise behaviour.
Notes to the Notes to the financial statementsfinancial statements for the year ended 31 December 2009for the year ended 31 December 2009

page 159G
rindrod Limited / A
nnual Report 2009
businessoverview commentaries sustainability
annual fi nancialstatements
shareholderinformation
30 SHARE-BASED PAYMENTS (continued) 30.2 Cash-settled share-based payments (continued) The valuation was performed by independent actuaries. The inputs into the model were as follows:
Group 2009 2008
Share price 1 780 1 530 Expected rolling volatility: three-year expected option lifetime (%) 44,93 43,64 four-year expected option lifetime (%) 51,12 39,45 fi ve-year expected option lifetime (%) 46,70 34,82 Expected option lifetime: vesting periods three (years) 3 3 vesting periods four (years) 4 4 vesting periods fi ve (years) 5 5 Risk-free rate based on zero-coupon government bond yield: three-year expected option lifetime (%) 7,78 9,47 four-year expected option lifetime (%) 8,50 9,50 fi ve-year expected option lifetime (%) 9,17 9,56 Expected dividend yield (%) 3,73 9,50 Forfeiture rate per annum compound (%) 10,00 10,00
31 CAPITAL COMMITMENTS Authorised and contracted for 2 243 062 3 245 998
Due within one year 1 455 328 1 647 309 Due between years one and two 702 953 1 026 383 Due thereafter 84 781 572 306
Authorised and not contracted for 56 434 277 000
2 299 496 3 522 998
Financing guarantees 43 366 39 655
Financing guarantees are provided where lending facilities have been approved and all the terms and conditions of the loan have been met.
Irrevocable unutilised facilities to be advanced to Bank customers 29 560 25 937
Irrevocable unutilised facilities are approved lending facilities which cannot be unconditionally withdrawn, prior to facility expiry, by the Bank.
The group’s total capital commitments per category of signifi cant assets are as follows:
2010 2011 Thereafter Total 2009 R000 R000 R000 R000
Ships 857 663 635 193 84 781 1 577 637 Property, terminals, vehicles and equipment 465 401 63 020 1 000 529 421 Intangible assets 5 000 5 000 – 10 000 Investment in businesses 176 678 5 760 – 182 438
1 504 742 708 973 85 781 2 299 496
2009 2010 Thereafter Total 2008 R000 R000 R000 R000
Ships 1 376 985 914 023 571 877 2 862 885 Property, terminals, vehicles and equipment 486 324 112 360 429 599 113 Investment in businesses 61 000 – – 61 000
1 924 309 1 026 383 572 306 3 522 998
These commitments will be funded by cash resources, cash generated from operations and bank fi nancing facilities. The group has carried out a detailed liquidity planning exercise and is confi dent that it has the necessary resources to comfortably meet its capital and other commitments.
The group’s share of the capital commitments (included in above) of its jointly controlled entities referred to in note 35, is as follows:
2009 2008 R000 R000
Ships 260 219 665 000 Property, terminals, vehicles and equipment 24 500 –
284 719 665 000

160
page
G
rindr
od L
imite
d /
Ann
ual R
epor
t 200
9
32 CONTINGENT LIABILITIES The company has guaranteed loans and facilities of subsidiaries and joint ventures amounting to R3 757 200 000 (2008: R3 989 900 000)
of which R1 569 500 000 (2008: R962 073 000) had been utilised at year-end.
The company has guaranteed charter-hire payments of subsidiaries amounting to R1 711 900 000 (2008: R3 283 800 000). The charter-hire payments are due by the subsidiaries in varying amounts from years 2010 to 2015.
In addition the company has guaranteed the liabilities of two subsidiaries amounting to R228 000 000 (2008: R550 000 000).
UK tonnage taxation authorities are in the process of carrying out detailed reviews of UK tonnage taxation companies to ensure compliance with regulations. The group’s UK-based tonnage taxation companies have been subject to these reviews. While the group is confi dent it has complied with all regulations and requirements, there is a risk that the taxation authorities may attempt to levy additional taxation charges.
The group is engaged in a legal dispute with a shipyard over cancellation of ship newbuilding orders. Although it is anticipated that these issues will be resolved, there is a risk of a fi nancial loss.
The total contingent liabilities incurred by the group arising from interests in joint ventures is R32 947 000 (2008: R32 103 000).
Group Group 2009 2008 Year-end Average Year-end Average rates rates rates rates
33 FOREIGN CURRENCY DENOMINATED ITEMS All foreign currency denominated items are translated in
terms of the group’s policies.
At 31 December, exchange rates used on conversion were:
US Dollar 7,37 8,46 9,45 8,27 Euro 10,64 11,78 12,94 12,07 Pound Sterling 11,79 13,23 13,59 15,15 Swedish Krona 1,03 1,09 1,21 1,25 Singapore Dollar 5,29 5,75 6,67 5,79 Danish Krone 1,43 1,54 1,79 1,62 Japanese Yen 0,08 0,09 0,11 0,08 Botswana Pula 1,12 1,19 1,28 1,22 Tanzanian Shilling 0,01 0,01 0,01 0,01 New Mozambican Metical 0,26 0,31 0,38 0,34
Notes to the Notes to the financial statementsfinancial statements for the year ended 31 December 2009for the year ended 31 December 2009
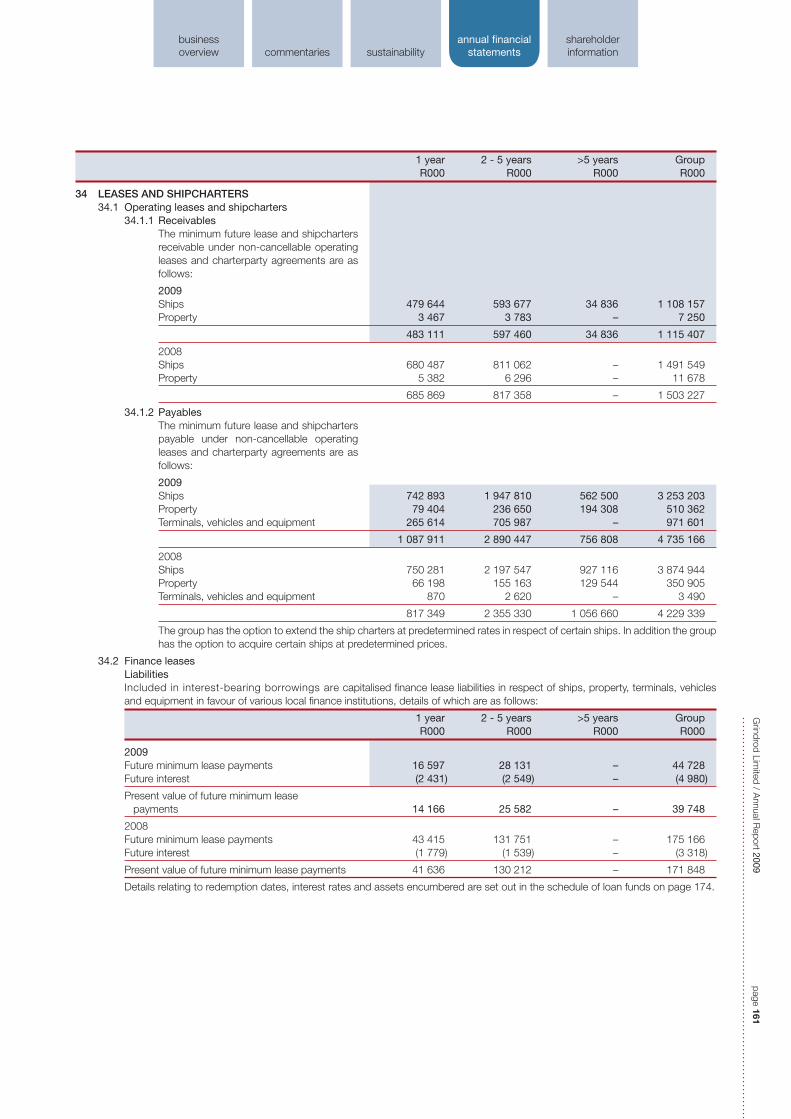
page 161G
rindrod Limited / A
nnual Report 2009
businessoverview commentaries sustainability
annual fi nancialstatements
shareholderinformation
1 year 2 - 5 years >5 years Group R000 R000 R000 R000
34 LEASES AND SHIPCHARTERS 34.1 Operating leases and shipcharters 34.1.1 Receivables The minimum future lease and shipcharters
receivable under non-cancellable operating leases and charterparty agreements are as follows:
2009 Ships 479 644 593 677 34 836 1 108 157 Property 3 467 3 783 – 7 250
483 111 597 460 34 836 1 115 407
2008 Ships 680 487 811 062 – 1 491 549 Property 5 382 6 296 – 11 678
685 869 817 358 – 1 503 227
34.1.2 Payables The minimum future lease and shipcharters
payable under non-cancellable operating leases and charterparty agreements are as follows:
2009 Ships 742 893 1 947 810 562 500 3 253 203 Property 79 404 236 650 194 308 510 362 Terminals, vehicles and equipment 265 614 705 987 – 971 601
1 087 911 2 890 447 756 808 4 735 166
2008 Ships 750 281 2 197 547 927 116 3 874 944 Property 66 198 155 163 129 544 350 905 Terminals, vehicles and equipment 870 2 620 – 3 490
817 349 2 355 330 1 056 660 4 229 339
The group has the option to extend the ship charters at predetermined rates in respect of certain ships. In addition the group has the option to acquire certain ships at predetermined prices.
34.2 Finance leases Liabilities Included in interest-bearing borrowings are capitalised fi nance lease liabilities in respect of ships, property, terminals, vehicles
and equipment in favour of various local fi nance institutions, details of which are as follows:
1 year 2 - 5 years >5 years Group R000 R000 R000 R000
2009 Future minimum lease payments 16 597 28 131 – 44 728 Future interest (2 431) (2 549) – (4 980)
Present value of future minimum lease payments 14 166 25 582 – 39 748
2008 Future minimum lease payments 43 415 131 751 – 175 166 Future interest (1 779) (1 539) – (3 318)
Present value of future minimum lease payments 41 636 130 212 – 171 848
Details relating to redemption dates, interest rates and assets encumbered are set out in the schedule of loan funds on page 174.

162
page
G
rindr
od L
imite
d /
Ann
ual R
epor
t 200
9
Group 2009 2008 R000 R000
35 JOINT VENTURE INTERESTS The group has joint venture interests in the following companies, which have the same year-end
as the company unless otherwise stated:
Handyventure (Singapore) Pte Ltd Shipowning and operating (%) 50,0 50,0 Petrochemical Shipping Limited# Shipowning (%) 50,0 50,0 Röhlig-Grindrod (Pty) Limited Clearing and forwarding (%) 50,0 50,0 Unicorn Calulo Shipping Services (Pty) Limited Barge operations (%) 50,0 50,0 Chromtech Holdings (Pty) Limited Minerals trading (%) 50,0 – Unicorn-Heidmar LLC Ship operating (%) 50,0 50,0 Tri-View Shipping Pte Ltd Shipowning and operating (%) 51,0 51,0 LCL Grindrod (Pty) Limited* Seafreight perishable cargo agent (%) – 50,0 Vanguard Rigging (Pty) Limited Machine handling, rigging and
transport services (%) 50,0 50,0 IM Shipping Pte Ltd Shipowning and operating (%) 51,0 51,0 Portus Indico – Sociedade de Servicos Poruarios SA Port operations (%) 48,5 48,5 Crocodile Chrome (Pty) Limited Minerals trading (%) 50,0 – Otjozondu Mining (Pty) Limited Minerals mining (%) 25,0 – East Coast Maritime (Pty) Limited Minerals trading (%) 50,0 – RRL Grindrod (Pty) Limited Rail operations (%) 50,0 – RRL Grindrod Locomotives (Pty) Limited Rail owning (%) 50,5 – * This investment was disposed of during the current year. # 31 March year-end.
The proportionate interest in the joint ventures has been incorporated into the results, cash fl ow, assets and liabilities as follows:
INCOME STATEMENT Revenue 2 663 803 749 146
Operating income before interest and taxation 16 426 242 970 Net interest received/(paid) 378 (6 143) Taxation (9 410) (22 265)
Net income after taxation 7 394 214 562
STATEMENT OF CASH FLOW Cash infl ow from operating activities 290 564 80 583 Cash outfl ow from investing activities (284 490) (59 559) Cash infl ow/(outfl ow) in fi nancing activities 86 617 (47 554)
Net cash infl ow/(outfl ow) 92 691 (26 530)
STATEMENT OF FINANCIAL POSITION Non-current assets 809 419 844 703 Current assets 526 843 378 919 Non-current liabilities (99 233) (8 774) Current liabilities (608 692) (415 674)
Net assets 628 337 799 174
Total liabilities comprise: Interest-bearing liabilities (229 058) (238 061) Non-interest-bearing liabilities (478 867) (186 387) The proportionate share of the capital commitments of the joint ventures, which have been
incorporated in the group’s overall capital commitment detailed in note 31, are as follows:
Authorised and contracted for 284 719 665 000
Due within one year 284 719 275 000 Due between years one and two – 144 000 Due between years two and three – 246 000 Due thereafter – –
Authorised and not contracted for – –
284 719 665 000
Notes to the Notes to the financial statementsfinancial statements for the year ended 31 December 2009for the year ended 31 December 2009

page 163G
rindrod Limited / A
nnual Report 2009
businessoverview commentaries sustainability
annual fi nancialstatements
shareholderinformation
Group Company 2009 2008 2009 2008 R000 R000 R000 R000
36 CASH FLOW 36.1 Reconciliation of operating profi t before interest
paid and taxation to cash generated from/(absorbed by) operations
Operating profi t before interest paid and taxation 1 142 522 2 785 075 1 306 924 2 719 984 Adjustments for: Depreciation 240 886 203 229 Share option expense 22 954 2 865 Dividends received (1 313 721) (2 735 806) Amortisation of intangible assets and dry-docking 51 514 37 713 Non-cash fi nancial instruments and foreign
exchange gains (60 213) (154 687) 169 2 412 Profi t on sale of ships and locomotives (255 726) (356 920) Impairment of held-for-sale assets – 65 406 Ship option write-up (1 183) (3 517) Non-cash provisions/other (5 030) 3 583 6 064 13 811
Operating profi t before working capital changes 1 135 724 2 582 747 (564) 401 Working capital changes Decrease/(increase) in inventories 317 626 (175 139) Increase/(decrease) in trade and other receivables (95 104) 604 004 92 (430) (Decrease)/increase in trade and other payables (440 499) 341 374 (691) (2 804)
Cash generated from/(absorbed by) operations 917 747 3 352 986 (1 163) (2 833)
36.2 Dividends paid Dividends paid by company (539 761) (607 429) (550 292) (620 451)
36.3 Property, plant and equipment acquired Additions – property, terminals, vehicles and
equipment (359 095) (513 997)
Cash fl ow on acquisition of property, terminals, vehicles and equipment (359 095) (513 997) – –
36.4 Acquisition of subsidiaries and joint ventures During the year the group acquired additional
interests in subsidiaries and joint ventures as follows:
Ships, property, terminals, vehicles and equipment (17 834) (46 998) Non-current assets held for sale – (480) Financial assets – (1 374) Working capital (7 307) (152 534) Cash and bank 7 018 67 908 Long-term liabilities 5 488 14 790 Post-retirement medical obligation – 1 498 Minority interest – 136 Short-term borrowings – 50 247 Deferred taxation – (224) Taxation liabilities – 8 464 Goodwill and intangible assets (189 072) (207 610)
Total purchase price (201 707) (266 177) Less cash and cash equivalents (7 018) (67 908)
Cash fl ow on acquisition net of cash acquired (208 725) (334 085)

164
page
G
rindr
od L
imite
d /
Ann
ual R
epor
t 200
9
Group Company 2009 2008 2009 2008 R000 R000 R000 R000
36 CASH FLOW (continued) 36.5 Disposal of subsidiaries and joint ventures During the year the group disposed of its interests in
subsidiaries and joint ventures as follows:
Ships, property, terminals, vehicles and equipment 123 – Investments 248 – 482 – Working capital (1 912) – Cash and bank 2 299 – Minority interest 26 146 – Loans from minority interest (16 146) – Deferred taxation 1 375 – Goodwill and intangible assets 2 318 –
Total purchase price 14 451 – 482 – Less cash and cash equivalents (2 299) –
Cash fl ow on acquisition net of cash acquired 12 152 – 482 –
36.6 Cash and cash equivalents Cash and cash equivalents included in the cash
fl ow comprise the following statement of fi nancial position amounts:
1 922 327 2 403 087 2 057 804
Deposits with the SA Reserve Bank 32 907 27 247 Bank and cash balances included in non-current
assets held for sale 4 632 – Interbank call deposits 380 161 508 410 Bank balances and cash 1 504 627 1 867 430 2 057 804
Bank overdrafts (253 045) (427 981)
1 669 282 1 975 106 2 057 804
37 ACQUISITION OF SUBSIDIARIES AND JOINT VENTURES During the year the group acquired the following additional interests:
Date Percentage of acquisition/ Company acquired incorporation
RRL Grindrod (Pty) Limited 50,0 01 January 2009 RRL Grindrod Locomotives (Pty) Limited 50,5 01 January 2009 Corrline (Pty) Limited 54,6 01 September 2009
The cash consideration for these businesses totalled R17 519 000 and the incremental profi t recognised was R3 562 000.
Net assets acquired in the transactions and the goodwill/intangible assets arising, are as follows:
Acquirees’ carrying amount before combination Fair value Net assets acquired R000 R000
Property, plant and equipment 17 834 17 834 Working capital 7 307 7 307 Cash and bank (7 018) (7 018) Long-term liabilities (5 488) (5 488)
Total 12 635 12 635 Goodwill and intangible assets arising on acquisition (refer to note 4 for details) 189 072
201 707
The goodwill arising on the acquisition of these businesses is attributable to the anticipated profi tability of these businesses.
Notes to the Notes to the financial statementsfinancial statements for the year ended 31 December 2009for the year ended 31 December 2009

page 165G
rindrod Limited / A
nnual Report 2009
businessoverview commentaries sustainability
annual fi nancialstatements
shareholderinformation
38 RELATED PARTY TRANSACTIONS During each year the group, in the ordinary course of business, enters into various transactions with related parties. Parties are considered
to be related if one party has the ability to control or exercise signifi cant infl uence over the other party in making fi nancial and operating decisions. These transactions occurred under terms that are no more or less favourable than those arranged with third parties.
Group Infl uence Amounts holders Joint due by/(to) in the group Associates ventures related party R000 R000 R000 R000
2009 Goods and services sold to: Ocean Africa Container Lines (Pty) Limited 958 142 Röhlig-Grindrod (Pty) Limited 1 347 Spinnaker Shipping & Logistics (Pty) Limited 235 460 Erundu Stevedoring (Pty) Limited 278 Vanguard Rigging (Pty) Limited 240 67 Corrline (Pty) Limited 2 837 East Coast Maritime (Pty) Limited 1 169
Goods and services purchased from: Maputo Port Development Company 36 975 3 564 Catfi sh Investments (Pty) Limited 668 LCL Grindrod (Pty) Limited 9 Ocean Africa Container Lines (Pty) Limited 2 758 Röhlig-Grindrod (Pty) Limited 6 574 Petrochemical Shipping Limited 931 East Coast Maritime (Pty) Limited 2 374 Nicolle Shipping (Pty) Limited 305
305 41 872 14 135 4 580
2008 Goods and services sold to: CMA CGM Shipping Agencies South Africa (Pty) Limited 187 23 Unicorn Calulo Bunker Services (Pty) Limited 10 768 LCL Grindrod (Pty) Limited 1 457 Ocean Africa Container Lines (Pty) Limited 4 929 387 IM Shipping Pte Ltd 593 63 051 Tri-View Shipping Pte Ltd 231 13 575 Petrochemical Shipping Limited 91 Röhlig-Grindrod (Pty) Limited 3 047 2 346 Portus Indico - Sociedade de Servicos Poruarios SA 4 681 91 060 Spinnaker Shipping & Logistics (Pty) Limited 93 19 Vanguard Rigging (Pty) Limited 144
Goods and services purchased from: Maputo Port Development Company 3 577 Catfi sh Investments (Pty) Limited 632 Nicolle Shipping (Pty) Limited 278
910 8 786 10 244 181 229

166
page
G
rindr
od L
imite
d /
Ann
ual R
epor
t 200
9
Company Other Guarantee Amounts Dividends revenue fees and other due by/(to) received received expenses paid related party R000 R000 R000 R000
38 RELATED PARTY TRANSACTIONS (continued) 2009 Subsidiaries Grindrod Freight Services (Pty) Limited 165 099 395 812 325 Grindrod Financial Holdings Limited 28 378 Grindrod Freight Investments (Pty) Limited 73 180 311 (4) Grindrod Management Services (Pty) Limited 3 468 (4 429) (422 863) Grindrod Shipping Limited 13 244 (21 267) (7 707) Grindrod Shipping South Africa (Pty) Limited 811 168 1 965 26 004 Grindrod Trading Holdings (Pty) Limited 235 896 (50 559) Swallow Enterprises Incorporated 4 844 Unicorn Shipping Holdings Limited 72 Unicorn Shipping (Pty) Limited 21 Grincor Shipping Holdings Limited (113 325)
1 313 721 19 383 (25 696) 248 808
2008 Subsidiaries Grindrod (South Africa) (Pty) Limited 64 919 8 773 (14 232) 210 808 Grindrod Financial Holdings Limited 19 696 (365) 25 874 Grindrod Freight Investments (Pty) Limited 1 029 789 468 181 360 Grindrod Management Services (Pty) Limited 809 (4 744) (1 008 929) Grindrod Shipping Limited 1 519 891 6 398 (9 803) 93 670 Island View Shipping (Pty) Limited 66 640 2 666 476 643 Unicorn Shipping Holdings Limited 7 107 72 Unicorn Shipping Operations (Pty) Limited 27 763
2 735 805 19 114 (29 144) (20 502)
Associates Details of material investments in associates are set out in note 7. Dividends received from associate companies amounted to
R78 893 000 (2008: R3 035 000).
Joint ventures Details of interests in joint ventures are set out in notes 6 and 35.
Subsidiaries Details of investments in subsidiaries are set out in note 5 and in the schedule of interest in subsidiaries on page 175.
Directors Details of directors’ interests in the company and directors’ emoluments are set out in the directors’ report.
Shareholders The principal shareholders of the company are detailed in the share analysis schedule.
Notes to the Notes to the financial statementsfinancial statements for the year ended 31 December 2009for the year ended 31 December 2009

page 167G
rindrod Limited / A
nnual Report 2009
businessoverview commentaries sustainability
annual fi nancialstatements
shareholderinformation
39 FINANCIAL INSTRUMENTS RISK MANAGEMENT OBJECTIVES AND POLICIES The principal risks to which the group is exposed through fi nancial instruments are: – foreign currency; – commodity; – shipping market; – interest rate; – credit; – counterparty; – liquidity; and – solvency.
The group’s overall strategy with regard to liquidity and fi nancial risk is guided by the corporate objective to maximise the group’s cash fl ow, actively manage its risk and reduce earnings volatility in a cost effective manner.
Divisional and group treasury aim to negotiate fi ner rates for borrowings and avoid restrictive covenants, which limit the board’s fl exibility to act. The group also aims to minimise transaction charges from the company’s banks, maximise interest income and minimise interest cost through effi cient cash management practices.
Commodity price exposure is managed by the Trading division. Main risk exposures are yellow maize, corn, soya bean meal, wheat, bunker fuel, iron ore and chrome.
Treasury function The treasury function incorporates the following main sections: – foreign exchange management; – cash management; – funding and liquidity management; – counterparty and credit risk management; – interest rate exposure management; and – bank relationship management.
Treasury management committee The treasury management committee meets eight times a year and reviews the total risk management process. It is responsible for
implementing, reviewing and maintaining the treasury management policies. The committee membership consists of the group fi nancial director and the divisional treasurers. In addition to the risk management process the committee reviews the following functions:
– forecast liquidity and funding requirements; – foreign exchange cover levels based on the exchange rate views; – performance of market risk management; – interest rate exposure and cover levels; and – reporting on divisional treasury positions.
Financial director The fi nancial director together with the divisional executives are responsible for the ultimate approval of day-to-day treasury activities and
reporting on treasury matters.
Executive committee The executive committee reviews all treasury related proposals and strategies that require board approval prior to submission.
Board of directors The board of directors is the highest approval authority for all treasury matters. A formal treasury review performed by the treasury
department is tabled quarterly. Material changes to the policies and urgent treasury matters as determined by the group’s limits of authority are required to be submitted to the board.

168
page
G
rindr
od L
imite
d /
Ann
ual R
epor
t 200
9
Notes to the Notes to the financial statementsfinancial statements for the year ended 31 December 2009for the year ended 31 December 2009
39 FINANCIAL INSTRUMENTS RISK MANAGEMENT OBJECTIVES AND POLICIES (continued) 39.1 Foreign currency risk The objective of the foreign exchange exposure management policy is to ensure that all foreign exchange exposures are identifi ed as
early as possible and that the identifi ed exposures are actively managed to reduce risk. All exposures are to refl ect underlying foreign currency commitments arising from trade and/or foreign currency fi nance. Under no circumstances are speculative positions, not supported by normal trade fl ows, permitted.
The group is subject to economic exposure, transaction exposure and translation exposure.
– Economic exposure consists of planned net foreign currency trade in goods and services not yet manifested in the form of actual invoices and orders. Economic exposure is initially identifi ed at the time of budget preparation and is progressively reviewed on a quarterly basis at the time of each budget revision.
– Transaction exposure consists of all transactions entered into which will result in a fl ow of cash in foreign currency at a future time, such as payments for foreign currency long and short-term loan liabilities, purchases and sales of goods and services (from invoice date to cash payment or receipt), capital expenditure (from approval date until cash payment) and dividends (from declaration date to payment date). Commercial transactions shall only be entered in currencies that are readily convertible by means of formal external forward contracts.
– Translation exposure relates to the group’s investments and earnings in non-Rand currencies which are translated in the Rand reporting currency. Translation exposure is not hedged.
Transaction and translation exposures are identifi ed as they occur and are reported by the various entities to the respective treasury divisions and the group treasury management committee.
In terms of group policy, foreign loan liabilities are not covered using forward exchange contracts as these are covered by a natural hedge against the underlying assets.
The group’s policy is to cover all trade commitments that are not hedged by a foreign currency revenue stream and to cover the Rand funded element of capital commitments.
Monetary items are converted to Rands at the rate of exchange ruling at the fi nancial reporting date. Derivative instruments are valued with reference to forward exchange rates from the year-end to settlement date, as provided by independent fi nancial institutions.
Foreign currency balances The uncovered foreign currency denominated balances at 31 December were as follows:
Group 2009 2009 2008 2008 US$000 R000 US$000 R000
Ship option security deposit – – 10 910 103 100 Loans (63 011) (464 395) (37 459) (353 988) Trade and other receivables 31 071 228 993 3 597 33 996 Trade and other payables (4 780) (35 228) (6 008) (56 772) Bank balances 9 236 68 059 17 379 164 236
(27 484) (202 571) (11 581) (109 428)
Sensitivity analysis At year-end the sensitivity of the net open exposure on the operating profi t is as follows:
Group 2009 2008 Net exposure R000 R000
+15% (2008: +50%) (68 019) (93 623) –15% (2008: –50%) 68 019 120 522
39.2 Commodity risk The group uses commodity futures and options to manage exposure to commodity price risk where the positions are not naturally
economically hedged through the combination of holding inventory, forward sales contracts and forward purchase contracts. In instances where the commodity prices are traded in foreign currency, the foreign exchange exposure is covered by forward exchange contracts.
Sensitivity analysis At year-end the sensitivity of the net open exposure on operating profi t is as follows:
Group 2009 2008 Net exposure R000 R000
+10% 1 774 (56 729) –10% (1 774) 56 729

page 169G
rindrod Limited / A
nnual Report 2009
businessoverview commentaries sustainability
annual fi nancialstatements
shareholderinformation
39 FINANCIAL INSTRUMENTS RISK MANAGEMENT OBJECTIVES AND POLICIES (continued) 39.3 Shipping market risk The group is exposed to the fl uctuations in market conditions in the shipping industry. Management continually assesses shipping
markets, using their experience and detailed research. Risks are managed by fi xing tonnage on longer-term charters, contracts of affreightment and entering into forward freight agreements. Refer to the risk management policies in the sustainability report for further details.
39.4 Interest rate risk 39.4.1 Interest rate risk of the group (excluding fi nancial institution) The group monitors its exposure to fl uctuating interest rates and generally enters into contracts that are linked to market
rates relative to the currency of the asset or liability. The group makes use of derivative instruments, such as interest rate swaps to manage this exposure, from time to time.
The interest rate profi le of the group is summarised as follows:
2009 2008 R000 R000
Loans linked to LIBOR 299 372 346 891 Loans linked to SA money market 801 316 677 746 Short-term borrowings linked to LIBOR 5 113 42 336 Short-term borrowings linked to SA money market 1 140 661 896 591 Loans with a fi xed interest rate – –
2 246 462 1 963 564
Full details of the interest rate profi le of long-term borrowings are set out in the schedule of loan funds on page 174.
The range of interest rates in respect of all non-current borrowings comprising both fi xed and fl oating rate obligations at 31 December 2009 is: local rates are between 7,60% and 10,00% (2008: 12,75% and 13,50%); and foreign rates are between 1,23% and 4,78% (2008: 2,28% and 15,00%). At 31 December 2009 and 2008, all of the group’s non-current borrowings were at fl oating rates of interest. Floating rates of interest are based on LIBOR (London interbank Offered Rate – for US Dollar borrowings) and on JIBAR (Johannesburg Interbank Agreed Rate – for SA borrowings). Fixed rates of interest are based on contract rates. Interest rate swaps are taken in order to fi x interest rates on certain loans.
Sensitivity analysis At year-end the sensitivity of the net open exposure of fl oating interest rates on the operating profi t is as follows:
Group 2009 2008 Net exposure R000 R000
+500 basis points (2008: +10%) 192 060 50 404 –500 basis points (2008: –10%) (197 749) (50 126)
39.4.2 Interest rate risk of the fi nancial institution There is a risk that fl uctuating interest rates will unfavourably affect Grindrod Bank’s earnings and the value of its assets,
liabilities and capital. The risk is due to assets and liabilities maturing or repricing at different times, or against different base rates. The amount at risk is a function of the magnitude and direction of interest rate changes and the size and maturity structure of the mismatch position.
>3 months >6 months >1 year Non-rate <3 months <6 months <1 year <5 years >5 years sensitive Total Interest rate repricing gap R000 R000 R000 R000 R000 R000 R000
2009 Assets 1 839 491 – – 49 208 92 000 126 302 2 107 001 Equity and liabilities (1 469 248) (104 416) (185 261) (29 741) – (318 335) (2 107 001) Interest rate hedging activities 139 692 – – (48 746) (90 946) – – Repricing profi le 509 935 (104 416) (185 261) (29 279) 1 054 (192 033) – Cumulative repricing profi le 509 935 405 519 220 258 190 979 192 033 Expressed as a percentage
of total assets of the fi nancial institution (%) 24,2 19,2 10,5 9,1 9,1
2008 Assets 1 655 622 – – 53 703 82 378 89 401 1 881 104 Equity and liabilities (1 285 991) (15 994) (242 224) (28 346) – (308 549) (1 881 104) Interest rate hedging activities 133 307 – (7 245) (47 964) (78 098) – – Repricing profi le 502 937 (15 994) (249 469) (22 607) 4 280 (219 147) – Cumulative repricing profi le 502 937 486 942 237 472 214 866 219 146 Expressed as a percentage
of total assets of the fi nancial institution (%) 26,7 25,9 12,6 11,4 11,6

170
page
G
rindr
od L
imite
d /
Ann
ual R
epor
t 200
9
Notes to the Notes to the financial statementsfinancial statements for the year ended 31 December 2009for the year ended 31 December 2009
39 FINANCIAL INSTRUMENTS RISK MANAGEMENT OBJECTIVES AND POLICIES (continued) 39.4 Interest rate risk (continued) 39.4.2 Interest rate risk of the fi nancial institution (continued)
>3 months >6 months Interest income sensitivity <3 months <6 months <1 year Total
2009 2% interest rate increase 1 344 1 696 3 918 6 958 2% interest rate decrease (1 513) (1 832) (4 137) (7 482)
2008 2% interest rate increase 2 342 1 703 3 589 7 634 2% interest rate decrease (2 325) (1 664) (3 438) (7 427)
39.5 Credit risk Credit risk refers to the risk of fi nancial loss resulting from failure of a counterparty to an asset, for any reason, to fully honour its
fi nancial and contractual obligations. Potential areas of credit risk consist of cash and cash equivalents, bank advances, trade debtors and other receivables. The group limits its exposure in relation to cash balances by only dealing with well established fi nancial institutions of high quality credit standing. Credit risk management applied by the group involves prudently managing the risk and reward relationship and controlling and minimising credit risks across a variety of dimensions, such as quality, concentration, maturity and security. These procedures help to ensure the credit quality of the group’s fi nancial assets. The spread of risk in relation to trade and other debtors is summarised as follows:
Shipping Freight Services Trading Group costs Total
Number of Number of Number of Number of Number of debtors R000 debtors R000 debtors R000 debtors R000 debtors R000
2009 Trade debtors 95 107 316 9 219 598 381 457 1 675 785 82 3 368 9 853 2 384 850
2008 Trade debtors 51 141 732 5 271 658 867 517 1 414 910 – – 5 839 2 215 509
CREDIT RISK MANAGEMENT Trade debtors The group aims to minimise loss caused by default of its customers through specifi c group-wide policies and procedures.
Compliance with these policies and procedures are the responsibility of the divisional and other fi nancial managers. Monitoring of compliance with these policies is done by internal audit. All known risks are required to be fully disclosed and accounted for and are provided against as doubtful debts. Certain divisions have obtained Credit Guarantee Insurance Cover to manage the risk of default by debtors.
Granting credit The group assesses the creditworthiness of potential and existing customers by obtaining trade references, credit references
and evaluating the business acumen of the client. Once this review has been performed, the applied credit limit is reviewed and approved.
Loans and advances The credit committee is responsible for ensuring that credit approval processes are stringent and for monitoring large exposures,
associated exposures, sectoral exposure and any irregular or problem loans.
Monitoring exposure The group monitors exposures on an ongoing basis utilising the various reporting tools and fl agging potential risks. The following
reports are used to monitor credit risk: overdue report, age analysis and late payment history.

page 171G
rindrod Limited / A
nnual Report 2009
businessoverview commentaries sustainability
annual fi nancialstatements
shareholderinformation
Group 2009 2008 R000 R000
39 FINANCIAL INSTRUMENTS RISK MANAGEMENT OBJECTIVES AND POLICIES (continued) 39.5 Credit risk (continued) Monitoring exposure (continued) Carrying amount of fi nancial assets past due or impaired and whose terms have
been renegotiated 283 3 217 Carrying amount of fi nancial assets impaired during the year 11 423 29 562
Maximum credit risk exposure to the group is: Other investments 83 515 50 151 Loans and advances 1 483 314 1 049 761 Trade and other receivables before allowance for doubtful debts 3 029 889 3 567 442 Liquid assets and short-term negotiable securities 104 092 138 553 Cash and cash equivalents 1 917 695 2 403 087
6 618 505 7 208 994
Analysis of the ageing of fi nancial assets which are past due but have not been impaired: Current 1 724 189 864 30 days 60 590 179 752 60 days 30 746 77 706 90 days 11 363 26 266 120+ days 27 080 106 266
Total 131 503 579 854
Refer to note 11 for analysis of ageing of loans and advances.
39.6 Counterparty risk The risk that a counterparty to a transaction fails to perform in terms of the contract resulting in a potential cost to replace the cash
fl ows or the risk that a counterparty fails to honour an undertaking for payment or delivery in terms of unsettled transactions.
The group is extremely cautious when selecting counterparties to transactions and formal limits are established for counterparties to assess or hedge transactions.
39.7 Liquidity risk The group manages liquidity risk by monitoring forecast cash fl ows and ensuring that adequate borrowing facilities are maintained.
The directors may from time to time at their discretion raise or borrow monies for the purpose of the group as they deem fi t. There are no borrowing limits in the articles of association of the company or its subsidiaries.
Daily cash management systems are in place with three local banks in order to optimise the group’s short-term net cash position. The divisions maintain rolling liquidity forecasts including operational and divisional capital expenditure and operating expenditure budgets. These forecasts are regularly updated so as to identify future funding requirements and assess the adequacy of existing and committed funding facilities. Different scenarios are built into the rolling forecasts in order to stress test the divisional and group liquidity positions. The rolling liquidity forecasts are consolidated and reviewed at a board level on a quarterly basis. Each quarter a fi ve-year balance sheet liquidity gap analysis is performed on the forecast statement of fi nancial position and reported to the board. This exercise highlights any potential liquidity gaps that may arise over the next fi ve-year period.
To ensure access to additional funding and hedging facilities, Grindrod maintains relationships with a number of existing and potential funding banks and procures additional facilities where required. Negotiations of facilities are considered carefully to limit the potential restrictions imposed as a result of fi nancial covenants and margining requirements. Contingency funding capacity in the form of committed but undrawn on-demand facilities is maintained.
In the banking environment liquidity risk may be defi ned as the risk of a bank not being able to repay its maturing deposits or meet its obligations under a loan agreement. Liquidity risk in a bank includes the risk of incurring excessively high interest costs or being forced to sell assets at a loss in order to meet its obligations.
Grindrod Bank has a prudent liquidity management policy and the asset and liability committee is responsible for monitoring the stability of funding, surplus cash or near cash assets, anticipated cash outfl ows, exposure to large depositors and exposure to connected parties. The Bank is exposed to a maturity mismatch due to the duration of the lending book when compared against the duration of the funding book. To date the Bank has been well served by its prudent liquidity management policy, the stability of its deposit base and the high quality of the advances book. The Bank intends to continue to adopt a conservative liquidity policy in the future.

172
page
G
rindr
od L
imite
d /
Ann
ual R
epor
t 200
9
Notes to the Notes to the financial statementsfinancial statements for the year ended 31 December 2009for the year ended 31 December 2009
39 FINANCIAL INSTRUMENTS RISK MANAGEMENT OBJECTIVES AND POLICIES (continued) 39.7 Liquidity risk (continued) Group liquidity analysis The contractual maturities of the group’s (including the Bank’s) fi nancial liabilities are as follows:
>3 months >6 months >1 year Non- 2009 <3 months <6 months <1 year <5 years >5 years contractual Total
Liabilities Provisions 13 732 15 826 54 111 31 089 – – 114 758 Income received in
advance – – – – – 117 921 117 921 Trade and other payables 2 200 704 34 300 46 108 446 – – 2 281 558 Financial liabilities 59 170 2 810 61 781 17 328 9 437 – 150 526 Deposits 1 436 709 93 420 196 256 29 741 – – 1 756 126
3 710 315 146 356 358 256 78 604 9 437 117 921 4 420 889
2008 Liabilities Provisions 17 010 – 84 038 98 508 – – 199 556 Income received in
advance – – 37 800 – 151 200 – 189 000 Trade and other payables 2 474 647 58 342 183 320 1 818 – 22 442 2 740 569 Financial liabilities 203 343 3 390 5 585 86 300 2 245 – 300 863 Deposits 1 254 996 14 365 247 931 29 441 – – 1 546 733
3 949 996 76 097 558 674 216 067 153 445 22 442 4 976 721
Bank liquidity analysis
>3 months >6 months >1 year Non- 2009 <3 months <6 months <1 year <5 years >5 years contractual Total
Liabilities Financial liabilities – – 55 196 – – – 55 196 Deposits 1 436 708 104 416 185 261 29 741 – – 1 756 126
1 436 708 104 416 240 457 29 741 – – 1 811 322
2008 Liabilities Financial liabilities – – – 6 155 – 3 955 10 110 Deposits 1 254 996 14 365 247 931 29 441 – – 1 546 733
1 254 996 14 365 247 931 35 596 – 3 955 1 556 843
The holding company has guaranteed a facility of R240 million to the Bank as additional liquidity.
39.8 Solvency risk Capital adequacy refers to the risk that a bank will not have adequate capital and reserve funds to absorb losses, resulting in
depositors having to absorb these losses and losing confi dence in the Bank and/or the banking sector.
The capital adequacy risk asset ratio of the Bank at 31 December 2009 was 14,20% (2008: 16,50%). The Bank will raise additional capital as and when capital is required to support asset growth and to ensure that a prudent risk asset ratio is maintained.

page 173G
rindrod Limited / A
nnual Report 2009
businessoverview commentaries sustainability
annual fi nancialstatements
shareholderinformation
39 FINANCIAL INSTRUMENTS RISK MANAGEMENT OBJECTIVES AND POLICIES (continued) 39.9 Capital risk management The group manages its capital to ensure that entities in the group will be able to continue as a going concern while maximising
the return to stakeholders through the optimisation of the debt to equity balance. The group’s overall strategy remains unchanged from 2008.
The capital structure of the group consists of debt, which includes the borrowings disclosed in note 17, cash and cash equivalents and equity attributable to equity holders of Grindrod, comprising ordinary and preference share capital, reserves and accumulated profi t as disclosed in the statement of changes in equity.
Gearing ratio The group reviews the capital structure on a quarterly basis. As part of the review the group considers the cost of capital and the
risks associated with each class of capital. The group has a target gearing ratio of 75% determined as the proportion of net debt to equity.
The group defi nes net debt as being comprised of borrowings, less cash and cash equivalents and assets classifi ed as held for sale. The gearing ratio at year-end was:
Group 2009 2008 R000 R000
Debt 2 246 462 1 963 564 Deposits from bank customers 1 756 126 1 507 046 Cash and cash equivalents (excluding the Bank) (1 917 695) (2 403 087) Other cash equivalents included in fi nancial assets – (103 100) Recoverables on cancelled ships (238 589) – Loans and advances to bank customers (1 483 314) (1 049 761) Liquid assets and short-term negotiable securities (104 092) (138 553) Net non-current assets classifi ed as held for sale – (100 955)
Net debt/(cash) 258 898 (324 846)
Equity (including minority interest) 5 836 126 6 775 011
Net debt to equity ratio (%) 4 (5)

174
page
G
rindr
od L
imite
d /
Ann
ual R
epor
t 200
9
Loan fundsLoan funds for the year ended 31 December 2009for the year ended 31 December 2009
Current rate 2009 2008 Date of of interest % Carrying value Carrying value redemption per annum R000 US$000 R000 US$000
SECURED Foreign currency fi nancing Financial liabilities measured at amortised cost Loans secured by mortgage bonds over ships Repayable in quarterly instalments 12/2018 1,91 47 103 6 391 65 090 6 888 Repayable in quarterly instalments 12/2018 1,91 47 103 6 391 65 090 6 888 Repayable in quarterly instalments 06/2014 1,23 23 370 3 171 40 833 4 321 Repayable in quarterly instalments 12/2014 1,23 27 601 3 745 46 258 4 895 Repayable in quarterly instalments 08/2016 1,31 76 482 10 377 Repayable in quarterly instalments 06/2013 2,28 19 133 2 596 Loans secured by mortgage bonds over plant and equipment Repayable monthly 12/2009 245 26 Loans secured by guarantee Repayable in quarterly instalments 02/2013 30 995 3 280 Repayable monthly 06/2013 2,28 14 763 2 003 28 460 3 012 Repayable monthly 08/2015 2,28 42 433 5 758 48 192 5 100 Repayable monthly 02/2018 4,78 35 118 4 765 7 095 751 Repayable monthly 04/2015 2,28 4 982 676 7 607 805 Repayable monthly 02/2013 2,28 8 387 1 138 14 133 1 496
Local fi nancing Financial liabilities measured at amortised cost Loans secured by mortgage bond over property and terminals Repayable in quarterly instalments 11/2014 8,75 71 396 85 815 Repayable in quarterly instalments 12/2017 8,75 215 530 232 045 Capitalised fi nance leases secured by vehicles and equipment Repayable monthly 01/2009 – 14 795 Repayable monthly 08/2013 10,25 9 285 – Repayable monthly 03/2010 8,40 331 1 577 Repayable monthly 11/2013 8,00 78 763 93 590 Repayable monthly 10/2013 8,50 23 775 28 627 Repayable monthly various 8,46 82 591 106 652 Repayable monthly 06/2029 10,50 8 805 – Repayable monthly 11/2013 9,80 4 669 – Repayable monthly 08/2014 9,60 5 587 – Repayable monthly 09/2014 9,25 8 964 – Repayable monthly 05/2010 10,50 1 328 – Loans secured by guarantee 38 196 2 165 Other capitalised fi nance leases and loans secured by plant and equipment 87 074 105 373
AGGREGATE SECURED LOANS 982 769 1 024 637 Other unsecured foreign currency loans 01/2019 – 117 920 16 000 Amount repayable within one year (179 902) (227 679)
NET LONG-TERM BORROWINGS 920 787 796 958
SECURITY Net book values of assets encumbered to secure long-term loans are as follows: 1 011 827 1 205 113
Ships 585 877 834 352 Land and buildings 110 271 113 139 Equipment, plant and vehicles 315 679 257 622

page 175G
rindrod Limited / A
nnual Report 2009
businessoverview commentaries sustainability
annual fi nancialstatements
shareholderinformation
Interests in subsidiariesInterests in subsidiaries for the year ended 31 December 2009for the year ended 31 December 2009
At 31 December 2009, the company had the following subsidiaries carrying on business which principally affected the profi ts and assets of the group.
They have the same year-end date as the company and have been included in the consolidated fi nancial statements.
Share Effective Investments Share-based payments Loans to capital holding Shares at original cost to employees subsidiary Nature of 2009 2008 2009 2008 2009 2008 2009 2008 2009 2008 business* R000 R000 % % R000 R000 R000 R000 R000 R000
INCORPORATED IN SOUTH AFRICA Grindrod Freight Investments (Pty) Limited F 1 158 1 158 100 100 175 900 175 900 345 345 – 181 360 Grindrod Management Services (Pty) Limited G 100 100 2 495 1 514 Grindrod Travel (Pty) Limited F – 43 – 100 – 600 Grindrod Property Leasing (Pty) Limited F – 100 Grincor Shipping Holdings Limited G 23 23 100 100 144 451 144 451 Unicorn Shipping (Pty) Limited D 100 100 21 21 Grindrod Shipping South Africa (Pty) Limited S 5 5 100 100 5 000 5 000 551 297 – 476 643 Voigt Shipping (Pty) Limited D 10 000 10 000 100 100 Seasure Insurance Brokers (Pty) Limited D 100 100 100 100 – 455 Unilog (Pty) Limited F 10 10 100 100 7 521 7 521 Unicorn Shipping Holdings Limited S 1 500 1 500 100 100 72 72 Unicorn Shipping Operations (Pty) Limited S 100 100 Southern Tankers (Pty) Limited S 1 1 100 100 Grindrod Financial Holdings Limited B 81 81 221 097 183 793 – 25 874 Grindrod Trading Holdings (Pty) Limited T 100 100 551 547 544 405 Grindrod Freight Services (Pty) Limited F 1 1 100 100 1 893 244 1 414 123 10 487 10 015 813 619 506 818
INCORPORATED IN BRITISH VIRGIN ISLANDS Swallow Enterprises Incorporated G 415 415 100 100 415 415 4 844 5 043
INCORPORATED IN ISLE OF MAN Grindrod Shipping Limited S 100 100 1 025 331 1 025 331 910 661 – 93 670
INTEREST IN SUBSIDIARIES (Note 5) 4 024 506 3 501 539 14 788 12 832 818 556 1 289 956
* Nature of businessB – Bank D – Dormant F – Freight and property services G – Group services S – Shipping T – Trading

pa
ge 1
76G
rindr
od L
imite
d /
Ann
ual R
epor
t 200
917
6 pa
ge
Grin
drod
Lim
ited
/ A
nnua
l Rep
ort 2
009

page 177G
rindrod Limited / A
nnual Report 2009
businessoverview sustainabilitycommentaries
annual fi nancialstatements

178
page
G
rindr
od L
imite
d /
Ann
ual R
epor
t 200
9
Share analysis of Share analysis of ordinary shareholdersordinary shareholders at 31 December 2009at 31 December 2009
Number of Percentage of Number of Percentage ofshareholders shareholders shares shares
SHAREHOLDER SPREAD 1 – 5 000 shares 10 611 74,2 18 773 358 4,0 5 001 – 10 000 shares 1 665 11,6 12 902 586 2,810 001 – 50 000 shares 1 498 10,5 32 892 972 7,150 001 – 100 000 shares 190 1,3 14 166 510 3,1 Over 100 001 shares 336 2,4 384 646 554 83,0
14 300 100,0 463 381 980 100,0Non-public shareholders– directors 8 0,1 10 547 650 2,3– treasury stock 1 – 9 179 348 2,0Public shareholders 14 291 99,9 443 654 982 95,7
14 300 100,0 463 381 980 100,0
INVESTOR PROFILEIndividuals 10 887 76,1 88 075 149 19,0Nominees and trusts 2 166 15,2 31 917 774 7,0Private companies 364 2,6 90 560 688 19,5Close corporations 227 1,6 2 919 986 0,6Mutual funds 137 1,0 48 395 507 10,4Retirement funds 127 0,9 65 844 466 14,2Other corporations 102 0,7 535 194 0,1Endowment funds 99 0,7 2 381 324 0,5Banks 76 0,5 65 660 074 14,2Insurance companies 41 0,3 27 312 700 5,9Investment companies 49 0,3 29 908 429 6,5Public companies 20 0,1 557 781 0,1Medical aid schemes 4 – 113 560 –Treasury 1 – 9 179 348 2,0
14 300 100,0 463 361 980 100,0
MAJOR SHAREHOLDERSGrindrod Investments (Pty) Limited (Grindrod family) 62 933 450 13,6Public Investment Corporation 42 099 134 9,1
105 032 584 22,7
TOP 10 FUND MANAGERSPublic Investment Corporation 31 364 826 6,8Alliance Bernstein 22 964 743 5,0Stanlib Asset Management 22 437 437 4,8Foord Asset Management 17 215 150 3,7Metropolitan Asset Management 11 956 558 2,6Standard Financial Markets 11 384 421 2,5Emerging Markets Management 11 045 568 2,4Dimensional Fund Advisors 8 736 325 1,9Old Mutual Investment Group 7 475 015 1,6Metal and Engineering Industries 7 240 923 1,6
151 820 966 32,9
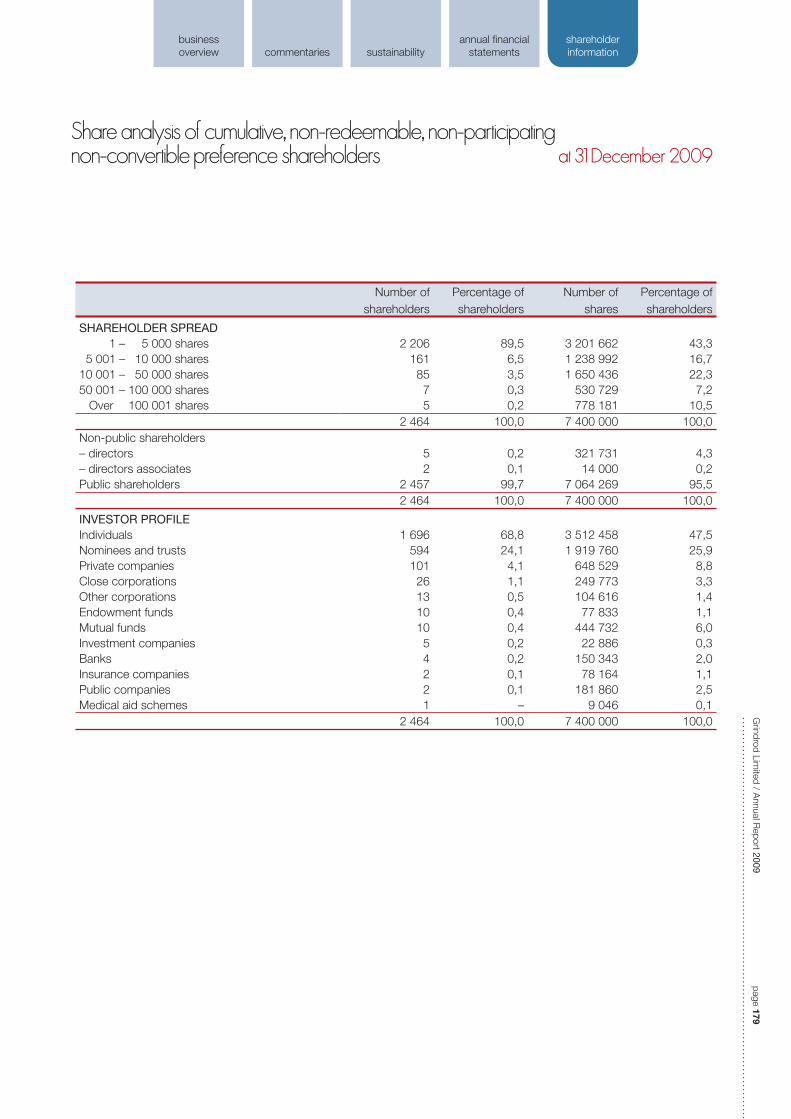
page 179G
rindrod Limited / A
nnual Report 2009
businessoverview commentaries sustainability
annual fi nancialstatements
shareholderinformation
Share analysis of cumulative, non-redeemable, non-participatingShare analysis of cumulative, non-redeemable, non-participatingnon-convertible preference shareholdersnon-convertible preference shareholders at 31 December 2009at 31 December 2009
Number of Percentage of Number of Percentage ofshareholders shareholders shares shareholders
SHAREHOLDER SPREAD 1 – 5 000 shares 2 206 89,5 3 201 662 43,3 5 001 – 10 000 shares 161 6,5 1 238 992 16,710 001 – 50 000 shares 85 3,5 1 650 436 22,350 001 – 100 000 shares 7 0,3 530 729 7,2 Over 100 001 shares 5 0,2 778 181 10,5
2 464 100,0 7 400 000 100,0Non-public shareholders– directors 5 0,2 321 731 4,3– directors associates 2 0,1 14 000 0,2Public shareholders 2 457 99,7 7 064 269 95,5
2 464 100,0 7 400 000 100,0
INVESTOR PROFILEIndividuals 1 696 68,8 3 512 458 47,5Nominees and trusts 594 24,1 1 919 760 25,9Private companies 101 4,1 648 529 8,8Close corporations 26 1,1 249 773 3,3Other corporations 13 0,5 104 616 1,4Endowment funds 10 0,4 77 833 1,1Mutual funds 10 0,4 444 732 6,0 Investment companies 5 0,2 22 886 0,3Banks 4 0,2 150 343 2,0Insurance companies 2 0,1 78 164 1,1 Public companies 2 0,1 181 860 2,5Medical aid schemes 1 – 9 046 0,1
2 464 100,0 7 400 000 100,0

180
page
G
rindr
od L
imite
d /
Ann
ual R
epor
t 200
9
Share performanceShare performance at 31 December 2009at 31 December 2009
2009 2008 2007 2006 2005 2004*
Ordinary Preference Ordinary Preference Ordinary Preference Ordinary Preference Ordinary Preference Ordinary
Market price per share (cents)
– opening 1 530 8 600 2 300 10 900 1 560 10 959 1 300 11 650 790 10 000 238
– year-end 1 778 9 700 1 530 8 600 2 342 10 300 2 578 10 300 1 300 11 650 790
– highest 1 870 9 900 2 886 10 900 2 740 11 000 1 570 11 599 1 315 11 650 800
– lowest 1 115 8 600 943 8 600 2 143 9 502 1 000 10 500 770 10 000 240
Number of shares (000) 454 203 7 400 450 253 7 400 455 509 7 500 449 179 7 500 461 626 5 000 454 610
– in issue 463 382 7 400 478 476 7 500 474 956 7 500 473 386 7 500 461 626 5 000 454 610
– treasury (9 179) – (28 224) (100) (19 447) – (19 447) – – – –
Number of transactions recorded 95 473 1 505 98 692 1 381 55 642 1 599 40 099 2 165 28 654 788 10 973
Number of shares traded (000) 361 749 1 132 358 554 1 616 329 078 1 898 267 150 2 818 238 429 2 185 206 155
Volume of shares traded as % of total issued shares 78,1 15,3 74,9 21,5 69,3 25,3 56,4 37,6 51,6 43,7 45,3
Value of shares traded (R000) 5 551 232 104 702 7 144 093 156 833 7 289 001 193 031 3 527 355 314 132 988 417 230 706 995 310
Market capitalisation (R000) 8 238 932 717 800 7 320 700 645 000 11 123 500 772 500 7 310 500 873 700 6 001 100 582 500 3 591 400
PE ratio % 9,2 3,2 8,9 11,7 7 1,3
Dividend yield % 3,4 8,9 3,3 2,6 4 4,4
Earnings yield % 10,9 31,1 11,3 8,6 14,3 77,3
* Preference shares fi rst issued in 2005.
VALUE OF ORDINARY SHARES TRADED (Rm)
MARKET CAPITALISATION OF ORDINARY SHARES (Rm)
VOLUME OF ORDINARY SHARES TRADED (million)
VOLUMES TRADED/TOTAL ISSUED ORDINARY SHARES (%)
206
45
238
52
3 527
10,5
05
05
05
05
04
04
04
04
06
06
06
06
07
07
07
07
08
08
08
08
09
09
09
09
3 53 52727
110,110 5
3 591
7 311 7 3218 239
11 124
56
6975 78

page 181G
rindrod Limited / A
nnual Report 2009
businessoverview commentaries sustainability
annual fi nancialstatements
shareholderinformation
Notice of meetingNotice of meetingNOTICE IS HEREBY GIVEN THAT THE FORTY-THIRD ANNUAL GENERAL MEETING OF MEMBERS OF GRINDROD LIMITED WILL BE HELD IN THE BOARDROOM, 1ST FLOOR, QUADRANT HOUSE, 115 MARGARET MNCADI AVENUE, DURBAN ON WEDNESDAY, 19 MAY 2010 AT 14:00 FOR THE FOLLOWING PURPOSES:
1. To receive and adopt the audited fi nancial statements for the year ended 31 December 2009 including the reports of the directors and the auditors.
2. To re-elect retiring directors in accordance with the articles of association. Motions for re-election will be moved individually.
In accordance with article 59 of the articles of association Messrs I M Groves, J G Jones, R A Norton, A F Stewart and L R Stuart-Hill retire by rotation and being eligible, offer themselves for re-election with exception of R A Norton who has not made himself available for re-election and will retire on 19 May 2010. The credentials of these directors are provided on pages 7 to 9 of the annual report.
The nomination committee of the company has conducted an assessment of the performance of each of the retiring candidates and the board accepted the results of that assessment. Accordingly, the board recommends their re-election to shareholders.
3. To note the resignation of Ms N T Y Siwendu as a director effective 1 January 2010.
4. To confi rm the appointment of Messrs M R Faku, M J Hankinson and S D M Zungu who were appointed as directors by the board of directors on 15 December 2009. Their details are set out on pages 6 and 7 of the annual report.
5. To consider and confi rm the executive directors' remuneration for the year ended 31 December 2009 as set out on page 69 of the annual report.
6. To consider and approve the fees to the non-executive directors for the year 1 July 2010 to 30 June 2011, as set out below:
Present
R
Proposed
R
BoardChairman 320 000 400 000Director 135 000 170 000Audit committeeChairman 50 000 70 000Member 36 000 50 000Remuneration/nomination committeeChairman 45 000 50 000Member 34 875 40 000
7. To reappoint Deloitte and Touche as external auditors for the ensuing year and Mr A G Waller as the responsible partner.
8. To authorise the directors to determine the remuneration of the auditors for the past year’s audit.
As special business, to consider and if deemed fi t, pass with or without modifi cation the following special and ordinary resolutions:
9. Special resolution “Resolved that the directors of the company be and are hereby authorised, by way of a general approval, to repurchase on behalf
of the company, ordinary shares of 0,002 cent each (“ordinary shares”) issued by the company, in terms of sections 85 to 90 of the South African Companies Act, 1973 (Act 61 of 1973), as amended, and in terms of the Listings Requirements of JSE Limited (“JSE”) being that:
• any such repurchase of ordinary shares shall be implemented on the open market of the JSE;
• this general authority shall only be valid until the company’s next annual general meeting, provided that it shall not extend beyond 15 months from the date of passing of this special resolution;
• an announcement will be published for every 3% of the ordinary shares in issue, in aggregate, repurchased by the company, containing full details of such acquisitions in accordance with section 5.79 of the Listings Requirements;
• in terms of this general approval, the acquisition of ordinary shares in any one fi nancial year may not exceed, in aggregate, 20% of the company’s issued share capital of that class, at the time that approval is granted and the acquisition of shares by a subsidiary of the company may not exceed 10% in the aggregate, in any one fi nancial year, of the number of issued shares of the company of that class;
• in determining the price at which ordinary shares issued by the company are repurchased by it in terms of this general approval, the maximum premium at which such ordinary shares may be repurchased is 10% of the weighted average of the market value at which such ordinary shares are traded, respectively, on the JSE as determined over the fi ve trading days immediately preceding the day on which the transaction was agreed;
• the company may only undertake a repurchase of shares if, after such repurchase, it still complies with paragraphs 3.37 to 3.41 of the Listings Requirements concerning shareholder spread requirements; and
• unless prior notice is given in terms of the JSE Listings Requirements the company or its subsidiary may not repurchase shares during a prohibited period as defi ned in paragraph 3.67 of the Listings Requirements.”

182
page
G
rindr
od L
imite
d /
Ann
ual R
epor
t 200
9
Notice of meeting Notice of meeting (continued)(continued)
Reason and effect of special resolution The reason for and the effect of the special resolution is that the general approval for the company to acquire its own ordinary shares
which was renewed by special resolution at the annual general meeting of 20 May 2009 will lapse at this annual general meeting and the special resolution will renew that authority. The authority contemplated will remain in effect until the next succeeding annual general meeting, but in any event will not extend beyond 15 months from the date of the special resolution.
The directors, after considering the maximum number of shares which may be repurchased and the price at which such repurchases may take place pursuant to the general repurchase approval, are of the opinion that:
• the company and the group will be able to pay its debts in the ordinary course of business for a period of 12 months after the date of the notice of the annual general meeting;
• the consolidated assets of the company and the group, fairly valued in accordance with International Financial Reporting Standards (IFRS), will be in excess of the consolidated liabilities of the company and the group after the repurchase for a period of 12 months after the date of the notice of the annual general meeting;
• the share capital and reserves of the company and the group will be adequate for ordinary business purposes for a period of 12 months after the date of notice of the annual general meeting; and
• the working capital available to the company and the group will be adequate for the purposes of the business of the company and the group for the period of 12 months after the date of notice of the annual general meeting.
10. Ordinary resolution “Resolved that the unissued ordinary shares in the capital of the company reserved for the purpose of the company’s share option
scheme, representing 5 500 000 ordinary shares in total, continue to be placed under the control of the directors, who shall be authorised to issue these shares at such times and on such terms as they may determine."
Shareholders are to note that this scheme has been closed and is replaced with a cash-based share price linked option scheme, the details of which are set out on page 68 of the annual report.
11. To transact such other business as may be transacted at an annual general meeting.
Information related to JSE Listings Requirement 11.26 can be found in the annual report on the page references below:
Page number
Directors and management 6Directors’ interests in securities 72Responsibility statement 108Material change 111Share capital of the company 147Litigation statement 160Major shareholders 178
Preference shareholdersPreference shareholders are entitled to receive copies of correspondence related to all shareholder meetings. It is to be noted that in respect of the annual general meeting to be held on Wednesday, 19 May 2010, preference shareholders are entitled to attend the meeting and to vote together with ordinary shareholders in respect of the special resolution relating to a general authority to repurchase ordinary shares.
ProxiesA member registered as such (either as the holder of shares in certifi cated form and whose name is refl ected in the register of company members, or as the holder of shares in dematerialised form and whose name is refl ected in a sub-register maintained by a CSDP) is entitled to appoint one or more proxies to attend, speak and, on a poll, vote in his/her stead should he/she be unable to attend the annual general meeting, but wishes to be represented thereat. A proxy need not be a member of the company. Proxy forms should be forwarded to reach the offi ce of the Transfer Secretaries, Computershare Investor Services (Pty) Limited, Ground Floor, 70 Marshall Street, Johannesburg, 2001 (PO Box 61051, Marshalltown, 2107) at least 48 hours before the commencement of the meeting. Shareholders who have dematerialised their shares in Grindrod such that their holdings are no longer recorded in their own names should arrange with their CSDP or broker for the necessary authority to attend the annual general meeting. Should they be unable, or do not wish to attend but wish to be represented at the meeting, they should provide their CSDP or broker with their voting instructions in terms of the agreements entered into between the shareholder and CSDP or broker concerned.
By order of the board
C A S RobertsonGroup secretary
Durban
12 April 2010

Form of proxyForm of proxyGRINDROD LIMITED(Incorporated in the Republic of South Africa) (Registration number 1966/009846/06)Share code: GND and GNDP ISIN: ZAE000072328 and ZAE 000071106(“the company”)
(To be used by certifi cated shareholders and dematerialised shareholders with own name registration)
For use at the annual general meeting of shareholders of the company to be held in the Boardroom, 1st Floor, Quadrant House, 115 Margaret Mncadi Avenue, Durban on Wednesday, 19 May 2010 at 14:00.
I/We (FULL NAMES IN BLOCK LETTERS)
of (ADDRESS)
being the registered holder/s of ordinary shares preference shares in the capital of the company hereby appoint:
1. of or failing him/her,
2. of or failing him/her,
3. the chairman of the annual general meeting, 4. as my/our proxy to vote for me/us and on my/our behalf at the annual general meeting of the company to be held in the Boardroom,
1st Floor, Quadrant House, 115 Margaret Mncadi Avenue, Durban at 14:00 on Wednesday, 19 May 2010 and at any adjournment thereof as follows:
RESOLUTION IN FAVOUR OF AGAINST ABSTAIN
1. Approval of annual fi nancial statements
2. Re-election of directors retiring by rotation
2.1 I M Groves
2.2 J G Jones
2.3 A F Stewart
2.4 L R Stuart-Hill
3. Note resignation of N T Y Siwendu
4. Confi rmation of the appointments of M R Faku, M J Hankinson and S D M Zungu
5. Consider and confi rm the executive directors’ remuneration for the year ended 31 December 2009
6. Approve the fees to non-executive directors to 30 June 2011
7. Confi rmation of appointment of auditors and responsible partner
8. Remuneration of the auditors
9. Renewal of authority to repurchase ordinary shares
10. Directors’ authority to issue shares reserved for the share option scheme
(Indicate instruction by an “X” in the space provided)
Unless otherwise instructed, my proxy may vote as he/she thinks fi t.
A member entitled to attend and vote at the abovementioned meeting is entitled to appoint a proxy to attend, speak and vote in his stead. The proxy need not be a member of the company.
Signed this day of 2010
Signature/s
REGISTERED OFFICE TRANSFER SECRETARIESQuadrant House Computershare Investor Services (Pty) Limited115 Margaret Mncadi Avenue Ground Floor, 70 Marshall StreetDurban, 4001 Johannesburg, 2001(PO Box 1, Durban, 4000) (PO Box 61051, Marshalltown, 2107)

NotesNotes
1. Only shareholders who are recorded in the register of members of the company who have not dematerialised their shares or who hold dematerialised shares in their own name must complete the form of proxy or alternatively attend the meeting.
Benefi cial shareholders whose shares are not registered in their own name but in the name of another, e.g. a nominee, must not complete the form of proxy or attend the meeting unless a proxy is issued to them by the registered shareholder. Benefi cial shareholders who are not also registered shareholders should contact the registered shareholder to issue instructions on voting or to obtain a proxy to attend the meeting.
2. A shareholder may insert the name of a proxy or the names of two alternative proxies of the shareholder’s choice in the space/s provided, with or without deleting “the chairman of the annual general meeting”. The person whose name appears fi rst on the form of proxy and who is present at the annual general meeting will be entitled to act as proxy to the exclusion of those whose names follow.
3. Any deletion, alteration or correction to this form of proxy must be initialled by the signatory/ies.
4. Documentary evidence establishing the authority of a person signing this form of proxy in a representative capacity must be attached to this form of proxy unless previously recorded by the company.
5. Forms of proxy must be lodged at, or posted to, the registered offi ce of the Transfer Secretaries, Computershare Investor Services (Pty) Limited, Ground Floor, 70 Marshall Street, Johannesburg, 2001 (PO Box 61051, Marshalltown, 2107) to be received by not later than 14:30 on Monday, 17 May 2010.
6. The completion and lodging of this form of proxy will not preclude the shareholder from attending the annual general meeting and speaking and voting in person thereat to the exclusion of any proxy appointed in terms hereof should such shareholder wish to do so.
7. The chairman of the annual general meeting may reject or accept any form of proxy which is completed and/or received other than in accordance with these notes.
8. A form of proxy shall be deemed to include the rights to demand or join in demanding a poll.
9. Shareholders, who have either dematerialised their company shareholdings (such that these holdings are no longer recorded in their own names in the sub-registers maintained by Central Securities Depository Participants (CSDPs), are not company members as defi ned. Such shareholders who wish to attend the company’s annual general meeting should arrange with their CSDPs or brokers for the necessary authority to attend the annual general meeting. Such shareholders who are unable, or do not wish, to attend the annual general meeting, but wish to be represented thereat, should provide their CSDPs or brokers with their voting instructions in suffi cient time to enable the CSDPs or brokers to lodge forms of proxy or appoint a representative for the meeting.
businessoverview commentaries sustainability
annual fi nancialstatements
shareholderinformation
Corporate informationCorporate information
GRINDROD LIMITEDRegistration number 1966/009846/06
Company secretary
C A S Robertson FCIS
Registered offi ce and business address
Quadrant House115 Margaret Mncadi AvenueDurban4001
Postal address
PO Box 1Durban4000
Telephone +27 31 304 1451Facsimile +27 31 305 2848E-mail [email protected] www.grindrod.co.za
Investor relations
E-mail [email protected]
GROUP AUDITORSDeloitte and Touche
TRANSFER SECRETARIESComputershare Investor Services (Pty) Limited70 Marshall StreetJohannesburg2001
Postal address
PO Box 61051Marshalltown2107
Telephone +27 11 370 5000Facsimile +27 11 370 5271/2
MAIN BANKERS TO THE GROUPLocal
ABSA Bank LimitedFirst National Bank of Southern Africa LimitedInvestec Bank LimitedMercantile BankNedbank LimitedThe Standard Bank of South Africa Limited
Foreign
Crédit AgricoleFortis BankRoyal Bank of ScotlandSociété GénéraleStandard Chartered BankMillennium BIM MozambiqueMitsui & Co. Financial Services (Asia) Limited
ATTORNEYS TO GRINDROD LIMITEDGarlicke & Bousfi eld Incorporated
SPONSORSGrindrod Bank LimitedFirst Floor, Building 3, North Wing Commerce Square39 Rivonia Road Sandhurst Sandton2196
Postal address
PO Box 78011Sandton2146
Telephone +27 11 459 1860Facsimile +27 11 459 1872
page 183G
rindrod Limited / A
nnual Report 2009

Terms and expressionsTerms and expressionsBACK HAUL
Routes which are against the standard fl ow of traffi c, i.e. loading in a port situated in what is usually a discharge area and discharging in a port situated in what is usually a loading area.
BALLAST
The period of time during which a ship performs a voyage without cargo on board.
BALTIC DRY INDEX (BDI)
The BDI is published every London working day by the Baltic Exchange, who collate information for supramax, panamax and capesize vessels to create this lead freight market indicator.
BALTIC HANDYSIZE SPOT INDEX (BHSI)
The BHSI is published every London working day by the Baltic Exchange, who have collated information on fi xtures for a number of routes in relation to a standard 28 000 dwt vessel with 30 metre cranes and maximum 15 years of age. The index is also published on the basis of a time charter return and is used to determine the value of the trading routes and settlement prices for FFAs.
BALTIC SUPRAMAX INDEX (BSI)
The BSI is published every London working day by the Baltic Exchange, who have collated information on fi xtures for a number of routes in relation to a standard Tess 52 type vessel. This vessel is 52 454 dwt, with 4 x 30 metre cranes and grabs and maximum 10 years of age. This index is also published on the basis of a time charter return and is used to determine the value of trading routes and settlement prices for FFAs.
BAREBOAT OR BAREBOAT CHARTER
Charter for an agreed period of time during which the shipowner provides only the ship while the charterer provides the crew together with all stores and bunkers and pays all vessel operating costs.
BARGING
Transfer of cargo between a ship and the shore using a barge.
BEAM
The greatest width of a vessel.
BREAKBULK
Dry, loose cargo.
BULK CARRIER
Ship designed to carry dry, loose cargoes in bulk.
BUNKER(S)
Fuel, consisting of fuel oil and diesel, burned in the vessel's engines.
BUNKER TANKER
A small tanker used to refuel ships with bunkers.
CAPESIZE BULK CARRIER
Drybulk carrier with a capacity of about 130 000 to 200 000 dwt which, due to its size, must transit when loaded, the Atlantic to the Pacifi c via Cape Horn or the Cape of Good Hope and is typically used for long voyages in the coal and iron ore trades.
CHARTERER
A person, fi rm or company hiring a vessel for the carriage of goods or other purposes.
CHARTER-HIRE
The revenue earned by a vessel pursuant to a bareboat charter or a time charter (see “Freight” for voyage charter revenue).
CHARTERPARTY
Document containing all the terms and conditions of the contract between the owner of a vessel and a charterer for the use of a vessel, signed by both parties or their agents, for the hire of a ship or the space in a ship.
CHEMICAL TANKERS
A tanker, usually not larger than 40 000 dwt, designed to carry numerous bulk liquid chemical products, often in stainless steel tanks, in isolated compartments (also termed “parcels”).
COMMERCIAL MANAGEMENT
Management of those aspects of shipowning and operation that relate to obtaining economic value from the vessel, which includes ship fi nancing, sale and purchase, chartering or vessel employment, voyage execution, insurance and claims handling, accounting and corporate administration.
CONTAINERSHIP
Ship designed to carry containerised cargo.
CONTRACT OF AFFREIGHTMENT (COA)
Is similar to a voyage charter but covers two or more shipments over an agreed period of time (this could be over a number of months or years) and no particular vessel is specifi ed.18
4 pa
ge
Grin
drod
Lim
ited
/ A
nnua
l Rep
ort 2
009

page 185G
rindrod Limited / A
nnual Report 2009
businessoverview commentaries sustainability
annual fi nancialstatements
shareholderinformation
DOUBLE HULL
A ship which has an inner and an outer hull. The distance between these two can be up to two metres. Such construction increases the safety during a possible grounding or collision and in this way leakage may be avoided. The double hull is also used for ballast.
DEADWEIGHT TONNES (DWT)
Deadweight tonnes, the unit of measurement of weight capacity of vessels, which is the total weight (usually in metric tonnes) the ship can carry, including cargo, bunkers, water, stores, spares, crew, etc. at a specifi ed draft.
DEMURRAGE
An agreed amount payable to the shipowner by the charterer when the agreed time allowed for loading or unloading cargo has been exceeded through no fault of the owner.
DRAFT
Vertical distance between the waterline and the bottom of the vessel’s keel (i.e. the depth of the ship in the water).
DRY-DOCKING
The removal of a vessel from the water for inspection, maintenance and/or repair of parts that are normally submerged.
FLAG STATE
The country where the vessel is registered.
FREIGHT
The revenue earned by a vessel pursuant to a voyage charter or a contract of affreightment.
FREIGHT FORWARD AGREEMENT (FFA)
A derivative instrument that is a means of hedging exposure to freight market risk through the purchase or sale of specifi ed time charter rates for forward positions. Settlement is in cash, against a daily market index published by the Baltic Exchange.
FRONT HAUL
Routes which follow the typical fl ow of the transportation of cargoes from the main loading areas to the main discharging areas.
HANDYMAX
Drybulk carriers of about 40 000 to 60 000 dwt which is commonly equipped with cargo gear such as cranes. This type of vessel carries a wide variety of cargoes including major bulk and minor bulk cargoes.
HANDYSIZE
Drybulk carrier of about 10 000 to 40 000 dwt which is commonly equipped with cargo gear such as cranes. This type of vessel carries principally minor bulk cargoes and limited quantities of major bulk cargoes. It is well suited for transporting cargoes to ports that may have draft restrictions or are not equipped with gear for loading or discharging cargoes.
INTERNATIONAL MARITIME ORGANISATION (IMO)
The international United Nations advisory body on transport by sea.
ISM CODE
The international management code for the safe operation of ships and for pollution prevention adopted by the International Maritime Organisation.
JOINT SERVICES AGREEMENT
An organised group of shipowners and/or charterers where there is a pooling of resources for the purpose of the fl exible and commercial operation of ships. A pool manager is responsible for the commercial operation of the joint service.
LINER SHIPPING OPERATIONS
Operators who trade ships according to a schedule between specifi ed ports.
MAJOR BULK
Drybulk cargoes consisting of iron ore, coal and grain.
MARPOL
The international convention governing marine pollution prevention. It is part of IMO.
MINOR BULK
Drybulk cargoes such as forest products, iron and steel products, fertilisers, agricultural products, minerals and petcoke, bauxite and alumina, cement, other construction materials and salt.
NEWBUILDING
A vessel under construction or on order.
OFF-HIRE
Period during which a vessel is temporarily unable to operate under the terms of its charter, resulting in loss of income under the charter.
OPERATOR
A person/company who trades in ships and cargo.

Grin
drod
Lim
ited
/ A
nnua
l Rep
ort 2
009
186
page
Terms and expressions Terms and expressions (continued)(continued)
P&IProtection and indemnity insurance coverage taken by a shipowner or charterer against third party liabilities such as oil pollution, cargo damage, crew injury or loss of life, etc.
PANAMAX BULK CARRIERDrybulk carrier of about 60 000 to 80 000 dwt with beam not exceeding 32,2 metres, which permits it to transit, when fully loaded, through the Panama Canal. Panamax vessels are primarily used to transport major bulks, although they can be used to transport certain minor bulks such as fertilisers, ores, petcoke and salt.
PERIOD MARKETThe time charter market where a ship (or space on a ship) is chartered for a period of time (see "Time charter").
PETROCHEMICALSChemicals containing carbon, often referred to as petrochemicals when derived from hydrocarbon sources such as oil, gas and coal.
POST PANAMADrybulk carrier of about 80 000 to 130 000 dwt with beam exceeding 32,2 metres, which are mainly used to transport coal and grains.
PRODUCTS TANKERA tanker designed to carry refi ned petroleum products in bulk, in multiple tanks.
SPOT MARKETThe market for immediate chartering of a vessel, usually for a single cargo or short-term trading.
SPOT RATEFreight rate for a voyage agreed on the basis of current market level.
SUPRAMAXDry bulk carrier within the handymax sector of about 50 000 to 60 000 dwt, which is usually grab fi tted and carries a wide variety of cargoes including major bulk and minor bulk cargoes.
TAKE-OR-PAY AGREEMENTA contractual agreement in which one party agrees to utilise specifi c capacity of another party’s total available capacity or to pay the equivalent cost even if the contracted capacity is not utilised.
TECHNICAL MANAGEMENT
Management of those aspects of shipowning and operation that relate to the physical operation of a vessel, including the provision of crew, routine maintenance, repairs, dry-docking, supplies of stores and spares, compliance with all applicable international regulations, safety and quality management, environment protection, newbuilding plan approval and newbuilding supervision and related technical and fi nancial reporting.
TIME CHARTER
Charter for an agreed period of time where the shipowner is paid on a per day basis and is responsible for operating the vessel and paying the vessel operating costs while the charterer is responsible for paying the voyage costs and bears the risk of fi lling the vessel with cargo and any delays at port or during the voyage except where caused by a defect of the ship.
TIME CHARTER EQUIVALENT (TCE)
Freight and charter-hire less voyage costs incurred expressed as a daily rate over the duration of the voyage.
TONNAGE
A generic term referring to any kind of ocean-going cargo vessel or vessels.
TWENTY FOOT EQUIVALENT UNIT (TEU)
The standard length of a container and the measurement used to determine the container carrying capacity of a container ship.
VESSEL OPERATING COSTS
These consist of crew expenses, insurance, spare parts, stores and lubricating oils, vessel repairs and surveys, commissions and other miscellaneous running costs.
VOYAGE CHARTER
Charter under which a shipowner is paid freight on the basis of transporting cargo from a load port to a discharge port and is responsible for paying both vessel operating costs and voyage costs.
VOYAGE COSTS
Bunker costs, port charges and canal dues or tolls incurred during the course of a voyage.

TANKERS
Small products tankerCargoes shipped: petrol/diesel/bulk liquids
Chemical tankerCargoes shipped: industrial chemicals/bulk liquids
Mid-range products tankerCargoes shipped: petrol/diesel/vegetable oils
DRYBULK CARRIERS
Handysize bulk carrierCargoes shipped: mining/agricultural/general bulk products
Panamax bulk carrierCargoes shipped: grain/steel
Capesize bulk carrierCargoes shipped: iron ore/coal

www.grindrod.co.za