grindrod de-risking retirement payers and growers may 2015
TRANSCRIPT

DE-RISKING RETIREMENT STRATEGIES
Paul Stewart Head: Fund Management
May 2015

AGENDA
Update on Grindrod Asset Management – Paul Stewart
Marc Thomas – Post Retirement thinking
Ian Anderson – Portfolio attributes
Marc Thomas – Pre Retirement thinking

“More dangerous yet is the shift in focus away
from retirement income to return on investment
that has come with the introduction of saver-
managed DC plans: Investment decisions are now
focused on the value of the funds, the returns on
investment they deliver, and how volatile those
returns are. Yet the primary concern of the saver
remains what it always has been: Will I have
sufficient income in retirement to live comfortably?”
- Robert C. Merton, MIT Sloan School of Economics
Harvard Business Review, March 2014

We conceptualised the Grindrod Asset Management business offering
on 3 key ideas:
Differentiated products aimed at meeting particular investor needs
Delivering on our primary promise of income and income growth
Competitive long-term investment results against the benchmark
and peer group.
A REFLECTION ON WHERE WE CAME FROM

Most asset managers, globally and in South Africa, are peer group and capital
return focussed;
We saw the pre- and post-retirement markets as being poorly serviced by
asset managers
We decided on “outcomes-based investing” as a core principle addressing the
dual problems of income provision and inflation-hedged income growth
Yield and growth in yield is our major measureable and deliverable
We registered the trademark
We realigned our fund range along these principles in 2012.
1. DIFFERENTIATED PRODUCTS MEETING INVESTOR NEEDS

2. DELIVERING ON OUR PROMISE OF INCOME GROWTH
Source: Grindrod Asset Management
230,805
285,725
329,209
100,000
150,000
200,000
250,000
300,000
350,000
2012 2013 2014
ANNUAL INCOME PRODUCED FROM R5m INVESTMENT
164,000
219,000
290,500
100,000
150,000
200,000
250,000
300,000
350,000
2012 2013 2014
ANNUAL INCOME PRODUCED FROM R5m INVESTMENT
Grindrod Stable Growth Fund Grindrod Managed Growth Fund

3. P&G® ALSO DELIVER COMPETITIVE LONG-TERM RETURNS
3 years to 30 April 2015
Annualised
income
return
Annualised
capital
return
Annualised
total return
Annualised
benchmark
return
Peer
group
rank
Grindrod Stable
Growth A 5.31% 11.05% 16.36%
(TER 1.27%)
7.47% (CPI +2%)
1/80
Grindrod Managed
Growth A 4.64% 16.38% 21.02%
(TER 1.25%)
9.64% (CPI +4%)
1/90
Grindrod High
Income A 6.89% 1.24% 8.13%
(TER 1.17%)
6.67% (Stefi +1%)
8/50
Grindrod Equity
Income Growth A (*since inception – 2 Jul 2013)
3.72% 20.94%
24.66% (TER 1.23%)
*19.93% (SA Gen Eq. Ave.)
18/162
TER is measured over the last 12 months to 31 March 2015
Source: Grindrod Asset Management, Moneymate

Payers & Growers® brand has seen very pleasing growth:
AuM growth of 22.4% over 12 months to 30 April 2015
GCI Manco assets grow by 58.7% for the year to 30 April 2015
159 IFA‟s consistently supporting the business
- across the country in all provinces and markets
Both direct and LISP business channels growing
Institutional clients now number ten – up from five 12 months ago
Launched Grindrod Global Equity Income Growth Fund
and Grindrod Global Managed Growth Funds domiciled in Ireland
Launched our Tax-free Savings Plan on 1 April 2015.
BUSINESS MILESTONES ACHIEVED

Marc Thomas May 2015
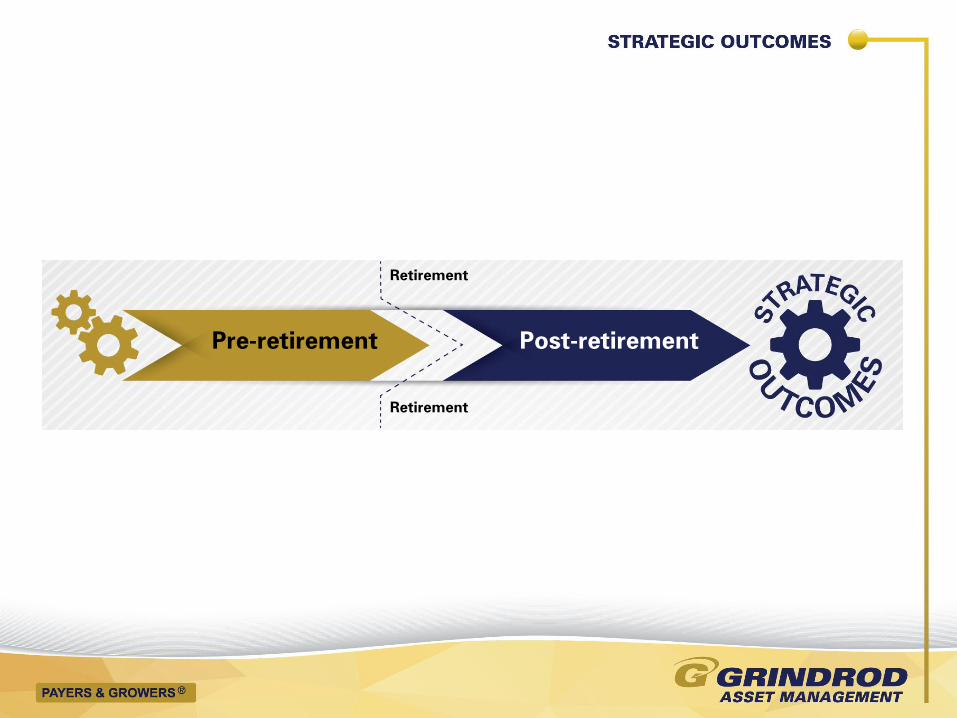
DE-RISKING RETIREMENT STRATEGIES

Pre-retirement Post-retirement
Retirement
Retirement


BlackRock: America‟s Retirement Needs 2013
“the challenge of decumulation has yet to be effectively addressed”
William Sharpe: Nobel Laureate Economics,CFA Conference May 2014
“I am focussing my attention on this issue (retirement income). And it‟s a really hard problem-the hardest problem I‟ve ever considered- because its multidimensional…”
Thaler: Behavioural Finance Professor. Your Wealth and Life UBS 2015
“.. One issue that‟s on everyone‟s mind is that we don‟t have satisfactory solutions for dealing with the decumulation phase of life. This is a problem because figuring out the best way to draw down a pile of money is a much harder problem than accumulation.”
DECUMULATION/DRAWDOWN CHALLENGE

SEQUENCE OF RETURNS: INCOME DRAWDOWN

New thinking:
but in a different direction

“Substituting Top 100 Dividend Paying stocks for S&P 500 Index stocks
had very beneficial effects on the “SAFEMAX” for retirees during the period.
The SAFEMAX was increased by about 25 percent (i.e. from 4% to 5%)
during this period, which translates into a significant improvement of lifestyle
for those retirees… and they also saw very substantial increases
in their portfolio longevity” Bengen
“We found that this focus on dividends had a significantly positive impact
on both the portfolio‟s withdrawal rate and its sustainability…
we found that using a strategy focused on companies with high and growing
dividends alleviates the stress of regular withdrawals.”
Thornburg Investment Management
INCOME DRAWDOWN:PORTFOLIO SUSTAINABILITY Impact of including yield and income growth in drawdown portfolios

HYPOTHETICAL INCOME, BALANCE, AND RETURN SHEET

R3m invested on 06/07/2012
Initial drawdown rate of 6%
Escalating at 6% per annum
July is anniversary month
Unit balance is dropping moderately
Reinvestment of distributions lower than income drawdowns
Income growth will stabilise the decline and then increase the units
(2,000)
(1,000)
-
1,000
2,000
3,000
Drawdown Reinvestment
174,500
175,000
175,500
176,000
176,500
177,000
177,500
178,000
178,500
179,000
Unit balance
Only 1.6% decline
in units
GRINDROD STABLE GROWTH FUND (JAN 2014)

GRINDROD STABLE GROWTH FUND (JULY 2014)
(2,000)
(1,000)
-
1,000
2,000
3,000
07/1
2
08/1
2
09/1
2
10/1
2
11/1
2
12/1
2
01/1
3
02/1
3
03/1
3
04/1
3
05/1
3
06/1
3
07/1
3
08/1
3
09/1
3
10/1
3
11/1
3
12/1
3
01/1
4
02/1
4
03/1
4
04/1
4
05/1
4
06/1
4
Drawdown Reinvestment
172,000
173,000
174,000
175,000
176,000
177,000
178,000
179,000
180,000
Unit balance
Initial investment: R3,000,000.00
Initial drawdown rate: 6%
Income escalation: 6% per annum
Anniversary month: July

(2,000)
(1,000)
-
1,000
2,000
3,000
07
/12
08
/12
09
/12
10
/12
11
/12
12
/12
01
/13
02
/13
03
/13
04
/13
05
/13
06
/13
07
/13
08
/13
09
/13
10
/13
11
/13
12
/13
01
/14
02
/14
03
/14
04
/14
05
/14
06
/14
07
/14
08
/14
09
/14
10
/14
11
/14
12
/14
01
/15
02
/15
03
/15
04
/15
Drawdown Reinvestment
171,000
172,000
173,000
174,000
175,000
176,000
177,000
178,000
179,000
180,000
Unit balance
Initial investment: R3,000,000.00
Initial drawdown rate: 6%
Income escalation: 6% per annum
Anniversary month: July
GRINDROD STABLE GROWTH FUND – APRIL 2015

Year 1
July 2012 -
June 2013
Year 2
July 2013 -
June 2014
Year 31
July 2014 -
June 2015
Income drawdown requirement R180,000.00 R190,800.00 R202,248.00
Net income produced by fund R134,035.08 R172,555.19 R193,453.88
Income covered by portfolio 74.5% 90.4% 95.7%
Capital value at end of period R3,284,104.89 R3,528,361.24 n/a
GRINDROD STABLE GROWTH FUND – APRIL 2015 6% drawdown rate
1 Based on GrAM distributions forecasts and April 2015 ending unit balance

1. Client retirement becoming
MORE secure
2. Advisor AUM based fees
INCREASE
3. Capital and income LESS
vulnerable to volatility,
sequence, timing and top up
risk

Reliable income yield
Annual growth in income of close to CPI
Long term capital growth (Total Return) at/above CPI to sustain income for up
to 30 years
INCOME EFFICIENT PORTFOLIOS 3 important elements to provide for income dependent investors

Ian Anderson May 2015
DE-RISKING RETIREMENT STRATEGIES

IN JANUARY 2014, SA FUND MANAGERS...
forecast the 10-year bond yield to be 8.5 – 9.0% in 12 months
forecast the rand to be ZAR10.25/US$ in 12 months
thought that South African 10-year bonds were „overvalued‟
thought that resources would be the best performing equity sector in 2014
Source: Merrill Lynch Fund Manager Survey

HISTORIC PERFORMANCE – SA ASSET CLASSES
0
100
200
300
400
500
600
700
800
2005 2006 2007 2008 2009 2010 2011 2012 2013 2014 2015
Ten year performance to 31/03/2015
SA Listed Property SA Equities SA Bonds SA Cash
SA Listed Property
SA Equities SA Bonds SA Cash
10 Years 22.4% 18.0% 8.9% 7.4%
5 Years 22.2% 16.1% 9.7% 5.8%
3 Years 25.2% 19.4% 9.0% 5.6%
1 Year 41.4% 12.5% 12.4% 6.1%
Source: I-Net Bridge

HISTORIC PERFORMANCE – SA FUND MANAGERS
SA Listed
Property SA Equities SA Bonds SA Cash
10 Years 22.4% 18.0% 8.9% 7.4%
5 Years 22.2% 16.1% 9.7% 5.8%
3 Years 25.2% 19.4% 9.0% 5.6%
1 Year 41.4% 12.5% 12.4% 6.1%
Multi-Asset Low Equity
Multi-Asset High Equity
10.1% 13.4%
10.3% 12.8%
11.5% 15.0%
10.3% 11.9%
16.0% 20.5% P&G portfolios – 3 years
20.0% 25.1% P&G portfolios – 1 year
Source: I-Net Bridge & Morningstar
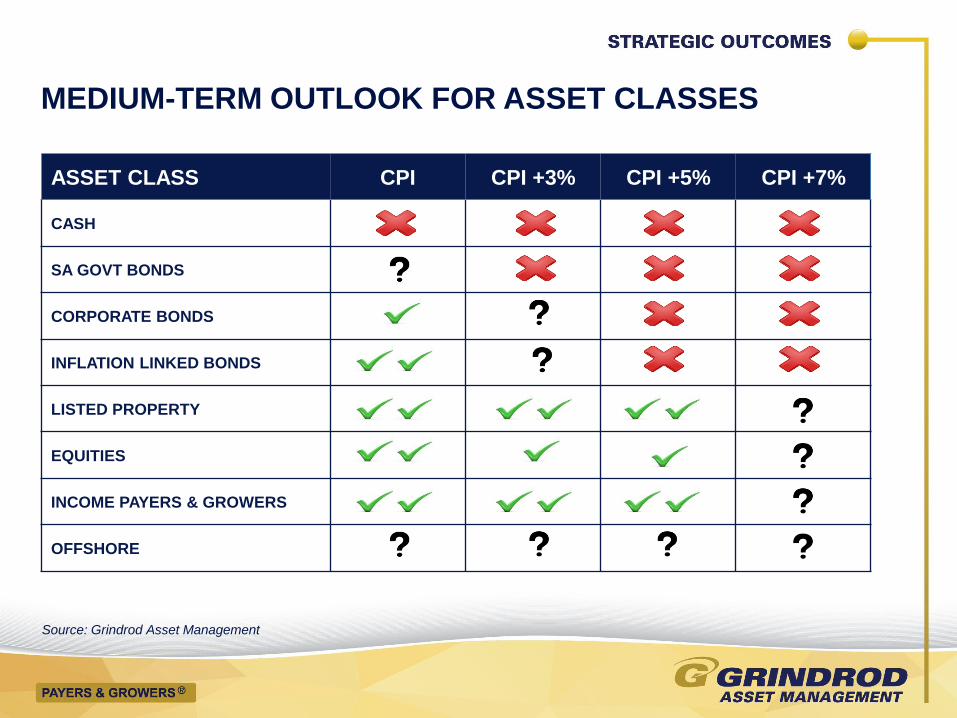
MEDIUM-TERM OUTLOOK FOR ASSET CLASSES
ASSET CLASS CPI CPI +3% CPI +5% CPI +7%
CASH
SA GOVT BONDS
CORPORATE BONDS
INFLATION LINKED BONDS
LISTED PROPERTY
EQUITIES
INCOME PAYERS & GROWERS
OFFSHORE
CPI
CPI
CPI
CPI
CPI
CPI
CPI
CPI CPI CPI CPI
CPI
CPI
CPI
CPI
CPI
CPI
CPI
CPI
CPI
CPI
CPI
CPI
CPI CPI CPI
CPI CPI
CPI CPI
CPI CPI
Source: Grindrod Asset Management

MEDIUM-TERM OUTLOOK FOR ASSET CLASSES Simple expected real returns
Source: Research Affiliates based on data from Robert Shiller, FactSet & Bloomberg

INCOME
ASSETS
Lis
ted
pro
pert
y
GROWTH
ASSETS
INCOME EFFICIENT PORTFOLIOS

INCOME EFFICIENT PORTFOLIOS
Listed property
Cash & Bonds
Equities
Listed property
Cash & Bonds
Equities
Listed property
Cash & Bonds
Equities
Listed property
GRINDROD STABLE GROWTH FUND
GRINDROD MANAGED GROWTH FUND
GRINDROD HIGH INCOME FUND
GRINDROD EQUITY INCOME GROWTH FUND
Source: Grindrod Asset Management

► SOUTH AFRICA - MULTI-ASSET - LOW EQUITY
► FORWARD INCOME YIELD 6.5%
► INCOME GROWTH (3 YEARS) 6.8% p.a.
► SOUTH AFRICA - MULTI-ASSET - INCOME
► FORWARD INCOME YIELD 8.5%
► INCOME GROWTH (3 YEARS) 1.9% p.a.
INCOME EFFICIENT PORTFOLIOS
GRINDROD STABLE GROWTH FUND
GRINDROD MANAGED GROWTH FUND
GRINDROD HIGH INCOME FUND
GRINDROD EQUITY INCOME GROWTH FUND
► SOUTH AFRICA - MULTI-ASSET - HIGH EQUITY
► FORWARD INCOME YIELD 5.0%
► INCOME GROWTH (3 YEARS) 9.5% p.a.
► SOUTH AFRICA - EQUITY - GENERAL
► FORWARD INCOME YIELD 4.4%
► INCOME GROWTH (3 YEARS) 10.7% p.a.
Source: Grindrod Asset Management

INCOME EFFICIENT EQUITY PORTFOLIO
AVI
BAT
BIDVEST
CLICKS
FIRSTRAND
INVESTEC
LIBERTY
LIFE HEALTHCARE
MMI
MR PRICE MTN NAMPAK
OLD MUTUAL
REUNERT
SABMILLER
STANDARD BANK
SPAR
TIGER BRANDS
TRUWORTHS
VODACOM
WOOLWORTHS
DIVIDEND YIELD 4.0%
DIVIDEND GROWTH 10.9% p.a.
Source: Grindrod Asset Management

INCOME EFFICIENT EQUITY PORTFOLIO
Positions equally weighted
reduces risks to portfolio income stream (good businesses can cut dividends)
disciplined approach (regular rebalancing)
Emphasis on industries & products that matter
aging demographic – healthcare & financial services
communication – mobile telecomms
High quality businesses with relevant products and services;
high cash conversion ratios; clear dividend policies.

INCOME EFFICIENT LISTED PROPERTY PORTFOLIO
ACCELERATE
ARROWHEAD
DELTA
DIPULA
FAIRVEST
NEPI
SAFARI
TEXTON
TOWER
DIVIDEND YIELD
8.0%
DIVIDEND GROWTH
10.0% p.a.
Source: Grindrod Asset Management

INCOME EFFICIENT LISTED PROPERTY PORTFOLIO
Positions equally weighted
reduces risks to portfolio income stream (good businesses can cut dividends)
disciplined approach (regular rebalancing)
Yield and expected growth substantially above the market
current yield is more than 2% above market
expected distribution growth over next 3 years is more than 3% above market
Listed property is used to enhance the outcome
(high yield, high growth or combination of the two)

GRINDROD HIGH INCOME FUND
2.8%
2.1%
2.6%
1.9%
0.6%
1.4%
1.0% 1.2%
2.3% 2.1%
1.8%
4.5%
-2.0%
-1.0%
0.0%
1.0%
2.0%
3.0%
4.0%
5.0%
Jun '12 Sep '12 Dec '12 Mar '13 Jun '13 Sep '13 Dec '13 Mar '14 Jun '14 Sep '14 Dec '14 Mar '15
Pe
rce
nta
ge
Quarterly investment returns – A class
Capital Income Total Return
Source: Grindrod Asset Management

GRINDROD STABLE GROWTH FUND
2.2%
6.4%
7.1%
2.2%
1.2%
1.8%
3.7%
2.1%
4.5%
1.7%
5.4%
7.1%
-1.0%
0.0%
1.0%
2.0%
3.0%
4.0%
5.0%
6.0%
7.0%
8.0%
Jun '12 Sep '12 Dec '12 Mar '13 Jun '13 Sep '13 Dec '13 Mar '14 Jun '14 Sep '14 Dec '14 Mar '15
Pe
rce
nta
ge
Quarterly investment returns – A class
Capital Income Total Return
Source: Grindrod Asset Management

GRINDROD MANAGED GROWTH FUND
2.3%
8.0%
9.0%
2.6%
1.5%
3.2%
5.1%
2.9%
5.1%
1.8%
7.6%
8.8%
0.0%
1.0%
2.0%
3.0%
4.0%
5.0%
6.0%
7.0%
8.0%
9.0%
10.0%
Jun '12 Sep '12 Dec '12 Mar '13 Jun '13 Sep '13 Dec '13 Mar '14 Jun '14 Sep '14 Dec '14 Mar '15
Pe
rce
nta
ge
Quarterly investment returns – A class
Capital Income Total Return
Source: Grindrod Asset Management

GRINDROD EQUITY INCOME GROWTH FUND
4.4%
5.7%
3.8%
5.5%
2.6%
7.4%
8.3%
0.0%
1.0%
2.0%
3.0%
4.0%
5.0%
6.0%
7.0%
8.0%
9.0%
Sep '13 Dec '13 Mar '14 Jun '14 Sep '14 Dec '14 Mar '15
Pe
rce
nta
ge
Quarterly investment returns – A class
Capital Income Total Return
Source: Grindrod Asset Management

INCOME FROM GROWTH ASSETS GRINDROD STABLE GROWTH FUND
230,805
285,725
329,209
360,848
384,507
100,000
150,000
200,000
250,000
300,000
350,000
400,000
2012 2013 2014 2015f 2016f
Annual income produced from R5m investment – A class
Source: Grindrod Asset Management
TOTAL INCOME = R1,591,093
31.8% OF ORIGINAL INVESTMENT

INCOME FROM GROWTH ASSETS GRINDROD MANAGED GROWTH FUND
164,000
219,000
290,500
330,000
356,000
100,000
150,000
200,000
250,000
300,000
350,000
400,000
2012 2013 2014 2015f 2016f
Annual income produced from R5m investment – A class
Source: Grindrod Asset Management
TOTAL INCOME = R1,359,500
27.2% OF ORIGINAL INVESTMENT

INCOME FROM GROWTH ASSETS GROWTH TRUMPS YIELD
100,000
150,000
200,000
250,000
300,000
350,000
400,000
450,000
500,000
550,000
600,000
2013 2014 2015f 2016f 2020f
Annual income produced from R5m investment – A class
High Income Fund Stable Growth Fund Managed Growth Fund
Source: Grindrod Asset Management

GRINDROD MANAGED GROWTH FUND ANOTHER PERSPECTIVE
Current NAV = R437.9m (as at 07/05/2015)
Income - 2015 Income - 2016 % change
Banking business R1,574,539 R1,773,445 12.6%
Mobile communications business R1,498,490 R1,605,587 7.1%
Fashion retailing business R1,454,230 R1,693,488 16.5%
Insurance business R1,424,029 R1,918,744 34.7%
Food production business R1,065,217 R1,162,895 9.2%
Electronics business R781,070 R781,070 0%
Tobacco business R526,133 R575,214 9.3%
Packaging business R513,764 R622,784 21.2%
Healthcare business R506,629 R570,336 12.6%
Food retailing business R471,374 R510,975 8.4%
Food service & logistics business R376,350 R425,005 12.9%
Brewing business R274,086 R299,584 9.3%
Health & beauty retailing business R352,634 R397,586 12.7%
Property portfolio R8,542,272 R9,317,050 9.1%
Cash & bonds R3,810,696 R3,810,696 0%
TOTAL R23,171,513 R25,464,468 9.9%
Source: Grindrod Asset Management

PORTFOLIO HEALTH MONITOR

GRINDROD MANAGED GROWTH FUND A CASE STUDY
Source: Grindrod Asset Management
45 YEARS OLD
CURRENT ANNUAL SALARY OF R490,769.23
COMPULSORY SAVINGS OF R878,370.85
CONTRIBUTIONS OF 8.25% OF ANNUAL SALARY
SALARY ESCALATES AT 6% PER ANNUM
COMPULSORY SAVINGS INVESTED
IN THE GRINDROD MANAGED GROWTH FUND

GRINDROD MANAGED GROWTH FUND SCENARIO PLANNING TOOL
Source: Grindrod Asset Management
0
100
200
300
400
500
600
700
800
2015 2016 2017 2018 2019 2020 2021 2022 2023 2024 2025 2026 2027 2028 2029 2030 2031 2032 2033 2034
Simulated price performance

GRINDROD MANAGED GROWTH FUND SCENARIO PLANNING TOOL
Source: Grindrod Asset Management
1.00
2.00
3.00
4.00
5.00
6.00
7.00
8.00
2015 2016 2017 2018 2019 2020 2021 2022 2023 2024 2025 2026 2027 2028 2029 2030 2031 2032 2033 2034
Simulated quarterly distributions

GRINDROD MANAGED GROWTH FUND INCOME COVERAGE RATIO
Source: Grindrod Asset Management
0%
50%
100%
150%
200%
250%
300%
350%
0
500,000
1,000,000
1,500,000
2,000,000
2,500,000
3,000,000
3,500,000
2015 2016 2017 2018 2019 2020 2021 2022 2023 2024 2025 2026 2027 2028 2029 2030 2031 2032 2033
% Of annual salary covered by income from GMGF
Income coverage ratio (rhs) Annual salary (lhs) Retirement income (lhs)
Pre-retirement Post-retirement
Retirement
Retirement
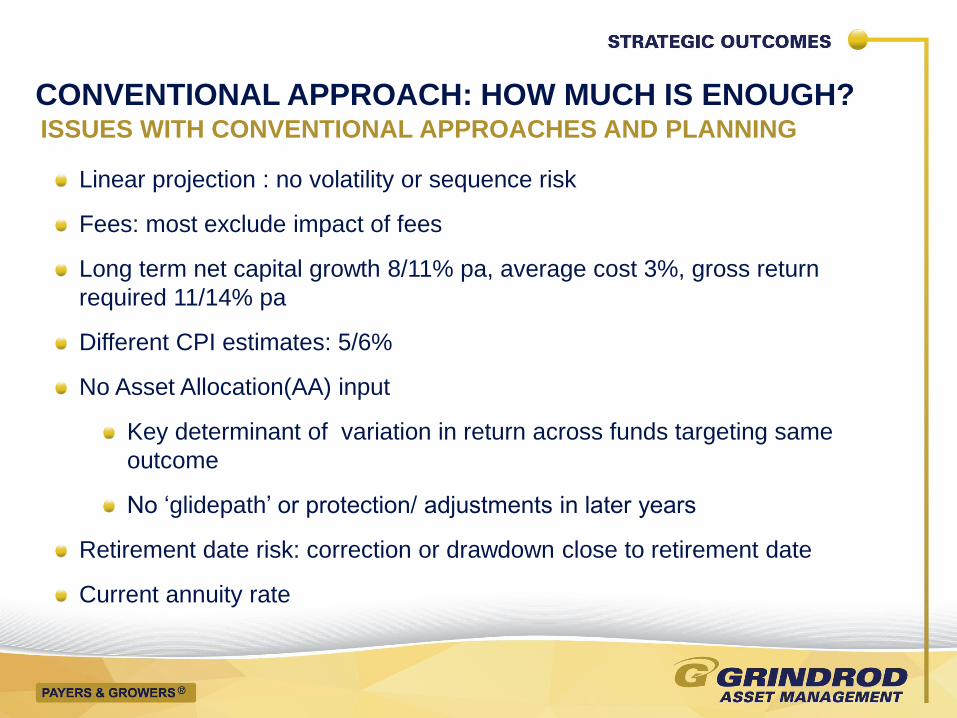
Linear projection : no volatility or sequence risk
Fees: most exclude impact of fees
Long term net capital growth 8/11% pa, average cost 3%, gross return
required 11/14% pa
Different CPI estimates: 5/6%
No Asset Allocation(AA) input
Key determinant of variation in return across funds targeting same
outcome
No „glidepath‟ or protection/ adjustments in later years
Retirement date risk: correction or drawdown close to retirement date
Current annuity rate
ISSUES WITH CONVENTIONAL APPROACHES AND PLANNING
CONVENTIONAL APPROACH: HOW MUCH IS ENOUGH?

HOW MUCH IS ENOUGH? ISSUES WITH CONVENTIONAL ASSUMPTIONS AND CALCULATORS
0
2
4
6
8
10
12
14
1 5 10 15 20 25
Mill
ion
s
Years
Linear projection : no volatility or sequence risk

A MORE REALISTIC LOOK MONTE CARLO: RANGE OF OUTCOMES FOR CPI+3

SEQUENCE RISK IN LATER YEARS HARDER TO RECOVER LOSSES ESPECIALLY IN LATTER YEARS

SEQUENCING RISK MAY LEAD TO PORTFOLIO RUIN

HOW MUCH IS ENOUGH?
Retirement date risk
Correction or drawdown close to retirement date.
-10% increases a 5% planned drawdown rate to 5,5%
Reduces real income growth period from 19 to 17 years and
success rate from 54% to 44%.
-15% increases a 5% planned drawdown rate to 5,8%
Reduces real income growth period from 19 to 14 years and
success rate from 54% to 40%
ISSUES WITH CONVENTIONAL ASSUMPTIONS AND CALCULATORS

ANNUITY RISK
Capital value
Annuity Rate
5% 4.5% 6%
NEED MORE
CAPITAL
NEED LESS
CAPITAL
UNKNOWABLE INTEREST/ANNUITY RATE CHANGES

ANNUITY RISK
Capital value
Annuity Rate
RSA 2000/ 14%
RSA 2006/ 8.6%
RSA 2015/ 7.2%, escalating@5%/ 4.2%
UNKNOWABLE INTEREST/ANNUITY RATE CHANGES

Shock after annuity
rates hit record low 29 April 2015
UK 1995/ 11.3%
UK 2008/ 7%
UK 2015/ 4.7%
UK 2015 escalating@CPI/ 2.7%

RETIREMENT RISK ZONE SEQUENCE RISK, ANNUITY RISK
High Annuity
Risk

GLIDEPATH OR TARGET DATE FUND MECHANICAL ASSET ALLOCATION ADJUSTMENTS

Almost certain to not achieve the projected capital value (not fully
invested)
Still have another 30 years to sustain income drawdown stress
25-50% less
income
or higher
drawdown rate
0
2
4
6
8
10
12
14
1 5 10 15 20 25
Mill
ion
s
Years
GLIDEPATH OR TARGET DATE FUND MECHANICAL ASSET ALLOCATION ADJUSTMENTS

Risk is better measured by the volatility in our prospective retirement
income than by the volatility in our portfolio value
A far better measure is the real sustainable spending a portfolio is likely to
deliver
Glidepath funds neither reflect current market conditions or yields, nor
adapt opportunistically to them


Projected Income

Morningstar: John Rekenthaler Vice President of Research for Morningstar 2014
“for investors approaching (or in) retirement, the better way to think about
progress is the growth (or shrinkage) of projected income.
Projected income is a concept whose time has come…. Projected retirement
income is superior to total return for conveying to investors how they are
progressing toward their goals,
it‟s quite possible for a fund to succeed according to total return but fail as
measured by projected income,”
Blackrock: Chip Castille Managing Director,BlackRock US DC Group. May 2015
We need to shift our focus away from the total value of the nest egg, and
instead toward the annual income it could provide
NEW THINKING IN A DIFFERENT DIRECTION GLOBAL RESEARCH

UNDERSTANDING „REAL‟ RISK
Short-term risk (“shallow risk”)
- Price volatility
• Obvious
• Immediate
• Temporary
SOURCE: WILLIAM BERNSTEIN:
DEEP RISK
Long-term risk (“deep risk”)
- Devastation (war or anarchy – Egypt)
- Confiscation (taxes or seizure by government - Zimbabwe)
- Deflation (falling asset values - Japan)
- INFLATION
“Std Dev measures only shallow risk”
“You should actively seek shallow risk,
since it will enable you to buy at lower
prices”

COMPONENTS OF RETURN AND STANDARD DEVIATIONS 2000 – 2013 ANNUALISED

GRINDROD MANAGED GROWTH FUND
2.3%
8.0%
9.0%
2.6%
1.5%
3.2%
5.1%
2.9%
5.1%
1.8%
7.6%
8.8%
0.0%
1.0%
2.0%
3.0%
4.0%
5.0%
6.0%
7.0%
8.0%
9.0%
10.0%
Jun '12 Sep '12 Dec '12 Mar '13 Jun '13 Sep '13 Dec '13 Mar '14 Jun '14 Sep '14 Dec '14 Mar '15
Pe
rce
nta
ge
Quarterly investment returns – A class
Capital Income Total Return
Source: Grindrod Asset Management

INCOME FROM GROWTH ASSETS GRINDROD MANAGED GROWTH FUND
164,000
219,000
290,500
330,000
356,000
100,000
150,000
200,000
250,000
300,000
350,000
400,000
2012 2013 2014 2015f 2016f
Annual income produced from R5m investment
Source: Grindrod Asset Management

FOCUS ON TOTAL RETURN THE BENEFITS OF COMPOUNDING INCOME
0
1,000,000
2,000,000
3,000,000
4,000,000
5,000,000
6,000,000
7,000,000
2010 2011 2012 2013 2014
Cumulative return split on R5m initial investment Nedgroup Investments Property Fund
Income paid Capital appreciation Income reinvested (compounding)
Source: Grindrod Asset Management
R933k produces R74k pa= 14% more income

GRINDROD MANAGED GROWTH FUND RETIREMENT PLANNING:INCOME COVERAGE RATIO
Source: Grindrod Asset Management
0%
50%
100%
150%
200%
250%
300%
350%
0
500,000
1,000,000
1,500,000
2,000,000
2,500,000
3,000,000
3,500,000
% OF ANNUAL SALARY COVERED BY INCOME FROM GMGF
Income coverage ratio (rhs) Annual salary (lhs) Retirement income (lhs)

“Incremental liabilities are not met by the cash
matching of bonds,….They are best matched
through productivity and inflation-related
investments – equity and real estate.”

PRE-RETIREMENT POST-RETIREMENT
DERISKING RETIREMENT STRATEGIES CHANGING THE APPROACH
Move away from an approach that is mostly based on unknowns and
therefore hope. This approach focuses on:
A short term only risk measure, volatility, measured by Std Deviation
Short term tactical or market timing techniques, which are high risk for
the client, especially in the retirement risk zone I.e., value strategy out of
favour
Creating portfolios that look efficient and optimised based on complex
mathematical models which are price centric and short term volatility
based, focus mostly on short term market conditions and bear no
relationship to client outcomes
-10% increases a 5% planned drawdown rate to 5,5%
Reduces real income growth period from 19 to 17 years and success rate from 54%
to 44%.
-15% increases a 5% planned drawdown rate to 5,8%
Reduces real income growth period from 19 to 14 years and success rate from
54% to 40%

PRE-RETIREMENT POST-RETIREMENT
DERISKING RETIREMENT STRATEGIES CHANGING THE APPROACH
To an approach that is based on tangible, predictable metrics, thereby
facilitating solid planning. This approach focuses on :
The only relevant retirement risk, predictable income and income growth
A metric that gives you a better indication of income position and risk
than portfolio values, the Income Coverage Ratio (ICR)
The ICR that facilitates a plan management process that matches the
clients income liability with their asset through time
-10% increases a 5% planned drawdown rate to 5,5%
Reduces real income growth period from 19 to 17 years and success rate from 54%
to 44%.
-15% increases a 5% planned drawdown rate to 5,8%
Reduces real income growth period from 19 to 14 years and success rate from
54% to 40%

PRE-RETIREMENT POST-RETIREMENT
DERISKING RETIREMENT STRATEGIES APPLYING ASSET LIABILITY MATCHING
This is achieved by:
Matching the clients current or future income liability ………….
through the Income Coverage Ratio ………
to a…..
-10% increases a 5% planned drawdown rate to 5,5%
Reduces real income growth period from 19 to 17 years and success rate from 54%
to 44%.
-15% increases a 5% planned drawdown rate to 5,8%
Reduces real income growth period from 19 to 14 years and success rate from
54% to 40%
Grindrod
Income Efficient Portfolio.

Grindrod Collective Investments RF) (Pty) Ltd (“the Manager”), Registration number 2008/022492/07, is a company incorporated in South Africa acting as a manager of collective investments schemes in securities in terms of Section 42 of the Collective Investments Schemes Control Act and is supervised by the Financial Services Board. The registered address of the Manager is 5 Arundel Close, Kingsmead Office Park, Durban, 4001. The Trustee and Custodian is Société Générale Johannesburg Branch. The Investment Management of the portfolios is outsourced to Grindrod Asset Management (Pty) Ltd, an authorised financial services provider, FSP 29834. Both the Manager and Grindrod Asset Management (Pty) Ltd are members of the Grindrod Financial Services Group. Client administration is outsourced to Maitland Group South Africa Limited, Tel: 021 681 8059; Address: Maitland House 1, River Park, Gloucester Road, Mowbray, 7700, Cape Town. Collective investment schemes are generally medium to long-term investments. The value of participatory interests or the investment may go down as well as up. Past performance is not necessarily a guide to future performance. Collective investment schemes are traded at ruling prices and can engage in borrowing and scrip lending. A schedule of fees and charges and maximum commissions is available on request from the manager. There are no performance fees charged in the portfolio. The manager does not provide any guarantee either with respect to the capital or the return of a portfolio. A fund of funds is a portfolio that invests in portfolios of collective investment schemes that levy their own charges, which could result in a higher fee structure for the fund of funds. Participatory interests in the portfolios issued by the manager qualify as investment instruments for the purposes of Tax Free Savings and Investment account by virtue of Section 12T of the Income Tax Act. If you wish to invest in a Tax Free Savings and Investment Plan please ensure that you fill in the correct application form. Grindrod is required by law not to accept contributions in excess of the annual and lifetime limits. Grindrod does not monitor the contributions you may have with other service providers. Consequently, you undertake to advise Grindrod when your aggregate contribution across service providers has reached the annual limit and the lifetime limits. Grindrod is not responsible for the tax penalty which you may incur as a result of excess contributions made by you into the Investment Plan. A 40% penalty is payable on the contribution above limit. No transfers to another tax free investment service provider will be allowed before 1 March 2016. Grindrod does not charge any fees for withdrawal of the tax free investment. The General Investor Report is published on a quarterly basis and is available on request and on our website. The portfolio may borrow up to 10% of its net assets on a temporary basis. Such borrowings are permitted only to meet the portfolio’s obligations in relation to (i) the administration of the Fund relating to purchase or sale transactions; and/or (ii) the redemption or cancellation of participatory interests in the portfolio. Borrowings in relation to (i) above are only permitted for a period of up to 8 calendar days, and 61 calendar days in respect of (ii). Past portfolio performance is measured on a rolling monthly basis. The annual report, brochures, application form is available on our website. The portfolio may be closed to new investments at any time in order to be managed in accordance with its mandate. Forward pricing is used. Information on this document shall not be construed as financial advice as defined and/or contemplated in terms of the Financial Advisory and Intermediary Services Act, Act 37 of 2002 ("the FAIS Act"). Grindrod shall, wherever possible, avoid situations causing a conflict of interest. Where it is not possible to avoid such conflict, Grindrod shall advise you of such conflict in writing at the earliest reasonable opportunity and shall mitigate the conflict of interest in accordance with its conflict of interest Management Policy. You may send a blank email with a subject “conflict of interest” to the compliance officer, should you need a copy of this policy. Complaints should be directed to the Compliance Officer. The Complaints Resolution Policy is available on request. The Compliance Officer’s email address is [email protected]. Grindrod Collective Investments (RF) (Pty) Ltd and Grindrod Asset Management (Pty) Ltd (collectively referred to as “Grindrod”) are members of the Grindrod Financial Services Group and are supervised by the Financial Services Board
THANK YOU