a walk on the wild side. exploring the compatibility of biodiversity and recreational preferences in...
TRANSCRIPT

EXPLORING THE COMPATIBILITY OF BIODIVERSITY AND RECREATIONAL PREFERENCES IN URBAN GREEN SPACES
A WALK ON THE WILD SIDE

30 ECTS points MSc. thesis inLandscape Architecture and Green Space Management
A walk on the wild sideExploring the compatibility of biodiversity and recreational preferences in urban green spaces
Malene Fogh Bang (lsh744)Sara Folvig (fwt504)
Department of Geosciences and Natural Resource Management. Faculty of Science, University of Copenhagen
SupervisorHans Peter Ravn
Co-supervisors Anders Busse NielsenAndy G. Howe
Submitted1st October 2015
Image creditsAll photos are captured by the authors, unless otherwise stated. All hand drawn trees by courtesy of Anders Busse Nielsen.
Printed at:Christensen Grafisk


This thesis investigated the compatibility of biodiversity and recreational preferences in urban green spaces. This was addressed through an inter-disciplinary approach which combined methods from the fields of ecol-ogy and landscape architecture. A method for assessing biodiversity was employed to compare biodiversity between three formal green spaces designated for recreational use and three informal green spaces with no designated recreational function.
Biodiversity was assessed in terms of both habitat diversity and species diversity of vascular plants and terrestrial invertebrates. In addition, transect diagrams were employed to assess the spatial configuration of the areas. The results revealed that biodiversity was relatively high in formal green spaces due to high habitat heterogeneity and diverse plant compositions. Nevertheless, in many respects biodiversity was higher in the informal green spaces, characterised by spontaneous vegetation of complex structures and compositions.
The landscape qualities which were found to promote biodiversity with-in the six case areas were compared to preferences for various land-scape structures identified through a literature study. The comparison revealed that biodiversity and recreational preferences are not imme-diately compatible. It was found that the general dislike for especially dense vegetation, spontaneous structures, and a lack of coherence within the landscape presents a challenge for promoting biodiversity in urban green spaces. Thus, a set of design strategies were developed for promoting compatibility of biodiversity and recreational preferences in both formal and informal green spaces. Finally, these strategies were applied in small scale design interventions in each of the six case areas.
KEYWORDSBiodiversity assessment, biotope mapping, derelict areas, invertebrates, landscape preference, park design, recreation, vascular plants, vegeta-tion structure, urban green space
Abstract

Dette speciale undersøgte foreneligheden af biodiversitet og rekreative præferencer i urbane grønne områder. Dette blev grebet an ud fra en tværfaglig tilgang som kombinerede metoder fra økologi og landskab-sarkitektur. En metode til bestemmelse af biodiversitet blev anvendt til at sammenligne biodiversiteten mellem tre formelle grønne områder udlagt til rekreative formål og tre uformelle områder ikke udlagt til re-kreative formål.
Biodiversiteten blev bestemt ud fra både habitatdiversitet og artsdi-versitet af vaskulære planter og terrestrielle invertebrater. Dertil blev transektdiagrammer anvendt til at undersøge den rumlige opbygn-ing af områderne. Resultaterne viste, at biodiversiteten var relativt høj i formelle grønne områder grundet en høj habitatheterogenitet og varierede beplantninger. Dog viste det sig at biodiversiteten på mange punkter var højere i de uformelle områder, som var karakteriserede af spontan vegetation med komplekse plantekompositioner og -sammen-sætninger.
Landskabskvaliteterne som viste sig at fremme biodiversiteten i de seks case områder blev sammenlignet med præferencer for forskellige land-skabsstrukturer udpeget gennem et litteraturstudie. Sammenligningen viste, at biodiversitet og rekreative præferencer ikke umiddelbart er forenelige. Det fremgik, at den generelle modvilje mod især tæt vegeta-tion, spontane strukturer og en manglende sammenhæng i landskabet gør det vanskeligt at fremme biodiversiteten i urbane grønne områder. Et sæt designstrategier blev derfor udviklet til at fremme foreneligheden af biodiversitet og rekreative præferencer i både formelle og uformelle grønne områder. Disse strategier blev til slut anvendt i mindre designfor-slag til hvert af de seks case områder.
NØGLEORDBiodiversitetsundersøgelse, biotopkortlægning, invertebrater, landska-bspræference, parkedesign, rekreation, restarealer, vaskulære planter, vegetationsstruktur, urbane grønne områder
Resume

Contents
Foreword p. 8Acknowledgements p. 9
Introduction p. 10 Aim and objectives p. 11 Structure and Method p. 12 Delimitation p. 14 Terms and definitions p. 15
// Part I
The ecological aspect Biodiversity and its drivers p. 18 Biodiversity in ‘formal’ green spaces p. 22 Biodiversity in ’informal’ green spaces p. 22
Introduction to case studies Selecting case areas p. 26 Presentation of ‘formal’ green spaces Fælledparken p. 28 Enghaveparken p. 30 Mimersparken p. 32
Presentation of ‘informal’ green spaces Stejlepladsen p. 34 Nordhavnstippen p. 36 Amagerbanen p. 38
Methodology Urban biodiversity assessment p. 42 Habitat diversity p. 43 Species diversity p. 44 Data analysis p. 46
Results Fælledparken p. 50 Enghaveparken p. 64 Mimersparken p. 76 Stejlepladsen p. 86 Nordhavnstippen p. 96 Amagerbanen p. 106
Collective results of the formal p. 118and informal green spaces
Discussion p. 124Limitations p. 129Conclusion p. 129
General recommendations for p. 130improving biodiversity

// Part II
The recreational aspect Culture vs. nature p. 134 The recreational use of urban green spaces p. 136 The recreational qualities of wastelands p. 137 Recreational preferences p. 138 Compatibility assessment Fælledparken p. 144 Enghaveparken p. 146 Mimersparken p. 148 Stejlepladsen p. 150 Nordhavnstippen p. 152 Amagerbanen p. 154 Conclusion to compatibility assessment p. 156
// Part III
Potential for compatibility p. 160Design strategies p. 162
Proposals Fælledparken p. 166 Enghaveparken p. 168 Mimersparken p. 170 Stejlepladsen p. 172 Nordhavnstippen p. 174 Amagerbanen p. 176
// Part IV
Conclusion p. 180Reflections p. 182
References p. 186
Appendix p. 196

Nordhavnstippen

Introduction

This thesis marks the end of five years of study in landscape architecture. During these five years, we have studied how to plan and manage our green surroundings to create the best possible frame for human well-being and the environment. The human aspect of green spaces plays a principal role in the work of a landscape architect. However, we find there are other aspects to this profession that also deserve considera-tion. In the fall of 2014, we completed a small study of biodiversity in urban roadside verges of Copenhagen. The study triggered an interest for a theme we had not given adequate attention before: biodiversity in urban nature. The findings of our study suggested that management traditions and aesthetic preferences are key determinants of the degree of biodi-versity within roadside verges. This made us wonder about the possible extent of biodiversity in other types of urban green spaces.
In this thesis we endeavoured to bridge the field of ecology in order to explore the possibilities for promoting biodiversity in urban green spac-es. We set up an explorative study and merged analytical tools from the field of landscape architecture with methods derived from the field of ecology. Working with this methodology has been interesting and also challenging. Insect nets, pitfall traps, and the magnifying effect of the microscope have certainly pushed a few personal boundaries. Neverthe-less, the interdisciplinary approach has enabled us to better understand the factors that influence biodiversity in urban green spaces. It is our hope that this thesis provides evidence based reflections on the possibilities for synergies between biodiversity and recreational quali-ties that can inspire the planning and management of both existing and future urban green spaces.
Foreword
Malene Fogh Bang
Copenhagen, 2015
Sara Folvig

Writing a thesis is exciting and instructive when you are fortunate to have a committed team of academic advisors who provide valuable com-ments and great encouragement throughout.
In that regard, thank you to our main supervisor Hans Peter Ravn for taking on two landscape architects and for guiding us in our efforts to explore the ecological perspective on landscape architecture and recrea-tion.
Additionally, thank you to our co-supervisor Anders Busse Nielsen for his inspiring input and way of getting us back on track.
Finally, thank you to Andy Howe for being an excellent sparring partner and for his immense help in the lab sorting and identifying ‘the little crit-ters’. We hope he finds it was time well spent!
Acknowledgements

Once, man lived in harmony with nature from the understanding that all life is connected and interdependent. As human society evolved and cit-ies expanded people became more and more detached from their natu-ral surroundings. The loss of affiliation with nature resulted in a loss of the sense of responsibility for it. This generated a tendency of perceiving nature as a product to be exploited instead of something that has value in itself (Natursyn, 2015a; Farinha-Marques et al., 2011). In an expanding urban environment governed by an anthropocentric mindset the pressure on urban green spaces to provide various ecosys-tem services, i.e. cultural, regulating, and provisioning services, is signifi-cant. With several aspects to consider in the planning and management of urban green spaces, biodiversity is rarely given top priority (Hermy & Cornelis, 2000; Ejrnæs & Reddersen, 2012). Planners may be aware of the importance of biodiversity and aspire to promote it. However, any implication of biodiversity interfering with recreational qualities, will re-peatedly lead to reconsiderations and a shift in focus towards user func-tions instead of ecological values (Natusyn, 2015).
The frequent failure to accommodate biodiversity in urban green space design is concerning, given the continuing decline of biodiversity by in-creasing globalisation (Shochat et al., 2010). Biodiversity is an integral underlying foundation for the various ecosystem services on which hu-man well-being depends (Cardinale, 2012) and in addition, it has sig-nificant intrinsic value (Mikrofonholder, 2015). In the expanding urban environment, urban green spaces should be utilised for conserving and promoting biodiversity. This requires an understanding of not only the factors that promote biodiversity, but also human preferences for green spaces. These preferences will be the determinant factor for the extent of biodiversity in conservation efforts (Stokes, 2007).
Like many other aspects of today’s society, urban green spaces are sub-ject to a high level of order and control (Faeth et al., 2011). As such, the formal, designed urban green spaces which are found in cities are a mere interpretation of nature, shaped by cultural values, and designed to suit different recreational trends. In contrast, nature is not defined by straight lines. It is skewed, layered, and dynamic; factors that in various ways benefit biodiversity (Mikrofonholder, 2015). Occasionally, nature of a spontaneous kind finds its way into the urban environment. This is often seen on derelict land such as wastelands and landfill areas. These areas often possess valuable ecological qualities (Bonthoux et al., 2014) that might inspire new approaches to planning and management of ur-ban green spaces to offer better conditions for biodiversity.
The premise for this thesis was the hypothesis that a higher level of bio-diversity exists within informal, spontaneous green spaces than in for-mal, designed green spaces. It was assumed that preferences for certain landscape qualities and recreational functions of urban green spaces do not coincide with the qualities that promote biodiversity.
Introduction

The aim of this thesis was to explore to what extent factors promoting biodiversity and recreational preferences are compatible. In order to ad-dress this, the thesis was structured around the following objectives:
We wanted to (1) explore whether and why informal green spaces offer better conditions for biodiversity than formal green spaces. In a recrea-tional context we wanted to (2) identify preferred landscape qualities in order to (3) investigate whether the preferred landscape qualities are compatible with factors promoting biodiversity.
As a final evaluation, we wanted to (4) examine how formal green spaces can offer better conditions for biodiversity without compromising their recreational values and how informal green spaces can offer better con-ditions for recreation without compromising their ecological qualities.
Aim and objectives
Fig. 1 The three main aspects to consider in urban green spaces. The thesis will investigate to what extent biodiversity is compatible with prefer-ences for recreational functions and experiences. Adapted from: Habitats (2013).
Functions
ExperiencesBiodiversity

The first part of the thesis consist of empirical field research. It is initi-ated with a brief account of the ecological factors that influence biodi-versity according to existing research. This is followed by six case studies set to illuminate differences in biodiversity between formal and informal green spaces in Copenhagen. The empirical findings derived from the case studies are evaluated in relation to the presented existing research and a set of general recommendations for promoting biodiversity within urban green spaces is presented.
In the second part we focus on the recreational aspect of urban green spaces. By means of a literature study we investigate the recreational qualities of urban green spaces in terms of recreational use and land-scape preferences. Subsequently, we compare the empirical findings of the case studies with the identified, preferred landscape qualities and investigate the similarities and differences.
In part three, we examine the possibilities for synergies between fac-tors promoting biodiversity and recreational qualities. Subsequently, we present a set of design strategies to promote compatibility between biodiversity and recreation in urban green spaces. Finally, we apply the presented strategies in a set of proposals to integrate biodiversity and recreation in the formal green and informal case areas.
The fourth and final part presents a conclusion to our findings and reflec-tions on the study.
Structure and method

Fig. 2Structure and flow of the thesis.
Compatibility assessment
Design proposals
Urban biodiversity assessment
Part I Part II Part III
General recommendations for promoting biodiversity
Empirical research
Recreational preferences
Evidence based design
Theoretical research
Design strategies

The limited time frame made a few restrictions necessary. Firstly, the biodiversity assessment employed for the case studies was simplified to be manageable within a six month period spanning from April to Octo-ber. Hence, the registration of flora and fauna was non-repetitive which notably provides limited insight to the degree of biodiversity within the different green spaces. Furthermore, approximately half of the area of Fælledparken was omitted from the analysis.
As the focus of this study lies on the empirical field research, the design proposals have a limited level of detail and take form of small interven-tions that can be adopted in similar green spaces elsewhere. The up-coming plans for Amagerbanen developed by Schönherr and Moe (KK, 2014), the plans for climate adaptation in Enghaveparken developed by Tredje Natur (Tredje Natur, 2014), and the development plans for Nord-havn (By & Havn, n.d.) will not be discussed.
Delimitation

BIODIVERSITYBiodiversity or biological diversity is defined as “the variability among liv-ing organisms from all sources, including, ‘inter alia’, terrestrial, marine, and other aquatic ecosystems, and the ecological complexes of which they are part: this includes diversity within species, between species and of ecosystems” (UN, 1992). In this study, the term biodiversity will cover species diversity and habitat diversity. We fully acknowledge that these form only two levels of biodiversity which by definition encompasses multiple additional levels of biological organisation.
FORMAL AND INFORMAL GREEN SPACESThe distinction between the terms formal and informal green spaces is derived from Rupprecht & Byrne (2014) who have developed a global definition and typology of the two terms applicable to this study.
The term ‘formal green space’ covers any green space that results from human intention. All landscape elements have been designated and or-ganised either for recreational use or cultivation and the area is man-aged and developed accordingly.
The term ‘informal green space’ encompasses any green space that may have human origin, but is not a direct result of human design. It is an area where vegetation has developed spontaneously on the basis of its former use or origin and where management is not coherent. The area is not designated for recreation, production or cultivation. Any use is informal and transitional in both time, space, and function.
Terms and Definitions
Humanorigin
Management
Informal green space
Ecology
Conservation areasForm
al gr
een
spac
e
Fig. 3The organisation of formal and informal green spaces according to three main influencing factors. Adapted from: Rupprecht & Byrne (2014).


// Part I
THE ECOLOGICAL ASPECT

Biodiversity is a complex concept as it encompasses multiple, interrelat-ed levels of biological organisation. These include; ecosystem diversity, species diversity and genetic diversity (Alvey, 2006; Noss, 1990). Diver-sity at ecosystem level is regulated by physiographic patterns expressed by the spatial distribution of habitats as well as both biotic and abiotic ecological processes such as water and nutrient cycles, climate, inter-specific interactions, and natural disturbances (GBC, 2002a; Noss, 1990). Diversity of species is determined by numerous factors. Most relevant to urban environments are dispersal abilities and the degree to which niche requirements of various species are fulfilled. These requirements vary indefinitely between biotic factors, be it quantitatively and qualita-tively sufficient resources such as food, shelter and nesting opportuni-ties, or abiotic factors such as variations in temperature and moisture (Agger et al., 1982). Genetic diversity is dependent on the interchange of genes within species which is strongly influenced by the spatial distribu-tion of habitats and the dispersal ability of different species (Bernhardt, n.d.a; Agger et al., 1982).
Franklin et al. (1981) recognized three main attributes of biodiversity; composition, structure and function. The following will present various factors that promote biodiversity structured according to the first two attributes, as composition and structure can be directly influenced by human intervention in the urban environment and form the template for ecological functions (Faeth et al., 2011).
COMPOSITIONAn important driver of biodiversity is the biotic components that make up an ecosystem (Noss, 1990). The various components are interde-pendent; yet vegetation constitutes an essential foundation for the rest of the biological community. Consequently, diversity of plant species is considered a precondition for overall biodiversity (Gao et al., 2014; and references therein). While diversity of plant species is important as a precaution against pest and disease outbreak with potential devastat-ing effects on ecosystems (Alvey, 2006), species diversity also includes non-native species. These are species that occur outside their natural range due to human-mediated introduction (Pyšek et al., 2004). There is
Biodiversity and its drivers
a tendency for an increase in non-native species towards the urban core (Kowarik, 2008; McKinney, 2002). Urbanisation promotes biotic homog-enisation whereby species assemblages in geographically separate cities resemble each other. One contributing mechanism is when native spe-cies are replaced by non-native species due to both accidental and inten-tional importation (McKinney, 2006). With their superior adaptive skills, robustness, and lack of natural enemies, some non-native species are strong competitors for resources to native species and more so if they have invasive behaviour (Alvey, 2006). The abundance of non-native species may increase local species diversity, but on a broader scale their competitive effect reduces native species diversity (McKinney, 2006) and thus contributes to the worrying trend of the ongoing homogenization of the global species pool (Wittig & Becker, 2010; McKinney, 2006).
The distribution of non-native species will also affect the large taxon of primary consumers, i.e. herbivorous insects, with further bottom-up implications for local food webs (Burghardt et al., 2010). Several stud-ies have demonstrated that many non-native plant species support less organisms compared to native species (Helden, 2012; and references therein). Kennedy & Southwood (1984) studied twenty-eight British trees and their associated insect fauna and asserted that among the trees with the most associated insects the top twelve trees were all na-tive. Especially species belonging to the genus Salix, Quercus, and Bet-ula had particularly rich assemblages of insects. With the exception of some species such as Ilex aquifolium and Taxus baccata, it is generally agreed that native vegetation is essential for invertebrate diversity and subsequently other faunal groups of higher trophic level (Helden et al., 2012; Burghardt & Tallamy, 2013) such as insectivorous birds for whom native vegetation was found to provide greater food supply than non-native vegetation (Helden et al., 2012). It should not be inferred that all non-native species are poor supporters of biodiversity nor that all native species are equally valuable (Burghardt & Tallamy, 2013). This was for example made evident by Helden et al.(2012) who studied insect fauna on native and non-native trees and found that non-native species some-times exceeded native species in associated insects. According to Smith et al. (2006) some non-native plant species may constitute resources to

insects if they are near-native, i.e. related to native plant species at fam-ily or genus level.
For the declining taxon of pollinating insects, native and near-native flora comprises the most important resource; yet research suggests that overall resource abundance is the main driver of insect populations regardless of its native/non-native status (Salisbury et al., 2015; Bjerk-nes, 2007). Salisbury et al. (2015) recently argued that a careful selec-tion of non-native plant species added to a habitat can provide valu-able resources for pollinators when native and near-native resources are scarce, especially in very early and late season (Bjerknes, 2007).
STRUCTUREAnother significant driver of biodiversity is the spatial and temporal structure of vegetation (Gao et al, 2012) on which species richness and abundance strongly depend (Farinha-Marques et al., 2011; and refer-ences therein). The spatial structure comprises both the horizontal and vertical dimensions of vegetation.
On the horizontal level, a high complexity of vegetation types will sup-port habitat heterogeneity and higher species diversity as more niche requirements will be fulfilled (Agger et al., 1981; Tews et al., 2004 and reference therein). An important part of the complexity of vegetation types are the transition zones. These often form a particular sort of intermediate habitats that favour many species. Studies have shown (Magura et al., 2001; and references therein) that diversity of ground beetles (Coleoptera: Carabidae) is higher in the edge zones than in the adjacent forest structures and open grassland. The in-between condi-tions of the stand interior and the open surface provide ideal conditions for many species and particularly those who require habitats of different structure in close vicinity.
In tree and shrub stands, variation in the vertical strata will also pro-mote biodiversity. A high stand of multiple layers can contribute to plant species richness and will furthermore enhance habitat heterogeneity for the benefit of different organisms that forage, nest, and rest at different
heights (Gao et al., 2014; GBC, 2002b). Gao et al. (2014) found that ma-ture, multi-layered stands had higher plant species diversity which also was the case in mixed stands of both deciduous and coniferous species and stands of semi-open character. Additionally, they found that young, one-layered, and especially coniferous stands had low plant species di-versity.
Structural complexity of vegetation will also affect diversity and distri-bution of fauna. In a study of urban forests it was discovered that the herb layer had a positive effect on ground beetles (Pinna et al., 2009). The herb cover provides protection from predation and ensures fa-vourable microclimatic conditions for the egg and larval development of most ground beetles. Additionally, the herb cover may increase the abundance of detritivores and herbivores which in turn may increase predatory species (Magura et al., 2001; Morris, 2000). Along with the understorey, herb cover is also an important provider of floral nectar. However, this resource is often in short supply as the plants bloom early in the season before leaf expansion. Along edges and where gaps in the canopy allow for sun infiltration, blooming may continue and resources be more consistent (Ulyshen, 2011).
Variations in the topography is another important structural factor that will add to the heterogeneity of microclimates and affect both flora and fauna in various positive ways (Bennie et al., 2008). The presence of leaf litter, rocks, and logs will furthermore retain moisture in between rain events and provide protection from desiccation for many invertebrate species (Hickerson et al., 2012).
In grassland environments, structural complexity is also of significant importance for invertebrates. Tall vegetation supports more species and a higher abundance of individuals, however some species are charac-teristic to shorter swards. Variation of low and tall grasses and herbs therefore enhances microhabitat heterogeneity (Morris, 2000; Noordijk et al., 2010). In addition, variation of fresh as well as dead strands will also support more species as many utilize dead strands for the construc-tion of nests (Morris, 2000).

Temporal structures are also an important attribute of biodiversity. Tree stands become more structurally complex with age which increases fau-nal diversity. As trees age, they tend to develop cavities that in both dry and water filled-state provide key habitats for wildlife. Adding to this, sap flow increases which is an important resource for many arthropod species. Old, fallen, mature trees create gaps in the canopy and add to the habitat- and microclimate heterogeneity and the dead or decaying wood is essential to saproxylic species (Sörensen, 2008) among others (Ulyshen, 2011).
Continuity of resources is an important temporal aspect of biodiversity. In the process of natural succession, the relatively open and sun exposed first stage is the most diverse (Rink & Herbst, 2012). Plant diversity tends to decrease towards the climax stage, while diversity of fauna increases (Bernhardt, n.d.b). As such, continuity of these stages is important to sustain a large variety of organisms (Bonthoux et al. 2014). Additionally, continuity of resources throughout seasons ensures continuous food sources or shelter opportunity even during winter. Notably, some spe-cies require different resources for the different stages of their lives. As an example, some species inhabit wood debris at ground level in their larval stage and progress upwards to the canopy layers as adults (Uly-shen, 2011). Other species are dependent on water elements for ovipo-sition (Williams, 1987; Hamer et al., 2012).

BIODIVERSITY IN FORMAL GREEN SPACESFormal urban green spaces are often characterized by high habitat het-erogeneity due to the complex spatial configuration of vegetation and water elements. As such, they can support biodiversity despite their primary recreational functions (Nielsen et al., 2013; Ahern, 2007; Hermy & Cornelis, 2004). Furthermore, they often contain remnants of natural areas or have a long history as a public green space within the urban matrix. Continuity is therefore often a key determinant of relatively high degrees of biodiversity in these areas (Farinha-Marques et al., 2011). The quality of the habitats within formal urban green spaces is, how-ever, under the control of the planners and managers and it is therefore greatly influenced by shifting fashions in landscape architecture.
As aesthetics is a ruling aspect of design, considerations for biodiversity may often be forfeit. Trees that provide a beautiful display of flowers in the spring are a sight valued by many, but when the beautiful flowers later turn into windfall fruit, the scenery is disrupted (Nassauer, 1995). As a prevention, the choice may fall on genetically modified, sterile tree species to avoid the ‘mess’ that otherwise constitute an important re-source for various faunal groups (Torrance, 2010).
The limited extent of many formal urban green spaces will cause many architects to utilize the area to its fullest extent. As a result, the lines are often sharply drawn (Odgaard, 2014). A clean transition from extensive lawn to a swiftly rising tree stand is a key example (Pape, 1984) of an architectural solution that does not consider edge sensitivity of various species.
The public pressure on formal urban green spaces means that certain reinforcements of the landscape are considered necessary. For example, lawns are often fertilized as a remedy against wear and tear (KK, 2013; Faeth, 2011). However, this practice has negative effects on biodiversity as the generous supply of nutrients to the lawns will result in monotone swards of only a few dominant species (Falk, 1980 referenced in Müller et al., 2013; Nordijk et al., 2010). However, some forms of wear and tear can promote highly favourable conditions for other species. A trodden
path through vegetation or a south facing slope subject to the tear of sledges in winter can produce just the right sort of habitat for ground nesting bees (Natursyn, 2015b; Potts et al., 2005).
Following design, maintenance is another determining factor of the de-gree of biodiversity in formal urban green spaces. When the vegetation elements have finally reached the designated spatial dimensions the goal is generally to keep that expression (Andersson, 1999). Temporal variation of vegetation is therefore often limited in formal urban green spaces and tends to be concentrated on the exchange of ornamental annual plants. Trees are rarely allowed to reach old age in formal green spaces. In general, they are removed before they potentially become a safety risk for visitors (Thomsen, 2014; Pape, 1984). Old, veteran trees full of cavities are therefore a rare sight and lost potential habitats for many organisms, especially the abundant group of saproxylic insects.
BIODIVERSITY IN INFORMAL GREEN SPACESInformal urban green spaces such as spontaneous or derelict areas, have in many cases been found to harbour more species than other urban green spaces and they are generally acknowledged to have sig-nificant potential for promoting biodiversity in the urban environment (Bonthoux et al., 2014; Farinha-Marques et al., 2011). The potential is rooted in the specific substrates, soil conditions, varying structures, and climate that are associated with these types of areas (Rink & Herbst, 2012; Kattwinkel et al., 2011). In fact, the high sun exposure and the well-drained brick debris, which in many cases makes up the substrate of these areas, often mimic natural habitats such as sandy heaths and chalk grassland and can support rare and even endangered species (Robinson & Lundholm, 2012).
Informal green spaces often comprise a mosaic of habitats in a pattern shaped by the former use of the area and are often highly dynamic due to progressing succession (Bonthoux et al., 2014, Kattwinkel et al., 2011; Strauss & Biedermann, 2006). This both spatial and temporal diversity of habitats creates a variety of niches for flora and fauna (Bonthoux et al., 2014).
Biodiversity in urban green spaces

Diversity of species changes with age and in accordance with the differ-ent stages of succession. It is found to peak within six to nine years, after which it tends to decrease as the vegetation matures (Rink & Herbst, 2012; Rebele, 1994). The early successional stage supports particularly diverse and complex food webs as the diverse plant communities pro-duce a variety of food sources such as plant mass, seeds, nectar, pollen and fruit (Swanson et al., 2010). This supports a variety of invertebrates and especially pollinating insects due to the abundance of pollen and nectar resources (Robinson & Lundholm, 2012).

Fælledparken

Introduction to case studies

Formal and informal urban green spaces exist on very different founda-tions which give them relatively dissimilar expressions. Whether dissimi-larities of landscape characteristics also result in differences in biodiver-sity was investigated by means of six case studies.
SELECTION OF CASE AREASThe case studies included three formal and three informal urban green spaces in Copenhagen. The three formal green spaces each represents a typical architectural style with certain recreational qualities.
• The traditional public park for promenading, sports, and play• The urban garden offering quiet contemplation• The multifunctional park for physical activities and socialising
By including different types of formal green spaces we hoped to illu-minate the level of biodiversity across a wider range of architectural expressions and recreational qualities. This should further enable us to present strategies for improving biodiversity that apply to more than one type of formal green space. The three contrasting informal green spaces included in the study were chosen based on their complexity and age to ensure reasonable com-parability to the formal green spaces. These areas included an old, de-serted railroad and two former landfill areas that all have developed spontaneously.
Introduction to case studies
Fig. 4The location of the six selected case areas in Copenhagen.
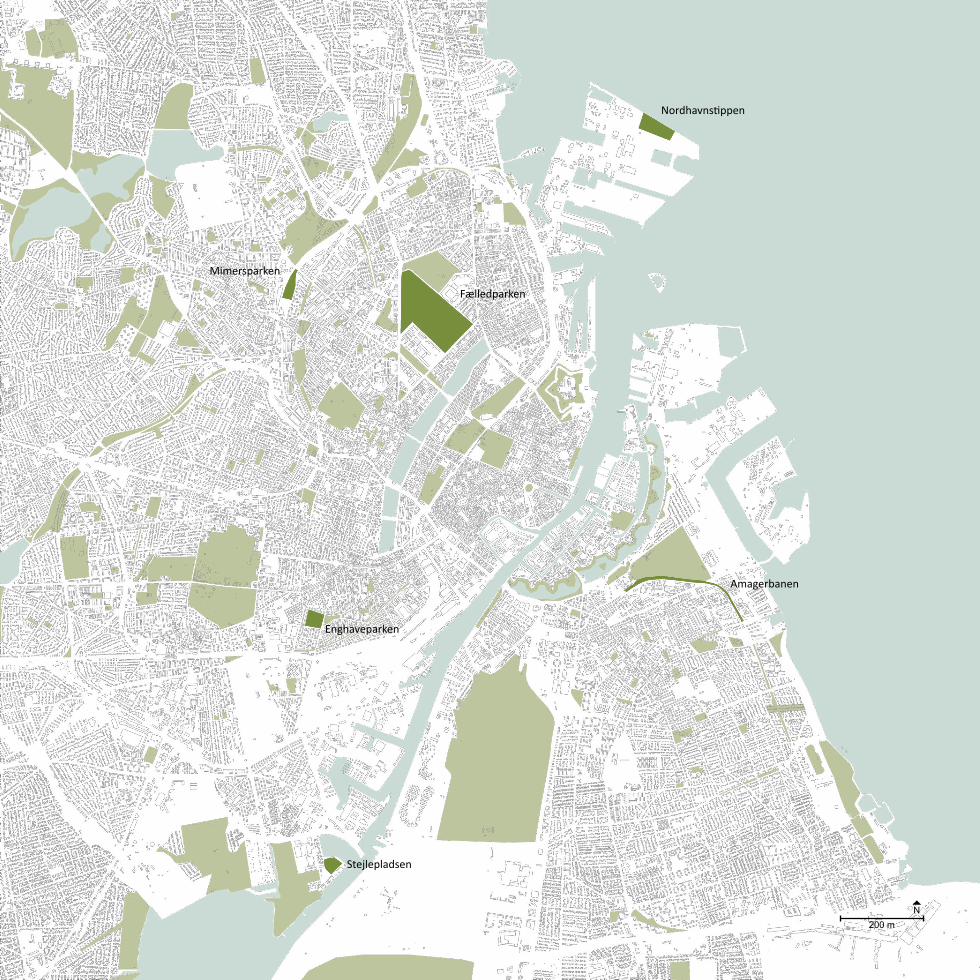
Nordhavnstippen
Fælledparken
Enghaveparken
Amagerbanen
Stejlepladsen
Mimersparken
200 mN
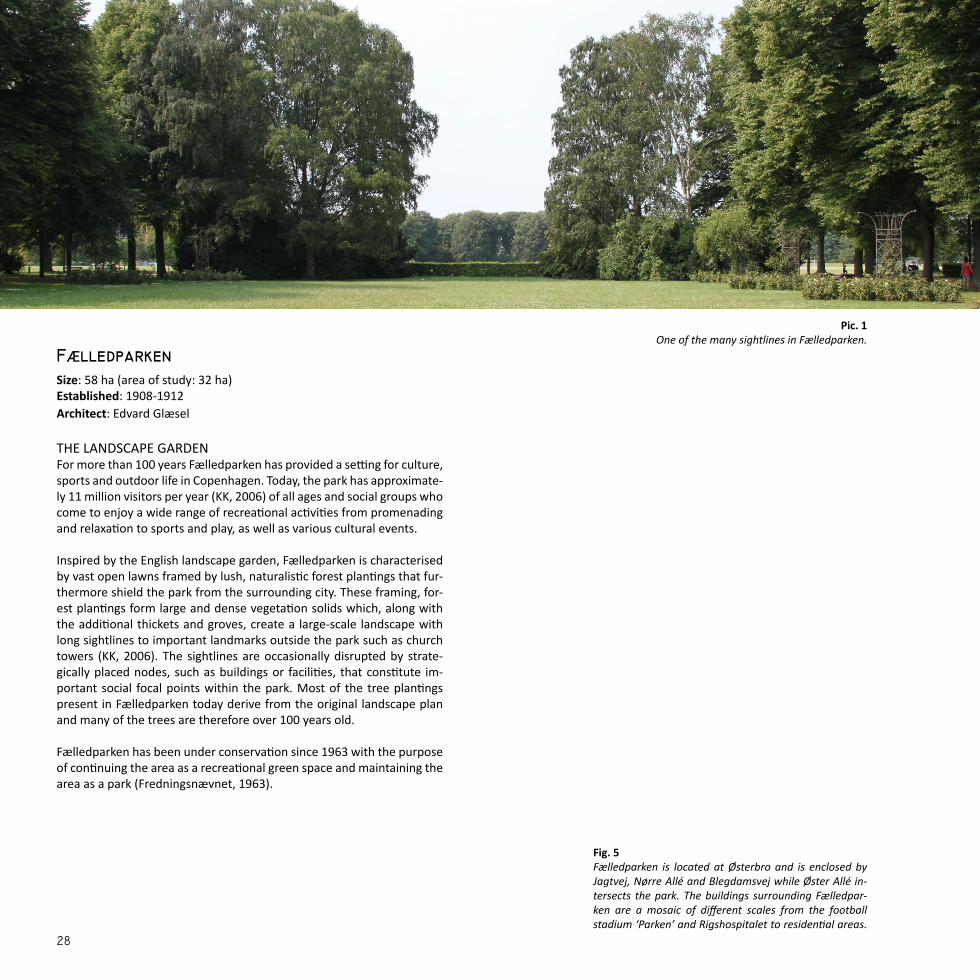
FÆlledparkenSize: 58 ha (area of study: 32 ha)Established: 1908-1912Architect: Edvard Glæsel
THE LANDSCAPE GARDENFor more than 100 years Fælledparken has provided a setting for culture, sports and outdoor life in Copenhagen. Today, the park has approximate-ly 11 million visitors per year (KK, 2006) of all ages and social groups who come to enjoy a wide range of recreational activities from promenading and relaxation to sports and play, as well as various cultural events.
Inspired by the English landscape garden, Fælledparken is characterised by vast open lawns framed by lush, naturalistic forest plantings that fur-thermore shield the park from the surrounding city. These framing, for-est plantings form large and dense vegetation solids which, along with the additional thickets and groves, create a large-scale landscape with long sightlines to important landmarks outside the park such as church towers (KK, 2006). The sightlines are occasionally disrupted by strate-gically placed nodes, such as buildings or facilities, that constitute im-portant social focal points within the park. Most of the tree plantings present in Fælledparken today derive from the original landscape plan and many of the trees are therefore over 100 years old.
Fælledparken has been under conservation since 1963 with the purpose of continuing the area as a recreational green space and maintaining the area as a park (Fredningsnævnet, 1963).
Pic. 1 One of the many sightlines in Fælledparken.
Fig. 5Fælledparken is located at Østerbro and is enclosed by Jagtvej, Nørre Allé and Blegdamsvej while Øster Allé in-tersects the park. The buildings surrounding Fælledpar-ken are a mosaic of different scales from the football stadium ‘Parken’ and Rigshospitalet to residential areas.

Parken
Øster Allé
Blegdam
svej
Frederik V’s Vej
Edel S
auntes A
llé
Brumleby
Rigshospitalet
Sports fields
Café
Playground
Playground
Playground
Trianglen
Lake
Københavns universitet
200 mN

EnghaveparkenSize: 3.6 haEstablished: 1929Architect: Poul Holsøe
THE URBAN GARDENEnghaveparken has been of significant local recreational value and the centre of social activities for many years and continues to be so with ap-proximately 1 mio. visitors a year (Tredje natur, 2014).
Enghaveparken has a typical neoclassical design with a strong symmetri-cal layout. The almost quadratic park is framed by a tall hedgerow and a line of trees. Within this frame an alley divides the park into six different rooms; a water garden, a perennial garden, a rose garden, a sports area, a play area, and a social area with a stage. The park has seen only a few changes since the establishment. The original elm alleys succumbed to the Dutch elm disease in the nineties and have since been replaced by Tilia x europaea and Robinia pseudoacacia (Lund, 2000).
Despite the epithet ‘park’, Enghaveparken has a defined horticultural character. The intimate scale, the various rooms and the distinct en-closed nature indicate that this is a place where something is grown. The water features, the lush and colourful vegetation and different garden rooms offer the opportunity of play, contemplation and relaxation. This is particularly valuable in a dense city environment such as Vesterbro, which has the lowest amount of green spaces per square kilometre in all of Copenhagen (Lund, 2000).
Enghaveparken has been under conservation since 1966. The conserva-tion ensures that the area is maintained as a public recreational green space and that it is managed as a park. No significant changes may be made to either terrain or vegetation which are not in tune with the func-tions of the park. (Fredningsnævnet, 1966).
Fig. 6Enghaveparken is located in Vesterbro. It is enclosed by Lyrskovgade, Ejderstedgade, Ny Carlsbergvej, and Eng-havevej with the adjoining green space Enghave Plads.
Pic. 2 The rose garden in Enghaveparken

Enghave Plads
Sports area
Playground
Paddling pool
Perennial garden
Rose garden
Scene
Lyrskovgade
Ny Carlsberg Vej
Ejde
rste
dgad
e
Engh
avev
ej
200 mN
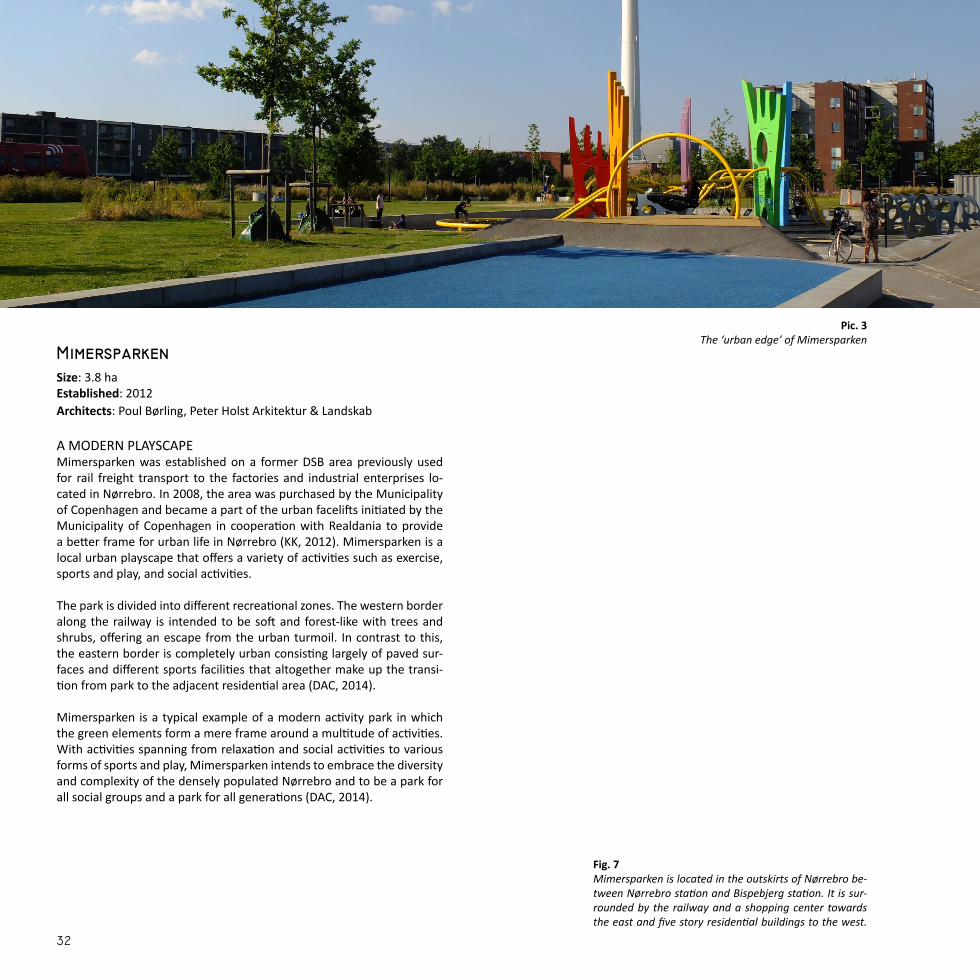
MimersparkenSize: 3.8 haEstablished: 2012Architects: Poul Børling, Peter Holst Arkitektur & Landskab
A MODERN PLAYSCAPE Mimersparken was established on a former DSB area previously used for rail freight transport to the factories and industrial enterprises lo-cated in Nørrebro. In 2008, the area was purchased by the Municipality of Copenhagen and became a part of the urban facelifts initiated by the Municipality of Copenhagen in cooperation with Realdania to provide a better frame for urban life in Nørrebro (KK, 2012). Mimersparken is a local urban playscape that offers a variety of activities such as exercise, sports and play, and social activities.
The park is divided into different recreational zones. The western border along the railway is intended to be soft and forest-like with trees and shrubs, offering an escape from the urban turmoil. In contrast to this, the eastern border is completely urban consisting largely of paved sur-faces and different sports facilities that altogether make up the transi-tion from park to the adjacent residential area (DAC, 2014).
Mimersparken is a typical example of a modern activity park in which the green elements form a mere frame around a multitude of activities. With activities spanning from relaxation and social activities to various forms of sports and play, Mimersparken intends to embrace the diversity and complexity of the densely populated Nørrebro and to be a park for all social groups and a park for all generations (DAC, 2014).
Fig. 7Mimersparken is located in the outskirts of Nørrebro be-tween Nørrebro station and Bispebjerg station. It is sur-rounded by the railway and a shopping center towards the east and five story residential buildings to the west.
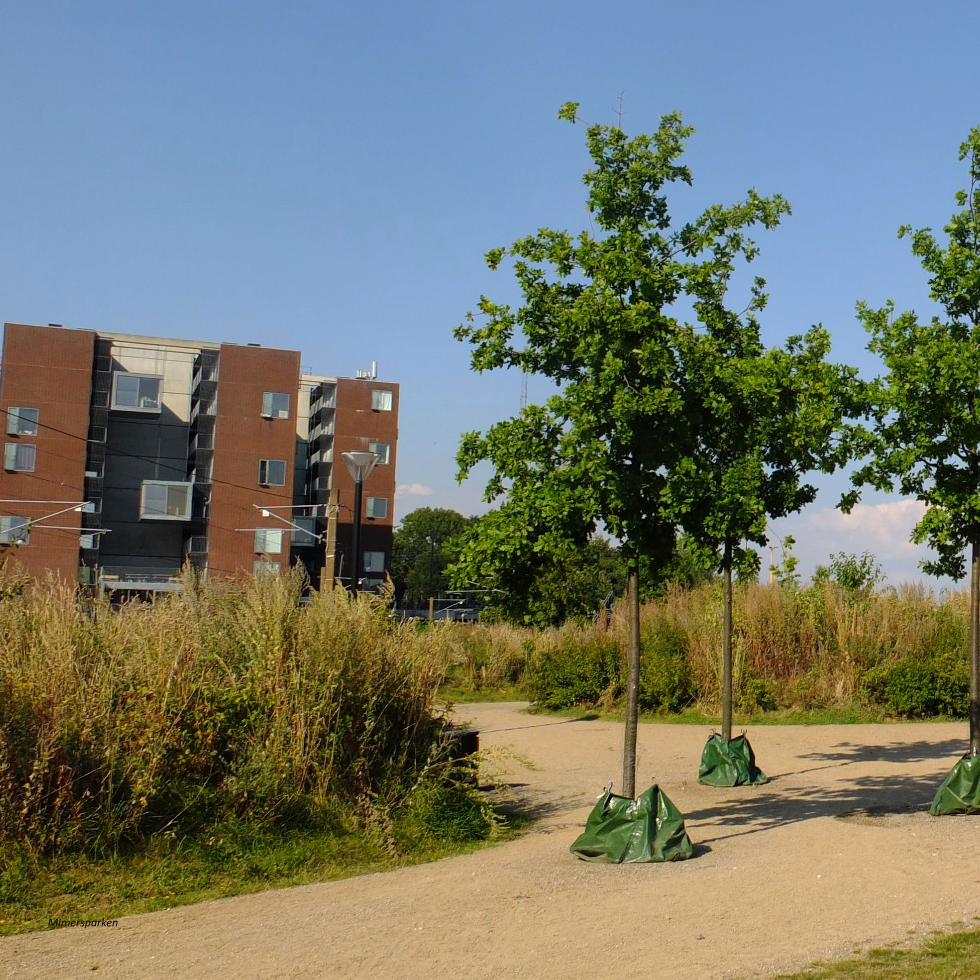
Pic. 3 The ‘urban edge’ of Mimersparken

Artificial turf
Nørrebro Bycenter
Playground
Sports area
Tagensvej
Bispebjerg st.
Mjølnerparken
200 mN

StejlepladsenSize: 3.2 haEstablished: 1945-1973
A WILDERNESS BY THE WATERStejlepladsen is a former part of Copenhagen Harbour that was filled up with soil, debris, and waste between 1945 and 1973, as the area was used as a dump yard from around 1950 (Eriksen, 1996). After 1973 the area was left to itself and natural succession set in (DN, 2012).
Up until the end of the 1980’s, Stejlepladsen was used by local fishermen to dry both fishing nets and fish. Today, the area is still occasionally used to handle fishing nets, but above all it is a green space where the locals gather for the annual Midsummer’s Eve bonfire (DN, 2012).
Stejlepladsen has been declared a valuable landscape and is in-cluded in the important cultural environments of Copenhagen (KK, 2011a). An application for conservation of Stejlepladsen and the adjacent nature area of Sydhavnstippen was submitted in 2012, but the application was denied (Fredningsnævnet, 2014).
Fig. 8Stejlepladsen is located in Sydhavnen close to the na-ture area Sydhavnstippen and is surrounded by two marinas, residential housing and an industrial area.
Pic. 4 Meadow and sporadic trees and shrubs in Stejlepladsen
Sydhavnstippen
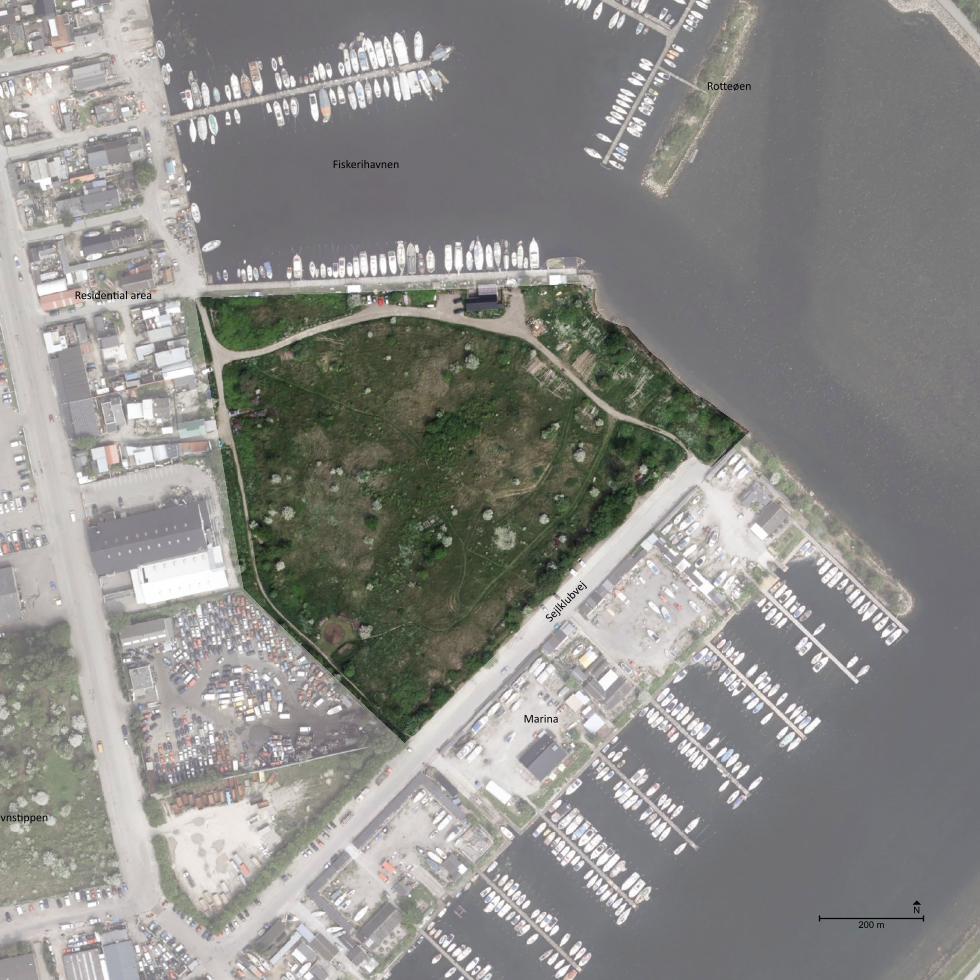
Sydhavnstippen
Residential area
Fiskerihavnen
Rotteøen
Sejlk
lubvej
Marina
200 mN

NordhavnstippenSize: 9 haEstablished: 1950-2000
A NATURAL SANCTUARYNordhavnen was constructed by landfill from the late 1880’s and on-wards in order to accommodate Copenhagen’s expanding harbour and shipping industry (By & Havn, 2015). The majority of Nordhavnen was filled between 1950 and 2000 (By & Havn, 2008).
Nordhavnstippen was developed during the last 40 years with the in-tention of including the area in future harbour activities. Between the 1980’s and the 1990’s the area was more or less left to itself, until it from 1995-2000 was completely closed off as a construction site for continu-ing landfill projects (DOF, 2015; Eriksen, 1996).
Nordhavnstippen is a large-scale, open landscape of wasteland charac-ter with spontaneous vegetation mainly consisting of extensive grass-land and thickets. Apart from sheep grazing in one half of the area, no maintenance is carried out and the flora and fauna has occurred spon-taneously. The area is included in many migration routes and is used as both a resting and breeding area for birds. Two hundred bird species and rare moths have been observed (By & Havn, 2008) as well as the pro-tected European green toad (Bufo viridis) which has inhabited the two constructed lakes at Nordhavnstippen (DN, 2015). The area has no recreational facilities such as paths, lighting, benches, etc. Nevertheless, the area is often used by e.g. birdwatchers, anglers, and dog owners (DOF, 2015).
Fig. 9Nordhavnstippen is located in the northeastern part of the Nordhavn peninsula in Copenhagen Harbour. The area is enclosed by Nordsøvej and Kattegat-vej together with the industrial area of the harbour.
Pic. 5 Trodden path through the landscape at Nordhavnssippen

Industrial area
Københavns Miljøcenter
Nordsøvej
Katte
gatv
ejØresund
100 mN

AmagerbanenSize: 3.1 haEstablished: 1907Abandoned: 1991
FULL STEAM ON NATURAL SUCCESSIONThe original 12 km railway was established in 1907 as a private line for passengers and freight between Amagerbro and Dragør. The railway was shut down in 1991 from which point on all maintenance ceased and spontaneous vegetation was allowed to cover the tracks (Petersen 2015). Today, only the northern part of the abandoned railway line can still be seen as a green curve that runs through the urban landscape. Amagerbanen has no specific function, but due to the long and narrow shape it has become a local transit zone and is mainly used for dog walk-ing.
Fig. 10The remains of Amagerbanen are located in the northern part of Amager. It is surrounded by Up-landsgade and Ved Amagerbanen as well as al-lotment gardens, residential buildings, indus-try, and the extensive lawns of Kløvermarken.
Pic. 6 Tunnel of Prunus ceracifera enclosing the tracks of Amagerbanen

Kløvermarken
Uplandsgade
Vermlandsgade
Prags Blvd.
Ved Amagerbanen
200 mN

Stejlepladsen

Methodology

As previously established, biodiversity is a multifaceted and complex matter spanning levels from genes and species to habitats and ecosys-tems (Noss, 1990; Raven, 1992), with each level containing various com-positional, structural, and functional aspects (Noss, 1997). Often, bio-diversity assessments focus on one specific taxonomic group (Hermy & Cornelis, 2004, Farinha-Marques et al., 2011). However, this gives a very limited perspective on biodiversity. This study employed a modified version of an ecological method devel-oped by Hermy & Cornelis (2000) to monitor biodiversity within urban and suburban parks. The original method was developed to consider more aspects of biodiversity and as such, it works along two lines; habi-tat diversity and species diversity (Fig. 11). While the original method by Hermy & Cornelis (2000) gives a relatively thorough account of biodiver-sity, it does not consider vegetation structure, which has shown to have significant positive relations to biodiversity (Qiu et al., 2010). The aspect of vegetation structure was therefore incorporated according to Qiu et
Urban biodiversity assessment
Biodiversity assessment
Planar elements
Linear elements
Punctual elements
Terrestrialinvertebrates
Vascular plants
Habitat diversity Species diversity
0.3 m
2 m
8 m
4. Upper canopy layer
3. Lower canopy layer
2. Shrub layer
1. Herb layer
Fig. 12The vertical distribution of the 4 layers of vegetation within a tree stand. Adapted from: Warncke (2008).
Fig. 11Structure of the method showing the five main biodiversity indicators.
al. (2010) to ensure a more nuanced assessment of biodiversity within each of the six case areas.
To simplify matters, species diversity was determined for just two dif-ferent species groups; vascular plants and terrestrial invertebrates. Re-search shows that invertebrates are a viable indicator for biodiversity as they are abundant, easy to sample, and sensitive to environmental changes. Furthermore, as invertebrates constitute a lower part of the food chain, they affect the presence of other species of higher trophic levels (McIntyre, 2000 referenced in Jones & Leather, 2012; Willand et al., 2011). The principle of the method was as follows:

HABITAT DIVERSITY
HABITAT UNIT INDEXHabitat diversity was determined from a pre-determined index of habi-tat units (see appendix 1) designed to map elements typically found in urban green spaces in Copenhagen which are considered to have some degree of ecological value. The index consists of 164 habitat units divid-ed into 62 planar, 77 linear, and 25 punctual elements. Planar elements cover features such as forest, grassland, and water bodies and are ex-pressed in area (m2). Linear elements possess a length/width ratio larger than 10 and include alleys, hedges, watercourses, etc. Linear elements are expressed in total length (m). Punctual elements are expressed in numbers and comprise features such as single trees or shrubs with cov-erage up to 100 m2, after which they are defined as planar elements. The only exception is solitary trees which are always considered punctual elements.
BIOTOPE MAPPING For each of the six case areas the various habitat units corresponding to the habitat unit index were mapped in the field and subsequently digit-ised using GIS. Thereafter, data sets displaying the distribution and total cover of the digitised habitat units were generated. A Shannon diversity index (H) was calculated to determine the habitat diversity for planar, linear, and punctual elements.
=
= −∑1
lns
i i
i
n nHN N
= − =max maxmax
1ln lnH ss
Where i is the ith habitat unit, s the number of habitat units, ni the area, length or number of the ith habitat unit, N the total area, length or num-ber in the park.
A Shannon diversity index is not very informative on its own. Therefore a saturation index, i.e. the ratio between the calculated diversity indices and the maximum potential diversity was calculated. The maximum po-tential diversity (Hmax) is reached when all habitat units featured in the index are present and they all have the same area, length or number (Table 1).
Where smax is the total number of distinguished habitat units. The saturation index H/Hmax x 100 expresses the diversity as a percentage of the maximum diversity for planar, linear, and punctual units respec-tively.
Maximum no. (s) Hmax = ln s
Planar elements 62 4.13
Linear elements 77 4.34
Punctual elements 25 3.22
Table 1. Maximum potential Shannon diversity index (Hmax) for the three categories of habitat units.

The total saturation index (St) for all habitat units combined was deter-mined as the weighted average of the three indices for planar, linear, and punctual elements.
+ += pl pl li li pu pu
tt
S n S n S nS
n
Where Spl is the saturation index for planar elements, npl the number of planar elements, Sli the saturation index of linear elements, nli the num-ber of linear elements, Spu the saturation index for punctual elements, npu the number of punctual elements, and nt the total number of habitat units. TRANSECT SURVEYIn order to include the important aspect of vegetation structure in the assessment of species diversity, transect diagrams were employed. This is an analytical tool derived from the field of landscape architecture which is appropriate for displaying the spatial configuration of vegeta-tion. Along these transects, the assessment of species diversity would also be carried out.
The main criteria for the layout of the transects was that they should intersect the most characteristic landscape elements of each case area. In order to identify these characteristics, the data sets from the habitat diversity assessment were used once more. Initially, all mapped habi-tat units which were abiotic elements, e.g. gravel surface and hardened paths, in which it would not be possible to determine species diversity of vascular plants and invertebrates, were discarded. Subsequently, the most frequent and abundant habitat units for each case area were se-lected as they also represented the characteristic landscape elements of these areas. Transects were then pre-positioned on the biotope maps to intersect as many of the characteristic habitat units as possible. The transects had a length of 25 m or 50 m, comprising a total of 100 m per case area. This was appropriate both in terms of covered area and avail-able time for registrations.
Along the transects, 3 plots of 4m2 were to be used for registration of herbaceous vegetation and collection of associated invertebrate fauna. The position of the plots were determined according to the frequency of herbaceous vegetation elements. For example, if a case area comprised more lawn than meadow the majority of the plots would be placed in lawn. Additionally, spots within open and enclosed vegetation elements as well as edge zones were marked out for the collection of ground dwelling invertebrates. Following the initial preparations, the transect survey was finally carried out. In the field, a measuring tape was drawn out according to the posi-tion of the transects. Subsequently, the proportions of each individual tree or shrub of a height above 50 cm from the ground that either di-rectly intersected the measuring tape or were situated maximum 1 m away was noted.
SPECIES DIVERSITY COLLECTION OF INVERTEBRATESThe collection of invertebrates took place during the course of two consecutive weeks in late May and early June. Collections were com-pleted on dry days with stable temperature and wind conditions. A total of three different sampling methods were employed to attain samples across different vertical structures. A bottom-up sampling approach was applied to ensure that inverte-brates in the field layer were not disturbed while collecting invertebrates at higher levels. Hence, invertebrates were first collected from the field layer with a sweep net. Following this, invertebrates were collected with a beating tray by beating branches of all the woody vegetation up to 2 metres that had previously been registered along the registration tran-sects. All collections were conducted following a standardised procedure in each area. Branches of woody vegetation were beaten 5 times per individual tree or shrub, while 16 sweeps were performed in each of

=
= −∑1
lni iw
i
n nHN N
=
= −∑1
lni ih
i
n nHN N
=
= −∑1
lni ii
i
n nHN N
the 3 plots of 4 m2. The invertebrates were quickly transferred to closed containers by means of an aspirator to prevent loss of specimens and subsequently frozen. As a supplement to invertebrates collected with sweep net and beating tray, 4 pitfall traps were placed at the marked spots within open and en-closed vegetation as well as in edge zones. The pitfall traps were regular plastic containers filled a quarter up with water and a drop of detergent to break the surface tension and ensure trapping. The pitfall traps were placed in the ground with the rim flush with the ground surface, covered with a protective lid and left for seven consecutive days. All collected specimens from the three different sampling methods were counted and identified to family level by a specialist. Additionally, the number of morphospecies within each family was noted. Due to time limitations involved in identifying invertebrates, the taxonomic classifi-cation of species called for a conservative approach in which differen-tiation between species was omitted when individuals within the same family bore near identical resemblance to one another. Consequently, this resulted in a fairly coarse taxonomic resolution which translates as a conservative estimate of invertebrate diversity. To determine diversity of invertebrates a Shannon diversity index was calculated for each pitfall trap, 4 m2 plot, and all intersected woody veg-etation.
Where i is the ith invertebrate species, ni the number of individuals of the ith invertebrate species, and N the total number of individuals.
REGISTRATION OF VASCULAR PLANTSThe registration of vascular plants took place over two consecutive weeks in mid June. All registered woody plants along the transects were identified to species level following Jensen & Jacobsen (2003) and Moss-berg & Stenberg (2014).
Within the 3 predetermined plots of 4 m2 for the registration of herba-ceous vegetation, a 1 m2 quadrat frame divided into 25 subquadrats was laid out end to end four times. All plants within the frame were identified to species level, and in some cases to genus level, following Mossberg & Stenberg (2014), Frederiksen et al. (2006), and Schou et al. (2014) and their respective abundance was registered in terms of percentage cover. Subsequently, two sets of Shannon diversity indices for woody vegeta-tion (Hw) were calculated for: all woody vegetation along each registra-tion transect and all individual habitat units containing woody vegeta-tion along the registration transects
Where i is the ith plant species, ni the number of individuals of the ith plant species, and N the total number of individuals of all woody plant species.
Similarly, a Shannon diversity index for herbaceous vegetation (Hh) for each 4 m2 plot was calculated.
Where i is the ith plant species, ni the cover of individuals of the ith plant species, and N the total cover of individuals of all herbaceous plant spe-cies.
DATA ANALYSISThe data was analysed by incorporating the different layers of informa-tion on top of the transect diagrams.
For all intersected habitat units containing vegetation the previously calculated Shannon diversity indices were applied as a curve. For the intersected habitat units comprising herbaceous vegetation, e.g. lawn and meadow, the diversity index incorporated in the curve was adopted from a corresponding 4 m2 plot. For example, if a 4 m2 plot was placed in lawn, the diversity index of this particular plot was used as a proxy for all intersected lawns elsewhere on the transects within the given case area. Furthermore, if two habitat units overlapped on the transect diagram, such as when lawn was present underneath solitary trees, the highest diversity index of the two habitat units was applied to the curve. The distribution of vertical layers of vegetation were determined according to Fig. 12.
In addition, the diversity indices for the collections of invertebrates ob-tained from each individual pitfall trap and 4 m2 plot were added to the transect diagrams in the form of bars. The diversity index for collections sampled from woody vegetation was applied as a uniform line express-ing the total diversity of invertebrates sampled from all woody plants along the entire transect, as we did not obtain individual collections from each specific habitat unit.
Consequently, the transect diagrams displayed the relation between the spatial configuration of vegetation and the diversity of vascular plants and invertebrates (Fig. 13).
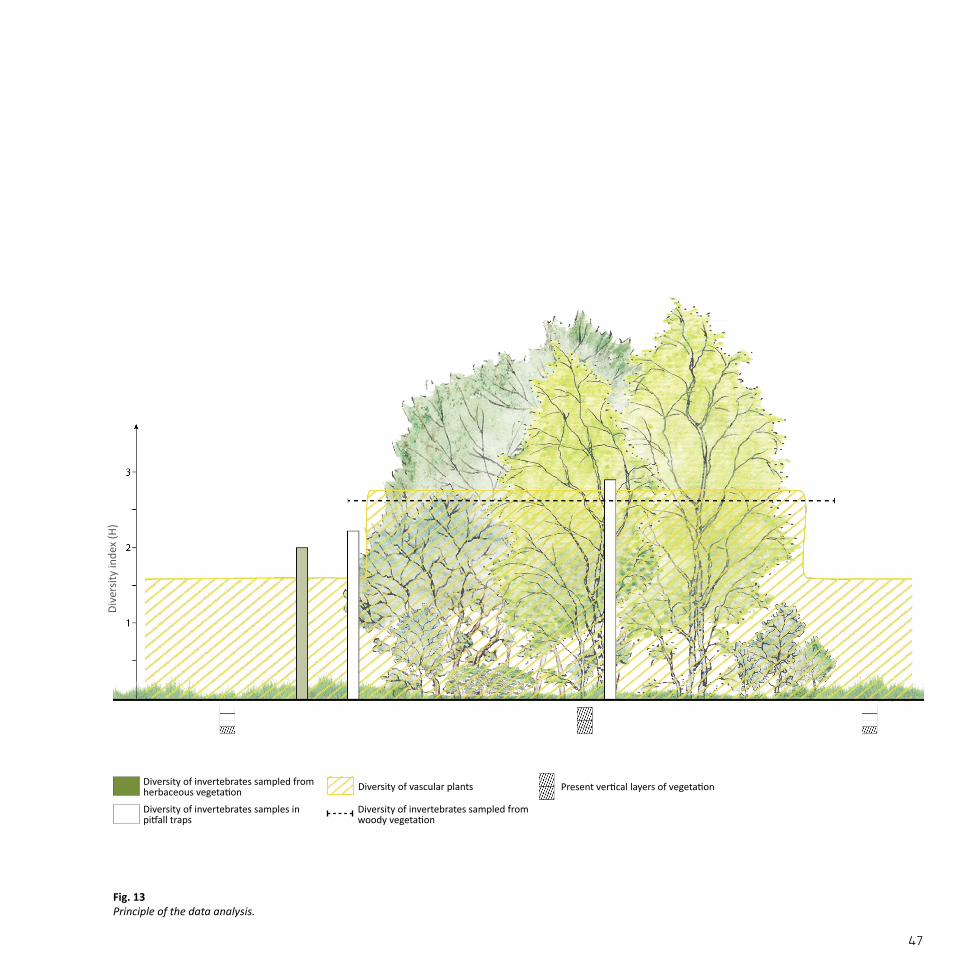
Fig. 13Principle of the data analysis.
Dive
rsity
inde
x (H
)
Diversity of invertebrates sampled from herbaceous vegetation
Diversity of invertebrates sampled from woody vegetation
Present vertical layers of vegetation
Diversity of invertebrates samples in pitfall traps
Diversity of vascular plants
Mimersparken

Results

Fig. 14Planar units
100 mN
The planar elements comprised 30.5 ha of the total park area of 32 ha. Lawn (113), sports field (115), grove (124) and multi-layered, deciduous tree stands with a canopy cover of 30-80% (135) were the most abun-dant units.
All linear elements amounted to 9.374 m in total. Most abundant were path <2m not hardened (41), path >2m not hardened (43), lawn (52), and vegetated slope 10-30% (34).
Of the 15 punctual elements cobblestone surface (2), boulders (3), veg-etated mound (11), single tree or shrub (22), and cluster of trees and/or shrubs (23) were the most abundant units.
HABITAT DIVERSITYFor full results see appendix 2.1.
Habitat elements
No. of habitat units Diversity index (H) Saturation index
Planar 23 1.86 45%
Linear 19 1.97 45%
Punctual 15 2.31 72%
Total 57 2.02 52%
Table 2. Summarised results of the habitat diversity assessment
FÆlledparken

Fig. 15Linear units.
Fig. 16Punctual units.
100 mN
100 mN
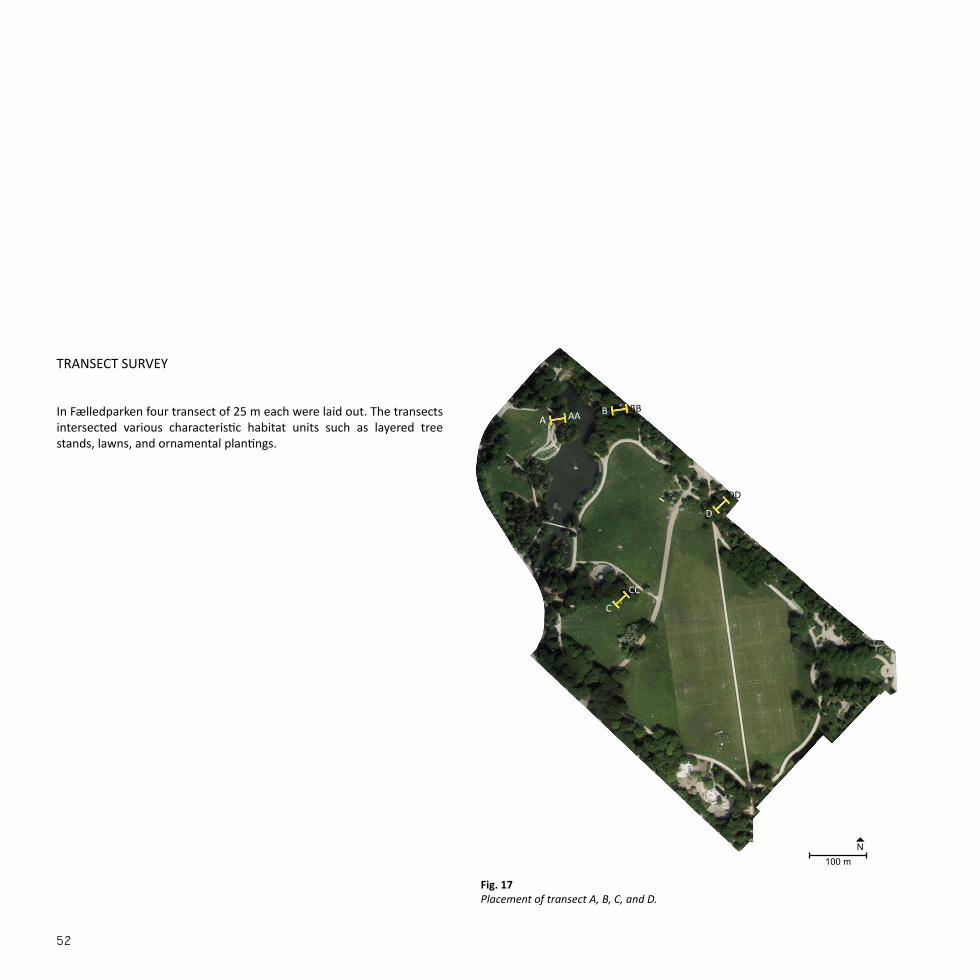
In Fælledparken four transect of 25 m each were laid out. The transects intersected various characteristic habitat units such as layered tree stands, lawns, and ornamental plantings.
TRANSECT SURVEY
Fig. 17Placement of transect A, B, C, and D.
A AA B BB
C
CC
D
DD
100 mN

Fælledparken
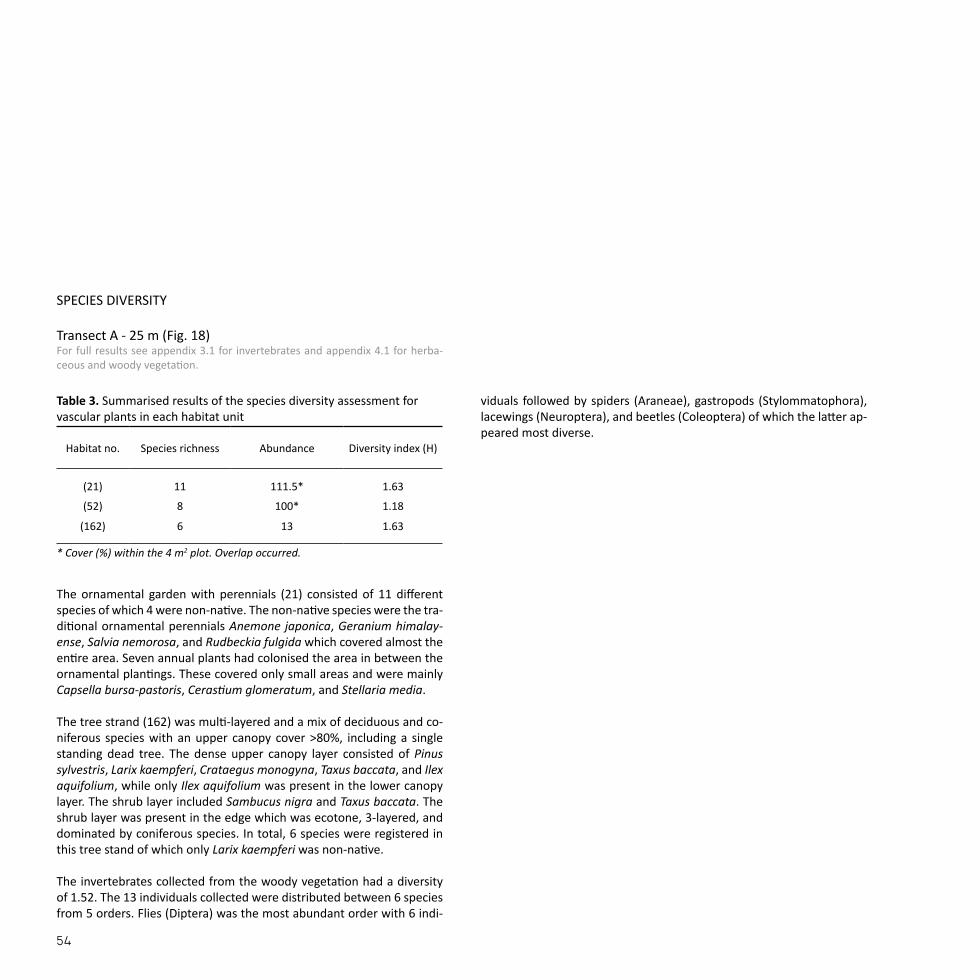
The ornamental garden with perennials (21) consisted of 11 different species of which 4 were non-native. The non-native species were the tra-ditional ornamental perennials Anemone japonica, Geranium himalay-ense, Salvia nemorosa, and Rudbeckia fulgida which covered almost the entire area. Seven annual plants had colonised the area in between the ornamental plantings. These covered only small areas and were mainly Capsella bursa-pastoris, Cerastium glomeratum, and Stellaria media. The tree strand (162) was multi-layered and a mix of deciduous and co-niferous species with an upper canopy cover >80%, including a single standing dead tree. The dense upper canopy layer consisted of Pinus sylvestris, Larix kaempferi, Crataegus monogyna, Taxus baccata, and Ilex aquifolium, while only Ilex aquifolium was present in the lower canopy layer. The shrub layer included Sambucus nigra and Taxus baccata. The shrub layer was present in the edge which was ecotone, 3-layered, and dominated by coniferous species. In total, 6 species were registered in this tree stand of which only Larix kaempferi was non-native. The invertebrates collected from the woody vegetation had a diversity of 1.52. The 13 individuals collected were distributed between 6 species from 5 orders. Flies (Diptera) was the most abundant order with 6 indi-
SPECIES DIVERSITY
Transect A - 25 m (Fig. 18)For full results see appendix 3.1 for invertebrates and appendix 4.1 for herba-ceous and woody vegetation.
viduals followed by spiders (Araneae), gastropods (Stylommatophora), lacewings (Neuroptera), and beetles (Coleoptera) of which the latter ap-peared most diverse.
Habitat no. Species richness Abundance Diversity index (H)
(21) 11 111.5* 1.63
(52) 8 100* 1.18
(162) 6 13 1.63
Table 3. Summarised results of the species diversity assessment for vascular plants in each habitat unit
* Cover (%) within the 4 m2 plot. Overlap occurred.

Fig. 18Transect A - 25 m. The diversity index of the grass strip (H=1.18) was adopted from plot 2 in transect C (Fig. 20) in Fælledparken.
H=1.52
Dive
rsity
inde
x (H
)
Ornamental garden, perennials (21)
A
1
2
3
AA
Grass strip (52)
Path(43)
Tree stand mixed >80%, multilayered (162)
Diversity of invertebrates sampled from herbaceous vegetation
Diversity of invertebrates sampled from woody vegetation
Present vertical layers of vegetation
Diversity of invertebrates samples in pitfall traps
Diversity of vascular plants

The tree stand (159) was multi-layered and a mix of deciduous and co-niferous species with an upper canopy cover of 30-80%. The moderately dense upper canopy layer consisted of one single species; Fagus sylvat-ica. The lower canopy layer and shrub layer were dominated by a wider range of species such as Acer campestre, Crataegus monogyna, Ulmus glabra, Ribes alpinum, Prunus domestica, and Sambucus nigra. In total, 8 different species were registered within the tree stand of which only Prunus domestica was non-native. Together, the upper canopy layer and lower shrub layer formed an ecotone, 2-layered edge towards the path.
The invertebrates collected from pitfall trap 1 placed within this tree stand had a diversity index of 1.93. The collection comprised 77 indi-viduals distributed between 16 species from 8 orders. With 28 individu-als crustaceans (Isopoda) was the most abundant order closely followed by harvestmen (Opiliones) with 23 individuals. The most diverse orders were beetles (Coleoptera) with 8 individuals and 5 species, followed by flies (Diptera) with 7 individuals and 4 species. On the other side of the path was a two-layered, deciduous tree stand (134) with a canopy cover of 30-80%. The relatively open lower canopy layer included only Quercus robur while the non-native species Sym-
SPECIES DIVERSITY
Transect B - 25 m (Fig. 19)For full results see appendix 3.1 for invertebrates and appendix 4.1 for herba-ceous and woody vegetation.
phoricarpos albus constituted the dense shrub layer. The invertebrates sampled in pitfall trap 2 placed in the edge of this tree stand scored a diversity index of 2.44. The collection comprised 41 individuals distrib-uted between 15 species from 8 orders. The most abundant and diverse orders were crustaceans (Isopoda) with 13 individuals and 3 species followed by spiders (Araneae) with 10 individuals and 3 species, subse-quently followed by beetles (Coleoptera) with 5 individuals and 3 spe-cies.
The collection of invertebrates sampled from all registered woody vege-tation scored a diversity index of 3.32. The 102 sampled individuals were distributed between 49 species from 11 orders and one class. The most abundant order, and also the most diverse, was true bugs (Hemiptera) with 38 individuals and 9 species followed by flies (Diptera) and spiders (Araneae), respectively.
Habitat no. Species richness Abundance Diversity index (H)
(52) 8 100* 1.18
(134) 2 3 0.64
(159) 8 17 1.92
Table 4. Summarised results of the species diversity assessment for vascular plants in each habitat unit
* Cover (%) within the 4 m2 plot.
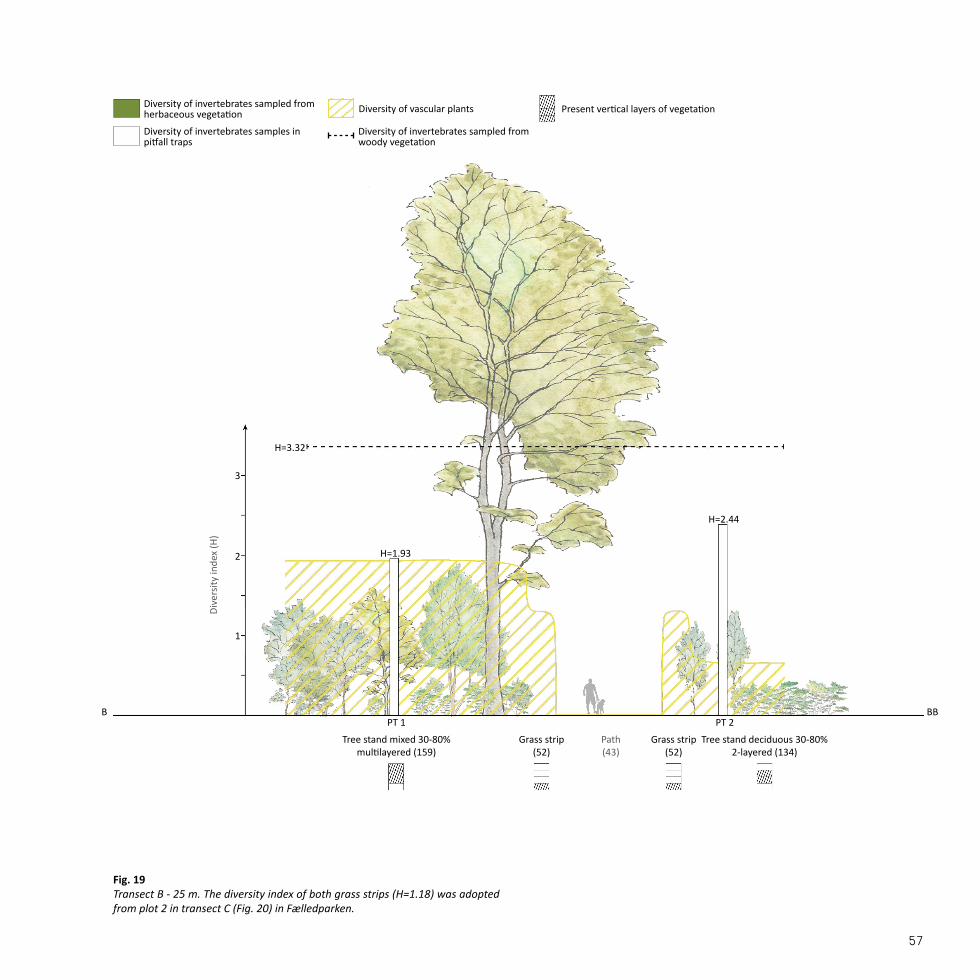
Fig. 19Transect B - 25 m. The diversity index of both grass strips (H=1.18) was adopted from plot 2 in transect C (Fig. 20) in Fælledparken.
H=3.32
Dive
rsity
inde
x (H
)
Tree stand mixed 30-80%multilayered (159)
Grass strip (52)
H=1.93
PT 1
H=2.44
PT 2
Path(43)
Grass strip (52)
Tree stand deciduous 30-80%2-layered (134)
B BB
1
2
3
Diversity of invertebrates sampled from herbaceous vegetation
Diversity of invertebrates sampled from woody vegetation
Present vertical layers of vegetation
Diversity of invertebrates samples in pitfall traps
Diversity of vascular plants
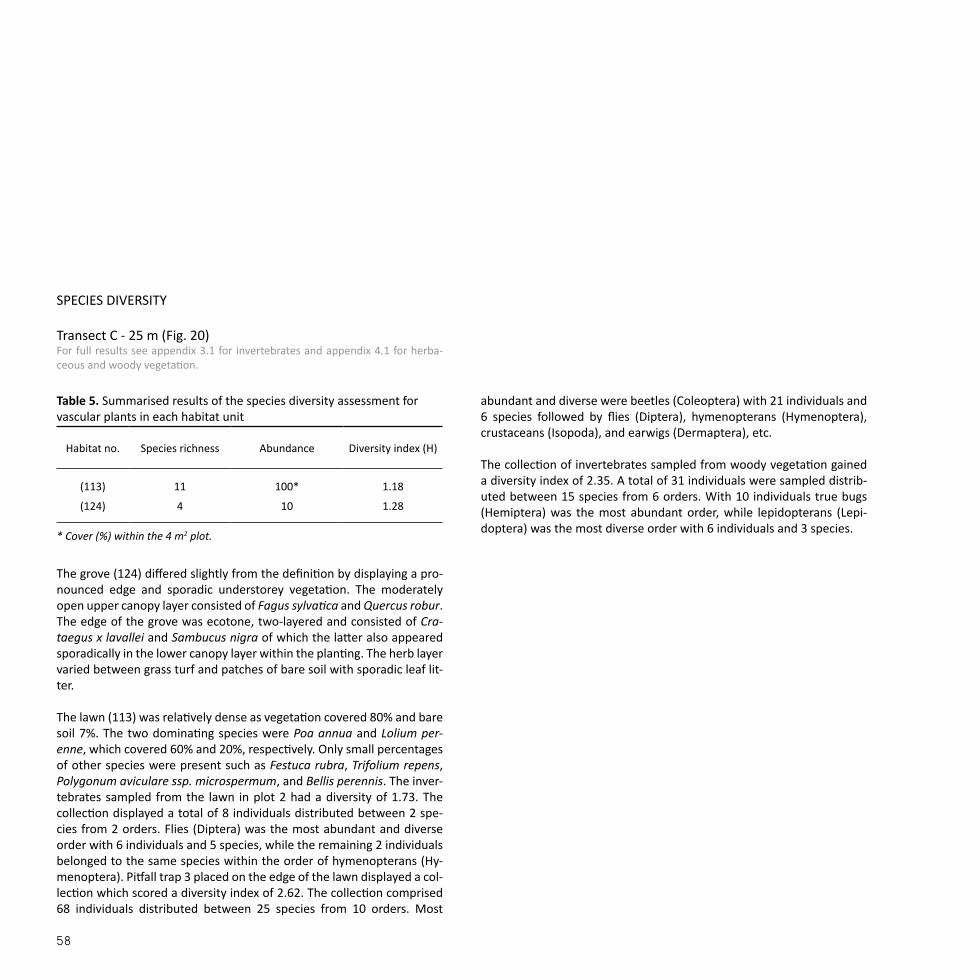
The grove (124) differed slightly from the definition by displaying a pro-nounced edge and sporadic understorey vegetation. The moderately open upper canopy layer consisted of Fagus sylvatica and Quercus robur. The edge of the grove was ecotone, two-layered and consisted of Cra-taegus x lavallei and Sambucus nigra of which the latter also appeared sporadically in the lower canopy layer within the planting. The herb layer varied between grass turf and patches of bare soil with sporadic leaf lit-ter.
The lawn (113) was relatively dense as vegetation covered 80% and bare soil 7%. The two dominating species were Poa annua and Lolium per-enne, which covered 60% and 20%, respectively. Only small percentages of other species were present such as Festuca rubra, Trifolium repens, Polygonum aviculare ssp. microspermum, and Bellis perennis. The inver-tebrates sampled from the lawn in plot 2 had a diversity of 1.73. The collection displayed a total of 8 individuals distributed between 2 spe-cies from 2 orders. Flies (Diptera) was the most abundant and diverse order with 6 individuals and 5 species, while the remaining 2 individuals belonged to the same species within the order of hymenopterans (Hy-menoptera). Pitfall trap 3 placed on the edge of the lawn displayed a col-lection which scored a diversity index of 2.62. The collection comprised 68 individuals distributed between 25 species from 10 orders. Most
SPECIES DIVERSITY
Transect C - 25 m (Fig. 20)For full results see appendix 3.1 for invertebrates and appendix 4.1 for herba-ceous and woody vegetation.
abundant and diverse were beetles (Coleoptera) with 21 individuals and 6 species followed by flies (Diptera), hymenopterans (Hymenoptera), crustaceans (Isopoda), and earwigs (Dermaptera), etc.
The collection of invertebrates sampled from woody vegetation gained a diversity index of 2.35. A total of 31 individuals were sampled distrib-uted between 15 species from 6 orders. With 10 individuals true bugs (Hemiptera) was the most abundant order, while lepidopterans (Lepi-doptera) was the most diverse order with 6 individuals and 3 species.
Habitat no. Species richness Abundance Diversity index (H)
(113) 11 100* 1.18
(124) 4 10 1.28
Table 5. Summarised results of the species diversity assessment for vascular plants in each habitat unit
* Cover (%) within the 4 m2 plot.

Fig. 20Transect C - 25 m.
H=2.35
Dive
rsity
inde
x (H
)
Grove (124)
H=2.62
H=1.73
PT 3Plot 2
Lawn (113)
C CC
1
2
3
Diversity of invertebrates sampled from herbaceous vegetation
Diversity of invertebrates sampled from woody vegetation
Present vertical layers of vegetation
Diversity of invertebrates samples in pitfall traps
Diversity of vascular plants

In the deciduous and multi-layered tree stand with a canopy cover of 30-80% the upper canopy layer consisted of Carpinus betulus, Ulmus glabra, Acer campestre, Crataegus monogyna, and Acer platanoides. The lower canopy layer consisted of Sambucus nigra, Ligustrum ovalifolium, Ulmus glabra, and Acer campestre, while the shrub layer mainly included Ribes alpinum and Crataegus monogyna. Of these 8 registered species only Ligustrum ovalifolium was non-native. The herb layer with a diversity of 1.29 was dominated by Hedera helix which covered 55% of the registra-tion plot. Leaf litter covered approximately 30% while seven additional species covered smaller percentages. Among them were species such as Aegopodium podagraria, Anemone nemorosa, Geum urbanum, and Corydalis cava, of which the latter dominated with a cover of 7%. Of the 8 species present in the plot only Aegopodium podagraria was non-native, yet naturalised.
The invertebrates collected in pitfall trap 4 within this tree stand had a diversity index of 2.94. The collection comprised 42 individuals distrib-uted between 22 species from 9 orders. The most abundant and diverse order was beetles (Coleoptera) with 17 individuals and 6 species, fol-lowed by flies (Diptera) and spiders (Araneae). The rest of the individu-als were distributed on orders such as springtails (Entomobryomorpha), harvestmen (Opiliones) and crustaceans (Isopoda).
SPECIES DIVERSITY
Transect D - 25 m (Fig. 21)For full results see appendix 3.1 for invertebrates and appendix 4.1 for herba-ceous and woody vegetation.
The invertebrates sampled from all registered woody vegetation scored a diversity index of 2.21. The collection comprised 59 individuals distrib-uted between 18 species from 7 orders. Most abundant was the order lepidopterans (Lepidoptera) with 27 individuals. The most diverse order was true bugs (Hemiptera) with 11 individuals and 4 species, followed by beetles (Coleoptera) and spiders (Araneae).
Habitat no. Species richness Abundance Diversity index (H)
(135) 8 25 1.97
Table 6. Summarised results of the species diversity assessment for vascular plants in each habitat unit

Fig. 21Transect D - 25 m.
Dive
rsity
inde
x (H
)
Tree stand deciduous 30-80%, multilayered (135)
H=2.94
H=2.21
PT 4D DD
1
2
3
Diversity of invertebrates sampled from herbaceous vegetation
Diversity of invertebrates sampled from woody vegetation
Present vertical layers of vegetation
Diversity of invertebrates samples in pitfall traps
Diversity of vascular plants

Table 8. Summarised results for registered vascular plants in Fælledparken
Table 7. Summarised results for the collected invertebrates in Fælledparken
* Cover (%) within the 4 m2 plot. Overlap occurred.
Samples from pitfall traps Samples from vegetation
PT 1 PT 2 PT 3 PT 4 Transect A Transect B Transect C Transect D Plot 2
Species richness 16 15 25 22 6 49 15 18 6
Abundance 77 41 68 42 13 102 31 59 8
Diversity index (H) 1.93 2.44 2.62 2.94 1.52 3.32 2.35 2.21 1.73
Transect A Transect B Transect C Transect D
Woody plants Herbaceous plantsPlot 1 Woody plants Woody plants Herbaceous plants
Plot 2 Woody plants Herbaceous plants Plot 3
Species richness 6 11 10 4 8 8 9
Abundance 13 111.50* 20 10 100* 25 106,00*
Diversity index (H) 1.63 1.63 2.15 1.28 1.18 1.97 1.29

DISCUSSIONThe spatial configuration of vegetation within Fælledparken showed that structurally more complex vegetation types promote higher biodiversity. This was in particular evident in the tree stands, as multiple layers of vegetation generally resulted in a higher diversity of vascular plants and invertebrates.
It was noted that the tree stand (135) in transect D comprised the high-est diversity of vascular plants closely followed by the tree stand (159) in transect B. Both of these were multi-layered, moderately dense and thereto mainly consisted of deciduous species. The large amount of na-tive species could account for the diverse assemblages of herbivorous invertebrates collected from the woody vegetation (Kennedy & South-wood, 1984; Burghardt & Tallamy, 2013). In addition, the abundance of Acer campestre, Crataegus monogyna, Ribes alpinum, and Lonicera xylosteum in both tree stands could have contributed further to the di-verse assemblages as these species are valuable resources for many pol-linating insects (Halstead, n.d.; Kirk & Howes, 2012).
The small number of invertebrates collected from the tree stand (162) in transect A suggested a negative response of invertebrate fauna to ev-ergreen vegetation, and possibly to the species Taxus baccata and Ilex aquifolium in particular (Helden, 2012).
The most diverse collection of ground dwelling invertebrates was ob-tained from pitfall trap 4 placed in the multi-layered tree stand (135) in transect D. This suggests that presence of a herb layer has significant effects on ground dwelling invertebrates (Magura et al., 2001). Addi-tionally, the many trodden paths within this tree stand may also have contributed to the rich assemblage of ground dwelling invertebrates as it increases habitat heterogeneity (Magura et al., 2001; Koivula, 2003 referenced in Noreika, 2011).
It was further noted, that pitfall trap 3 placed in the edge between the grove (124) and the lawn (113) displayed a relatively abundant assem-blage of ground beetles (Coleoptera: Carabidae). This could be due to the difference in adjoining habitat structures of dense shrub and open swards (Magura et al., 2001), but it may especially be related to the open sward which increases the activity of ground beetles (Noordijk, 2010).
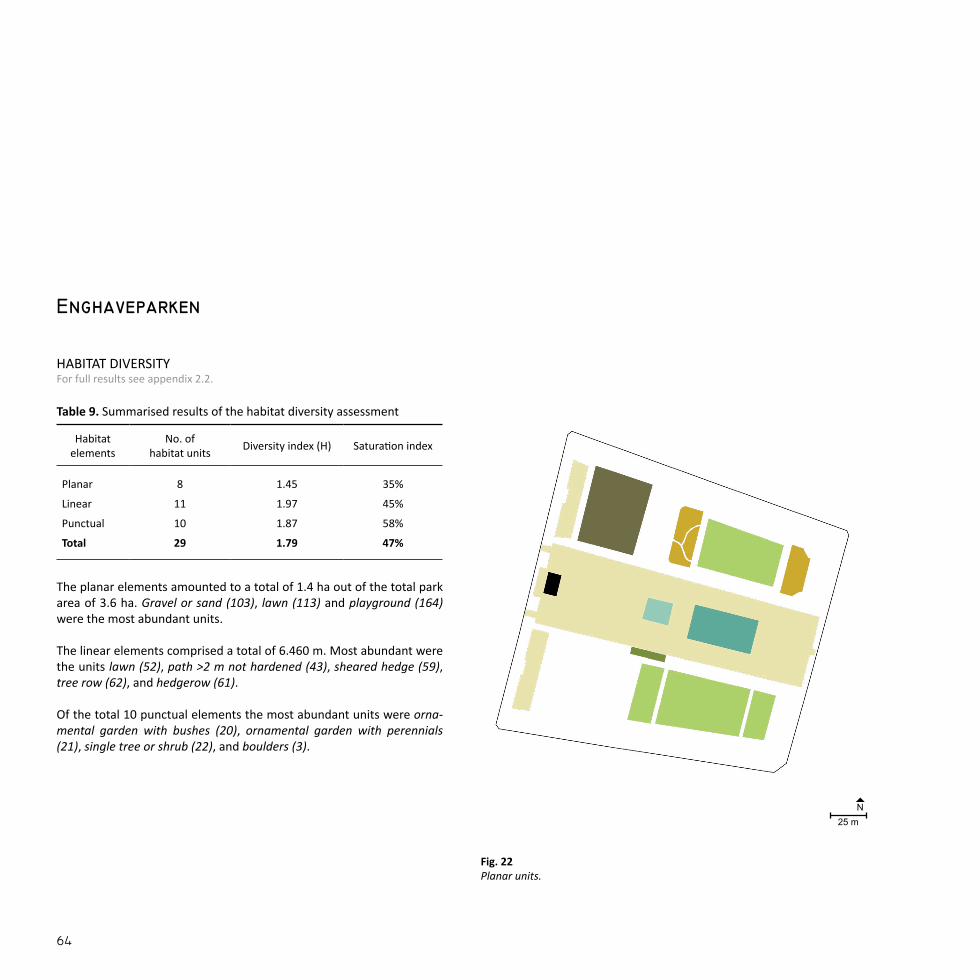
The planar elements amounted to a total of 1.4 ha out of the total park area of 3.6 ha. Gravel or sand (103), lawn (113) and playground (164) were the most abundant units.
The linear elements comprised a total of 6.460 m. Most abundant were the units lawn (52), path >2 m not hardened (43), sheared hedge (59), tree row (62), and hedgerow (61).
Of the total 10 punctual elements the most abundant units were orna-mental garden with bushes (20), ornamental garden with perennials (21), single tree or shrub (22), and boulders (3).
HABITAT DIVERSITYFor full results see appendix 2.2.
Habitat elements
No. of habitat units Diversity index (H) Saturation index
Planar 8 1.45 35%
Linear 11 1.97 45%
Punctual 10 1.87 58%
Total 29 1.79 47%
Table 9. Summarised results of the habitat diversity assessment
Enghaveparken
Fig. 22Planar units.
25 mN

Fig. 23Linear units.
Fig. 24Punctual units.
25 mN
25 mN

In Enghaveparken two transects of 25 m and one transect of 50 m were laid out. These intersected habitat units such as a hedgerow, ornamental gardens, lawns, and tree rows.
TRANSECT SURVEY
Fig. 25Placement of transect A, B, and C.
A
AA
B
BB
C
CC
25 mN

Enghaveparken

The grass strip (52) was vastly dominated by Poa annua and Lolium per-enne which covered approximately 80% of the plot with 60% and 20%, respectively. Additional species such as Bellis perennis, Chaerophyllum temulum, Plantago major, and Taraxacum spp. covered only limited ar-eas. The collection of invertebrates sampled from plot 1 in this grass strip scored a diversity index of 1.04. The collection displayed a total of 4 individuals distributed between 3 species from 2 orders. True bugs (Hemiptera) was the most diverse order with 2 individuals and 2 species followed by flies (Diptera).
In the hedgerow (61), vegetation was most predominant in the lower canopy layer which consisted of species such as Viburnum rhytidophyl-lum, Staphylea holocarpa, and Viburnum farreri. In the shrub layer, only Symphoricarpos albus was present. All five species in the hedgerow were non-native.
The ornamental garden with bushes (120) had a shrub layer of Hyperi-cum androsaemum and Hypericum hookerianum and sporadic leaf litter. In the lower canopy layer Cupressus macrocarpa sp., Viburnum farreri and Ilex aquifolium were present. Excluding the latter, all species were non-native.
SPECIES DIVERSITY
Transect A - 25 m (Fig. 26)For full results see appendix 3.2 for invertebrates and appendix 4.2 for herba-ceous and woody vegetation.
Pitfall trap 1 was lost. The invertebrates collected in pitfall trap 2 placed within the ornamental garden reached a diversity index of 2.52. The col-lection comprised 226 individuals distributed between 39 species from 12 orders. The most abundant and diverse order was crustaceans (Isop-oda) with 103 individuals and 2 species, followed by springtails (Entomo-bryomorpha), beetles (Coleoptera), and spiders (Araneae). The rest of the individuals were distributed between orders such as earwigs (Der-maptera), hymenopterans (Hymenoptera), and flies (Diptera).
Invertebrates collected from all registered woody vegetation scored a diversity index of 3.16. The collection comprised 45 individuals distrib-uted between 28 species from 4 orders. The most abundant and diverse order was spiders (Araneae) with 25 individuals and 14 species followed by flies (Diptera), beetles (Coleoptera), and springtails (Collembola).
Habitat no. Species richness Abundance Diversity index (H)
(52) 10 100* 1.37
(61) 9 5 1.30
(120) 5 12 1.35
Table 10. Summarised results of the species diversity assessment for vascular plants in each habitat unit
* Cover (%) within the 4 m2 plot.

Dive
rsity
inde
x (H
)
H=3.16
H=1.04
H=2.52
PT 2Plot 1
Grass strip (52)
Hedgerow (61)
Ornamental garden, bushes (120)
Path(43)
Fig. 26Transect A- 25 m.
A AA
1
2
3
Diversity of invertebrates sampled from herbaceous vegetation
Diversity of invertebrates sampled from woody vegetation
Present vertical layers of vegetation
Diversity of invertebrates samples in pitfall traps
Diversity of vascular plants

The plot placed in the ornamental garden with perennials (57) covered 12 species of which 6 were non-native. The dominating species were tra-ditional, ornamental species such as Dianthus barbatus spp., Origanum sp., Sanguisorba officinalis, and Lysimachia clethroides which covered approximately 70% in total. A few other species had colonised a lim-ited area, e.g. Aegopodium podagraria, Geum urbanum, and Taraxacum spp., while bare soil constituted 24% of the plot.
The invertebrates collected in pitfall trap 3 placed between the peren-nials reached a diversity index of 2.34. A total of 231 individuals were collected which were distributed between 33 species from 13 orders. The most abundant and diverse order was crustaceans (Isopoda) with 125 individuals and 4 species, followed by earwigs (Dermaptera), hyme-nopterans (Hymenoptera), beetles (Coleoptera), and springtails (Ento-mobryomorpha), respectively. The rest of the individuals were distrib-uted between orders such as gastropods (Stylommatophora), millipedes (Julida), flies (Diptera), and centipedes (Lithobiomorpha).
SPECIES DIVERSITY
Transect B - 25 m (Fig. 27)For full results see appendix 3.2 for invertebrates and appendix 4.2 for herba-ceous and woody vegetation.
Both the hedge (59) and the tree row (62) gained a diversity index of 0 as they consisted of only one species each; Carpinus betulus and Robinia pseudoacacia, of which the latter is non-native and potentially invasive.
The collection of invertebrates sampled from the registered woody veg-etation reached a diversity index of 2.04. It comprised a total of 9 indi-viduals distributed between 8 species from 4 orders. The most abun-dant and diverse order was spiders (Araneae) with 5 individuals and 5 species, followed by springtails (Collembola), beetles (Coleoptera), and hymenopterans (Hymenoptera), respectively.
Habitat no. Species richness Abundance Diversity index (H)
(52) 10 100* 1.37
(57) 13 111* 2.09
(59) 1 1 0
(62) 1 1 0
Table 11. Summarised results of the species diversity assessment for vascular in each habitat unit
* Cover (%) within the 4 m2 plot. Overlap occurred.

Dive
rsity
inde
x (H
)
H=2.04
H=2.34
PT 3
Grass strip (52)
Tree row(62)
Sheared hedge (59)
Ornamental garden, perennials (57)
Gravel surface (103)
Fig. 27Transect B - 25 m. The diversity of the grass strip (H=1.37) was adopted from plot 1 in transect A (Fig. 26) in Enghaveparken.
B BB
1
2
3
Diversity of invertebrates sampled from herbaceous vegetation
Diversity of invertebrates sampled from woody vegetation
Present vertical layers of vegetation
Diversity of invertebrates samples in pitfall traps
Diversity of vascular plants

The two ornamental gardens (20) of Rosa spp. on the edges of the lawn consisted of only one species each and as a result gained a diversity in-dex of 0. This was also the case with the sheared hedges of Carpinus betulus and Crataegus monogyna, respectively, as well as the tree row of Tilia x europaea and the two solitary trees of the non-native Magnolia kobus.
The ornamental garden (57) also consisted of Rosa spp., however the transect intersected two different species which ensured a diversity in-dex of 0.69.
The lawn consisted almost entirely of non-native species. It was domi-nated by Poa annua and Lolium perenne, which covered approximately 90% of the plot with 34% and 57%, respectively. Bellis perennis, Plantago major, Taraxacum spp., and Trifolium repens covered limited areas. The collection of invertebrates obtained from pitfall trap 4 in the lawn scored
SPECIES DIVERSITY
Transect C - 50 m (Fig. 28)For full results see appendix 3.2 for invertebrates and appendix 4.2 for herba-ceous and woody vegetation.
a diversity index of 1.80. It comprised 191 individuals distributed be-tween 27 species from 10 orders. With 110 individuals hymenopterans (Hymenoptera) was the most abundant order, while the most diverse orders were beetles (Coleoptera) with 28 individuals and 10 species, and flies (Diptera) with 19 individuals and 8 species. The remaining indi-viduals were distributed between the orders millipedes (Julida), earwigs (Dermaptera), and crustaceans (Isopoda).
The collection of invertebrates sampled from woody vegetation reached a diversity index of 3.12. The collected invertebrates comprised 39 indi-viduals distributed between 26 species from 6 orders. Spiders (Araneae) was the most diverse order with 10 individuals and 7 species, followed by flies (Diptera) and beetles (Coleoptera), respectively.
Habitat no. Species richness Abundance Diversity index (H)
(20) x 2 1 4 0
(22) x 2 1 1 0
(52) 10 100* 1.37
(57) 2 4 0.69
(59) x 2 1 1 0
(62) 1 1 0
(113) 6 100* 0.98
Table 12. Summarised results of the species diversity assessment for vascular plants in each habitat unit
* Cover (%) within the 4 m2 plot.

Dive
rsity
inde
x (H
)
H=3.12
H=1.80
PT 4
Lawn (113)
Tree row (62)
Grass strip (62)
Single tree (22)
Ornamental garden, bushes (57)
Ornamental garden, bushes (20)
Ornamental garden, bushes (20)
Path(43)
Path(43)
Sheared hedge (59)
Fig. 28Transect C - 50 m. The diversity of the grass strip (H=1.37) was adopted from plot 1 in transect A (Fig. 26) in Enghaveparken
C CC
1
2
3
Diversity of invertebrates sampled from herbaceous vegetation
Diversity of invertebrates sampled from woody vegetation
Present vertical layers of vegetation
Diversity of invertebrates samples in pitfall traps
Diversity of vascular plants
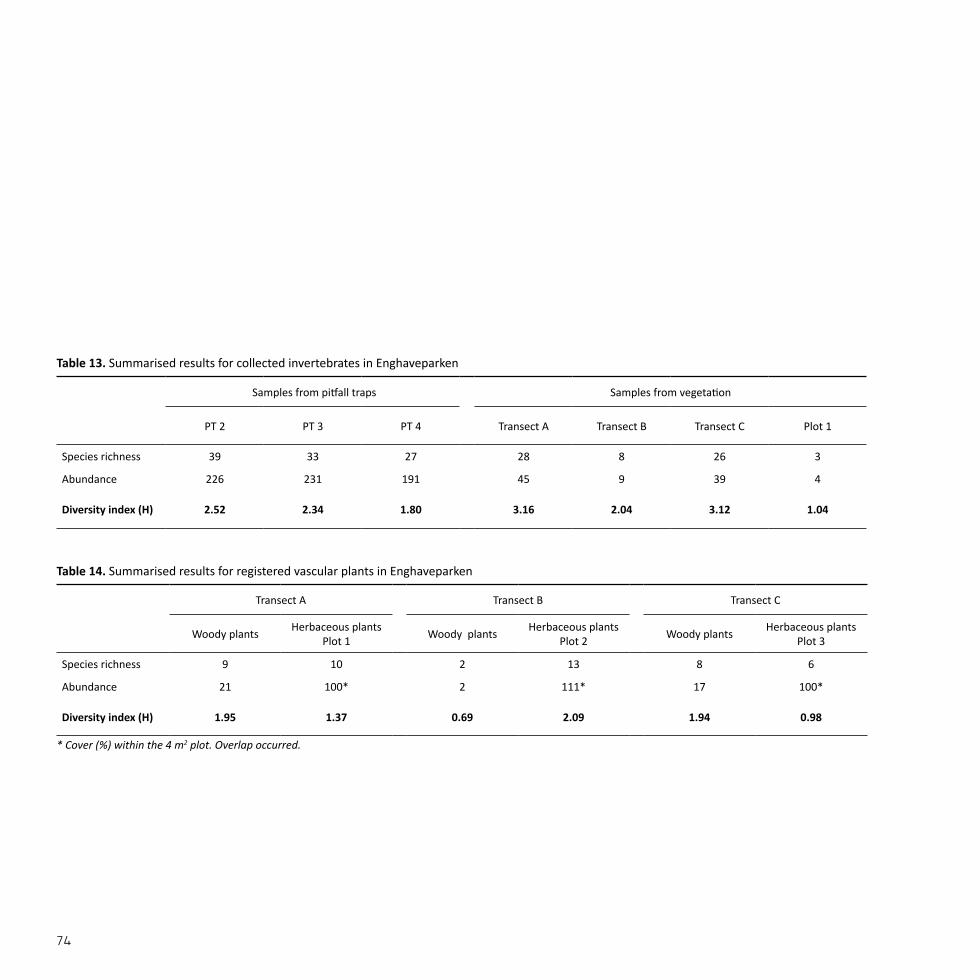
Table 14. Summarised results for registered vascular plants in Enghaveparken
Table 13. Summarised results for collected invertebrates in Enghaveparken
Samples from pitfall traps Samples from vegetation
PT 2 PT 3 PT 4 Transect A Transect B Transect C Plot 1
Species richness 39 33 27 28 8 26 3
Abundance 226 231 191 45 9 39 4
Diversity index (H) 2.52 2.34 1.80 3.16 2.04 3.12 1.04
Transect A Transect B Transect C
Woody plants Herbaceous plantsPlot 1 Woody plants Herbaceous plants
Plot 2 Woody plants Herbaceous plants Plot 3
Species richness 9 10 2 13 8 6
Abundance 21 100* 2 111* 17 100*
Diversity index (H) 1.95 1.37 0.69 2.09 1.94 0.98
* Cover (%) within the 4 m2 plot. Overlap occurred.

DISCUSSIONSimilarly to Fælledparken, the results of Enghaveparken showed a posi-tive effect of compositional and structural complexity of vegetation on the diversity of vascular plants and invertebrates. This especially tran-spired in the collections of invertebrates obtained from both the woody vegetation along transect A and from pitfall trap 2 placed in the dense and complex ornamental garden, which reached very high diversity indi-ces. In contrast, collections obtained from more open structures in the park were relatively less diverse.
Surprisingly, transects A and C displayed similarly high diversity indices for invertebrates sampled from woody vegetation. Yet, the composition and structure of woody vegetation in these transects were different. As transect C was severely lacking in compositional and structural complex-ity, it could be inferred that the simple, linear elements of hedges and the row of trees are also valuable structures for invertebrates (Smith et al., 2005 referenced in Farinha-Marques et al., 2011). In addition, the lin-ear elements in transect C consisted of native species, whereas only one native species was present in transect A. The difference in native and non-native compositions between the two transects was reflected in the collections of wood dwelling invertebrates. The collection from transect C comprised more orders and a more diverse assemblage of herbivores. In contrast, the collection sampled from transect A displayed fewer or-ders and a less diverse assemblage of herbivores. This suggests, that the native vegetation is important for herbivorous insect orders which consequently attracts a diverse assemblage of other invertebrate orders (Kennedy & Southwood, 1984). It also suggests that evergreen vegeta-tion may provide shelter for various of organisms (RHS, 2013), but it may not support a very diverse assemblage of invertebrate orders.
The low diversity of both herbaceous vegetation and associated inver-tebrate fauna in the lawn in transect C could be due to the short sward and lack of structural variation which promotes a poor composition of herbs (Noordijk et al., 2010). Interestingly, the grass strip between the path and the hedgerow in transect A had double the amount of herba-
ceous species compared to the lawn in transect C. This shows a potential for more diverse species compositions of grassland vegetation in areas subject to less user pressure which could benefit grassland invertebrates in general (Noordijk et al., 2010), but also species characteristic to edge habitats (Magura et al., 2001).

Fig. 29Planar units.
The planar elements amounted to 1.2 ha out of the total park area of 3.8 ha. The most abundant units were lawn (113) and meadow (116).
The linear elements came to a total of 2.421 m. The most abundant units were path >2m not hardened (43), vegetated slope 30-60% (36), and vegetated slope >60% (38).
Of the 5 punctual elements the most abundant units were single tree or shrub (22), and gravel or sand surface (1).
HABITAT DIVERSITYFor full results see appendix 2.3.
Habitat elements
No. of habitat units Diversity index (H) Saturation index
Planar 3 0.66 16%
Linear 10 1.83 42%
Punctual 5 0.76 24%
Total 18 0.34 33%
Table 15. Summarised results of the habitat diversity assessment
Mimersparken
50 mN

Fig. 30Linear units.
Fig. 31Punctual units.
50 mN
50 mN
50 mN
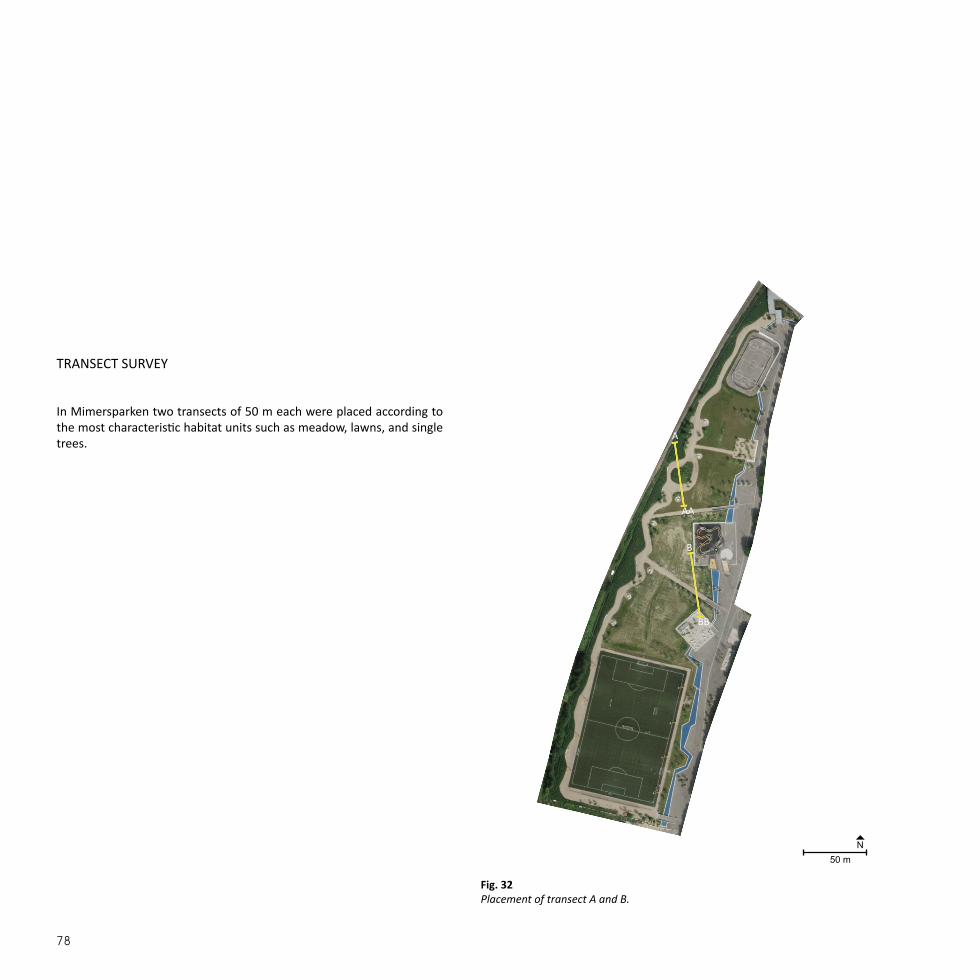
In Mimersparken two transects of 50 m each were placed according to the most characteristic habitat units such as meadow, lawns, and single trees.
TRANSECT SURVEY
Fig. 32Placement of transect A and B.
A
AA
B
BB
50 mN

Mimersparken

The meadow to the far left comprised both herbaceous vegetation, but also a sporadic shrub layer of Ribes alpinum, Sambucus nigra, Rosa canina ssp. canina, and Syringa vulgaris, of which only the latter was non-native. The herb layer was dominated by the grass species Dactylis glomerata ssp. glomerata, Lolium perenne, and Poa annua which in to-tal covered 55% of the plot. Other species such as Tanacetum vulgare, Artemisia vulgaris, and Solidago gigantea covered smaller areas, while bare soil covered approximately 22% of the plot. Additionally, 25% were covered by small, spontaneous woody undergrowth. Of the 8 registered species 3 were non-native, including Solidago gigantea which was also invasive.
The collected invertebrates from pitfall trap 1 placed in the meadow reached a diversity of 3.07. The collection comprised 246 individuals dis-tributed between 41 species from 9 orders and one class. With 64 indi-viduals and 9 species beetles (Coleoptera) was both the most abundant and diverse order, followed by crustaceans (Isopoda), flies (Diptera), and hymenopterans (Hymenoptera). The rest of the sampled specimens were distributed among orders such as spiders (Araneae), springtails (Collembola), and millipedes (Julida).
SPECIES DIVERSITY
Transect A - 50 m (Fig. 33)For full results see appendix 3.3 for invertebrates and appendix 4.3 for herba-ceous and woody vegetation.
The meadow across the path was also characterised by a sporadic shrub layer. A total of 8 species were registered including the non-native spe-cies Amelanchier lamarckii, Rosa majalis var. majalis, and Syringa vul-garis.
The lawn was dominated by the non-native grasses Poa annua and Lo-lium perenne which covered approximately 70% with 23% and 47%,re-spectively. Species such as Trifolium repens, Medicago lupulina, and Trifolium pratense covered only small areas and mosses approximately 14%. Since the single tree in the lawn only comprised the single non-na-tive species; Juglans nigra, it gained a diversity index of 0. The collection of invertebrates obtained from pitfall trap 2 in the lawn comprised 71 individuals distributed between 26 species from 8 orders and one class and scored a diversity index of 2.63. The most abundant and diverse order was flies (Diptera) with 35 individuals and 6 species, followed by beetles (Coleoptera) with 11 individuals and 8 species. The rest of the collected specimens were distributed on orders such as hymenopterans (Hymenoptera), springtails (Collembola), and spiders (Araneae).
The collection of invertebrates sampled from plot 2 in the lawn had a di-versity index of 1.39. The collection comprised 4 individuals distributed between 4 species from 2 orders. With 3 individuals and 3 species flies (Diptera) was the most abundant and diverse order, followed by beetles (Coleoptera) with just 1 individual.
Collections of invertebrates sampled from the woody vegetation com-prised 53 individuals distributed between 24 species from 8 orders, re-sulting in a diversity index of 2.82 The most abundant and diverse order was beetles (Coleoptera) with 25 individuals and 10 species, followed by hymenopterans (Hymenoptera) with 11 individuals and 4 species, and true bugs (Hemiptera) with 6 individuals and 2 species. The rest of the specimens were distributed between orders such as earwigs (Der-maptera), flies (Diptera), and lepidopterans (Lepidoptera).
Habitat no. Species richness Abundance Diversity index (H)
(22) 1 1 0
(113) 10 100* 1.45
(116) x 2 10 117.5* 1.88
Table 16. Summarised results of the species diversity assessment for vascular plants in each habitat unit
* Cover (%) within the 4 m2 plot. Overlap occurred.

Dive
rsity
inde
x (H
)
H=2.82H=3.07
H=2.63
H=1.39
PT 2 Plot 2PT 1
Meadow (116)
Meadow (116)
Lawn(113)
Single tree (22)
Path(43)
Path(43)
Fig. 33Transect A - 50 m.
A AA
1
2
3
Diversity of invertebrates sampled from herbaceous vegetation
Diversity of invertebrates sampled from woody vegetation
Present vertical layers of vegetation
Diversity of invertebrates samples in pitfall traps
Diversity of vascular plants

The lawn was dominated by the grasses Poa annua and Lolium perenne which covered approximately 27% each. Additionally, Trifolium repens covered 33%, while other species such as Artemisia vulgaris, Medicago lupulina, Matricaria suaveolens, Arrhenatherum elathius, and Plantago major covered only small areas, and bare soil 11%. Of the 8 registered species, 4 were non-native.
The cluster of shrubs consisted only of Salix x smithiana and therefore gained a diversity index of 0. This was also the result of the 3 single trees of the species Prunus avium and Tilia cordata.
The collection of invertebrates sampled in pitfall trap 3 in the cluster of shrubs scored a diversity index of 2.70. The collection comprised 44 individuals distributed between 21 species from 5 orders. The most abundant order was flies (Diptera) with 15 individuals. The most diverse orders were beetles (Coleoptera) with 13 individuals and 9 species and spiders (Araneae) with 13 individuals and 6 species. The rest of the spec-imens were distributed between the orders of true bugs (Hemiptera) and hymenopterans (Hymenoptera).
SPECIES DIVERSITY
Transect B - 50 m (Fig. 34)For full results see appendix 3.3 for invertebrates and appendix 4.3 for herba-ceous and woody vegetation.
Collections obtained from pitfall trap 4 in the lawn scored a diversity index of 2.06. The collection comprised 19 individuals distributed be-tween 10 species from 4 orders. With 8 individuals and 6 species bee-tles (Coleoptera) was the most abundant and diverse order, followed by flies (Diptera), hymenopterans (Hymenoptera), and spiders (Araneae), respectively.
The invertebrates collected from all registered woody vegetation com-prised a total of 67 individuals distributed between 8 species from 5 or-ders, resulting in a diversity index of 0.54. The most abundant order was true bugs (Hemiptera) with 60 individuals and 1 species, while the most diverse order was spiders (Araneae) with 3 individuals and 3 species, fol-lowed by beetles (Coleoptera) with 2 individuals and 2 species. The rest of the invertebrates were distributed between the orders of hymenop-terans (Hymenoptera) and lepidopterans (Lepidoptera).
Habitat no. Species richness Abundance Diversity index (H)
(22) x 3 1 1 0
(23) 1 5 0
(113) 9 100* 1.43
Table 17. Summarised results of the species diversity assessment for vascular plants in each habitat unit
* Cover (%) within the 4 m2 plot.
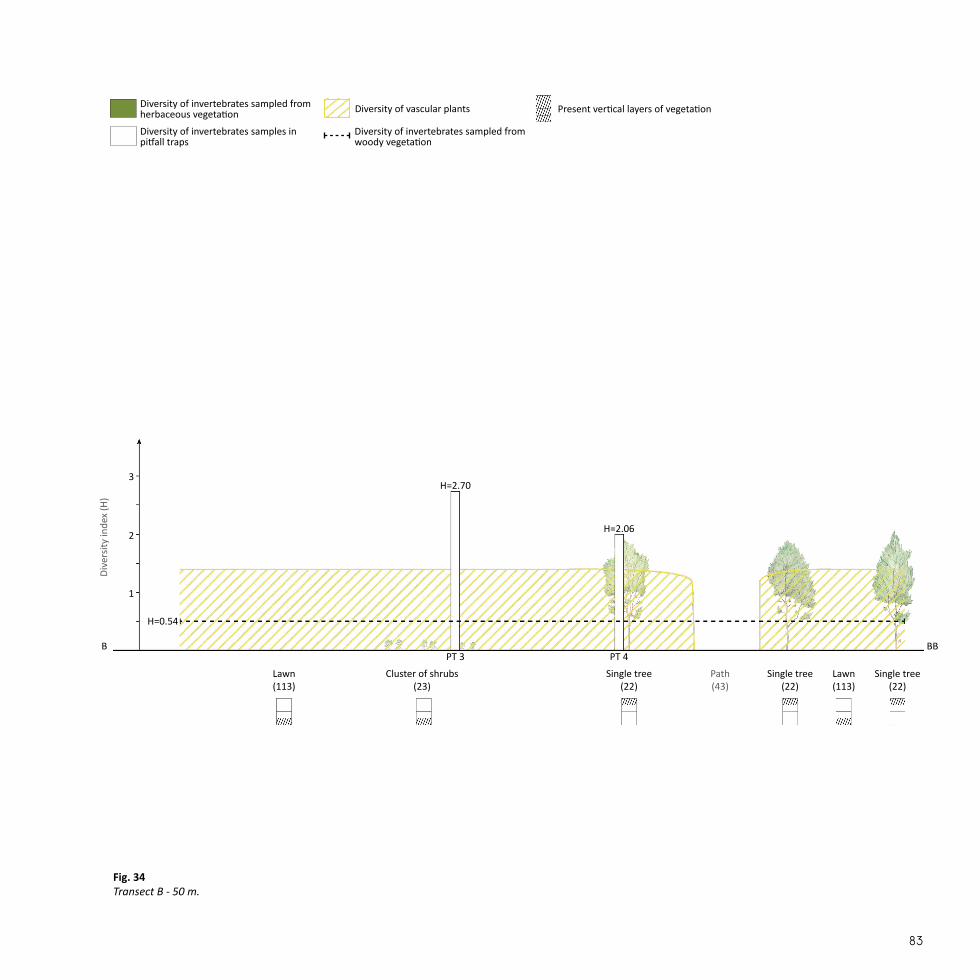
Dive
rsity
inde
x (H
)
H=0.54
H=2.70
H=2.06
PT 3 PT 4
Cluster of shrubs (23)
Single tree (22)
Single tree (22)
Single tree (22)
Lawn (113)
Lawn (113)
Path(43)
Fig. 34Transect B - 50 m.
B BB
1
2
3
Diversity of invertebrates sampled from herbaceous vegetation
Diversity of invertebrates sampled from woody vegetation
Present vertical layers of vegetation
Diversity of invertebrates samples in pitfall traps
Diversity of vascular plants

* Cover (%) within the 4 m2 plot. Overlap occurred.
Table 19. Summarised results for registered vascular plants in Mimersparken
Table 18. Summarised results for collected invertebrates in Mimersparken
Samples from pitfall traps Samples from vegetation
PT 1 PT 2 PT 3 PT 4 Transect A Transect B Plot 2
Species richness 41 26 21 10 24 8 4
Abundance 246 71 44 19 53 67 4
Diversity index (H) 3.07 2.63 2.70 2.06 2.82 0.54 1.39
Transect A Transect B
Woody plants Herbaceous plantsPlot 1
Herbaceous plantsPlot 2 Woody plants Herbaceous plants
Plot 3
Species richness 10 10 10 3 9
Abundance 23 117,50* 100* 8 100*
Diversity index (H) 1.90 1.88 1.45 0.90 1.43
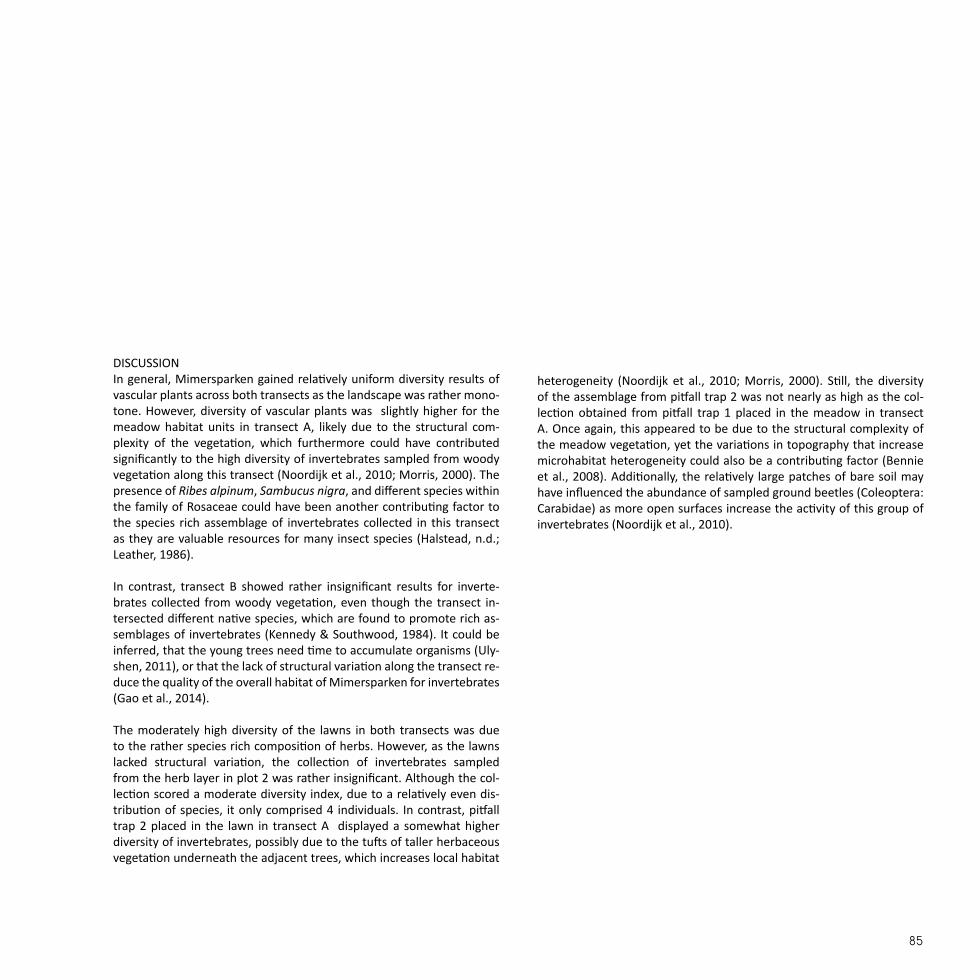
DISCUSSIONIn general, Mimersparken gained relatively uniform diversity results of vascular plants across both transects as the landscape was rather mono-tone. However, diversity of vascular plants was slightly higher for the meadow habitat units in transect A, likely due to the structural com-plexity of the vegetation, which furthermore could have contributed significantly to the high diversity of invertebrates sampled from woody vegetation along this transect (Noordijk et al., 2010; Morris, 2000). The presence of Ribes alpinum, Sambucus nigra, and different species within the family of Rosaceae could have been another contributing factor to the species rich assemblage of invertebrates collected in this transect as they are valuable resources for many insect species (Halstead, n.d.; Leather, 1986).
In contrast, transect B showed rather insignificant results for inverte-brates collected from woody vegetation, even though the transect in-tersected different native species, which are found to promote rich as-semblages of invertebrates (Kennedy & Southwood, 1984). It could be inferred, that the young trees need time to accumulate organisms (Uly-shen, 2011), or that the lack of structural variation along the transect re-duce the quality of the overall habitat of Mimersparken for invertebrates (Gao et al., 2014).
The moderately high diversity of the lawns in both transects was due to the rather species rich composition of herbs. However, as the lawns lacked structural variation, the collection of invertebrates sampled from the herb layer in plot 2 was rather insignificant. Although the col-lection scored a moderate diversity index, due to a relatively even dis-tribution of species, it only comprised 4 individuals. In contrast, pitfall trap 2 placed in the lawn in transect A displayed a somewhat higher diversity of invertebrates, possibly due to the tufts of taller herbaceous vegetation underneath the adjacent trees, which increases local habitat
heterogeneity (Noordijk et al., 2010; Morris, 2000). Still, the diversity of the assemblage from pitfall trap 2 was not nearly as high as the col-lection obtained from pitfall trap 1 placed in the meadow in transect A. Once again, this appeared to be due to the structural complexity of the meadow vegetation, yet the variations in topography that increase microhabitat heterogeneity could also be a contributing factor (Bennie et al., 2008). Additionally, the relatively large patches of bare soil may have influenced the abundance of sampled ground beetles (Coleoptera: Carabidae) as more open surfaces increase the activity of this group of invertebrates (Noordijk et al., 2010).

Fig. 35Planar units.
The planar elements amounted to a total of 3.5 ha out of the total park area of 3.2 ha (overlap of habitat units occurred). The most abundant units were meadow (116), thicket (123) and multi-layered deciduous tree stand with a canopy cover of 10-30% (132).
The linear elements amounted to a total of 1.810 m. The most abundant units were path <2 m not hardened (41), path >2 m not hardened (43), and vegetated slope >60% (38).
The punctual elements came to a total of 12 units. The most abundant units were single tree or shrub (22), boulders (3), and cluster of trees and/or shrubs (23).
HABITAT DIVERSITYFor full results see appendix 2.4.
Habitat elements
No. of habitat units Diversity index (H) Saturation index
Planar 6 0.53 16%
Linear 8 1.51 35%
Punctual 12 1.71 53%
Total 26 1.38 38%
Table 20. Summarised results of the habitat diversity assessment
Stejlepladsen
50 mN

Fig. 36Linear units.
Fig. 37 Punctual units.
50 mN
50 mN

The two transects laid out in Stejlepladsen each had a length of 50 m. Here the transects intersected the characteristic habitat units such as meadow, thicket, and clusters of trees and shrubs.
TRANSECT SURVEY
Fig. 38Placement of transect A and B.
A
AAB
BB
50 mN

Stejlepladsen

The large meadow surface was dominated by grasses which constituted 6 of the 11 species registered within the plot. The grasses covered ap-proximately 93% and mainly consisted of Arrhenatherum elatius, Phala-ris arundinacea, and Festuca rubra. Additional species such as Potentilla reptans, Vicia hirsuta, and Vicia sativa ssp. sativa covered only small ar-eas. Of the 11 species present, three were non-native.
The collection of invertebrates obtained from pitfall trap 1 placed in the meadow scored a diversity index of 2.41. The collection comprised 26 individuals distributed between 14 species from 7 orders and one class. The two most abundant and diverse orders were hymenopterans (Hymenoptera) and crustaceans (Isopoda), both with 6 individuals and 2 species. The rest of the individuals were distributed between orders such as beetles (Coleoptera), springtails (Entomobryomorpha), and spi-ders (Araneae).
The invertebrates collected in pitfall trap 2 placed in the edge between the meadow and the thicket had a diversity index of 2.14. The collec-tion comprised 374 individuals distributed between 30 species from 11 orders. The most abundant and diverse order was crustaceans (Isopoda) with 226 individuals and 4 species, followed by beetles (Coleoptera)
SPECIES DIVERSITY
Transect A - 50 m (Fig. 39)For full results see appendix 3.4 for invertebrates and appendix 4.4 for herba-ceous and woody vegetation.
with 40 individuals and 11 species. The rest of the individuals were dis-tributed between orders such as hymenopterans (Hymenoptera), mil-lipedes (Julida), and spiders (Araneae).
In the thicket (123) the lower canopy layer consisted of Laburnum ana-gyroides, Crataegus monogyna, Sambucus nigra, and Ulmus glabra, while species such as Malus domestica, Rubus fruticosus, Laburnum ana-gyroides, and Crataegus monogyna formed the shrub layer. Of the seven registered species in the thicket, Laburnum anagyroides and Malus do-mestica were non-native.
The collection of invertebrates obtained from pitfall trap 3 placed in the thicket reached a diversity index of 2.24. The collection comprised 60 in-dividuals distributed between 22 species from 9 orders. The most abun-dant order was millipedes (Julida) with 28 individuals. The most diverse order was spiders (Araneae) with 8 individuals and 6 species, followed by beetles (Coleoptera) with 7 individuals and 6 species. Other individu-als were distributed between orders such as flies (Diptera), flat-backed millipedes (Polydesmida), and earwigs (Dermaptera).
In between the thicket (123) and the cluster of trees and shrubs (23) the meadow scored a diversity index of 2.11. A total of 13 species were reg-istered of which 7 species were grasses, which covered approximately 100% of the plot. The grass cover mainly consisted of Phalaris arundi-nacea, Carex hirta, Festuca ovina, and Dactylis glomerata. Other species such as Eupatorium cannabinum, Vicia sativa ssp. sativa, and Tragopo-gon pratensis ssp. minor, covered smaller areas and bare soil 4%. Of the 13 registered species, 3 were non-native. The invertebrates sampled from the meadow in plot 2 had a diversity of 2.73. The collection com-prised a total of 35 individuals distributed between 20 species from 7 orders. The most abundant and diverse order was true bugs (Hemiptera) with 10 individuals and 6 species, followed by spiders (Araneae) with 8 individuals and 7 species. The rest of the individuals were distributed between orders such as flies (Diptera), gastropods (Stylommatophora), and hymenopterans (Hymenoptera).
Habitat no. Species richness Abundance Diversity index (H)
(23) 3 5 0.64
(116) 11 107* 1.48
(116) 14 125* 2.11
(123) 7 25 1.54
Table 21. Summarised results of the species diversity assessment for vascular plants in each habitat unit
* Cover (%) within the 4 m2 plot. Overlap occurred.

The cluster of trees and shrubs (23) consisted of three different species; Laburnum anagyroides, Sambucus nigra, and Crataegus monogyna.
Collections of invertebrates sampled from the woody vegetation reached a diversity index of 2.67. The collection comprised 78 individuals distrib-uted between 27 species from 7 orders. With 27 individuals, the most abundant order was hymenopterans (Hymenoptera). The most diverse order was beetles (Coleoptera) with 20 individuals and 8 species, fol-lowed by true bugs (Hemiptera) with 18 individuals and 5 species. The rest of the individuals were distributed between orders such as spiders (Araneae) and gastropods (Stylommatophora).
Dive
rsity
inde
x (H
)
H=2.41H=2.67
H=2.12H=2.24
H=2.73
PT 1 PT 2 PT 3 Plot 2
Thicket (123)
Meadow (116)
Cluster of shrubs and trees (23)
Meadow (116)
Fig. 39Transect A - 50 m.
A AA
1
2
3
Diversity of invertebrates sampled from herbaceous vegetation
Diversity of invertebrates sampled from woody vegetation
Present vertical layers of vegetation
Diversity of invertebrates samples in pitfall traps
Diversity of vascular plants

The clusters of trees and shrubs (23) both comprised two species. The cluster on the left consisted of Crataegus monogyna and Rosa sp. and the cluster on the right included Crataegus monogyna and Sambucus nigra.
The tree stand (132) was deciduous and multi-layered with a canopy cover of 10-30%. The upper canopy layer consisted of Betula pendula, while the shrub layer comprised Prunus cerasifera, Rosa sp., and Sambu-cus nigra. Of the 4 registered woody species only Prunus cerasifera was non-native.
The collection of invertebrates obtained from pitfall trap 4 placed in the edge between the tree stand and the meadow scored a diversity index of 2.31. The collection comprised 165 individuals distributed between 29 species from 9 orders. The most abundant and diverse order was crus-taceans (Isopoda) with 91 individuals and 4 species, followed by hyme-nopterans (Hymenoptera), spiders (Araneae), and beetles (Coleoptera). The rest of the invertebrates were distributed between orders such as millipedes (Julida) and lepidopterans (Lepidoptera).
SPECIES DIVERSITY
Transect B - 50 m (Fig. 40)For full results see appendix 3.4 for invertebrates and appendix 4.4 for herba-ceous and woody vegetation.
The herb layer in the edge of the tree stand (132) scored a diversity index of 2.50. A total of 21 species were registered within the plot of which 6 were grasses such as Anisantha sterilis, Elytrigia repens, and Festuca ru-bra. In total, the grasses covered approximately 30%. Potentilla reptans was the most abundant species covering approximately 30%, followed by Tanacetum vulgare with 16%. Other species such as Lapsana commu-nis ssp. communis, Geranium pusillum, Malva sylvestris ssp. sylvestris, and Urtica dioica ssp. dioica covered only small areas, while bare soil covered 25% of the plot. Of the 21 registered species, 6 were non-native.
Invertebrates collected from woody vegetation reached a diversity index of 2.65. The 73 sampled individuals were distributed between 27 spe-cies from 8 orders. With 27 individuals the most abundant order was flies (Diptera). The most diverse order was true bug (Hemiptera) with 24 individuals and 5 species. The rest of the individuals were distributed be-tween orders such as spiders (Araneae), hymenopterans (Hymenoptera) and beetles (Coleoptera).
Habitat no. Species richness Abundance Diversity index (H)
(23) x 2 2 2 0.69
(116) 11 107* 1.48
(116) 14 125* 2.11
(132) 4 5 1.33
Table 22. Summarised results of the species diversity assessment for vascular plants in each habitat unit
* Cover (%) within the 4 m2 plot. Overlap occurred.

Dive
rsity
inde
x (H
) H=2.65H=2.31
PT 4
Cluster of trees and shrubs (23)
Cluster of trees and shrubs (23)
Treestand - 10-30%, multilayered (132)
Meadow (116)
Meadow (116)
Meadow (116)
Fig. 40Transect B - 50 m. The diversity of the meadows in between the clusters of trees and shrubs (23) and the tree stand (132) was adopted from plot 2 in transect A (Fig. 39). The diversity index for the meadow on the left was adopted from plot 1 in transect A (Fig. 39).
B BB
1
2
3
Diversity of invertebrates sampled from herbaceous vegetation
Diversity of invertebrates sampled from woody vegetation
Present vertical layers of vegetation
Diversity of invertebrates samples in pitfall traps
Diversity of vascular plants
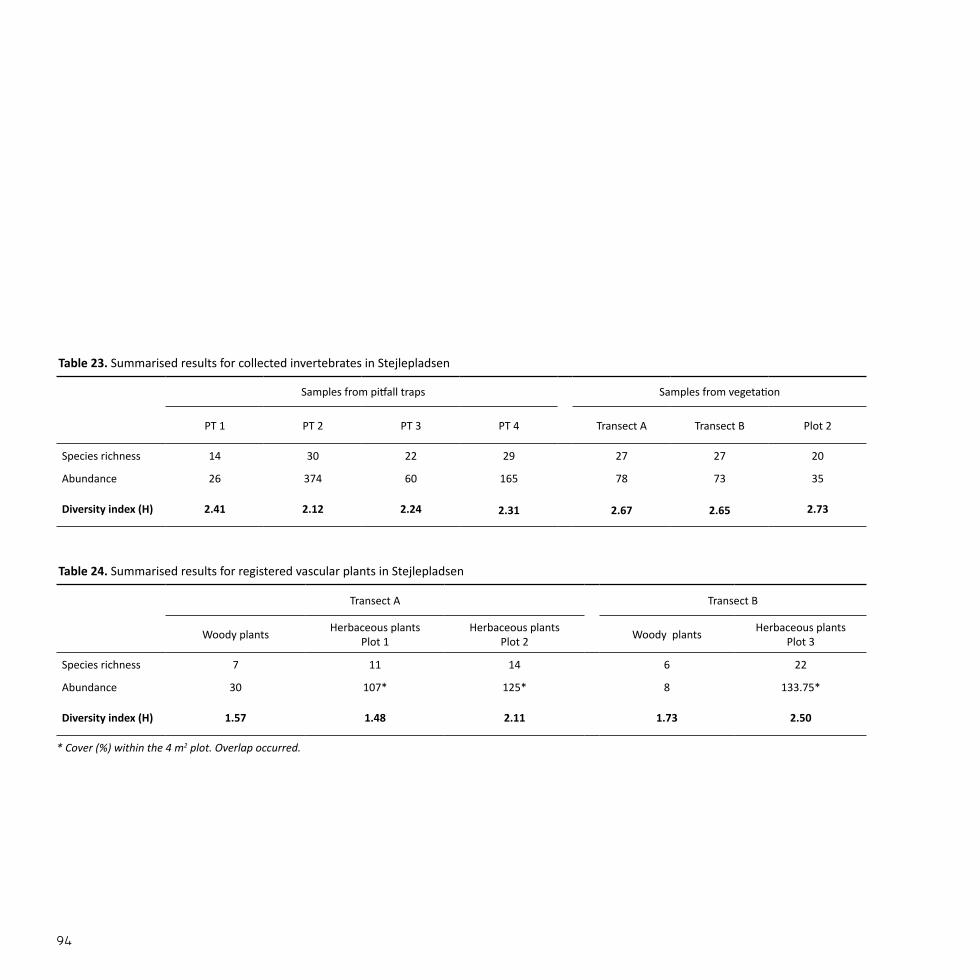
Table 24. Summarised results for registered vascular plants in Stejlepladsen
Table 23. Summarised results for collected invertebrates in Stejlepladsen
Samples from pitfall traps Samples from vegetation
PT 1 PT 2 PT 3 PT 4 Transect A Transect B Plot 2
Species richness 14 30 22 29 27 27 20
Abundance 26 374 60 165 78 73 35
Diversity index (H) 2.41 2.12 2.24 2.31 2.67 2.65 2.73
Transect A Transect B
Woody plants Herbaceous plantsPlot 1
Herbaceous plantsPlot 2 Woody plants Herbaceous plants
Plot 3
Species richness 7 11 14 6 22
Abundance 30 107* 125* 8 133.75*
Diversity index (H) 1.57 1.48 2.11 1.73 2.50
* Cover (%) within the 4 m2 plot. Overlap occurred.

DISCUSSIONThe results of Stejlepladsen showed a positive relation between varying vegetation structures and the diversity of vascular plants and inverte-brates. This was expressed in most edge zones across both transects, where diversity of vascular plants generally was higher, possibly due to the particular intermediate conditions of these edge habitats (Magura et al. 2001; and references therein). The edge zone following the tree stand (132) on transect B displayed the highest diversity of vascular plants. This could be due to the sun-exposed slope, which creates variation in microclimate conditions (Robinson & Lundholm, 2012). In addition, the edge zones also displayed a high diversity of invertebrates sampled from both the herbaceous vegetation and in pitfall traps. This suggests, that the soft, ecocline edges from light-open to enclosed vegetation struc-tures constitute valuable habitats for many invertebrate species (Duelli et al., 2002; Magura et al., 2001).
In general, the woody vegetation elements appeared only moderately diverse, as they consisted of only a few species. The wide and dense thicket in transect A was only slightly more diverse than the smaller clusters of trees seen in both transects which only consisted of a few individuals. However, altogether these different elements formed a complex vegetation structure, which could explain the high diversity of invertebrates collected both from woody vegetation and the herbaceous vegetation across both transects (Strauss & Biedermann, 2006). The par-ticular plant species present at Stejlepladsen may also have contributed to the diverse assemblages of invertebrates. Although neither of the transects expressed a high diversity of woody species, the abundance of individuals belonging to the families of Rosaceae and Betulaceae could have had a positive effect on the collections of invertebrates (Kennedy & Southwood, 1984; Leather, 1986).
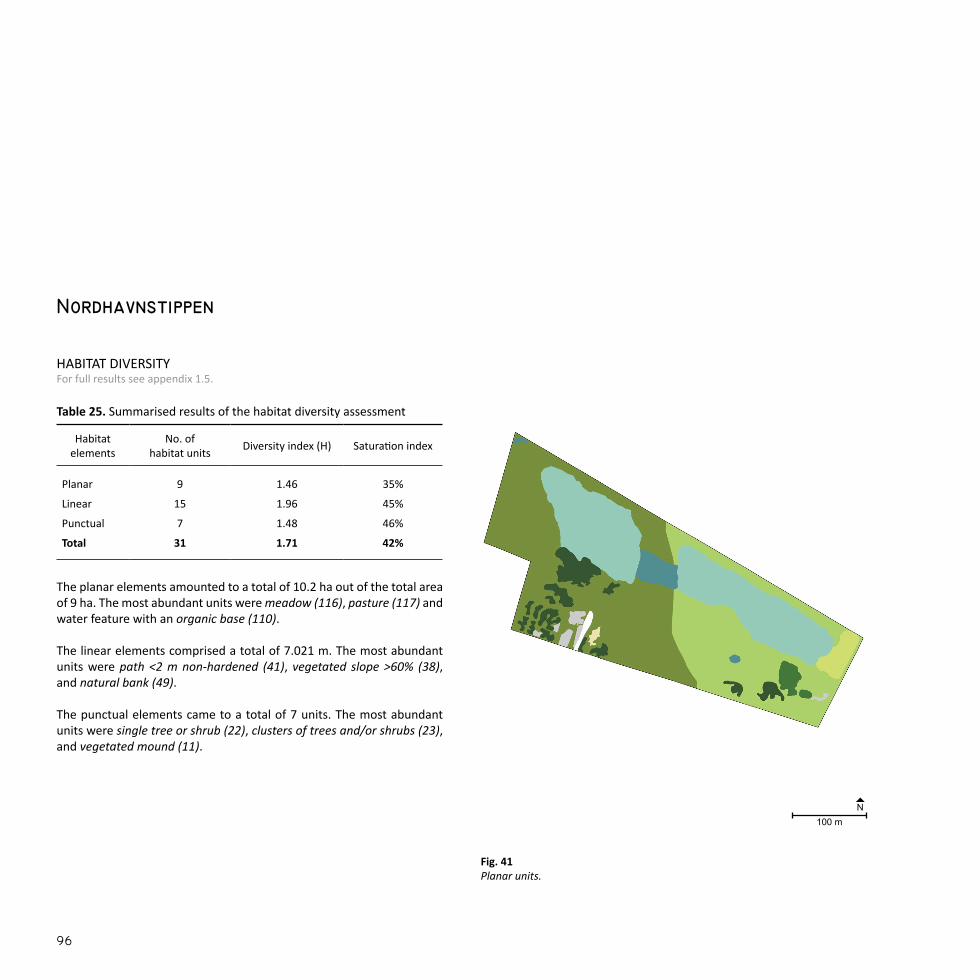
Fig. 41Planar units.
The planar elements amounted to a total of 10.2 ha out of the total area of 9 ha. The most abundant units were meadow (116), pasture (117) and water feature with an organic base (110).
The linear elements comprised a total of 7.021 m. The most abundant units were path <2 m non-hardened (41), vegetated slope >60% (38), and natural bank (49).
The punctual elements came to a total of 7 units. The most abundant units were single tree or shrub (22), clusters of trees and/or shrubs (23), and vegetated mound (11).
HABITAT DIVERSITYFor full results see appendix 1.5.
Habitat elements
No. of habitat units Diversity index (H) Saturation index
Planar 9 1.46 35%
Linear 15 1.96 45%
Punctual 7 1.48 46%
Total 31 1.71 42%
Table 25. Summarised results of the habitat diversity assessment
Nordhavnstippen
100 mN

Fig. 42Linear units.
Fig. 43Punctual units.
100 mN
100 mN

Two transects were placed at Nordhanstippen. Each had a length of 50 m and intersected habitat units such as meadow, pasture, thicket, and a grove.
TRANSECT SURVEY
Fig. 44Placement of transect A and B.
AAA
B BB
100 mN

Nordhavnstippen

The thicket (123) consisted only of Salix caprea and therefore scored a diversity index of 0.
The meadow in between the woody vegetation elements reached a di-versity index of 2.31. Out of 17 registered species within the plot, 6 were grasses including species such as Agrostis gigantea, Agrostis stolonifera, and Festuca rubra. In total, the grasses covered approximately 55% of the plot. Trifolium campestre and mosses were dominating with a cover of approximately 24% and 17%, respectively. Additional species such as Lotus corniculatus, Medicago lupulina, and Taraxacum spp. covered smaller areas. Of the 17 registered species only Melilotus alba was non-native.
The cluster of trees and shrubs (23) consisted of two species; Salix caprea and Sorbus intermedia.
In the wide meadow surface 27 species were registered within the plot of which 8 species were grasses such as Arrhenatherum elatius, Lolium perenne, and Poa palustris. Grasses covered 69% of the plot, while Achil-lea millefolium, Plantago lanceolata, Tanacetum corymbosum, Trifolium
SPECIES DIVERSITY
Transect A - 50 m (Fig. 45)For full results see appendix 3.5 for invertebrates and appendix 4.5 for herba-ceous and woody vegetation.
campestre, and Vicia hirsuta in total covered approximately 80% of the plot. Additional species such as Medicago lupulina, Trifolium repens, Taraxacum spp., and Solidago sp. covered only limited areas. Of the 27 species five were non-native.
Pitfall trap 1 was lost. The collection of invertebrates obtained from pit-fall trap 2 placed in the meadow had a diversity index of 3.12. The col-lection comprised 109 individuals distributed between 30 species from 10 orders and one class. The most abundant and diverse order was spi-ders (Araneae) with 28 individuals and 7 species followed by gastropods (Stylommatophora) with 21 individuals and 3 species and beetles (Co-leoptera) with 16 species and 6 species.The rest of the individuals were distributed between orders such as crustaceans (Isopoda), springtails (Collembola) and millipedes (Julida).
Invertebrates sampled from the herbaceous vegetation of the meadow in plot 2 reached a diversity of 3.40. The 89 sampled individuals were distributed between 47 species from 9 orders. The most abundant and diverse order was flies (Diptera) with 22 individuals and 17 species fol-lowed by beetles (Coleoptera) with 19 individuals and 7 species and gas-tropods (Stylommatophora) with 18 individuals and 3 species. The rest of the invertebrates were distributed between orders such as hymenop-terans (Hymenoptera), true bugs (Hemiptera), and spiders (Araneae).
The invertebrates collected from woody vegetation scored a diversity index of 1.52. The collection comprised 157 individuals distributed be-tween 18 species from 6 orders. Hymenopterans (Hymenoptera) was the most abundant order with 88 individuals and 2 species. The most diverse order was true bugs (Hemiptera) with 56 individuals and 6 spe-cies. The rest of the individuals were distributed between the orders of spiders (Araneae), beetles (Coleoptera), flies (Diptera), and gastropods (Stylommatophora).
Habitat no. Species richness Abundance Diversity index (H)
(23) 2 3 0.69
(116) 18 112.25* 2.31
(116) 28 185.25* 2.93
(123) 1 2 0
Table 26. Summarised results of the species diversity assessment for vascular plants in each habitat unit
* Cover (%) within the 4 m2 plot. Overlap occurred.

Dive
rsity
inde
x (H
)
H=1.52
H=3.08
H=3.40
PT 2Plot 2
Cluster of trees and shrubs (23)
Meadow (116)
Meadow (116)
Thicket (123)
Fig. 45Transect A - 50 m.
A AA
1
2
3
Diversity of invertebrates sampled from herbaceous vegetation
Diversity of invertebrates sampled from woody vegetation
Present vertical layers of vegetation
Diversity of invertebrates samples in pitfall traps
Diversity of vascular plants

In the pasture a total of 19 species were registered within the plot of which 6 were grasses such as Festuca rubra, Phalaris arundinacea, and Poa compressa. The grasses covered approximately 95% of the plot. Oth-er species such as Trifolium campestre, Trifolium repens, Daucus carota, Taraxacum spp., and mosses covered limited areas. Of these 19 species three were non-native.
The collection of invertebrates obtained from pitfall trap 3 placed in the pasture scored a diversity index of 1.92. The 116 individuals were distrib-uted between 18 species from 9 orders. The most abundant order was crustaceans (Isopoda) with 55 individuals followed by hymenopterans (Hymenoptera) with 20 individuals. Spiders (Araneae) was the most di-verse order with 15 individuals and 4 species. The rest of the individuals were distributed between orders such as beetles (Coleoptera), flies (Dip-tera) and millipedes (Julida).
The intersected part of the grove differed slightly from the norm by com-prising vegetation in the shrub layer. The shrub layer consisted of two species; Rosa sp. and Symphoricarpos albus. The upper canopy layer consisted of Salix caprea and Ulmus glabra, while the lower canopy layer consisted of Salix caprea, Sorbus aucuparia, and Prunus cerasifera. Of
SPECIES DIVERSITY
Transect B - 50 m (Fig. 46)For full results see appendix 3.5 for invertebrates and appendix 4.5 for herba-ceous and woody vegetation.
the 6 registered species two were non-native. The herb layer was scarce with only a few sporadic tufts of grasses on otherwise bare soil with some leaf litter.
Pitfall trap 4 placed in the grove displayed a collection of invertebrates that resulted in a diversity index of 2.10. The 159 sampled individuals were distributed between 22 species from 9 orders. The most abundant and diverse order was crustaceans (Isopoda) with 80 individuals and 4 species, followed by beetles (Coleoptera) with 33 individuals and 6 spe-cies and hymenopterans (Hymenoptera) with 24 individuals and 2 spe-cies.The rest of the individuals were distributed between spiders (Ara-neae), millipedes (Julida), and springtails (Collembola).
The invertebrates collected from woody vegetation scored a diversity index of 1.80. The collection comprised 87 individuals distributed on 21 species from 6 orders. True bugs (Hemiptera) was the most abundant and diverse order with 57 individuals and 4 species, followed by flies (Diptera) with 11 individuals and 3 species and hymenopterans (Hyme-noptera) with 8 individuals and 4 species. The rest of the individuals were distributed between the orders beetles (Coleoptera), lepidopter-ans (Lepidoptera), and spiders (Araneae).
Habitat no. Species richness Abundance Diversity index (H)
(22) 1 1 0
(117) 20 148.75* 2.52
(124) 6 11 1.54
Table 27. Summarised results of the species diversity assessment for vascular plants in each habitat unit
* Cover (%) within the 4 m2 plot. Overlap occurred.

Dive
rsity
inde
x (H
)
H=2.10
H=1.80H=.1.92
PT 4PT 3
Single shrub (22)
Grove (124)
Pasture (117)
Ditch (44)
Fig. 46Transect B - 50 m.
B
BB
1
2
3
Diversity of invertebrates sampled from herbaceous vegetation
Diversity of invertebrates sampled from woody vegetation
Present vertical layers of vegetation
Diversity of invertebrates samples in pitfall traps
Diversity of vascular plants
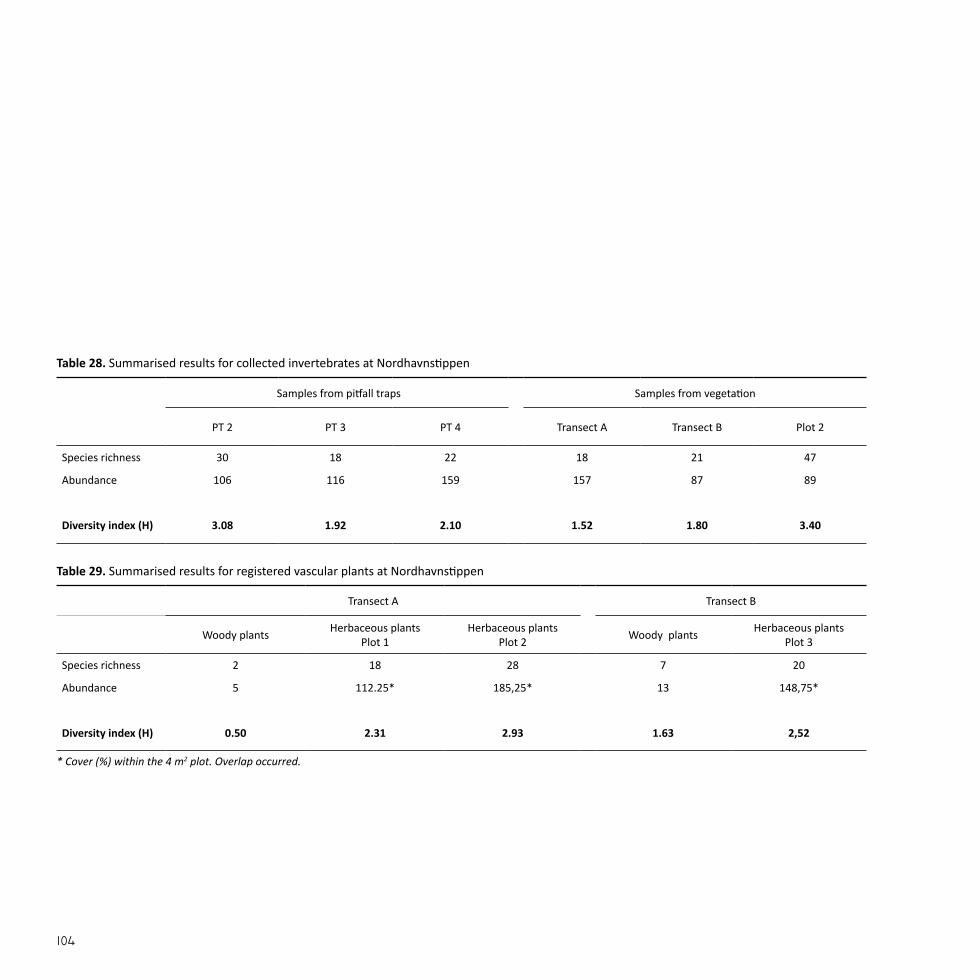
Table 29. Summarised results for registered vascular plants at Nordhavnstippen
Table 28. Summarised results for collected invertebrates at Nordhavnstippen
* Cover (%) within the 4 m2 plot. Overlap occurred.
Samples from pitfall traps Samples from vegetation
PT 2 PT 3 PT 4 Transect A Transect B Plot 2
Species richness 30 18 22 18 21 47
Abundance 106 116 159 157 87 89
Diversity index (H) 3.08 1.92 2.10 1.52 1.80 3.40
Transect A Transect B
Woody plants Herbaceous plantsPlot 1
Herbaceous plantsPlot 2 Woody plants Herbaceous plants
Plot 3
Species richness 2 18 28 7 20
Abundance 5 112.25* 185,25* 13 148,75*
Diversity index (H) 0.50 2.31 2.93 1.63 2,52
DISCUSSIONNordhavnstippen gained only moderate diversity indices for woody veg-etation in both transects. The diversity was highest in transect B, which displayed more complex compositions of woody plants. The collection of invertebrates sampled from the woody vegetation in each transect did not differ significantly, yet the collection from transect B was slightly higher. Similarly, this could be due to the more complex plant compo-sition, but also the structure of vegetation. The dense edge consisting largely of Prunus cerasifera could account for the abundance of cater-pillars collected there, as the Prunus genus constitute fodder plants for the larvae of a number of lepidopterans (Trolle, 2010). In addition, the vast amount of sampled herbivores such as aphids (Hemiptera: Aphidi-dae) seemed to correspond with the abundance of Salix spp. across both transects (Kennedy & Southwood, 1984).
Once again, structural variation of grassland habitats showed to increase species richness and diversity of herbaceous plants and associated in-vertebrate fauna. This was evident from both meadow and pasture, yet plant diversity was slightly lower in the pasture. This was possibly due to the grazing sheep, which promote grasses and therefore a more species poor plant composition (Buttenschön, 2000). Species within the families of Asteraceae and Fabaceae were particularly abundant in both meadow and pasture. This may account for the diverse collection of invertebrates sampled from the herbaceous vegetation, as these plant families are particularly favourable for many species, especially pollinators (Carlton, 2011; Kirk & Howes, 2012).
Although the herb layer was scarce within the grove in transect B, the rather diverse collection of ground dwelling invertebrates suggests that the complexity of other structures present such as old tiles, leaf litter, twigs and branches, and sporadic tufts of grass is important for this group of fauna (Hickerson et al., 2012).

The planar elements amounted to a total of 1.9 ha out of the total area of 3.1 ha. The most abundant units were meadow (116) and lawn (113) followed by thicket (123).
The linear elements amounted to a total of 6.483 m. The most abundant units were hedgerow (61), path >2 m half-hardened (42), and path <2 m half-hardened (40).
The punctual elements came to a total of 12 units. Single tree or shrub (22), cluster of trees and/or shrubs (23), wood chips (6), and piles of branches (5) were the most abundant units.
HABITAT DIVERSITYFor full results see appendix 2.6.
Table 30. Summarised results of the habitat diversity assessment
Amagerbanen
Habitat elements
No. of habitat units Diversity index (H) Saturation index
Planar 7 1.23 30%
Linear 15 2.36 54%
Punctual 12 2.18 68%
Total 34 2.06 54%

Fig. 47Planar units.
Fig. 48Linear unit.
Fig. 49 Punctual units.
100 mN
100 mN
100 mN

At Amagerbanen three transects were laid out. Transect A had length of 50 m while transect B and C each had a length of 25 m. These tran-sects intersected light open as well as closed vegetation types such as meadow, tree stands and hedgerows.
TRANSECT SURVEY
Fig. 50Placement of transect A, B, and C.
ABB
CC
AA
B
C
100 mN

Amagerbanen

In the meadow (116) a total of 20 species were registered within the plot. The four grasses; Calamagrostis sp., Dactylis glomerata, Festuca rubra, and Poa trivialis covered approximately 47% of the plot. Achillea millefolium, Plantago lanceolata, and Trifolium campestre dominated the plot with a total cover of approximately 54%, while mosses covered 30%. Species such as Melampyrum pratense, Pilosella officinarum, Vicia sativa spp. nigra, and Myosotis arvensis covered limited areas. Of the 20 registered species, three were non-native and one species; Pastinaca sativa var. sativa, was invasive.
The invertebrates collected from pitfall trap 1 placed in the meadow reached a diversity index of 2.68. The 169 collected individuals were dis-tributed between 45 species from 11 orders and 2 classes. The most abundant and diverse order was crustaceans (Isopoda) with 90 individu-als and 4 species, followed by beetles (Coleoptera) with 23 individuals and 9 species. The rest of the individuals were distributed between or-ders such as flies (Diptera), spiders (Araneae), worms (Haplotaxida), and hymenopterans (Hymenoptera).
SPECIES DIVERSITY
Transect A - 50 m (Fig. 51)For full results see appendix 3.6 for invertebrates and appendix 4.6 for herba-ceous and woody vegetation.
The two single trees (22) consisted of Salix caprea and Betula pubescens and the single shrub (22) of Rubus fruticosus.
The tree stand (131) was multi-layered and deciduous with an upper canopy cover of 10-30% and consisted of 4 species, of which all were na-tive. The upper and lower canopy layers included Betula pubescens and Salix caprea, while the shrub layer consisted of Ulmus glabra and Rosa canina ssp. canina.
Pitfall trap 2 placed in the tree stand displayed a collection of inverte-brates that reached a diversity index of 1.95. The 41 individuals were distributed between 14 species from 6 orders and one class. Hymenop-terans (Hymenoptera) was the most abundant order with 20 individuals. The most diverse order was beetles (Coleoptera) with 8 individuals and 4 species, followed by springtails (Collembola) with 7 individuals and 3 species. The rest of the individuals were distributed between the orders true bugs (Hemiptera), spiders (Araneae) and the class of gastropods (Gastropoda).
The invertebrates collected from the woody vegetation scored a diver-sity of 2.63. The collection comprised 97 individuals distributed between 24 species from 6 orders. With 52 individuals and 4 species, the most abundant and diverse order was true bugs (Hemiptera), followed by hymenopterans (Hymenoptera), beetles (Coleoptera), and spiders (Ara-neae). The rest of the individuals were distributed between the orders of lepidopterans (Lepidoptera) and gastropods (Stylommatophora).
Habitat no. Species richness Abundance Diversity index (H)
(22) x 3 1 1 0
(116) 20 168* 2.31
(131) 4 16 0.99
Table 31. Summarised results of the species diversity assessment for vascular plants in each habitat unit
* Cover (%) within the 4 m2 plot. Overlap occurred.

Dive
rsity
inde
x (H
)
H=1.95
H=2.86
H=.2.36
PT 2PT 1
Single tree (22)
Single tree (22)
Single shrub (22)
Tree stand, 10-30%, 2-layered (131)
Meadow (116)
Fig. 51Transect A - 50 m.
A AA
1
2
3
Diversity of invertebrates sampled from herbaceous vegetation
Diversity of invertebrates sampled from woody vegetation
Present vertical layers of vegetation
Diversity of invertebrates samples in pitfall traps
Diversity of vascular plants

The hedgerow (61) to the left had a lower canopy layer of two species; Acer campestre and Prunus cerasifera and a shrub layer of Crataegus monogyna and Prunus cerasifera of which the latter were non-native.
The hedgerow the to right had a lower canopy layer of Prunus ceras-ifera and Crataegus monogyna and a shrub layer of Prunus cerasifera and Sambucus nigra that formed a one-layered ecotone edge towards a sports field. The herb layer in the hedgerow had a diversity of 1.29 and was dominated by bare soil which covered approximately 59% of the plot. A total of 6 species were present of which all were native. Most abundant were Allaria petiolata with a cover of approximately 17% fol-lowed by Chaerophyllum temulum and Lamium album.
The invertebrates collected from the woody vegetation reached a diver-sity index of 2.36. The collection comprised 60 individuals distributed between 21 species from 5 orders. The most abundant and diverse order was lepidopterans (Lepidoptera) with 30 individuals and 6 species, fol-lowed by true bugs (Hemiptera) with 12 individuals and 4 species. The rest of the individuals were distributed between spiders (Araneae), bee-tles (Coleoptera), and flies (Diptera).
SPECIES DIVERSITY
Transect B - 25 m (Fig. 52)For full results see appendix 3.6 for invertebrates and appendix 4.6 for herba-ceous and woody vegetation.
The collection of invertebrates obtained from pitfall trap 3 placed in the hedgerow comprised 56 individuals distributed between 16 species from 8 orders and scored a diversity index of 1.95. The most abundant order was spiders (Araneae) with 26 individuals. With 13 individuals and 4 species beetles (Coleoptera) was the most diverse order. The rest of the individuals were distributed between hymenopterans (Hymenop-tera), flat-backed millipedes (Polydesmida), and harvestmen (Opiliones).
The invertebrates sampled from the herbaceous vegetation in plot 2 placed in the edge of the hedgerow comprised 53 individuals distrib-uted between 27 species from 8 orders and reached a diversity index of 2.95. The most abundant and diverse order was true bugs (Hemiptera) with 20 individuals and 4 species, followed by hymenopterans (Hyme-noptera) with 13 individuals and 5 species. The rest of the individuals were distributed between flies (Diptera), spiders (Araneae), and beetles (Coleoptera).
Habitat no. Species richness Abundance Diversity index (H)
(61) 3 9 0.85
(61) 3 11 0.60
Table 32. Summarised results of the species diversity assessment for vascular plants in each habitat unit

Dive
rsity
inde
x (H
)
H=2.95
H=1.95
H=.2.36
Plot 2PT 3
Hedgerow(61)
Hedgerow(61)
Fig. 52Transect B - 25 m.
BBB
1
2
3
Diversity of invertebrates sampled from herbaceous vegetation
Diversity of invertebrates sampled from woody vegetation
Present vertical layers of vegetation
Diversity of invertebrates samples in pitfall traps
Diversity of vascular plants

The hedgerow to the left (61) had a lower canopy layer of Acer camp-estre and a shrub layer of Acer campestre and Crataegus monogyna of which all species were native.
The hedgerow (61) the to right consisted of a lower canopy layer of Acer campestre, Malus sylvestris, Sorbus aucuparia, and Crataegus monogy-na. The shrub layer only consisted of Rubus armeniacus. The hedgerow formed a two-layered ecotone edge towards the adjoining lawn.
In the herb layer in between the two hedgerows the plot was dominated by Chaerophyllum temulum which covered approximately 52%, followed by Aegopodium podagraria and Geum urbanum with a cover of approxi-mately 11% and 14%, respectively. Species such as Allaria petiolata, Ga-lium aparine, and Anthriscus sylvestris covered additional small areas, and bare soil approximately 16%. Of the 9 registered species only Aego-podium podagraria and Heracleum mantegazzianum were non-native, and the latter also invasive. The herb layer had a diversity of 1.52.
Pitfall trap 4 placed in the edge between the hedgerow and the lawn displayed a collection of invertebrates that comprised 107 individuals distributed between 16 species from 8 orders. The collection reached a diversity index of 1.37. The most abundant order was hymenopter-
SPECIES DIVERSITY
Transect C - 25 m (Fig. 53)For full results see appendix 3.6 for invertebrates and appendix 4.6 for herba-ceous and woody vegetation.
ans (Hymenoptera) with 72 individuals, followed by beetles (Coleoptera) with 14 individuals. Spiders (Araneae) was the most diverse order with 11 individuals and 4 species. The rest of the individuals were distributed between flies (Diptera), true bugs (Hemiptera), and lepidopterans (Lepi-doptera).
The invertebrates sampled from woody vegetation reached a diversity index of 2.42. The 103 collected individuals were distributed between 25 species from 8 orders. True bugs was the most abundant and diverse order with 40 individuals and 5 species, followed by lepidopterans (Lepi-doptera) with 27 individuals and 1 species. Other represented orders such as spiders (Araneae), hymenopterans (Hymenoptera), beetles (Co-leoptera) and the subclass of arachnids (Acari) comprised only a few specimens
Habitat no. Species richness Abundance Diversity index (H)
(61) 2 5 0.50
(61) 5 5 1.61
Table 33. Summarised results of the species diversity assessment for vascular in each habitat unit

Dive
rsity
inde
x (H
)
H=1.37
H=.2.42
PT 4
Hedgerow(61)
Hedgerow(61)
Lawn(113)
Fig. 53Transect C - 25 m.
C CC
1
2
3
Diversity of invertebrates sampled from herbaceous vegetation
Diversity of invertebrates sampled from woody vegetation
Present vertical layers of vegetation
Diversity of invertebrates samples in pitfall traps
Diversity of vascular plants

Table 35. Summarised results for registered vascular plants at Amagerbanen
Table 34. Summarised results for collected invertebrates at Amagerbanen
* Cover (%) within the 4 m2 plot. Overlap occurred.
Samples from pitfall traps Samples from vegetation
PT 1 PT 2 PT 3 PT 4 Transect A Transect B Transect C Plot 2
Species richness 45 14 16 16 24 21 25 27
Abundance 169 41 56 107 97 60 103 53
Diversity index (H) 2.86 1.95 1.95 1.37 2.36 2.36 2.42 2.95
Transect A Transect B Transect C
Woody plants Herbaceous plantsPlot 1 Woody plants Herbaceous plants
Plot 2 Woody plants Herbaceous plantsPlot 3
Species richness 7 20 4 7 5 10
Abundance 23 168* 19 102,50* 10 103,50*
Diversity index (H) 1.54 2.31 0.85 1.29 1.36 1.52

DISCUSSIONAmagerbanen displayed particularly high diversity of vegetation within the meadow in transect A, which was characterised by a low cover of grasses and an abundance of flowering herbs. Species belonging to the families Asteraceae and Fabaceae could be a contributing factor to the rich collection of invertebrates sampled in pitfall trap 1 placed in the meadow and from the shrubs (Carlton, 2011; Kirk & Howes, 2012).
Across all transects, the collections of invertebrates sampled from woody vegetation was relatively diverse. This could be due to the abundance of native trees and shrubs belonging to the families Salicaceae, Betulaceae, and Rosaceae (Kennedy & Southwood, 1984; Leather, 1986), as the col-lection of invertebrates displayed abundant assemblages of herbivorous insects from the order Hemiptera (Helden et al., 2012). In addition, the abundance of the species Prunus cerasifera in the hedgerows in transect B could account for the rich assemblages of caterpillars collected here (Trolle, 2010).
The collections of ground dwelling invertebrates were more diverse in the open meadow vegetation than in the enclosed vegetation types. This suggests that the openness, the sun exposure, and the high structural complexity and diversity of flowering herbs creates a valuable habitat for invertebrates (Noordijk et al., 2010). The pitfall traps placed within woody vegetation elements gained similar diversity indices, most likely because the vegetation structure was also similar. Pitfall trap 4, which was placed in the edge of the hedgerow in transect C was less diverse, however, this could very well be due to the fact that the lid of the trap had been pressed down at some point during the collection period so that it covered the opening.

HABITAT DIVERSITY
OVERALL RESULTSThe number of mapped habitat units per case area ranged between 18 and 57. Three habitat units appeared in all six areas; single tree or shrub (22), cluster of trees and/or shrubs (23) and path >2m not hardened (43). Of these three, habitat unit (22) and (23) were also among the most abundant in all case areas. The total habitat diversity index varied be-tween 1.34 and 2.06 resulting in a total saturation index ranging from 33% to 54%. The saturation index for planar units varied between 13% and 45%, that of linear units between 35% and 54% and that of punctual units between 24% and 72%. The overall results of the studies are shown in Table 40.
FORMAL GREEN SPACESThe number of mapped habitat units per formal green space ranged from 18 to 57. They had a total of 69 different habitat units between them distributed on 26 planar, 25 linear and 18 punctual units. A total of 6 habitat units appeared in all three formal green spaces (Table 36). Among these were lawn (52) and single tree or shrub (22) which along with ornamental garden: bushes (54) were among the most abundant units in all formal green spaces (Table 37). The total habitat diversity index varied between 1.34 and 2.02 and the saturation index between 33% and 52%. With an average of 35 habitat units, the formal green spaces gained an average habitat diversity index of 1.7 and an average saturation index of 43%. INFORMAL GREEN SPACESThe number of mapped habitat units per informal green space ranged from 26 to 34. They had a total of 51 different habitat units between them distributed on 15 planar, 21 linear and 15 punctual units. A total of 14 habitat units appeared in all three informal green spaces (Table 36). Among these, meadow (116) was the most abundant in all informal green spaces followed by thicket (123), single tree and/or shrub (22), cluster of trees and/or shrubs (23), vegetated slope 30-60% (36) and veg-
etated slope >60% (38) (Table 37). The total habitat diversity index varied between 1.38 and 2.06 and the saturation index between 38% and 54%. With an average of 30 habitat units the informal green spaces reached an average habitat diversity index of 1.7 and an average saturation index of 44%.
Collective results of the formal and informal case areas
Formal green spaces Informal green spaces
Single tree or shrub (22) Boulders (3)
Cluster of trees and/or shrubs (23) Vegetated mound (11)
Path >2m not hardened (43) Soil mound (13)
Lawn (52) Single tree or shrub (22)
Gravel or sand (103) Cluster of trees and/or shrubs (23)
Lawn (113) Vegetated slope 10-30% (34)
Vegetated slope 10-30% facing south (35)
Vegetated slope 30-60% (36)
Vegetated slope >60% (38)
Vegetated slope >60% facing south (39)
Path <2m not hardened (41)
Path >2m not hardened (43)
Meadow (116)
Thicket (123)
Table 36. The habitat units present in all formal or informal green spaces

Habitat no. Description Fæ En Mi St No Am
7, 52, 113 Lawn x x x x
64, 124 Grove x x x
75, 135 Multi-layered deciduous tree stand 30-80% x x
72, 132 Multi-layered deciduous tree stand 10-30% x x x x
123 Thicket x x x x
9, 54, 116 Meadow x x x x
61 Hedgerow x x
22 Single tree or shrub x x x x x x
71, 131 Two-layered deciduous tree stand 10-30% x x
23 Cluster of trees and/or shrubs x x x x x
20, 57, 120 Ornamental garden: bushes x x x
21, 58, 121 Ornamental garden: perennials x x
62, (63) Tree row (or alley) x x x
59 Sheared hedge x x
38 Vegetated slope >60% x x x x x
36 Vegetated slope 30-60% x x x x x
117 Pasture x
74, 134 Two-layered deciduous tree stand 30-80% x x
The most (x) and next (x) abundant habitat units within the six case areas.
Table 37. Most abundant habitat units within the six case areas

DIVERSITY OF VASCULAR PLANTS
OVERALL RESULTSThe number of woody plant species per area ranged from 8 to 20 while the number of herbaceous species ranged from 16 to 43 (Table 40). In total, the six case areas had 56 woody species and 109 herbaceous spe-cies between them. Out of these, 20 woody species and 28 herbaceous species were non-native, furthermore 3 herbaceous species were inva-sive. The six case areas had an average proportion of non-native species of 29% and varied between 20% and 48% per case area (Table 38).
No one woody species occurred in all areas, however different species from the genus Prunus were present across both types of green spaces. Across the different case areas Crataegus monogyna, Sambucus nigra, Prunus cerasifera, and different species of Rosa were among the most abundant. Different species belonging to the genus Taraxacum occurred in all case areas, but no single specific herbaceous species appeared in all six areas. Across all six case areas the diversity index of woody veg-etation varied between 1.55 and 2.36 and the diversity index for herba-ceous vegetation between 1.39 and 3.78.
FORMAL GREEN SPACESThe number of different woody species per formal green space varied between 13 and 20. They had a total of 42 different woody species be-tween them, of which 16 were non-native. The number of individual woody plants varied between 31 and 68 and the proportion of non-
native individuals between 7% and 57%. No single woody species was present in all three formal green spaces (Table 39). The most abundant species were Sambucus nigra, Rosa spp., Ribes alpinum, and Crataegus monogyna. The diversity index for woody vegetation varied between 1.67 and 2.36.
The number of herbaceous species varied between 16 and 26. The for-mal green spaces had a total of 50 different herbaceous species between them, of which 16 were non-native and 1 also invasive. The proportion of non-native plant cover within the plots varied between 59% and 81% (Table 38). Four species occurred in all three areas, e.g. Taraxacum spp., Lolium perenne, Poa annua, and Trifolium repens (Tabel 39). Of the total array of herbaceous species 6 species were grasses. The diversity index of herbaceous vegetation varied between 1.39 and 2.43.
INFORMAL GREEN SPACESThe number of different woody species per informal green space var-ied between 8 and 13. They had a total of 21 different woody species between them, of which 5 were non-native. The number of individual woody plants varied between 18 and 52 and the proportion of non-na-tive individuals between 17% and 39%. The species Crataegus monogy-na, Prunus cerasifera, and Ulmus glabra occurred in all areas (Table 39). The most abundant species included Prunus cerasifera, Salix caprea, and Laburnum anagyroides. The diversity index for woody vegetation varied between 1.55 and 1.94.
Fælledparken Enghaveparken Mimersparken Stejlepladsen Nordhavnstippen Amagerbanen
Non-native herbaceous species 27% 41% 35% 23% 19% 23%
Abundance of non-native herbaceous plants* 66% 81% 59% 14% 22% 7%
Non-native woody species 22% 56% 31% 27% 25% 15%
Abundance of non-native woody plants 7% 57% 29% 39% 17% 29%
Total non-native species 25% 48% 33% 24% 20% 21%
Table 38. The proportion of registered non-native vascular plants within the six case areas
* Total percentage cover of non-native species within all three 4m2 plots.

The number of herbaceous species varied between 30 and 43. They had 77 herbaceous species between them, of which 16 were non-native and 2 also invasive. The proportion of non-native plant cover within each plot varied between 7% and 22%. Seven species were present in all three areas, e.g. Trifolium campestre, Festuca rubra, and Tragopogon praten-sis ssp. minor (Table 39). Of the total array of herbaceous species 19 spe-cies were grasses. The diversity index for herbaceous vegetation varied between 2.27 and 3.78.
Formal green spaces Informal green spaces
Herbaceous species: Herbaceous species:
Lolium perenne Arrhenatherum eliatus
Poa annua Bryophytes
Taraxacum ssp. Dactylis glomerata
Trifolium repens Festuca rubra
Bare soil Taraxacum ssp.
Tragopogon pratensis ssp. minor
Trifolium campestre
Bare soil
Woody species:
Crataegus monogyna
Prunus cerasifera
Ulmus glabra
Table 39. The vascular plant species present in all formal or informal green spaces.
DIVERSITY OF INVERTEBRATES
OVERALL RESULTSAcross all six case areas the number of individuals sampled in pitfall traps ranged from 228 to 646 and the number of species from 55 to 83. The diversity index for invertebrates sampled in pitfall traps ranged from 2.68 to 3.46. The number of individuals sampled from woody vegeta-tion ranged from 93 to 224 and the number of species from 29 to 77. The diversity index for invertebrates sampled from vegetation ranged from 1.81 to 3.34. The number of individuals sampled from herbaceous ranged from 4 to 89 and the number of species from 4 to 47. The diver-sity index for invertebrates sampled from vegetation ranged from 1.04 to 3.40.
FORMAL GREEN SPACESAcross the formal green spaces the number of individuals sampled in pitfall traps ranged from 228 to 646 and the number of species from 60 to 83. The diversity index ranged from 2.85 to 3.39. The number of indi-viduals sampled from woody vegetation ranged from 93 to 205 and the number of species from 29 to 77. The diversity index ranged from 2.48 to 3.34. The number of individuals sampled from herbaceous vegetation ranged from 4 to 8 and the number of species from 4 to 6. The diversity index ranged from 1.04 to 1.73.
INFORMAL GREEN SPACESAcross the formal green spaces the number of individuals sampled in pitfall traps ranged from 373 to 625 and the number of species from 55 to 78. The diversity index ranged from 2.68 to 3.46. The number of in-dividuals sampled from woody vegetation ranged from 151 to 224 and the number of species from 36 to 64. The diversity index ranged from 1.81 to 2.93. The number of individuals sampled from herbaceous veg-etation ranged from 35 to 89 and the number of species from 20 to 47. The diversity index ranged from 2.73 to 3.40.

Formal green spaces Informal green spaces
Fælledparken32 ha
Enghaveparken3.6 ha
Mimersparken3.8 ha
Stejlepladsen3.2 ha
Nordhavn9 ha
Amagerbanen3.1 ha
Planar units
No. of planar units (max = 62) 23 8 3 6 9 7
Diversity of planar units (Hmax = 4.13) 1.86 1.45 0.66 0.53 1.46 1.23
Saturation index (%)* 45 35 16 13 35 30
Linear units
No. of linear units (max = 77) 19 11 10 8 15 15
Diversity of linear units (Hmax = 4.34) 1.97 1.97 1.83 1.51 1.96 2.36
Saturation index (%)* 45 45 42 35 45 54
Punctual units
No. of punctual units (max = 25) 15 10 5 12 7 12
Diversity of punctual units (Hmax = 3.22) 2.31 1.87 0.76 1.72 1.48 2.18
Saturation index (%)* 72 58 24 53 46 68
Habitats
Total no. of habitat units (max = 164) 57 29 18 26 31 34
Total diversity of habitat units** 2.02 1.79 1.34 1.38 1.71 2.06
Total saturation index (%)** 52 47 33 38 42 54
Vascular plants
No. of individual woody plants 68 40 31 38 18 52
No. of woody species 20 18 13 11 8 13
Diversity of woody plants** 2.36 1.91 1.67 1.94 1.55 1.61
No. of herbaceous species 26 22 16 30 43 30
Diversity of herbaceous plants** 1.39 2.04 2.43 3.25 3.78 2.27
Invertebrates
No. of individuals sampled from herbaceaous vegetation 8 4 4 35 89 53
No. of species sampled from herbaceous vegetation 6 6 4 20 47 27
Diversity of invertebrates sampled from vegetation** 1.73 1.04 1.39 2.73 3.40 2.95
No. of individuals sampled in pitfall traps 228 646 380 625 384 373
No. of species sampled in pitfall traps 60 83 80 62 55 78
Diversity of invertebrates sampled in pitfall traps** 3.29 2.85 3.39 3.46 3.17 2.68
No. of individuals sampled from woody vegetation 205 93 120 151 224 206
No. of species sampled in woody vegeation 77 60 29 49 36 64
Diversity of invertebrates sampled from vegetation** 3.34 3.10 2.48 2.93 1.81 2.60
Table 40. Summarised results of the biodiversity assessment habitat diversity and species diversity of vascular plants and invertebrates for all six case areas
*The ratio between the calculated diversity index and the maximum potential diversity index (Hmax). **Weighted average

Fælle
dparken
Enghav
eparken
Stejle
pladsen
Nordhavnsti
ppen
Amagerban
en
Mimersp
arken
1
2
3
4
Fig. 54Comparing diversity across all case areas.
Diversity of habitats Diversity of herbaceous vegetation Diversity of invertebrates sampled from herbaceous vegetation
Diversity of woody vegetation Diversity of invertebrates sampled in pitfall traps
Diversity of invertebrates sampled from woody vegeation
Dive
rsity
inde
x (H
)

The results of the biodiversity assessment did not unanimously confirm the stated hypothesis that a higher level of biodiversity uniformly ex-ists within informal green spaces than in formal green spaces. Yet, each biodiversity indicator, i.e. habitat and species diversity, did reveal differ-ences between the two types of green spaces which point towards cer-tain factors that promote biodiversity. FORMAL GREEN SPACE DESIGNS PROMOTE HABITAT DIVERSITYPrevious studies have stated that formal green spaces often comprise high habitat heterogeneity due to complex landscape designs (Nielsen et al., 2013; Ahern, 2007; Hermy & Cornelis, 2004). This was confirmed by the case studies, as the formal green spaces had more habitat units between them than the informal green spaces both in terms of planar, linear, and punctual units, but also combined. The range of habitat units between the formal green spaces was greater compared to that of the informal green spaces and in addition, only a few habitat units occurred in all three formal green spaces. This suggests that depending on the complexity of their designs, formal green spaces have a good basis for supporting habitat heterogeneity.
The value of complex designs in supporting habitat diversity was clearly reflected in the range of habitat units across the formal green spaces. Notably, this group of green spaces displayed both the highest and the lowest number of habitat units out of all six case areas, due to Fælled-parken and Mimersparken, respectively. This suggests that some de-signs provide a greater variety of habitats. The particular composition of Fælledparken, and also Enghaveparken, is an integrated part of the rec-reational use as the different green elements ensure a variety of scenic expressions. Mimersparken, on the other hand, is a modern playscape with focus on physical activity and social interaction in which case a vari-ation of green elements seems to play a less vital role.
In contrast to the formal green spaces, the range of habitat units be-tween the informal green spaces was small. Adding to this, more than a quarter of the total array of habitat units mapped in the informal green
spaces recurred in all three areas. This suggests that the informal green spaces have relatively similar compositions of habitats which could serve as an advantage on a broader scale. The consistency of habitats across several green spaces may promote ecological stability and as such, these informal green spaces could potentially be valuable ecological refuges for wildlife, provided they are well-distributed throughout the urban landscape (Donovan et al., 2005). Notably, the term ‘stability’ is ambigu-ous (Rebele, 1994). Formal green spaces provide another kind of stabil-ity by means of their relatively static expressions. As such, the habitat heterogeneity and particular habitat structures of formal green spaces persist in both space and time (Gibon, 1984 referenced in Rebele, 1994). However, informal green spaces may provide ‘natural stability’, by which the natural succession ensures stability of ecological development in both space and time (Rebele, 1994).
SIMILARITIES IN HABITAT DIVERSITYWhile the three formal green spaces comprised more habitat units and thereby generally displayed greater habitat diversity, the difference be-tween the formal and informal green spaces was not significant. The range of habitat diversity indices was similar for both types of green spaces and when taking the average results into account the two types of green spaces tied with an average habitat diversity index of 1.7. It appears that informal green spaces can supply equally diverse habitat compositions compared to the formal green spaces. The main difference in the number of habitat units between the formal and informal green spaces was in the planar units. In total, the formal green spaces comprised a greater number of planar units, yet the av-erage diversity index for planar units was almost similar between the two types of green spaces. This is due to the particular weighing of the index. A Shannon diversity index is influenced by evenness and will pre-sent a low value if one or more subjects are particularly more abundant (Magurran, 2004). As such, the similarity in the average diversity indi-cates that the formal green spaces had a less even distribution of planar units. This may likely be due to their particular designs. As the formal
Discussion

green spaces are designated for recreation, certain elements, e.g., lawns and sports fields, constitute a significant part of their total area, as ob-served in Fælledparken and to some extent in Mimersparken. Conse-quently, this reduced the average diversity index of planar elements for the formal green spaces. In contrast, it may be inferred that the informal green spaces have a relatively even distribution of habitat units which further stresses the value of informal green spaces in ensuring a stable distribution of habitats for wildlife.
DIVERSE MEADOWS AND HOMOGENOUS LAWNSDiversity of herbaceous vegetation was higher across the informal green spaces, which had more species between them than the formal green spaces. This was especially to the credit of the unmaintained, tall herba-ceous vegetation in these informal areas which generally displayed very complex plant compositions. In accordance with findings by Robinson & Lundholm (2012) it appeared that the particular debris substrate of especially Stejlepladsen and Nordhavnstippen, resulting from a history of landfill, is in favour of more hardy species suited to less nutrient rich habitats such as the observed Pilosella officinarum, Potentilla reptans, Medicago lupulina, among others.
The formal green spaces, on the other hand, were characterised by mowed lawns. As such, the herbaceous vegetation registered in these areas consisted of more competitive species that are suited to a nutrient rich environment, tolerate frequent maintenance and create a uniform green sward. These primarily included grasses with a few additional spe-cies such as Trifolium campestre, Bellis perennis, and Taraxacum spp. It was noted that the lawns of Mimersparken differed from the lawns of Fælledparken and Enghaveparken as they were less dominated by grass-es and containing a different array of additional species such as Medica-go lupulina, Matricaria suaveolens, and Trifolium pratense. Although not observed within the registration plots, small sporadic tufts of tall herb vegetation occurred on the edge of the lawn which contained an even greater diversity of species. It may be inferred that since Mimersparken was established on a former railway area where pruning of the soil was
not permitted due to contamination, the conditions for floristic diversity are particularly advantageous.
COMPLEX WOODY PLANTINGSWhile the informal green spaces harboured a greater diversity of her-baceous vegetation, the formal green spaces displayed higher diversity of woody vegetation. In fact, they had twice as many different woody species between them than the informal green spaces. In addition, the array of registered woody species varied in each formal green space. Moreover they were generally different from the species registered in the informal green spaces. This is likely due to the designed and man-aged character of formal green spaces as variation in plant compositions traditionally is of high recreational value (Nielsen et al, 2013). In con-trast, the informal green spaces are currently in an earlier stage of suc-cession, which is characterised by only a few pioneer species and slow growth rate (Alvey, 2006). While diversity of woody species was greater in the formal green spaces it was noted, that they were generally char-acterised by more dense plantings consisting of more individual woody plants.
Pic. 7Medicago Lupulina was present in many the informal case areas as well as Mimersparken.
Fig. 7Medicago Lupulina
Pic. 8 Potentilla reptans was present at Ste-jlepladsen.
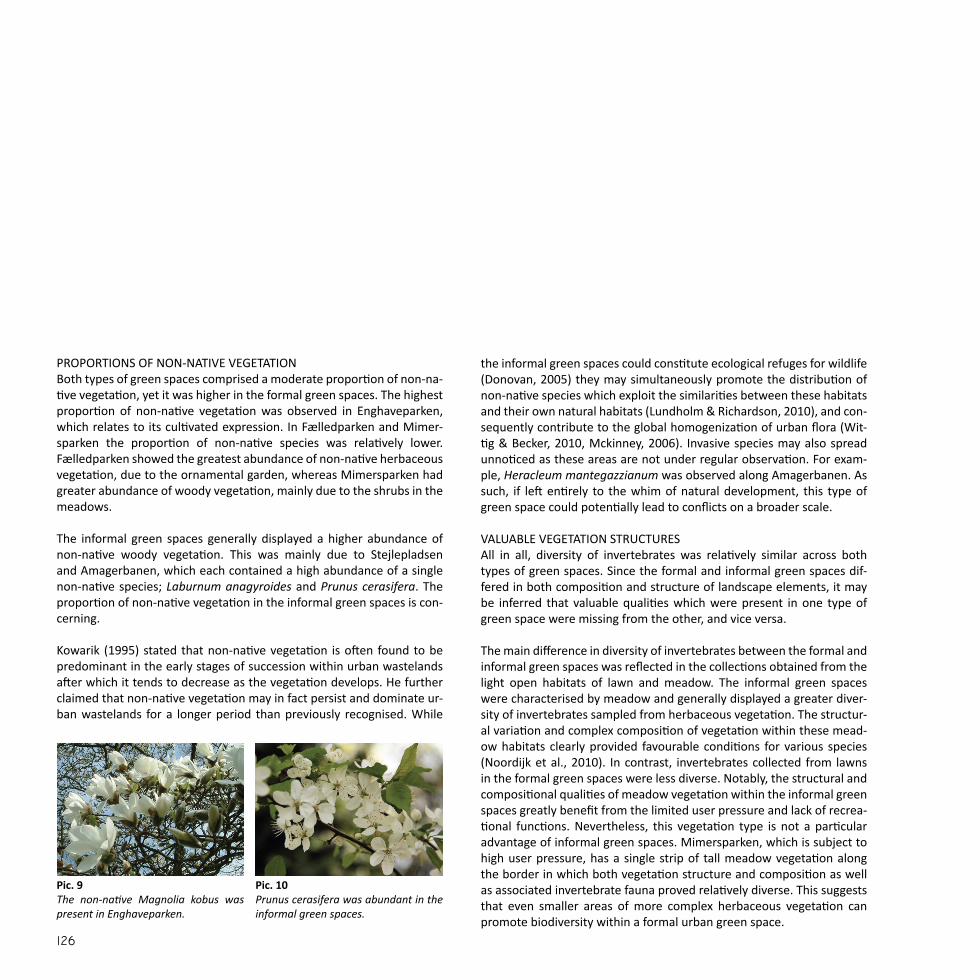
PROPORTIONS OF NON-NATIVE VEGETATIONBoth types of green spaces comprised a moderate proportion of non-na-tive vegetation, yet it was higher in the formal green spaces. The highest proportion of non-native vegetation was observed in Enghaveparken, which relates to its cultivated expression. In Fælledparken and Mimer-sparken the proportion of non-native species was relatively lower. Fælledparken showed the greatest abundance of non-native herbaceous vegetation, due to the ornamental garden, whereas Mimersparken had greater abundance of woody vegetation, mainly due to the shrubs in the meadows.
The informal green spaces generally displayed a higher abundance of non-native woody vegetation. This was mainly due to Stejlepladsen and Amagerbanen, which each contained a high abundance of a single non-native species; Laburnum anagyroides and Prunus cerasifera. The proportion of non-native vegetation in the informal green spaces is con-cerning.
Kowarik (1995) stated that non-native vegetation is often found to be predominant in the early stages of succession within urban wastelands after which it tends to decrease as the vegetation develops. He further claimed that non-native vegetation may in fact persist and dominate ur-ban wastelands for a longer period than previously recognised. While
the informal green spaces could constitute ecological refuges for wildlife (Donovan, 2005) they may simultaneously promote the distribution of non-native species which exploit the similarities between these habitats and their own natural habitats (Lundholm & Richardson, 2010), and con-sequently contribute to the global homogenization of urban flora (Wit-tig & Becker, 2010, Mckinney, 2006). Invasive species may also spread unnoticed as these areas are not under regular observation. For exam-ple, Heracleum mantegazzianum was observed along Amagerbanen. As such, if left entirely to the whim of natural development, this type of green space could potentially lead to conflicts on a broader scale.
VALUABLE VEGETATION STRUCTURESAll in all, diversity of invertebrates was relatively similar across both types of green spaces. Since the formal and informal green spaces dif-fered in both composition and structure of landscape elements, it may be inferred that valuable qualities which were present in one type of green space were missing from the other, and vice versa.
The main difference in diversity of invertebrates between the formal and informal green spaces was reflected in the collections obtained from the light open habitats of lawn and meadow. The informal green spaces were characterised by meadow and generally displayed a greater diver-sity of invertebrates sampled from herbaceous vegetation. The structur-al variation and complex composition of vegetation within these mead-ow habitats clearly provided favourable conditions for various species (Noordijk et al., 2010). In contrast, invertebrates collected from lawns in the formal green spaces were less diverse. Notably, the structural and compositional qualities of meadow vegetation within the informal green spaces greatly benefit from the limited user pressure and lack of recrea-tional functions. Nevertheless, this vegetation type is not a particular advantage of informal green spaces. Mimersparken, which is subject to high user pressure, has a single strip of tall meadow vegetation along the border in which both vegetation structure and composition as well as associated invertebrate fauna proved relatively diverse. This suggests that even smaller areas of more complex herbaceous vegetation can promote biodiversity within a formal urban green space.
Pic. 9The non-native Magnolia kobus was present in Enghaveparken.
Pic. 10Prunus cerasifera was abundant in the informal green spaces.

Structural variation of vegetation was a recurring factor in the habitats that showed high diversity of invertebrates. In fact, this sometimes ap-peared more important than plant composition. The tall herbaceous vegetation of Stejlepladsen was vastly dominated by grasses with only a few additional herbs. Yet, it had a greater diversity of associated inver-tebrate fauna than the herbaceous vegetation at Amagerbanen, which was similar in structure, but contained greater abundance and species richness of herbs. However, the difference may also be due to the dis-similarities in size and shape of these areas and their respective contexts (Hunter, 2002). In addition, the differences in the collections of inver-tebrates could be a limitation of the sampling method. A sweep net is a time efficient tool for sampling a variety of taxa, but it is less ideal for giving a truthful estimate of the diversity of flower-visiting insects (Spaf-ford & Lortie, 2013). Had another sampling method for grassland inver-tebrates been employed, it may be presumed that the results would have displayed a greater diversity of invertebrates in the rich floral com-position of Amagerbanen.
The collections obtained from woody vegetation within the different tree stands revealed a positive effect of structural complexity in the ver-tical strata on the diversity of invertebrates. Additional layers of vegeta-tion add extra vertical structures for invertebrates to utilize (Gao et al.,
2014). In accordance with Pinna et al. (2009) the presence of a sporadic ground cover of shrubs, herbs and leaf litter generally resulted in diverse collections of ground dwelling invertebrates.
The value of structure was not only evident for the specific habitats, but also the transition zones between these. Abundance and species rich-ness of invertebrates was generally high in edge zones between open and enclosed vegetation types, but particularly so within the informal green spaces. These areas comprised more ecocline edges created by the small woody undergrowth slowly rising towards the closed vegeta-tion elements. These heterogeneous structures provide a multitude of microhabitats with abiotic factors such as temperature and humidity which offers different microclimates to be exploited. As such, this type of edge creates favourable conditions for many species (Magura et al., 2001).
Besides structural variation, plant composition also seemed to be a key factor of invertebrate diversity as habitats with high plant species rich-ness often yielded more diverse collections. Notably, certain plant spe-cies had less associated invertebrates. This especially applied to ever-green species such as Taxus baccata and Ilex Aquifolium, while other evergreen species such as the non-native compositions in Enghavepark-en had more diverse assemblages of invertebrates. It should be added, that these evergreen species constitute valuable resource for many other species such as birds and small mammals (Sherril & Brittingham, 2001).
Certain species were found to have particularly diverse assemblages of invertebrates. Among these were Prunus cerasifera, Salix caprea and Sambucus nigra. This may be due to particular favourable features such as fruits and sap (Kennedy & Southwood, 1984; Leather, 1986). Addi-tionally, the majority of Salix observed in the informal green spaces were male specimens which are more attractive to nectar and pollen depend-ent insects (KK, 2011). Notably, the diverse assemblages sampled from these trees could also be related to the particular timing of the collec-tions.
Pic. 11Notiophilus biguttatus (Coleoptera: Carabidae) was sampled in a pitfall trap at Nordhavnstippen.
Pic. 12Cantharis livida (Coleoptera: Canthari-dae) was sampled in Mimersparken and Fælledparken.

SPECIAL ENCOUNTERSThe invertebrates collected from the informal green spaces revealed a couple of specimens which indicate that special qualities exist in these areas. At Nordhavnstippen, damselflies (Odonata: Coenagrionidae) were sampled from the herbaceous vegetation. Damselflies are asso-ciated with standing water and bank vegetation (Hansen & Jørgensen, 2015) which were some of the characteristics of Nordhavnstippen. At Stejlepladsen a sawfly (Hymenoptera: Megalodontesidae) was sampled from the woody vegetation. Sawflies are suited to dry, alkaline habitats (Haselböck, 2015). Presumably the debris substrate in this area provides just the right sort of habitat for this insect. Also, mirids (Hemiptera: Miridae) were sampled from both Nordhavnstippen and Stejlepladsen. Some mirids feed on flowers, while others are predators of herbivores, and as such they depend on floristically rich habitats for foraging oppor-tunities. At Amagerbanen diving beetle larvae (Coleoptera: Dytiscidae) was sampled in a pitfall trap. This group of invertebrates are associated with water (Encyclopædia Britannica, 2015), which stresses the value of small, temporary water features.
Mimersparken showed special qualities that somehow are a testimony of its ecological potential. For example, the strip of meadow vegetation revealed surprisingly diverse assemblages of invertebrates for a park of
that calibre. In addition, the beetle Notoxus monoceros (Coleoptera: Car-abidae) was sampled from a pitfall trap in the lawn. This species is espe-cially suited to sandy habitats (Petersen & Nielsen, 2015), which in fact is what is underneath the turf. In fact, Mimersparken seems to rather closely resemble the informal green spaces in both substrate, vegetation and, to some extent, invertebrate fauna. This may be influenced by the context of the park. Mimersparken is directly linked to a larger ruderat area of sand and gravel substrates wherefrom many species, including the beetle Notoxus monoceros, may have dispersed.
Pic. 13 Clytus arietis (Coleoptera: cerambyci-dae) sampled in Mimersparken.
Pic. 14Phyllobius virideaeris (Coleoptera: Cur-culionidae) sampled from Mimerspark-en and Fælledparken.

Since the outcome of such a biodiversity assessment is influenced by the scope of the survey, area covered, and the number of taxonomic groups included, the results should be assessed with some reservations. In this case, a couple of experimental caveats may have affected the results of the study.
In relation to the assessment of species diversity, the registration of woody plants only included individuals of a height over 50 cm. As many of the informal green spaces were characterised by small woody shoots many individuals have thus been excluded from the results. Some plants were only identified to genus level due to identification issues. For the calculation of species diversity, these individuals were treated as differ-ent species when they did not share the same features.
The collection and identification of invertebrates also presented some limitations. As we were only able to collect specimens from vegetation within reach, the results do not reflect the distribution and diversity of species at heights above 2 m. Furthermore, two pitfall traps were lost and three had lost their lid. Thus, abundance and species richness of invertebrates may have been higher in these areas. Additionally, it is important to note that the collections may include specimens that are not necessarily connected with the given habitat such as species flying through. Therefore, the results may not truthfully reflect the associated invertebrate fauna of the areas. The conservative approach to the iden-tification of invertebrates, as mentioned previously, has also resulted in somewhat simplified results. Moreover, as we only distinguished be-tween species collected within each individual case area, recurrence of species in other case areas was not noted. As such, we were not able to compare species assemblages across the different case areas.
Limitations Conclusion
The biodiversity assessment revealed that biodiversity was relatively high in formal green spaces. However, in many respects biodiversity was higher in the informal green spaces.
Habitat diversity was generally higher in formal green spaces. It was found that some landscape designs of the formal green spaces pro-moted habitat heterogeneity as was the case in Fælledparken and Eng-haveparken. However, habitat diversity in the informal green spaces did not differ significantly from the formal green spaces. The sporadic character and particular structures shaped by the former use created a complex mosaic of different habitats. In regard to species diversity, the formal green spaces generally showed higher diversity of woody vegetation, due to more complex plant com-positions that included many non-native species. In contrast, the infor-mal green spaces were characterised by relatively simple compositions. Diversity of herbaceous vegetation was greater in the informal green spaces, as these areas comprised large surfaces of structurally complex grassland habitats. Diversity of invertebrates appeared relatively similar for the two types of green spaces. The main difference was in diversity of invertebrates sam-pled from herbaceous vegetation, which was significantly higher in the informal green spaces. Diversity of invertebrates was especially related to factors such as structural complexity of vegetation, ecocline edges as well as diverse plant compositions. Finally, it can be concluded that since the degree of biodiversity between the formal and informal green spaces proved to be relatively similar, the foundation for biodiversity in urban green spaces is decent. Yet, there is further potential to be exploited.
The results of the case studies presented several factors that influence biodiversity and which serve as evidence for a set of general recommen-dations for promoting biodiversity within urban green spaces. As the case studies did not relate all ecological aspects of the six case areas, the recommendations are supplemented by findings derived from existing research.
PROMOTE FLORISTIC DIVERSITY OF GRASSLAND VEGETATIONReducing mowing practices to twice a year with removal of excess bio-mass will reduce nutrient uptake and increase plant species richness. Additionally, rotational management by which approximately 10-20 pct. of the area alternately is excluded from mowing will add to the structural complexity of the vegetation and ensure continuity of resources for a variety of invertebrates (Noordijk et al., 2010).
SUPPORT NATIVE PLANT SPECIESNative species will ensure ecological relations as they are adapted to the native environment (Alvey, 2006). Additionally, promoting species with favourable features such as fruit, sap, pollen, and nectar will provide valuable food sources for wildlife and maintain ecological interactions (Burghardt & Tallamy, 2013).
SUSTAIN STRUCTURAL VARIATION WITHIN TREE STANDSVariation in the vertical layers of vegetation will favour a variety of spe-cies that forage, nest and rest at different heights (Gao et al. 2014). En-suring gaps in the canopy cover can promote a rich herb layer within tree stands, which is a valuable resource for a variety of invertebrates (Uly-shen 2011; Magura, Tóthmérész & Molnár, 2001). In addition, leaf litter and rocks will retain moisture at the ground (Hickerson et al., 2012).
ENSURE STRUCTURAL VARIATION OF EDGE ZONESSoft and ecocline edges between open and more closed vegetation types will ensure favourable habitats for a variety of species depend-ent on these particular, intermediate conditions (Magura, Tóthmérész & Monlnár, 2001 and references therein). A less open edge will further-more buffer the distinctive interior environment of the tree stand.
RETAIN WATERWater is essential for all life. Therefore, permanent or temporary water bodies with natural or at least semi-natural banks are of immense value to a variety of organisms at different stages of their lives (Hamer et al., 2012).
ESTABLISH SHELTERLarge open surfaces are not easily crossed by small organisms. Establish-ing shelter belts in the form of raised terrain or vegetation belts cre-ates resting zones that enhances dispersal of flying organisms. Shelter of both deciduous and evergreen species will both provide leaf litter for ground dwelling fauna to hibernate in, and consistent shelter at higher vertical levels.
ENSURE MICRO HABITATSDifferences in terrain from smaller mounds to more or less erect slopes are of high value as they provide different niche habitats as well as cli-matic variation for many ground dwelling species (Bennie et al., 2008; Potts et al., 2005).
PRESERVE VETERAN TREES AND DEAD OR DECAYING WOODMany species depend on old, dead or decaying wood. Preserving vet-eran trees and dead or decaying wood will provide habitats of high eco-logical value (Ulyshen, 2011).
General recommendations for improving biodiversity

Pic. 15A diverse meadow is a valuable habitat for many species.
Pic. 16Many organisms depend on deadwood.
Pic. 17Ecocline woodland edge provides favourable edge habitats.
Pic. 18Temporary water is essential for many organisms.


// Part II
THE RECREATIONAL ASPECT

The distinction between nature and culture has in many ways been fundamental throughout centuries. Nowadays, it is commonly acknowl-edged that nature is variable and will change in line with human culture as we create, transform or reconstruct nature based on cultural trends. Although it is common to perceive untouched areas as being more natu-ral than others, the ecological qualities of any landscape will always be influenced by some cultural aspects such as norms and values (Bruun, 2000). It can even be argued that untouched and seemingly natural land-scapes only really exist due to human forbearance and that the laissez-faire state of these areas entirely results from a deliberate choice (Stahl-schmidt, 1984). As nature and culture have been weaved together both in the landscape and in our awareness, it is therefore no longer useful to separate them. It is much more constructive to acknowledge that a landscape comprises both an aspect of nature and an aspect of culture (Agger, 2012).
An important point in the discussion of the two terms is that culture has now entirely conquered nature. In a matter of survival, human society has done what was necessary to control the natural environment. How-ever, the previously all-powerful nature has now become weak to the point that it is in need of protection. It is therefore important that we contemplate how to ethically deal with nature (Bruun, 2000). While promoting biodiversity within our urban green spaces is essential for sustaining a healthy foundation for all life, it is not successfully done without linking it to the cultural aspect. In that regard, it is not without significance if the factors that promote biodiversity can converge with recreational values. Whether this is possible, is to be investigated in the following sections.
Culture vs. nature
NATURE PERCEPTIONOur perceptions of nature greatly influence the way we experience, shape, and interact with our green surroundings. The very term ‘nature perception’ is an ideology of the qualities and values of nature. In es-sence, it is expressed in the judgement of what is attractive and what is unattractive, what is natural and what is unnatural, what is useful, and what is not useful as well as in the opinions of the extent of the term nature (Hansen, 1989). People have different fundamental norms and values which affect the way they perceive nature. While perception to a large extent is subjective, it will also display the prevailing viewpoints in society and can change with time (Kaae & Madsen, 2003). Several dif-ferent theories exist in regard to the classification of nature perceptions. In environmental philosophy it is common to differentiate between the anthropocentric and the ecocentric perception of nature which are con-sidered to be the two principal opposites (Bruun, 2000). UTILITARIAN VALUESThe anthropocentric perception of nature assigns more value to human interests and regards nature as a resource to be exploited. As a result, all initiatives regarding nature are assessed on the basis of whether or not they serve human interests. The anthropocentric mindset often supports nature conservation as preservation of natural resources, as a healthy ecosystem promotes human well-being (Bruun, 2000; Thompson, 1994). HOLISTIC VALUESThe ecocentric nature perception prizes nature for its intrinsic value, re-gardless of the benefits nature holds for human well-being. In that optic, nature is worth conserving independently of human interests. Essen-tially, the ecocentric perception of nature embraces both the physical landscape as well as all the living things sharing the landscape (Bruun, 2000; Thompson, 1994).

A VARIATION OF GREEN SPACE EXPRESSIONSPreviously, nature perception was more or less uniform within society and urban green spaces displayed a very clear expression according to the prevailing preferences (Hansen, 1989). Today, nature perception is a much more complicated affair. The Danish philosopher Hans Fink (2003) argued that several additional concepts of nature exist within our soci-ety and among individuals as our culture does not present one unam-biguous concept of the term. Consequently, urban green spaces have varying expressions.
Landscape architect Per Stahlscmidt (1984) defined three general types of expressions that can be found in green spaces; the formed, the cul-tivated, and the self-grown expression. The formed expression is to this day the preferred expression among landscape architects. The landscape is modelled from a certain aesthetic idea. Vegetation is here described as ‘plantations’ or ‘plantings’ through which the architect’s plan is clearly visible. These plantings are defined and valued by their volume or shape and as such, they are desired to remain static in their expression fol-lowing the establishment. The cultivated expression arises from practi-cal considerations and the design is often straightforward, orderly, and following straight lines and geometrical shapes. Finally, the self-grown expression appears to be shaped by natural processes. The underlying landscape plan is not perceptible as the vegetation appears spontaneous and not designed.
These expressions exist in more than one form and also as hybrids. Eng-haveparken more or less fits into the cultivated expression due to its symmetrical design and horticultural qualities. Fælledparken comprises elements such as sports fields, transecting as well as meandering paths and forest-like plantings that altogether make it a hybrid between the formed and the cultivated expression. Mimersparken displays hints of the self-grown expression due to the meadow-covered hills along the railway. However, the rest of the park has a clear cultivated, stylistic expression largely determined by functional use. The informal green spaces all have a self-grown expression, although in their cases it is not
directly by design. They are subject to nature’s own order, but only as a result of human forbearance.
Each in their own way, these landscape expressions convey some cul-tural understanding of nature, whether rooted in art, the agricultural landscape, or nature itself (Stahlschmidt, 1984). As such all should be respected as a part of our cultural heritage when introducing changes to promote biodiversity.

Urban green spaces have increasingly become an integrated part of our lives and their functions are many and varied. A survey completed by Petersen & Nielsen (2011) on the recreational use of formal urban green spaces in the Copenhagen area concluded that the use is generally re-lated to three themes; everyday life, social functions, and certain land-scape qualities. These themes are described in the following sections.
THE DAILY DOSE OF GREENUrban green spaces are essentially an extension of the domestic sphere. They are areas of high flexibility and there is nothing they are not used for. People consume their meals, study, exercise, and socialise outside. In addition, there are fewer and fewer rules about the use of urban green spaces and as such they provide free space for a multitude of activities. The use of urban green spaces covers both daily and weekly routines as well as special events. Furthermore, it varies between organised, spon-taneous and transitional use. The results of the survey by Petersen & Nielsen (2011) revealed that for some people urban green spaces form a part of their daily route and constitute a pleasant scenery that provides momentary relief from daily tasks. For others they are a destination in themselves with the main motivations for visits being to relax and re-load, and to stay fit. Proximity and accessibility of urban green spaces was found to ease and thereby increase use. In addition, proximity and accessibility was suggested to be a means of establishing affiliation for an area, which is important for it to be maintained as a green space.
A GREEN SETTING FOR SOCIAL INTERACTIONSUrban green spaces constitute an important common ground for social interactions. These interactions vary between meetings with close re-lations, informal meetings with loose acquaintances, passive observa-tion of other people, and complete avoidance of social contact. In that sense, a valued quality of urban green spaces is that they support and encourage different social functions by means of variation between green spaces, variation in size and in the configuration of landscape el-ements. These offer possibilities for engaging with people at different levels of organisation. Respondents of the survey by Petersen & Nielsen
The recreational use of urban green spaces
(2011) remarked that openness in terms of a view of the surroundings is important for the sense of social inclusion. At the same time, enclosed space created by trees, shrubs or differences in terrain provides valued intimate and private spheres.
RECREATIONAL USE SHAPED BY LANDSCAPE QUALITIESThe survey by Petersen & Nielsen (2011) revealed that urban green spac-es are valued in regard to experiences of scenery and natural content. In fact, for 80 pct. of the respondents an important motivation for visiting urban green spaces is to experience nature and the landscape. In other research, the importance of these experiences have been linked to cer-tain physical and mental health benefits, and it was found that certain landscape qualities are more valued than others. These included the ex-periences of serenity, refuge, space, and species richness (see Randrup et al., 2008). The experiences of growth and of other living things during the shifting seasons is an important part of the sensory impression of ur-ban green spaces and it contributes to the experience of the landscape. In addition to the importance of natural elements within urban green spaces, respondents of the survey also remarked that facilities such as outdoor furniture, shelter, etc. are important for the recreational use. Such facilities ease and encourage longer stay, in all seasons and all weather conditions.

The wilderness of wasteland areas form a significant contrast to the regu-lated, formal green spaces (Armstrong, 2006). Therefore wastelands can provide an exciting, alternative recreational setting (Unt & Bell, 2014). Even though there may be many dangers associated with such areas due to the unregulated conditions, research argues that they are particularly important spaces for children’s social play. These areas often have just the right combination of water, dirt, trees and bushes with edible fruits, tall grassland vegetation, variations in topography, and things to build with (Jorgensen & Tylecote, 2007).
Wastelands provide an exceptional opportunity for many different social groups to interact as these areas offer possibilities for activities across different age groups and interests, such as mountain biking, building huts, playing, climbing, digging, etc. An important attribute of the lack of an officially designated function of wastelands is precisely that there are no underlying rules that determine what one is or is not allowed to do (Rink & Herbst, 2011). In that sense, wastelands may be a valuable contribution to the array of more traditional, formal urban green spaces, provided that people accept them as such.
The recreational qualities of wastelands

An important aspect of conserving and promoting biodiversity is pro-viding and maintaining suitable habitats (Fahrig, 2003). While this is an essential precondition for biodiversity, Stokes (2007) remarked, that a large portion of the Earth’s biodiversity will persist only if people make an effort to protect it. As conservation efforts are often influenced by personal tastes, Stokes (2007) predicted that people’s preferences in re-gard to nature will be significant in determining the future prosperity of many species.
As previously established, nature symbolises different things to differ-ent individuals and people are generally selective regarding what they perceive as natural (Fink, 2003). Lamb & Purcell (1990) argued that eco-logical naturalness and perceived naturalness are related but not the equivalent of one another. It is possible that ecological values and aes-thetic preference can be positively correlated, but this is not necessarily always the case. Tended lawns may be considered beautiful, but are in fact ecological deserts, while ecologically rich wetlands may be seen as unattractive or messy (Gobster et al., 2007). Gobster et al. (2007) as-serted that people draw assumptions about ecological quality based on their aesthetic preferences. These aesthetic preferences are often based on picturesque understandings of what is ‘natural’ hence; a well main-tained landscape is often preferred over the wild. Order and control are deeply rooted in our society and therefore we tend to align these quali-ties with ecological values (Qiu et al., 2013).
A growing body of research in landscape preference shows that certain landscape compositions and structures are more preferred than oth-ers. These preferences often reflect both aesthetic pleasure as well as sense of safety, as the two concepts are closely related (Jorgensen et al., 2002). Preference studies are of high relevance to recreation research, yet these studies can also serve to illustrate where landscape prefer-ences and ecological qualities either converge or collide. This becomes valuable information for determining how to accommodate biodiversity in urban green spaces without compromising recreational values.
Recreational preferences
PREFERRED LANDSCAPE STRUCTURESIn order to explore what characterises preferred landscapes Kaplan & Ka-plan (1989) developed a preference matrix (Table 41) based on people’s need for understanding and exploring the landscape. These two themes form the overall framework around four different factors that each play an important role in determining how people perceive, and act in a given landscape setting. While preference is not necessarily increased by high prevalence of all four factors, Kaplan & Kaplan (1989) claimed that the higher legibility and mystery the better. In contrast, landscapes with little coherence or complexity are often disliked.
Understanding Exploration
CoherenceA sense of order helps directing
attention. Enhanced by repeated elements and uniformity.
ComplexityRichness of elements increases curiosity. Enhanced by variation
within the landscape.
LegibilityA well-structured space is easy to
understand and remember. Enhanced by landmarks and
distinctive elements or regions.
MysteryA promise of additional
experiences. Enhanced by meandering paths and depth within
the landscape.
Table 41. Preference matrix
Adapted from: Kaplan & Kaplan (1989).

6 12 18
Across several studies the most preferred landscape features have shown to be elements such as trees, especially old trees (Kaplan & Ka-plan, 1989), water and forested areas (Özgüner & Kendle, 2006, and ref-erences therein). While such elements are highly valued when viewed in isolation, people tend to relate individual features to overall scenic quali-ties (Nassauer, 1988; Qiu et al., 2011). In general, the preferred type of landscape is moderately open and consists of a grassy surface with spo-radic elements such as trees or shrubs (Bjerke, 2006; Kaplan & Kaplan, 1989; Hull & Harvey 1989). This corresponds with evolutionary theories of landscape preference such as the prospect-refuge theory by Appleton (1975) which often forms the conceptual basis of preference studies. Ac-cording to this theory, the landscape is evaluated in relation to whether it provides the opportunity of seeing without being seen, i.e. prospect and refuge, which in an evolutionary context is essential for survival.
Where woody vegetation elements are concerned, Schroeder & Orland (1994) studied preference in relation to different spatial arrangements of trees. They found that while preference increased with number of trees, people generally preferred when a large number of trees were placed in a large cluster with a wide diameter so that the features of each tree clearly appeared. Cluster diameter had little effect on prefer-ence where only a few trees were concerned as the trees in this case did not obscure each other significantly (Fig. 55).This corresponds with findings by Randrup et al. (2008) who stated that spaciousness is a fa-voured quality in green spaces, which for example is achieved within larger clusters of trees.
People’s reactions to landscapes are often related to understorey veg-etation (Jorgensen et al., 2002). Hull & Harvey (1989) found that prefer-ence increased with density of trees, but decreased with density of un-dergrowth, which is consistent with other studies that similarly reported low preferences for dense understorey vegetation (Kaplan & Kaplan, 1989; Bjerke, 2006; Qiu et al., 2013). Density of edges is a key param-eter in preference studies. A study by Jorgensen et al. (2002) showed a general disregard for naturalistic woodland with dense layers and edges,
Fig. 55The relative effect of cluster diameter and the number of trees on preference. Adapted from: Schroeder & Orland (1994).
Larger cluster diameterMedium cluster diameterSmall cluster diameter
No. of trees
Pref
eren
ce

gensen et al. (2002) found that edges of flowering herbs was the means of softening the unappealing expression of dense vegetation, it may be assumed that such vegetation types can be positive features in a recrea-tional setting. Nevertheless, taller herbaceous vegetation may also be responsible for the accumulation of waste, which subsequently could re-sult in low appeal (Qiu et al., 2013; Özgüner & Kendle, 2006). In accord-ance with Özgüner & Kendle (2006) it should further be pointed out that even though people see wildflower meadows as especially beautiful in season, they may find them unmanaged and thereby unattractive as the grasses and flowers wither. The aversion for natural processes of decay also generates low preference for natural elements such as deadwood. Similarly, at the other end of the cycle there is also a low preference for the process of vegetation rejuvenation (Qiu et al., 2013).
In regard to maintenance, Qui et al. (2013) pointed out that man-made objects and signs of human presence evoke dislike for green space set-tings. This was also found by Özgüner & Kendle (2006) who specifically listed features such as fences, litter, graffiti, buildings, urban surround-ings as well as general appearances of neglect as being responsible for diminishing the attractiveness of a park.
PREFERENCE FOR INFORMAL GREEN SPACESResearch on landscape preference tend to focus on traditional, formal parks. However, as informal green spaces differ significantly in both ex-pression and function, preferences may vary in such settings. Literature on informal green spaces such as wastelands often emphasize negative attitudes towards such green spaces. They are found to challenge the space we live in by disturbing the ‘civic beauty’ (Hall, 2013) as they sym-bolize decline, neglect, poor value, and a loss of control in an otherwise orderly urban setting (Rink & Herbst, 2011). In literature, they are of-ten assigned with negative descriptions such as ‘no man’s land’, ‘urban void’, ‘nameless space’, among several others (Hall, 2013; and references therein). Consequently, the spontaneous vegetation occurring on waste-lands is not necessarily considered urban nature (Rink & Herbst, 2011).
as they generated a feeling of personal unsafety. This was particularly the case where the spatial arrangement of dense vegetation elements created enclosure. Yet, they also found that by establishing a focal point it was possible to draw people’s attention away from the unpleasant ele-ment. Jorgensen et al. (2002) finally concluded that more open edges were preferred. However, they added that the use of flowering herba-ceous vegetation along naturalistic edges may make people more prone to accept more dense structures.
Hull & Harvey (1989) explored undergrowth from another angle and related it with experience value. They argued that a high understorey inhibits exploration as it is relatively impenetrable. Low understorey vegetation, on the other hand, is too effortless to pass through, and offers little thrill. However, a moderate amount of understorey vegeta-tion requires some effort to pass through and generates just the right amount of excitement. This is consistent with earlier findings by Kaplan (1987;1992) who stated that a powerful variable in regard to landscape preference is mystery. Hull & Harvey (1989) further argued that the presence of a pathway affects the experience of understorey vegetation. Where understorey is dense the presence of a pathway will increase the experience value as it makes way-finding easier. However, where un-derstorey is sparse and the landscape otherwise easy to read and walk through, the presence of a pathway is not appreciated as it infers a form of behaviour control by indirectly informing people to stay on the path.
Maintenance is another significant aspect in preference studies. Gener-ally, people value neatness and a designed expression (Jorgensen et al., 2002). In a recreational green space setting this especially comes across in the general preference for a smooth ground surface that ensures ease of access (Bjerke, 2006; Kaplan & Kaplan, 1989). Ornamental plantings and mowed lawns are highly prized features in urban green spaces as they display control and care which increases a sense of safety since it is under continuous supervision (Nassauer, 1988; Özgüner & Kendle, 2006; Herzog and Chernick, 2000). Not much research has been done on at-titudes towards taller grassland vegetation or wild meadows. Yet, as Jor-

On the other hand, informal green spaces may also evoke enthusiasm for the fanciful romantic notion of untouched wilderness (Hall, 2013).Whether preferred or not, an important asset of informal green spaces is that the intuitive expectations upon entering such an area differ from the formal green space setting. At first glance, it is apparent that the informal green space is governed by a very different set of rules - if any rules at all (Rink & Herbst, 2011). Although this may evoke uncertainty, it sets the tone for the further experience of the area and may increase tolerance.
Landscape preference is a complex matter as multiple factors affect the way we perceive our surroundings. Research shows that certain land-scape elements have high preference value, yet they are never viewed entirely in isolation. Preferences for landscape elements are as much related to the scenery in its entity as the element itself. Therefore, the compatibility between biodiversity and recreational preferences should be addressed in terms of both individual structures as well as the over-all landscape scenery.
Element Preferences
High Low Mixed
Moderately open landscapes with sporadic trees or shrubs X
Few trees standing in smaller groups X
Many trees standing in larger groups X
Shelter/refuge X
Dense plantings X
High understory X
Low understory X
Moderate understory X
Dense edges X
Open edges X
Meadow X
Neatness and order X
Smooth and visible ground surface X
Tended lawns X
Vegetation rejuvenation X
Deadwood X
Signs of decay X
Man-made objects X
Water features X
Natural edges X
Ornamental plantings X
Table 42. Preferences for various landscape structures according to research on landscape preference.

Amagerbanen

Compatibility assessment

FÆlledparken
Since the formed expression is a preferred landscape expression (Stahl-schmidt, 1984) the overall scenery of Fælledparken has high preference value. Due to the large scale of the park, habitat heterogeneity is rela-tively high and the planar habitat elements generally cover large sur-faces which, from an ecological point of view, is an advantage (Agger, 1982). However, the formed expression is also characterised by abrupt, stylistic transitions from one habitat unit to the next, which reduces the quality of the edge habitats in Fælledparken (Agger, 1982).
As Fælledparken is designed as an English landscape park the plantings are meant to be experienced from afar. Preference for the individual tree stands is therefore considered to be high as they are all a part of the overall scenery. Nevertheless, they each possess unappealing quali-ties that challenge the experience of the scenery. For example, the tree stands in transect A and C (Fig. 56 and 58) both have dense edges, which is not preferred. However, this is considered to be outweighed by other more positive qualities. The dense edge in transect A (Fig. 56) may be of less concern as an adjacent and impressive solitary Aesculus x carnea serves as a focal point and distraction (Jorgensen et al., 2002). Further-more, the lack of understorey within the tree stand greatly increases visibility inside the planting and creates a spacious interior (Randrup et al., 2008). The lack of understorey was however found to be among the reasons for the just moderate biodiversity results. Moreover, the ever-green species which form the densely enclosed interior room did not have many associated invertebrates. Yet, the evergreen planting may be a valuable habitat for other faunal groups (Sherril & Brittingham, 2001). The tree stand in transect C (Fig. 58) also lacked understorey, which de-creased biodiversity, but this greatly increases spaciousness and thereby preference.
Both tree stands in transect B (Fig. 57) have been assessed to have low preference, yet tree stand (159) is considered to have higher preference when viewed in relation to the overall scenery. When viewed in isola-tion, tree stand (159) loses appeal on account of the dense high and
low understorey, yet this was found to be positive feature in regards to biodiversity. Tree stand (134) is presently in rejuvenation and as such, it does not fit in well with the overall of the scenery. However, the dense shrub layer in the new planting supported a diverse assemblage of in-vertebrates.
The tree stand that displayed the highest compatibility between biodi-versity and preference was the one in transect D (Fig. 59). In this tree stand both understorey and a herb layer was present which promoted biodiversity. In addition, preference is assessed to be high. This is due to the presence of trodden paths, which increase mystery and enables way-finding within the planting (Hull & Harvey, 1989; Kaplan & Kaplan, 1989). The ornamental garden in transect A (Fig. 56) is assessed to be of high preference due to its ornamental character (Nassauer, 1988). As the planting mainly consists of non-native species and thereto is maintained frequently by removal of withered plants and litter, biodiversity may not exceed the presently assessed moderate level. The lawns in Fælledparken are highly preferred features. First of all, they provide space for activities (Petersen & Nielsen, 2011), but they also dis-play care, order, and control (Nassauer, 1988). The latter also applies to the grass strips which are present around most of the tree plantings. However, biodiversity in these grass units were consistently low.

High
Moderate
Low
High
Moderate
Low
High
Moderate
Low
High
Moderate
Low
Fig. 58Transect C - 25 m.
Fig. 56Transect A - 25 m.
Fig. 59Transect D - 25 m.
Fig. 57Transect B - 25 m.
Ornamental garden, perennials (21)
Grass strip (52)
Tree stand mixed >80%, multilayered (162)
Tree stand mixed 30-80%multilayered (159)
Grass strip (52)
Tree stand deciduous 30-80%2-layered (134)
Grove (124)
Lawn (113)
Tree stand deciduous 30-80%, multilayered (135)
Preference for element
Preference in a landscape context
Assessed biodiversity

The pronounced cultivated expression and distinct horticultural char-acter of Enghaveparken was designated to generate aesthetic pleasure and therefore the park is considered to have high preference. Due to the neoclassical design, the spatial configuration of landscape elements ensures a mosaic of garden sceneries that create an array of different, yet cohesive, experiences which is a preferred aspect of green spaces (Kaplan & Kaplan, 1989). The particular mosaic of landscape elements was found to also support habitat heterogeneity, and therefore compat-ibility of biodiversity and recreational preferences appears to be high on a landscape level. Preference for the woody vegetation elements along the transects is generally assessed to be high, due to their neat character and ornamen-tal expression (Jorgensen et al., 2002) and because they fit well into the overall design (Kaplan & Kaplan, 1989). The linear elements of hedges and rows of trees provide an orderly frame within the park that upholds the cultivated and neat expression (Nassauer, 1995). The linear elements along the transects did not possess the same qualities for supporting biodiversity. The hedges and rows of trees scored moderately high biodi-versity results as they mainly consisted of native species and supported more invertebrates than the non-native vegetation. When viewed in iso-lation, the density of vegetation in the hedgerow (61) in transect A (Fig. 60) makes it unappealing (Hull & Harvey, 1989). Moreover, the planting was in poor condition and also stored a lot of litter which conjures up a negative impression (Qiu et al., 2013). The biodiversity results for this planting were moderate. Notably, this was found to be due to the non-native plant composition of especially evergreen species.
The ornamental gardens of perennials and bushes, and the single trees have distinct ornamental purposes, and therefore they are preferred (Nassauer, 1988). The biodiversity results for the ornamental gardens varied slightly. In transect A and B (Fig. 60 and 61), where the structure was dense and the plant composition more complex, the biodiversity results were moderately high. In contrast, the ornamental gardens in transect C (Fig. 62) scored low biodiversity results as these were mono-
Enghaveparken
cultures and possibly of horticultural varieties of little use for the inver-tebrate fauna. In addition, the single trees in transect C were non-native species of high ornamental value, yet they had little associated inverte-brate fauna.
The lawn surfaces are highly preferred features (Özgüner & Kendle, 2006; Herzog and Chernick, 2000; Nassauer, 1995).The strips of lawn along the edges of plantings add to the neat and orderly expression and the wide lawns invite to play and relaxation. Reversely, the biodiversity results for these units were moderately low. The manicured state of the lawns dis-played low species richness of plants and species poor assemblages of invertebrates. Notably, the grass strips did have slightly higher species richness of plants, which infers that where user pressure is slightly lower there is higher potential for biodiversity.

High
Moderate
Low
High
Moderate
Low
High
Moderate
Low
Grass strip (52)
Hedgerow (61)
Ornamental garden, bushes (120)
Grass strip (52)
Tree row(62)
Sheared hedge (59)
Ornamental garden, perennials (57)
Lawn (113)
Tree row (62)
Grass strip (62)
Single tree (22)
Ornamental garden, bushes (57)
Ornamental garden, bushes (20)
Ornamental garden, bushes (20)
Sheared hedge (59)
Fig. 62Transect C - 50 m.
Fig. 60Transect A - 25 m.
Fig. 61Transect B - 25 m.
Preference for element
Preference in a landscape context
Assessed biodiversity
The stylistic design gives the park a sharp, cultivated expression yet with a soft edge that tangents both the formed and the self-gown expression. These contrasting expressions offer a variation of experiences within the park which is considered a valued quality within green spaces (Kaplan & Kaplan, 1989). The concept of an urban playscape and the openness that accompany it do not significantly support habitat diversity. As such, the foundation for compatibility between biodiversity and preferences on a landscape level is not particularly favourable. Due to their certain characteristics, the various landscape elements of Mimersparken are generally of high preference. Notably, high preference is almost exclusively tied to the part of the landscape that is specifically designated for physical activities. Similarly to other formal green spaces, the lawns in Mimersparken are a highly preferred landscape feature (Nassauer, 1988; Özgüner & Kendle, 2006; Herzog & Chernick, 2000). In the biodiversity assessment, the lawns only scored low to moderate results due to a lack of structural variation, yet the particular substrate of Mimersparken was an evidence of its high potential. The cluster of shrubs in transect B (Fig. 64) are currently in a phase of establishment and therefore of low appeal (Qiu et al., 2013). Although not significant in terms of plant diversity, the biodiversity results for this unit were relatively high, as it seemed to favour invertebrates seeking shelter in the open sward. Presumably, when the cluster of shrubs is fully developed it will be able to not only support the overall park design but also constitute habitat for invertebrates. The single trees within the park that eventually will form tree rows are valued features as they enhance the impression of neatness and control (Nassauer, 1988) and furthermore define spatial qualities of the land-scape which enhances spaciousness (Randrup et al., 2008). These units harboured low to moderately low biodiversity results. Notably, this was likely due to the very young state of the trees and it may be presumed that they will gain additional value as they grow. As all but one of the intersected trees are native, they will possibly be valuable resources in the future as well as highly prized landscape features.
Mimersparken
The one single unit that generate mixed preferences happens to also be the one unit that generated the highest biodiversity results of the entire park. The meadow in transect A (Fig. 63) is assessed to have moderately high preference when viewed in relation to the overall landscape. This is due to the meandering shape of the unit which appears designed and therefore fit well into the rest of the scenery. However, it may also be considered an eyesore, due to the unmaintained expression and low at-tractiveness for a large part of the year (Özgüner & Kendle, 2006). Yet, it is exactly the unmaintained expression and seasonal variation that seemed to make this a biodiversity hotspot.

High
Moderate
Low
High
Moderate
Low
Meadow (116)
Meadow (116)
Lawn(113)
Single tree (22)
Cluster of shrubs (23)
Single tree (22)
Single tree (22)
Single tree (22)
Lawn (113)
Lawn (113)
Fig. 64Transect B - 50 m.
Fig. 63Transect A- 50 m.
Preference for element
Preference in a landscape context
Assessed biodiversity

Overall, the relatively open character of Stejlepladsen and sporadic trees and shrubs is assessed to be of high preference (Kaplan & Kaplan, 1989; Bjerke, 2006). However, as this is a landscape of wasteland character preference is predominantly low (Hall, 2013; Rink & Herbst, 2011). The meadow vegetation, which covers a large part of Stejlepladsen, is only moderately preferred, as it obscures the topography and thereby decreases accessibility (Bjerke, 2006; Kaplan & Kaplan, 1989). Yet, the complex structure of the herbaceous vegetation was found to be a valu-able quality for flora and fauna. Similarly, the scattered structure of clusters of trees and shrubs was found to create favourable conditions for flora and fauna, particularly in edge zones. Viewed in isolation the scattered structure may enhance spaciousness (Randrup et al., 2008), but since they are scattered in a surface of already inaccessible tall, herbaceous vegetation, they add to a decrease in legibility within the landscape (Kaplan & Kaplan, 1989). Biodiversity was moderately high in and around the thicket in transect A (Fig. 65), however it has low preference. It appears as an oddity within the open landscape and is assessed to evoke a feeling of unsafety due to the density of the vegetation (Jorgensen et al., 2002). For the tree stand on the edge of the embankment in transect B (Fig. 66), biodiversity and preference rank equally high. Biodiversity was high due to the edge conditions and the embankment, while preference was related to the openness of the tree stand and the moderate understorey (Jorgensen et al., 2002), and especially the rich flora on the embankment (Nassauer, 1988).
Stejlepladsen

High
Moderate
Low
High
Moderate
Low
Thicket (123)
Meadow (116)
Cluster of shrubs and trees (23)
Meadow (116)
Cluster of trees and shrubs (23)
Cluster of trees and shrubs (23)
Tree stand - 10-30%, multilayered (132)
Meadow (116)
Meadow (116)
Meadow (116)
Fig. 66Transect B - 50 m.
Fig. 65Transect A - 50 m.
Preference for element
Preference in a landscape context
Assessed biodiversity

In general, the spontaneous character of Nordhavnstippen is assessed to generate low preference. However, its large scale and peaks, enables broad views to the surroundings which may increase legibility and give a positive experience of the landscape. Biodiversity was high in the meadow vegetation that covers a large part of Nordhavnstippen, as seen in transect A (Fig. 67). Similarly to Stejlep-ladsen, preference is only moderate, as the tall herbaceous vegetation decreases accessibility by obscuring the topography (Bjerke, 2006; Ka-plan & Kaplan, 1989). Furthermore, the wasteland debris add to the dis-orderly expression (Qiu et al., 2012; Özguner & Kendle, 2006). Another large part of Nordhavnstippen consists of pasture, as seen on transect B (Fig. 68). Likewise, biodiversity was high, but preference only moderate. Pasture generally has the same unappealing traits as meadow vegeta-tion, yet the presence of grazing sheep may be a positive feature as they convey care (Nassauer, 1988) and add to the experience of species rich-ness (Randrup et al., 2008). The thicket and cluster of trees and shrubs in transect A (Fig. 67) dis-played moderately low biodiversity which was found to be due to poor plant species richness. Preference was even lower; however this was due to the dense structure and spatial configuration of the units as they form a complex labyrinth of poor legibility (Kaplan, 1989). In transect B (Fig. 68), the grove is assessed to be a preferred element as the elevated canopies and moderate understorey increase the feeling of spaciousness. This is further enhanced by the dense edges, but viewed from the outside the grove may appear unsafe (Jorgensen, 2002). The wasteland debris scattered within the grove is not a preferred feature (Qiu et al., 2013), yet it was found to be among the reasons for the rich assemblages of ground dwelling invertebrates in the grove.
Nordhavnstippen
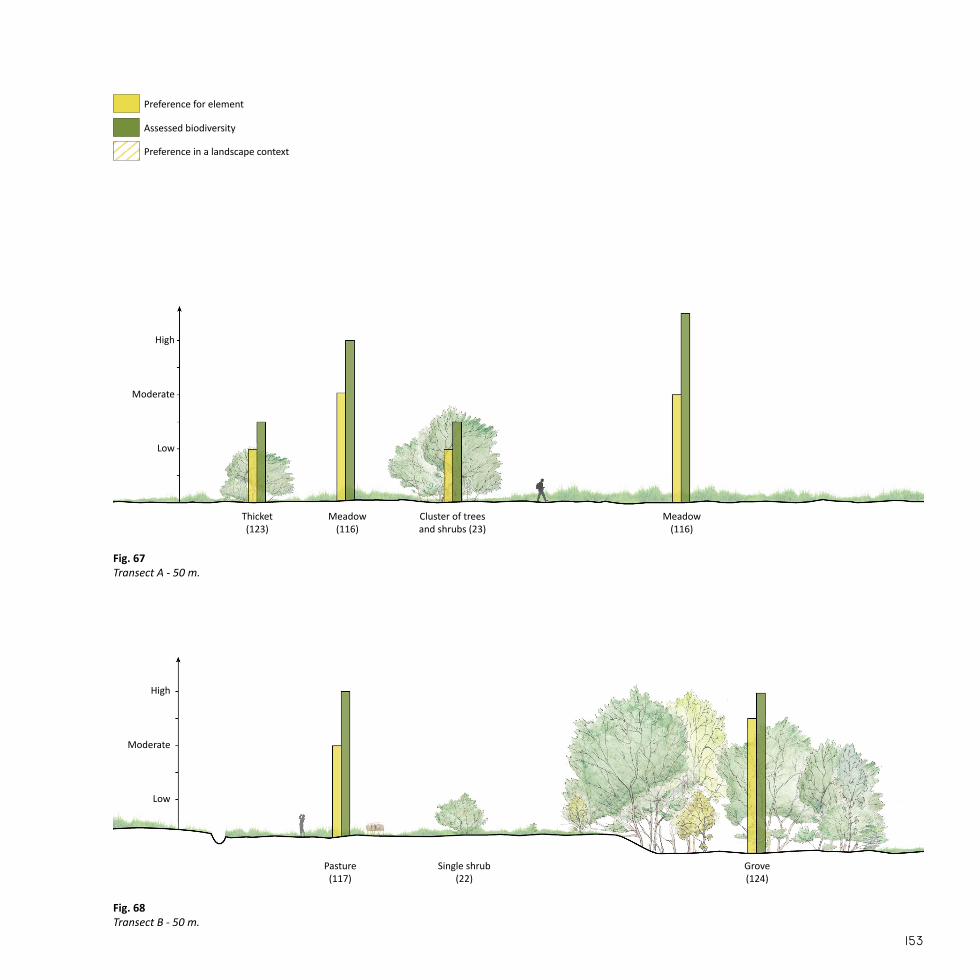
High
Moderate
Low
High
Moderate
Low
Cluster of trees and shrubs (23)
Meadow (116)
Meadow (116)
Thicket (123)
Single shrub (22)
Grove (124)
Pasture (117)
Fig. 68Transect B - 50 m.
Fig. 67Transect A - 50 m.
Preference for element
Preference in a landscape context
Assessed biodiversity

The remnants of Amagerbanen are a piece of cultural history, yet the un-controlled growth literally seems to cover the tracks of the past, which in itself could generate low preferences for the landscape in its entity. Amagerbanen displays high habitat diversity and is characterised by a mosaic of open and enclosed vegetation types. These are valuable traits in terms of biodiversity; however, it makes the landscape elements indis-tinguishable and the scenery difficult to read. The area is dominated by enclosed vegetation, that generally gain low preference as they are multi-layered and dense which makes way find-ing difficult (Jorgensen et al., 2002; Hull & Harvey, 1989). In addition, the hedgerows in transect B and C (Fig. 70 and 71) creates full enclosure and thereby increases the feeling of unsafety as there is not much opportu-nity for escape (Jorgensen et al., 2002). In the tree stand in transect A (Fig. 69) the density of the vegetation reduces visibility and similarly de-creases navigation (Hull & Harvey, 1989). The biodiversity results for the three, dense vegetation elements were moderately high. It appears that the density and structural complexity of the vegetation attracts wildlife, but discourages people. Where the landscape was not dominated by tall and dense vegetation, meadow and sporadic woody undergrowth prevailed. This vegetation type gains mixed preferences as it contributes to obscuring the ground surface (Bjerke, 2006; Kaplan & Kaplan, 1989), which is not very appro-priate where no pathway exists and the old railway tracks makes it un-easy to walk unhindered. The unattractive appearance of meadow veg-etation outside of season, not to mention the additional piles of twigs and branches along the tracks, all contribute the mixed preferences. Reversely, the complex composition of wooden sleepers and old track ballast, piles of twigs and branches, and tall herbaceous vegetation gave the meadow very high biodiversity results.
Amagerbanen
The lawn in transect C (Fig. 71) is the only element that gain high prefer-ence since it, contrary to the rest of the vegetation elements, is regularly mowed and thus expresses neatness (Nassauer, 1989). Similarly to for-mal green spaces, the neat and tended character of this unit is assumed to not support biodiversity.

High
Moderate
Low
High
Moderate
Low
High
Moderate
Low
Single tree (22)
Single tree (22)
Tree stand, 10-30%, 2-layered (131)
Meadow (116)
Hedgerow(61)
Hedgerow(61)
Hedgerow(61)
Hedgerow(61)
Fig. 70Transect B - 25 m.
Fig. 71Transect C - 25 m.
Fig. 69Transect A - 50 m.
Preference for element
Preference in a landscape context
Assessed biodiversity

Habitat unit High preference
Low preference
High
bio
dive
rsity
Meadow (116) x x
Pasture (117) x
Sheared hedge (59) x
Thicket (123) x
Tree row (62) x
Tree stand (131) x
Tree stand (132) x
Tree stands (159) x
Deadwood (4) x
Hedgerow (61) x
Low
bio
dive
rsity Grass strip (52) x
Lawn (113) x
Ornamental garden with perennials (21, 57) x
Ornamental gardenwith bushes (120, 20, 57) x
Single tree or shrub (22) x
Cluster of trees and/or shrubs (23) x
Grove (124) x
Tree stand (134) x
Tree stand (135) x
Tree stand (162) x
The results of the compatibility assessment shows that preferred land-scape structures are not always compatible with structures promoting biodiversity (Table 43). Elements of high preference are generally as-sessed to have low biodiversity. Elements assessed to have high biodi-versity are only preferred if they have ornamental value, express order or care, or have particular spatial qualities. This was evident from the high preference for linear elements such as hedges and tree rows and a tree stand with a spacious interior room. The desire for neatness and control, and the low preferences for dense and spontaneous structures as well as natural processes show that overall, biodiversity is not consid-ered attractive.
The compatibility assessment of each of the six case areas showed habi-tat structures, in which biodiversity and recreational preferences was particularly out of balance. As such, these habitat structures constitute areas of focus in Part III.
Conclusion to compatibility assessment
Table 43. Estimated preference for the habitat units of high and low biodiversity along the transects in the six case areas.
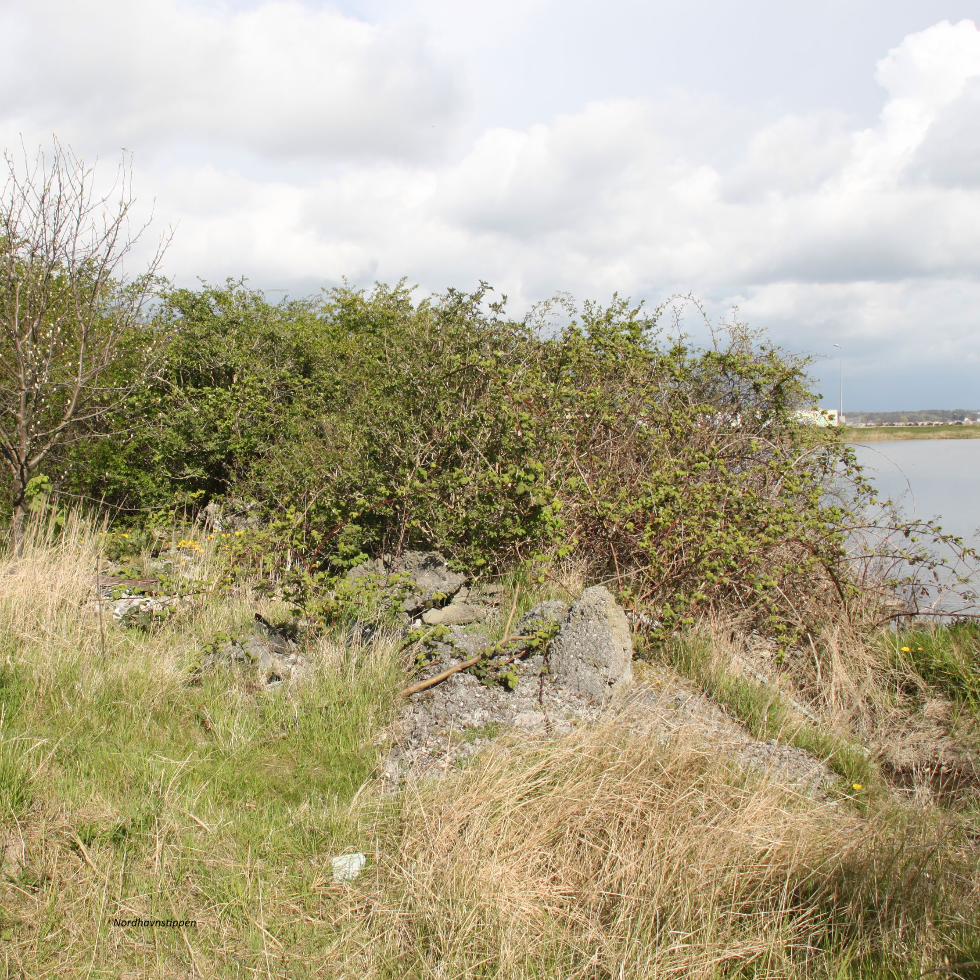
Nordhavnstippen


// Part III
POTENTIAL FOR COMPATIBILITY

The cultural pressure on urban green spaces to facilitate recreational functions and the general ambivalent attitudes towards ecological val-ues give rise to a number of implications, when it comes to promoting biodiversity within urban green spaces. Certain elements and structures accommodating biodiversity can be integrated in a recreational setting without difficulties, but others are not so easily accepted due to aes-thetic or functional discrepancies. The positive attitude towards spatial heterogeneity and species richness within urban green spaces (Petersen & Nielsen, 2011; Randrup et al., 2008) goes well in hand with biodiver-sity. However, the general aversion towards certain faunal groups or ele-ments such as deadwood may not fit well into the prevailing cultural conception of what is appropriate in urban nature. Aesthetics often gets the decisive vote in terms of what is accepted in an urban green space (Gobster et al., 2007; Özgüner & Kendle, 2006). If an element is aestheti-cally unpleasing, it is generally not tolerated.
Moreover, the recreational functions of urban green spaces may lead to further conflicts. As an example, floristically diverse, tall grassland veg-etation will neither survive, nor be a very practical surface for football matches. It was furthermore established that a landscape which does not show some evidence of care may induce a feeling of unsafety and as a result be less appealing (Özgüner & Kendle, 2006; Herzog & Chernick, 2000).
The concepts of nature and culture are by now greatly integrated both in our awareness and in practice. In order to avoid cultural misconceptions about ecological value serving as the motives for improving biodiversity, measures must be taken to translate genuine ecological qualities into a cultural language.
CHANGING THE NEGATIVE IMAGE OF WASTELANDSAs established, wastelands are an interesting addition to formal urban green spaces. In the recent decades, the term ‘urban wilderness’ has gained momentum and has even received attention in conservation ef-forts (Rink and Herbst, 2011). According to Rink and Herbst (2011) the term ‘urban wilderness’ is applied to diminish the negative connotation of wastelands and it represents a new approach to design and planning
Potential for compatibility
that utilizes the dynamics of spontaneous vegetation. The term ‘urban wilderness’ also encourages the implementation of new management concepts that include nature conservation, and increasing public aware-ness of ecological qualities. In addition, the term ‘urban wilderness’ proposes an inexpensive concept for wastelands, which combined with additional adjectives such as ‘controlled’ and ‘steered’ can remove any provocative connotations and reduce fears and concerns of the wild (Rink & Herbst, 2011; Bauer, 2013).
SIX LEGS ARE TWO LEGS TOO MANYPublic fears and concerns of the wild is a significant impediment against biodiversity. It is often related to the inconvenience caused by nature getting out of control such as when trees tip over in storms and when animals get too close (Petersen & Nielsen, 2011). In regard to animals in particular, people are very selective about which species they are inclined to support as some animals simply are more appealing than others. In fact, human preferences motivate conservation efforts based on the attractiveness of large charismatic species, especially attractive groups of vertebrates such as birds and mammals (Stokes, 2007). Stokes (2007) stated that biodiversity conservation to a considerable degree depends on the public appeal of various species. He further noted that efforts for conserving biodiversity will only take effect if people are famil-iar with the term biodiversity and have an understanding of the various species of concern.
A substantial group of organisms of which many species could be at risk of extinction in the near future are the invertebrates (Stokes, 2007; Col-len et al., 2012). As invertebrates are ‘the little things that run the world’ (Wilson, 1987), this is potentially a catastrophic loss. In spite of this, Kellert (1993) asserted that the values of invertebrates remain largely unrecognized. In his study of public perception of invertebrates Kellert (1993) found that people mainly expressed feelings of aversion, dislike, or fear toward most invertebrates, in particular insects and spiders. Furthermore, most people disapproved of major economic expenses regarding the protection of endangered invertebrates. A more positive attitude towards invertebrates transpired if the species possessed aes-thetic attributes such as colourful butterflies or practical qualities such as

pollinating bees. Kellert (1993) concluded that it is unlikely that people will change their general attitudes towards invertebrates. Nevertheless, he added that a more compelling representation of this group of fauna that emphasises the benefits of invertebrates may alter some opinions to their advantage.
The power of information in changing people’s perceptions of nature has consistently been proclaimed in research (Gobster et al., 2007; Stokes, 2007; Kellert, 1993). It has been suggested that informing the general public about the importance of biodiversity and relating it to aesthetic values could be a wise move in terms of raising awareness and support for conservation initiatives (Stokes, 2007; and references therein; KK, 2011).
CUES OF CAREIt is universally acknowledged that neatness expresses control, and control a sense of power. The aesthetics of care is powerful; however, Nassauer (1995) argues that this aesthetics can be interpreted beyond neatness to include ecological values. The problem with introducing structures for promoting biodiversity within urban green spaces is that they are likely to express a lack of care. To prevent this problem Nassau-er (1995) suggests providing the untidy expressions with orderly frames. Placing unappealing structures and forms within a cultural framework indicates that the area is well cared for which will gain people’s approval. This may be achieved with simple features such as fences, lawns or other structuring elements. Nassauer (1995) further states that people do not immediately recognize ecological qualities. Therefore, a combination of cues of care and information about the ecological merits of the land-scape is a well matched solution.
In a formal green space setting, it should be possible, to a certain extent, to enhance ecological values as long as it is does not compromise rec-reational qualities. A sports field may rightfully never be converted into a meadow, but areas that are not actively used may readily be included in new management practises as long as it looks intentional. Addition-ally, keystone structures of high biological value such as deadwood can be incorporated in the park design to make it less visible and less of an eyesore.
In informal green spaces, cues of care will help increase recreational use. This is not without significance as such areas may easily convey neglect and therefore be in danger of urban development (Tredici, 2010; and references therein). Recreational use should be encouraged, but with-out compromising the ecological qualities. As we have established, these informal areas often harbour particular diverse flora and fauna that could be sensitive to user pressure. Design interventions that encour-age recreational use should still ensure the ecological qualities of the area. Alterations should preferably support that these areas are to be experienced on nature’s own premises. As revealed by the case studies, these areas are too ecologically valuable to be moulded into a culturally defined form. Instead, they should serve as interesting alternatives to the existing formal green spaces and communicate ecological qualities.
According to Bauer (2013), the way to balance recreation and wilderness while protecting the nature of these areas is to create a zoning system. Main focus should be establishing zones that allow nature to develop freely and largely undisturbed. These can also be used for guided tours. Other zones designated for recreational activities will ensure that the areas can be used and enjoyed. This provides people with a direct ex-perience of wilderness which can in turn increase the acceptance and awareness of ecological processes and the importance of wilderness sites (Rink and Herbst, 2011). A zoning system can be combined with small-scale interventions to increase both biodiversity in an area and recreational functions.
Small-scale interventions can be used to solve a larger problem and transform the urban context without the necessity of dramatic spatial changes (Unt & Bell, 2014). As such, small-scale interventions are an alternative to large transformations which often require great funding. Often these interventions solve site-specific issues, are more tempo-rary, and with low budgets. In a study by Unt & Bell (2014) it was found that the spatial interventions of urban acupuncture at a derelict site in-creased the time people spent outdoors as well as the types of activi-ties they engaged in. While these interventions were not new ideas, the study emphasised just how large an influence even small changes can have.
There is potential for synergies between biodiversity and recreational preferences that must be exploited to increase compatibility between the two. However, this calls for an approach that blurs unappealing as-pects of biodiversity, and ensures that people gain awareness of ecologi-cal values.
In a formal green space settings, where the landscape is so clearly de-fined, a solution is to create illusions or distractions that draw attention away from conservation efforts. This can be done by integrating them in conventional green space patterns that fit within the existing scenery. In an informal green space setting, where nature rules, the challenge is to preserve the existing ecological qualities, while inviting people in to establish affinity for the area. This requires a delicate balance. Therefore, a solution is to implement a form of mild behaviour control in which people are unconsciously guided around the area to keep user pressure at a reasonable level. With these general objectives in mind, the follow-ing design strategies can be applied.
Design strategies

Strategies for promoting biodiversity in formal green spaces without compromising recreational values.
Strategies for optimising recreational use of informal green spaces with-out compromising existing ecological qualities.
CUES OF CARE• Integrate ecological qualities into the existing, familiar patterns to
make them seem a part of the design.
ZONING• Establish well-maintained zones to increase attractiveness of
the area.
STORYTELLING• Assign an appealing name or storyline to the area or element to
promote a positive experience.• Communicate about ecological qualities to increase awareness,
acceptance, and interest.
FACILITIES• Provide facilities that increase comfort and encourage stay.
NATURE EXPERIENCES• Ensure nature experiences by guiding people to where there is
something interesting to see. • Make special attractions out of seasonal natural phenomena.
ORIENTATION• Increase legibility of the area by means of pathways and
landmarks.• Guide people away from areas that are sensitive to user pressure.• Provide different routes that accommodate different tastes for
wilderness.
DISTRACTIONS• Create distractions by introducing attractive elements in less
appealing settings.• Place less attractive elements out of direct sight.
NATURE EXPERIENCES• Ensure nature experiences by guiding people to where there is
something interesting to see. • Make special attractions out of seasonal natural phenomena.
STORYTELLING• Enhance the narrative value of the place by emphasising the
history and former use of the area. • Assign an appealing name to the area to promote a positive
impression. • Communicate about ecological qualities to increase awareness
and interest.
Formal green spaces Informal green spaces
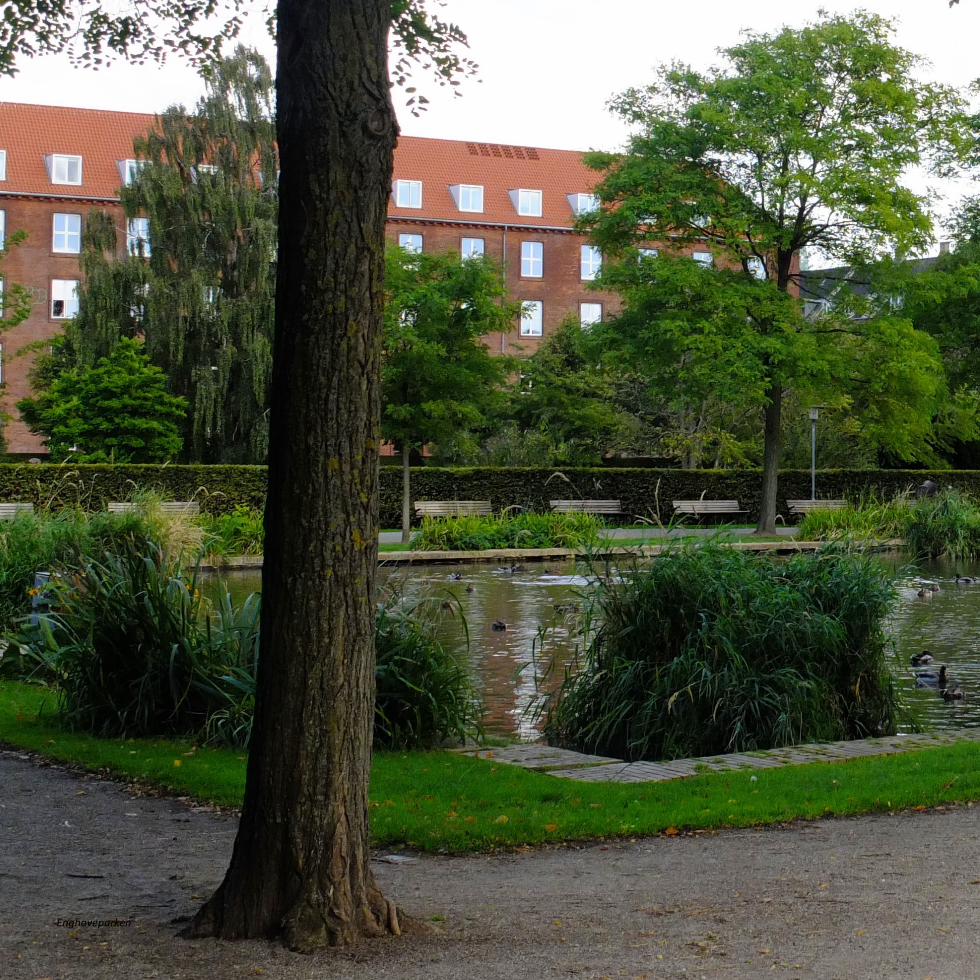
Enghaveparken

Proposals

Fælledparken has a distinctive recreational purpose, for which especially the extensive lawns play a key role. In order not to impede the recrea-tional activities in the park, measures for increasing biodiversity should mainly be undertaken within or near the existing borderline forest plant-ings. These plantings are designated to be experienced from afar rather than from within and as such, their interior space can be utilized to in-crease biodiversity. Re-thinking the functions of the plantings will fur-ther benefit the recreational qualities of Fælledparken, as it adds a new set of experiences to the park. The promotion of biodiversity in this type of park relies especially on cues of care, as well as the additional strat-egies of creating distractions and offering more nature experiences by means of storytelling.
FOCUS AREAS
FLOWERING LAWNS (1)Along the plantings (Fig. 56 and 57) strips of mowed grass ensures a neat and orderly expression, yet they have little ecological value. However, since these grass strips are the means of increasing preference for the adjoining dense and multi-layered plantings, we assert that they should keep their existing expression and function. If the density and complexi-ty of the neighbouring plantings can gain more appeal by means of these mowed edges, this is considered an acceptable trade-off. The extensive lawns generally displayed low biodiversity (Fig. 59). This can be improved by after sowing with seed mixtures that contain spe-cies such as Trifolium repens, Taraxacum spp., and Bellis perennis. Such species tolerate wear and tear relatively well and may thus help increase floristic diversity in areas of more intensive use. Underneath trees, the mowing practice could be reduced to ensure structural variation within the lawn and to promote the flowering of herbs. Additionally, the lawns may be supplied with flower bulbs in appropriate areas. Besides from creating a seasonal attraction for park visitors, this will support pollina-tors who emerge early in the season when resources are scarce.
ADDITIONAL IMPROVEMENTS
INTO THE WOODS (2)This planting is the longest continuous forest planting within Fælledpar-ken. By means of a few improvements, biodiversity in this habitat may increase and nature experiences can be enhanced. The establishment of a footpath will allow for better access and orientation within the plant-ing. Additionally, the creation of gaps in the canopy will increase light penetration and promote herbaceous ground vegetation. This could be further aided by incorporating topsoil from a nearby forest to serve as a seed bank (see Nakamura et al., 2005) or by introducing native forest herbs (see Andersen & Nielsen, 2010). A diverse herb layer and distribu-tion of deadwood will increase the quality of the habitat and also pro-vide a rich forest scenery which will enhance the sensory experience of species richness. This area can thus offer an alternative route to the con-ventional open path system that is characteristic to Fælledparken and to this type of park in general.
On the orientation signs of Fælledparken, this forest planting could fur-thermore be assigned with an appealing name to evoke the curiosity of park visitors.
DIVERSE SHRUB LAYERS (3)The forest-like plantings are often dominated by the encroaching, non-native species Symphoricarpos albus (Pic. 20), which although practical from a management point of view is of little value to wildlife. To promote a more diverse shrub layer that supports native fauna, Symphoricarpos albus should be cut back and replaced with native species such as Ribes alpinum, Acer campestre, Lonicera xylosteum, Crataegus monogyna, and Corylus avellana.
FAUNA IN FÆLLEDPARKEN (4)Nature experiences can be enhanced by communicating about the eco-logical qualities present in the park to park visitors. This especially ap-plies to the forest plantings, where information signs can serve to inform
FÆlledparken

people about the wildlife that is associated with the habitat, such as bats and birds.
ORNAMENTAL GARDENS (5)The ornamental garden comprises a large proportion of the non-native species registered in Fælledparken. To keep the use of non-native flora at a minimum and support native invertebrate fauna, native perennials should be prioritised, and preferably compositions that ensure flowering during the entire season. In addition, seed heads should be left through-out the winter season to support granivorous wildlife, as well as hiber-nating species. With a well chosen composition, withered perennials can provide a decorative display when the frost sets in.
Fig. 72Selected areas for the proposals
Pic. 19Lawn with Trifolium repens.
Pic. 20The non-native Symphoricarpos albus is often dominating the shrub layer in Fælledparken.
1
4
4
3
2
1
5
N

The distinctive neatness of the neoclassical and horticultural expression of Enghaveparken proposes a significant challenge for improving biodi-versity. As such, any changes or additions to the park must be carefully integrated into the existing design, in which case the strategy ‘cues of care’ becomes essential.
FOCUS AREAS VARIATION OF GRASS SURFACES (1)The strong symmetrical structure of Enghaveparken is underlined by strips of mowed grass that run along the many plantings (Fig. 60, 61, and 62). In order to increase the ecological value of these units, we suggest reducing the mowing intervals to approximately once every third week. This will enhance structural variation and promote flowering of the exist-ing herbs Trifolium repens and Bellis perennis for the benefit of grassland invertebrates within these edge habitats. As the design is so outspoken in this park, we believe reduced mowing intervals of these grass strips will not be a significant alteration of the overall expression of the park. In accordance with the very formal expression of Enghaveparken, the lawns are intensively mowed and thus of low ecological value (Fig. 61). While a reduced mowing practice is not appropriate in these areas, we suggest the addition of flower bulbs to enhance the ecological value of these grassland habitats in the spring, before they have to be available for sunbathing and picnics etc. This goes well in hand with the horticul-tural expression of the park and furthermore provides a seasonal attrac-tion. ADDITIONAL IMPROVEMENTS RETHINKING PLANT COMPOSITIONS (2)Enghaveparken is vastly dominated by non-native flora. When rejuve-nation of the plantings is in order, the choice of new plants should be biased towards native or at least near-native species to support the na-
Enghaveparken
tive fauna. In addition, species that provide resources such as pollen and nectar as well as fruit will add to the ecological value of the plantings and may also be appealing elements for park visitors. However, fruit-bearing species should be integrated sporadically to not produce an abundance of windfall fruit that could potentially be disturbing the neat expression of the park.
Similarly, native perennial species should be prioritised in the ornamen-tal gardens as well as continuous, alternating blooming throughout the season. The withered perennials and seed heads should be left through-out the winter season for the benefit of hibernating species and granivo-rous wildlife, but also as a decorative feature in the winter months. In addition, natural elements such as wattle fences or small stone walls can be incorporated in the ornamental, horticultural plantings, to increase habitat heterogeneity, and additionally enhance the romantic expres-sion of the plantings.
FOR THE BIRDS AND THE BEES (3)Distribution of birdhouses and insect hotels can add to the experience of nature within the park. While it is not guaranteed that these will be inhabited by the intended wildlife it will convey the message that in Eng-haveparken, nature is cared for. This can be supported by information signs about the species that are expected to utilize the nesting facilities, which potentially can spark an interest for nature among park visitors.
THE POND (4)The water feature is a favoured element in the park and attracts a lot of visitors. However, the mismanaged state caused by excessive bird feed-ing has resulted in eutrophication and algae growth, which decreases biodiversity and gives the water a mudded appearance. By occasionally cleaning the water and forbidding bird feeding activities by means of information about the ecological consequences it is possible to increase the quality of the habitat for a variety of organisms as well as enhancing the neat expression of the park.

Fig. 73Selected areas for the proposals
1
4
3
3
2
1
N
Pic. 21Example of an ornamental insect hotel.
Pic. 23A lawn with bulbs early spring which has value for both pollinators and park visitors.
Pic. 22The pond in Enghaveparken attracts many birds which results in excessive feed-ing.

Mimersparken is still a very young park and as such, it has not yet estab-lished a firm character. This provides an ideal opportunity to influence its continuous development. As the park is designated to accommodate a broad range of activities, it presents some difficulties in terms of promot-ing biodiversity. Yet the area holds a lot of potential. The strategies that can be employed to exploit this potential are a combination of applying cues of care and ensuring nature experiences by means of storytelling.
FOCUS AREAS
GRASS UNDER TREES (1)To further enhance the naturalistic expression of the designated ‘forest edge’, mowing of the lawn underneath the trees (Fig. 63 and 64), and the stairwell should be reduced to twice a year. This will establish structural variation of the grassland vegetation and promote the richness of herba-ceous plants already present in the lawn. The shape of these alternative grassland patches should be clearly defined to convey an expression of order and care.
SALIX FOR POLLINATORS (2)The two clusters of shrubs consisting of Salix spp. are in poor condition and only a few plants remain. As these shrubs are a valuable habitat and foraging resource for wildlife, the clusters of Salix should be re-es-tablished and provided with a fence until they have gained a foothold and are able to withstand the pressure from children’s play. The shrubs should comprise both male and female Salix spp. to provide both pollen and nectar for invertebrates.
Mimersparken
ADDITIONAL IMPROVEMENTS
MAINTAINING THE MEADOW (3)By design, the strip of meadow is intended to develop into a ‘forest edge’. However, as the relatively high level of biodiversity in this park is due to this particular habitat, it is important to maintain its open struc-ture in the future. Therefore, maintenance of the herbaceous vegetation should be undertaken, to prevent the domination of shrubs and grasses, and instead promote herbaceous diversity. In this case, a rotational man-agement scheme in which sections of the vegetation are excluded from cutting to promote structural variation for flora and fauna could be ben-eficial. To ensure the expression of the long meadow strip, we further suggest that cutting of the vegetation is done in lengthwise zones so that tall meadow vegetation is always present along the total length of the strip. To increase the experience of this habitat, botanical information signs can be put up to inform park visitors of the flora and fauna and to increase preference for this type of nature.
VERTICAL VEGETATION (4)To increase structural diversity of vegetation and habitat heterogeneity, additional trees can be planted in one part of the ‘forest edge’. This will furthermore increase the nature experience of the ‘forest edge’ and also create a visual barrier to the railway.
In addition, we propose that the fences enclosing the artificial football pitch could be utilized by climbing vines like Humulus lupulus, Lonicera caprifolium or other such native species, favoured by pollinating insects.

Fig. 74Selected areas for the proposals
1
4
4
3
3
2
2
1
N
Pic. 24Humulus lupulus can cover vertical surfaces and attract bees.
Pic. 26A well defined edge around an area with unmown grass expresses order.
Pic. 25Salix is a valuable plant for pollinators foraging in the early spring.

Since Stejlepladsen is rather secluded and located amongst residential housing and a local marina, the area should mainly be promoted as a ‘green back yard’ for the local community. Although declared a valuable cultural landscape, the area offers little opportunity for exploration. In-creasing orientation, by means of zoning and facilities will draw people in and increase the experience of the area. Through storytelling, the par-ticular historical narrative can be emphasised in order to assign further value to the area.
FOCUS AREAS
COMFORT ZONES (1)The dense thicket in the centre of the area is a valuable habitat for flora and fauna (Fig. 65), yet the enclosed element evokes suspicion. By es-tablishing a zone of mowed grass with facilities within close vicinity to encourage stay, a message is conveyed that this is a safe area. The zone should be established north west of the thicket, to preserve a view to the main road, which will further increase the feeling of safety. Establish-ing a neat mowed zone in this particular area where the vegetation was dominated by rough grasses is a convenient trade-off as more diverse meadow vegetation on the southern side of the thicket may then be spared. MOWED TRAILS (2)The tall meadow vegetation generally decreases legibility of the area and makes it difficult to move around the landscape (Fig. 65 and 66). A mowed trail will signal where to walk and make it possible to guide peo-ple away from areas that could be sensitive to user pressure. The existing trodden paths signal where people prefer to walk and should be re-used for the mowed trail, but it should especially lead people past particular attractive elements such as fruit bearing trees and shrubs and particu-larly diverse herbaceous vegetation to increase nature experiences.
Stejlepladsen
ADDITIONAL IMPROVEMENTS HISTORIC CONNECTIONS (3)The history of the area can be conveyed through information signs at various places, and by the remains of equipment from the old fishing in-dustry. The history of landfill could furthermore establish a historic con-nection to the larger neighbouring area of Sydhavnstippen, and possibly motivate the establishment of a better physical connection between the two areas, that at present are only separated by a scrap yard.
FACILITIES THAT ACCOMODATE RECREATION (4)Distribution of facilities such as benches and trash cans will convey order and increase the appeal of the area to encourage stay. The area would benefit from disposal of waste such as metal scraps, overgrown fishnets, and broken buoys that could constitute a safety risk to both people and wildlife. A valuable addition to the area could be a watch tower, placed near the centre. This would both constitute a landmark within the area to increase way-finding, but it will also provide the opportunity of expe-riencing the area and its context from a different height.
CONNECTION TO THE WATER (5)While Stejlepladsen lies in close vicinity of the harbour, the water can only be accessed in where it is not blocked by dense vegetation and hin-dered by a steep embankment. To increase visibility and experience of the water, vegetation blocking the view should be cleared and facilities by the water should be provided.
MAINTAINING THE LIGHT OPEN CHARACTERAs succession progresses Stejlepladsen will eventually develop into for-est. As the mosaic of open and enclosed vegetation increases habitat heterogeneity, clearing of shrubs over 1 meter should be carried out every third year. This will allow the present vegetation to mature, but preserve areas of open meadow vegetation which furthermore is essen-tial for conveying the history of the area.
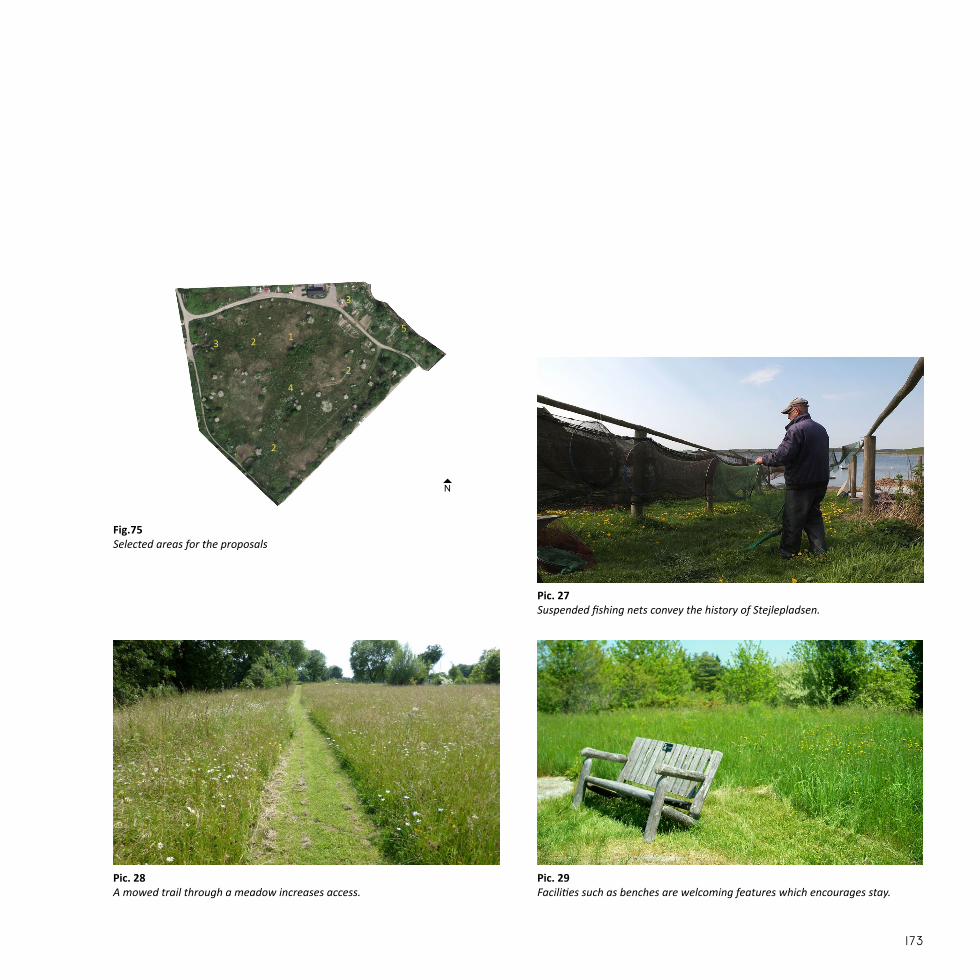
Fig.75Selected areas for the proposals
1
4
3
3
2
2
25
N
Pic. 27Suspended fishing nets convey the history of Stejlepladsen.
Pic. 29Facilities such as benches are welcoming features which encourages stay.
Pic. 28A mowed trail through a meadow increases access.

As Nordhavn is developing into a new urban district of Copenhagen, Nordhavnstippen could potentially be in danger of being included in fu-ture expansion projects. However, as this is a valuable piece of nature, it is important to increase awareness of its ecological and potentially recreational values to maintain it as an urban green space. We suggest implementing zones to add elements of order to an otherwise disorderly scene and increase orientation to enhance way-finding and encourage exploration. The use of storytelling can give the area narrative value as a historical area as well as an area with nature experiences. FOCUS AREAS
MEADOW TRAILS (1)In areas where tall meadow vegetation makes orientation difficult (Fig. 67), a mowed trail could inform people where to walk, and at the same time lead people away from sensitive areas. The trail should to a large extent exploit the pre-existing trodden paths, but it should especially guide them through a scenic route and past areas, where there is some-thing interesting to be seen, such as views or diverse meadow vegeta-tion. The experience of the latter could be enhanced by the distribution of information signs about the botanical qualities to increase interest in ecological values. To increase orientation in the landscape, additional gates should be added to the enclosure around the pasture, to signal that access is al-lowed. Furthermore, signs should inform about the effects of grazing to increase awareness of the ecological benefits of this form of mainte-nance (Fig. 68).
Nordhavnstippen
ADDITIONAL IMPROVEMENTS
WELCOMING FACILITIES (2)While this area holds special value for nature enthusiasts as it is, it should also appear welcoming to the broader public. In this regard, zones dis-playing order and care will appeal to people who have different prefer-ences for green spaces. Zones should be established in appealing areas such as near the lakes, near the sheep or on top of a hill, where there is a view of the surroundings. These zones should further be equipped with facilities such as benches, trash cans, and shelter, in the case of sudden shifting weather. A particular facility that could enhance nature experi-ences, is a watch tower placed to ensure a view of the lakes, from where it is possible to experience the rich bird life. NATURE WALKS (3)The diverse nature experiences and the size of the area, makes it an ideal green space for outings with an educational purpose. Guided tours for groups of young as well as older people with a focus on the flora and fauna can help spark awareness of the value of this piece of nature and possibly increase interest in biodiversity. The grazing sheep provide an additional attraction that in itself can assign value to the area as a desti-nation for an outing. The history of landfill provides an ideal opportunity for teaching about natural succession, as this area has had no particular function, what is seen to be entirely the result of natural colonisation. In this regard, the different stages of development should be communicated to possibly increase interest in its future natural development.

Fig. 76 Selected areas for the proposals
1
1
1
3
3
3
2
N
Pic. 30In Nordhavnstippen the grazing sheep provide a visitor attraction.
Pic. 32Information boards on the rich flora and fauna communicate about the ecologi-cal qualities of Nordhavnstippen.
Pic. 31A bird watching tower can enhance the experience of the rich bird life.

The long continuous shape of Amagerbanen has made it a transit area. However, a transit area can have significant recreational value for ex-ample by offering a ‘daily dose of green’ on a daily route from A to B. Amagerbanen has both ecological as well as historic value, and by focus-ing on storytelling, the cultural heritage of the area can foster an inter-esting meeting between culture and nature.
FOCUS AREAS
THE TRACK OF HISTORY (1)Currently, the tall herbaceous vegetation is not appealing as it covers the railway tracks and makes it difficult to move around in the area (Fig. 69). In order to increase accessibility and at the same time preserve the rich meadow vegetation, a path should be established between the rails, to enable safe walking. This path will add an element of order within a mosaic of spontaneous vegetation and should thus increase the appeal of the tree stand (Fig. 69) as people are being lead safely past it.
In the southern part of Amagerbanen, tall meadow vegetation covering the tracks is once again decreasing the appeal of the rest of the scen-ery due to poor accessibility (Fig. 71). Here, a path could similarly be established between the tracks and woody undergrowth should be re-moved to emphasise the spaciousness of this ‘inner room’. The continu-ous removal of the invasive giant hogweed that is progressing in the area should be ensured.
GAPS IN THE TUNNEL (2)The tunnel creates enclosure, which can be intimidating (Fig. 70). We suggest removing the fence that runs along Uplandsgade to open up the entire area of Amagerbanen and to decrease the sense of enclosure in the tunnel. The hedgerow should remain as it blurs the noise from the adjacent traffic, but gaps in the vegetation will allow for slipping out onto the street if need be.
Amagerbanen
ADDITIONAL IMPROVEMENTS
THE FLOWER WALK (3)The hedgerows creating the tunnel around the tracks consist mainly of Prunus cerasifera which make a heavenly display in late spring when they bloom. This seasonal attraction is ideal for increasing appeal for the area and should be communicated to the local community.
SOFTENING THE EDGES (4)The edge towards Kløvermarken could be expanded to increase ecologi-cal value. We propose reducing mowing to once or twice a year in a zone between Amagerbanen and Kløvermarken. This will increase the quality of the edge habitat and promote flowering of the existing Trifolium re-pens as a resource for pollinators. To block the view of the unappealing car rental service in the northern part of Amagerbanen, trees should be planted along the edge. These could conveniently be planted in line to add an element of order to the natural succession.
MORE MEADOW (5)The area of mowed grass across Uplandsgade and along the business enterprises in the southern part of Amagerbanen could benefit from a reduced mowing scheme to promote a species rich composition.

Fig. 78Selected areas for the proposals
114 4
3
2
5
5
N
Pic. 33An ecocline edge towards Kløvermarken can increase the quality of the edge habitats.
Pic. 35The flowering tunnel of Prunus ceracifera could be a seasonal attraction.
Pic. 34The remaining tracks of Amagerbanen can be converted into a path.


// Part IV

This thesis focused on the compatibility of biodiversity and recreational preferences in urban green spaces of Copenhagen. A comparative as-sessment of biodiversity between three formal green spaces designated for recreational use and three informal green spaces with no assigned function revealed that in many respects, biodiversity was higher in the informal green spaces. Nevertheless, the results of the biodiversity as-sessment did not differ significantly between the two types of green spaces. This was reflected across a selection of biodiversity indicators which included diversity of habitats, diversity of vascular plants, and di-versity of terrestrial invertebrates. The spontaneous character of the informal green spaces created com-plex vegetation structures which supported high diversity of herbaceous plants and associated invertebrates. Furthermore, these complex struc-tures created a mosaic of vegetation elements that promoted habitat heterogeneity. Adding to this, the informal green spaces proved to have a great number of habitat units and structural qualities in common. If these are shared by additional informal green spaces this could make them important patches of ecological stability within the urban land-scape.
It was found that the comparatively high biodiversity results of the for-mal green spaces were related to the designed character and particu-lar spatial configuration of landscape elements which promoted habitat heterogeneity. However, the quality of some habitats was found to be compromised by stylistic transitions between habitat units and inten-sive maintenance of the extensive grassland habitats which greatly de-creased diversity of herbaceous vegetation and associated invertebrates. The composition of woody vegetation was very diverse, yet diversity was confounded by the abundance of non-native species.
The results of the biodiversity assessment pointed towards several fac-tors that promote biodiversity. However, far from all of these factors cor-respond with preferred landscape qualities. The main discrepancies lie in the distaste for dense vegetation and complex, disorderly structures. Conversely, these are some of the qualities supporting biodiversity.
Conclusion
The findings indicated that biodiversity and recreational preferences are compatible to the extent the factors promoting biodiversity do not im-pinge on cultural conceptions of urban green spaces or to the extent recreational preferences do not compromise ecological qualities.
In the formal green spaces, compatibility between biodiversity and rec-reational preferences can be increased if interventions for promoting bi-odiversity are integrated in the cultural framework that surrounds these traditional green spaces. This can be achieved with ‘cues of care’ that disguise unappealing structures and elements in conventional green space patterns. In the informal green spaces compatibility can be in-creased by introducing similar conventional green space patterns to the natural, unregulated setting. This may be accomplished by zoning the area in sections that conserve sensitive ecological qualities, and sections that provide the necessary space and facilities for recreational activity.

Enghaveparken

When we set up the premise for this thesis, we did not expect to find that the formal urban green spaces comprise such commendable foun-dations for biodiversity compared to the reasonably more natural infor-mal green spaces. However unexpected, this was a positive conclusion to arrive at. It tells us that efforts for conserving and promoting biodi-versity within formal urban green spaces do not begin at the foot of the mountain, but at rather considerable heights. RETHINKING URBAN GREEN SPACESAnother positive finding of the biodiversity assessment was that bio-diversity in the informal green spaces was in fact high. As such, they are an important part of the urban green infrastructure. Their poten-tial as stable ecological refuges for flora and fauna further emphasises the importance of informal green spaces for conserving and promoting biodiversity within the urban environment. However, the future of such areas may be uncertain if they are not accepted by the general public. This acceptance is made difficult by the generally low preferences for the spontaneous and disorderly expression of informal green spaces. The challenge, therefore, lies in promoting these areas as welcoming urban green spaces. This being said, people should not expect that these areas present the same recreational qualities as conventional, formal urban green spaces. Instead, informal green spaces should be offered as alter-native green settings to communicate about biodiversity and ecological qualities. Although formal green spaces may not possess the same valu-able ecological qualities as informal green spaces, it must be acknowl-edged that these traditional green spaces have an important recreation-al function. In this case, efforts for promoting biodiversity are neither always possible nor fitting in such settings. Nevertheless, a little goes a long way and even small interventions for establishing better synergy between biodiversity and recreation have a value. As the planning and management of urban green spaces is greatly influ-enced by general recreational preferences it is not without relevance to examine the drivers of people’s likes and dislikes for various landscape structures. However, preferences are complex. The idea of comparing
Reflections
elements and structures that promote biodiversity to recreational pref-erences presented some challenges. As a framework for determining biodiversity, we classified the landscape elements of each case area ac-cording to fixed definitions. Yet, this framework was not immediately applicable for assessing recreational preferences. Several variables influence recreational preferences. People may re-spond positively to a certain element, but if this element is placed in an unappealing setting, preference will vary. Therefore, the elements and structures that were initially identified to be preferred through the lit-erature study had to be re-assessed when compared to the identified biodiversity ‘hot spots’ in each case area. The fact that preferences dif-fer according to different variables can, however, be beneficial for pro-moting biodiversity within urban green spaces. Knowing the drivers of recreational preferences could make it easier to target interventions for promoting biodiversity to cause minimal conflict.
A VIABLE TOOL FOR ASSESSING BIODIVERSITYThe empirical research completed for this thesis was comprehensive and took up a substantial part of the working period. Nevertheless, we saw this final assigned project as an ideal opportunity to make a more detailed study of the drivers of biodiversity to gain knowledge which in a future career situation will enable us to make appropriate decisions based on experience. The employed method for assessing biodiversity will probably not be time efficient in a professional situation. Yet, with certain modifications we believe this is a viable tool for assessing bio-diversity in and between urban green spaces. This could be valuable to planning and management authorities as the method can serve to illus-trate where attention should be directed for conserving and promoting biodiversity within urban green spaces. In this regard, the approach to assessing habitat diversity is considered to be easily applicable as many municipalities keep mapped recordings of their green spaces. Biotope mapping can therefore, to a large extent, be completed at the desk and supplemented with field observations.

Determining species diversity in the characteristic landscape structures gives added value to the assessment of biodiversity within the given area; however, it may be considered too comprehensive to be cost-effec-tive. While the registration of vascular species might be conducted effi-ciently, the assessment of invertebrate diversity could be unmanageable without sufficient knowledge of invertebrate taxonomy. Nevertheless, an assessment of invertebrate diversity provides additional information about habitat quality. Therefore, it should be prioritised as a means of monitoring the given area to assess the effects of management changes on habitat conditions. These monitoring efforts could further serve as evidence of either decline or progress in biodiversity within the given green space, which is valuable for catching the attention of policy mak-ers.
MIND THE GAPIn the process of writing this thesis, we have become increasingly aware of the fact that conservation and promotion of biodiversity within the urban environment greatly depend on whether planners and manag-ers will relinquish their aesthetic preconceptions about nature. This has made us reassess the skills we have acquired during the past five years of studying landscape architecture. We conclude that there is a gap in this field of study as the concept of biodiversity has received far too little attention. This gap is unfortunate since landscape architects as future advocates of our green surround-ings have a significant share of the responsibility of supporting ecological qualities as well as conveying their importance to the public. Yet, it is our observation that landscape architects demonstrate limited knowledge of biodiversity. The traditional norms and values within landscape architecture seem to stand in the way of working with nature’s own dynamics. A dynamic landscape is not easily drawn on a plan which presents a challenge for communicating a final result to a client. However, working with a dy-namic landscape is an interesting alternative approach to this profession
as the work is in continuous development. Furthermore, utilising natural dynamics can reduce project expenses. However, for this approach to gain momentum among landscape architects, there is a need for better ecological knowledge. Knowing how to work with nature and not against it may induce planners and managers to look beyond the human aspect of urban green spaces and weigh biodiversity and recreational prefer-ences more equally. Working towards increasing the compatibility of biodiversity and recrea-tional preferences is essential for conserving and promoting biodiver-sity in urban green spaces. In this regard, there is also a need for better ecological knowledge among the general public. Ecological qualities are only visible to the knowing eye. We urge that informal green spaces are utilised to make people rethink the term ‘urban green space’. If planners and managers can manage to present informal green spaces as fascinat-ing areas of spontaneous, natural processes, it will not only help save these valuable green spaces from redevelopment, but possible trigger an interest in these alternative urban green spaces among the general public. There is a lot of experiences awaiting in these areas, for those who dare to take a walk on the wild side.


References

Agger, P., Brandt, J., Jensen, S.M. & Ursin, M. (1982) Biotopmønstrets betydn-ing for forekomsten af vilde dyr og planter. Forskningsrapport nr. 24. Roskilde: Roskilde Universitetscenter.
Agger, P. (2012) Naturens værdi. In: Meltofte, H. (ed). Danmarks natur frem mod 2020 - om at stoppe tabet af biologisk mangfoldighed. København: Det Grønne Kontaktudvalg.
Ahern, J. (2007) Green infrastructures for cities: The spatial dimension. In No-votny, V. & Brown, P. (eds.). Cities of the future: Towards integrated sustainable water and landscape management. London: IWA Publishing.
Alvey, A.A. (2006) Promoting and preserving biodiversity in the urban forest. Ur-ban Forestry and Urban Greening. 5 (4). p. 195-201. Andersen, J.F. & Nielsen, A.B. (2010) Skovbundsflora i bynær skov. Park og Land-skabsserien 8.0-14. København: Skov og Landskab.
Andersson, S.L. (1999) Nye omgivelser - nye holdninger - ny strategi. [online] Available from: http://www.arkitekturnet.dk/landskab/9912sla.htm [Accessed: 03 september 2015]
Appleton, J. (1975) The experience of landscape. London: John Wiley.
Armstrong, H. (2006) Time, Dereliction and Beauty: an argument for ‘Landscapes of Contempt’ The Landscape Architect, IFLA Conference Papers. p. 116 -127.
Bauer, N. (2013) Attitudes towards wilderness and public demands on wilder-ness areas. In: Kowarik, I. & Körner, S. (eds). Wild Urban Woodlands. New per-spectives for urban forestry. Springer Berlin Heidelberg.
Bennie, J., Huntley, B., Wiltshire, A., Hill, M.O. & Baxter, R. (2008) Slope, aspect and climate: spatially explicit and implicit models of topographic microclimate in chalk grassland. Ecological Modelling. 216 (1). p. 47-59.
Bernhardt, T. (n.d.a) Three levels of biodiversity [online] Available from: http://canadianbiodiversity.mcgill.ca/english/theory/threelevels.htm [Accessed: 29 April 2015]
Bernhardt, T. (n.d.b) Gaining and losing biodiversity [online] Availbale from: http://canadianbiodiversity.mcgill.ca/english/theory/gainingandlosing.htm [Ac-cessed 17 September 2015].
Bjerke, T., Østdahl, Thrane, C. & Strumse, E. (2006) Vegetation density of urban parks and perceived appropriateness for recreation. Urban Forestry & Urban Greening. 5 (1). p. 35-44.
References
Bjerknes, A., Totland, Ø., Hegland, E.J. & Nielsen, A. (2007) Do alien invasions really affect pollination success in native plant species?. Biological Conservation. 138 (1-2). p. 1-12
Bonthoux, S., Brun, M., Di Pietro, F., Greulich, S. & Bouché-Pillon, S. (2014). How can wastelands promote biodiversity in cities? A review. Landscape and Urban Planning. 132. p. 79-88.
Bruun, J. (2000) Natur, national identitet og engagement i miljøspørgsmål. København: Danmarks Pædagogiske Institut. Burghardt, K. T., Tallamy, D.W., Philips, C. & Shropshire, K.J. (2010) Non-native plants reduce abundance, richness, and host specialization in lepidopteran com-munities. Ecosphere. 1 (5), p. 1-22 Burghardt, K.T. & Tallamy, D.W. (2013) Plant origin asymmetrically impactsfeeding guilds and life stages driving community structure of herbivorous arthro-pods. Diversity and Distributions. 19 (12). p. 1553–1565
Buttenschön, R.M. (2000) Græsning som pleje af bynære arealer. Park og Land-skabsserien, Forskningscentret for Skov og Landskab. 6.0-15.
By & Havn (2008) Nordhavnen - idekonkurrence. [online] Available from: http://www.nordhavnen.dk/gfx/Pdf/alle_artikler_270508_med.pdf [Accessed: 11 March 2015]. By & Havn (2015) Nordhavns historie. [online] Available from: http://www.nord-havnen.dk/oplev+nordhavnen/nh-historie.aspx [Accessed: 11 March 2015].
By & Havn (n.d.) Den internationale idékonkurrence, 2008. [online] Available from: http://www.nordhavnen.dk/fra+vision+til+bydel/processen+hidtil/nh-konkurrencen.aspx [Accessed: 29 September 2015].
Cardinale, B. (2012) Impacts of biodiversity loss. Science. 336 (6081). p 552-553
Carlton, M. (2011) Flowers for pollinators. [online] Available from: http://www.foxleas.com/flower_shapes.htm [Accessed 07 September 2015].
Collen, B., Böhm, M., Kemp, R. & Baille, J.E.M. (2012) Spineless: status and trends of the world’s invertebrates. London: Zoological Society of London.
DAC (2014) Mimersparken. [online] Available from: http://www.dac.dk/da/dac-life/copenhagen-x-galleri/cases/mimersparken/ [Accessed: 11 March 2015].
DMU (2015) Den danske rødliste. Enhjørning Notoxus monoceros (Linnaeus, 1761). [online] Available from: http://www2.dmu.dk/1_Om_DMU/2_Tvaer-funk/3_fdc_bio/projekter/redlist/data.asp?ID=8315&gruppeID=116 [Accessed: 23 September 2015].

DN, Danmarks Naturfredningsforening (2012) Forslag til fredning af Sydhavn-stippen. [online] Available from: http://www.kk.dk/sites/default/files/edoc/455e6421-036a-416d-a1fb-4b03dde7c27b/6b772795-df28-4406-aa36-da053892e63b/Attachments/7533a0d0-3b9b-441b-8915-d61bdb446d0c.PDF [Accessed: 31 August 2015].
DOF, Dansk Ornitologisk Forening (2015) Nordhavnstippen. [online] Avail-able from: http://www.dofbasen.dk/IBA/lokalitet.php?lokid=166 [Accessed: 11 March 2015].
DN, Danmarks Naturfredningsforening (2015) Nordhavnstippen. [online] Availa-ble from: http://www.dn.dk/Default.aspx?ID=23774 [Accessed: 11 March 2015].
Donovan, R.G., Sadler, J.P. & Bryson, J.R. (2005) Urban biodiversity and sustain-able development. Proceedings of the ICE - Engineering Sustainability. 158 (2). p. 105-114.
Duelli, P., Obrist, M.K. & Flückiger, P.F. (2002) Forest edges are biodiversity hot-spots - Also for Neuroptera. Acta Zoologica Academiae Scientiarum Hungaricae. 48 (suppl. 2). p. 75-87.
Encyclopædia Britannica (2015) Predaceous diving beetle [online] Available from: http://global.britannica.com/animal/predaceous-diving-beetle [Accessed: 17 September 2015].
Ejrnæs, R. & Reddersen (2012) Hvordan sikrer vi byernes biodiversitet? In: Mel-tofte, M. (ed). Danmarks natur frem mod 2020 - om at stoppe tabet af biologisk mangfoldighed. København: Det Grønne Kontaktudvalg.
Eriksen, J.M. (1996) Lossepladser og opfyldning i København - Historisk re-degørelse for Københavns opfyldninger og lossepladser fra omkring århun-dredeskiftet til 1995. Copenhagen: Miljøkontrollen.
Faeth, S.H., Bang, C. & Saari, S. (2011) Urban biodiversity: patterns and mecha-nisms. Year in Ecology and Conservation Biology. 1223 (1). p. 69-81
Fahrig, L. (2003) Effects of habitat fragmentation on biodiversity. Annual Review of Ecology, Evolution, and Systematics. 34 (1 1). p. 487-515.
Farinha-Marques, P., Lameiras, J.M., Fernandes, C., Silva, S. & Guilherme, F. (2011) Urban biodiversity: A review of current concepts and contributions to multidisciplinary approaches. Innovation: The European Journal of Social Science Research. 24 (3). p. 247-271
Fink, H. (2003) Et mangfoldigt naturbegreb. In: Agger, P., Reenberg, A., Læsøe, J. & Hansen, H.P. (eds). Naturens værdi: Vinkler på danskernes forhold til naturen. Copenhagen: Gads Forlag.
Franklin, J.F., Cromack, K.Jr., Denison, W., McKee, A., Maser, C., Sedell, J., Swan-son, F. & Juday, G. (1981) Ecological characteristics of old-growth Douglas-fir for-ests. Portland: U.S. Dept. of Agriculture, Forest Service, Pacific Northwest Forest and Range Experiment Station
Frederiksen, S., Rasmussen, F. & Seberg, O. (2006) Dansk flora. Copenhagen: Gyldendal.
Fredningsnævnet (1963) Deklaration vedrørende Fælledparken. [online] Avail-able from: http://www2.blst.dk/nfr/03072.00.pdf [Accessed: 11 March 2015] Fredningsnævnet (1966) Deklaration vedrørende Enghaven. [online] Available from: http://www2.blst.dk/nfr/03991.00.pdf [Accessed: 10 March 2015].
Fredningsnævnet (2014) Vedr.: Fredningsnævnet for Københavns afgørelse i sagen om fredning af Sydhavnstippen i Københavns Kommune. [online] Available from: http://www.kk.dk/sites/default/files/edoc/26de785b-448a-4d64-8526-a1865cdf7cf8/39bff32f-9c5f-43ad-9840-317e7916516d/Attach-ments/12290809-13158994-1.PDF [Accessed: 31 August 2015].
Gao, T., Qiu, L., Hammer, M. & Gunnarsson, A. (2012) The Importance of Tempo-ral and Spatial Vegetation Structure. Information in Biotope Mapping Schemes: A Case study in Helsingborg, Sweden. Environmental Management. 49 (2). p. 459-472
Gao, T., Hedblom, M., Emilsson, T. & Nielsen, A.B. (2014) The role of forest stand structure as biodiversity indicator. Forest Ecology and Management. 330, p. 82-93
GBC, Government of British Columbia (2002a) What is biological diversity? [on-line] Available from: https://www.for.gov.bc.ca/hfp/training/00001/module01/biodiversity.htm [Accessed 17 September 2015]
GBC, Government of British Columbia (2002b) Why is stand structure important to biodiversity? [online] Available from: https://www.for.gov.bc.ca/hfp/train-ing/00001/module03/structure-importance.htm [Accessed: 29 April 2015]
Gobster, P.H., Nassauer, J.I., Daniel, T.C. & Fry, G. (2007) The shared landscape: what does aesthetics have to do with ecology? Landscape Ecology. 22 (7). p. 959-972.
Habitats (2013) Biodiversitet i byer - forslag til synergier mellem biodiversitet og byudvikling. København: Naturstyrelsen

Hall, M.C. (2013) The ecological and environmental significance of urban waste-lands and drosscapes. In: Zapata, M.J. & Hall, M.C. (eds). Organising waste in the city. International perspectives on narratives and practices. Bristol: Policy Press. Halstead, A. (n.d.) Plants to encourage pollinating insects. [online] Available from: http://www.wilsteadvillage.org.uk/Village/Plants_to_encourage_pollena-tors.html [Accessed: 06 September 2015].
Hamer, A.J., Smith, P.J. & McDonnell, M.J. (2012) The importance of habitat de-sign and aquatic connectivity in amphibian use of stormwater retention ponds. Urban ecosystems. 15 (2). p. 451-471
Hansen, M.D.D. & Jørgensen, O. (2015) Insekter i Danmark. 2nd ed. København: Gyldendal.
Hansen, J. S. (1989) Natursyn og planlægning. Hørsholm: Statens Byggeforskn-ingsinstitut.
Haselböck, A. (2015) Naturspaziergang [online] Available from: http://www.naturspaziergang.de/Pflanzenwespen/Megalodontes_cephalotes.htm [Ac-cessed 17 September 2015].
Helden, A.J., Stamp, G.C. & Leather, S.R. (2012) Urban biodiversity: comparison of insect assemblages on native and non-native trees. Urban Ecosystems. 15 (3). p. 611-624
Hermy, M. & Cornelis, J. (2000) Towards a monitoring method and a number of multifaceted and hierarchical biodiversity indicators for urban and suburban parks. Landscape Planning. 49 (3). p. 149-162
Hermy, M. & Cornelis, J. (2004) Biodiversity relationships in urban and suburban parks in Flanders. Landscape and Urban Planning. 69 (4). p. 385-401.
Herzog, T.R. & Chernick, K.K. (2000) Tranquility and danger in urban and natural settings. Journal of Environmental Psychology. 20 (1). p. 29-39.
Hickerson, C.M., Anthony, C.D. & Walton, B.M. (2012) Interactions among forest-floor guild members in structurally simple microhabitats. The American Midland Naturalist. 168 (1). p. 30-42.
Hull, R.B. & Harvey, A. (1989) Explaining the emotion people experience in sub-urban parks. Environment and Behaviour. 21 (3). p. 323-345.
Hunter, M.D. (2002) Landscape structure, habitat fragmentation, and the ecol-ogy of insects. Agricultural and Forest Entomology. 4 (3). p. 159-166.
Jensen, J. & Jacobsen, N. (2003) Udvidet systematisk botanik bind 1-6. Copenha-gen: Kgl. Veterinær- og Landbohøjskole Jones, E.L. & Leather, S.R. (2012) Invertebrates in urban areas: A review. Euro-pean Journal of Entomology. 109 (4). p. 463-478.
Jorgensen, A., Hitchmough, J. & Calvert, T. (2002) Woodland spaces and edges: their impact on perception of safety and preference. Landscape and Urban Plan-ning. 60 (3). p. 135-150.
Jorgensen, A. & Tylecote, M. (2007) Ambivalent landscapes - wilderness in the urban interstices. Landscape Research. 32 (4). p. 443-462.
Kaae, B.C. & Madsen, L.M. (2003) Holdninger og ønsker til Danmarks natur. Hør-sholm: Skov og Landskab
Kaplan, S. (1987) Aesthetics, affect and cognition: environmental preference from an evolutionary perspective. Environment and Behaviour. 19 (1). p. 3-32.
Kaplan, R. & Kaplan, S. (1989) The experience of nature: a psychological perspec-tive. Cambridge US: Cambridge University Press.
Kattwinkel, M., Biedermann, R. & Kleyer, M. (2011) Temporary conservation for urban biodiversity. Biological Conservation. 144 (9). p. 2335-2343
Kellert, S.R. (1993) Values and perceptions of invertebrates. Conservation Biol-ogy. 7 (4). p. 845-855.
Kennedy, C.E.J. & Southwood, T.R.E. (1984) The number of species of insects associated with British trees: a re-analysis. Journal of Animal Ecology. 53 (2). p. 455-478
Kirk, W.D.J. & Howes, F.N. (2012) Plants for Bees – a guide to the plants that benefit the bees of the British Isles. UK: International Bee Research Association. KK, Københavns Kommune (2006) Fælledparken - udviklingsplan. [online] Avail-able from: http://kk.sites.itera.dk/apps/kk_pub2/pdf/456_faelledparku_plan.pdf [Accessed: 11 March 2015].
KK, Københavns kommune (2011) Plads til naturen - strategi for biologisk mangfoldighed. [online] Available from: http://www.klimatilpasning.dk/me-dia/607082/biokbh.pdf [Accessed: 14 September 215].
KK, Københavns Kommune (2011a) Værdifulde kulturmiljøer i København - Slusen/Bådklubben Valby. [online] Available from: http://kk.sites.itera.dk/apps/kk_pub2/pdf/1346_TciyRCr5qE.pdf [Accessed: 31 August 2015].

KK, Københavns Kommune (2012) Nu åbner Mimersparken. [online] Available from: http://realdania.dk/filantropiske-programmer/samlet-projektliste/mimer-sparken/nyheder/mimersparken_011012 [Accessed: 11 March 2015].
KK, Københavns kommune (2013) Gartnerisk driftsmanual. [online] Available from: http://kk.sites.itera.dk/apps/kk_pub2/pdf/1120_3yQ2T2zFTu.pdf [Ac-cessed 16 September 2015]
KK, Københavns Kommune (2014) Amagerbanen - regnvandsbassin og cykelrute. [online] Available from: http://www.kk.dk/sites/default/files/edoc/8a86f893-4969-4995-bd80-090f4c45528c/7e0ff271-00d9-477a-b302-cea54e0225c9/At-tachments/11651245-12115410-1.PDF [Accessed 12 September 2015]
Kowarik, I. (1995) On the role of alien species in urban flora and vegetation. In: Pyšek, P., Prach, K., Rejmánek, M. & Wade, M. (eds). Plant Invasions - General Aspects and Special Problems. Amsterdam: SPB Academic Publishing.
Kowarik, I. (2008) On the role of alien species in urban flora and vegetation. In Marzluff, J.M., Shulenberger, E., Endlicher, W., Alberti, M., Bradley, G., Ryan, C., Simon, U. & ZumBrunnen, C. (eds.). Urban Ecology. An International Perspective on the Interaction Between Humans and Nature. Springer US.
Lamb, R.J. & Purcell, A.T. (1990) Perception of naturalness in landscape and its relationship to vegetation structure. Landscape and Urban Planning. 19 (4). p. 333-352.
Leather, S.R. (1986) Insect Species Richness of the British Rosaceae: The Im-portance of Host Range, Plant Architecture, Age of Establishment, Taxonomic Isolation and Species-Area Relationships. Journal of Animal Ecology. 55 (3). p. 841-860.
Lund, A. (ed.) (2000) Guide til dansk havekunst - År 1000-2000. 2nd ed. Copen-hagen: Arkitektens Forlag.
Lundholm, J.T. & Richardson, P.J. (2010) Habitat analogues for reconciliation ecol-ogy in urban and industrial environments. Journal of Applied Ecology. 47 (5). p. 966-975.
Magura, T., Tóthmérész, B. & Molnár, T. (2001) Edge effect on carabid assem-blages along forest-grass transects. Web Ecology. 2 (1). p. 7-13.
Magurran, A.E. (2004) Measuring Biological Diversity. UK: Blackwell Publishing.
Mckinney, M. L. (2002) Urbanization, biodiversity, and conservation. BioScience. (52) 10. p. 883-890.
McKinney, M.L. (2006) Urbanization as a major cause of biotic homogenization. Biological Conservation. 127 (3). p. 247-260.
Mikrofonholder. Uge 30 (2015) Radio 24syv. 23 july.
Morris, M. G. (2000) The effects of structure and its dynamics on the ecology and conservation of arthropods in British grasslands. Biological Conservation. 95 (2). p. 129-142.
Mossberg, B. & Stenberg, L. (2014) Den nye nordiske flora. 2nd. edn. Copenha-gen: Gyldendal
Müller, N., Ignatieva, M., Nilon, C.H., Werner, P. & Zipperer, W.C. (2013) Patterns and trends in urban biodiversity and landscape design. In: Elmqvist, T. et al. (eds.). Urbanization, Biodiversity and Ecosystem Services: Challenges and Oppor-tunities: A Global Assessment. Netherlands: Springer.
Nakamura, A., Morimoto, Y., Mizutani, Y. (2005) Adaptive management approach to increasing the diversity of a 30-year-old planted forest in an urban area of Japan. Landscape and Urban Planning. 70 (3-4). p. 291-300.
Nassauer, J.I. (1988) The aesthetics of Horticulture: Neatness as a form of Care. HortScience. 23 (6). p. 973-977.
Nassauer, J. (1995) Messy ecosystems orderly frames. Landscape Journal. 14 (2). p. 161-170
Natursyn. Bymennesket mangler naturen (2015a) Danmarks Radio P1. 12 Janu-ary
Natursyn. De vilde bier og biodiversiteten (2015b) Danmarks Radio P1. 24 August
Nielsen, A.B., van den Bosch, M., Maruthaveeran, S., van den Bosch, C.K. (2013) Species richness in urban parks and its drivers: A review of empirical evidence. Urban Ecosystems. 17 (1). p. 305-327
Noordijk, J., Schaffers, A. P., Heijerman, T., Boer, P., Gleichman, M. & Sýkora, K. V. (2010) Effects of vegetation management by mowing on ground-dwelling arthro-pods. Ecological Engineering. 36 (5). p. 740-750
Noreika, N. (2011) Forest edge contrasts have a predictable effects on the spa-tial distribution of carabid beetles in urban forests. M.Sc. thesis. Aarhus: Aarhus Universitet
Noss, R. F. (1990) Indicators for monitoring biodiversity: A hierarchical approach. Conservation Biology. 4 (4). p. 355-364

Noss, R.F. (1997) Hierarchical indicators for monitoring changes in biodiversity. In: Meffe, G.F. & Caroll, C.R. (Eds.). Principles of conservation biology. 2nd ed. Sunderland, MA: Sinauer. Odgaard, M. (2014) Biodiversitetens byer - om naturbygning i dansk byplanlægn-ing. Ph.D. thesis. Aarhus: Arkitektskolen Aarhus
Özgüner, H. & Kendle, A.D. (2006) Public attitudes towards naturalistic versus designed landscapes in the city of Sheffield (UK). Landscape and Urban Planning. 74 (2). p. 139-157.
Pape, J. (1984) Naturpræget vegetation i byens friarealer. Licentiate thesis. Kgl. Veterinær- og Landbohøjskole Petersen, L.K. & Nielsen, S.S. (2011) Bynaturen i hverdagslivet. Faglig rapport fra DMU nr. 814. Aarhus: Aarhus University.
Petersen, E.V. (2015) Amagerbanen – indledning. [online] Available from: http://evp.dk/index.php?page=amagerbanen [Accessed: 11 March 2015].
Pinna, S., Varady-Szabo, H., Boivin, P. & Lucas, E. (2009) Relevance of using a vegetation-based method to conserve urban carabid diversity. Journal of Insect Conservation. 13 (4). p. 387-397.
Potts, S.G., Vulliamy, B., Roberts, S.P.M., O’Toole, C., Dafni, A. & Ne’eman, G. (2005) Role of nesting resources in organising diverse bee communities in a Mediterranean landscape. Ecological Entomology. 30 (1). p. 78-85.
Pyšek, P., Richardson, D.M., Rejmanek, M., Webster, G.L., Williamson, M. & Kirschner, J. (2004) Alien plants in checklists and floras: towards better commu-nication between taxonomists and ecologists. Taxon. 53 (1). p. 131-143
Qiu, L., Gao, T., Gunnarsson, A., Hammer, M. & von Bothmer, R. (2010) A meth-odological study of biotope mapping in nature conservation. Urban Forestry and Urban Greening. 9 (2). p. 161-166.
Qiu, L., Lindberg, S. & Nielsen, A.B. (2013) Is biodiversity attractive? - On site per-ception of recreational and biodiversity values in urban green space. Landscape and Urban Planning. 119. p. 136-146.
Randrup, T.B., Schjipperijn, J., Hansen, B.I., Jensen, F.S. & Stigsdotter, U.K. (2008) Natur og sundhed - Sammenhæng mellem grønne områders udtryk og brug set i forhold til befolkningens sundhed. Hørsholm: Skov og Landskab.
Raven (1992) The nature and value of biodiversity. In: Courier, K. (ed.). Global biodiversity strategy: guidelines for action to save, study, and use Earth’s biotic wealth sustainably and equitability. WRI, IUCN & UNEP.
Rebele, F. (1994) Urban Ecology and Special Features of Urban Ecosystems. Glob-al Ecology and Biogeography Letters. 4 (6). p. 173-187.
Rink, D. & Herbst, H. (2012) From wasteland to wilderness - aspects of a new form of urban nature. In Richter, M. & Weiland, U. (eds.). Applied Urban Ecology: A Global Framework. Chichester, UK: John Wiley & Sons.
RHS (2013) Shrub garden. [online] Available from: http://www.wildaboutgar-dens.org.uk/habitats/shrub-borders.aspx [Accessed: 06 September 2015].
Robinson, S.L. & Lundholm, J.T. (2012) Ecosystem services provided by urban spontaneous vegetation. Urban Ecosystems. 15 (3). p. 545-557.
Rupprecht, C.D.D. & Byrne, J.A. (2014) Informal urban green spaces: A typology and trilingual systematic review of its role for urban residents and trends in lit-erature. Urban Forestry & Urban Greening. 13 (4). p. 597-611.
Salisbury, A., Armitage, J., Bostock, H., Perry, J., Tatchell, M. & Thompson, K. (2015) Enhancing gardens as habitats for flower-visiting aerial insects (pollina-tors): should we plant native or exotic species?. Journal of Applied Ecology. 52 (5). p. 1156-1164.
Schou, J. C., Wind, P. & Lægaard, S. (2009) Danmarks græsser. 2nd. ed. Klitmøller: Biologisk Forening for Nordjylland. Sherril, U. & Brittingham, M. C. (2001) Landscaping for wildlife: trees, shrubs, and vines. [online] Available from: http://extension.psu.edu/natural-resources/wild-life/landscaping-for-wildlife/pa-wildlife-7/extension_publication_file [Accessed: 02 September 2015].
Shochat, Y., Lerman, S.B., Anderies, J.M., Warrem, P.S., Faeth, S.H. & Nilon, C.H. (2010). Invasion, Competition, and Biodiversity Loss in Urban Ecosystems. BioSci-ence. 60 (3). p 199-208.
Schroeder, H.W. & Orland, B. (1994) Viewer preference for spatial arrangement of park trees: an application of video-imaging technology. Environmental Man-agement. 18 (1). p. 119-128.
Smith, R.M., Thompson, K., Hodgson, J.G., Warren, P.H. & Gaston, K.J. (2006) Ur-ban domestic gardens (IX): Comparison and richness of the vascular plant flora, and implications for native biodiversity. Biological Conservation. 129 (3). p. 312-322
Spafford, R.D. & Lortie, C.J. (2013) Sweeping beauty: is grassland arthropod com-munity composition effectively estimated by sweep netting?. Ecology and Evolu-tion. 3 (10). p. 3347-3358

Stahlschmidt, P. (1984) Det formede, det dyrkede og det selvgroede udtryk. Landskab. 65 (4). p. 73-79.
Stokes, D.L. (2007) Things we like: Human preferences among similar organisms and implications for conservation. Human Ecology. 35 (3). p.361-369.
Strauss, B. & Biedermann, R. (2006) Urban brownfields as temporary habitats: driving forces for the diversity of phytophagous insects. Ecography. 29 (6). p. 928-940
Swanson, M.E., Franklin, J.F., Beschta, R.L., Crisafulli, C.M., DellaSala, D.A., Hutto, R.L., Lindenmayer, D.B. & Swanson, F.J. (2010) The forgotten stage of forest suc-cession: early-successional ecosystems on forest sites. Frontiers in Ecology and the Environment. 9 (2). p. 117-125
Sörensen, M. (2008) AHA - a simple method for evaluating conservation priori-ties of trees in South Swedish parks and urban areas from an entomo-saproxylic viewpoint. Entomologisk Tidskrift. 129 (2). p. 81-90
Tews, J., Brose, U., Grimm, V., Tielbörger, K., Wichmann, M.C., Schwager, M. & Jeltsch, F. (2004) Animal species diversity driven by habitat heterogeneity/diver-sity: the importance of keystone structures. Journal of Biogeography. 31 (1). p. 79-92
Thompson, S.C.G. & Barton, M.A (1994) Ecocentric and anthropocentric atti-tudes toward the environment. Journal of Environmental Psychology. 14 (2). p. 149-157.
Thomsen, I.M. (2014) Hazard trees and enhancing fungal diversity. [Lecture]. Biodiversity in urban nature. University of Copenhagen, Department of Geo-sciences and natural resource management, 25 September 2014
Torrance, J. (2010) Nature’s feast on early autumn fruits. [online] Available from: http://www.bbc.co.uk/blogs/natureuk/2010/09/early-autumn-fruits.shtml [Ac-cessed: 03 September 2015]
Tredici, P. D. (2010) Spontaneous Urban Vegetation: Reflections of Change in a Globalized World. Nature and Culture. 5 (3). p. 299-315.
Tredje Natur (2014) Enghaveparken her og nu. [online] Available from: http://tredjenatur.dk/portfolio/enghaveparken-her-og-nu/ [Accessed: 10 March 2015]
Trolle, L. (2010) Sommerfuglene i Danmark. 3rd ed. København: Nordisk Forlag.
Ulyshen, M. D. (2011) Arthropod vertical stratification in temperate deciduous forests: Implications for conservation-oriented management. Forest Ecology and Management. 261 (9). p. 1479-1489
UN (1992) Article 2. Use of terms. [online] Available from: https://www.cbd.int/convention/articles/default.shtml?a=cbd-02 [Accessed 22 September 2015]
Unt, A. & Bell, S. (2014) The impact of small-scale design interventions on the behaviour patterns of the users of an urban wasteland. Urban Forestry & Urban Greening. 13 (1). p. 121–135.
Warncke, E. (2008) Feltbiologi. København: Nordisk forlag.
Willand, J. E., Wodika, B. J., Palmer, J., Jenkins, S. E. & McCravy, K. W. (2011) Diversity of ground beetles (Coleoptera: Carabidae) in relation to habitat type in west-central Illinois. The American Midland Naturalist. 166 (2). p. 266-282. Williams, D.D. (1987) The ecology of temporary waters. London: Croom Helm
Wilson, E.O. (1987) The little things that run the world. The importance and con-servation of invertebrates. Conservation Biology. 1 (4). p. 344-346.
Wittig, R. & Becker, U. (2010) The spontaneous flora around street trees in cit-ies - A striking example for the worldwide homogenization of the flora of urban habitats. Flora. 205 (10). p. 704–709
PICTURES
Pic. 7Arkkio, H. (2004) Medicago lupulina. Images from Harri Arkkio. [Online image] Available from: http://193.166.3.2/pub/sci/bio/life/plants/magnoliophyta/mag-noliophytina/magnoliopsida/fabaceae/medicago/lupulina-1.jpg [Accessed: 28 september 2015]
Pic. 8Pichard, O. (2008) Potentilla reptans. Wikimedia Commons. [Online image] Avail-able from: https://commons.wikimedia.org/wiki/File:Potentilla_reptans_beau-vais-carriere-bracheux_60_20062008_1.jpg [Accessed: 28 september 2015]
Pic. 9havetips.dk (2014) Japansk Magnolia. havetips.dk [Online image] Available from: http://havetips.dk/japansk-magnolia/ [Accessed: 28 september 2015]
Pic. 10Osterloh, A. (2011) Prunus cerasifera - Kirschpflaume, Myrobalane. Wikimedia Commons. [Online image] Available from: http://commons.hortipedia.com/wiki/File:Prunus_cerasifera_flowers_photo_file_PDB_91KB.jpg [Accessed: 28 september 2015]
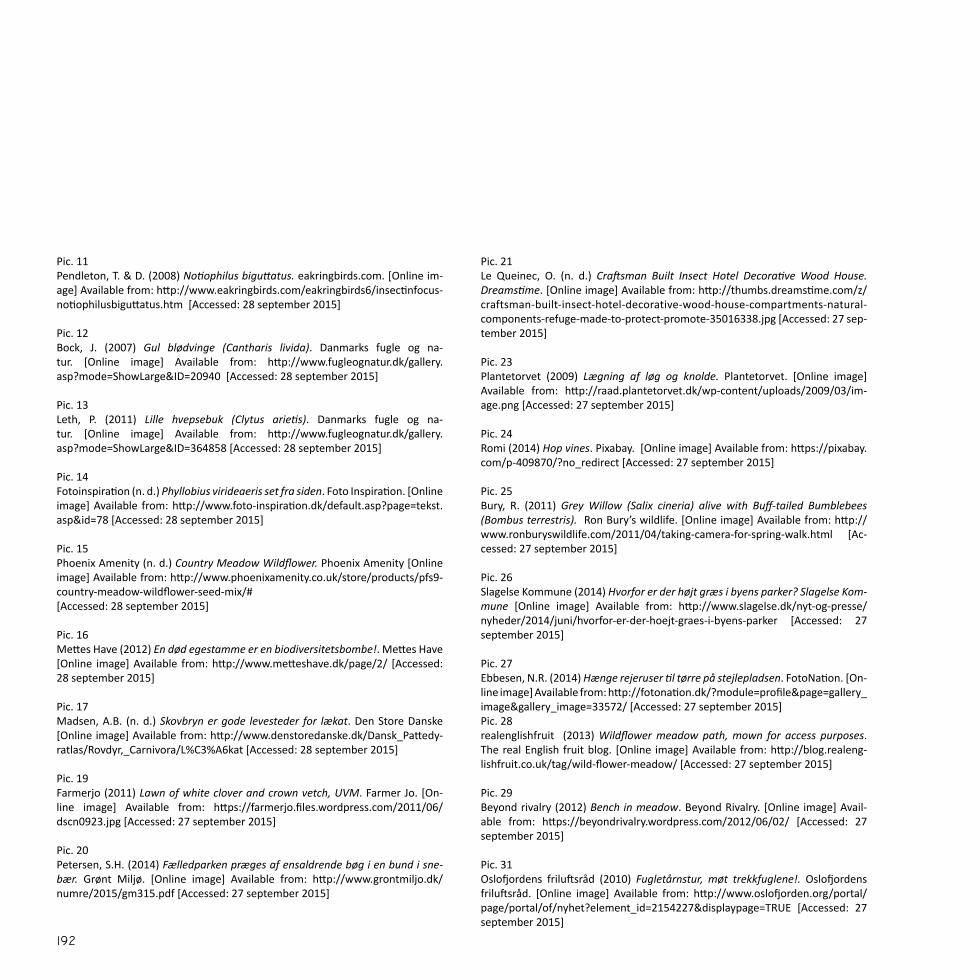
Pic. 11Pendleton, T. & D. (2008) Notiophilus biguttatus. eakringbirds.com. [Online im-age] Available from: http://www.eakringbirds.com/eakringbirds6/insectinfocus-notiophilusbiguttatus.htm [Accessed: 28 september 2015]
Pic. 12Bock, J. (2007) Gul blødvinge (Cantharis livida). Danmarks fugle og na-tur. [Online image] Available from: http://www.fugleognatur.dk/gallery.asp?mode=ShowLarge&ID=20940 [Accessed: 28 september 2015]
Pic. 13Leth, P. (2011) Lille hvepsebuk (Clytus arietis). Danmarks fugle og na-tur. [Online image] Available from: http://www.fugleognatur.dk/gallery.asp?mode=ShowLarge&ID=364858 [Accessed: 28 september 2015]
Pic. 14Fotoinspiration (n. d.) Phyllobius virideaeris set fra siden. Foto Inspiration. [Online image] Available from: http://www.foto-inspiration.dk/default.asp?page=tekst.asp&id=78 [Accessed: 28 september 2015]
Pic. 15Phoenix Amenity (n. d.) Country Meadow Wildflower. Phoenix Amenity [Online image] Available from: http://www.phoenixamenity.co.uk/store/products/pfs9-country-meadow-wildflower-seed-mix/#[Accessed: 28 september 2015]
Pic. 16Mettes Have (2012) En død egestamme er en biodiversitetsbombe!. Mettes Have [Online image] Available from: http://www.metteshave.dk/page/2/ [Accessed: 28 september 2015]
Pic. 17Madsen, A.B. (n. d.) Skovbryn er gode levesteder for lækat. Den Store Danske [Online image] Available from: http://www.denstoredanske.dk/Dansk_Pattedy-ratlas/Rovdyr,_Carnivora/L%C3%A6kat [Accessed: 28 september 2015]
Pic. 19Farmerjo (2011) Lawn of white clover and crown vetch, UVM. Farmer Jo. [On-line image] Available from: https://farmerjo.files.wordpress.com/2011/06/dscn0923.jpg [Accessed: 27 september 2015]
Pic. 20Petersen, S.H. (2014) Fælledparken præges af ensaldrende bøg i en bund i sne-bær. Grønt Miljø. [Online image] Available from: http://www.grontmiljo.dk/numre/2015/gm315.pdf [Accessed: 27 september 2015]
Pic. 21Le Queinec, O. (n. d.) Craftsman Built Insect Hotel Decorative Wood House. Dreamstime. [Online image] Available from: http://thumbs.dreamstime.com/z/craftsman-built-insect-hotel-decorative-wood-house-compartments-natural-components-refuge-made-to-protect-promote-35016338.jpg [Accessed: 27 sep-tember 2015]
Pic. 23Plantetorvet (2009) Lægning af løg og knolde. Plantetorvet. [Online image] Available from: http://raad.plantetorvet.dk/wp-content/uploads/2009/03/im-age.png [Accessed: 27 september 2015]
Pic. 24Romi (2014) Hop vines. Pixabay. [Online image] Available from: https://pixabay.com/p-409870/?no_redirect [Accessed: 27 september 2015]
Pic. 25Bury, R. (2011) Grey Willow (Salix cineria) alive with Buff-tailed Bumblebees (Bombus terrestris). Ron Bury’s wildlife. [Online image] Available from: http://www.ronburyswildlife.com/2011/04/taking-camera-for-spring-walk.html [Ac-cessed: 27 september 2015]
Pic. 26Slagelse Kommune (2014) Hvorfor er der højt græs i byens parker? Slagelse Kom-mune [Online image] Available from: http://www.slagelse.dk/nyt-og-presse/nyheder/2014/juni/hvorfor-er-der-hoejt-graes-i-byens-parker [Accessed: 27 september 2015]
Pic. 27Ebbesen, N.R. (2014) Hænge rejeruser til tørre på stejlepladsen. FotoNation. [On-line image] Available from: http://fotonation.dk/?module=profile&page=gallery_image&gallery_image=33572/ [Accessed: 27 september 2015]Pic. 28realenglishfruit (2013) Wildflower meadow path, mown for access purposes. The real English fruit blog. [Online image] Available from: http://blog.realeng-lishfruit.co.uk/tag/wild-flower-meadow/ [Accessed: 27 september 2015]
Pic. 29Beyond rivalry (2012) Bench in meadow. Beyond Rivalry. [Online image] Avail-able from: https://beyondrivalry.wordpress.com/2012/06/02/ [Accessed: 27 september 2015]
Pic. 31Oslofjordens friluftsråd (2010) Fugletårnstur, møt trekkfuglene!. Oslofjordens friluftsråd. [Online image] Available from: http://www.oslofjorden.org/portal/page/portal/of/nyhet?element_id=2154227&displaypage=TRUE [Accessed: 27 september 2015]

Pic. 32Natural England (2013) NCA 60 Mersey Valley - Rixton Clay Pits. Flickr. [On-line image] Available from: https://www.flickr.com/photos/naturaleng-land/13779790984 [Accessed: 27 september 2015]
Pic. 33Skipper, L. (n. d.) Frodige skovbryn samt lysninger. Danmarks Blomstertæger. [Online image] Available from: http://www.miridae.dk/biotoper.htm [Accessed: 27 september 2015]
Pic. 34Brandt, H. (n. d.) NSG Schöneberger Südgelände. Senatsverwaltung fürStadtentwicklung und Umwelt [Online image] Available from: http://www.stad-tentwicklung.berlin.de/natur_gruen/naturschutz/schutzgebiete/de/nsg/nsg31.shtml [Accessed: 27 september 2015]


Appendix

CONTENTS
APPENDIX 1
HABITAT UNIT INDEX p. 198
APPENDIX 2
BIOTOPE MAPPING 2.1 Fælledparken p. 202 2.2 Enghaveparken p. 208
2.3 Mimersparken p. 214 2.4 Stejlepladsen p. 220
2.5 Nordhavnstippen p. 226
2.6 Amagerbanen p. 232
APPENDIX 3
REGISTRATION OF INVERTEBRATES
3.1 Fælledparken p. 238
3.2 Enghaveparken p. 244
3.3 Mimersparken p. 250 3.4 Stejlepladsen p. 254
3.5 Nordhavnstippen p. 260 3.6 Amagerbanen p. 264

APPENDIX 4
REGISTRATION OF VASCULAR PLANTS
4.1 Fælledparken Herbaceous vegetation p. 270 Woody vegetation p. 272
4.2 Enghaveparken Herbaceous vegetation p. 274 Woody vegetation p. 276
4.3 Mimersparken Herbaceous vegetation p. 278 Woody vegetation p. 280
4.4 Stejlepladsen Herbaceous vegetation p. 282 Woody vegetation p. 284
4.5 Nordhavnstippen Herbaceous vegetation p. 286 Woody vegetation p. 289
4.6 Amagerbanen Herbaceous vegetation p. 290 Woody vegetation p. 292

1. PUNCTUAL ELEMENTS
1.1. Abiotic element1.1.1. Gravel or sand surface (1)1.1.2. Cobblestone surface (2)1.1.3. Boulders (3)
1.2. Biotic element1.2.1. Deadwood: standing or lying trunks with a
diameter >50 cm (4)1.2.2. Pile of branches (5)1.2.3. Wood chips (6)1.2.4. Lawn: frequently mown grassland (7)1.2.5. Lawn with bulbs (8)1.2.6. Meadow: tall grass and herb vegetation
with sporadic woody upgrowth (9)1.2.7. Bare soil: surface of >75% bare soil (10)
1.3 Mounds1.3.1. Vegetated mound: height 20-100 cm (11)1.3.2. Gravel mound: height 20-100 cm (12)1.3.3. Soil mound: height 20-100 cm (13)
1.4 Water feature1.4.1. Permanent
1.4.1.1 Water feature with a non-organic base (14)
1.4.1.2 Water feature with an organic base (15)
1.4.2. Temporary water feature (16)
1.5. Bank vegetation (17)
1.6. Garden1.6.1. Kitchen garden: garden composed of plants
producing vegetables and fruit (18)1.6.2. Herb garden: garden composed of herbs (19)1.6.3. Ornamental garden: garden composed of
ornamental plants1.6.3.1. Garden composed of bushes (20)1.6.3.2. Garden composed of perennials (21)
1.7. Single tree or shrub: single tree or shrub not surrounded by other trees or shrubs (22)
1.8. Cluster of trees and/or shrubs (23)
1.9. Human construction1.9.1. Well, fountain, kiosk, bridge, mast, statue,
bunker etc. (24)1.9.2. Birdhouse, insect hotel, and bat box (25)
2. LINEAR ELEMENTS
2.1. Abiotic element2.1.1. Wall (26)2.1.2. Boulders (27)
2.2. Terrain2.2.1. Soil surface
2.2.1.1. Slope 10-30% (28)2.2.1.1.1. Slope facing south (29)
2.2.1.2. Slope 30-60% (30)2.2.1.2.1. Slope facing south (31)
2.2.1.3. Slope >60% (32)2.2.1.2.1. Slope facing south (33)
2.2.2. Vegetated surface2.2.2.1. Slope 10-30% (34)
2.2.2.1.1. Slope facing south (35)2.2.2.2. Slope 30-60% (36)
2.2.2.2.1. Slope facing south (37)2.2.2.3. Slope >60% (38)
2.2.2.3.1. Slope facing south (39)
2.3. Path infrastructure2.3.1. Path: infrastructure with a width of <2 m
2.3.1.1. Half-hardened: road with a hardeningthat is not completely sealed (40)
2.3.1.2. Not hardened: road without any hardening (41)
2.3.2. Road: infrastructure with a width of >2 m2.3.2.1. Half-hardened: road with a hardening
that is not completely sealed (42)2.3.2.2. Not hardened: road without any
hardening (43)
2.4. Watercourse2.4.1. Ditch: watercourse with a width of max. 1 m
that may contain water (44)2.4.2. Brook: watercourse with a width of max. 3 m
that always contain water (45)2.4.3. River: watercourse with a width of >3 m (46)
HABITAT UNIT INDEXAppendix 1

2.5. Bank: strip of land on each side of water feature or watercourse
2.5.1. Watercourse2.5.1.1. Natural: bank not consolidated by
humans (47)2.5.1.2. Semi-natural: bank consolidated by
humans with organic materials (48)2.5.2. Water feature
2.5.2.1. Natural: bank not consolidated by humans (49)
2.5.2.2. Semi-natural: bank consolidated by humans with organic materials (50)
2.6. Bank vegetation (51)
2.7. Grass strip2.7.1. Lawn: frequently mown grassland (52)2.7.2. Lawn with bulbs (53)2.7.3. Meadow: tall grass and herb vegetation with
sporadic woody upgrowth (54)
2.8. Garden2.8.1. Kitchen garden: garden composed of plants
producing vegetables and fruit (55)2.8.2. Herb garden: garden composed of herbs (56)2.8.3. Ornamental garden: garden composed of
ornamental plants2.8.3.1. Garden composed of bushes (57)2.8.3.2. Garden composed of perennials (58)
2.9. Hedge2.9.1. Sheared hedge (59)2.9.2. Non-sheared hedge (60)
2.10. Hedgerow: a row of closely spaced trees and shrubs used to mark a boundary (61)
2.11. Tree row: single row of trees >80% canopy cover (62)
2.12. Alley: double or four-double row of trees >80% canopy cover (63)
2.13. Tree stand2.13.1. Grove: a group of trees on a grass surface (64)
2.13.2. Coppice2.13.2.1. Coppice: stand of regularly cut
thickets (65)2.13.2.2. Coppice with standards: stand of
regularly cut thickets and upper trees (66)
2.13.3. Tree stand - Deciduous2.13.3.1. >10% canopy cover of trees
2.13.3.1.1. One-layered (67)2.13.3.1.2. Two-layered (68)2.13.3.1.3. Multi-layered (69)
2.13.3.2. 10-30% canopy cover of trees2.13.3.2.1. One-layered (70)2.13.3.2.2. Two-layered (71)2.13.3.2.3. Multi-layered (72)
2.13.3.3. 30-80% canopy cover of trees2.13.3.3.1. One-layered (73)2.13.3.3.2. Two-layered (74)2.13.3.3.3. Multi-layered (75)
2.13.3.4. >80% canopy cover of trees2.13.3.4.1. One-layered (76)2.13.3.4.2. Two-layered (77)2.13.3.4.3. Multi-layered (78)
2.13.4. Tree stand - Coniferous2.13.4.1. >10% canopy cover of trees
2.13.4.1.1. One-layered (79)2.13.4.1.2. Two-layered (80)2.13.4.1.3. Multi-layered (81)
2.13.4.2. 10-30% canopy cover of trees2.13.4.2.1. One-layered (82)2.13.4.2.2. Two-layered (83)2.13.4.2.3. Multi-layered (84)
2.13.4.3. 30-80% canopy cover of trees2.13.4.3.1. One-layered (85)2.13.4.3.2. Two-layered (86)2.13.4.3.3. Multi-layered (87)
2.13.4.4. >80% canopy cover of trees2.13.4.4.1. One-layered (88)2.13.4.4.2. Two-layered (89)2.13.4.4.3. Multi-layered (90)
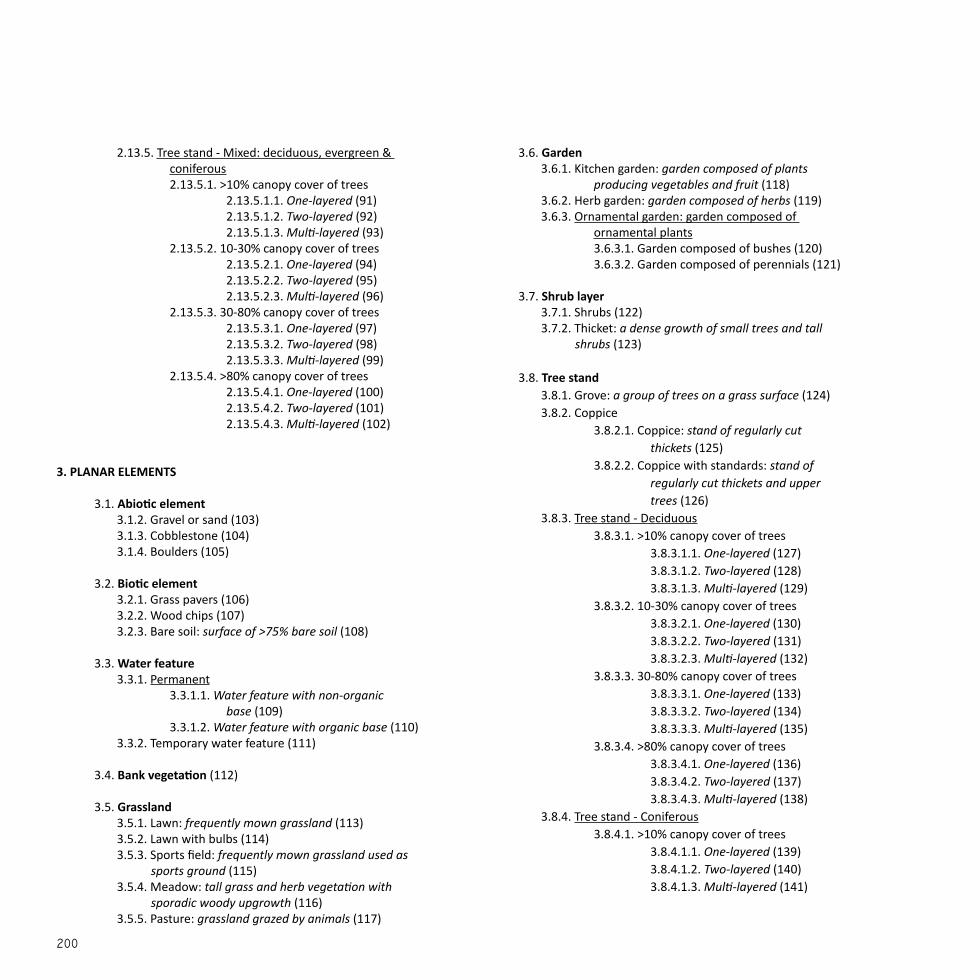
2.13.5. Tree stand - Mixed: deciduous, evergreen & coniferous2.13.5.1. >10% canopy cover of trees
2.13.5.1.1. One-layered (91)2.13.5.1.2. Two-layered (92)2.13.5.1.3. Multi-layered (93)
2.13.5.2. 10-30% canopy cover of trees2.13.5.2.1. One-layered (94)2.13.5.2.2. Two-layered (95)2.13.5.2.3. Multi-layered (96)
2.13.5.3. 30-80% canopy cover of trees2.13.5.3.1. One-layered (97)2.13.5.3.2. Two-layered (98)2.13.5.3.3. Multi-layered (99)
2.13.5.4. >80% canopy cover of trees2.13.5.4.1. One-layered (100)2.13.5.4.2. Two-layered (101)2.13.5.4.3. Multi-layered (102)
3. PLANAR ELEMENTS
3.1. Abiotic element3.1.2. Gravel or sand (103)3.1.3. Cobblestone (104)3.1.4. Boulders (105)
3.2. Biotic element3.2.1. Grass pavers (106)3.2.2. Wood chips (107)3.2.3. Bare soil: surface of >75% bare soil (108)
3.3. Water feature3.3.1. Permanent
3.3.1.1. Water feature with non-organic base (109)
3.3.1.2. Water feature with organic base (110)3.3.2. Temporary water feature (111)
3.4. Bank vegetation (112)
3.5. Grassland3.5.1. Lawn: frequently mown grassland (113)3.5.2. Lawn with bulbs (114)3.5.3. Sports field: frequently mown grassland used as
sports ground (115)3.5.4. Meadow: tall grass and herb vegetation with
sporadic woody upgrowth (116)3.5.5. Pasture: grassland grazed by animals (117)
3.6. Garden3.6.1. Kitchen garden: garden composed of plants
producing vegetables and fruit (118)3.6.2. Herb garden: garden composed of herbs (119)3.6.3. Ornamental garden: garden composed of
ornamental plants3.6.3.1. Garden composed of bushes (120)3.6.3.2. Garden composed of perennials (121)
3.7. Shrub layer3.7.1. Shrubs (122)3.7.2. Thicket: a dense growth of small trees and tall
shrubs (123)
3.8. Tree stand3.8.1. Grove: a group of trees on a grass surface (124)3.8.2. Coppice
3.8.2.1. Coppice: stand of regularly cut thickets (125)
3.8.2.2. Coppice with standards: stand of regularly cut thickets and upper trees (126)
3.8.3. Tree stand - Deciduous3.8.3.1. >10% canopy cover of trees
3.8.3.1.1. One-layered (127)3.8.3.1.2. Two-layered (128)3.8.3.1.3. Multi-layered (129)
3.8.3.2. 10-30% canopy cover of trees3.8.3.2.1. One-layered (130)3.8.3.2.2. Two-layered (131)3.8.3.2.3. Multi-layered (132)
3.8.3.3. 30-80% canopy cover of trees3.8.3.3.1. One-layered (133)3.8.3.3.2. Two-layered (134)3.8.3.3.3. Multi-layered (135)
3.8.3.4. >80% canopy cover of trees3.8.3.4.1. One-layered (136)3.8.3.4.2. Two-layered (137)3.8.3.4.3. Multi-layered (138)
3.8.4. Tree stand - Coniferous3.8.4.1. >10% canopy cover of trees
3.8.4.1.1. One-layered (139)3.8.4.1.2. Two-layered (140)3.8.4.1.3. Multi-layered (141)

3.8.4.2. 10-30% canopy cover of trees3.8.4.2.1. One-layered (142)3.8.4.2.2. Two-layered (143)3.8.4.2.3. Multi-layered (144)
3.8.4.3. 30-80% canopy cover of trees3.8.4.3.1. One-layered (145)3.8.4.3.2. Two-layered (146)3.8.4.3.3. Multi-layered (147)
3.8.4.4. >80% canopy cover of trees3.8.4.4.1. One-layered (148)3.8.4.4.2. Two-layered (149)3.8.4.4.3. Multi-layered (150)
3.8.5. Tree stand - Mixed: deciduous, evergreen & coniferous3.8.5.1. >10% canopy cover of trees
3.8.5.1.1. One-layered (151)3.8.5.1.2. Two-layered (152)3.8.5.1.3. Multi-layered (153)
3.8.5.2. 10-30% canopy cover of trees3.8.5.2.1. One-layered (154)3.8.5.2.2. Two-layered (155)3.8.5.2.3. Multi-layered (156)
3.8.5.3. 30-80% canopy cover of trees3.8.5.3.1. One-layered (157)3.8.5.3.2. Two-layered (158)3.8.5.3.3. Multi-layered (159)
3.8.5.4. >80% canopy cover of trees3.8.5.4.1. One-layered (160)3.8.5.4.2. Two-layered (161)3.8.5.4.3. Multi-layered (162)
3.9. Buildings (163)
3.10. Playground: an area set aside for recreation and play containing play equipment and natural elements such as sand, soil, wood, water, and vegetation (164)

Appendix 2BIOTOPE MAPPING2.1 FÆLLEDPARKEN
PLANAR ELEMENTS
Habitat number Description
Total number of
units
Total area (m2)
103 Gravel or sand 1 436
108 Bare soil 1 347
110Permanent water feature with an organic base
1 19325
112 Bank vegetation 2 391
113 Lawn 33 136447
115 Sports field 2 59720
120 Ornamental garden: bushes 1 238
123 Thicket 5 4129
124 Grove 34 24863
129Multi-layered deciduous tree stand >10%
3 1705
131Two-layered deciduous tree stand 10-30%
2 1414
132Multi-layered deciduous tree stand 10-30%
9 8028
134Two-layered deciduous tree stand 30-80%
3 1690
135Multi-layered deciduous tree stand 30-80%
12 17751
136One-layered deciduous tree stand >80%
1 3555
153Multi-layered mixed tree stand >10%
1 148
PLANAR ELEMENTS - CONTINUED
Habitat number Description
Total number of
units
Total area (m2)
156Multi-layered mixed tree stand 10-30%
5 2965
158Two-layered mixed tree stand 30-80%
1 273
159Multi-layered mixed tree stand 30-80%
6 6066
161Two-layered mixed tree stand >80%
2 459
162Multi-layered mixed tree stand >80%
3 3075
163 Buildings 1 203
164 Playground 3 12173
Total 305401
Shannon diversity index = 1.86

103 - Gravel or sand
124 - Grove
113 - Lawn
134 - Two-layered deciduous tree stand 30-80%
156 - Multi-layered mixed tree stand 10-30%
162 - Multi-layered mixed tree stand >80%
110 - Permanent water feature with an organic base
131 - Two-layered deciduous tree stand 10-30%
120 - Ornamental garden: bushes
136 - One-layered deciduous tree stand >80%
159 - Multi-layered mixed tree stand 30-80%
164 -Playground
108 - Bare soil
129 - Multi-layered deciduous tree stand >10%
115 - Sports field
135 - Multi-layered deciduous tree stand 30-80%
158 - Two-layered mixed tree stand 30-80%
163 - Buildings
112 - Bank vegetation
132 - Multi-layered deciduous tree stand 10-30%
153 - Multi-layered mixed tree stand >10%
161 - Two-layered mixed tree stand >80%
123 - Thicket
100 mN

LINEAR ELEMENTS
Habitat number Description
Total number of
units
Total length
(m)
26 Wall 1 37
27 Boulders 2 111
34 Vegetated slope 10-30% 16 784
35Vegetated slope 10-30% facing south
2 33
36 Vegetated slope 30-60% 7 193
37Vegetated slope 30-60% facing south
1 8
38 Vegetated slope >60% 3 91
40 Path <2m half-hardened 1 26
41 Path <2m not hardened 23 756
43 Path >2m not hardened 28 4216
44 Ditch 1 12
49 Natural bank 12 435
50 Semi-natural bank 11 390
51 Bank vegetation 2 60
52 Lawn 29 1273
58 Ornamental garden: perennials 7 166
59 Sheared hedge 11 296
60 Non-sheared hedge 2 259
63 Alley 3 228
Total 9374
Shannon diversity index = 1.97
Appendix 2BIOTOPE MAPPING2.1 FÆLLEDPARKEN

26 - Wall
41 - Path <2m not hardended
36 - Vegetated slope 30-60%
50 - Semi-natural bank
59 - Sheared hedge
34 - Vegetated slope 10-30%
44 - Ditch
38 - Vegetated slope >60%
52 - Lawn
63 - Alley
27 - Boulders
43 - Path >2m not hardended
37 - Vegetated slope 30-60% facing south
51 - Bank vegetation
60 - Non-sheared hedge
35 - Vegetated slope 10-30% facing south
49 - Natural bank
58 - Ornamental garden: perennials
40 - Path <2m half-hardened
100 mN

PUNCTUAL ELEMENTS
Habitat number Description Total number of units
2 Cobblestone surface 53
3 Boulders 50
4 Deadwood 20
6 Wood chips 1
7 Lawn 9
10 Bare soil 1
11 Vegetated mound 45
13 Soil mound 9
17 Bank vegetation 2
20 Ornamental garden: bushes 10
21 Ornamental garden: perennials 7
22 Single tree or shrub 30
23 Cluster of trees and/or shrubs 23
24 Human construction: statue 13
25 Human construction: birdhouse 12
Total 285
Shannon diversity index = 2.31
Appendix 2BIOTOPE MAPPING2.1 FÆLLEDPARKEN

2 - Cobblestone surface
17 - Bank vegetation
7 - Lawn
23 - Cluster of trees and/or shrubs
4 - Deadwood
21 - Ornamental garden: perennials
11 - Vegetated mound
25 - Human construction: birdhouse
3 - Boulders
20 - Ornamental garden: bushes
10 - Bare soil
24 - Human construction: statue
6 - Wood chips
22 - Single tree or shrub
13 - Soil mound
100 mN

PLANAR ELEMENTS
Habitat number Description
Total number of
units
Total area (m2)
103 Gravel or sand 3 7099
109Permanent water feature with a non-organic base
1 1005
111 Temporary water feature 1 255
113 Lawn 3 2432
120 Ornamental garden: bushes 4 970
132Multi-layered deciduous tree stand 10-30%
1 114
163 Building 1 123
164 Playground 1 1955
Total 13953
Shannon diversity index = 1.45
Appendix 2BIOTOPE MAPPING2.2 ENGHAVEPARKEN

103 - Gravel or sand
120 - Ornamental garden: bushes
111 - Temporary water feature
163 - Buildings
109 - Permanent water feature with a non-organic base
132 - Multi-layered deciduous tree stand 10-30%
113 - Lawn
164 -Playground
25 mN

LINEAR ELEMENTS
Habitat number Description
Total number of
units
Total length
(m)
40 Path <2m half-hardened 1 57
41 Path <2m not hardened 9 85
43 Path >2m not hardened 10 1290
52 Lawn 15 1412
58 Ornamental garden: perennials 6 323
59 Sheared hedge 17 1064
61 Hedgerow 7 672
62 Tree row 12 1188
63 Alley 1 185
72Multi-layered deciduous tree stand 10-30%
2 108
75Multi-layered deciduous tree stand 30-80%
1 76
Total 6460
Shannon diversity index = 1.97
Appendix 2BIOTOPE MAPPING2.2 ENGHAVEPARKEN

41 - Path <2m not hardened
59 - Sheared hedge
72 - Multi-layered deciduous tree stand 10-30%
52 - Lawn
62 - Tree row
43 - Path >2m not hardened
61 - Hedgerow
75 - Multi-layered deciduous tree stand 30-80%
58 - Ornamental garden: perennials
63 - Alley
40 - Path <2m half-hardened
25 mN
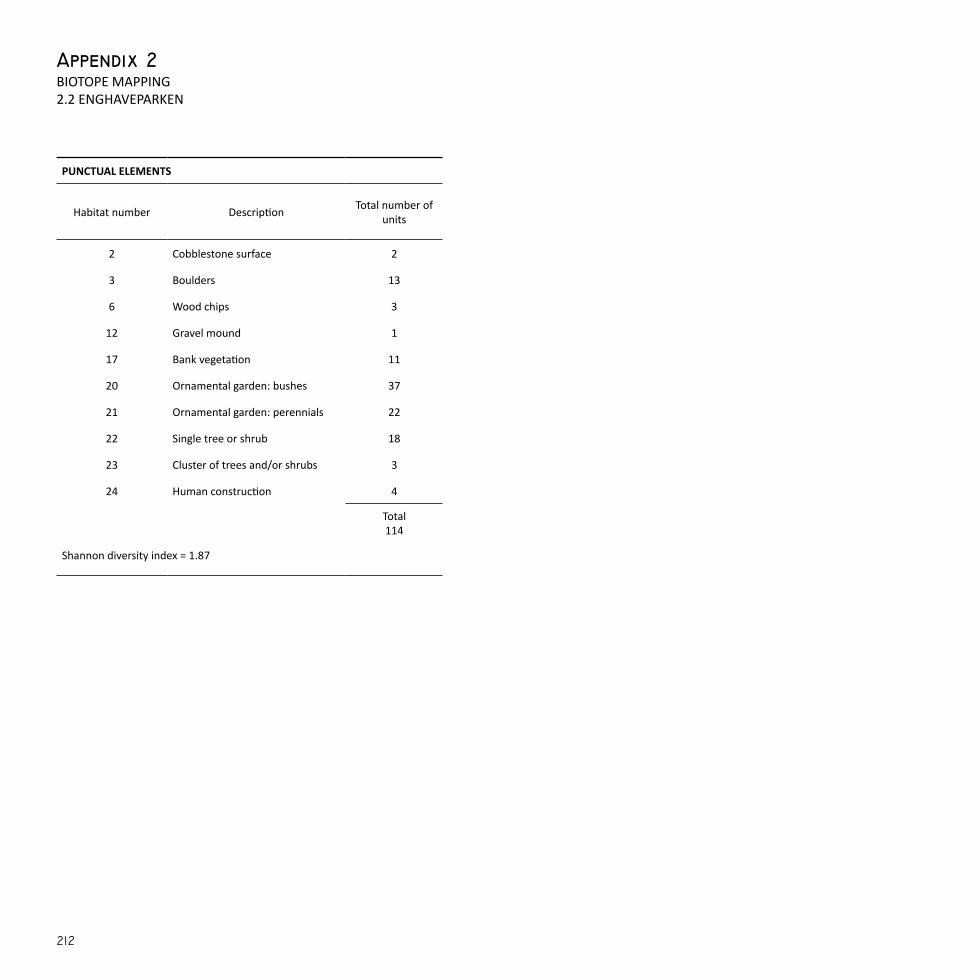
Appendix 2BIOTOPE MAPPING2.2 ENGHAVEPARKEN
PUNCTUAL ELEMENTS
Habitat number Description Total number of units
2 Cobblestone surface 2
3 Boulders 13
6 Wood chips 3
12 Gravel mound 1
17 Bank vegetation 11
20 Ornamental garden: bushes 37
21 Ornamental garden: perennials 22
22 Single tree or shrub 18
23 Cluster of trees and/or shrubs 3
24 Human construction 4
Total 114
Shannon diversity index = 1.87

2 - Cobblestone surface
23 - Cluster of trees and/or shrubs
17 - Bank vegetation
6 - Wood chips
21 - Ornamental garden: perennials
3 - Boulders
24 - Human construction
20 - Ornamental garden: bushes
12 - Gravel mound
22 - Single tree or shrub25 m
N

PLANAR ELEMENTS
Habitat number Description
Total number of
units
Total area (m2)
103 Gravel or sand 2 379
113 Lawn 5 9088
116 Meadow 8 2708
Total 12175
Shannon diversity index = 0.66
Appendix 2BIOTOPE MAPPING2.3 MIMERSPARKEN

103 - Gravel or sand
116 - Meadow
113 - Lawn25 m
N

Appendix 2BIOTOPE MAPPING2.3 MIMERSPARKEN
LINEAR ELEMENTS
Habitat number Description
Total number of
units
Total length
(m)
34 Vegetated slope 10-30% 16 204
35Vegetated slope 10-30% facing south
2 18
36 Vegetated slope 30-60% 8 333
37Vegetated slope 30-60% facing south
2 16
38 Vegetated slope >60% 9 333
39Vegetated slope >60% facing south
2 18
43 Path >2m not hardened 4 813
44 Ditch 1 401
52 Lawn 4 239
57 Ornamental garden: bushes 1 46
Total 2421
Shannon diversity index = 1.83

43 - Path >2m not hardened
36 - Vegetated slope 30-60%
34 - Vegetated slope 10-30%
52 - Lawn
38 - Vegetated slope >60%
44 - Ditch
37 - Vegetated slope 30-60% facing south
35 - Vegetated slope 10-30% facing south
57 - Ornamental garden: bushes
39 - Vegetated slope >60% facing south
25 mN

PUNCTUAL ELEMENTS
Habitat number Description Total number of units
1 Gravel or sand surface 42
7 Lawn 6
18 Kitchen garden 3
22 Single tree or shrub 150
23 Cluster of trees and/or shrubs 2
Total 203
Shannon diversity index = 0.76
Appendix 2BIOTOPE MAPPING2.3 MIMERSPARKEN

1 - Gravel or sand surface
23 - Cluster of trees and/or shrubs
18 -Kitchen garden
7 - Lawn
22 - Single tree or shrub25 m
N

PLANAR ELEMENTS
Habitat number Description
Total number of
units
Total area (m2)
103 Gravel or sand 3 453
116 Meadow 6 30786
122 Shrubs 1 182
123 Thicket 7 1702
128Two-layered deciduous tree stand >10%
1 758
132Multi-layered deciduous tree stand 10-30%
1 1047
Total 34928
Shannon diversity index = 0.53
Appendix 2BIOTOPE MAPPING2.4 STEJLEPLADSEN

103 - Gravel or sand
128 - Two-layered deciduous tree stand >10%
122 - Shrubs
116 - Meadow
132 - Multi-layered deciduous tree stand 10-30%
123 - Thicket25 m
N
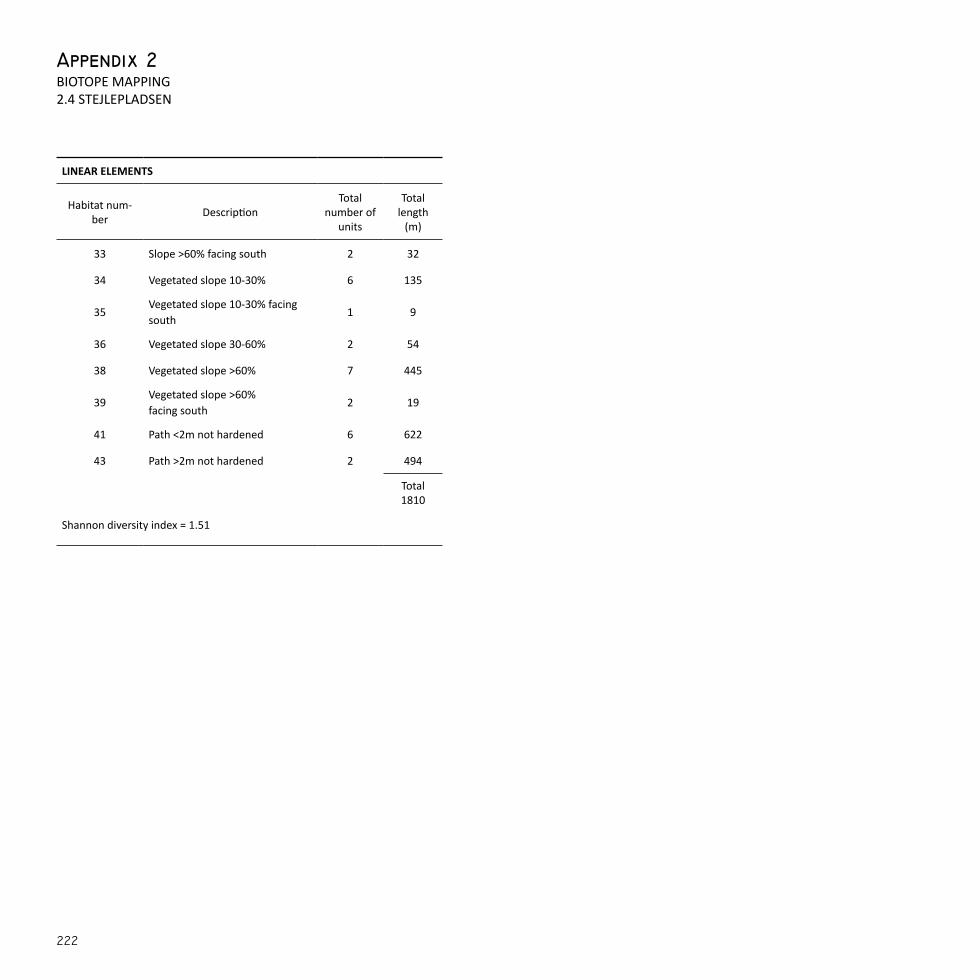
LINEAR ELEMENTS
Habitat num-ber Description
Total number of
units
Total length
(m)
33 Slope >60% facing south 2 32
34 Vegetated slope 10-30% 6 135
35Vegetated slope 10-30% facing south
1 9
36 Vegetated slope 30-60% 2 54
38 Vegetated slope >60% 7 445
39Vegetated slope >60% facing south
2 19
41 Path <2m not hardened 6 622
43 Path >2m not hardened 2 494
Total 1810
Shannon diversity index = 1.51
Appendix 2BIOTOPE MAPPING2.4 STEJLEPLADSEN

43 - Path >2m not hardened
36 - Vegetated slope 30-60%
34 - Vegetated slope 10-30%
39 - Vegetated slope >60% facing south
33 - Slope >60% facing south
38 - Vegetated slope >60%
35 - Vegetated slope 10-30% facing south
41 - Path <2m not hardened25 m
N
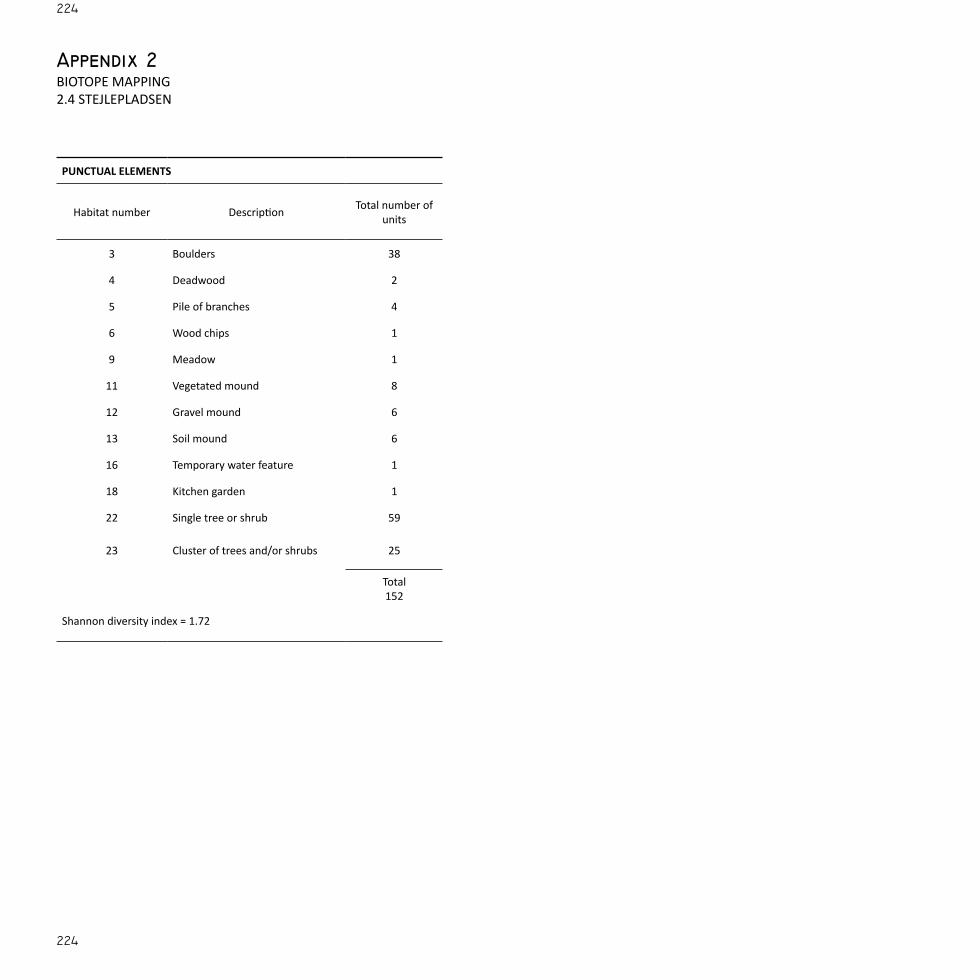
PUNCTUAL ELEMENTS
Habitat number Description Total number of units
3 Boulders 38
4 Deadwood 2
5 Pile of branches 4
6 Wood chips 1
9 Meadow 1
11 Vegetated mound 8
12 Gravel mound 6
13 Soil mound 6
16 Temporary water feature 1
18 Kitchen garden 1
22 Single tree or shrub 59
23 Cluster of trees and/or shrubs 25
Total 152
Shannon diversity index = 1.72
Appendix 2BIOTOPE MAPPING2.4 STEJLEPLADSEN
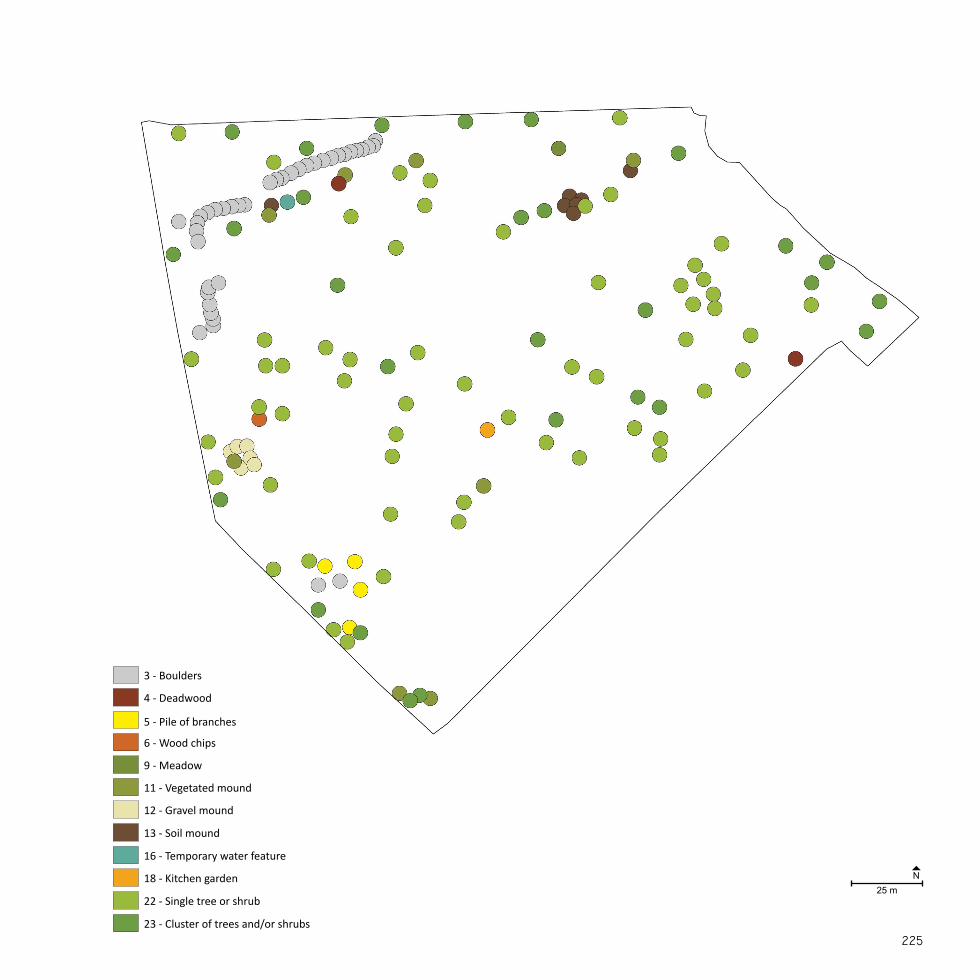
3 - Boulders
16 - Temporary water feature
9 - Meadow
5 - Pile of branches
22 - Single tree or shrub
12 - Gravel mound
4 - Deadwood
18 - Kitchen garden
11 - Vegetated mound
6 - Wood chips
23 - Cluster of trees and/or shrubs
13 - Soil mound
25 mN
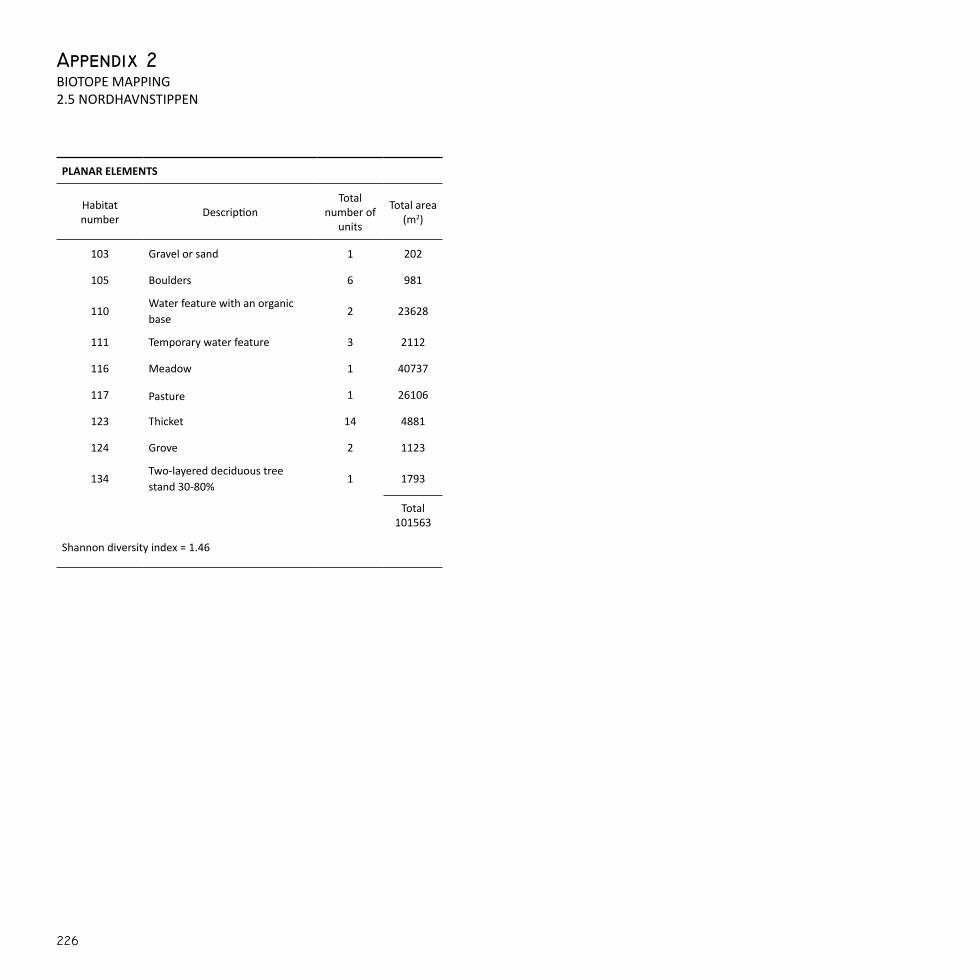
PLANAR ELEMENTS
Habitat number Description
Total number of
units
Total area (m2)
103 Gravel or sand 1 202
105 Boulders 6 981
110Water feature with an organic base
2 23628
111 Temporary water feature 3 2112
116 Meadow 1 40737
117 Pasture 1 26106
123 Thicket 14 4881
124 Grove 2 1123
134Two-layered deciduous tree stand 30-80%
1 1793
Total 101563
Shannon diversity index = 1.46
Appendix 2BIOTOPE MAPPING2.5 NORDHAVNSTIPPEN
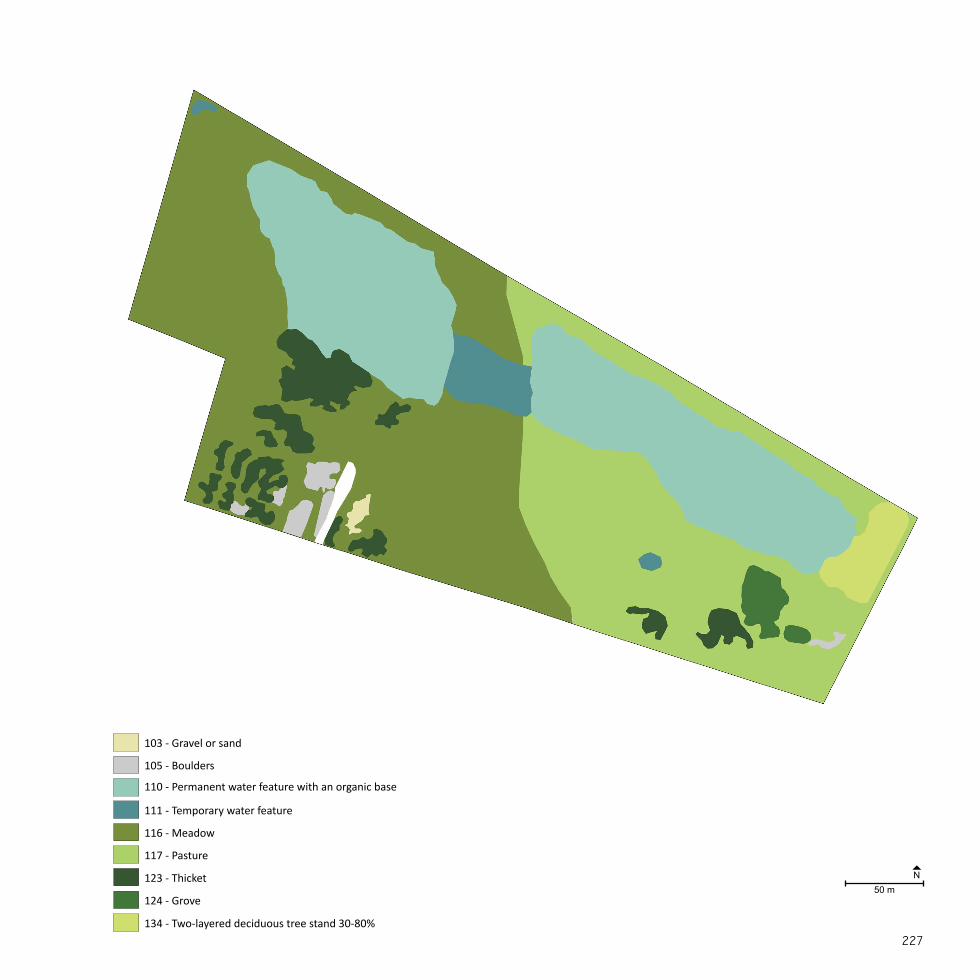
103 - Gravel or sand
134 - Two-layered deciduous tree stand 30-80%
116 - Meadow
110 - Permanent water feature with an organic base
123 - Thicket
105 - Boulders
117 - Pasture
111 - Temporary water feature
124 - Grove50 m
N

LINEAR ELEMENTS
Habitat number Description
Total number of
units
Total length
(m)
27 Boulders 1 22
31 Slope 30-60% facing south 1 125
33 Slope >60% facing south 4 143
34 Vegetated slope 10-30% 7 193
35Vegetated slope 10-30% facing south
6 150
36 Vegetated slope 30-60% 8 209
37Vegetated slope 30-60% facing south
5 61
38 Vegetated slope >60% 22 893
39Vegetated slope >60% facing south
11 478
40 Path <2m half-hardened 1 15
41 Path <2m not hardened 20 2865
43 Path >2m not hardened 1 61
44 Ditch 4 254
49 Natural bank 2 1041
51 Bank vegetation 6 511
Total 7021
Shannon diversity index = 1.96
Appendix 2BIOTOPE MAPPING2.5 NORDHAVNSTIPPEN

31 - Slope 30-60% facing south
27 - Boulders
41 - Path <2m not hardened
36 - Vegetated slope 30-60%
51 - Bank vegetation
34 - Vegetated slope 10-30%
44 - Ditch
38 - Vegetated slope >60%
33 - Slope >60% facing south
43 - Path >2m not hardened
37 - Vegetated slope 30-60% facing south
35 - Vegetated slope 10-30% facing south
49 - Natural bank
40 - Path <2m half-hardened
39 - Vegetated slope >60% facing south
50 mN

PUNCTUAL ELEMENTS
Habitat number Description Total number of units
3 Boulders 10
11 Vegetated mound 27
13 Soil mound 8
16 Temporary water feature 6
17 Bank vegetation 1
22 Single tree or shrub 70
23 Cluster of trees and/or shrubs 30
Total 152
Shannon diversity index = 1.48
Appendix 2BIOTOPE MAPPING2.5 NORDHAVNSTIPPEN

16 - Temporary water feature
11 - Vegetated mound
22 - Single tree or shrub
3 - Boulders
17 - Bank vegetation
13 - Soil mound
23 - Cluster of trees and/or shrubs
50 mN

PLANAR ELEMENTS
Habitat number Description
Total number of
units
Total area (m2)
113 Lawn 1 3804
116 Meadow 11 11466
122 Shrubs 3 849
123 Thicket 6 1259
131Two-layered deciduous tree stand 10-30%
1 1430
132Multi-layered deciduous tree stand 10-30%
1 152
135Multi-layered deciduous tree stand 30-80%
1 257
Total 19217
Shannon diversity index = 1.23
Appendix 2BIOTOPE MAPPING2.6 AMAGERBANEN
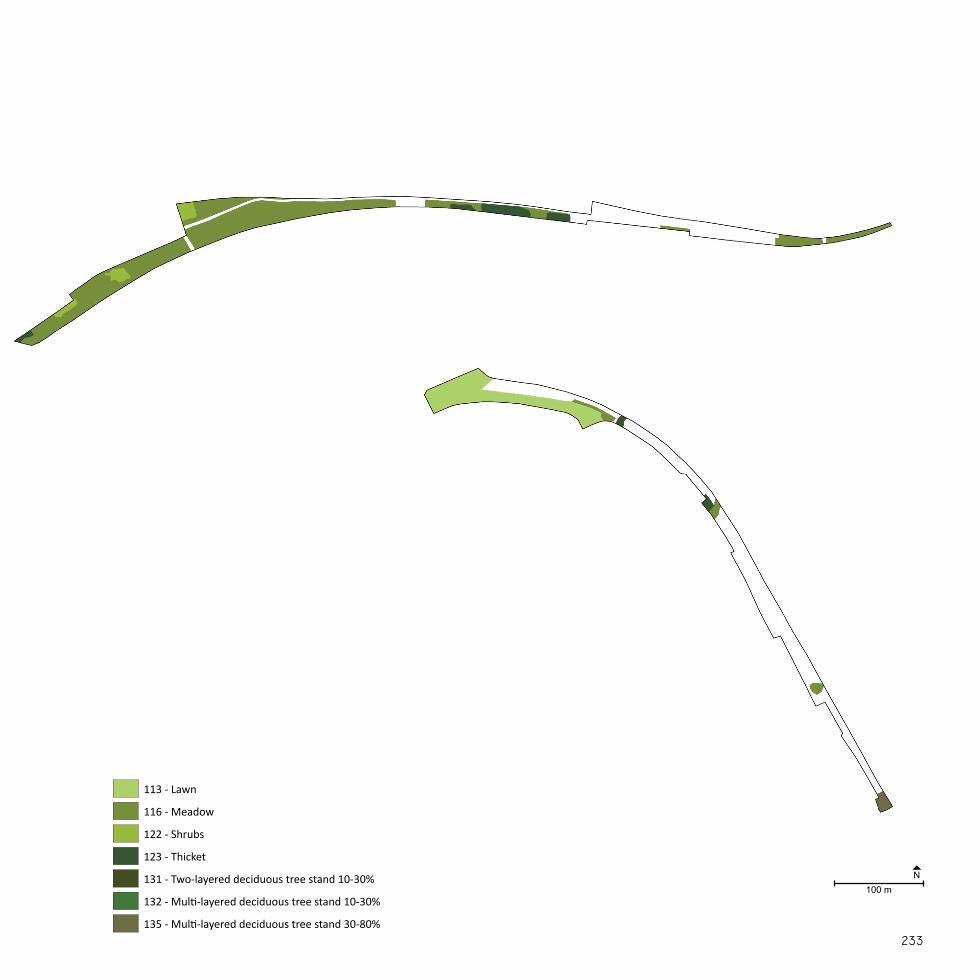
113 - Lawn
131 - Two-layered deciduous tree stand 10-30%
122 - Shrubs
135 - Multi-layered deciduous tree stand 30-80%
116 - Meadow
132 - Multi-layered deciduous tree stand 10-30%
123 - Thicket
100 mN

LINEAR ELEMENTS
Habitat number Description
Total number of
units
Total length
(m)
32 Soil slope >60% 1 32
34 Vegetated slope 10-30% 8 428
35Vegetated slope 10-30% facing south
4 197
36 Vegetated slope 30-60% 6 357
37Vegetated slope 30-60% facing south
3 222
38 Vegetated slope >60% 5 472
39Vegetated slope >60% facing south
2 126
40 Path <2m half hardened 5 751
41 Path <2m not hardened 19 294
42 Path >2m half hardened 4 1142
43 Path >2m not hardened 6 513
54 Meadow 2 125
61 Hedgerow 15 1451
62 Tree row 4 274
64 Grove 1 99
Total 6483
Shannon diversity index =2.36
Appendix 2BIOTOPE MAPPING2.6 AMAGERBANEN

34 - Vegetated slope 10-30%
32 - Soil slope >60%
43 - Path >2m not hardened
38 - Vegetated slope >60%
64 - Grove
36 - Vegetated slope 30-60%
61 - Hedgerow
40 - Path <2m half-hardened
35 - Vegetated slope 10-30% facing south
54 - Meadow
39 - Vegetated slope >60% facing south
37 - Vegetated slope 30-60% facing south
62 - Tree row
42 - Path >2m half hardened
41 - Path <2m not hardened
100 mN

PUNCTUAL ELEMENTS
Habitat number Description Total number of units
1 Gravel or sand surface 6
3 Boulders 10
4 Deadwood 4
5 Pile of branches 15
6 Wood chips 25
9 Meadow 1
11 Vegetated mound 7
12 Gravel mound 3
13 Soil mound 14
22 Single tree or shrub 33
23 Cluster of trees and/or shrubs 29
24 Human construction 8
Total 152
Shannon diversity index = 2.18
Appendix 2BIOTOPE MAPPING2.6 AMAGERBANEN

1 - Gravel or sand surface
13 - Soil mound
6 - Wood chips
4 - Deadwood
23 - Cluster of trees and/or shrubs
11 - Vegetated mound
3 - Boulders
22 - Single tree or shrub
9 - Meadow
5 - Pile of branches
24 - Human construction
12 - Gravel mound
100 mN

Appendix 3REGISTRATION OF INVERTEBRATES3.1 FÆLLEDPARKEN
Superfamily (SP)Subfamily (SB)Uncertainty **
PITFALL TRAP 1
Order/Class* Family Species No. of individuals
Araneae Unknown family A 4
Araneae Unknown family B 1
Coleoptera Curculionidae A 3
Coleoptera Elateridae A 1
Coleoptera Staphylinidae A 2
Coleoptera Staphylinidae B 1
Coleoptera Tenebrionidae** D 1
Diptera Sciaridae** A 3
Diptera Unknown family A 2
Diptera Unknown family B 1
Diptera Unknown family C 1
Hymenoptera Ichneumonidae A 1
Isopoda Philosciidae A 28
Julida Julidae A 4
Opiliones Phalangiidae A 23
Prostigmata Unknown family A 1
Total 16
Total 77
Shannon diversity index = 1.93
PITFALL TRAP 2
Order/Class* Family Species No. of individuals
Araneae Unknown family A 6
Araneae Unknown family C 2
Araneae Unknown family D 2
Coleoptera Carabidae A 1
Coleoptera Carabidae B 1
Coleoptera Staphylinidae A 3
Diptera Unknown family D 2
Diptera Unknown family E 2
Entomobryomorpha Unknown family A 2
Hemiptera Aphididae A 1
Isopoda Armadillidiidae A 1
Isopoda Oniscidae A 2
Isopoda Philosciidae A 10
Julida Julidae A 2
Opiliones Phalangiidae B 4
Total 15
Total 41
Shannon diversity index = 2.44

PITFALL TRAP 4
Order/Class* Family Species No. of individuals
Araneae Unknown family A 4
Araneae Unknown family H 1
Araneae Unknown family I 1
Coleoptera Carabidae A 1
Coleoptera Carabidae F 2
Coleoptera Curculionidae A 4
Coleoptera Staphylinidae A 5
Coleoptera Staphylinidae B 2
Coleoptera Staphylinidae C 3
Diptera Tipulidae A 1
Diptera Unknown family N 2
Diptera Unknown family O 1
Diptera Unknown family P 1
Diptera Unknown family Q 1
Entomobryomorpha Unknown family C 2
Entomobryomorpha Unknown family D 1
Hymenoptera Proctotrupoidea A 1
Isopoda Oniscidae A 2
Julida Julidae A 2
Lithobiomorpha Lithobiidae B 1
Opiliones Phalangiidae A 2
Opiliones Phalangiidae B 2
Total 22
Total 42
Shannon diversity Index = 2.94
PITFALL TRAP 3
Order/Class* Family Species Number of individuals
Araneae Unknown family E 1
Araneae Unknown family F 1
Araneae Unknown family G 1
Coleoptera Carabidae A 16
Coleoptera Carabidae C 1
Coleoptera Carabidae D 1
Coleoptera Carabidae E 1
Coleoptera Curculionidae A 1
Coleoptera Staphylinidae A 1
Dermaptera Forficulidae A 7
Diptera Unknown family F 1
Diptera Unknown family G 2
Diptera Unknown family H 2
Diptera Unknown family I 1
Diptera Unknown family J 1
Diptera Unknown family K 1
Diptera Unknown family L 1
Entomobryomorpha Unknown family B 1
Hymenoptera Formicidae A 8
Hymenoptera Ichneumonidae B 1
Hymenoptera Ichneumonidae C 1
Isopoda Armadillidiidae A 11
Julida Julidae A 2
Lepidoptera Unknown family A 3
Lithobiomorpha Lithobiidae A 1
Total 25
Total 68
Shannon diversity index = 2.62

TRANSECT A - 25 m
Order/Class* Family Species No. of individuals
Araneae Unknown family M 2
Coleoptera Cerambycidae A 1
Coleoptera Curculionidae A 1
Diptera Canacidae A 6
Neuroptera Unknown family A 1
Stylommatophora Helicidae A 2
Total 6
Total 13
Shannon diversity index = 1.52
TRANSECT B - 25 m
Order/Class* Family Species No. of individuals
Acari Unknown family A 1
Araneae Unknown family A 2
Araneae Unknown family B 2
Araneae Unknown family C 2
Araneae Unknown family D 1
Araneae Unknown family E 1
Araneae Unknown family F 1
Araneae Unknown family G 1
Araneae Unknown family H 1
Araneae Unknown family I 1
Araneae Unknown family J 1
Araneae Unknown family K 1
Araneae Unknown family L 1
Coleoptera Bostrichidae A 1
Coleoptera Curculionidae B 2
Coleoptera Curculionidae C 1
Coleoptera Staphylinidae A 1
Coleoptera Unknown family A 1
Diptera Empididae A 17
Diptera Tipulidae A 1
Diptera Tipulidae B 1
Diptera Tipulidae C 1
Diptera Tipulidae D 1
Diptera Tipulidae E 2
Diptera Tipulidae F 1
Diptera Unknown family A 1
Appendix 3REGISTRATION OF INVERTEBRATES3.1 FÆLLEDPARKEN
Superfamily (SP)Subfamily (SB)Uncertainty **

TRANSECT B - 25 m (CONTINUED)
Order/Class* Family Species No. of individuals
Entomobryomorpha Unknown family A 1
Ephemeroptera Unknown family A 1
Hemiptera Anthocoridae A 17
Hemiptera Aphididae A 5
Hemiptera Aphididae B 1
Hemiptera Aphididae C 6
Hemiptera Cicadellidae A 1
Hemiptera Lygaeidae A 3
Hemiptera Lygaeidae B 1
Hemiptera Miridae** A 1
Hemiptera Unknown family A 3
Hymenoptera Ichneumonidae A 1
Hymenoptera Trigonalidae A 1
Lepidoptera Unknown family A 3
Lepidoptera Unknown family B 1
Lepidoptera Unknown family C 1
Lepidoptera Unknown family D 1
Lepidoptera Unknown family E 1
Lepidoptera Unknown family F 1
Lepidoptera Unknown family G 1
Maxillopoda* Unknown family A 2
Neuroptera Unknown family B 1
Opiliones Unknown family A 1
Total 49
Total 102
Shannon diversity index = 3.32
TRANSECT C - 25 m
Order/Class* Family Species No. of individuals
Araneae Unknown family A 1
Araneae Unknown family F 1
Araneae Unknown family K 1
Coleoptera Coccinellidae A 4
Coleoptera Curculionidae D 1
Coleoptera Elateridae A 1
Diptera Empididae B 2
Hemiptera Anthocoridae B 1
Hemiptera Miridae** A 9
Hymenoptera Ichneumonidae B 1
Hymenoptera Ichneumonidae C 1
Hymenoptera Unknown family A 2
Lepidoptera Unknown family A 4
Lepidoptera Unknown family B 1
Lepidoptera Unknown family F 1
Total 15
Total31
Shannon diversity index = 2.35

TRANSECT D - 25 m
Order/Class* Family Species No. of individuals
Araneae Unknown family N 3
Araneae Unknown family O 4
Coleoptera Bostrichidae B 3
Coleoptera Cantharidae A 1
Coleoptera Elateridae B 2
Coleoptera Unknown family B 1
Diptera Empididae C 1
Diptera Tipulidae A 1
Diptera Tipulidae G 1
Hemiptera Anthocoridae B 2
Hemiptera Aphididae C 5
Hemiptera Lygaeidae A 3
Hemiptera Miridae A 1
Hymenoptera Ichneumonidae D 1
Lepidoptera Unknown family A 25
Lepidoptera Unknown family C 1
Lepidoptera Unknown family H 1
Stylommatophora Helicidae A 3
Total 18
Total 59
Shannon diversity index = 2.21
PLOT 2
Order/Class* Family Species No. of individuals
Diptera Unknown family B 2
Diptera Unknown family C 1
Diptera Unknown family D 1
Diptera Unknown family E 1
Diptera Unknown family F 1
Hymenoptera Formicidae A 2
Total 6
Total 8
Shannon diversity index = 1.73
Appendix 3REGISTRATION OF INVERTEBRATES3.1 FÆLLEDPARKEN
Superfamily (SP)Subfamily (SB)Uncertainty **


PITFALL TRAP 2 (CONTINUED)
Order/Class* Family Species No. of individuals
Diptera Unknown family C 1
Diptera Unknown family D 2
Diptera Unknown family E 1
Diptera Unknown family F 2
Diptera Unknown family G 1
Entomobryomorpha Unknown family A 26
Entomobryomorpha Unknown family B 2
Entomobryomorpha Unknown family C 1
Haplotaxida Lumbricidae A 2
Hymenoptera Formicidae A 11
Hymenoptera Unknown family A 1
Isopoda Armadillidiidae A 32
Isopoda Philosciidae A 71
Julida Julidae A 1
Julida Julidae B 4
Lithobiomorpha Lithobiidae A 2
Lithobiomorpha Lithobiidae B 1
Prostigmata Trombidiidae A 1
Stylommaptophora Unknown family A 1
Total 39
Total 226
Shannon diversity index = 2.52
PITFALL TRAP 2
Order/Class* Family Species No. of individuals
Araneae Unknown family A 2
Araneae Unknown family B 3
Araneae Unknown family C 1
Araneae Unknown family D 1
Araneae Unknown family E 1
Araneae Unknown family F 2
Araneae Unknown family G 1
Araneae Unknown family H 1
Araneae Unknown family I 1
Coleoptera Carabidae A 2
Coleoptera Carabidae B 1
Coleoptera Carabidae C 1
Coleoptera Carabidae D 1
Coleoptera Curculionidae A 15
Coleoptera Dermestidae A 6
Coleoptera Staphylinidae A 1
Coleoptera Staphylinidae B 1
Dermaptera Forficulidae A 20
Diptera Unknown family A 1
Diptera Unknown family B 1
Appendix 3REGISTRATION OF INVERTEBRATES3.2 ENGHAVEPARKEN
Superfamily (SP)Subfamily (SB)Uncertainty **

PITFALL TRAP 3 (CONTINUED)
Order/Class* Family Species No. of individuals
Lithobiomorpha Lithobiidae C 2
Opisthopora Lumbricidae A 1
Prostigmata Trombidiidae A 1
Stylommaptophora Arionidae A 2
Stylommaptophora Arionidae B 1
Stylommaptophora Helicidae A 1
Stylommaptophora Unknown family A 2
Stylommaptophora Unknown family B 2
Total 33
Total 231
Shannon diversity index = 2.34
PITFALL TRAP 3
Order/Class* Family Species No. of individuals
Araneae Unknown family J 1
Coleoptera Carabidae A 6
Coleoptera Carabidae E 2
Coleoptera Carabidae F 1
Coleoptera Carabidae G 2
Coleoptera Carabidae H 1
Coleoptera Carabidae I 1
Coleoptera Curculionidae B 1
Coleoptera Staphylinidae C 3
Dermaptera Forficulidae A 27
Diptera Unknown family H 1
Diptera Unknown family I 1
Diptera Unknown family J 2
Diptera Unknown family K 2
Diptera Unknown family L 1
Entomobryomorpha Unknown family A 5
Entomobryomorpha Unknown family B 3
Entomobryomorpha Unknown family D 6
Hemiptera Aphididae A 1
Hymenoptera Formicidae A 18
Isopoda Armadillidiidae A 39
Isopoda Oniscidae A 3
Isopoda Philosciidae A 82
Isopoda Porcellionidae A 1
Julida Julidae A 9

PITFALL TRAP 4
Order/Class* Family Species No. of individuals
Coleoptera Carabidae A 2
Coleoptera Carabidae I 1
Coleoptera Carabidae J 1
Coleoptera Carabidae K 1
Coleoptera Carabidae L 1
Coleoptera Carabidae M 14
Coleoptera Curculionidae C 1
Coleoptera Staphylinidae D 4
Coleoptera Staphylinidae E 2
Coleoptera Staphylinidae F 1
Dermaptera Forficulidae B 5
Diptera Calliphoridae A 1
Diptera Muscidae A 4
Diptera Muscidae B 6
Diptera Muscidae C 3
Diptera Unknown family K 2
Diptera Unknown family M 1
Diptera Unknown family N 1
Diptera Unknown family O 1
Hemiptera Aphididae B 1
Hymenoptera Formicidae A 109
Hymenoptera Mymaridae A 1
Isopoda Armadillidiidae A 2
Appendix 3REGISTRATION OF INVERTEBRATES3.2 ENGHAVEPARKEN
Superfamily (SP)Subfamily (SB)Uncertainty **
PITFALL TRAP 4 (CONTINUED)
Order/Class* Family Species No. of individuals
Julida Julidae A 23
Lithobiomorpha Lithobiidae A 1
Polydesmida Polydesmidae A 1
Stylommatophora Unknown family C 1
Total 27
Total 191
Shannon diversity index = 1.80

TRANSECT A - 25 m
Order/Class* Family Species No. of individuals
Araneae Unknown family A 2
Araneae Unknown family B 3
Araneae Unknown family C 4
Araneae Unknown family D 6
Araneae Unknown family E 1
Araneae Unknown family F 1
Araneae Unknown family G 1
Araneae Unknown family H 1
Araneae Unknown family I 1
Araneae Unknown family J 1
Araneae Unknown family K 1
Araneae Unknown family L 1
Araneae Unknown family M 1
Araneae Unknown family N 1
Coleoptera Curculionidae A 2
Coleoptera Unknown family A 1
Coleoptera Unknown family B 1
Coleoptera Unknown family A 1
Coleoptera Unknown family B 1
Collembola Entomobryoidea** A 2
Diptera Calliphoridae A 1
Diptera Tipulidae A 1
Diptera Unknown family A 2
Diptera Unknown family B 2
Diptera Unknown family C 2
Diptera Unknown family D 2
TRANSECT A - 25 m (CONTINUED)
Order/Class* Family Species No. of individuals
Diptera Unknown family E 1
Diptera Unknown family F 1
Total 28
Total 45
Shannon diversity index = 3.16

Appendix 3REGISTRATION OF INVERTEBRATES3.2 ENGHAVEPARKEN
Superfamily (SP)Subfamily (SB)Uncertainty **
TRANSECT B - 25 m
Order/Class* Family Species No. of individuals
Araneae Unknown family G 1
Araneae Unknown family O 1
Araneae Unknown family P 1
Araneae Unknown family Q 1
Araneae Unknown family R 1
Coleoptera Unknown family A 1
Collembola Unknown family A 2
Hymenoptera Unknown family A 1
Total 8
Total9
Shannon diversity index = 2.04
TRANSECT C - 50 m
Order/Class* Family Species No. of individuals
Araneae Unknown family S 2
Araneae Unknown family T 1
Araneae Unknown family U 2
Araneae Unknown family V 1
Araneae Unknown family W 1
Araneae Unknown family Y 1
Araneae Unknown family Z 2
Coleoptera Byrrhidae A 1
Coleoptera Cleridae A 2
Coleoptera Coccinellidae B 1
Coleoptera Coccinellidae C 1
Coleoptera Unknown family C 2
Diptera Unknown family E 1
Diptera Unknown family G 3
Diptera Unknown family H 1
Diptera Unknown family I 1
Diptera Unknown family J 2
Diptera Unknown family K 1
Hemiptera Anthocoridae A 1
Hemiptera Apididae A 1
Hemiptera Apididae B 1
Hemiptera Cicadellidae A 1
Hemiptera Cicadellidae B 1

TRANSECT C - 25 m
Order/Class* Family Species No. of individuals
Hymenoptera Ichneumonidae A 1
Hymenoptera Ichneumonidae B 2
Lepidoptera Unknown family A 5
Total 26
Total 39
Shannon diversity index = 3.12
PLOT 1
Order/Class* Family Species No. of individuals
Diptera Chironomidae A 2
Hemiptera Delphacidae A 1
Hemiptera Aphididae A 1
Total 3
Total4
Shannon diversity index = 1.04

PITFALL TRAP 1 (CONTINUED)
Order/Class* Family Species No. of individuals
Diptera Unknown family N 2
Diptera Unknown family O 1
Diptera Unknown family P 1
Diptera Unknown family Q 1
Diptera Unknown family R 1
Gastropoda* Unknown family A 15
Hemiptera Anthocoridae A 1
Hymenoptera Andrenidae A 1
Hymenoptera Formicidae A 35
Hymenoptera Unknown family A 2
Hymenoptera Unknown family B 2
Isopoda Armadillidiidae A 3
Isopoda Oniscidae A 20
Isopoda Philosciidae A 2
Isopoda Porcellonidae A 30
Julida Julidae A 6
Total 41
Total 246
Shannon diversity index = 3.07
PITFALL TRAP 1
Order/Class* Family Species No. of individuals
Araneae Unknown family A 15
Araneae Unknown family B 5
Araneae Unknown family C 1
Araneae Unknown family D 4
Coleoptera Carabidae A 7
Coleoptera Carabidae B 19
Coleoptera Carabidae C 8
Coleoptera Carabidae D 17
Coleoptera Carabidae E 1
Coleoptera Carabidae A 1
Coleoptera Scarabaeidae A 7
Coleoptera Staphylinidae A 3
Coleoptera Unknown family B 1
Collembola Entomobryoidea** A 7
Dermaptera Forficulidae A 1
Diptera Tipulidae A 1
Diptera Unknown family E 7
Diptera Unknown family F 1
Diptera Unknown family G 1
Diptera Unknown family H 2
Diptera Unknown family I 4
Diptera Unknown family J 1
Diptera Unknown family K 6
Diptera Unknown family L 1
Diptera Unknown family M 2
Appendix 3REGISTRATION OF INVERTEBRATES3.3 MIMERSPARKEN
Superfamily (SP)Subfamily (SB)Uncertainty **

PITFALL TRAP 3
Order/Class* Family Species No. of individuals
Araneae Unknown family B 4
Araneae Unknown family G 2
Araneae Unknown family H 1
Araneae Unknown family I 4
Araneae Unknown family J 1
Araneae Unknown family K 1
Coleoptera Carabidae D 2
Coleoptera Carabidae E 1
Coleoptera Carabidae I 3
Coleoptera Coccinellidae A 1
Coleoptera Curculionidae B 1
Coleoptera Curculionidae C 2
Coleoptera Staphylinidae C 1
Coleoptera Unknown family D 1
Coleoptera Unknown family E 1
Diptera Unknown family W 11
Diptera Unknown family X 2
Diptera Unknown family Y 1
Diptera Unknown family Z 1
Hemiptera Unknown family A 1
Hymenoptera Trichogrammatidae A 2
Total 21
Total 44
Shannon diversity index = 2.70
PITFALL TRAP 2
Order/Class* Family Species No. of individuals
Acari Unknown family A 3
Araneae Unknown family E 1
Araneae Unknown family F 1
Araneae Unknown family G 1
Araneae Unknown family H 1
Coleoptera Carabidae C 1
Coleoptera Carabidae D 3
Coleoptera Carabidae F 1
Coleoptera Curculionidae A 1
Coleoptera Curculionidae B 1
Coleoptera Staphylinidae A 1
Coleoptera Staphylinidae B 2
Coleoptera Unknown family C 1
Collembola Entomobryidae B 5
Diptera Tipulidae B 1
Diptera Unknown family S 7
Diptera Unknown family T 2
Diptera Unknown family U 1
Diptera Unknown family V 1
Diptera Unknown family W 23
Gastropoda* Unknown family A 1
Hemiptera Aphididae A 3
Hymenoptera Formicidae A 5
Hymenoptera Unknown family C 1
Hymenoptera Unknown family D 1
Julida Julidae A 2
Total 26
Total 71
Shannon diversity index = 2.63
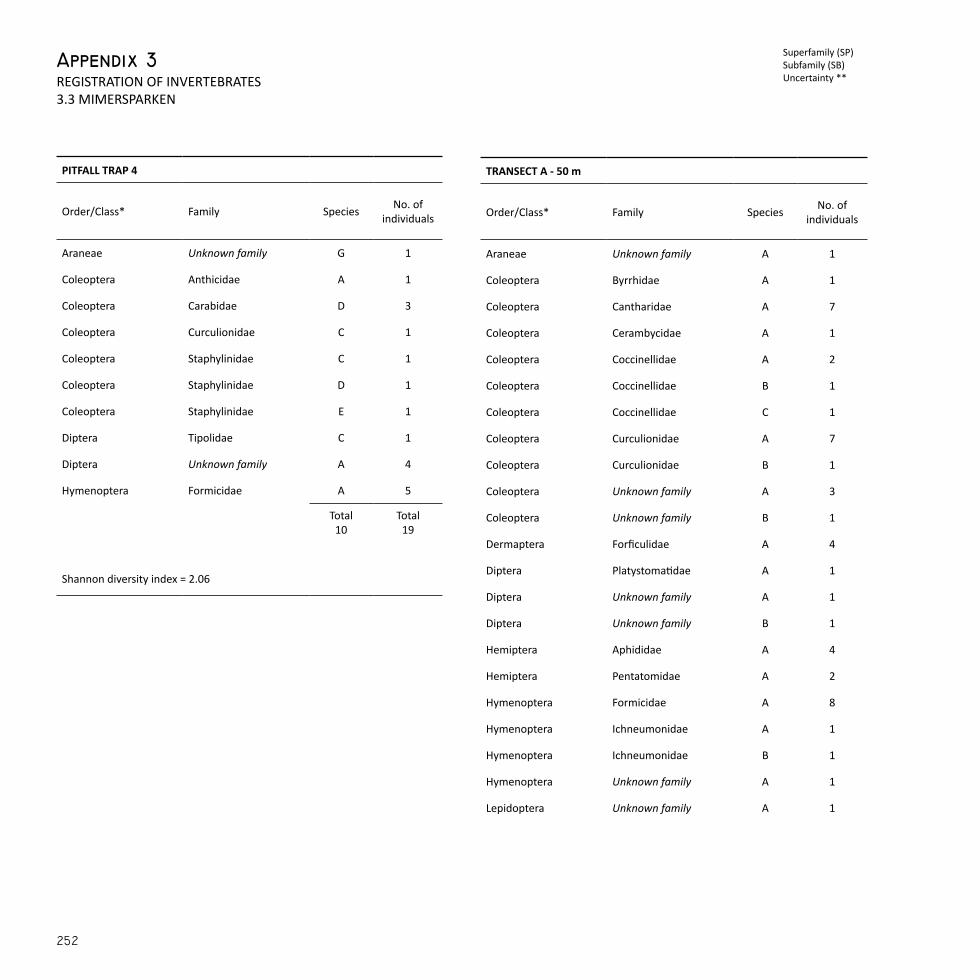
TRANSECT A - 50 m
Order/Class* Family Species No. of individuals
Araneae Unknown family A 1
Coleoptera Byrrhidae A 1
Coleoptera Cantharidae A 7
Coleoptera Cerambycidae A 1
Coleoptera Coccinellidae A 2
Coleoptera Coccinellidae B 1
Coleoptera Coccinellidae C 1
Coleoptera Curculionidae A 7
Coleoptera Curculionidae B 1
Coleoptera Unknown family A 3
Coleoptera Unknown family B 1
Dermaptera Forficulidae A 4
Diptera Platystomatidae A 1
Diptera Unknown family A 1
Diptera Unknown family B 1
Hemiptera Aphididae A 4
Hemiptera Pentatomidae A 2
Hymenoptera Formicidae A 8
Hymenoptera Ichneumonidae A 1
Hymenoptera Ichneumonidae B 1
Hymenoptera Unknown family A 1
Lepidoptera Unknown family A 1
PITFALL TRAP 4
Order/Class* Family Species No. of individuals
Araneae Unknown family G 1
Coleoptera Anthicidae A 1
Coleoptera Carabidae D 3
Coleoptera Curculionidae C 1
Coleoptera Staphylinidae C 1
Coleoptera Staphylinidae D 1
Coleoptera Staphylinidae E 1
Diptera Tipolidae C 1
Diptera Unknown family A 4
Hymenoptera Formicidae A 5
Total 10
Total19
Shannon diversity index = 2.06
Appendix 3REGISTRATION OF INVERTEBRATES3.3 MIMERSPARKEN
Superfamily (SP)Subfamily (SB)Uncertainty **
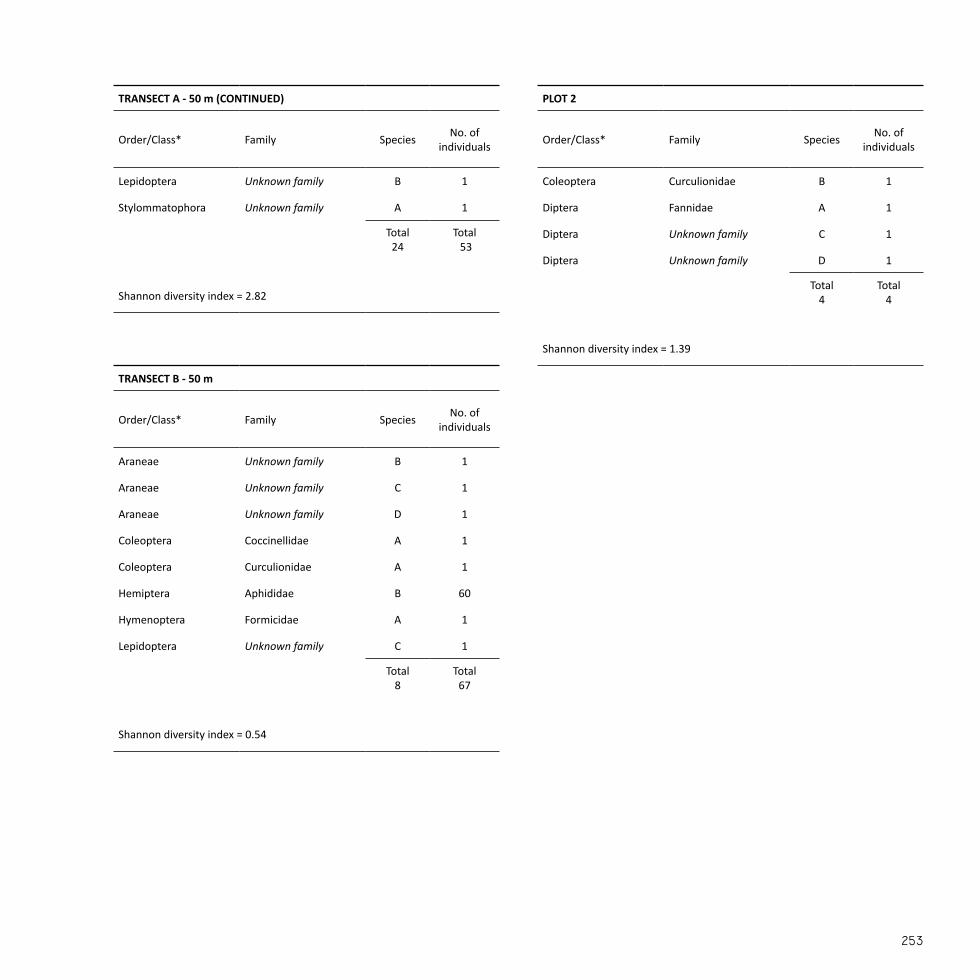
TRANSECT B - 50 m
Order/Class* Family Species No. of individuals
Araneae Unknown family B 1
Araneae Unknown family C 1
Araneae Unknown family D 1
Coleoptera Coccinellidae A 1
Coleoptera Curculionidae A 1
Hemiptera Aphididae B 60
Hymenoptera Formicidae A 1
Lepidoptera Unknown family C 1
Total 8
Total67
Shannon diversity index = 0.54
PLOT 2
Order/Class* Family Species No. of individuals
Coleoptera Curculionidae B 1
Diptera Fannidae A 1
Diptera Unknown family C 1
Diptera Unknown family D 1
Total 4
Total4
Shannon diversity index = 1.39
TRANSECT A - 50 m (CONTINUED)
Order/Class* Family Species No. of individuals
Lepidoptera Unknown family B 1
Stylommatophora Unknown family A 1
Total 24
Total 53
Shannon diversity index = 2.82

PITFALL TRAP 1
Order/Class* Family Species No. of individuals
Araneae Unknown family A 1
Araneae Unknown family B 1
Coleoptera Carabidae A 1
Coleoptera Carabidae B 1
Coleoptera Staphylinidae A 1
Entomobryomorpha Unknown family A 2
Entomobryomorpha Unknown family B 1
Hemiptera Cercopidae A 1
Hymenoptera Formicidae A 5
Hymenoptera Myrmiciniae (SB) A 1
Isopoda Oniscidae A 1
Isopoda Philosciidae A 5
Julida Julidae A 2
Gastropoda* Unknown family A 3
Total 14
Total 26
Shannon diversity index = 2.41
PITFALL TRAP 2
Order/Class* Family Species No. of individuals
Araneae Unknown family A 2
Araneae Unknown family C 1
Araneae Unknown family D 4
Araneae Unknown family E 2
Araneae Unknown family F 2
Araneae Unknown family G 1
Araneae Unknown family H 1
Coleoptera Byrrhidae A 1
Coleoptera Carabidae A 1
Coleoptera Carabidae C 3
Coleoptera Curculionidae A 1
Coleoptera Curculionidae B 18
Coleoptera Curculionidae C 2
Coleoptera Curculionidae B 6
Coleoptera Curculionidae D 2
Coleoptera Staphylinidae A 3
Coleoptera Staphylinidae A 2
Coleoptera Staphylinidae B 1
Diptera Fannidae A 1
Entromobryomorpha Unknown family B 1
Entromobryomorpha Unknown family B 1
Hemiptera Cydnidae A 1
Hemiptera Nabidae A 2
Hymenoptera Formicidae A 24
Appendix 3REGISTRATION OF INVERTEBRATES3.4 STEJLEPLADSEN
Superfamily (SP)Subfamily (SB)Uncertainty **

PITFALL TRAP 2 (CONTINUED)
Order/Class* Family Species No. of individuals
Isopoda Armadillidiidae A 78
Isopoda Oniscidae A 48
Isopoda Philosciidae A 138
Isopoda Porcellionidae A 2
Julida Julidae A 17
Lithobiomorpha Lithobiidae A 1
Polydesmida Unknown family A 1
Polydesmida Unknown family A 4
Prostigmata Trombidiidae A 2
Total 30
Total374
Shannon diversity index = 2.14
PITFALL TRAP 3
Order/Class* Family Species No. of individuals
Araneae Unknown family F 1
Araneae Unknown family H 1
Araneae Unknown family I 1
Araneae Unknown family J 1
Araneae Unknown family K 1
Araneae Unknown family L 3
Coleoptera Carabidae B 1
Coleoptera Carabidae C 1
Coleoptera Curculionidae B 2
Coleoptera Staphylinidae A 1
Coleoptera Staphylinidae B 1
Coleoptera Unknown family A 1
Dermaptera Forficulidae A 3
Diptera Fannidae A 2
Diptera Unknown family A 1
Diptera Unknown family B 1
Diptera Unknown family C 1
Gastropoda* Unknown family B 2
Hemiptera Lygaeidae A 1
Hymenoptera Formicidae A 2
Julida Julidae A 28
Polydesmida Unknown family A 4
Total 22
Total 60
Shannon diversity index = 2.24

PITFALL TRAP 4
Order/Class* Family Species No. of individuals
Araneae Unknown family A 1
Araneae Unknown family D 3
Araneae Unknown family E 1
Araneae Unknown family J 2
Araneae Unknown family M 12
Araneae Unknown family N 2
Coleoptera Carabidae C 2
Coleoptera Carabidae D 2
Coleoptera Curculionidae A 1
Coleoptera Curculionidae B 3
Coleoptera Dermastidae A 1
Coleoptera Staphylinidae C 1
Coleoptera Unknown family B 1
Diptera Sacrophagidae A 1
Diptera Unknown family D 1
Diptera Unknown family E 1
Gastropoda* Unknown family A 1
Gastropoda* Unknown family B 3
Gastropoda* Unknown family C 1
Hymenoptera Formicidae A 28
Hymenoptera Ichneumonidae A 1
Isopoda Armadillidiidae A 5
Isopoda Oniscidae A 42
Isopoda Philosciidae A 41
PITFALL TRAP 4 (CONTINUED)
Order/Class* Family Species No. of individuals
Isopoda Porcellionidae A 3
Julida Julidae A 2
Julida Julidae B 1
Lepidoptera Unknown family A 1
Opiliones Unknown family A 1
Total 29
Total165
Shannon diversity index = 2.31
Appendix 3REGISTRATION OF INVERTEBRATES3.4 STEJLEPLADSEN
Superfamily (SP)Subfamily (SB)Uncertainty **

TRANSECT A - 50 m
Order/Class* Family Species No. of individuals
Araneae Unknown family A 2
Araneae Unknown family B 2
Araneae Unknown family C 1
Araneae Unknown family D 1
Araneae Unknown family E 1
Araneae Unknown family F 1
Araneae Unknown family G 1
Coleoptera Bruchninae (SB) A 10
Coleoptera Cleridae A 1
Coleoptera Curculionidae B 2
Coleoptera Curculionidae C 1
Coleoptera Curculionidae A 1
Coleoptera Phalacridae A 3
Coleoptera Phalacridae B 1
Coleoptera Staphylinidae A 1
Diptera Bibioniae A 1
Diptera Unknown family A 1
Hemiptera Aphididae A 1
Hemiptera Lygaeidae A 8
Hemiptera Miridae A 1
Hemiptera Psylicidae A 1
Hemiptera Psylicidae B 7
Hymenoptera Furmicidae A 21
Hymenoptera Tenthredinidae A 1
Lepidoptera Unknown family A 1
TRANSECT A - 50 m (CONTINUED)
Order/Class* Family Species No. of individuals
Stylommatophora Helicidae A 3
Stylommatophora Unknown family A 3
Total 27
Total 78
Shannon diversity index = 2.67

Appendix 3REGISTRATION OF INVERTEBRATES3.4 STEJLEPLADSEN
Superfamily (SP)Subfamily (SB)Uncertainty **
TRANSECT B - 50 m
Order/Class* Family Species No. of individuals
Araneae Unknown family H 1
Araneae Unknown family I 1
Araneae Unknown family J 1
Araneae Unknown family K 1
Araneae Unknown family L 2
Araneae Unknown family M 1
Coleoptera Curculionidae D 2
Coleoptera Curculionidae E 2
Coleoptera Curculionidae F 1
Coleoptera Curculionidae G 1
Dermaptera Forficulidae A 1
Diptera Bibioniae A 22
Diptera Tipulidae A 1
Diptera Tipulidae B 1
Diptera Tipulidae C 1
Diptera Unknown family B 2
Hemiptera Aphididae B 3
Hemiptera Aphididae C 9
Hemiptera Cicadellidae A 1
Hemiptera Lygaeidae A 8
Hemiptera Psylicidae B 3
Hymenoptera Formicidae A 3
Hymenoptera Megalodontesidae A 1
Hymenoptera Mymaridae A 1
TRANSECT B - 50 m (CONTINUED)
Order/Class* Family Species No. of individuals
Lepidoptera Unknown family A 1
Lepidoptera Unknown family B 1
Stylommatophora Helicidae A 1
Total 27
Total 73
Shannon diversity index = 2.65

SWEEP NET - PLOT 2
Order/Class* Family Species No. of individuals
Araneae Unknown family E 1
Araneae Unknown family N 2
Araneae Unknown family O 1
Araneae Unknown family P 1
Araneae Unknown family Q 1
Araneae Unknown family R 1
Araneae Unknown family S 1
Coleoptera Bruchinae (SB) A 1
Diptera Unknown family C 7
Diptera Unknown family D 1
Hemiptera Cicadellidae B 1
Hemiptera Cydnidae A 1
Hemiptera Delphacidae A 1
Hemiptera Delphacidae B 2
Hemiptera Miridae A 4
Hemiptera Miridae B 1
Hymenoptera Formicidae A 1
Isopoda Armadillidiidae A 1
Stylommatophora Helicidae A 2
Stylommatophora Hygromiidae A 4
Total 20
Total 35
Shannon diversity index = 2.73

PITFALL TRAP 2 (CONTINUED)
Order/Class* Family Species No. of individuals
Julida Porcellionidae A 5
Lepidoptera Unknown family A 1
Stylommatophora Unknown family A 5
Stylommatophora Unknown family B 13
Total 30
Total106
Shannon diversity index = 3.08
PITFALL TRAP 2
Order/Class* Family Species No. of individuals
Araneae Unknown family A 3
Araneae Unknown family B 9
Araneae Unknown family C 1
Araneae Unknown family D 5
Araneae Unknown family E 2
Araneae Unknown family F 3
Araneae Unknown family G 5
Coleoptera Carabidae A 2
Coleoptera Carabidae D 8
Coleoptera Curculionidae A 1
Coleoptera Elateridae A 1
Coleoptera Lathridiidae A 1
Coleoptera Staphylinidae A 3
Collembola Entomobryoidea** A 2
Diptera Unknown family B 1
Diptera Unknown family C 2
Diptera Unknown family D 9
Diptera Calliphoridae A 1
Diptera Tipulidae A 1
Gastropoda* Unknown family A 2
Gastropoda* Unknown family B 5
Haplotaxida Lumbricidae A 2
Hymenoptera Formicidae A 3
Isopoda Armadillidiidae A 3
Isopoda Porcellionidae A 7
Appendix 3REGISTRATION OF INVERTEBRATES3.5 NORDHAVNSTIPPEN
Superfamily (SP)Subfamily (SB)Uncertainty **

PITFALL TRAP 3
Order/Class* Family Species No. of individuals
Araneae Unknown family A 2
Araneae Unknown family D 7
Araneae Unknown family E 1
Araneae Unknown family J 5
Coleoptera Byrrhidae A 2
Coleoptera Carabidae B 1
Coleoptera Curculionidae B 1
Coleoptera Staphylinidae B 4
Collembola Entomobryoidea** A 1
Diptera Unknown family E 1
Diptera Unknown family F 1
Diptera Unknown family G 2
Diptera Unknown family H 4
Hymenoptera Formicidae A 20
Isopoda Armadillidiidae A 55
Julida Julidae A 5
Opiliones Unknown family A 1
Opisthopora Lumbricidae A 3
Total 18
Total 116
Shannon diversity index = 1.92
PITFALL TRAP 4
Order/Class* Family Species No. of individuals
Araneae Unknown family C 2
Araneae Unknown family H 1
Araneae Unknown family I 1
Coleoptera Carabidae A 4
Coleoptera Carabidae C 4
Coleoptera Curculionidae B 20
Coleoptera Curculionidae C 1
Coleoptera Staphylinidae C 1
Coleoptera Unknown family A 3
Collembola Entomobryidae A 3
Diptera Empididae A 1
Diptera Muscidae A 1
Diptera Tipulidae B 1
Hymenoptera Chalcidoidea** A 2
Hymenoptera Formicidae A 22
Isopoda Armadillidiidae A 1
Isopoda Oniscidae A 64
Isopoda Philosciidae A 14
Isopoda Porcellionidae A 1
Julida Julidae A 9
Lithobiomorpha Lithobiidae A 1
Prostigmata Lumbricidae A 2
Total 22
Total 159
Shannon diversity index = 2.10

TRANSECT A - 50 m
Order/Class* Family Species No. of individuals
Araneae Unknown family A 1
Araneae Unknown family B 1
Araneae Unknown family C 1
Araneae Unknown family D 1
Araneae Unknown family E 1
Coleoptera Coccinellidae A 1
Diptera Empididae A 4
Diptera Unknown family A 1
Hemiptera Aphididae A 13
Hemiptera Aphididae B 1
Hemiptera Cicadellidae A 32
Hemiptera Lygaeidae A 8
Hemiptera Psyllidae A 1
Hemiptera Psyllidae B 1
Hymenoptera Chalcididae** A 1
Hymenoptera Formicidae A 87
Stylommatophora Helicidae A 1
Stylommatophora Helicidae B 1
Total 18
Total 157
Shannon diversity index = 1.52
TRANSECT B - 50 m
Order/Class* Family Species No. of individuals
Araneae Unknown family F 1
Araneae Unknown family G 1
Araneae Unknown family H 1
Coleoptera Carabidae A 1
Coleoptera Chrysomelidae A 1
Coleoptera Curculionidae A 1
Coleoptera Curculionidae B 1
Diptera Empididae B 3
Diptera Tipulidae A 7
Diptera Unknown family B 1
Hemiptera Aphididae A 2
Hemiptera Aphididae C 51
Hemiptera Lygaeidae A 3
Hemiptera Psyllidae C 1
Hymenoptera Formicidae A 5
Hymenoptera Ichneumonidae A 1
Hymenoptera Ichneumonidae B 1
Hymenoptera Pteromalidae A 1
Lepidoptera Unknown family A 2
Lepidoptera Unknown family B 1
Lepidoptera Unknown family C 1
Total 21
Total87
Shannon diversity index = 1.80
Appendix 3REGISTRATION OF INVERTEBRATES3.5 NORDHAVNSTIPPEN
Superfamily (SP)Subfamily (SB)Uncertainty **

PLOT 2 (CONTINTUED)
Order/Class* Family Species No. of individuals
Diptera Unknown family J 1
Diptera Unknown family K 1
Diptera Unknown family L 1
Hemiptera Aphididae A 1
Hemiptera Cicadellidae B 1
Hemiptera Cydnidae A 3
Hemiptera Delphacidae A 1
Hemiptera Miridae A 1
Hemiptera Nabidae A 1
Hemiptera Unknown family A 1
Hymenoptera Formicidae A 8
Hymenoptera Ichneumonidae C 1
Hymenoptera Trichogrammatidae A 1
Hymenoptera Unknown family A 1
Isopoda Philosciidae A 1
Odonata Coenagriidae A 1
Orthoptera Unknown family A 1
Stylommatophora Hygromiidae A 4
Stylommatophora Unknown family C 11
Stylommatophora Unknown family E 3
Total 47
Total89
Shannon diversity index = 3.40
PLOT 2
Order/Class* Family Species No. of individuals
Araneae Unknown family I 1
Araneae Unknown family J 1
Araneae Unknown family K 2
Araneae Unknown family L 1
Araneae Unknown family M 1
Araneae Unknown family N 1
Coleoptera Bruchninae (SB) C 1
Coleoptera Chrysomelidae B 1
Coleoptera Coccinellidae A 1
Coleoptera Curculionidae C 12
Coleoptera Curculionidae D 2
Coleoptera Curculionidae E 1
Coleoptera Curculionidae F 1
Diptera Fannidae A 5
Diptera Sarcophagidae A 1
Diptera Tipulidae A 1
Diptera Tipulidae B 1
Diptera Tipulidae C 1
Diptera Tipulidae D 1
Diptera Tipulidae E 1
Diptera Unknown family C 2
Diptera Unknown family D 1
Diptera Unknown family E 1
Diptera Unknown family F 1
Diptera Unknown family G 1
Diptera Unknown family H 1
Diptera Unknown family I 1

PITFALL TRAP 1
Order/Class* Family Species No. of individuals
Arachnida* Unknown family A 1
Araneae Unknown family B 3
Araneae Unknown family C 2
Araneae Unknown family D 1
Araneae Unknown family E 1
Araneae Unknown family F 1
Araneae Unknown family G 1
Araneae Unknown family H 1
Araneae Unknown family I 1
Araneae Unknown family J 1
Coleoptera Carabidae A 1
Coleoptera Carabidae C 1
Coleoptera Coccinellidae A 1
Coleoptera Curculionidae A 2
Coleoptera Dytiscidae A 7
Coleoptera Staphylinidae A 3
Coleoptera Staphylinidae B 3
Coleoptera Staphylinidae C 2
Coleoptera Staphylinidae D 1
Coleoptera Staphylinidae E 2
Collembola Entomobryoidea** A 1
Collembola Entomobryoidea** B 1
Collembola Entomobryoidea** C 1
Diptera Unknown family A 3
PITFALL TRAP 1 (CONTINUED)
Order/Class* Family Species No. of individuals
Diptera Unknown family B 2
Diptera Unknown family C 1
Diptera Unknown family D 1
Diptera Unknown family E 3
Diptera Unknown family F 1
Diptera Unknown family G 1
Diptera Unknown family H 4
Diptera Unknown family I 1
Diptera Unknown family J 1
Diptera Unknown family K 1
Gastropoda* Unknown family A 1
Haplotaxida Lumbricidae A 8
Hymenoptera Formicidae A 4
Isopoda Armadillidiidae A 31
Isopoda Oniscidae A 13
Isopoda Philosciidae A 45
Isopoda Porcellionidae A 1
Julida Julidae A 4
Lithobiomorpha Lithobiidae A 1
Polydesmida Polydesmidae A 2
Stylommatophora Helicidae A 1
Total 45
Total 169
Shannon diversity index = 2.86
Appendix 3REGISTRATION OF INVERTEBRATES3.6 AMAGERBANEN
Superfamily (SP)Subfamily (SB)Uncertainty **

PITFALL TRAP 2
Order/Class* Family Species No. of individuals
Araneae Unknown family K 1
Coleoptera Carabidae F 1
Coleoptera Curculionidae A 5
Coleoptera Curculionidae B 1
Coleoptera Unknown family A 1
Collembola Entomobryoidea** B 4
Collembola Entomobryoidea** C 2
Diptera Unknown family L 2
Diptera Unknown family M 1
Diptera Unknown family N 1
Gastropoda* Unknown family B 1
Hemiptera Lygaeidae A 1
Hymenoptera Cynidae A 1
Hymenoptera Formicidae A 19
Total 14
Total 41
Shannon diversity index = 1.95
PITFALL TRAP 3
Order/Class* Family Species No. of individuals
Araneae Unknown family L 25
Araneae Unknown family M 1
Coleoptera Carabidae B 1
Coleoptera Carabidae D 1
Coleoptera Curculionidae A 10
Collembola Mycetophagidae** A 1
Diptera Unknown family N 1
Diptera Unknown family O 1
Hemiptera Aphididae A 4
Hymenoptera Ceraphronidae A 1
Hymenoptera Formicidae A 1
Hymenoptera Ichneumonidae A 1
Julida Julidae A 1
Opiliones Phalangiidae A 2
Opiliones Phalangiidae B 1
Polydesmida Polydesmidae A 4
Total 16
Total 56
Shannon diversity index = 1.95

PITFALL TRAP 4
Order/Class* Family Species No. of individuals
Araneae Unknown family L 3
Araneae Unknown family N 1
Araneae Unknown family O 5
Araneae Unknown family P 2
Coleoptera Carabidae E 1
Coleoptera Curculionidae A 12
Coleoptera Elateridae A 1
Diptera Clusiidae R 1
Diptera Fannidae P 1
Diptera Unknown family P 2
Entomobryomorpha Unknown family B 1
Hemiptera Aphididae B 2
Hemiptera Miridae A 1
Hymenoptera Formiciidae A 72
Lepidoptera Unknown family A 1
Opiliones Phalangiidae A 1
Total 16
Total107
Shannon diversity index = 1.37
Appendix 3REGISTRATION OF INVERTEBRATES3.6 AMAGERBANEN
Superfamily (SP)Subfamily (SB)Uncertainty **
TRANSECT A - 50 m
Order/Class* Family Species No. of individuals
Araneae Unknown family A 6
Araneae Unknown family B 2
Araneae Unknown family C 1
Araneae Unknown family D 1
Araneae Unknown family E 1
Araneae Unknown family F 1
Araneae Unknown family G 1
Coleoptera Coccinellidae A 1
Coleoptera Coccinellidae B 1
Coleoptera Curculionidae A 1
Coleoptera Curculionidae B 1
Coleoptera Curculionidae C 5
Coleoptera Curculionidae D 5
Hemiptera Aphididae A 5
Hemiptera Lygaeidae A 33
Hemiptera Lygaeidae B 1
Hemiptera Unknown family A 13
Hymenoptera Braconidae A 1
Hymenoptera Formicidae A 12
Hymenoptera Ichneumonidae A 1
Hymenoptera Tenthredinidae A 1

TRANSECT A - 50 m (CONTINUED)
Order/Class* Family Species No. of individuals
Hymenoptera Unknown family A 1
Lepidoptera Unknown family A 1
Stylommatophora Helicidae A 1
Total 24
Total97
Shannon diversity index = 2.36
TRANSECT B - 25 m
Order/Class* Family Species No. of individuals
Araneae Unknown family H 1
Araneae Unknown family I 8
Araneae Unknown family J 1
Coleoptera Cantharidae A 1
Coleoptera Chrysomelidae A 1
Coleoptera Coccinellidae C 1
Coleoptera Cucujidae A 1
Coleoptera Curculionidae E 1
Coleoptera Unknown family A 1
Diptera Unknown family A 1
Diptera Unknown family B 1
Hemiptera Anthocoridae A 1
Hemiptera Aradidae A 6
Hemiptera Lygaeidae A 2
Hemiptera Lygaeidae C 3
Lepidoptera Unknown family A 22
Lepidoptera Unknown family B 2
Lepidoptera Unknown family C 2
Lepidoptera Unknown family D 2
Lepidoptera Unknown family E 1
Lepidoptera Unknown family F 1
Total 21
Total60
Shannon diversity index = 2.36
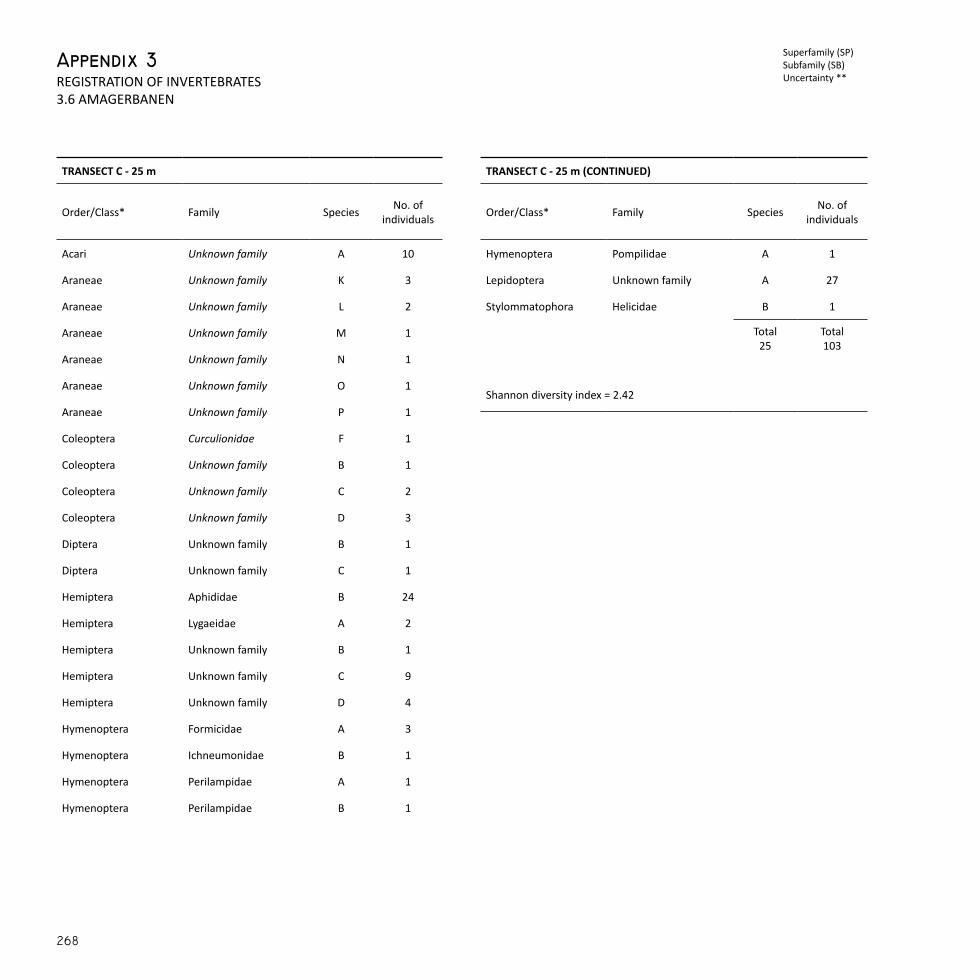
Appendix 3REGISTRATION OF INVERTEBRATES3.6 AMAGERBANEN
Superfamily (SP)Subfamily (SB)Uncertainty **
TRANSECT C - 25 m
Order/Class* Family Species No. of individuals
Acari Unknown family A 10
Araneae Unknown family K 3
Araneae Unknown family L 2
Araneae Unknown family M 1
Araneae Unknown family N 1
Araneae Unknown family O 1
Araneae Unknown family P 1
Coleoptera Curculionidae F 1
Coleoptera Unknown family B 1
Coleoptera Unknown family C 2
Coleoptera Unknown family D 3
Diptera Unknown family B 1
Diptera Unknown family C 1
Hemiptera Aphididae B 24
Hemiptera Lygaeidae A 2
Hemiptera Unknown family B 1
Hemiptera Unknown family C 9
Hemiptera Unknown family D 4
Hymenoptera Formicidae A 3
Hymenoptera Ichneumonidae B 1
Hymenoptera Perilampidae A 1
Hymenoptera Perilampidae B 1
TRANSECT C - 25 m (CONTINUED)
Order/Class* Family Species No. of individuals
Hymenoptera Pompilidae A 1
Lepidoptera Unknown family A 27
Stylommatophora Helicidae B 1
Total 25
Total103
Shannon diversity index = 2.42

PLOT 2
Order/Class* Family Species No. of individuals
Araneae Unknown family I 1
Araneae Unknown family K 1
Araneae Unknown family L 1
Araneae Unknown family Q 1
Araneae Unknown family R 1
Araneae Unknown family S 1
Coleoptera Carabidae A 1
Coleoptera Coccinellidae D 1
Coleoptera Curculionidae A 1
Dermaptera Forficulidae A 1
Diptera Unknown family D 2
Diptera Unknown family E 1
Diptera Unknown family F 1
Diptera Unknown family G 1
Diptera Unknown family H 1
Diptera Unknown family I 1
Hemiptera Aphididae B 7
Hemiptera Cicadellidae A 2
Hemiptera Lygaedidae A 3
Hemiptera Psyllidae A 8
Hymenoptera Formicidae A 6
Hymenoptera Ichneumonidae C 1
Hymenoptera Ichneumonidae D 1
Hymenoptera Myrmaridae A 1
Hymenoptera Myrmicinae (subfamily) A 4
PLOT 2 (CONTINUED)
Order/Class* Family Species No. of individuals
Orthoptera Unknown family A 1
Stylommatophora Helicidae C 2
Total 27
Total53
Shannon diversity index = 2.95

Appendix 4
PLOT 1
Species Cover (%)
Windflower *Japansk Anemone
Anemone japonicaRanuculaceae
43.50
Shepherd’s purseHyrdetaske
Capsella bursa-pastorisBrassicaceae 1.75
Sticky chickweedOpret Hønsetarm
Cerastium glomeratumCaryphyllaceae 0.75
Canada thistleAger-Tidsel
Circium arvenseAsteraceae 0.25
Cranesbill *Pragt-Storkenæb
Geranium himalayenseGeraniaceae 28.00
Wall-lettuceSkovsalat
Mycelis muralisAsteraceae 2.00
Rough meadow-grassAlmindelig Rapgræs
Poa trivialisPoaceae 2.75
Coneflower *Stråle-Solhat
Rudbeckia fulgidaAsteraceae 6.25
Common sage *Staudesalvie
Salvia nemorosaLamiaceae 20.75
Common chickweedAlmindelig Fuglegræs
Stellaria mediaCaryphyllaceae 5.00
DandelionMælkebøtte
Taraxacum sp.Asteraceae 0.50
Total 111.50
Total number of species: 11
Shannon diversity index: 1.63
PLOT 2
Species Cover (%)
Ground elder **Skvalderkål
Aegopodium podagrariaApiaceae 2.50
Wood anemoneHvid Anemone
Anemone nemorosaRanunculaceae 2.50
Rough chervilAlmindelig Hulsvøb
Chaerophyllum temulumApiaceae 0.50
HolewortHulrodet Lærkespore
Corydalis cavaPapaveraceae 7.00
GoosegrassBurre-Snerre
Galium aparineRubiaceae 1.25
Wood avensFeber-Nellikerod
Geum urbanumRosaceae 1.00
Common ivyVedbend
Hedera helixAraliaceae 55.25
Solomon’s sealStor Konval
Polygonatum multiflorumRuscaceae 3.25
Leaf litter - 32.75
Total 106.00
Total number of species: 9
Shannon diversity index: 1.29
REGISTRATION OF VASCULAR PLANTS
4.1 FÆLLEDPARKENHERBACEOUS VEGETATION
Non-native species *Non-native/ naturalised species *nInvasive species **

PLOT 3
Species Cover (%)
Common daisyTusindfryd
Bellis perennisAsteraceae 1.00
Shepherd’s purseHyrdetaske
Capsella bursa-pastorisBrassicaceae 0.25
Red fescue Rød Svingel
Festuca rubraPoaceae 5.00
Perennial ryegrass *nAlmindelig Rajgræs
Lolium perennePoaceae 20.00
Annual meadow-grass *Enårig Rapgræs
Poa annuaPoaceae 62.50
KnotgrassLiggende Vej-Pileurt
P. aviculare ssp. microspermumPolygonaceae 2.25
DandelionMælkebøtte
Taraxacum sp.Asteraceae 0.25
White cloverHvid-Kløver
Trifolium repensFabaceae 1.50
Bare soil - 0.75
Total 100.00
Total number of species: 8
Shannon diversity index: 1.18
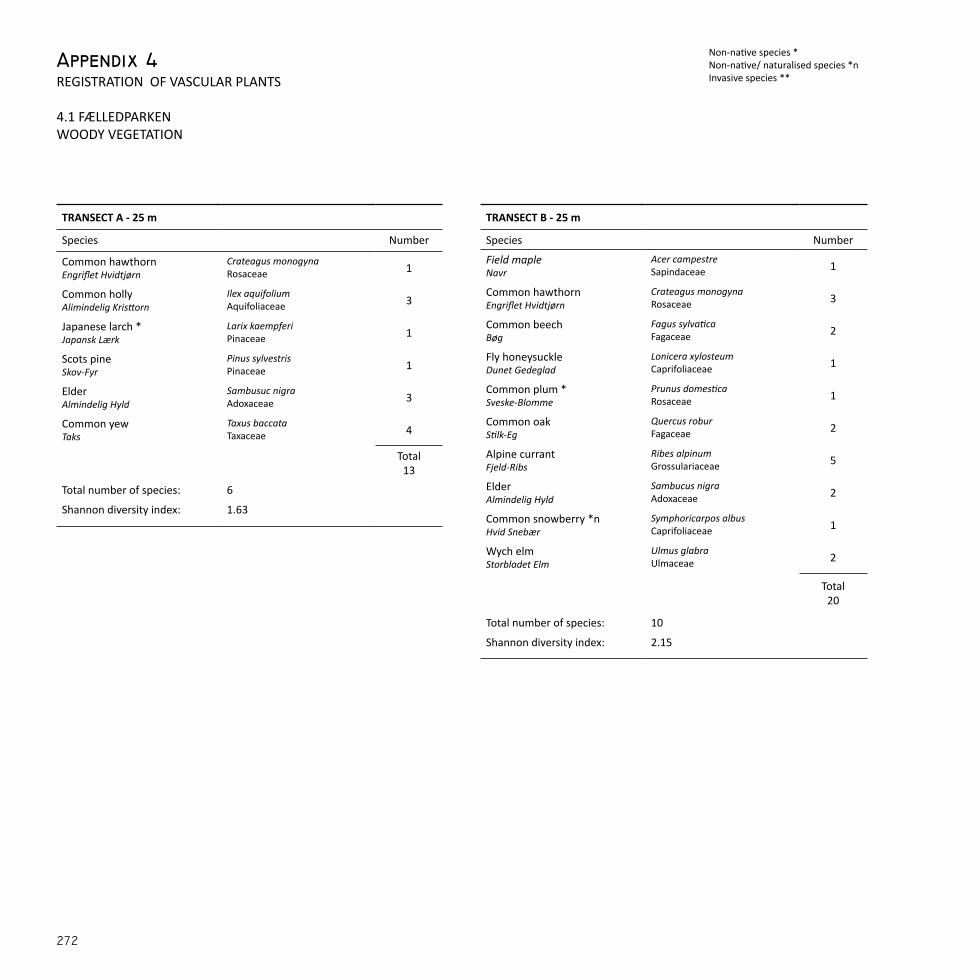
TRANSECT A - 25 m
Species Number
Common hawthornEngriflet Hvidtjørn
Crateagus monogynaRosaceae 1
Common hollyAlimindelig Kristtorn
Ilex aquifoliumAquifoliaceae 3
Japanese larch *Japansk Lærk
Larix kaempferiPinaceae 1
Scots pineSkov-Fyr
Pinus sylvestrisPinaceae 1
Elder Almindelig Hyld
Sambusuc nigraAdoxaceae 3
Common yewTaks
Taxus baccataTaxaceae 4
Total 13
Total number of species: 6
Shannon diversity index: 1.63
TRANSECT B - 25 m
Species Number
Field mapleNavr
Acer campestreSapindaceae 1
Common hawthornEngriflet Hvidtjørn
Crateagus monogynaRosaceae 3
Common beechBøg
Fagus sylvaticaFagaceae 2
Fly honeysuckleDunet Gedeglad
Lonicera xylosteumCaprifoliaceae 1
Common plum *Sveske-Blomme
Prunus domesticaRosaceae 1
Common oakStilk-Eg
Quercus roburFagaceae 2
Alpine currantFjeld-Ribs
Ribes alpinumGrossulariaceae 5
Elder Almindelig Hyld
Sambucus nigraAdoxaceae 2
Common snowberry *nHvid Snebær
Symphoricarpos albusCaprifoliaceae 1
Wych elmStorbladet Elm
Ulmus glabraUlmaceae 2
Total 20
Total number of species: 10
Shannon diversity index: 2.15
Appendix 4REGISTRATION OF VASCULAR PLANTS
4.1 FÆLLEDPARKENWOODY VEGETATION
Non-native species *Non-native/ naturalised species *nInvasive species **

TRANSECT C - 25 m
Species Number
Field mapleNavr
Acer campestreSapindaceae 4
Norway mapleSpids-Løn
Acer platanoidesSapindaceae 1
HornbeamAvnbøg
Carpinus betulusBetulaceae 3
Common hawthornEngriflet Hvidtjørn
Crateagus monogynaRosaceae 4
Oval-leaf privet *Storbladet Liguster
Ligrustrum ovalifoliumOleaceae 2
Alpine currantFjeld-Ribs
Ribes alpinumGrossulariaceae 2
Elder Almindelig Hyld
Sambucus nigraAdoxaceae 6
Wych elmStorbladet Elm
Ulmus glabraUlmaceae 3
Total25
Total number of species: 8
Shannon diversity index: 1.97
TRANSECT D - 25 m
Species Number
Midland hawthornAlmindelig Hvidtjørn
Crataegus lavaleiRosaceae 3
Common beechBøg
Fagus sylvaticaFagaceae 2
Common oakStilk-Eg
Quercus roburFagaceae 1
Elder Almindelig Hyld
Sambucus nigraAdoxaceae 2
Total8
Total number of species: 4
Shannon diversity index: 1.28

PLOT 1
Species Cover (%)
Common daisyTusindfryd
Bellis perennisAsteraceae 0.75
Rough chervilAlmindelig Hulsvøb
Chaerophyllum temulumApiaceae 3.75
Perennial ryegrass *nAlmindelig Rajgræs
Lolium perennePoaceae 18.25
Broadleaf plantain *nGlat Vejbred
Plantago majorPlantaginaceae 2.50
Annual meadow-grass *Enårig Rapgræs
Poa annuaPoaceae 59.25
KnotgrassLiggende Vej-Pileurt
P. aviculare ssp. microspermumPolygonaceae 4.00
Common chickweedAlmindelig Fuglegræs
Stellaria mediaCaryophyllaceae 1.50
DandelionMælkebøtte
Taraxacum sp.Asteraceae 2.75
White cloverHvid-Kløver
Trifolium repensFabaceae 0.50
Bare soil -6.75
Total100.00
Total number of species: 10
Shannon diversity index: 1.37
PLOT 2
Species Cover (%)
Ground elder **Skvalderkål
Aegopodium podagrariaApiaceae 7.50
Wind flower *Høst-Anemone
Anemone sp.Ranunculaceae 19.25
Sweet William *Studenternellike
Dianthus barbatus sp.Caryophyllaceae 1.75
Sweet William *Studenternellike
Dianthus barbatus sp.Caryophyllaceae 6.25
Small flowered willow-herbDunet Dueurt
Epilobium parviflorumOnagraceae 1.75
Wood avensFeber-Nellikerod
Geum urbanumRosaceae 4.25
Gooseneck *Hvid Fredløs
Lysimachia clethroidesPrimulaceae 15.50
Marjoram *Have-Merian
Origanum sp.Lamiaceae 5.50
Great burnetLæge-kvæsurt
Sanguisorba officinalisRosaceae 22.25
DandelionMælkebøtte
Taraxacum sp.Asteraceae 0.25
DandelionMælkebøtte
Taraxacum sp.Asteraceae 0.25
Bare soil -24.00
Total 111.00
Total number of species: 13
Shannon diversity index: 2.09
Appendix 4REGISTRATION OF VASCULAR PLANTS
4.2 ENGHAVEPARKENHERBACEOUS VEGETATION
Non-native species *Non-native/ naturalised species *nInvasive species **

PLOT 3
Species Cover (%)
Common daisyTusindfryd
Bellis perennisAsteraceae 2.50
Perennial ryegrass *nAlmindelig Rajgræs
Lolium perennePoaceae 57.00
Broadleaf plantain *nGlat Vejbred
Plantago majorPlantaginaceae 5.00
Annual meadow-grass *Enårig Rapgræs
Poa annuaPoaceae 34.25
DandelionMælkebøtte
Taraxacum sp.Asteraceae 0.25
White cloverHvid-Kløver
Trifolium repensFabaceae 5.50
Total 100.00
Total number of species: 6
Shannon diversity index: 0.98

TRANSECT A - 25 m
Species Number
Monterey cypress *Monterey Cypres
Cupressus macrocarpa sp.Cupressaceae 4
Tutsan *Bær-Perikon
Hypericum androsaemumHypericaceae 5
St John’s-wort *Kinesisk Perikon
Hypericum hookerianumHypericaceae 1
Common hollyAlimindelig Kristtorn
Ilex aquifoliumAquifoliaceae 1
Oval-leaf privet *Storbladet Liguster
Ligrustrum ovalifoliumOleaceae 1
Chinese bladdernut *Kinesisk Blærenød
Staphylea holocarpaStaphyleaceae 1
Common snowberry * Hvid Snebær
Symphoricarpos albusCaprifoliaceae 1
Fragrant viburnum *Kejserbusk
Viburnum farreriAdoxaceae 2
Leatherleaf viburnum *Rynkeblad
Viburnum rhytidophyllumAdoxaceae 5
Total 21
Total number of species: 9
Shannon diversity index: 1.95
TRANSECT B - 25 m
Species Cover (%)
HornbeamAvnbøg
Carpinus betulusBetulaceae 1
Black locust *Almindelig Robinie
Robinia pseudoacaciaFabaceae 1
Total 2
Total number of species: 2
Shannon diversity index: 0.69
Appendix 4REGISTRATION OF VASCULAR PLANTS
4.2 ENGHAVEPARKENWOODY VEGETATION
Non-native species *Non-native/ naturalised species *nInvasive species **
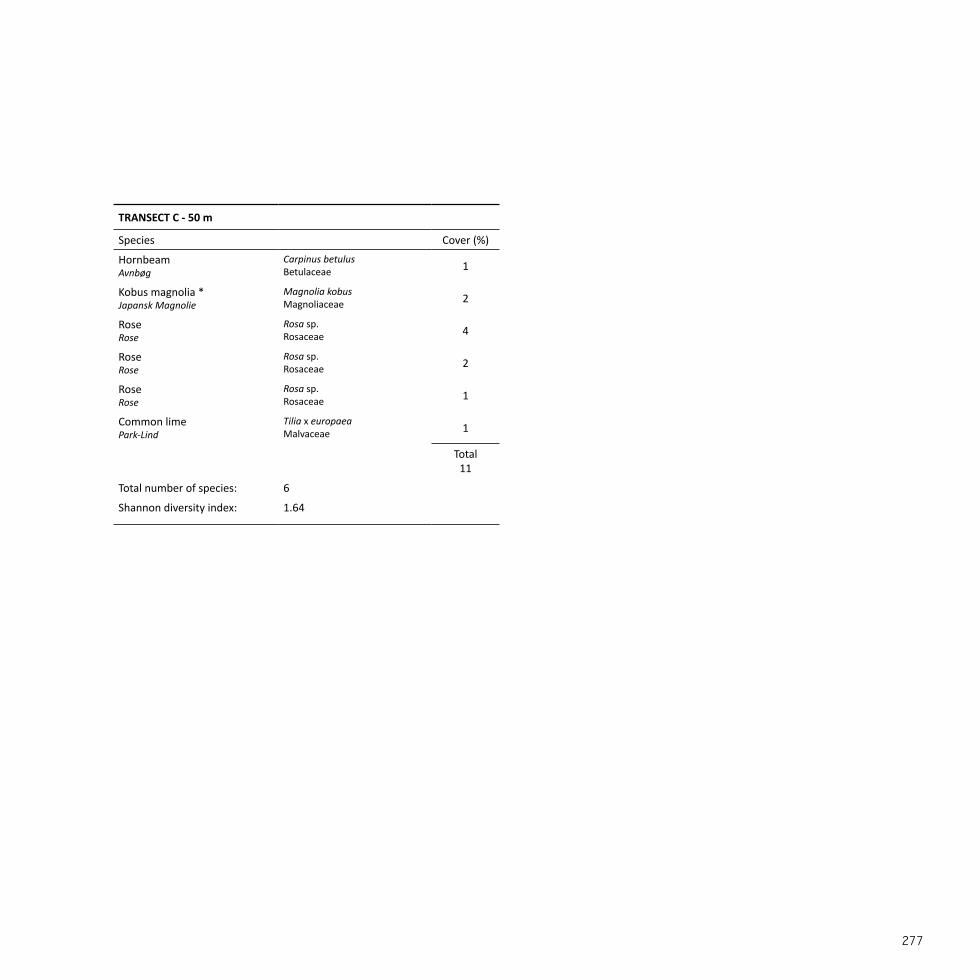
TRANSECT C - 50 m
Species Cover (%)
HornbeamAvnbøg
Carpinus betulusBetulaceae 1
Kobus magnolia *Japansk Magnolie
Magnolia kobusMagnoliaceae 2
RoseRose
Rosa sp.Rosaceae 4
RoseRose
Rosa sp.Rosaceae 2
RoseRose
Rosa sp.Rosaceae 1
Common limePark-Lind
Tilia x europaeaMalvaceae 1
Total11
Total number of species: 6
Shannon diversity index: 1.64

PLOT 1
Species Cover (%)
MugwortGrå-Bynke
Artemisa vulgarisAsteraceae 3.50
Canada thistleAger-Tidsel
Circium arvenseAsteraceae 2.00
Cock’s footAlmindelig Hundegræs
D. glomerata ssp. glomerataPoaceae 33.00
Perennial ryegrass *nAlmindelig Rajgræs
Lolium perennePoaceae 8.75
Common mallow *Rundbladet Katost
Malva neglectaMalvaceae 0.25
Annual meadow-grass *Enårig Rapgræs
Poa annuaPoaceae 13.75
Giant goldenrod **Sildig Gyldenris
Solidago giganteaAsteraceae 2.75
TansyRejnfan
Tanacetum vulgareAsteraceae 6.25
Bare soil -22.25
Small woody plants -25.00
Total117.50
Total number of species: 10
Shannon diversity index: 1.88
PLOT 2
Species Cover (%)
MugwortGrå-Bynke
Artemisa vulgarisAsteraceae 0.25
MossMos
- 14.25
Perennial ryegrass *nAlmindelig Rajgræs
Lolium perennePoaceae 46.75
Black medickHumle-Sneglebælg
Medicago lupulinaFabaceae 1.00
Buckhorn plantainLancet-Vejbred
Plantago lanceolataPlantaginaceae 0.25
Annual meadow-grass *Enårig Rapgræs
Poa annuaPoaceae 23.50
DandelionMælkebøtte
Taraxacum sp.Asteraceae 0.25
Red cloverRød-Kløver
Trifolium pratenseFabaceae 0.50
White cloverHvid-Kløver
Trifolium repensFabaceae 7.75
Bare soil -5.50
Total 100.00
Total number of species: 10
Shannon diversity index: 1.45
Appendix 4REGISTRATION OF VASCULAR PLANTS
4.3 MIMERSPARKENHERBACEOUS VEGETATION
Non-native species *Non-native/ naturalised species *nInvasive species **

PLOT 3
Species Cover (%)
False oat-grassDraphavre
Arrhenatherum elathiusPoaceae 0.25
MugwortGrå-Bynke
Artemisa vulgarisAsteraceae 0.25
Perennial ryegrass *nAlmindelig Rajgræs
Lolium perennePoaceae 27.00
Disc mayweed *Skive-Kamille
Matricaria suaveolensAsteraceae 0.25
Black medickHumle-Sneglebælg
Medicago lupulinaFabaceae 1.25
Broadleaf plantain *Glat Vejbred
Plantago majorPlantaginaceae 0.25
Annual meadow-grass *Enårig Rapgræs
Poa annuaPoaceae 26.75
White cloverHvid-Kløver
Trifolium repensFabaceae 33.00
Bare soil -11.00
Total 100.00
Total number of species: 9
Shannon diversity index: 1.43

TRANSECT A1 - 50 M
Species Number
Snowy mespilus *Almindelig Bærmispel
Amelanchier lamarckiiRosaceae 2
Black walnut *Sort Valnød
Juglans nigraJuglandaceae 1
Alpine currantFjeld-Ribs
Ribes alpinumGrossulariaceae 8
Dog-roseGlat Hunde-Rose
Rosa canina ssp. caninaRosaceae 1
Cinnamon-rose *Maj-Rose
Rosa majalis var. majalisRosaceae 2
RoseRose
Rosa sp.Rosaceae 1
RoseRose
Rosa sp.Rosaceae 1
Elder Almindelig Hyld
Sambucus nigraAdoxaceae 3
Common lilac *Almindelig Syren
Syringa vulgarisOleaceae 4
Total 23
Total number of species: 9
Shannon diversity index: 1.91
TRANSECT A2 - 50 M
Species Number
Bird cherryFugle-Kirsebær
Prunus aviumRosaceae 1
WillowLancetbladet Pil
Salix x smithianaSalicaceae 5
Small-leaved LimeSmåbladet Lind
Tilia cordataMalvaceae 2
Total 8
Total number of species: 3
Shannon diversity index: 0.90
Appendix 4REGISTRATION OF VASCULAR PLANTS
4.3 MIMERSPARKENWOODY VEGETATION
Non-native species *Non-native/ naturalised species *nInvasive species **


PLOT 1
Species Cover (%)
False oat-grassDraphavre
Arrhenatherum elatiusPoaceae 60,00
Cock’s footAlmindelig Hundegræs
D. glomerata ssp. glomerataPoaceae 1,25
Hard fescueBakke-Svingel
Festuca brevipilaPoaceae 2,50
Red fescue *Rød Svingel
Festuca rubraPoaceae 15,00
Reed canary grassRørgræs
Phalaris arudinaceaPoaceae 13,50
Timothy-grassEng-Rottehale
Phleum pratense ssp. pratensePoaceae 1,25
Creeping cinquefoilKrybende Potentil
Potentilla reptansRosaceae 1,00
DandelionMælkebøtte
Taraxacum sp.Asteraceae 0,50
Hop trefoilGul Kløver
Trifolium campestreFabaceae 1,50
Hairy tare *Tofrøet Vikke
Vicia hirsutaFabaceae 6,00
Common vetch *Foder-Vikke
Vicia sativa ssp. sativaFabaceae 4,50
Total107,00
Total number of species: 11
Shannon diversity index: 1,48
PLOT 2
Species Cover (%)
Black bentStortoppet Hvene
Agrostis giganteaPoaceae 8,75
False oat-grassDraphavre
Arrhenatherum elatiusPoaceae 12,50
MossMos
- 6,25
Hammer sedgeHåret Star
Carex hirtaCyperaceae 18,75
Cock’s footAlmindelig Hundegræs
D. glomerata ssp. glomerataPoaceae 8,50
Hemp-agrimonyHjortetrøst
Eupatorium cannabiumPoaceae 0,25
Sheep’s fescueFåre-Svingel
Festuca ovinaPoaceae 5,25
Red fescue *Rød Svingel
Festuca rubraPoaceae 7,50
Reed canary grassRørgræs
Phalaris arudinaceaPoaceae 42,50
Creeping cinquefoilKrybende Potentil
Potentilla reptansRosaceae 8,00
Goat’s beard *Småkronet Gedeskæg
Tragopogon pratensis ssp. minorAsteraceae 1,25
Common nettleStor Nælde
Urtica dioica ssp. dioicaUrticaceae 0,50
Common vetch *Foder-Vikke
Vicia sativa ssp. sativaFabaceae 1,25
Bare soil -3,75
Total 125,00
Total number of species: 10
Shannon diversity index: 1,45
Appendix 4REGISTRATION OF VASCULAR PLANTS
4.4 STEJLEPLADSENHERBACEOUS VEGETATION
Non-native species *Non-native/ naturalised species *nInvasive species **

PLOT 3
Species Cover (%)
Barren bromeGold Hejre
Anisantha sterilisPoaceae 2.75
False oat-grassDraphavre
Arrhenatherum elathiusPoaceae 4.75
MugwortGrå-Bynke
Artemisa vulgaris 4.00
Cock’s footAlmindelig Hundegræs
D. glomerata ssp. glomerataPoaceae 4.25
Couch grassAlmindelig Kvik
Elytrigia repensPoaceae 5.75
Red fescue *Rød Svingel
Festuca rubraPoaceae 7.25
GoosegrassBurre-Snerre
Galium aparineRubiaceae 0.50
Small-flowered cranesbill *nLiden Storkenæb
Geranium pusillumGeraniaceae 3.00
NipplewortHaremad
L.communis ssp. communisAsteraceae 8.00
Common mallow *Almindelig Katost
Malva sylvestris ssp. sylvestrisMalvaceae 3.50
Black medickHumle-Sneglebælg
Medicago lupulinaFabaceae 3.75
Canada bluegrassFladstrået Rapgræs
Poa compressaPoaceae 4.75
Creeping cinquefoilKrybende Potentil
Potentilla reptansRosaceae 31.50
Corn sowthistleAger-Svinemælk
Sonchus arvensisAsteraceae 1.00
Common sowthistle *Almindelig Svinemælk
Sonchus oleraceusAsteraceae
1.75
PLOT 3 (CONTINUED)
Species Cover (%)
TansyRejnfan
Tanacetum vulgareAsteraceae 16.50
Goat’s beard *Småkronet Gedeskæg
Tragopogon pratensis ssp. minorAsteraceae 0.50
Hop trefoilGul Kløver
Trifolium campestreFabaceae 0.50
Common nettleStor Nælde
Urtica dioica ssp. dioicaUrticaceae 2.50
Hairy tare *Tofrøet Vikke
Vicia hirsutaFabaceae 1.00
Common vetch *Foder-Vikke
Vicia sativa ssp. sativaFabaceae 1.25
Bare soil -25.00
Total 133.75
Total number of species: 22
Shannon diversity index: 2.50

TRANSECT A - 50 m
Species Number
Common hawthornEngriflet Hvidtjørn
Crateagus monogynaRosaceae 7
Golden rain *Almindelig Guldgregn
Laburnum anagyroidesFabaceae 13
Apple *Almindelig Æble
Malus domesticaRosaceae 1
Bird cherryFugle-Kirsebær
Prunus aviumRosaceae 1
BlackberryBrombær
Rubus fructicosisRosaceae 3
ElderAlmindelig Hyld
Sambucus nigraAdoxaceae 2
Wych elmStorbladet Elm
Ulmus glabraUlmaceae 3
Total 30
Total number of species: 7
Shannon diversity index: 1.57
TRANSECT B - 50 m
Species Number
Silver birchVorte-Birk
Betula pendulaBetulaceae 2
Common hawthornEngriflet Hvidtjørn
Crateagus monogynaRosaceae 1
Cherry plum *nMirabel
Prunus cerasiferaRosaceae 1
RoseRose
Rosa sp.Rosaceae 1
RoseRose
Rosa sp.Rosaceae 1
ElderAlmindelig Hyld
Sambucus nigraAdoxaceae 2
Total 8
Total number of species: 6
Shannon diversity index: 1.73
Appendix 4REGISTRATION OF VASCULAR PLANTS
4.4 STEJLEPLADSENWOODY VEGETATION
Non-native species *Non-native/ naturalised species *nInvasive species **


PLOT 1
Species Cover (%)
Black bentStortoppet Hvene
Agrostis giganteaPoaceae 13.25
Creeping bentgrassKryb-Hvene
Agrostis stoloniferaPoaceae 12.50
MossMos
- 17.25
Meadow fescueEng-Svingel
Festuca pratensisPoaceae 7.25
Red fescue *Rød Svingel
Festuca rubraPoaceae 11.25
St. John’s-wortPrikbladet Perikon
Hypericum perforatumHyperiaceae 0.25
Birdsfoot trefoilAlmindelig Kællingetand
Lotus corniculatusFabaceae 3.50
Black medickHumle-Sneglebælg
Medicago lupulinaFabaceae 2.75
White sweetclover *nHvid Stenkløver
Melilatus albaFabaceae 0.50
Reed canary grassRørgræs
Phalaris arudinaceaPoaceae 0.75
Canada bluegrassFladstrået Rapgræs
Poa compressaPoaceae 10.75
Common knotweedLiggende Vej-Pileurt
Polygonum aviculare ssp. micro-spermum 1.00
Dandelion Mælkebøtte
Taraxacum sp.Asteraceae 1.00
Dandelion Mælkebøtte
Taraxacum sp.Asteraceae 1.75
PLOT 1 (CONTINUED)
Species Cover (%)
Hop trefoilGul Kløver
Trifolium campestreFabaceae 24.25
White cloverHvid-Kløver
Trifolium repensFabaceae 0.50
Narrow-leaved vetchSmalbladet Vikke
Vicia sativa ssp. nigraFabaceae 0.25
Bare soil -3.50
Total 112.25
Total number of species: 18
Shannon diversity index: 2.31
Appendix 4REGISTRATION OF VASCULAR PLANTS
4.5 NORDHAVNSTIPPENHERBACEOUS VEGETATION
Non-native species *Non-native/ naturalised species *nInvasive species **

PLOT 2 (CONTINUED)
Species Cover (%)
Fowl meadowgrassStortoppet Rapgræs
Poa palustrisPoaceae 10.50
Golden rod Gyldenris
Solidago sp.Asteraceae 4.00
Corymbflower tansy *Kostblomstret Matrem
Tanacetum corymbosum 12.50
Dandelion Mælkebøtte
Taraxacum sp.Asteraceae 0.75
Dandelion Mælkebøtte
Taraxacum sp.Asteraceae 7.75
Dandelion Mælkebøtte
Taraxacum sp.Asteraceae 1.75
Goat’s beard *Småkronet Gedeskæg
Tragopogon pratensis ssp. minorAsteraceae 0.25
Hop trefoilGul Kløver
Trifolium campestreFabaceae 24.00
White cloverHvid-Kløver
Trifolium repensFabaceae 4.00
Hairy tareTofrøet Vikke
Vicia hirsutaFabaceae 16.25
Common vetch *Foder-Vikke
Vicia sativa ssp. sativaFabaceae 1.00
Bare soil -1.75
Total185.25
Total number of species: 28
Shannon diversity index: 2.93
PLOT 2
Species Cover (%)
Common yarrowAlmindelig Røllike
Achillea millefoliumAsteraceae 14.50
False oat-grassDraphavre
Arrhenatherum elatiusPoaceae 17.75
MossMos
- 3.50
Canada thistleAger-Tidsel
Circium arvenseFabaceae 1.25
Cock’s footAlmindelig Hundegræs
Dactylis glomerataPoaceae 2.75
Wild carrot *nVild Gulerod
Daucus carotaApiaceae 2.75
Meadow fescueEng-Svingel
Festuca pratensisPoaceae 6.00
Red fescue *Rød Svingel
Festuca rubraPoaceae 9.50
Common velvetgrassFløjlsgræs
Holcus lanatusPoaceae 3.75
Common St. John’s-wortPrikbladet Perikon
Hypericum perforatumHyperiaceae 2.50
Perennial ryegrass *Almindelig Rajgræs
Lolium perennePoaceae 11.00
Black medickHumle-Sneglebælg
Medicago lupulinaFabaceae 5.00
Tall melilotHøj Stenkløver
Melilotus altissimusFabaceae 0.25
Red bartsiaHøst-Rødtop
Odontites vernus ssp. serotinusOrobanchaceae 0.50
Reed canarygrassRørgræs
Phalaris arundinaceaPoaceae 7.75
Buckhorn plantainLancet-Vejbred
Plantago lanceolataPlantaginaceae 12.00

PLOT 3
Species Cover (%)
Common yarrowAlmindelig Røllike
Achillea millefoliumAsteraceae 1.75
Common daisyTusindfryd
Bellis perennisAsteraceae 0.25
MossMos
- 11.50
Spear thistleHorse-Tidsel
Circium vulgareAsteraceae 0.75
Wild carrot *nVild Gulerod
Daucus carotaApiaceae 5.75
Meadow fescueEng-Svingel
Festuca pratensisPoaceae 5.25
Red fescue *Rød Svingel
Festuca rubraPoaceae 12.00
Perennial ryegrass *Almindelig Rajgræs
Lolium perennePoaceae 19.25
Reed canary grassRørgræs
Phalaris arudinaceaPoaceae 25.00
Buckhorn plantainLancet-Vejbred
Plantago lanceolataPlantaginaceae 3.75
Canada bluegrassFladstrået Rapgræs
Poa compressaPoaceae 18.75
Common meadow-grassEng-Rapgræs
Poa pratensisPoaceae 14.00
Dandelion Mælkebøtte
Taraxacum sp.Asteraceae 0.75
Dandelion Mælkebøtte
Taraxacum sp.Asteraceae 0.75
PLOT 3 (CONTINUED)
Species Cover (%)
Dandelion Mælkebøtte
Taraxacum sp.Asteraceae 0.25
Hop trefoilGul Kløver
Trifolium campestreFabaceae 14.25
Strawberry cloverJordbær-Kløver
Trifolium campestreFabaceae 2.00
White cloverHvid-Kløver
Trifolium repensFabaceae 6.75
Common vetch *Foder-Vikke
Vicia sativa ssp. sativaFabaceae 4.25
Bare soil -1.75
Total 148.75
Total number of species: 20
Shannon diversity index: 2.52
Appendix 4REGISTRATION OF VASCULAR PLANTS
4.5 NORDHAVNSTIPPENHERBACEOUS VEGETATION
Non-native species *Non-native/ naturalised species *nInvasive species **

TRANSECT A - 50 m
Species Number
Pussy willowSelje-Pil
Salix capreaSalicaceae 4
Swedish whitebeamSelje-Røn
Sorbus intermediaRosaceae 1
Total 5
Total number of species: 2
Shannon diversity index: 0.50
TRANSECT B - 50 m
Species Number
Common hawthornEngriflet Hvidtjørn
Crateagus monogynaRosaceae 1
Cherry plum *nMirabel
Prunus cerasiferaRosaceae 2
RoseRose
Rosa sp.Rosaceae 1
Pussy willowSelje-Pil
Salix capreaSalicaceae 6
RowanAlmindelig Røn
Sorbus aucupariaRosaceae 1
Common snowberry *Hvid Snebær
Symphoricarpos albusCaprifoliaceae 1
Wych elmStorbladet Elm
Ulmus glabraUlmaceae 1
Total 13
Total number of species: 7
Shannon diversity index: 1.63
Appendix 4REGISTRATION OF VASCULAR PLANTS
4.5 NORDHAVNSTIPPENWOODY VEGETATION
Non-native species *Non-native/ naturalised species *nInvasive species **

PLOT 1
Species Cover (%)
Common yarrowAlmindelig Røllike
Achillea millefoliumAsteraceae 23.00
MugwortGrå-Bynke
Artemisa vulgarisAsteraceae 0.25
MossMos
- 30.00
Reed grassRørhvene
Calamagrostis spp. 9.75
Cock’s footAlmindelig Hundegræs
D. glomerata ssp. glomerataPoaceae 0.75
Bitter fleabaneBitter Bakkestjerne
Erigeron acerAsteraceae 2.00
Sun spurge *nSkærm-Vortemælk
Euphorbia heliscopiaEuphorbiaceae 0.50
Red fescue *Rød Svingel
Festuca rubraPoaceae 9.50
Common cow-wheatAlmindelig Kohvede
Melampyrum pratenseScropphulariaceae 4.75
Tall melilotHøj Stenkløver
Melilotes altissimusFabaceae 0.25
Field forget-me-not *nMark-Forglemmigej
Myosotis arvensisBoraginaceae 2.50
Parsnip **Pastinak
Pastinaca sativa var. sativaApiaceae 0.50
Mouseear hawkweedHåret Høgeurt
Pilosella officinarumAsteraceae 8.25
Buckhorn plantainLancet-Vejbred
Plantago lanceolataPlantaginaceae 15.50
Rough meadow-grassAlmindelig Rapgræs
Poa trivialisPoaceae 27.50
PLOT 1 (CONTINUED)
Species Cover (%)
European goldenrodAlmindelig Gyldenris
Solidago virgaureaAsteraceae 0.50
DandelionMælkebøtte
Taraxacum sp.Asteraceae 0.25
Goat’s beard *Småkronet Gedeskæg
Tragopogon pratensis ssp. minorFabaceae 1.50
Hop trefoilGul Kløver
Trifolium campestreFabaceae 27.00
Narrow-leaved vetchSmalbladet Vikke
Vicia sativa spp. nigraFabaceae 3.75
Total168.00
Total number of species: 20
Shannon diversity index: 2.31
Appendix 4REGISTRATION OF VASCULAR PLANTS
4.6 AMAGERBANENHERBACEOUS VEGETATION
Non-native species *Non-native/ naturalised species *nInvasive species **

PLOT 2
Species Cover (%)
Garlic mustardLøgkarse
Allaria petiolataBrassicaceae 2.75
Cow parsleyVild Kørvel
Anthriscus sylvestrisApiaceae 4.75
Rough chervilAlmindelig Hulsvøb
Chaerophyllum temulumApiaceae 4.00
GoosegrassBurre-Snerre
Galium aparineRubiaceae 4.25
Wood avensFeber-Nellikerod
Geum urbanumRosaceae 5.75
White nettle *nDøvnælde
Lamium albumLamiaceae 7.25
Bare soil -0.50
Total 102.50
Total number of species: 7
Shannon diversity index: 1.29
PLOT 3
Species Cover (%)
Ground elder *Skvalderkål
Aegopodium podagrariaApiaceae 11.50
Garlic mustardLøgkarse
Allaria petiolataBrassicaceae 2.50
Cow parsleyVild Kørvel
Anthriscus sylvestrisApiaceae 1.25
False oat-grassDraphavre
Arrhenatherum elatiusPoaceae 0.75
Rough chervilAlmindelig Hulsvøb
Chaerophyllum temulumApiaceae 52.50
GoosegrassBurre-Snerre
Galium aparineRubiaceae 2.75
Wood avensFeber-Nellikerod
Geum urbanumRosaceae 14.25
Giant hogweed **Kæmpe Bjørneklo
Heracleum mantegazzianumApiaceae 1.25
NipplewortHaremad
L. communis ssp. communisAsteraceae 1.00
Bare soil -15.75
Total 103.50
Total number of species: 10
Shannon diversity index: 1.52

TRANSECT A - 50 m
Species Number
Silver birchVorte-Birk
Betula pendulaBetulaceae 1
Downy birchDun-Birk
Betula pubescensBetulaceae 9
Common hawthornEngriflet Hvidtjørn
Crateagus monogynaRosaceae 1
Dog roseGlat Hunde-Rose
Rosa canina ssp. caninaRosaceae 1
BlackberryBrombær
Rubus fructicosisRosaceae 4
Pussy willowSejle-Pil
Salix capreaSalicaceae 5
Wych elmStorbladet Elm
Ulmus glabraUlmaceae 1
Total 22
Total number of species: 7
Shannon diversity index: 1.57
TRANSECT B - 25 m
Species Number
Field mapleNavr
Acer campestreSapindaceae 2
Common hawthornEngriflet Hvidtjørn
Crateagus monogynaRosaceae 2
Cherry plum *nMirabel
Prunus cerasiferaRosaceae 14
ElderAlmindelig Hyld
Sambucus nigraAdoxaceae 1
Total 19
Total number of species: 4
Shannon diversity index: 0.85
Appendix 4REGISTRATION OF VASCULAR PLANTS
4.6 AMAGERBANENWOODY VEGETATION
Non-native species *Non-native/ naturalised species *nInvasive species **

TRANSECT C - 25 m
Species Number
Field mapleNavr
Acer campestreSapindaceae 5
Common hawthornEngriflet Hvidtjørn
Crateagus monogynaRosaceae 2
Crab appleSkov-Æble
Malus sylvestrisRosaceae 1
Armenian blackberry *Armensk Brombær
Rubus armeniacusRosaceae 1
RowanAlmindelig Røn
Sorbus aucupariaRosaceae 1
Total 10
Total number of species: 5
Shannon diversity index: 1.36
