a validation study of transgenerational effects of ...ftp.iza.org/dp7999.pdf · a validation study...
TRANSCRIPT

DI
SC
US
SI
ON
P
AP
ER
S
ER
IE
S
Forschungsinstitut zur Zukunft der ArbeitInstitute for the Study of Labor
A Validation Study of Transgenerational Effects ofChildhood Conditions on the Third Generation Offspring’s Economic and Health OutcomesPotentially Driven by Epigenetic Imprinting
IZA DP No. 7999
February 2014
Gerard J. van den BergPia R. Pinger

A Validation Study of Transgenerational Effects of Childhood Conditions on the Third Generation Offspring’s Economic
and Health Outcomes Potentially Driven by Epigenetic Imprinting
Gerard J. van den Berg University of Mannheim,
IFAU-Uppsala, VU University Amsterdam and IZA
Pia R. Pinger University of Bonn
and IZA
Discussion Paper No. 7999 February 2014
IZA
P.O. Box 7240 53072 Bonn
Germany
Phone: +49-228-3894-0 Fax: +49-228-3894-180
E-mail: [email protected]
Any opinions expressed here are those of the author(s) and not those of IZA. Research published in this series may include views on policy, but the institute itself takes no institutional policy positions. The IZA research network is committed to the IZA Guiding Principles of Research Integrity. The Institute for the Study of Labor (IZA) in Bonn is a local and virtual international research center and a place of communication between science, politics and business. IZA is an independent nonprofit organization supported by Deutsche Post Foundation. The center is associated with the University of Bonn and offers a stimulating research environment through its international network, workshops and conferences, data service, project support, research visits and doctoral program. IZA engages in (i) original and internationally competitive research in all fields of labor economics, (ii) development of policy concepts, and (iii) dissemination of research results and concepts to the interested public. IZA Discussion Papers often represent preliminary work and are circulated to encourage discussion. Citation of such a paper should account for its provisional character. A revised version may be available directly from the author.

IZA Discussion Paper No. 7999 February 2014
ABSTRACT
A Validation Study of Transgenerational Effects of Childhood Conditions on the Third Generation Offspring’s Economic and Health Outcomes Potentially Driven by Epigenetic Imprinting*
At the crossroads of economics and human biology, this paper examines the extent to which pre-puberty nutritional conditions in one generation affect productivity-related outcomes in later generations. Recent studies have found a negative association between conditions at ages 8-12 and the grandchild’s over-all and cardiovascular and diabetes mortality in a single historical dataset. It has been argued that this association reflects epigenetic imprinting, which has been corroborated in animal studies. We provide an external validation by analyzing the impact of the German famine of 1916-1918 on children and grandchildren of those exposed to the famine at ages 8-12. Our findings support and extend the evidence so far. Among the third generation, males (females) tend to have higher mental health scores if their paternal grandfather (maternal grandmother) was exposed. We do not find robust effects on the probability of obtaining an upper secondary education. JEL Classification: I12, J11 Keywords: famine, transgenerational transmission, epigenetics, mental health, education,
long-run effects, nutrition, intergenerational effects, slow-growth period Corresponding author: Gerard J. van den Berg Department of Economics University of Mannheim L7, 3–5 68131 Mannheim Germany E-mail: [email protected]
* We thank Denny Vågerö, George Davey Smith, Jim Heckman, Anders Björklund, Timo Hener, Jean-Marc Robin and participants of the IZA Summer School for useful comments.

1 Introduction
In this paper we validate and extend findings in a recent set of exciting studies on the
transgenerational impact of nutritional shocks, where the mechanism plausibly runs via
epigenetic imprinting. Recently, epigenetics has become a focal point in medical, biological
and epidemiological research on the long run effects of nutrition, stress and other early life
circumstances (see Graff and Mansuy, 2008, Masterpasqua, 2009, Lundborg and Stenberg,
2010, Hochberg et al., 2011, Kuzawa and Thayer, 2011, and Low et al., 2012, for overview
articles). Epigenetics is defined as the process by which patterns of gene expression are
modified through methylation of the chromatin. Methylation involves the addition of a
methyl group to the DNA base, which can turn down a gene’s activity or switch it off
entirely. This may be driven by environmental shocks such as exposure to malnutrition or
stress. In this context, the possibility of transgenerational transmission is particularly inter-
esting (see e.g. Harper, 2005, Graff and Mansuy, 2008, Masterpasqua, 2009, Grossniklaus
et al., 2013). Epigenetic imprinting is the phenomenon that shortly after conception, when
stem cells are formed, some of the methyl tags from previous generations remain, causing
heritable changes in gene functioning that are not driven by changes in the DNA sequence.
Methyl markers are passed on through the germ line, with potentially different expressions
of the maternal and paternal alleles in the offspring. Epigenetic modifications may depend
on the sex of the parent who transmits it and can lead to transgenerational non-genetic
inheritance of lifetime experiences across generations (Hochberg et al., 2011).
So far, most of the empirical evidence on epigenetic transgenerational transmission in
mammals stems from animal experiments on mice and rats. Research with human probands
is rare. Evidence focusing on later-life health and cognitive outcomes among offspring has to
rely on non-experimental data, which leads to identification problems if parental conditions
are endogenously related to unobserved characteristics that also influence outcomes in
another way. To identify causal effects of food deprivation on subsequent generations, one
needs to observe an exogenous shock in nutrition in the first generation as well as the
relevant outcomes in subsequent generations. By now, a consensus has emerged that the
study of transgenerational epigenetic inheritance that is induced by environmental shocks
early in life requires the observation of at least three generations (see Grossniklaus et al.,
2013). After all, effects of parental exposure to environmental shocks on their children’s
health may not only run through an epigenetic pathway but can have many other biological
and behavioral explanations. Moreover, environmental shocks during pregnancy affect the
mother, the fetus, and the fetus’s primordial germ cells that will produce the grandchildren
of the mother. Along these lines, it is particularly interesting to consider environmental
shocks that may occur before reproductive ages, and to simultaneously analyze any effects
2
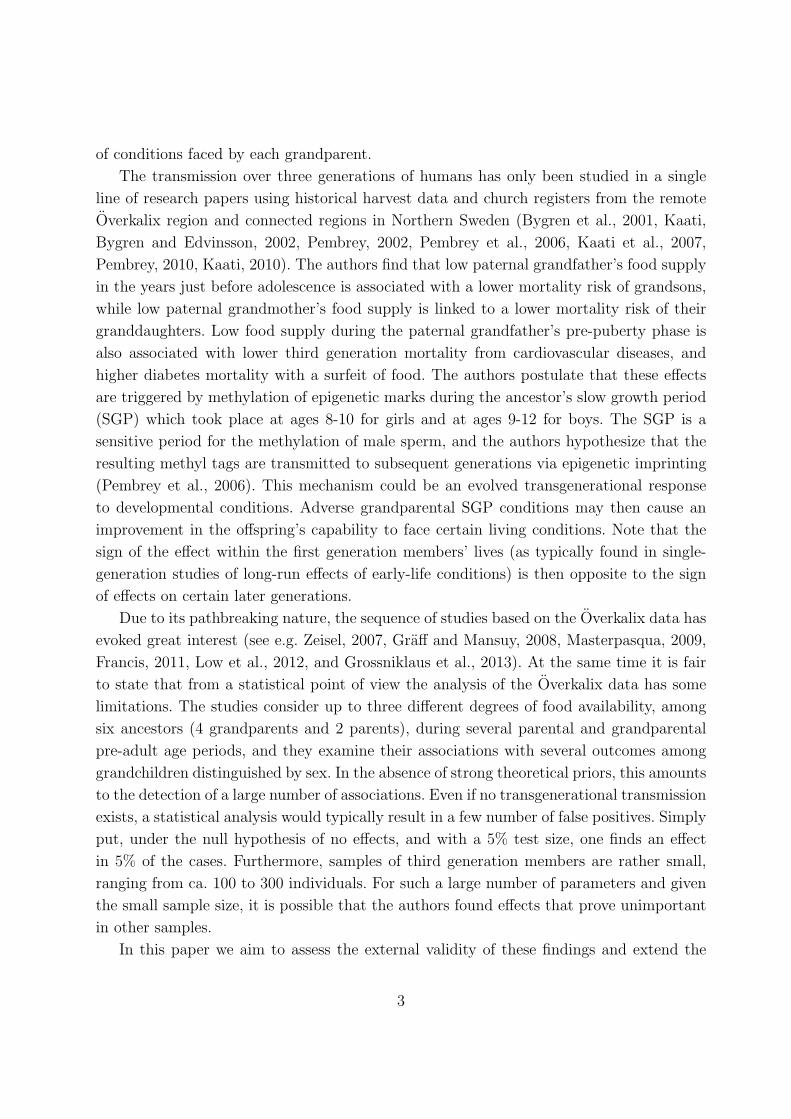
of conditions faced by each grandparent.
The transmission over three generations of humans has only been studied in a single
line of research papers using historical harvest data and church registers from the remote
Overkalix region and connected regions in Northern Sweden (Bygren et al., 2001, Kaati,
Bygren and Edvinsson, 2002, Pembrey, 2002, Pembrey et al., 2006, Kaati et al., 2007,
Pembrey, 2010, Kaati, 2010). The authors find that low paternal grandfather’s food supply
in the years just before adolescence is associated with a lower mortality risk of grandsons,
while low paternal grandmother’s food supply is linked to a lower mortality risk of their
granddaughters. Low food supply during the paternal grandfather’s pre-puberty phase is
also associated with lower third generation mortality from cardiovascular diseases, and
higher diabetes mortality with a surfeit of food. The authors postulate that these effects
are triggered by methylation of epigenetic marks during the ancestor’s slow growth period
(SGP) which took place at ages 8-10 for girls and at ages 9-12 for boys. The SGP is a
sensitive period for the methylation of male sperm, and the authors hypothesize that the
resulting methyl tags are transmitted to subsequent generations via epigenetic imprinting
(Pembrey et al., 2006). This mechanism could be an evolved transgenerational response
to developmental conditions. Adverse grandparental SGP conditions may then cause an
improvement in the offspring’s capability to face certain living conditions. Note that the
sign of the effect within the first generation members’ lives (as typically found in single-
generation studies of long-run effects of early-life conditions) is then opposite to the sign
of effects on certain later generations.
Due to its pathbreaking nature, the sequence of studies based on the Overkalix data has
evoked great interest (see e.g. Zeisel, 2007, Graff and Mansuy, 2008, Masterpasqua, 2009,
Francis, 2011, Low et al., 2012, and Grossniklaus et al., 2013). At the same time it is fair
to state that from a statistical point of view the analysis of the Overkalix data has some
limitations. The studies consider up to three different degrees of food availability, among
six ancestors (4 grandparents and 2 parents), during several parental and grandparental
pre-adult age periods, and they examine their associations with several outcomes among
grandchildren distinguished by sex. In the absence of strong theoretical priors, this amounts
to the detection of a large number of associations. Even if no transgenerational transmission
exists, a statistical analysis would typically result in a few number of false positives. Simply
put, under the null hypothesis of no effects, and with a 5% test size, one finds an effect
in 5% of the cases. Furthermore, samples of third generation members are rather small,
ranging from ca. 100 to 300 individuals. For such a large number of parameters and given
the small sample size, it is possible that the authors found effects that prove unimportant
in other samples.
In this paper we aim to assess the external validity of these findings and extend the
3

analysis to schooling and mental health outcomes. Specifically, we examine adult outcomes
of subsequent generations following first-generation exposure to the severe German famine
of 1916-1918 during the slow growth period. Clearly, any external validation requires un-
usual data, containing the date of birth of the first generation as well as relevant outcome
measures for the third generation. Currently available administrative register data do not
date back sufficiently far to meet these requirements. The same applies to longitudinal
panel survey data. However, surveys may gather retrospective information obtained from
second or third generation individuals about the relevant variables from the first generation.
This is the approach we follow in this paper. We use data from the German Socioeconomic
Panel (SOEP), a large longitudinal household panel since 1986 that is representative for the
German population. The data allow us to identify whether a first generation of individuals
(usually the parents of SOEP respondents) was exposed to the famine during the SGP.
Furthermore, they contain information on a wide range of health information, longevity,
education and economic outcomes for the second and third generation. We expect a first-
generation individual’s famine exposure during the SGP to be positively associated with
favorable second and, in particular, favorable third generation outcomes. Furthermore, if
famine exposure during SGP affects methylation of the male gametes but not the female
ones, we expect only male SGP famine exposure to affect offspring results.1 Moreover,
any causal impact of the famine, epigenetic or not, should be stronger for individuals who
suffered from the famine for a longer period of time during their SGP.
As an exogenous shifter of nutritional conditions in the SGP, the German famine has
several advantages. Specifically, it is well documented, it was severe, and it is sharply
delineated in time. Yet, its usage also involves two limitations. First, following the famine,
Germany was hit by the Spanish influenza, so that famine and influenza effects are hard
to disentangle. Secondly, the famine was a single event, so that exposure during the SGP
is equivalent to birth around 1907. Historical events, including World War II, may have
affected the SGP famine cohort differently than adjacent cohorts. A number of additional
empirical issues are common across studies of transgenerational effects. Notably, the study
of three consecutive generations of a family requires that family members of the first
two generations survive until reproductive ages and that they actually get children. This
condition may be selective in that it relates to evolutionary fitness. We deal with many of
these issues by carefully selecting the multigenerational sample and by estimating models
that include a large number of indicators of secular changes in society and background
controls.
Notice that the third-generation individuals in our sample are too young to have died of
a natural cause so that we cannot study third-generation mortality outcomes. Instead, we
1The female oocytes fully develop during fetal development.
4

examine adult height, adult mental health outcomes, as well as the highest attained level of
education. Adult height is a universally accepted summary measure of pre-adult conditions
that influence late-life health outcomes, notably longevity (Waaler, 1984, Steckel, 2008).
It has been shown to be sensitive to nutritional deficits in the SGP (see van den Berg et
al., 2009). Mental health has been shown to be particularly sensitive to epigenetic changes
and it has been argued that it is also sensitive to epigenetic imprinting (see the above
overview articles as well as McGowan et al. (2008) and Radtke et al. (2011)). Moreover,
just like mortality and cardiovascular disease, the mental health outcome has been shown
to be sensitive to early-life conditions (see Lumey et al. (2011) for a systematic overview
of the evidence on the effects of in utero exposure to famines on schizophrenia and other
mental disorders). Alternative potentially important health outcomes such as dementia
or cardiovascular diseases are virtually absent in the third generation up to the end of
the observation window, so that we cannot analyze them. Education is closely linked to
cognitive and noncognitive skills and to social class. It is not clear why this outcome should
reflect epigenetic imprinting, but as a determinant of economic well-being later in life it
is interesting to consider it nevertheless. Moreover, cognitive skills at high ages have been
shown to depend on early-life conditions, and the underlying mechanism may be related
to the dependence of cardiovascular diseases on early-life conditions (Doblhammer et al.,
2013).2 Concerning the second generation, we also investigate late-life mortality and adult
height.
Like the Overkalix data, our data lack information on methylation patterns. This means
that even if the transgenerational associations that we focus on all have the expected sign
and significance, it can not be completely ruled out that other transgenerational mecha-
nisms are also at play. In particular, exposure to a famine at pre-pubertal age may lead
to more mature behavior. Elder (1999), investigating the impact of the Great Depression
on children born in 1920-1921, finds that economic hardship around the age of 10 leads
to more resilience and psychological strength. This may translate into a different style of
upbringing of children. However, if such a mechanism is important then we expect it to
lead to stronger effects on the second generation than on the third.
The paper proceeds as follows. Section 2 discusses recent developments in relevant
branches of literature. Section 3 describes the 1916-1918 famine and summarizes the ex-
2To avoid confusion, notice that it is not an aim of our paper to study long-run effects of in-uteroexposure to adverse conditions on the health of the individual him- or herself. As mentioned above, suchconditions are known to lead to epigenetic changes (see e.g. Heijmans et al., 2008, and Tobi et al., 2009,for evidence on individuals exposed to the Dutch hunger winter around birth). It is not inconceivable thatthese are transgenerational. Heijmans et al. (2008) find different methylation levels of several genes almost60 years after exposure, compared to unexposed siblings. Potentially, this could be inherited by subsequentgenerations.
5

isting empirical evidence on its impact. Section 4 describes the empirical approach. We
discuss a range of selection issues that may affect the results and that may have plagued
the existing evidence. In Section 5 we describe our data. Section 6 presents our main
findings. We investigate how results change if we extend the basic set of covariates with
additional background variables that potentially account for non-biological pathways. We
also present robustness checks in which the famine intensity is taken into account and its
presumed time interval is adjusted. Section 7 concludes.
2 Epigenetic Imprinting
The logic behind epigenetics is evolutionary, but it potentially has important implications
for the effects of health interventions and the economic modeling of human capital forma-
tion. Epigenetic marks play an important role in normal development because methylation
patterns determine how stem cells develop into certain types of tissue which then maintain
cell identity over the lifetime of an individual. In addition, epigenetic alterations cause
gene regulation and changing phenotypes, and thus help cells to adopt to different pur-
poses or environments in an evolutionary manner. Such epigenetic patterns are formed over
the entire life-course (Fraga et al., 2005) and are strongly influenced by nutritional shocks
(Heijmans et al., 2008, Tobi et al., 2009). Scientific evidence suggests that several health
dimensions are related to epigenetic modifications. Epigenetics play an central role for the
development of cancer cells and cardiovascular diseases and thus determine old-age mor-
tality in humans (Ordovas and Smith, 2010, Jones and Baylin, 2002). Moreover, epigenetic
changes influence mental health and cognition (Graff and Mansuy, 2008, McGowan et al.,
2008, Radtke et al., 2011).
Epigenetic imprinting and epigenetic inheritance imply that adaptive methylation pat-
terns in one generation influence gene expression in the next. How such epigenetic trans-
missions or inheritance in humans works biologically is not fully resolved (Harper, 2005).
Shortly after conception, when the first cell divisions are taking place, the stem cells are
generally cleared of all methylation (Farooq, 2010, Mayer et al., 2000). However, if epige-
netic modifications take place on the part of the genome that is genetically imprinted, this
could explain sex-specific epigenetic inheritance. ’Imprinted genes’ keep their methyl tags
(about 1% of genes), which function as a biological marker to flag up their maternal or pa-
ternal origin (Masterpasqua, 2009). Epigenetic inheritance may thus be a biological means
for humans to adopt to changing environments and to transmit environmental information
to the next generation.
Kaati and co-authors argue that the slow growth period of a child may be a sensitive
6

period for epigenetic modifications on the male gametes and thus for epigenetic imprinting.3
In this period, the first sperm cells mature, which may make it an important period for
the reprogramming of methylation imprints (Pembrey, 2002). The latter part of this period
of childhood is also known as the ’fat spurt’: growth is low and the body is accumulating
reserves for in anticipation of the puberty-related development spurt (Marshall and Tanner,
1968, Gasser et al., 1994, Gasser, 1996). Therefore is plausible that limited food availability
during pre-adolescence leads to worse pubertal development and to epigenetic modifications
on the sperm or egg.4
It is perhaps fair to state that economists and social scientists are more interested in
whether adverse experiences can be transmitted non-genetically from one generation to the
next than in underlying biological mechanisms.5 Any non-genetic biological transmission
of experiences would revolutionize economic thinking about transgenerational transmis-
sion and human capital accumulation in at least two ways. First, if life experiences were
transmitted not only via upbringing and social circumstance but also biologically, from one
generation to the next, this would imply that the costs and benefits of any policy measure
would have to be re-evaluated to include such biological effects on subsequent genera-
tions. Second, it would imply that nature (genetic predisposition) and nurture (upbring-
ing) are inseparable, and the long-fought nature-nurture debate would become obsolete.
Future models of human capital investment would need to account for gene expressions
and gene-environment interactions as well as for critical and sensitive periods of epigenetic
transmission.
3 The Famine
The World War I famine which we use to study the effects of an exogenous variation in
nutrition among the first generation was sharply delineated in time and extremely severe.
In fact, it is said to be the severest famine experienced in Europe outside of Russia since
Ireland’s travail in the 1840s (Raico, 1989). At the end of the war, the German ’Reichsge-
sundheitsamt’ (Health Office) calculated that 763,000 German civilians died from starva-
3Indeed, this growth period has previously been found to be a sensitive period for development. Sparenet al. (2004) find that a famine at this age increases cardiovascular problems later in life and Lindeboomet al. (2010) and van den Berg et al. (2009) find this age period to be a sensitive period for life expectancyand adult height, respectively.
4So, effects along the female line could also be driven by maternal nutrition during SGP. Indeed, micemodels indicate that epigenetic imprinting may take place along the female germline (Cooney, 2006).
5For an overview of molecular genetics and economics see Lundborg and Stenberg (2009). For the roleof epigenetics in psychology see Harper (2005).
7

tion.6 The period of food scarcity started in June 1915 when bread began to be rationed.
In early 1916, food rationing became severe. From 1916 to mid-1919, the German popu-
lation on average had to live on less than 1500 calories per day (Starling, 1919). Because
the portion of bran in the bread was very large, the caloric value was further reduced by
about 15 to 20 percent.7 Most Germans had to live on a meagre diet of dark bread, slices of
sausage without fat, three points of potatoes per week and turnips (Vincent, 1985). Table 1
displays an overview over the amount of food consumed during the famine as compared to
prewar times.8 While these amounts are well below subsistence to begin with, the situation
was aggravated by the mere length of the famine which started in 1916 and extended into
1919. At the height of the famine, purchasing foodstuffs on the black market was the only
way to prevent starvation. Black market prices in cities skyrocketed (see Table A.2) and
many families had to rely on excursions to the countryside to feed their children.
Four factors led to the extreme shortage of food. First, by mid-1916 the Allied Powers
had successfully enacted a complete naval blockade of Germany restricting the maritime
supply of raw materials and foodstuffs. Before the war Germany had imported one third
of its food, but after the blockade Germany was cut from foodstuff imports of all sorts:
fodder for livestock, grain and potatoes. The blockade continued even after the Armistice
and until June 1919 to force Germany to sign the Treaty of Versailles. In fact, throughout
1919 rationing was maintained in many parts of the country at a rate of 1000-1300 calories
per day (Vincent, 1985).9
Second, due to the general war mobilization, around 40% of the male agricultural
labor force was absent, with a similar fraction of horses and cattle. This reduction in
the male work force was not adequately compensated by employment of prisoners of war,
women, adolescents and children (Huber and Fogel, 1920). As a consequence, between 1913
and 1919, annual production of crops, potatoes and milk decreased to about 50% when
compared to pre-war levels (Blum, 2011).
Third, in the summer of 1916, the root crop and grain harvest were particularly bad
and the potato crop failed almost completely. The latter was particularly detrimental,
because much of the German food supply was based on potatoes and during the war more
agricultural crop land had been shifted away from turnip cultivation and towards potatoes
(Klein, 1968). The Winter of 1916-1917 thus marked the peak of the famine and is today
6The overall population of the German empire at that time was about 65 million. In addition there wereabout 2 million military deaths, who in a conventional ground-based war like World War I, were almostexclusively men of age 17-60.
7Typically, a man needs about 2500 calories a day and a women about 2000.8For further evidence see Table A.1.9The reason for continued food rationing was that even after the end of the blockade in June 1919
Germany could not import freely, since all funds had to be saved for war reparations.
8

remembered as the ’turnip winter’ (Steckrubenwinter), because the only food in sufficient
supply during that winter were turnips.
Last, food storage was a concern. Before the war most of the potato crop was stored
in the countryside and only supplied to the cities on demand. After the start of the war,
transportation and dislocation became more difficult, and potatoes had to be stored in
larger quantities by individuals unschooled in the proper techniques of storage, which led
to spoilage and waste (Vincent, 1985).
Table 1: Food consumption before and duringthe famine
Item Before War During Famine
Calories 2280 per day 1313 per dayProtein 70g per day 30-40g per dayFat 70g per day 15-20g per dayBread 225g a) per day 160g per dayMeat 1050g per week 135g per weekPotatoes 100% 71%Grain 100% 53%Sugar 100% 49%Vegetable oil 100% 39%Meat 100% 31%Butter 100% 22%Eggs 100% 18%Pulse 100% 14%Cheese 100% 3%
Notes:Adult quantities reported.Lower part of the table (percentages) indicate official ra-tions and not actual amounts which were often lower.Products that vanished almost entirely: cheese, fruit,leather.a) in 1915.Sources:Ernest H. Starling, 1919, Report on Food Conditions inGermany. (London: H.M. Stationary Office) pp. 7-16.Paul C. Vincent, 1985, The politics of Hunger.Klein, 1968, Deutschland im ersten Weltkrieg.For more details on food ratios and average caloric con-sumption see Table A.1.
The famine had a large impact on the German population and in particular on young
adolescents. On average, individuals lost 15-25 percent of their weight between 1916 and
1919 and height in the male population born in the period between 1914 and 1917 is
around 1.5cm less than for adjacent cohorts (Blum, 2011).10 Children were less likely to
die than adults, but often suffered from hunger-diseases such as edema, tuberculosis, rickets,
10Individuals who had lost 30 percent or more mostly died.
9

influenza, scurvy, and keratomalacia (Roesle, 1928).11 Under-consumption of food during
that time was particularly dramatic among male adolescents. As a consequence, late-life
mortality is much higher for male (but not female) individuals who were around age 15 at
the end of the famine (Horiuchi, 1983).
The first wave of the Spanish Influenza pandemic hit Germany in June 1918, the second
one in the Fall and the third one in January 1919 (Witte, 2008). In Germany, about 150,000
individuals died in this period as a result of the disease (Vincent, 1985). This number is
low when compared to the overall number of deaths that resulted from starvation, but it is
still considerable. Because identification in our study relies on comparing outcomes of the
descendants of adjacent first-generation cohorts, it is difficult to separate the effects of the
famine from the effects of the influenza pandemic. However, evidence from Norway suggests
that, for the most part, the Spanish Influenza was lethal only for individuals of ages 20-40,
such that selective survival is not an issue for our cohorts of interest (Mamelund, 2003).
Nevertheless, since the continuation of the blockade and the third wave of the Spanish
influenza extended well into 1919, we conduct sensitivity checks that include the year 1919
in our famine period.
4 Identification and Outcome Models
We use common coefficient models and matching to identify the effect of SGP famine
exposure of first generation (G1) ancestors on second (G2) and third generation (G3)
individuals. We thus calculate a famine effect among G2 and G3 individuals with the same
background and birth year, who differ with respect to exogenous first generation famine-
SGP exposure. Because, first generation famine-SGP exposure is a historical incident that
is exogenous at the individual level, our approach allows us to identify the impact of having
ancestors of a certain age during the famine on the second and third generation.12
4.1 Famine exposure
To investigate systematically how adult outcomes of G2 and G3 vary with first generation
SGP exposure to the famine, we focus on individuals who have at least one ancestor born
11The number of occurrences of epidemic diseases such as typhoid, rabies, trichiniasis and dysenterystayed roughly constant in the population.
12Note that our measure of famine exposure is whether someone had reached a certain age by the timeof the famine. This measure thus reflects the intention to treat (ITT) and not the actual treatment effect(TE). Our data do not contain information on whether a first generation individual actually went hungryduring the famine (for a discussion of ITT and TE effects in famine studies see van den Berg et al., 2012).Recall however that the famine was widespread and more severe than other famines in Europe in the past150 years.
10

Figure 1: Birth rate, German empire
Source: H. Birg, 2001, Die Demographische Zeitenwende.
during the years 1902-1913. Note that male individuals in this cohort were too young to
have been drafted and females were too young to have conceived a child during Word War
I. Also, none were born during the war.
Table 2 displays the number of years the famine affected different birth cohorts of first
generation individuals during their SGP, defining 1916-1918 as the famine period. Note
that all first-generation individuals have been affected by the famine, but that exposure
occurred at different ages.13 We thus identify the effect of being famine exposed during
SGP as compared to being affected by the famine at a different point in time.
Our analysis relies on the assumption that there are no systematic differences in famine
survival between individuals affected by the famine during the SGP and the control groups.
Hence, we assume that children in their slow growth period were about equally likely to die
from the famine than children that were slightly younger or older at the time. Historical
sources seem to back this claim: death rates of children between the ages of one and five
had risen by fifty percent during the famine, while for children from five to fifteen were
only slightly higher (55 %) (Vincent, 1985). Selection into fertility would be a problem if
parents from different social classes had been more or less likely to conceive children in the
periods 1902-1903 (1902-1904) or 1910-1913 (1911-1913) than during the years 1904-1909
(1906-1910). Figure 1 however shows that for the time period of births we are analyzing
(1901-1914), overall birth rates do not show any systematic pattern. Of course, it was
impossible to anticipate the famine a decade earlier.
The exogenous shifter in nutrition, Z ∈ {0, 1}, is defined as an indicator of whether
G1 ancestors were SGP-exposed to the famine, i.e. of ages 8-10 (females) and of ages 9-12
(males) in 1916-1918. For G2, Z is a 2x1 vector with the first entry indicating whether the
mother was affected by the famine during her SGP and the second indicating whether the
13A rare exception for a historical event where there is a control group which is largely unaffected is theDutch Hunger Winter (see e.g. Scholte et al., 2012).
11

Table 2: Number of years of famine exposure during the slow growth period,first generation males and females.
Birth year 1902 1903 1904 1905 1906 1907 1908 1909 1910 1911 1912 1913
Males 0 0 1 2 3 3 2 1 0 0 0 0Females 0 0 0 0 1 2 3 2 1 0 0 0
Age during famine 14-16 13-15 12-14 11-13 10-12 9-11 8-10 7-9 6-8 5-7 4-6 3-5
Famine years: 1916-1918. The slow growth period ranges from ages 8-10 and 9-12 for females and males, respectively.
father was affected during that same period. Following the same logic, for G3, Z has four
entries: whether paternal grandfather (PGF) was SGP famine affected, whether paternal
grandmother (PGM) was SGP famine affected, whether maternal grandfather (MGF) was
SGP famine affected and whether maternal grandmother (MGM) was SGP famine affected.
4.2 Outcome models
We estimate three different types of outcome models to account for the different distri-
butional properties of the respective outcome variables: a duration model for individual
mortality, a discrete choice probit model for the decision to obtain a higher secondary
school degree and a linear regression model for the continuous outcomes height and mental
health. In all models, x denotes an individual-specific vector of observable characteristics,
which always comprises some basic control variables and in some specifications an addi-
tional set of background controls. fy is a vector of birth year dummies for the respective
generation that captures any variation that may be cohort or birth year specific.
4.2.1 Duration model
First, to estimate the impact of the famine on longevity of the second generation, we model
the hazard of mortality at any given point in time as being composed of the baseline hazard
and a systemic part. Following the standard biological literature on modeling mortality,
the baseline hazard has the shape of a Gompertz distribution with ancillary parameter γ:
h(t) = exp(γt)exp(N∑i=1
Z ′iδ + x′
iβ + f ′yη). (1)
Our sample is special in a sense that selection into the sample is conditional on ever
having responded to a the household questionnaire. We thus account for left truncation by
adjusting the likelihood for the fact that individuals only enter in adult life, using age at
12

first interview as truncation point.14
4.2.2 Probit model
We model binary outcomes such as disability status or upper secondary schooling as a
binary outcome latent index model with Yit = 1[Y ∗it>0], where Y ∗
it denotes the latent con-
tinuous variable. The latent variable in turn is determined by famine exposure, birth year
fixed effects and observable control variables. We assume a linear structure and additive
separability in the error term:
Y ∗i = Z ′
iδ + x′iβ + f ′
yη + ϵit.
The observed binary variable Yi is an indicator variable that is assumed to equal one if the
latent variable crosses zero as a threshold Y ∗i > 0. We estimate a probit model, assuming
that P (Yit = 1|xi, fy, Zi) = Φ(Z ′iδ + x′
iβ + f ′yη) where Φ denotes the normal cdf.
4.2.3 Linear regression model
For continuous outcomes, we estimate the following linear model between outcomes Yit,
famine effects and covariates for adult i born in year t:
Yi = Z ′iδ + x′
iβ + f ′yη + ϵit.
again xi denotes a vector of control variables and the equation comprises a vector of own
birth-year fixed effects (fy) to capture any variation that may be cohort or birth year spe-
cific.
5 Data
The German Socioeconomic Panel is a representative longitudinal survey data set. Since
1984, around 12,000 households, comprising more than 20,000 individuals, are followed over
time. The sampling unit is the household, and all household members aged 17 or above
participate in the survey. Individuals who leave the household to form a new household
are kept in the sample, as are their new household members. At the age of 17, children of
14We conduct robustness checks where we introduce a frailty term (α) that enters the hazard functionmultiplicatively:
h(t) = αµ0. (2)
We find that the introduction of unobserved heterogeneity hardly affects the results.
13

participating households become full-blown survey participants. Attrition from the panel
is compensated by refreshment samples aimed at maintaining representativeness for the
full population.
The survey participants are interviewed once a year. An average interview takes about
1.5 hours. The survey is a broad multi-purpose survey. It aims to obtain extensive infor-
mation on socioeconomic outcomes, demographic conditions, living conditions, opinions,
behavior, consumption, etc. of the respondents and their household. In certain waves of
the survey, individuals are exposed to modules covering special topics such as health sta-
tus, cognitive abilities, or family trees. In their respective first SOEP interviews, the adult
respondents were asked about the birth years of their parents if the latter were not SOEP
respondents themselves. In case a parent had died, the death year was also asked for.
5.1 Sample
The data design leads to a natural choice of what constitute the three generations in our
analysis. The second generation (G2) are adult SOEP respondents. The first generation
(G1) are their parents, while G3 are their children. This is the only choice that leads to a
substantial number of G1 individuals who experience the 1916-1918 famine in their SGP.
By relating their birth year to the famine period we infer whether they were exposed to
the famine during their SGP or indeed during any other age interval.
The actual selection of the G1, G2, G3 sample is rather involved. First, we select all
adult SOEP respondents as candidate G2 members whose parents are of German nation-
ality and do not have a migration background. We then exclude candidate G2 members
who reported unreasonable G1 birth years in a sense that their fathers (mothers) would
have had the G2 individual before age 15 (15) or after age 70 (50). Similarly we exclude
all candidate G3 members for whom the age differences between G2 and G3 individuals
are unreasonably high or low. G1 members are then only selected if they have G2 children
who are adult in at least one wave of the survey. Moreover, all G1 members need to be
one of two G2 parents or one of four G3 grandparents of which at least one needs to be
born in 1902-1913. In other words, we link all G2 individuals to their parents and all G3
individuals to their grandparents and only keep individuals in our G3-sample (G2-sample)
if at least one grandparent (parent) is born in 1902-1913. If the latter condition is not
satisfied or if the relevant years are missing for at least one grandparent (parent) then the
candidate G3 (G2) member is excluded from the G3-sample (G2-sample). Similarly, if one
of the candidate G2 members was born in 1902-1913 then the family is discarded.
As a result, our G3-sample (G2-sample) contains 2670 (6548) G1 individuals who were
born in 1902-1913. In addition, 580 (855) and 1914 (873) G1 individuals are born before
14

1902 and after 1913, respectively. The data contain 4138 G2 individuals and 1291 G3
individuals.15 See Table 3 for more details.16
As noted in Section 1, our study design faces a few potential limitations. Some of these
are inevitable (but often ignored) in the study of transgenerational effects. Specifically, the
study of three consecutive generations of a family requires that family members of the first
two generations survive until reproductive ages and that they actually get children, and
that the family members of the third generation survive until the moment that the outcome
of interest can be observed. Moreover, the second generation individuals must have received
the children in a relationship that was sufficiently stable to observe both partners in the
same household. Further, the third generation individuals only enter the survey if they lived
in the same household with their parents at some point after the household entered the
study (most households entered in 1984). This explains why most of the third generation
individuals in our sample were born after 1963 and are thus relatively young, and why the
second generation individuals were on average relatively old when they had children. These
conditions may be selective in that they relate to evolutionary fitness. In our observation
window, the single largest peak in mortality occurs during and right after World War II.
This would be a problem if World War II affected reproductive behavior in the SGP famine
cohort differently than in adjacent cohorts. It is likely that many G1 individuals, although
mostly older than 30 years of age during World War II, were drafted in that war. This
holds true for both the treatment and the control group, such that there should be no
systematic differences in battlefield exposure. Also, World War II occurred after most G1
individuals (whether in the SGP famine cohort or not) had obtained their first children
and before the G2 individuals reached ages at which they were drafted. Nevertheless, we
deal with the peak in mortality by including indicators for G2 birth years in the models
we estimate.
A potential limitation compared to the design of the Overkalix studies is that the 1916-
1918 famine was a single adverse event, so that exposure during the SGP is equivalent to
birth in or around 1907 (specifically, for boys in the interval 1904-1909 and for girls in the
interval 1906-1910, where the highest exposure during the SGP occurred in the middle of
the intervals). This is not so much a sampling limitation as a limitation of the historical
variation in SGP conditions. In the Overkalix studies, favorable and adverse years follow
each other with a certain frequency. Our design would be flawed if 1907 and the years
around it were special in the sense that the composition of newborns was systematically
15In addition we conduct robustness checks where we restrict our attention to only those G1 individualswho were born in 1902-1913. That is, we then focus only on G2 and G3 individuals if all their G1 ancestorswere born in that period. This leaves us with much smaller sample sizes of 1232 G2-males and 1261G2-females and of 178 G3-males and 137 G3-females, respectively.
16In the G3 generation sample we count 659 siblings who mostly have the same ancestors.
15

different. However, macro-economic statistics of the years 1900-1910 do not suggest that
this was the case. For example, the German economy grew at a rather steady rate until
World War I. A similar potential problem could arise if the 1907 cohort was exposed to
a cohort-specific shock later in life. In general, these concerns are dealt with by including
a large number of indicators of secular changes in society and background controls. In
addition, we point out that if the cohorts born in and around 1907 are selective in a way
that is unrelated to the effects we are interested in then we would expect this to affect the
results for each of the four grandparents. It is unlikely that the presence of an effect of the
parental grandfather’s SGP exposure is caused by a mechanism that is unrelated to the
effects we are after if we do not find an effect of the maternal grandfather’s SGP exposure.
An additional issue originates from the combination of the single adverse famine shock
and the fact that the sampling starts with potential G2 members. The latter come from
the cross-section of individuals alive at some point during the SOEP observation window.
Because of the age composition of the population, this means that they were born on
average in the late 1930s. Any G1 parent of such an individual who was exposed to the
famine in his/her SGP can not have been a young father in the late 1930s (on average they
were around 30 years old). This could affect the G2 upbringing. Moreover, epidemiological
studies have shown a positive association between higher paternal age at birth and leuko-
cyte telomere length in adulthood (see e.g. Kimura et al., 2008). The latter is known to
be associated with beneficial health outcomes later in life such as a lower mortality rate.
We address this issue in the same way as in the previous paragraph, by conditioning on
indicators of secular trends and background control variables. Moreover, recall that among
the G1 members who were not famine-exposed in their SGP we also observe many who
received offspring in their thirties or after that.
Table 3: Sample size and ancestor famine affectedness.
Variables Second generation Third generation
Males Females Males Females
Father famine in SGP 0.40 (0.49) 0.42 (0.49) . (.) . (.)Mother famine in SGP 0.35 (0.48) 0.33 (0.47) . (.) . (.)PGF famine in SGP . (.) . (.) 0.29 (0.45) 0.35 (0.48)PGM famine in SGP . (.) . (.) 0.23 (0.42) 0.24 (0.43)MGF famine in SGP . (.) . (.) 0.26 (0.44) 0.22 (0.42)MGM famine in SGP . (.) . (.) 0.19 (0.39) 0.16 (0.37)Birth year 1938.86 (6.36) 1938.76 (6.63) 1973.20 (7.85) 1974.41 (7.15)
N 2061 2077 715 576
Source: German Socioeconomic Panel (SOEP).Own calculations.
16

5.2 Outcome variables
Our outcome measures (Yit) are height, longevity, mental health and whether an individual
has obtained an upper secondary school degree. In the SOEP, age at death can be obtained
for individuals who have participated in the survey at least once and who dropped out
of the survey because they died. The death year is provided by the SOEP in the so-
called person-based metafile. Mental health and height measures are obtained using the
most recent information from the biannual SOEP health module. Height is self-reported
and mental health is measured by the Mental Component Summary Scale (MCS), one
of the two sub-dimensions of the SF-12 questionnaire. The MCS is measured on a scale
that ranges from 0 to 100 with mean 50 and standard deviation 10. It results from a
factor analysis comprising the dimensions ’general mental health’, ’emotional functioning’,
’social functioning’ and ’vitality’ each measured on separate scales (for details see Andersen
et al., 2007). We define whether an individual has obtained the German university or
technical college entrance diploma (German ”Abitur” or ”Fachhochschulreife”) using the
international Comparative Analysis of Social Mobility in Industrial Nations (CASMIN)
classification. Table 4 comprises summary statistics of all outcome variables.17
Table 4: Descriptive statistics: Age at death, height, mental health andschooling outcomes by sex and generation.
Variables Second generation Third generation
Males Females Males Females
Age at death 71.91 (6.35) 72.90 (6.24)Height 175.52 (6.63) 163.72 (6.03) 180.51 (7.05) 167.76 (6.06)Mental health 52.50 (9.77) 50.45 (10.69) 49.44 (9.18) 47.57 (9.98)Upper secondary school degree 0.36 (0.48) 0.19 (0.39) 0.49 (0.50) 0.52 (0.50)
N 2061 2077 715 576
Source: German Socioeconomic Panel (SOEP).Own calculations.
5.3 Control variables
We define two sets of control variables: basic control variables and background control
variables. Basic control variables comprise all variables that account for any bias that
may arise because famine-affected G1 individuals (and their offspring) are (may be) born
in different years than the corresponding control group members. Most importantly, in
accordance with research showing that wars and famines can have lasting scars on those
17We do not consider wages, because our data are a cross section of individuals who are sampled atdifferent points in their lives, which makes the computation and comparison of (permanent) income prob-lematic.
17

Figure 2: GDP per capita and population size, German Empire
Notes: GDP per capita (logarithm) is measured in 1990 International Geary-Khamis dollars. GDP was detrended usingthe Hodrick-Prescott-Filter (λ=100).Source: A. Maddison (2006). The World Economy: Historical Statistics, OECD Development Centre, Paris 2006.
individuals who were born at that time (see e.g. Lumey et al., 2011), we are including
indicator variables for whether G2 individuals were born during World War I and for
whether G2 individuals were born during World War II. Note however that our sample
comprises rather few of those individuals (68 G1 and 140 G2). Second, we are controlling
for individual birth year fixed effects to capture cohort or birth year specific variation in
outcomes. Last, we include detrended GDP per capita during the year of birth of G1 (see
Figure 2) in line with a strand of literature which demonstrates that economic and health
conditions at birth and during infancy can have long-run mortality and height effects. (For
the effect of business cycle variation on outcomes see e.g. van den Berg et al., 2011, Woitek,
2003 and Sunder and Woitek, 2005.)
We include background variables as additional covariates in some specifications to detect
behavioral, non-biological pathways. One of the potentially most important pathways goes
through parental education, reflecting parental cognitive ability, parenting skill, social class
and family earnings potential all of which are essential for health and schooling outcomes.
We define parental education dummies for different educational degrees in Germany. In
addition, we include the number of siblings, as a proxy for parental resources. Descriptive
statistics of all included background variables can be found in Table 5.
6 Empirical results
The results are discussed in two stages. First, in Subsection 6.1 we discuss how grand-
parental SGP famine exposure affects outcomes in the third generation. These are the
findings that most reliably allow us to draw conclusions about epigenetic pathways and
that can be connected directly to the main findings in the Overkalix studies. We investigate
18

Table 5: Descriptive statistics: Background control vari-ables.
Second generation Third generation
Father upper secondary school 0.10 (0.30) 0.33 (0.47)Father intermediate school 0.09 (0.28) 0.17 (0.37)Mother upper secondary school 0.03 (0.17) 0.21 (0.41)Mother intermediate school 0.11 (0.31) 0.26 (0.44)Number of brothers 0.99 (1.06) 0.72 (0.77)Number of sisters 0.99 (1.10) 0.77 (0.87)
N 4138 1291
Source: German Socioeconomic Panel (SOEP).Own calculations.
how the results change if we move from controlling only for a basic set of variables to con-
trolling for additional background variables, which potentially account for non-biological
channels. We also conduct robustness checks where we vary famine intensity and period,
e.g. by excluding individuals who experienced the famine for only one year and by ex-
tending the famine period to 1919. If famine exposure has a causal effect on outcomes, we
expect this effect to become larger and more significant if individuals with weak famine
exposure are excluded from the analysis. Last, we restrict the sample to individuals for
whom all G1-ancestors were born during the period 1902-1913.
Second, in Subsection 6.2 we discuss the results of parental SGP famine exposure on
the second generation, keeping in mind that these findings may be driven by a range of
mechanisms including epigenetic mechanisms but also direct behavioral or environmental
processes. Nevertheless, we expect these results to be informative about how any potential
effect transmits from the first to the third generation.
6.1 Third generation
The coefficients in Table 6 display the effect sizes of grandparental SGP-famine exposure
on height, mental health and schooling, conditional on the basic set of control variables
and on the combined set of basic and background controls. Since epigenetic inheritance
may be sex specific, we perform all analyzes separately for males (left panel) and females
(right panel) (Pembrey et al., 2006). We report p-values that correspond to robust stan-
dard errors clustered at the household level, because siblings share genes, environment,
and history of ancestral famine exposure. Note that there are four ancestors who have
potentially been affected by the famine during their SGP: the paternal grandfather, the
paternal grandmother, the maternal grandfather and the maternal grandmother. If our
results are driven by transgenerational epigenetic mechanisms, we should expect positive
and significant effects on G3 height, schooling and mental health. Of particular interest is
19
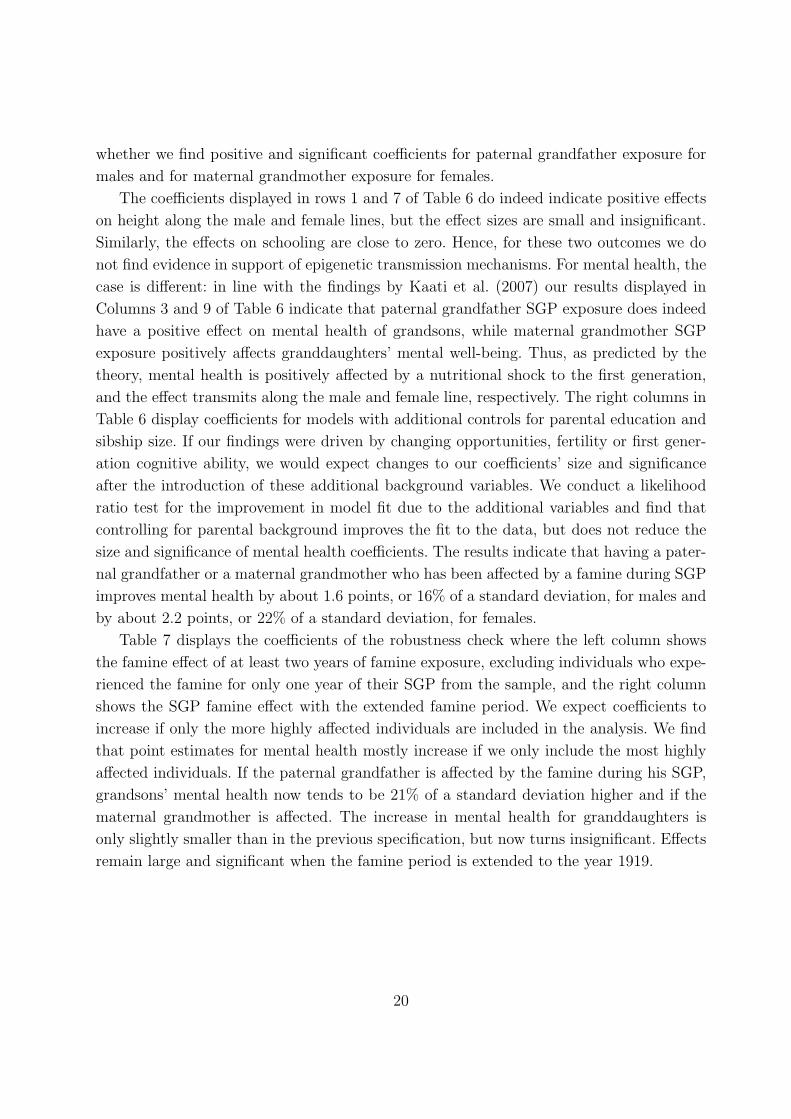
whether we find positive and significant coefficients for paternal grandfather exposure for
males and for maternal grandmother exposure for females.
The coefficients displayed in rows 1 and 7 of Table 6 do indeed indicate positive effects
on height along the male and female lines, but the effect sizes are small and insignificant.
Similarly, the effects on schooling are close to zero. Hence, for these two outcomes we do
not find evidence in support of epigenetic transmission mechanisms. For mental health, the
case is different: in line with the findings by Kaati et al. (2007) our results displayed in
Columns 3 and 9 of Table 6 indicate that paternal grandfather SGP exposure does indeed
have a positive effect on mental health of grandsons, while maternal grandmother SGP
exposure positively affects granddaughters’ mental well-being. Thus, as predicted by the
theory, mental health is positively affected by a nutritional shock to the first generation,
and the effect transmits along the male and female line, respectively. The right columns in
Table 6 display coefficients for models with additional controls for parental education and
sibship size. If our findings were driven by changing opportunities, fertility or first gener-
ation cognitive ability, we would expect changes to our coefficients’ size and significance
after the introduction of these additional background variables. We conduct a likelihood
ratio test for the improvement in model fit due to the additional variables and find that
controlling for parental background improves the fit to the data, but does not reduce the
size and significance of mental health coefficients. The results indicate that having a pater-
nal grandfather or a maternal grandmother who has been affected by a famine during SGP
improves mental health by about 1.6 points, or 16% of a standard deviation, for males and
by about 2.2 points, or 22% of a standard deviation, for females.
Table 7 displays the coefficients of the robustness check where the left column shows
the famine effect of at least two years of famine exposure, excluding individuals who expe-
rienced the famine for only one year of their SGP from the sample, and the right column
shows the SGP famine effect with the extended famine period. We expect coefficients to
increase if only the more highly affected individuals are included in the analysis. We find
that point estimates for mental health mostly increase if we only include the most highly
affected individuals. If the paternal grandfather is affected by the famine during his SGP,
grandsons’ mental health now tends to be 21% of a standard deviation higher and if the
maternal grandmother is affected. The increase in mental health for granddaughters is
only slightly smaller than in the previous specification, but now turns insignificant. Effects
remain large and significant when the famine period is extended to the year 1919.
20

Tab
le6:
Mainresults:Thirdgeneration,parentalSGPfamineeff
ects
onheigh
t,mentalhealthan
dschooling.
Variables
Males
Fem
ales
Height
Menta
lhealth
Schooling
Height
Menta
lhealth
Schooling
Patern
algrandfath
erfaminein
SGP
0.191
0.358
1.577∗
1.749∗∗
-0.0187
0.0506
0.555
0.608
-0.0246
0.0482
-0.00395
0.0527
(0.78)
(0.61)
(0.06)
(0.04)
(0.70)
(0.24)
(0.41)
(0.36)
(0.98)
(0.96)
(0.93)
(0.22)
Patern
algrandmoth
erfaminein
SGP
0.550
0.330
-0.133
-0.0825
0.0513
0.00737
-0.559
-0.645
0.425
0.580
0.0555
0.0423
(0.45)
(0.65)
(0.88)
(0.92)
(0.30)
(0.87)
(0.43)
(0.37)
(0.68)
(0.59)
(0.30)
(0.37)
Matern
algrandfath
erfaminein
SGP
-1.101
-1.097
0.459
0.385
-0.0415
-0.00850
0.805
0.743
0.297
0.397
0.0305
-0.00706
(0.20)
(0.20)
(0.62)
(0.68)
(0.44)
(0.86)
(0.26)
(0.30)
(0.80)
(0.74)
(0.57)
(0.88)
Matern
algrandmoth
erfaminein
SGP
0.154
0.257
-0.535
-0.476
0.0434
0.0561
0.0685
0.101
2.195∗
2.135∗
0.00609
0.0499
(0.87)
(0.77)
(0.62)
(0.65)
(0.45)
(0.26)
(0.93)
(0.89)
(0.08)
(0.10)
(0.92)
(0.34)
Observations
715
715
715
715
715
715
576
576
576
576
576
576
pvalLLR-test
0.03
0.13
.13
0Basicco
ntrolvariables
YES
YES
YES
YES
YES
YES
YES
YES
YES
YES
YES
YES
Back
groundvariables
NO
YES
NO
YES
NO
YES
NO
YES
NO
YES
NO
YES
Loglik.
-2387.6
-2380.8
-2577.3
-2573.6
-478.4
-410.0
-1836.1
-1834.0
-2121.7
-2119.6
-359.4
-303.3
R-squared
0.0630
0.0808
0.0588
0.0685
0.0611
0.0678
0.0671
0.0737
p-values
inparentheses
Source:SOEP
Data.Owncalculation
s.Note:Standarderrors
arerobust
andclustered
onthehou
seholdlevel.For
schoolingmodels,
coeffi
cients
reportedareaverag
emarginal
effects.pvalLLR-testis
thep-valueofalikelihoodratiotest
fortheim
provementin
model
fitdueto
thebackgrou
ndvariab
les.
Basiccontrolvariables:
detrended
GDP
per
capitaat
firstgenerationbirth,parentalag
eat
birth,individual
(G3)
birth
year
fixed
effects,indicator
variab
lesforwhether
themother/father
was
bornduringWorld
War
II(untilcu
rren
cyreform
).Back
gro
und
variables:
Parentaleducation
,number
ofsiblings.
∗p<
0.10,
∗∗p<
0.05
,∗∗
∗p<
0.01
21

Tab
le7:
Rob
ustnesschecks:Thirdgeneration,parentalSGPfamineeff
ects
onheigh
t,mentalhealthan
dschooling.
Variables
Males
Fem
ales
Height
Menta
lhealth
Schooling
Height
Menta
lhealth
Schooling
Patern
algrandfath
erfaminein
SGP
(≥2yrs)
-0.0745
2.109∗∗
0.00945
-0.0939
-0.617
0.0852
(0.93)
(0.05)
(0.86)
(0.91)
(0.61)
(0.10)
Patern
algrandmoth
erfaminein
SGP
(≥2yrs)
1.057
-0.819
-0.00392
0.0577
0.907
0.0513
(0.22)
(0.49)
(0.95)
(0.95)
(0.51)
(0.42)
Matern
algrandfath
erfaminein
SGP
(≥2yrs)
-2.864∗∗
∗0.506
0.0163
0.152
-0.0959
0.0223
(0.00)
(0.70)
(0.78)
(0.88)
(0.96)
(0.72)
Matern
algrandmoth
erfaminein
SGP
(≥2yrs)
0.994
-0.0326
0.0143
-0.318
1.649
-0.0800
(0.35)
(0.98)
(0.85)
(0.78)
(0.41)
(0.28)
Patern
algrandfath
erfaminein
SGP
(incl.1919)
0.264
1.585∗∗
0.0408
0.582
-0.0762
0.0511
(0.69)
(0.05)
(0.33)
(0.35)
(0.94)
(0.22)
Patern
algrandmoth
erfaminein
SGP
(incl.1919)
0.399
0.208
0.0393
-0.481
1.479
-0.00481
(0.56)
(0.80)
(0.35)
(0.47)
(0.14)
(0.91)
Matern
algrandfath
erfaminein
SGP
(incl.1919)
-1.264
0.458
0.0143
0.673
1.031
0.00746
(0.12)
(0.61)
(0.76)
(0.35)
(0.37)
(0.86)
Matern
algrandmoth
erfaminein
SGP
(incl.1919)
0.730
-0.832
-0.00463
0.549
2.181∗
0.0265
(0.39)
(0.43)
(0.92)
(0.50)
(0.09)
(0.61)
Observations
516
715
516
715
516
715
416
576
416
576
416
576
Hunger
period
≥2yrs
incl
1919
≥2yrs
incl
1919
≥2yrs
incl
1919
≥2yrs
incl
1919
≥2yrs
incl
1919
≥2yrs
incl
1919
Basicco
ntrolvariables
YES
YES
YES
YES
YES
YES
YES
YES
YES
YES
YES
YES
Back
groundvariables
YES
YES
YES
YES
YES
YES
YES
YES
YES
YES
YES
YES
Loglik.
-1680.4
-2378.5
-1839.8
-2573.0
-284.8
-409.4
-1303.8
-1832.3
-1512.7
-2117.2
-204.9
-299.0
R-squared
0.126
0.0867
0.0981
0.0700
0.102
0.0734
0.105
0.0814
p-values
inparentheses
Source:SOEP
Data.
Owncalculation
s.Note:Standard
errors
are
robust
andclustered
onthehou
seholdlevel.For
schoolingmodels,
coeffi
cients
reportedareaverag
emarginal
effects.pvalLLR-testis
thep-valueof
alikelihoodratiotest
fortheim
provementin
model
fitdueto
thebackgrou
ndvariab
les.
Basiccontrolvariables:
detrended
GDP
per
capitaat
firstgenerationbirth,parentalag
eat
birth,individual
(G3)
birth
year
fixed
effects,indicatorvariab
lesforwhether
themother/father
was
bornduringWorld
War
II(untilcu
rren
cyreform
).Back
gro
und
variables:
Parentaleducation,number
ofsiblings.
∗p<
0.10
,∗∗
p<
0.054
,∗∗
∗p<
0.01
22

If we restrict the sample to only those individuals with all G1-ancestors born during
1902-1913 (results not displayed), we find positive height effects if the paternal grandfather
was exposed for both males and females. Moreover, we find highly significant positive men-
tal health effects for females whose maternal grandmothers were exposed but no significant
effects for males whose paternal grandfathers were exposed. A problem with this sample is,
however, that it is rather small and that almost all individuals in it have at least one first
generation ancestor who was exposed to the famine during the SGP. Consequently, the
control group of completely unexposed individuals becomes tiny (2 males and 6 females)
and the result may be affected by that.18
6.2 Second generation
The analysis so far has focused on the third generation, where any findings most reliably
point towards transgenerational epigenetic effects. For two reasons, we also present results
for the second generation. First of all, the fact that about 10% of the G2 individuals have
died enables us to examine mortality effects, albeit to a limited extent. Second, for the
interpretation of the G3 results it is interesting to examine whether the effects on mental
health are also present in the second generation.
Table 8 displays the main results for G2 and Table 9 contains the same robustness
checks as for G3 discussed above. Overall, we do not find robust effects on G2 mortality
or height if a parent has been exposed during the famine during SGP. If at all, males tend
to be slightly shorter if the mother, and slightly taller if the father has been affected by
the famine. Furthermore, the coefficient on parental SGP famine exposure on schooling
is negative and significant in some specifications for males. We suspect that the negative
schooling effects of paternal famine exposure on male individuals are nonbiological effects
that come about, because fathers who experienced the famine during adolescence received
less rigorous training. This presumption is supported by the fact that the effect becomes
insignificant in Column 7 of Table 9 where the less severely affected fathers are excluded
from the analysis. Turning to second generation mental health, we neither find supportive
evidence that paternal SGP famine exposure raises son’s mental health nor that maternal
SGP famine exposure has positive mental health effects for their daughters.19
18Our results are robust for varying sets of background control variables. Additional variables we includedto test for robustness comprise age at the time of measurement, population growth, indicator variables forwhether G1 individuals were born before 1902 or after 1913 as well as parental (G1 and G2) age at thebirth of the children. For G3, the results also robust with respect to the inclusion of parental (G2) birthyear fixed effects that capture business cycle fluctuations and variation in the probability for an individualto be part of the sample.
19Similarly, if we restrict the sample to only those G2 individuals for whom both parents were bornduring 1902-1913, we do not find any significant mental health effects.
23

6.3 Discussion
The above findings hint towards the transgenerational epigenetic transmission of effects
triggered by a reduction in food access during the ancestors’ slow growth period: if the
paternal grandfather is affected by a nutritional shock during his SGP, then this improves
mental health among the third-generation male offspring. Similarly, if the maternal grand-
mother is affected by a nutritional shock during her SGP, this leads to an improvement in
mental health among the third-generation female offspring. In this subsection we perform
some additional analyses to shed light on the plausibility of the presence of an epigenetic
pathway.
First, to assess whether our findings are indeed driven by a food shortage in SGP, we
exclude all individuals from the analysis who have only been affected by the famine for a
single year during their SGP. We find that most second generation results become weaker,
but that the positive effect of paternal grandfather SGP exposure on male mental health
and the positive effect of maternal grandmother SGP exposure on female mental health
remain strong and significant. We interpret this as supportive for the evidence that the
pathway starts with a nutritional shortage in the SGP.
Concerning the channels through which the transgenerational effect operates, we cannot
be certain that our estimated effects are of epigenetic origin, because our data do not
contain methylation patterns. It is interesting to note however, that the findings are to
some extent similar to those in the above-described series of papers on the Overkalix data,
which conclude that their findings are likely driven by epigenetic mechanisms. All third
generation mental health effects appear along sex-specific lines and they are most significant
and robust along the male line, which might be reasonable because during the SGP the
sperm is still in development. Nevertheless, behavioral mechanisms are another possible
explanation for our findings. The experience of economic hardship around the age of 10 has
been found to increase resilience and psychological strength (Elder, 1999) and may therefore
have positive mental health effects. However, it is not evident why behavioral mechanisms
should work exclusively along sex-specific lines. Moreover, if third generation mental health
was elevated due to an increase in first generation resilience and psychological strength, we
would expect the effect to transmit to the third generation via elevated mental health levels
among the second generation. Instead all mental health coefficients are insignificant for the
second generation. From this we conclude that the mental health effects we find for the
third generation are more likely biological in origin and plausibly the result of epigenetic
transmission.
The results on the G3 educational outcome may be affected by causal effects of G1’s
level of education on G3’s level of education. Evidence of positive associations between G3
and G1 levels of education, controlling for G2 levels of education, is provided by Lindahl et
24

al. (2013), using multigenerational data from Sweden. In our setting, it is conceivable that
SGP famine exposure has a negative effect on the highest attained level of education of G1.
This by itself could then generate a negative effect of G1’s SGP famine exposure on G3’s
level of education. Such a pathway runs opposite to the epigenetic pathway that we focus
on. This may explain our empirical finding that the net over-all effect is not significantly
different from zero.
In fact, the data allow us to investigate this in some more depth, since they include G1’s
highest realized level of education. First, we examine whether G1 SGP famine exposure
has a negative impact on G1 education. Table 10 presents average marginal effects from
a probit analysis. It turns out that the effects are negative for males but not for females.
The average effects on male upper secondary and secondary education amount each to a
two percentage point reduction. In relative terms, this is quite considerable (around 20
percent), since the share of individuals with upper secondary and secondary education for
these cohorts is around 10% each.
We proceed by investigating whether adding G3’s realized education levels to our pre-
ferred specification impacts the mental health results displayed in 6. Table 11 displays
the mental health results for G3 if we do not only account for parental (G2) but also for
grandparental (G1) education. The results indicate that the SGP famine effect for males
becomes stronger and more significant while for females it becomes less significant. That
we do not find a major change in the results for females is not very surprising given that
the realized level of education of G1 females was not affected by the famine in the first
place. Conversely, controlling for G1’s level of education reinforces the mental health effect
for males.20 Another striking result is that paternal grandfather upper secondary education
seems to affect male mental health while maternal grandmother secondary education seems
to affect female mental health. This result suggests that both investments and shocks on
the first generation affect mental health outcomes of the third generation and that the
effect operates along sex-specific lines.
7 Conclusion
This paper investigates how a reduction in food supply due to the German World War
I famine of 1916-1918 affects descendants of the second and third generation. A well-
known line of literature finds that low food availability during the slow growth period of
male individuals positively affects health outcomes of subsequent generations. The studies
involved argue that such effects are potentially triggered by methylation of epigenetic marks
20The estimated G1 SGP famine effects on G3 height and education hardly change if G1 educationvariables are included in the main specification.
25

in the sperm, with methyl tags being transmitted to subsequent generations via epigenetic
imprinting.
We find that paternal grandfather SGP-famine exposure is associated with higher men-
tal health of third generation sons, while maternal grandmother SGP-famine exposure
has a positive effect on her granddaughters’ mental health. We conclude that these third-
generation mental health effects are likely to be causally related to a nutritional shortage
during the SGP. The estimated effects are larger if famine exposure is redefined such that
only the most severely affected individuals are included. Furthermore, the analyses indicate
that it is implausible that the results are driven by behavioral mechanisms. For example,
mental health effects are largely absent among the second generation. They take place
along sex-specific lines and are stronger for males than for females. We conclude that it is
likely that the results are driven by epigenetic imprinting.
Interestingly, mental health is among the most responsive adult health outcomes as a
function of nutritional conditions in utero, according to the literature on famine exposure
(see the survey in Lumey, Stein and Susser, 2011). This effect should not be confounded
with the effect detected in our study. The latter is driven by nutritional conditions in
the slow growth period, and it works on subsequent generations. Nevertheless, the results
provide a further confirmation that adult mental health is affected by past nutritional
shocks within the family.
The mental health results validate findings in the studies based on the Overkalix data.
Yet, as an external validation of the studies based on those data, the present study pro-
vides mixed evidence. This is to some extent because the sets of observed third-generation
outcome variables do not fully overlap. Notably, we are not able to use mortality and car-
diovascular diseases as G3 outcome variables. For various reasons outlined in the paper, we
may expect effects on mental health to be in line with effects on those outcome variables.
However, note that we do not find strong evidence for male-line effects on G2 mortality or
on G3 adult height as a proxy of mortality.
Research on transgenerational famine effects and epigenetic inheritance is only starting.
Further validation studies are needed that provide evidence on how nutritional shocks
transmit across generations, preferably including evidence on methylation changes. The
present study may therefore motivate the construction or usage of data sets that contain
elaborate retrospective information on nutritional shocks during childhood and adolescence,
as well as methylation patterns and health outcomes for several generations.
26

Tab
le8:
Mainresults:Secon
dgeneration,parentalSGPfamineeff
ects
onlongevity,
heigh
t,mentalhealthan
dschooling.
Variables
Males
Fem
ales
Morta
lity
Height
Menta
lhealth
Schooling
Morta
lity
Height
Menta
lhealth
Schooling
main
Fath
erfaminein
SGP
1.098
1.073
0.290
0.519∗
-0.346
-0.198
-0.0838∗∗
∗-0.0534∗∗
∗1.304
1.315
-0.368
-0.278
0.726
0.780
0.00736
0.0271
(0.50)
(0.62)
(0.36)
(0.10)
(0.47)
(0.68)
(0.00)
(0.01)
(0.13)
(0.12)
(0.20)
(0.33)
(0.16)
(0.13)
(0.70)
(0.14)
Moth
erfaminein
SGP
0.809
0.813
-0.390
-0.496
0.283
0.226
0.0372
0.0225
1.188
1.198
-0.243
-0.356
0.422
0.388
0.0277
0.0127
(0.14)
(0.15)
(0.25)
(0.14)
(0.59)
(0.66)
(0.14)
(0.33)
(0.34)
(0.31)
(0.44)
(0.26)
(0.46)
(0.50)
(0.21)
(0.52)
Observations
2061
2061
2061
2061
2061
2061
2061
2061
2077
2077
2077
2077
2077
2077
2077
2077
pvalLLR-test
00
00
.05
00
0γ
0.169
0.170
0.190
0.191
Basicco
ntrolvariables
YES
YES
YES
YES
YES
YES
YES
YES
YES
YES
YES
YES
YES
YES
YES
YES
Back
groundvariables
NO
YES
NO
YES
NO
YES
NO
YES
NO
YES
NO
YES
NO
YES
NO
YES
Loglik.
-188.228-181.673-6.8e+
03-6.7e+
03-7.6e+
03-7.6e+
03
-1.3e+
03
-1.2e+
03
-178.558-175.655-6.6e+
03-6.6e+
03-7.8e+
03-7.8e+
03-965.675-842.614
R-squared
0.068
0.108
0.035
0.046
0.036
0.059
0.038
0.045
p-values
inparentheses
Source:SOEP
Data.
Owncalculations.
Note:For
mortality
modelscoeffi
cients
are
hazard
rates.
For
schoolingmodels,
coeffi
cients
reportedareaverag
emarginal
effects.pvalLLR-test
isthep-valueof
alikelihoodratiotest
fortheim
provementin
model
fitdueto
thebackgrou
ndvariab
les.
γis
anan
cillaryparam
eter
that
param
etrizestheGom
pertz
baselinehazardfunction.Standarderrors
arerobust
andclustered
atthehou
seholdlevel.
Basiccontrolvariables:
detrended
GDP
per
capitaat
firstgenerationbirth,individual
(G2)
birth
yearfixed
effects,indicatorsforwhether
G1
individualswerebornduringthefamineandforwhether
G2individualswerebornduringWorld
War
II(untilcu
rren
cyreform
).Back
gro
und
variables:
Parentaleducation
,number
ofsiblings.
∗p<
0.10
,∗∗
p<
0.05,
∗∗∗p<
0.01
27
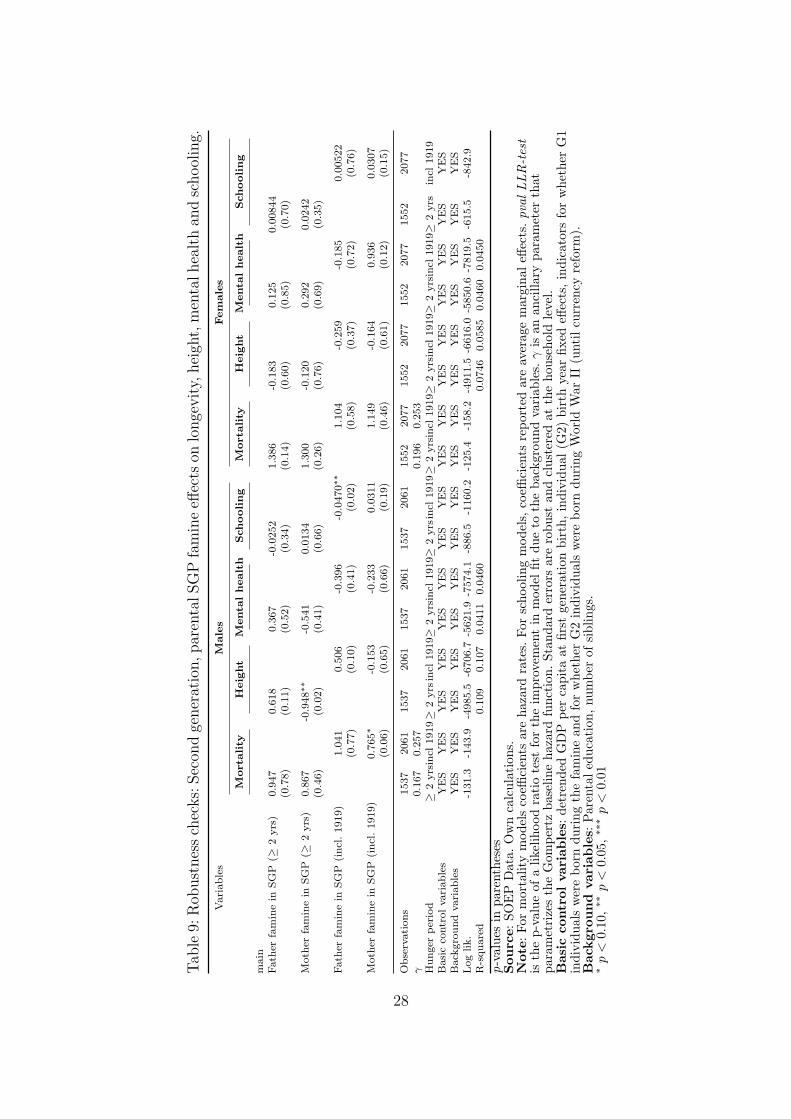
Tab
le9:
Rob
ustnesschecks:Secon
dgeneration,parentalSGPfamineeff
ects
onlongevity,heigh
t,mentalhealthan
dschooling.
Variables
Males
Fem
ales
Morta
lity
Height
Menta
lhealth
Schooling
Morta
lity
Height
Menta
lhealth
Schooling
main
Fath
erfaminein
SGP
(≥2yrs)
0.947
0.618
0.367
-0.0252
1.386
-0.183
0.125
0.00844
(0.78)
(0.11)
(0.52)
(0.34)
(0.14)
(0.60)
(0.85)
(0.70)
Moth
erfaminein
SGP
(≥2yrs)
0.867
-0.948∗∗
-0.541
0.0134
1.300
-0.120
0.292
0.0242
(0.46)
(0.02)
(0.41)
(0.66)
(0.26)
(0.76)
(0.69)
(0.35)
Fath
erfaminein
SGP
(incl.1919)
1.041
0.506
-0.396
-0.0470∗∗
1.104
-0.259
-0.185
0.00522
(0.77)
(0.10)
(0.41)
(0.02)
(0.58)
(0.37)
(0.72)
(0.76)
Moth
erfaminein
SGP
(incl.1919)
0.765∗
-0.153
-0.233
0.0311
1.149
-0.164
0.936
0.0307
(0.06)
(0.65)
(0.66)
(0.19)
(0.46)
(0.61)
(0.12)
(0.15)
Observations
1537
2061
1537
2061
1537
2061
1537
2061
1552
2077
1552
2077
1552
2077
1552
2077
γ0.167
0.257
0.196
0.253
Hunger
period
≥2yrsincl
1919≥
2yrs
incl
1919≥
2yrsincl
1919≥
2yrsincl
1919≥
2yrsincl
1919≥
2yrsincl
1919≥
2yrsincl
1919≥
2yrs
incl
1919
Basicco
ntrolvariables
YES
YES
YES
YES
YES
YES
YES
YES
YES
YES
YES
YES
YES
YES
YES
YES
Back
groundvariables
YES
YES
YES
YES
YES
YES
YES
YES
YES
YES
YES
YES
YES
YES
YES
YES
Loglik.
-131.3
-143.9
-4985.5
-6706.7
-5621.9
-7574.1
-886.5
-1160.2
-125.4
-158.2
-4911.5
-6616.0
-5850.6
-7819.5
-615.5
-842.9
R-squared
0.109
0.107
0.0411
0.0460
0.0746
0.0585
0.0460
0.0450
p-values
inparentheses
Source:SOEP
Data.Owncalculation
s.Note:For
mortality
modelscoeffi
cients
are
hazard
rates.
For
schoolingmodels,
coeffi
cients
reportedareaverag
emarginal
effects.pvalLLR-test
isthep-valueof
alikelihoodratiotest
fortheim
provementin
model
fitdueto
thebackgrou
ndvariab
les.
γis
anan
cillaryparam
eter
that
param
etrizestheGom
pertz
baselinehazardfunction.Standarderrors
arerobust
andclustered
atthehou
seholdlevel.
Basiccontrolvariables:
detrended
GDP
per
capitaat
firstgenerationbirth,individual
(G2)
birth
yearfixed
effects,indicatorsforwhether
G1
individualswerebornduringthefaminean
dforwhether
G2individualswerebornduringWorld
War
II(untilcu
rren
cyreform
).Back
gro
und
variables:
Parentaleducation
,number
ofsiblings.
∗p<
0.10
,∗∗
p<
0.05
,∗∗
∗p<
0.01
28
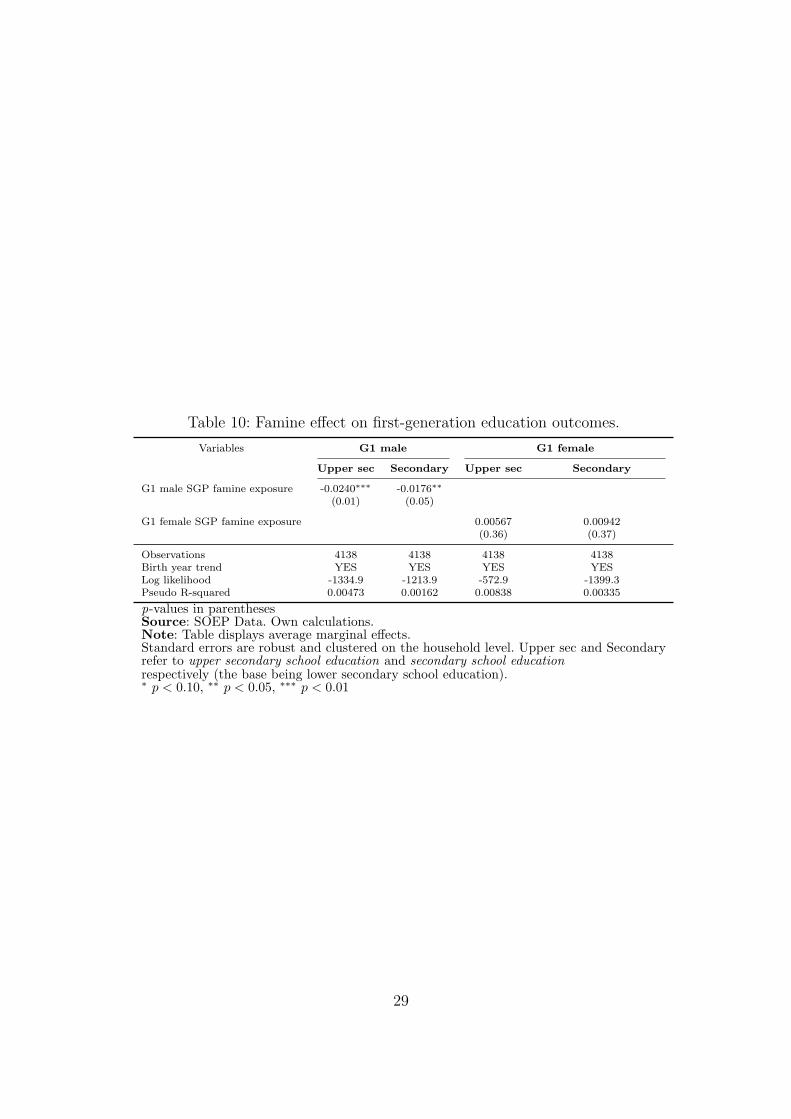
Table 10: Famine effect on first-generation education outcomes.
Variables G1 male G1 female
Upper sec Secondary Upper sec Secondary
G1 male SGP famine exposure -0.0240∗∗∗ -0.0176∗∗
(0.01) (0.05)
G1 female SGP famine exposure 0.00567 0.00942(0.36) (0.37)
Observations 4138 4138 4138 4138Birth year trend YES YES YES YESLog likelihood -1334.9 -1213.9 -572.9 -1399.3Pseudo R-squared 0.00473 0.00162 0.00838 0.00335
p-values in parenthesesSource: SOEP Data. Own calculations.Note: Table displays average marginal effects.Standard errors are robust and clustered on the household level. Upper sec and Secondaryrefer to upper secondary school education and secondary school educationrespectively (the base being lower secondary school education).∗ p < 0.10, ∗∗ p < 0.05, ∗∗∗ p < 0.01
29

Table 11: Effects of first-generation SGP famine and first-generationeducation on third-generation mental health outcomes.
Variables Males Females
Mental health
Paternal grandfather famine in SGP 1.647∗∗ 1.801∗∗ 0.0876 0.0996(0.04) (0.03) (0.93) (0.92)
Paternal grandmother famine in SGP -0.197 -0.148 0.430 0.611(0.82) (0.86) (0.68) (0.56)
Maternal grandfather famine in SGP 0.449 0.377 0.525 0.690(0.63) (0.69) (0.65) (0.56)
Maternal grandmother famine in SGP -0.703 -0.636 1.807 1.693(0.52) (0.55) (0.15) (0.18)
Paternal grandfather upper secondary school 3.631∗∗ 3.526∗∗ -0.195 -0.258(0.01) (0.01) (0.93) (0.91)
Maternal grandfather upper secondary school -1.797 -1.733 -1.421 -1.287(0.27) (0.28) (0.38) (0.44)
Paternal grandmother upper secondary school -1.804 -1.837 3.178 3.101(0.35) (0.33) (0.27) (0.30)
Maternal grandmother upper secondary school 1.442 2.022 -5.272∗ -5.095(0.55) (0.41) (0.10) (0.11)
Paternal grandfather secondary school -0.0867 0.00125 1.908 2.125(0.95) (1.00) (0.23) (0.18)
Paternal grandmother secondary school -1.147 -1.463 -0.817 -0.564(0.44) (0.33) (0.63) (0.74)
Maternal grandfather secondary school -0.140 0.0142 0.582 0.843(0.91) (0.99) (0.72) (0.62)
Maternal grandmother secondary school -0.0805 0.581 4.303∗∗∗ 4.291∗∗∗
(0.95) (0.66) (0.00) (0.00)
Observations 715 715 576 576Basic control variables YES YES YES YESBackground variables NO YES NO YESLog lik. -2573.5 -2569.9 -2114.4 -2112.6R-squared 0.0687 0.0781 0.0904 0.0960
p-values in parenthesesSource: SOEP Data. Own calculations.Note: Standard errors are robust and clustered on the household level.Basic control variables: detrended GDP p.c. at first generation birth,parental age at birth, individual (G3) birth year fixed effects, indicatorsfor mother/father born during World War II (until currency reform).Background variables: Parental education, number of siblings.∗ p < 0.10, ∗∗ p < 0.05, ∗∗∗ p < 0.01
30

References
Andersen, H., Muhlbacher, A., Nubling, M., Schupp, J., and Wagner, G. (2007). Compu-
tation of standard values for physical and mental health scale scores using the SOEP
version of SF-12v2. Schmollers Jahrbuch, 127(1): 171–182.
Baten, J., Dorothee C., and Voth, H.-J. (forthcoming). Poor, hungry and stupid: numeracy
and the impact of high food prices in industrializing Britain, 1780–1850. Review of
Economics and Statistics.
Birg, H. (2001). Die demographische Zeitenwende: der Bevolkerungsrckgang in Deutschland
und Europa (Vol. 1426). CH Beck.
Blum, M. (2011). Government decisions before and during the First World War and the
living standards in Germany during a drastic natural experiment. Explorations in Eco-
nomic History, 48(4): 556–567.
Bygren, L., Kaati, G., and Edvinsson, S. (2001). Longevity determined by paternal ances-
tors nutrition during their slow growth period. Acta Biotheoretica, 49(1): 53–59.
Cooney, C. A. (2006). Germ cells carry the epigenetic benefits of grandmother’s diet.
Proceedings of the National Academy of Sciences, 103(46): 17071–17072.
Doblhammer, G., van den Berg, G. J. and Fritze, T. (2013). Economic conditions at the
time of birth and cognitive abilities late in life: evidence from ten European countries.
PLoS ONE, 8(9), e74915.
Elder, G. (1999). Children of the Great Depression: Social Change in Life Experience.
Westview Press.
Farooq, A. (2010). Tales of adversity. Nature, 468(7327): 20.
Fraga, M. F., Ballestar, E., Paz, M. F., Ropero, S., Setien, F., Ballestar, M. L. et al. (2005).
Epigenetic differences arise during the lifetime of monozygotic twins. Proceedings of the
National Academy of Sciences of the United States of America, 102(30): 10604–10609.
Francis, R. C. (2011). Epigenetics: The ultimate mystery of inheritance. WW Norton.
Gasser, T. (1996). Development of fat tissue and body mass index from infancy to adult-
hood. Pediatric Nephrology, 10(3): 340–342.
Gasser, T., Ziegler, P., Largo, R. H., Molinari, L., and Prader, A. (1994). A longitudinal
study of lean and fat areas at the arm. Annals of Human Biology, 21(4): 303–314.
Graff, J. and Mansuy, I. M. (2008). Epigenetic codes in cognition and behaviour. Be-
havioural Brain Research, 192(1): 70–87.
31

Grossniklaus, U., Kelly, B., Ferguson-Smith, A. C., Pembrey, M. and Lindquist, S. (2013).
Transgenerational epigenetic inheritance: how important is it? Nature Reviews Genetics,
14(3): 228–235.
Harper, L. V. (2005). Epigenetic inheritance and the intergenerational transfer of experi-
ence. Psychological Bulletin, 131(3): 340–360.
Heijmans, B. T., Tobi, E. W., Stein, A. D., Putter, H., Blauw, G. J., Susser, E. et al.
(2008). Persistent epigenetic differences associated with prenatal exposure to famine in
humans. Proceedings of the National Academy of Sciences, 105(44): 17046–17049.
Hochberg, Z., Feil, R., Constancia, M., Fraga, M., Junien, C., Carel, J.-C. et al. (2011).
Child health, developmental plasticity, and epigenetic programming. Endocrine Reviews,
32(2): 159–224.
Horiuchi S. (1983). The long-term impact of war on mortality: old-age mortality of the
First World War survivors in the Federal Republic of Germany. Population Bulletin
UN, 15: 80-92.
Huber, D. R. and Fogel, E. M. (1920). Food conditions and agricultural production. The
Annals of the American Academy of Political and Social Science, 92(1): 131–136.
Huegel, A. (2003).Kriegsernahrungswirtschaft Deutschlands wahrend des Ersten und Zweiten
Weltkrieges im Vergleich. Hartung-Gorre.
Jones, P. A., and Baylin, S. B. (2002). The fundamental role of epigenetic events in cancer.
Nature Reviews Genetics, 3(6): 415–428.
Kaati, G. (2010). Case studies on epigenetic inheritance, in: A. Haslberger and S. Gressler,
eds., Epigenetics and Human Health: Linking Hereditary, Environmental and Nutritional
Aspects. John Wiley & Sons.
Kaati, G., Bygren, L. O., and Edvinsson, S. (2002). Cardiovascular and diabetes mortality
determined by nutrition during parents’ and grandparents’ slow growth period. European
Journal of Human Genetics, 10(11): 682–688.
Kaati, G., Bygren, L. O., Pembrey, M., and Sjostrom, M. (2007). Transgenerational re-
sponse to nutrition, early life circumstances and longevity. European Journal of Human
Genetics, 15(7): 784–790.
Kimura, M., Cherkas, L. F., Kato, B. S., Demissie, S., Hjelmborg, J. B., Brimacombe, M. et
al. (2008). Offspring’s leukocyte telomere length, paternal age, and telomere elongation
in sperm. PLOS Genetics, 4(2): e37.
Klein, F. (1968). Deutschland im ersten Weltkrieg. Leipziger Universitatsverlag.
32
Kuzawa, C. W. and Thayer, Z. M. (2011). Timescales of human adaptation: the role of
epigenetic processes. Epigenomics, 3(2): 221–234.
Lindahl, M., Palme, M., Sandgren Massih, S., and Sjogren, A. (2013), Dynastic capital
and long-term intergenerational persistence of earnings and educational attainment.
Working paper, Stockholm University.
Lindeboom, M., Portrait, F. and van den Berg, G. J. (2010). Long-run effects on longevity
of a nutritional shock early in life: The Dutch Potato famine of 18461847. Journal of
Health Economics, 29(5): 617–629.
Low, F. M., Gluckman, P. D., and Hanson, M. A. (2012). Developmental plasticity, epige-
netics and human health. Evolutionary Biology, 39(4): 650–665.
Lumey L. H., A. D. Stein, and Susser, E. (2011). Prenatal famine and adult health. Annual
Review of Public Health, 32: 237–262.
Lundborg, P. and Stenberg, A. (2010). Nature, nurture and socioeconomic policy What
can we learn from molecular genetics? Economics & Human Biology, 8(3): 320–330.
Mamelund, S. E. (2003). Effects of the Spanish influenza pandemic of 1918-19 on later life
mortality of Norwegian cohorts born about 1900. Research Memorandum, University of
Oslo.
Marshall, W. and Tanner, J. (1968). Growth and physiological development during ado-
lescence. Annual Review of Medicine, 19(1): 283–300.
Masterpasqua, F. (2009). Psychology and epigenetics. Review of General Psychology, 13(3):
194–201.
Mayer, W., Niveleau, A., Walter, J., Fundele, R., and Haaf, T. (2000). Demethylation of
the zygotic paternal genome. Nature, 403(6769): 501–502.
McGowan, P. O., Sasaki, A., Huang, T. C. T., Unterberger, A., Suderman, M., Ernst, C.
et al. (2008). Promoter-wide hypermethylation of the ribosomal RNA gene promoter in
the suicide brain. PlOS ONE, 3(5): e2085.
Ordovas, J. M., and Smith, C. E. (2010). Epigenetics and cardiovascular disease. Nature
Reviews Cardiology, 7(9): 510–519.
Painter, R. C., Osmond, C., Gluckman, P., Hanson, M., Phillips, D. I. W., and Roseboom,
T. J. (2008). Transgenerational effects of prenatal exposure to the Dutch famine on
neonatal adiposity and health in later life. BJOG : An International Journal of Obstet-
rics and Gynaecology, 115(10): 1243–1249.
Pembrey, M. E. (2002). Time to take epigenetic inheritance seriously. European Journal of
Human Genetics, 10(11): 669–671.
33

Pembrey, M. E. (2010). Male-line transgenerational responses in humans. Human Fertility,
13(4): 268–271.
Pembrey, M. E., Bygren, L. O., Kaati, G., Edvinsson, S., Northstone, K., Sjostrom, M.
et al. (2006). Sex-specific, male-line transgenerational responses in humans. European
Journal of Human Genetics, 14(2): 159–166.
Radtke, K. M., Ruf, M., Gunter, H. M., Dohrmann, K., Schauer, M., Meyer, A. et al.
(2011). Transgenerational impact of intimate partner violence on methylation in the
promoter of the glucocorticoid receptor. Translational Psychiatry, 1(7): e21.
Raico, R. (1989). The politics of hunger: a review. The Review of Austrian Economics,
3(1): 253–259.
Roesle, E. E. (1928). Die Geburts- und Sterblichkeitsverhltnisse. In Bumm, F. (Ed.).
Deutschlands Gesundheitsverhltnisse unter dem Einfluss des Weltkrieges (Vol. 7). Deutsche
Verlags-Anstalt.
Scholte, R., van den Berg, G. J. and Lindeboom, M. (2012). Long-run effects of gestation
during the Dutch hunger winter famine on labor market and hospitalization outcomes.
IZA Working Papers, (6307).
Sparen, P., Vagero, D., Shestov, D. B., Plavinskaja, S., Parfenova, N., Hoptiar, V. et
al. (2004). Long term mortality after severe starvation during the siege of Leningrad:
prospective cohort study. British Medical Journal, 328(7430): 11.
Starling, E. H. (1919). Report on Food Conditions in Germany. HMSO.
Steckel, R. H. (2008). Biological measures of the standard of living. The Journal of Eco-
nomic Perspectives, 22(1): 129–152.
Sunder, M., and Woitek, U. (2005). Boom, bust, and the human body: further evidence
on the relationship between height and business cycles. Economics & Human Biology,
3(3): 450–466.
Tobi, E. W., Lumey, L. H., Talens, R. P., Kremer, D., Putter, H., Stein, A. D. et al. (2009).
DNA methylation differences after exposure to prenatal famine are common and timing-
and sex-specific. Human Molecular Genetics, 18(21): 4046–4053.
van den Berg, G. J., Doblhammer-Reiter, G., and Christensen, K. (2011). Being born under
adverse economic conditions leads to a higher cardiovascular mortality rate later in life:
evidence based on individuals born at different stages of the business cycle. Demography,
48(2): 507–530.
van den Berg, G. J., Lundborg, P., Nystedt, P., and Rooth, D.-O. (2009). Critical periods
during childhood and adolescence: A study of adult height among immigrant siblings.
34

IZA Working Papers, (4140).
van den Berg, G. J., Pinger, P. R., and Schoch, J. (2011). Instrumental variable estimation
of the causal effect of hunger early in life on health later in life. IZA Working Papers,
(6110).
Vincent, C. (1985). The Politics of Hunger: The Allied Blockade of Germany, 1915-1919.
Ohio University Press.
Waaler, H. (1984). Height, weight and mortality – the Norwegian experience. Acta Medica
Scandinavica, 215(S679): 1–56.
Wagner, G. G., Frick, J. R., and Schupp, J. (2007). The German socio-economic panel study
(SOEP) – scope, evolution and enhancements. Schmollers Jahrbuch, 127(1): 139–169.
Witte, W. (2008). Tollkirschen und Quarantane: Die Geschichte der Spanischen Grippe.
Wagenbach.
Woitek, U. (2003). Height cycles in the 18th and 19th centuries. Economics & Human
Biology, 1(2): 243–257.
Zeisel, S. H. (2007). Nutrigenomics and metabolomics will change clinical nutrition and
public health practice: insights from studies on dietary requirements for choline. Amer-
ican Journal of Clinical Nutrition, 86(3): 542–548.
35

Appendix
Table A. 1: Food consumption before and during the famine (per-cent of pre-war level)
Item July 1916 July 1917 July 1918until June 1917 until June 1918 until December 1918
Meat 31 20 12Fish 51 - 5Eggs 18 13 15Lard 14 11 7Butter 22 21 28Cheese 3 4 15Rice 4 - -Pulse 14 1 7Sugar 49 56-67 80Vegetable oil 39 41 17Potatoes 71 94 94Flour 53 47 48
Sources:reprinted from Arnulf Huegel, 2003, Kriegsernahrungswirtschaft Deutschlands wahrenddes Ersten und Zweiten Weltkrieges im Vergleich (pp 180).
36

Table A. 2: Prices for foodstuffs in Bonn (in Mark), 1914 to 1918
Product Unit Official Official Black market Increase1914 1917/18 1917/1918 (%)
Beef 1 lb 1 2.8 4.75 375Veal 1 lb 1 2.8 5 400Pork 1 lb 0.8 - 6 650
Gammon 1 lb 1.2 - 13 983Bacon 1 lb 0.7 2.75 15.5 2.114Suet 1 lb 0.4 2 14.5 3.525Lard 1 lb 0.8 5 18 2.15
Concentrated milk 1 can 0.5 1.7 4.5 800Butter 1 lb 1.3 3.4 14 977Curd 1 lb 0.2 2.3 3.5 1.65Eggs 1 piece 0.06 0.4 0.65 983
Colza oil 1 l 0.6 5 21.5 3.483Salad oil 1 l 1.4 - 24 1.614Olive oil 1 l 3 - 50 1.567Rye flour 1 lb 0.15 1.85 4 2.567
Wheat flour 1 lb 0.2 - 4 1.9Rice 1 lb 0.25 - 8 3.1
Source:reprinted from Blum, 2011 (original source Roerkohl, Anne, 1991), Government decisions before andduring World War I and the living standards in Germany during a drastic natural experiment (p.558).
37