supplemental material transgenerational inheritance of ... · pdf filesupplemental material ....
TRANSCRIPT

Environmental Health Perspectives doi:10.1289/ehp.1205701
Supplemental Material
Transgenerational Inheritance of Increased Fat Depot Size, Stem Cell
Reprogramming, and Hepatic Steatosis Elicited by Prenatal Obesogen
Tributyltin in Mice
Raquel Chamorro-García, Margaret Sahu, Rachelle J.Abbey, Jhyme Laude, Nhieu Pham
and Bruce Blumberg2
Table of Contents
Table S1. Number of litters per group .............................................................................................. 2
Table S2. Number of animals per group .......................................................................................... 3
Table S3. Primers used for QPCR analysis of gene expression .............................................. 4
Figure S1. Hematoxylin and eosin staining of sections of epididymal, peri-‐renal,interscapular white and interscapular brown adipose tissues from F1 males. ............. 5
Figure S2. Transgenerational effects of TBT on ovarian, perirenal, subscapular whiteand subscapular brown adipose tissues from F1, F2 and F3 female mice. ...................... 6
Figure S3. Transgenerational effects of TBT on the body weights of F1, F2 and F3mice.................................................................................................................................................................. 7
Figure S4. Gene expression profiles of MSCs from F1, F2 and F3 female mice............... 8
Figure S5. Macroscopic phenotype of livers from F1 males and females. ........................ 9
1

Table S1. Number of litters per group
DMSO ROSI TBT 5.42 nM TBT 54.2 nM TBT 542 nM F1 5 4 4 4 4 F2 5 4 4 5 4 F3 4 4 4 4 4
2

Table S2. Number of animals per group
DMSO ROSI TBT 5.42 nM TBT 54.2 nM TBT 542 nM
MALES
F1 16 10 11 11 11 F2 12 10 10 14 10
F3 11 15 14 10 11
FEMALES
F1 16 10 10 12 14 F2 16 10 10 11 10
F3 10 9 8 11 11
3

Table S3. Primers used for QPCR analysis of gene expression
Gene Forward Reverse
ACOX CAGGAAGAGCAAGGAAGTGG CCTTTCTGGCTGATCCCATA
ALP GGGACTGGTACTCGGATAACGA CTGATATGCGATGTCCTTGCA
β-actin GGCTGTATTCCCCTCCATCG CCAGTTGGTAACAATGCCATGT
Fabp4 AGCCCAACATGATCATCAGC TTTCCATCCCACTTCTGCAC
FATP GGCGTTTCGATGGTTATGTT CAGCTCGTCCATCACTAGCA
Fsp27/CideC CTGGAGGAAGATGGCACAAT GGGCCACATCGATCTTCTTA
FASN GTGTCCAAGAAGTGCAGCAA GGAGCGCAGGATAGACTCAC
GyK AATCCGCTGGCTAAGAGACAACCT CCCTGAAAATGCTGGAACGAAGTA
LPL ACAACCAGGCCTTCGAGATT TCAGGCCAGCTGAAGTAGGA
PPARα TTTCCCTGTTTGTGGCTGCTA CCCTCCTGCAACTTCTCAATG
PPARγ TGGGTGAAACTCTGGGAGATTC AATTTCTTGTGAAGTGCTCATAGGC
Pref-1 CCTGGCTGTGTCAATGGAGT CTTGTGCTGGCAGTCCTTTC
Runx2 TTTAGGGCGCATTCCTCATC TGTCCTTGTGGATTAAAAGGACTTG
SREBP1 ACGAAGTGCACACAAAAGCA GCCAAAAGACAAGGGGCTAC
Zfp423 TGGACCACCGTGATCTTACA TCGTTCTCGAACGTCATCTG
4

Figure S1. Hematoxylin and eosin staining of sections of epididymal, peri-renal,
interscapular white and interscapular brown adipose tissues from F1 males.
Adipose depots were dissected, fixed with buffered 3.7% formaldehyde and then
embedded, sectioned and stained with hematoxylin and eosin using standard methods in
the UCI Pathology Core facility. The bar represents 50 µm in each panel.
5

Figure S2. Transgenerational effects of TBT on ovarian, perirenal, subscapular
white and subscapular brown adipose tissues from F1, F2 and F3 female mice.
A) Adipose tissue weights were represented as the percentage of total body weight. B)
Relative adipocyte size in ovarian-, perirenal- and subscapular white- adipose tissues, and
lipid accumulation for subscapular brown adipose tissue. C) Number of adipocytes per fat
depot assayed by total DNA quantitation. All data are expressed as averages from 8-16
animals ± SEM. For statistical analyses, samples were assayed with one-way ANOVA
followed by Dunnett's posthoc test. *, P<0.05; **, P<0.01; ***, P<0.001.
6

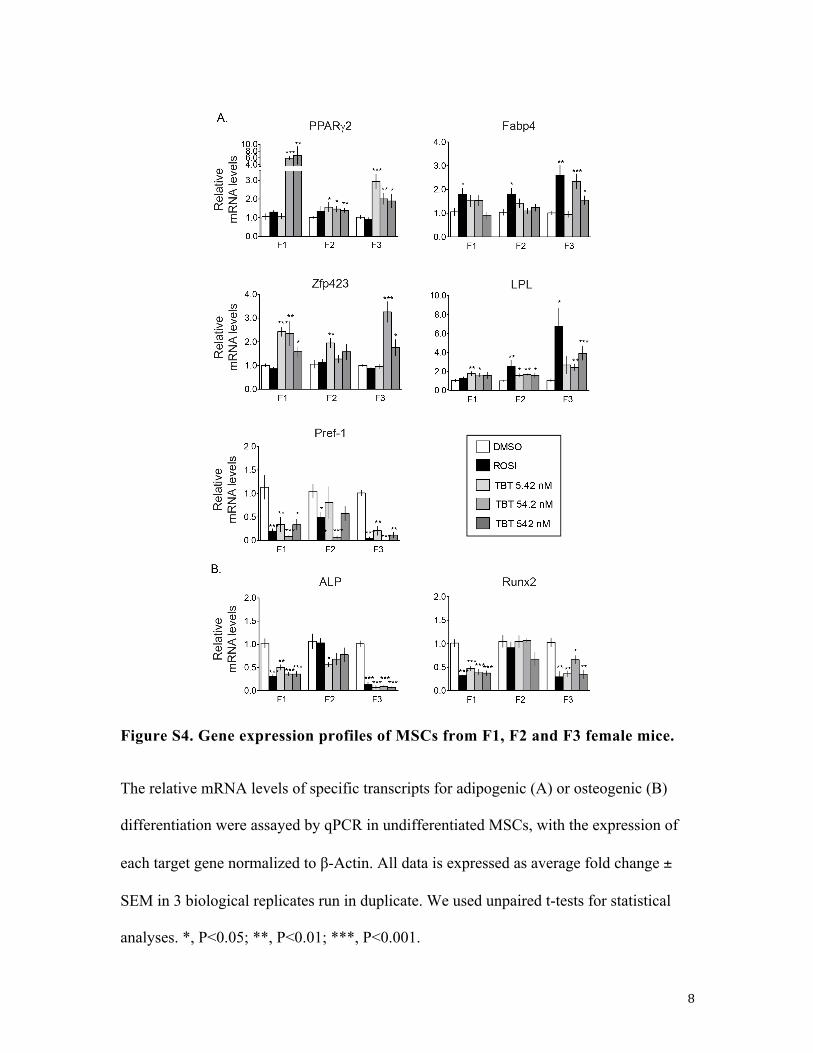
Figure S4. Gene expression profiles of MSCs from F1, F2 and F3 female mice.
The relative mRNA levels of specific transcripts for adipogenic (A) or osteogenic (B)
differentiation were assayed by qPCR in undifferentiated MSCs, with the expression of
each target gene normalized to β-Actin. All data is expressed as average fold change ±
SEM in 3 biological replicates run in duplicate. We used unpaired t-tests for statistical
analyses. *, P<0.05; **, P<0.01; ***, P<0.001.
8

Figure S5. Macroscopic phenotype of livers from F1 males and females.
Livers of representative animals were photographed during dissection to illustrate the
pale color of livers in treated animals.
9