a tutorial on the dynamics and control of wind...
TRANSCRIPT

A Tutorial on the Dynamics and Control of Wind Turbines and
Wind FarmsLucy Pao
Richard and Joy Dorf ProfessorElectrical, Computer, & Energy Engineering Department
University of Colorado at Boulder
Scientific DirectorCenter for Research and Education in Wind
IEEE-RRVS, November 2009Annual Joint IEEE RRVS, RRVS NIU Student Branch, & IEEE CSS Chapter Meeting

Lucy Y. Pao IEEE-RRVS, November 2009Acknowledgment
Grateful Acknowledgement to:
Kathryn Johnson
Clare Boothe Luce Assistant ProfessorDivision of Engineering
Colorado School of Mines
Colorado School of Mines Site DirectorCenter for Research and Education in Wind
L. Y. Pao and K. E. Johnson, “A Tutorial on the Dynamics and Control of Wind Turbines and Wind Farms,” Proc. American Control Conf., St. Louis, MO, pp. 2076-2089, June 2009.
Available at http://ecee.colorado.edu/~pao/ACC09WindTutorialSessionPresentations
This talk is based on our joint paper:

Lucy Y. Pao IEEE-RRVS, November 2009
Wind Energy
Fastest growing energy source in the world
Current global installed capacity exceeds 120,000 MW, with a projected growth of more than 20% per year for the next five years
Wind farms today produce electrical power at a Cost-of-Energy of approximately $0.03/kWh, comparable to that of coal and natural gas based power plants
Introduction 2
[data from www.wwindea.org]’08
World wind energy, total installed capacity

Lucy Y. Pao IEEE-RRVS, November 2009
Increasing Turbine Size
Typical size of utility-scale wind turbines has grown dramatically
Large flexible structures operating in uncertain environments [video]
Advanced controllers can help increase energy capture efficiency and reduce structural loading
[diagrams and schematic from www.renewableenergy.no, www.aerospaceweb.org/aircraft/jetliner/b747, and en.wikipedia.org/wiki/American_football]
Decrease the cost of wind energy
3Introduction

Lucy Y. Pao IEEE-RRVS, November 2009
Outline
Motivation and Wind Turbine Basics
Wind Turbine Control Loops
Issues in Turbine Control
Advanced Turbine Control
Wind Farms
Offshore Wind
Conclusions
4Outline

Lucy Y. Pao IEEE-RRVS, November 2009
Vertical vs. Horizontal Axis Wind Turbines
Vertical-axis wind turbines (VAWTs) more common among smaller turbines
HAWTs are the most commonly produced utility-scale wind turbines
Advantages of horizontal-axis wind turbines (HAWTs) Improved power capture capabilities Pitchable blades Improved structural performance
Introduction 5
[photo from www.symscape.com]
[photo courtesy of L. J. Fingersh, NREL]

Lucy Y. Pao IEEE-RRVS, November 2009
Vertical vs. Horizontal Axis Wind Turbines
Vertical-axis wind turbines (VAWTs) more common among smaller turbines
HAWTs are the most commonly produced utility-scale wind turbines
Advantages of horizontal-axis wind turbines (HAWTs) Improved power capture capabilities Pitchable blades Improved structural performance
Introduction 5
Horizontal Axis Wind Turbine
rotor
NREL’s Control Advanced Research Turbine (CART2)
nacelle
tower

Lucy Y. Pao IEEE-RRVS, November 2009
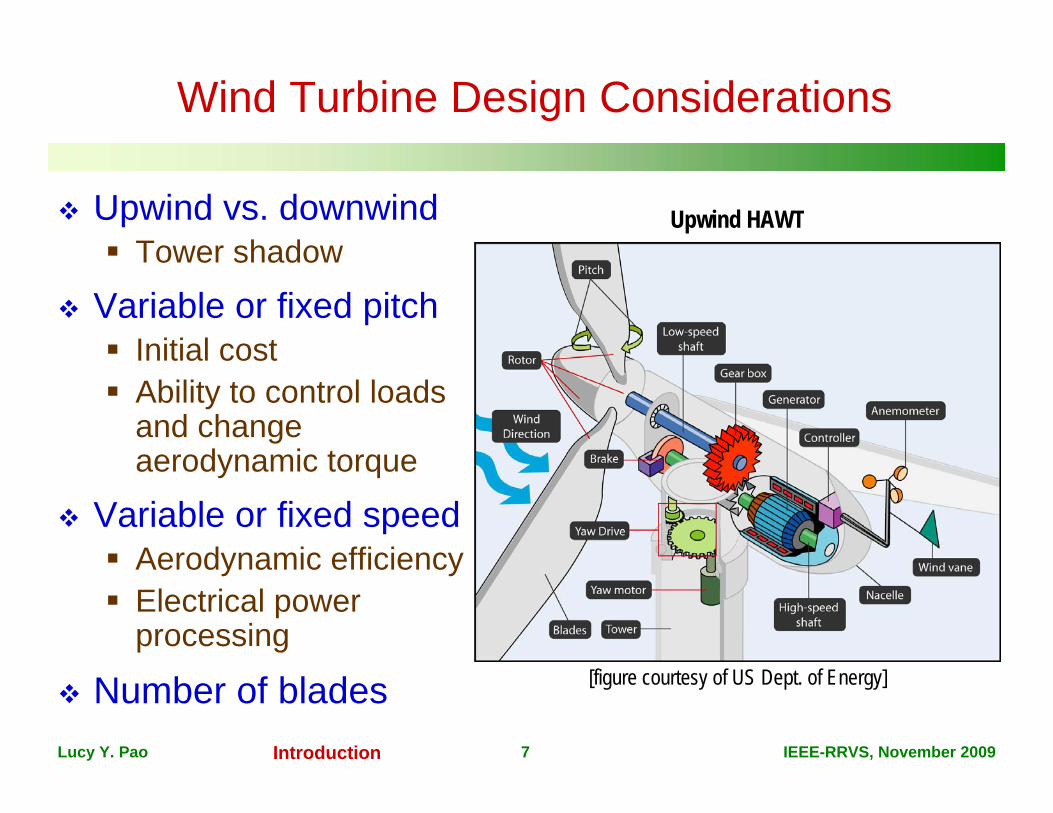
Wind Turbine Components
Wind encounters rotor, causing it to spin
Low-speed shaft transfers energy to the gear box Steps up speed Spins high-speed shaft
High-speed shaft causes generator to spin, producing electricity
Yaw system turns nacelle so that rotor faces into the wind
Introduction 6
[figure courtesy of US Dept. of Energy]
Upwind HAWT
Lucy Y. Pao IEEE-RRVS, November 2009
Wind Turbine Design Considerations
Upwind vs. downwind Tower shadow
Variable or fixed pitch Initial cost Ability to control loads
and change aerodynamic torque
Variable or fixed speed Aerodynamic efficiency Electrical power
processing
Number of bladesIntroduction 7
[figure courtesy of US Dept. of Energy]
Upwind HAWT

Lucy Y. Pao IEEE-RRVS, November 2009
Operating Regions Region 1: Low wind speed
(below 6 m/s) Wind turbines not run, because
power available in wind is low compared to losses in turbine system
Region 2: Medium wind speeds (6 m/s to 11.7 m/s) Variable-speed turbine captures
more power Fixed-speed turbine optimized for
one wind speed (10 m/s)– Max difference in example curves is
150 kW. For typical wind speed distributions,
in this example, variable-speed turbine captures 2.3% more energy than constant-speed turbine
Introduction 8
Region 3: High wind speeds (above 11.7 m/s) Power is limited to avoid exceeding safe electrical and mechanical load limits
Example Power Curves for 2.5 MW Wind Turbine
Region 1
WindPower
VariableSpeed
TurbinePower
Fixed Speed Turbine Power

Lucy Y. Pao IEEE-RRVS, November 2009
Outline
Motivation and Wind Turbine Basics Wind Turbine Control Loops
Wind Inflow Sensors Actuators Torque Control Pitch Control
Issues in Turbine Control Advanced Turbine Control Wind Farms Offshore Wind Conclusions
9Outline

Lucy Y. Pao IEEE-RRVS, November 2009
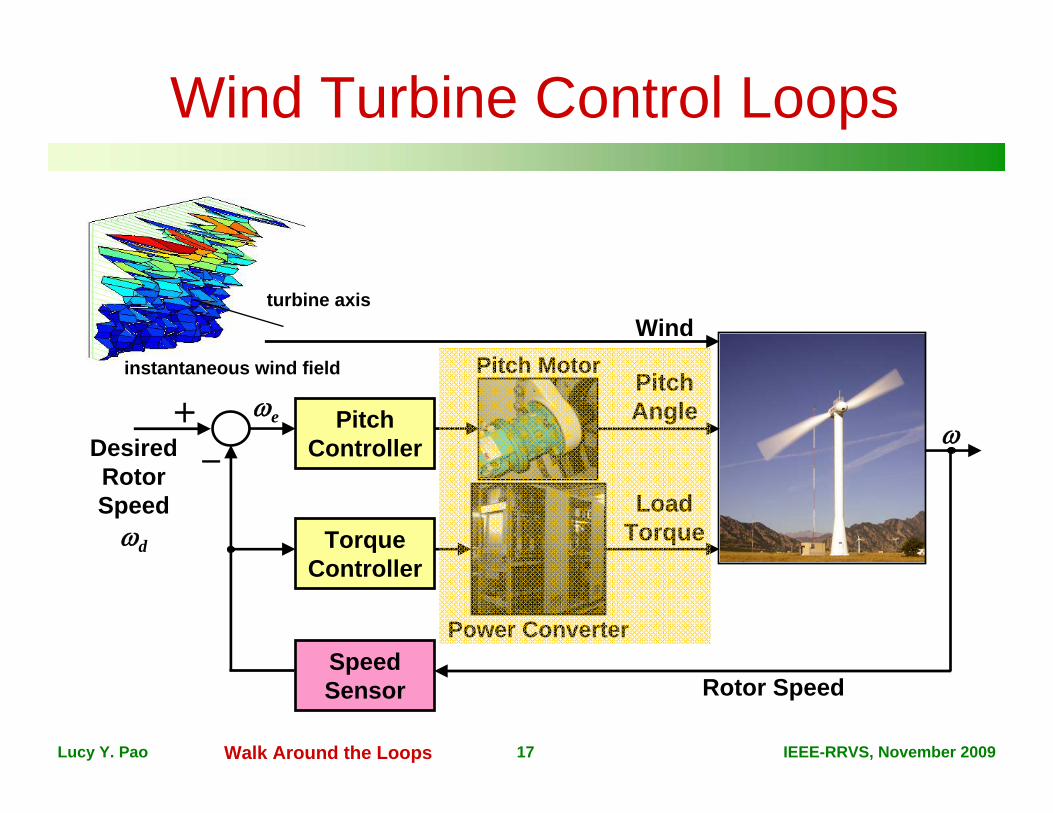
Wind Turbine Control Loops
Torque Controller
Pitch Controller
Wind
Desired Rotor Speedd
Speed Sensor
Pitch Motor
Power Converter
Rotor Speed
Pitch Angle
Load Torque
e
turbine axis
instantaneous wind field
10Walk Around the Loops

Lucy Y. Pao IEEE-RRVS, November 2009
Wind Inflow Differential heating of atmosphere
is driving mechanism for earth’s winds
Numerous phenomena affect wind inflow across a wind turbine’s rotor plane Sea breezes Frontal passages Mountain and valley flows Nocturnal low-level jet
Rotor plane of MW utility-scale turbines span from 60m to 180m above the ground
Virtually impossible to obtain a good measurement of the wind speed encountering the entire span of blades
11Walk Around the Loops
[Figure courtesy of R. Banta, Y. Pichugina, N. Kelley, B. Jonkman, and W. Brewer]
Hourly profiles of mean wind speed after sunset on 15 Sept 2003

Lucy Y. Pao IEEE-RRVS, November 2009
Characterizing the Wind
Average wind speed Spatial Temporal
Frequency distribution of wind speeds Spatial Temporal
Prevailing wind direction Frequency of other wind
directions
Capacity Factor
CF =actual energy output over time period
energy output if turbine operated at max output over same time period
12Walk Around the Loops
k
k
k
cw
cwkwf exp)(
1
c : scale parameter k : shape parameter
wind speed w (m/s)
prob
abilit
y den
sity
k = 1.5k = 2k = 2.5k = 3
Example Weibull Distributions

Lucy Y. Pao IEEE-RRVS, November 2009
Wind Turbine Control Loops
Torque Controller
Pitch Controller
Wind
Desired Rotor Speedd
Speed Sensor
Pitch Motor
Power Converter
Rotor Speed
Pitch Angle
Load Torque
e
turbine axis
instantaneous wind field
13Walk Around the Loops

Lucy Y. Pao IEEE-RRVS, November 2009
Sensors
Rotor speed measured on either high-speed (generator) or low-speed (rotor) shafts Gear box ratio known
Anemometers used for supervisory control purposes Usually located on
nacelle behind rotor plane
Power measurement devices
poor measurement of wind
[figure courtesy of US Dept. of Energy]
Upwind HAWT
14Walk Around the Loops

Lucy Y. Pao IEEE-RRVS, November 2009
Sensors
Rotor speed measured on either high-speed (generator) or low-speed (rotor) shafts Gear box ratio known
Anemometers used for supervisory control purposes Usually located on
nacelle behind rotor plane
Power measurement devices
poor measurement of wind
Several types of sonic and propeller anemometers on a meteorological tower at NREL’s NWTC
[Photo courtesy of L. J. Fingersh, NREL]15Walk Around the Loops

Lucy Y. Pao IEEE-RRVS, November 2009
Additional Sensors
Strain gauges Tower Blades
Accelerometers Position encoders Drive shaft Blade pitch
actuation systems
Torque transducers
16Walk Around the Loops
[figure courtesy of US Dept. of Energy]
Upwind HAWT
Lucy Y. Pao IEEE-RRVS, November 2009
Wind Turbine Control Loops
Torque Controller
Pitch Controller
Wind
Desired Rotor Speedd
Speed Sensor
Pitch Motor
Power Converter
Rotor Speed
Pitch Angle
Load Torque
e
turbine axis
instantaneous wind field
17Walk Around the Loops

Lucy Y. Pao IEEE-RRVS, November 2009
Actuators
Yaw motor Slow (usually < 1 deg/s)
Generator Fast (time constant usually
> 10x that of rotor speed)
[figure courtesy of US Dept. of Energy]
Upwind HAWT
18Walk Around the Loops

Lucy Y. Pao IEEE-RRVS, November 2009
Actuators
Yaw motor Slow (usually < 1 deg/s)
Generator Fast (time constant usually
> 10x that of rotor speed)
[Photo courtesy of L. J. Fingersh, NREL]
Inside the Nacelle of the 3-Bladed Controls Advanced Research Turbine (CART3) at NREL’s
National Wind Technology Center (NWTC)
CART3 is a 600 kW wind turbine with a 40 m rotor diameter that is used at NREL’s
NWTC as an experimental test bed for advanced controllers.
18Walk Around the Loops

Lucy Y. Pao IEEE-RRVS, November 2009
Actuators
Blade pitch motor Fast
– Up to 18 deg/s for 600 kW turbines– Up to 8 deg/s for 5 MW turbines
Collective vs. Individual Pitch
[Photo courtesy of L. J. Fingersh, NREL]
Three pitch motors on the CART3 Yaw motor Slow (usually < 1 deg/s)
Generator Fast (time constant usually
> 10x that of rotor speed)
CART3 is equipped with independent blade pitch capability.
18Walk Around the Loops

Lucy Y. Pao IEEE-RRVS, November 2009
More on Actuators Operational blade pitch angle data from CART2: CART2 is a 2-bladed, 600 kW
wind turbine with a 43 m diameter rotor at NREL’s NWTC
Data from a normal shut-down event caused by the wind speed decreasing into Region 1• Pitch rate limited to approx 5 deg/s• Lag between commanded and
actual pitch can be represented by a 1st-order filter
19Walk Around the Loops
Teetering hinge on 2-bladed turbines Allows rotor to respond to differential loads
when blades in vertical position

Lucy Y. Pao IEEE-RRVS, November 2009
Torque Control
Torque Controller
Pitch Controller
Wind
Desired Rotor Speedd
Speed Sensor
Pitch Motor
Power Converter
Rotor Speed
Pitch Angle
Load Torque
e
turbine axis
instantaneous wind field
20Walk Around the Loops

Lucy Y. Pao IEEE-RRVS, November 2009
“Standard” Torque Control
c = generator (control) torque
= measured rotor speed = air density R = rotor radius CPmax = maximum power
coefficient * = optimum tip-speed ratio
35
2
max
21
ˆ
p
c
CRK
K
21Walk Around the Loops
Tip-speed ratio:wR

Lucy Y. Pao IEEE-RRVS, November 2009
Torque Control: Perfect Measurements
When measurements are perfect and turbine is perfectly modeled, “standard” torque control leads to optimal operation in the steady-state
3*
325 max
21
1
pp
caero
CCR
J
J
0
0
33*
33*
max
max
pp
pp
CC
CC
22Walk Around the Loops

Lucy Y. Pao IEEE-RRVS, November 2009
Torque Control Summary
Data from CART2
Key features of standard torque control Nonlinear Only required
measurement is rotor speed
Saturates at rotor speeds near rated
Speed regulation achieved via pitch control
23Walk Around the Loops

Lucy Y. Pao IEEE-RRVS, November 2009
Pitch Control
Torque Controller
Pitch Controller
Wind
Desired Rotor Speedd
Speed Sensor
Pitch Motor
Power Converter
Rotor Speed
Pitch Angle
Load Torque
e
turbine axis
instantaneous wind field
24Walk Around the Loops

Lucy Y. Pao IEEE-RRVS, November 2009
PID Pitch Control
Speed regulation at high winds typically achieved using PID pitch control
e = error in rotor speed d = desired rotor speed c = control pitch angle
Pitch rate actuation limits may be up to 8 deg/s
dPKe
s
KI
sKD
c
25Walk Around the Loops

Lucy Y. Pao IEEE-RRVS, November 2009
Pitch Control Variations
Derivative term may be filtered to reduce measurement noise errors
KP, KI, and KD may be gain scheduled due to system nonlinearities
Pitch control signal can be given as angle or rate of change
Pitch control may be collective or independent MIMO control options available
sKDe
s
0
0.2
0.4
0.6
0.8
1
1.2
2 4 6 8 10 12 14 16 18 20 22
Blade Pitch (deg.)
Gai
n Sc
hedu
le F
acto
r GS
26Walk Around the Loops

Lucy Y. Pao IEEE-RRVS, November 2009
Pitch and Torque Control
Pitch control saturated below rated Saturation
value chosen to optimize energy capture
Pitch and torque control loops complement each other
27Walk Around the Loops

Lucy Y. Pao IEEE-RRVS, November 2009
Outline
Motivation and Wind Turbine Basics Wind Turbine Control Loops Issues in Turbine Control Size Multiple control loops Control while stopped Modeling inaccuracies
Advanced Turbine Control Wind Farms Offshore Wind Conclusions
28Outline

Lucy Y. Pao IEEE-RRVS, November 2009
Increasing Turbine Size
Increased flexibility may lead to structural vibrations Tower motion (fore-aft and
side-to-side) Drive train torsion Blade bending and twisting
Rotor is larger than some “coherent” wind turbulence structures Requires individual blade
pitch control [diagrams and schematic from www.renewableenergy.no, www.aerospaceweb.org/aircraft/jetliner/b747, and en.wikipedia.org/wiki/American_football]
29Turbine Control Issues

Lucy Y. Pao IEEE-RRVS, November 2009
Multiple Control Loops
Transition between regions 2 and 3 sometimes leads to maximum turbine loads
Switching between torque and pitch control may exacerbate problem
CART2 field data during a bad transition
30Turbine Control Issues

Lucy Y. Pao IEEE-RRVS, November 2009
Control while Stopped
Supervisory control may stop turbines due to faults or high winds
Little active control usually performed while stopped Yaw control may still be
performed to point turbine into the wind
Extreme loads may occur during “parked” conditions, usually in high winds
Fault detection and health monitoring are also of interest
Most active control performed here
31Turbine Control Issues

Lucy Y. Pao IEEE-RRVS, November 2009
Modeling Inaccuracies
Torque control assumes perfect knowledge of the turbine’s Cp surface Errors can be costly
Effect of a 5% modeling error in the optimal tip speed ratio Energy loss of around 1% - 3% in Region 2 Assume we reach DOE’s 20% Wind Energy by 2030 goal
– requires ~300 GW of installed capacity
Assume the cost of energy is $0.03 per kilowatt-hour (kWh)
Thus, a 1% loss of energy is equivalent to a loss of $630 million per year
32Turbine Control Issues

Lucy Y. Pao IEEE-RRVS, November 2009
Advanced Control Strategies
Adaptive control
Feedforward control Using wind speed estimates Using wind speed measurements
Lots of others under development
TURBINEFEEDBACKCONTROLLER
FEEDFORWARDCONTROLLER
-
33Advanced Control

Lucy Y. Pao IEEE-RRVS, November 2009
Advanced Blades
New configurations and actuators under development Multiple pitch actuators per
blade– Will allow different pitch angles
at different radial positions Microtabs
– Will change aerodynamic forces Air valves
– Will change aerodynamic forces
Advanced blade concepts will likely require new control systems
Multiple pitch actuators per blade
Microtabs (not to scale)
34Advanced Control

Lucy Y. Pao IEEE-RRVS, November 2009
Outline
Motivation and Wind Turbine Basics
Wind Turbine Control Loops
Issues in Turbine Control
Advanced Turbine Control
Wind Farms
Offshore Wind
Conclusions
35Outline

Lucy Y. Pao IEEE-RRVS, November 2009
Wind Farm Considerations
Wind farms can take advantage of economies of scale
May differ from individual turbines in noise safety visual environmental effects
36Wind Farms

Lucy Y. Pao IEEE-RRVS, November 2009
Wind Farm Layouts and Control
Control focuses Electricity Aerodynamics
Control goal is to maximize “array efficiency”given existing configuration
37Wind Farms

Lucy Y. Pao IEEE-RRVS, November 2009
Offshore Wind Motivation
Advantages to offshore wind Wind resource typically higher and more
consistent Turbine size is not
limited by transportation constraints Visual and noise effects
can be avoided more easily More area available,
especially near population centers
38Offshore Wind
Lucy Y. Pao IEEE-RRVS, November 2009
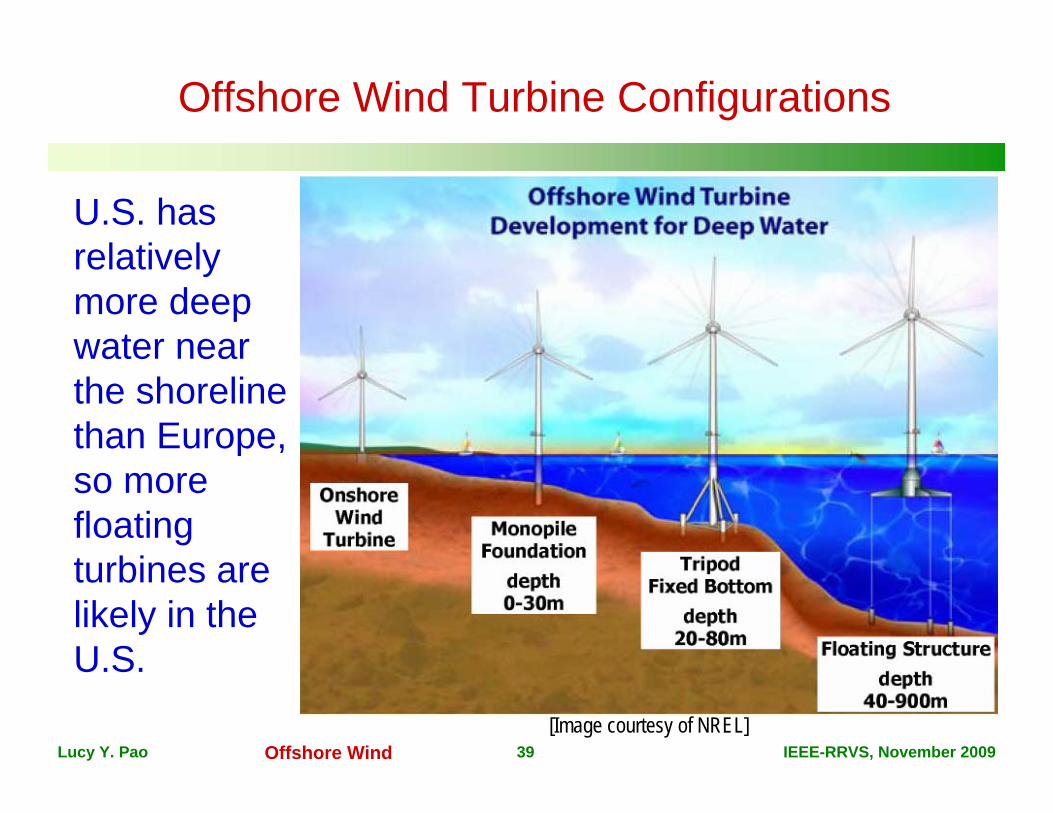
Offshore Wind Turbine Configurations
U.S. has relatively more deep water near the shoreline than Europe, so more floating turbines are likely in the U.S.
[Image courtesy of NREL]39Offshore Wind

Lucy Y. Pao IEEE-RRVS, November 2009
Floating Platforms
Floating platform configurations have been borrowed from offshore oil rig technologies
[Image courtesy of NREL]40Offshore Wind

Lucy Y. Pao IEEE-RRVS, November 2009
Offshore Wind Challenges
Waves can excite structural modes for both floating and fixed offshore turbines
Deep water anchors are expensive U.S. has more deep water near
population centers than Europe
What is the best way to control a floating inverted pendulum with a large spinning mass at its top? What actuators are necessary? How will control affect the energy
capture?
41Offshore WindGraphic courtesy of NREL

Lucy Y. Pao IEEE-RRVS, November 2009
Conclusions
Large, flexible turbines lend themselves to control solutions, and turbines are getting larger and more flexible
Existing turbine controllers tend not to take advantage of the wealth of available control theory Industry has been slow to adopt
advanced control strategies for both individual turbines and wind farms
Offshore wind turbine control is a big prospective area for research
42Conclusions

Lucy Y. Pao IEEE-RRVS, November 2009
Thank You
Thanks