a targeted proteomic assay quantifies the periodic
TRANSCRIPT

A targeted proteomic assay quantifies the periodic expression of cell-cycle regulators in
yeast S. cerevisiae
Matt Foster, Ph.D.
Duke University Proteomics and Metabolomics Shared Resource
Acknowledgements
ArthurMoseley
ErikSoderblom
DPMSR Duke Biology
Steve Haase
Tina Kelliher$$$ - DARPA
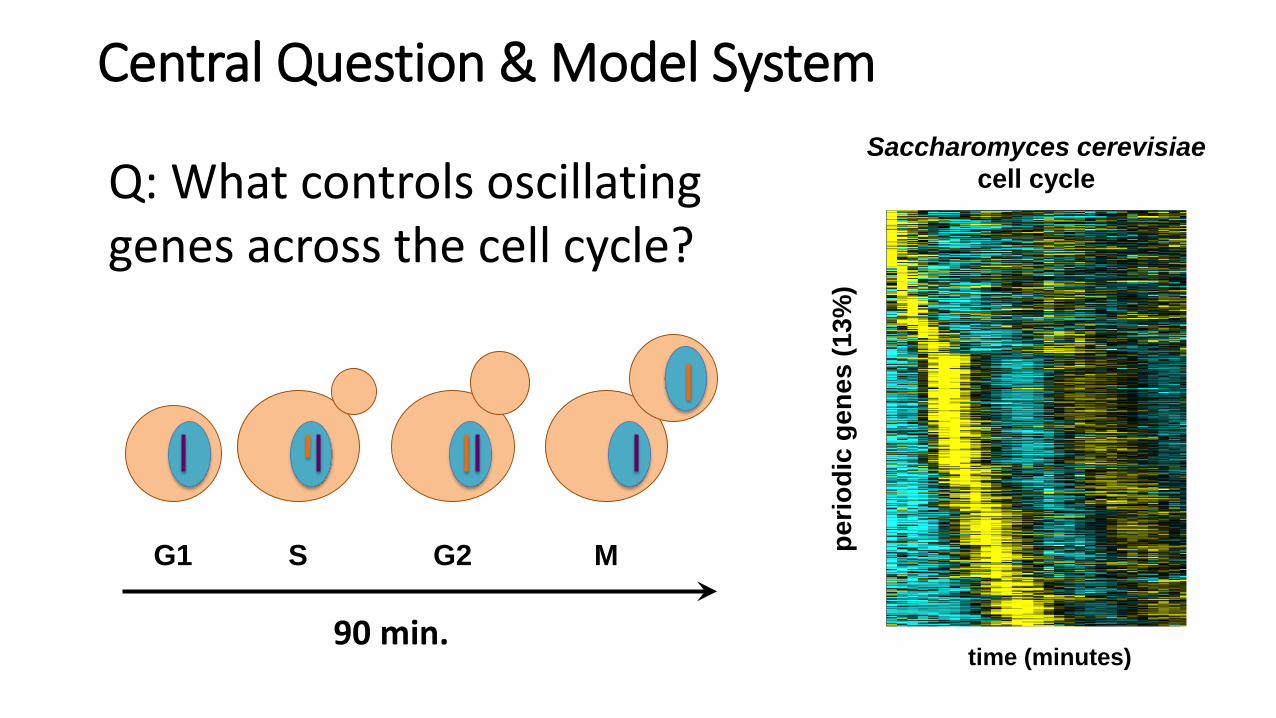
Central Question & Model System
time (minutes)
perio
dic
gene
s (1
3%)
Saccharomyces cerevisiaecell cycle
G1 S G2 M
90 min.
Q: What controls oscillating genes across the cell cycle?
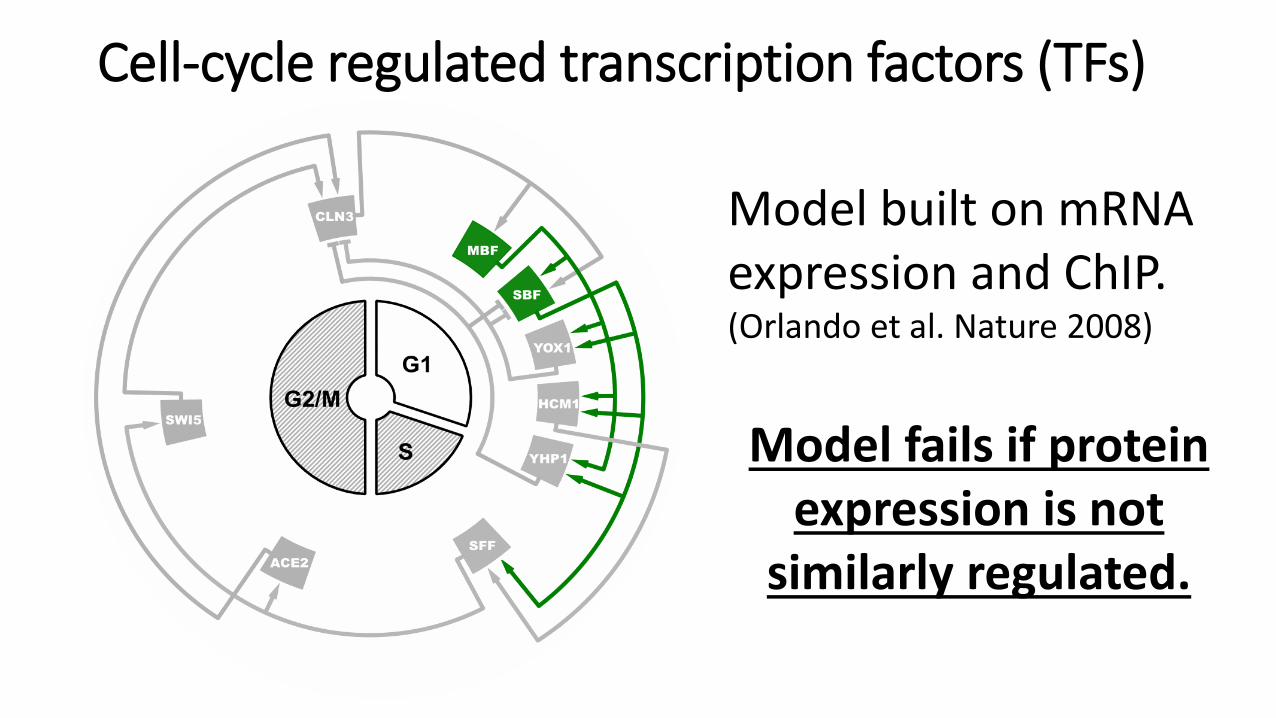
Cell-cycle regulated transcription factors (TFs)
Model built on mRNA expression and ChIP.(Orlando et al. Nature 2008)
Model fails if protein expression is not
similarly regulated.
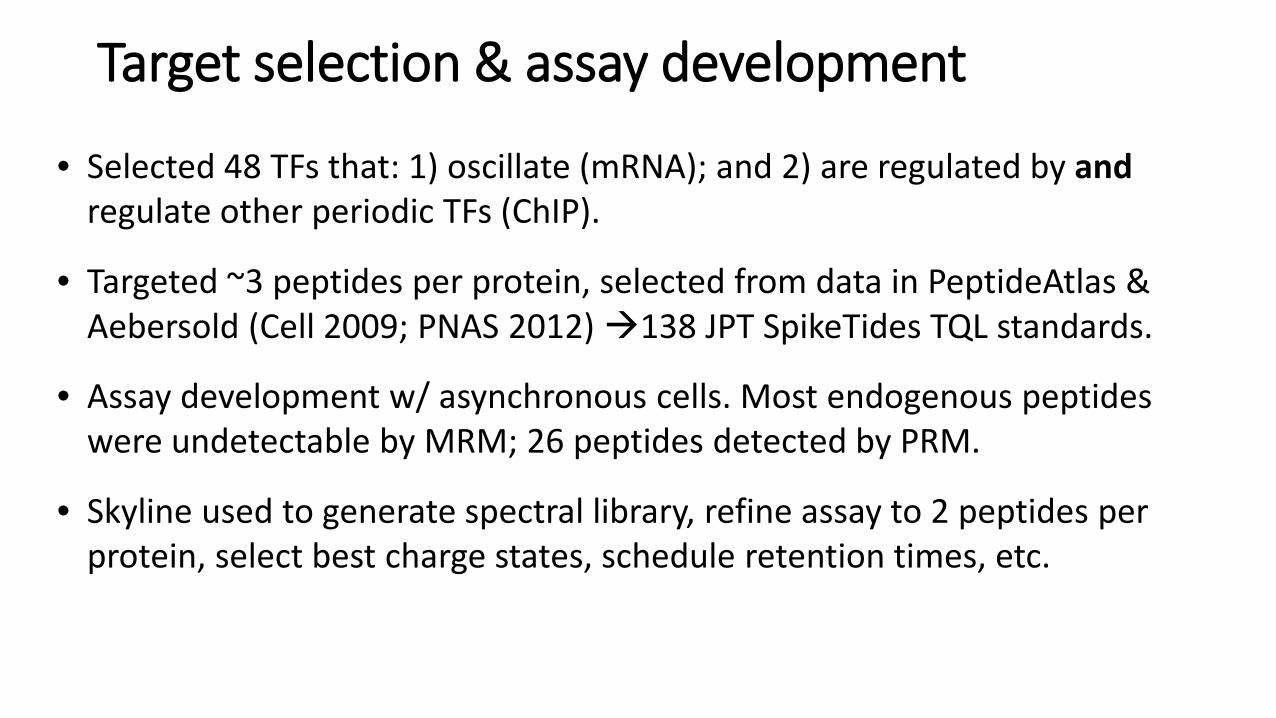
Target selection & assay development
• Selected 48 TFs that: 1) oscillate (mRNA); and 2) are regulated by andregulate other periodic TFs (ChIP).
• Targeted ~3 peptides per protein, selected from data in PeptideAtlas & Aebersold (Cell 2009; PNAS 2012) 138 JPT SpikeTides TQL standards.
• Assay development w/ asynchronous cells. Most endogenous peptides were undetectable by MRM; 26 peptides detected by PRM.
• Skyline used to generate spectral library, refine assay to 2 peptides per protein, select best charge states, schedule retention times, etc.
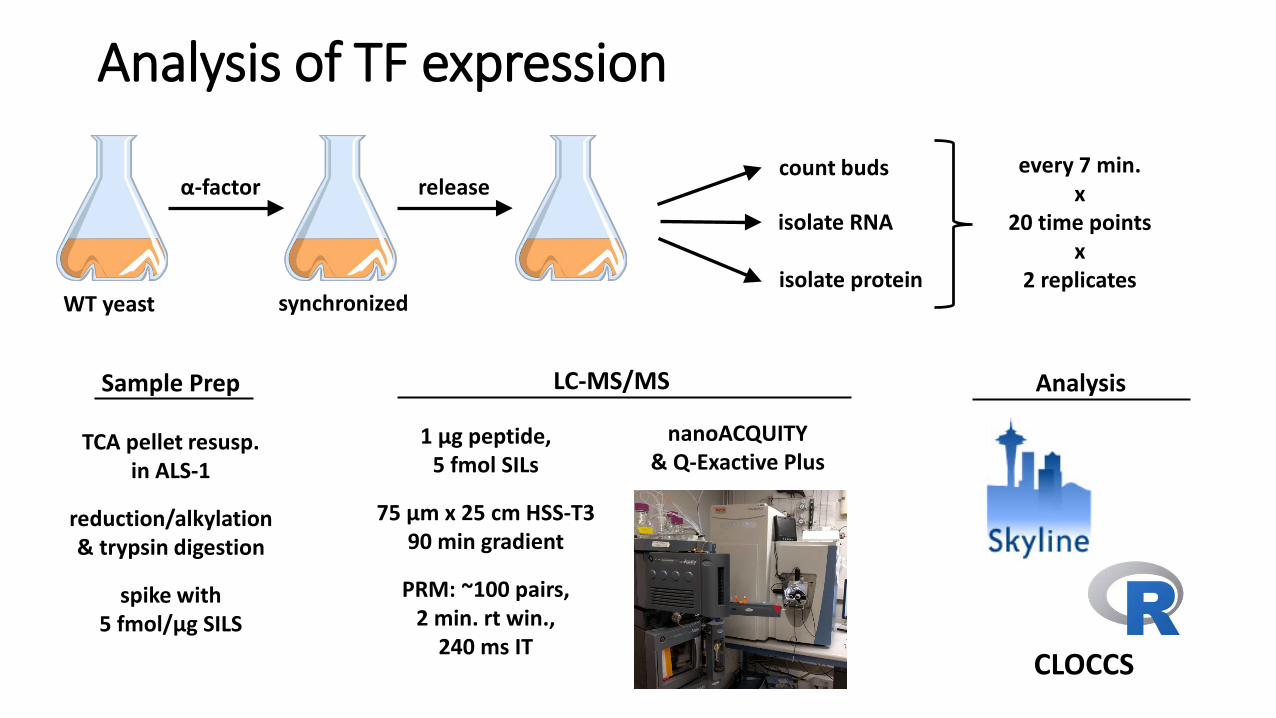
Analysis of TF expression
releaseα-factor
synchronized
count buds
isolate RNA
isolate proteinWT yeast
every 7 min.x
20 time pointsx
2 replicates
nanoACQUITY& Q-Exactive Plus
1 µg peptide,5 fmol SILs
75 µm x 25 cm HSS-T390 min gradient
PRM: ~100 pairs,2 min. rt win.,
240 ms IT
AnalysisSample Prep
TCA pellet resusp.in ALS-1
reduction/alkylation& trypsin digestion
spike with5 fmol/µg SILS
CLOCCS
LC-MS/MS

Raw data – TOS4Un-normalized, acquisition order normalized to SIL, acquisition order
Normalized to heavy, ordered to collection
time:QCs
* * ***
*QCs
7 21 35 49 63 77 91 105 119 133min.
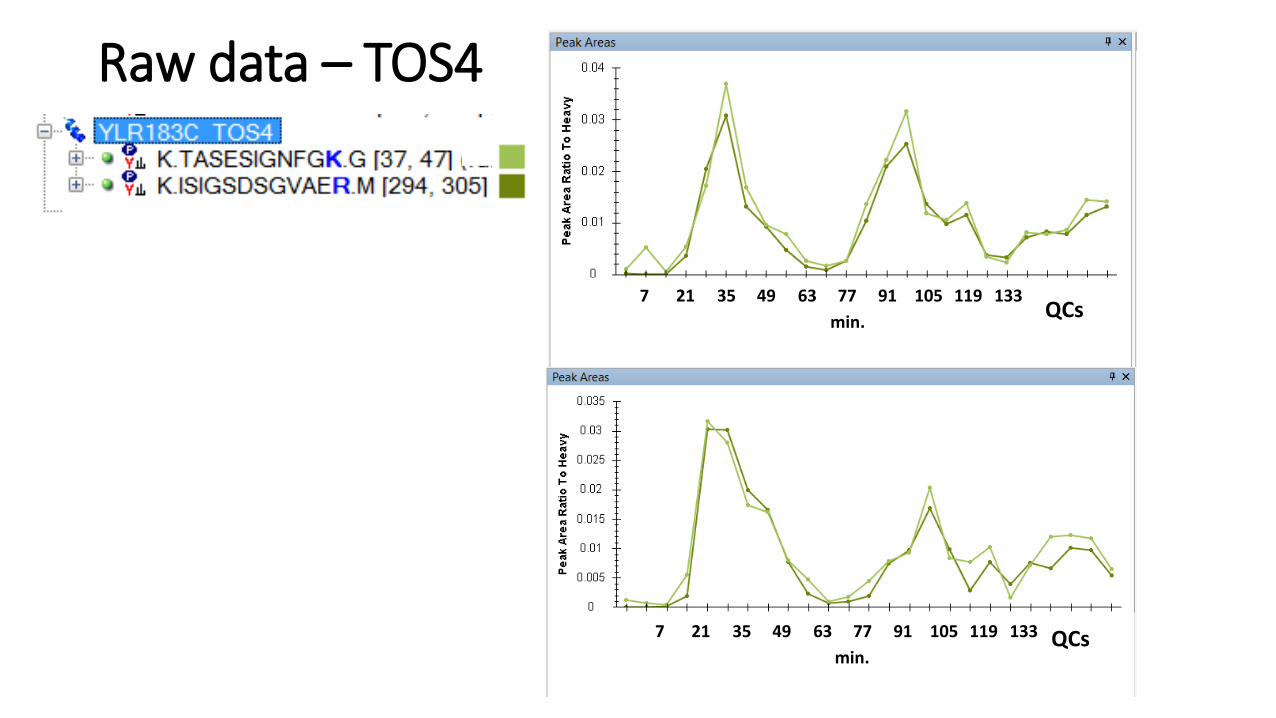
Raw data – TOS4
QCs
QCs7 21 35 49 63 77 91 105 119 133min.
7 21 35 49 63 77 91 105 119 133min.
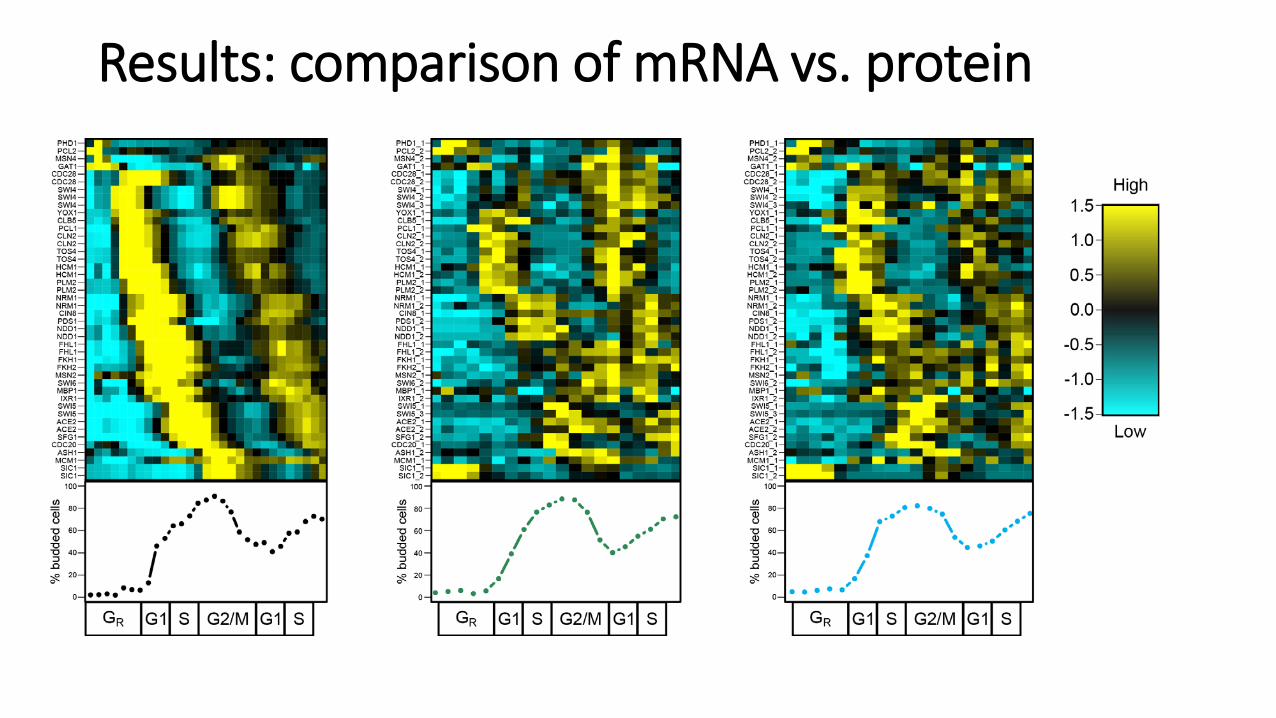
Results: comparison of mRNA vs. protein
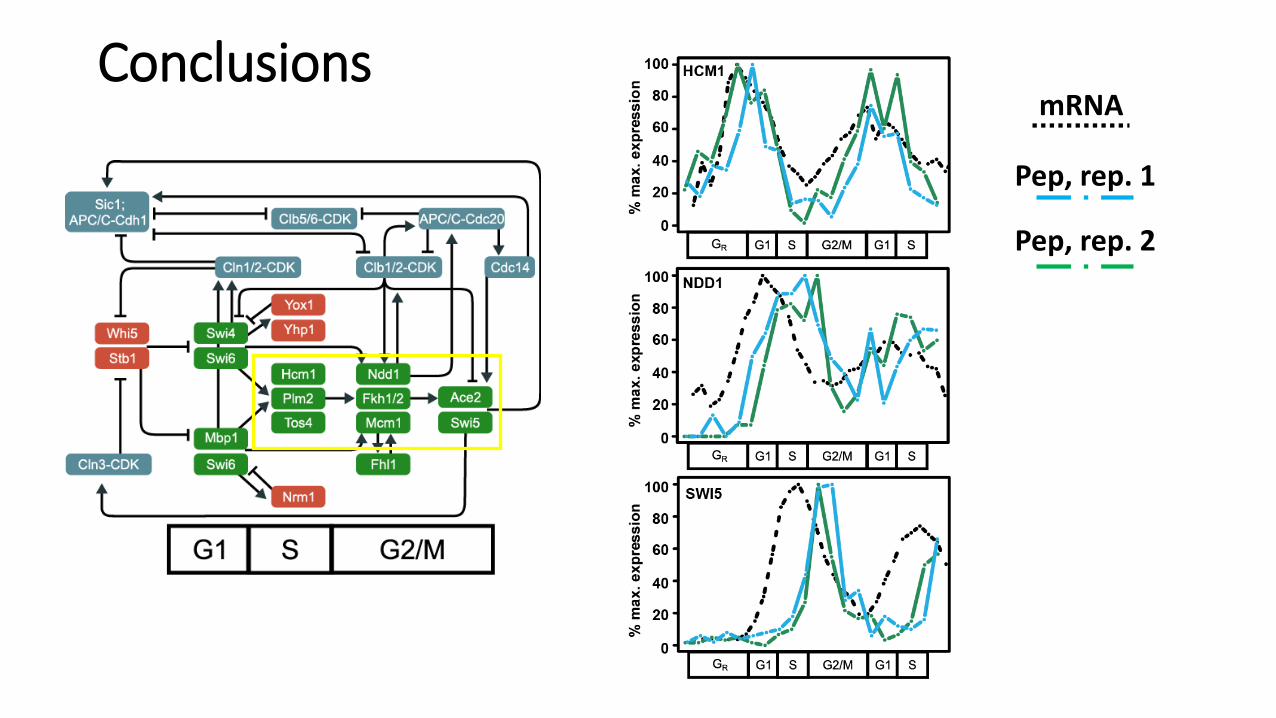
ConclusionsmRNA
Pep, rep. 1
Pep, rep. 2