mass spectrometry identifies and quantifies 74 unique ... · mass spectrometry identifies and...
TRANSCRIPT
Mass spectrometry identifies and quantifies 74unique histone H4 isoforms in differentiatinghuman embryonic stem cellsDoug Phanstiel*, Justin Brumbaugh†, W. Travis Berggren‡§, Kevin Conard‡, Xuezhu Feng¶, Mark E. Levenstein‡,Graeme C. McAlister*, James A. Thomson‡¶�**, and Joshua J. Coon*††‡‡
Departments of *Chemistry, ††Biomolecular Chemistry, and ¶Anatomy, †Integrated Program in Biochemistry, �Genome Center of Wisconsin, and **WisconsinNational Primate Research Center, University of Wisconsin, Madison, WI 53706; and ‡WiCell Research Institute, Madison, WI 53706
Edited by Fred W. McLafferty, Cornell University, Ithaca, NY, and approved January 7, 2008 (received for review November 5, 2007)
Epigenetic regulation through chromatin is thought to play acritical role in the establishment and maintenance of pluripotency.Traditionally, antibody-based technologies were used to probe forspecific posttranslational modifications (PTMs) present on histonetails, but these methods do not generally reveal the presence ofmultiple modifications on a single-histone tail (combinatorialcodes). Here, we describe technology for the discovery and quan-tification of histone combinatorial codes that is based on chroma-tography and mass spectrometry. We applied this methodology todecipher 74 discrete combinatorial codes on the tail of histone H4from human embryonic stem (ES) cells. Finally, we quantified theabundances of these codes as human ES cells undergo differenti-ation to reveal striking changes in methylation and acetylationpatterns. For example, H4R3 methylation was observed only in thepresence of H4K20 dimethylation; such context-specific patterningexemplifies the power of this technique.
electron transfer dissociation � epigenetics � posttranslational modification �histone code � pluripotency
P luripotency—the ability to differentiate into any specializedlineage—is the hallmark of embryonic stem (ES) cells and
the basis for their experimental and therapeutic potential. Theprecise molecular mechanisms that define pluripotency remainelusive; however, a number of recent works suggest a central rolefor epigenetic regulation through chromatin (1–6). Either byrecruiting or shielding certain factors, modifications on histoneproteins modulate a gene’s local environment and therebyregulate expression (7–12). Concerted changes in histone mod-ification states occur during differentiation (13). For example,high levels of histone H3 and H4 acetylation are characteristic ofpluripotent cells in mice and the abundance of these marksdecreases during differentiation (14, 15). Methylation of R2,R17, and R26 of histone H3 by CARM1 also correlates with cellfate and potency (6). Cells with higher levels of methylation, atthese residues, were enriched in the embryonic part of theblastocyst. Next, specific patterns of histone H3K4me3 andH3K27me3 are observed at promoter regions of genes that areregulated during differentiation (1, 2). Finally, demethylation ofH3K27me3 is required for activation of certain HOX genesessential for proper development (16, 17). The demethylaseresponsible interacts directly with MLL 2/3 complexes, whichmethylate histone H3K4 (18). Taken together these experimentshave shed new light on the power of epigenetic regulation withinES cells; however, the precise details and role(s) of suchcombinatorial PTM patterns remain largely unknown.
Technological limitations in our ability to discover and quan-tify combinatorial histone PTMs has, and continues to, presenta major obstacle. Most of our knowledge of epigenetics has beenderived by antibody-based approaches. Antibodies require apriori knowledge of individual modifications, are subject toepitope occlusion, and have difficulty distinguishing PTM pat-terns. Imagine the code as a complete sentence, antibodies can
identify letters or sometimes words, but these words and letterslack context. Mass spectrometry-based (MS) sequencing meth-ods, however, are rapidly evolving, have high sensitivity, and canidentify and quantitate PTM patterns without a priori knowledge(19–29). Here, we have developed and applied a method for thediscovery and quantification of histone H4 combinatorial codesthat is based on chromatography and recently developed MStechnology. First, intact histone H4 tails are chromatographi-cally separated by using nanoflow high-performance liquidchromatography (nHPLC) wherein the eluate is sampled directlyby either a hybrid linear quadrupole ion trap-orbitrap MS(orbitrap) or a linear quadrupole ion trap MS (QLT). Theorbitrap records the mass of each eluting histone tail withextraordinary mass accuracy for assignment of overall PTMstate, whereas the QLT employs electron transfer dissociation(ETD) to pinpoint the exact residue(s) carrying the individualPTMs. We and others have used a similar approach to study themodifications present on the N-terminal tail of histone H3 (20,22, 30). Here, we apply this methodology to decipher 74 discretecombinatorial codes occurring on the intact tail of histone H4from human ES cells. Finally, we quantified the abundances ofthese codes as human ES cells undergo differentiation, recordedstriking changes in global methylation and acetylation patterns,and observed that methylation of H4R3 is only observed in thepresence of H4K20 dimethylation.
ResultsCell Lines and Treatments. Federally registered human ES cell linesH1, H7, and H9 and human fibroblasts IMR90 (a model for fullydifferentiated, noncancerous cells) were used in this study.Treatment with 12-O-tetradecanoylphorbol-13-acetate (TPA), apotent differentiation agent, induced a rapid (within 24 h)epithelial–mesenchymal transition and a drastic change in EScell morphology [supporting information (SI) Fig. 4]. In contrastto the control human ES cell sample, single cells are readilydistinguished with nuclei that are smaller and darker; further,cells are spread throughout the growth surface rather thanremaining in tight colonies. Fibroblast morphology was un-changed (data not shown). To determine on a molecular levelwhether cells had retained pluripotency, treated and controlsamples were immunostained by using an anti-Oct4 antibody and
Author contributions: D.P., J.B., W.T.B., J.A.T., and J.J.C. designed research; D.P., J.B., W.T.B.,K.C., X.F., and M.E.L. performed research; G.C.M. contributed new reagents/analytic tools;D.P., J.B., and J.J.C. analyzed data; and D.P., J.B., and J.J.C. wrote the paper.
The authors declare no conflict of interest.
This article is a PNAS Direct Submission.
§Present address: Salk Institute for Biological Studies, La Jolla, CA 92037.
‡‡To whom correspondence should be addressed. E-mail: [email protected].
This article contains supporting information online at www.pnas.org/cgi/content/full/0710515105/DC1.
© 2008 by The National Academy of Sciences of the USA
www.pnas.org�cgi�doi�10.1073�pnas.0710515105 PNAS � March 18, 2008 � vol. 105 � no. 11 � 4093–4098
BIO
CHEM
ISTR
YCH
EMIS
TRY
analyzed by flow cytometry (Oct4 is an established marker forpluripotency; SI Fig. 4). An anti-IgG antibody was included as acontrol for nonspecific binding. Untreated human ES cellsstained positive for Oct4, whereas TPA-treated cells (72 h)showed no appreciable signal above the anti-IgG control.
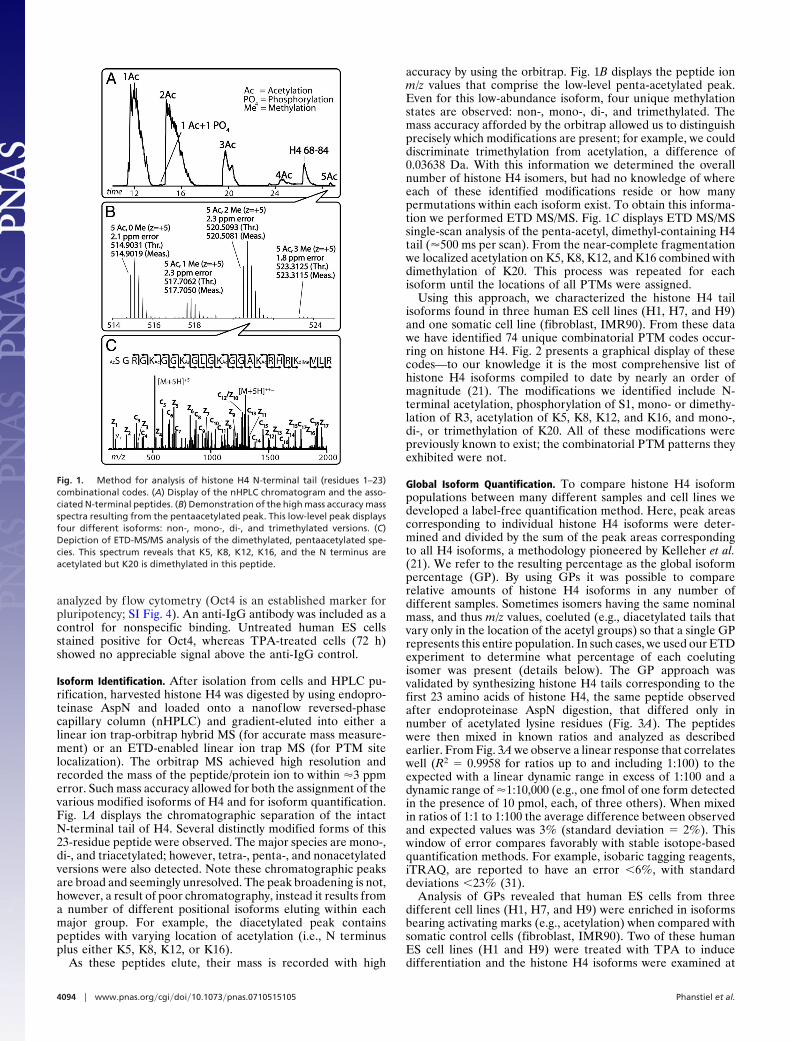
Isoform Identification. After isolation from cells and HPLC pu-rification, harvested histone H4 was digested by using endopro-teinase AspN and loaded onto a nanoflow reversed-phasecapillary column (nHPLC) and gradient-eluted into either alinear ion trap-orbitrap hybrid MS (for accurate mass measure-ment) or an ETD-enabled linear ion trap MS (for PTM sitelocalization). The orbitrap MS achieved high resolution andrecorded the mass of the peptide/protein ion to within �3 ppmerror. Such mass accuracy allowed for both the assignment of thevarious modified isoforms of H4 and for isoform quantification.Fig. 1A displays the chromatographic separation of the intactN-terminal tail of H4. Several distinctly modified forms of this23-residue peptide were observed. The major species are mono-,di-, and triacetylated; however, tetra-, penta-, and nonacetylatedversions were also detected. Note these chromatographic peaksare broad and seemingly unresolved. The peak broadening is not,however, a result of poor chromatography, instead it results froma number of different positional isoforms eluting within eachmajor group. For example, the diacetylated peak containspeptides with varying location of acetylation (i.e., N terminusplus either K5, K8, K12, or K16).
As these peptides elute, their mass is recorded with high
accuracy by using the orbitrap. Fig. 1B displays the peptide ionm/z values that comprise the low-level penta-acetylated peak.Even for this low-abundance isoform, four unique methylationstates are observed: non-, mono-, di-, and trimethylated. Themass accuracy afforded by the orbitrap allowed us to distinguishprecisely which modifications are present; for example, we coulddiscriminate trimethylation from acetylation, a difference of0.03638 Da. With this information we determined the overallnumber of histone H4 isomers, but had no knowledge of whereeach of these identified modifications reside or how manypermutations within each isoform exist. To obtain this informa-tion we performed ETD MS/MS. Fig. 1C displays ETD MS/MSsingle-scan analysis of the penta-acetyl, dimethyl-containing H4tail (�500 ms per scan). From the near-complete fragmentationwe localized acetylation on K5, K8, K12, and K16 combined withdimethylation of K20. This process was repeated for eachisoform until the locations of all PTMs were assigned.
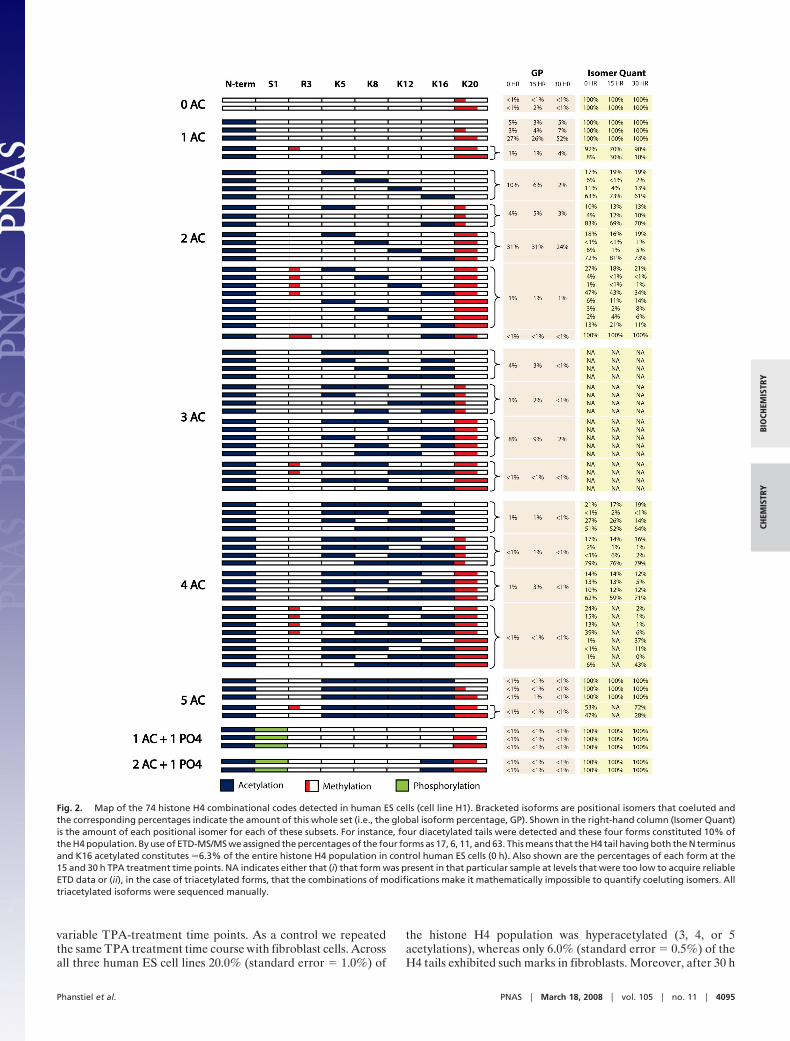
Using this approach, we characterized the histone H4 tailisoforms found in three human ES cell lines (H1, H7, and H9)and one somatic cell line (fibroblast, IMR90). From these datawe have identified 74 unique combinatorial PTM codes occur-ring on histone H4. Fig. 2 presents a graphical display of thesecodes—to our knowledge it is the most comprehensive list ofhistone H4 isoforms compiled to date by nearly an order ofmagnitude (21). The modifications we identified include N-terminal acetylation, phosphorylation of S1, mono- or dimethy-lation of R3, acetylation of K5, K8, K12, and K16, and mono-,di-, or trimethylation of K20. All of these modifications werepreviously known to exist; the combinatorial PTM patterns theyexhibited were not.
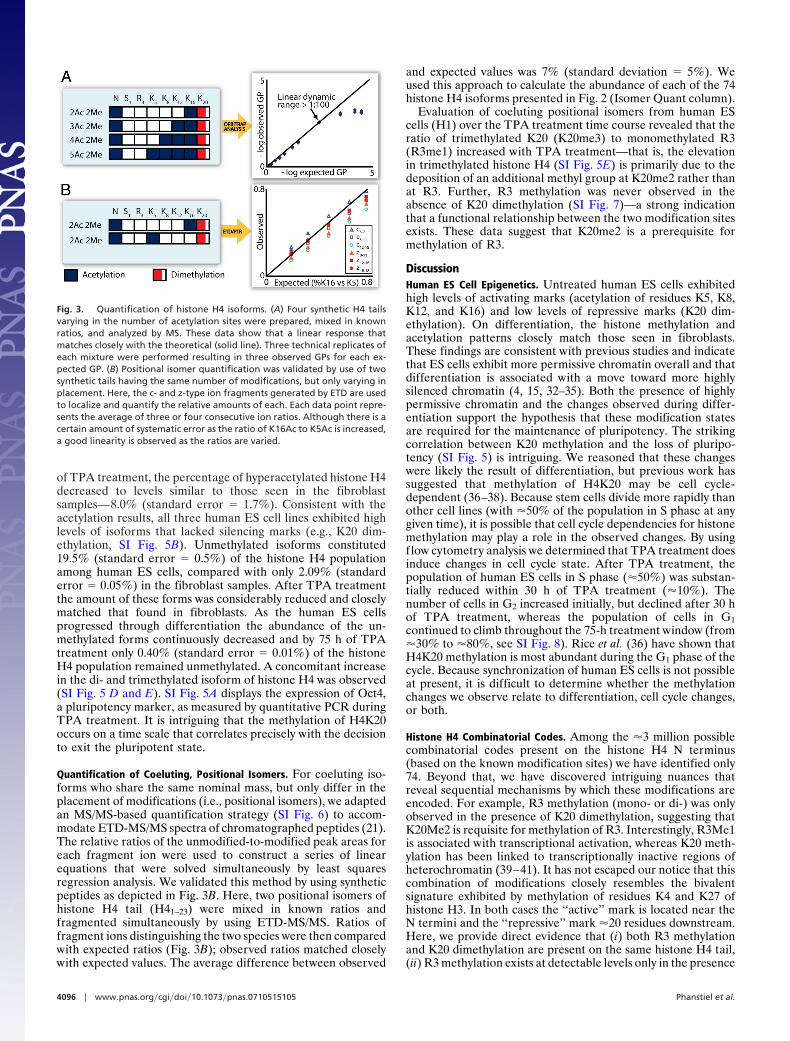
Global Isoform Quantification. To compare histone H4 isoformpopulations between many different samples and cell lines wedeveloped a label-free quantification method. Here, peak areascorresponding to individual histone H4 isoforms were deter-mined and divided by the sum of the peak areas correspondingto all H4 isoforms, a methodology pioneered by Kelleher et al.(21). We refer to the resulting percentage as the global isoformpercentage (GP). By using GPs it was possible to comparerelative amounts of histone H4 isoforms in any number ofdifferent samples. Sometimes isomers having the same nominalmass, and thus m/z values, coeluted (e.g., diacetylated tails thatvary only in the location of the acetyl groups) so that a single GPrepresents this entire population. In such cases, we used our ETDexperiment to determine what percentage of each coelutingisomer was present (details below). The GP approach wasvalidated by synthesizing histone H4 tails corresponding to thefirst 23 amino acids of histone H4, the same peptide observedafter endoproteinase AspN digestion, that differed only innumber of acetylated lysine residues (Fig. 3A). The peptideswere then mixed in known ratios and analyzed as describedearlier. From Fig. 3A we observe a linear response that correlateswell (R2 � 0.9958 for ratios up to and including 1:100) to theexpected with a linear dynamic range in excess of 1:100 and adynamic range of �1:10,000 (e.g., one fmol of one form detectedin the presence of 10 pmol, each, of three others). When mixedin ratios of 1:1 to 1:100 the average difference between observedand expected values was 3% (standard deviation � 2%). Thiswindow of error compares favorably with stable isotope-basedquantification methods. For example, isobaric tagging reagents,iTRAQ, are reported to have an error �6%, with standarddeviations �23% (31).
Analysis of GPs revealed that human ES cells from threedifferent cell lines (H1, H7, and H9) were enriched in isoformsbearing activating marks (e.g., acetylation) when compared withsomatic control cells (fibroblast, IMR90). Two of these humanES cell lines (H1 and H9) were treated with TPA to inducedifferentiation and the histone H4 isoforms were examined at
Fig. 1. Method for analysis of histone H4 N-terminal tail (residues 1–23)combinational codes. (A) Display of the nHPLC chromatogram and the asso-ciated N-terminal peptides. (B) Demonstration of the high mass accuracy massspectra resulting from the pentaacetylated peak. This low-level peak displaysfour different isoforms: non-, mono-, di-, and trimethylated versions. (C)Depiction of ETD-MS/MS analysis of the dimethylated, pentaacetylated spe-cies. This spectrum reveals that K5, K8, K12, K16, and the N terminus areacetylated but K20 is dimethylated in this peptide.
4094 � www.pnas.org�cgi�doi�10.1073�pnas.0710515105 Phanstiel et al.
variable TPA-treatment time points. As a control we repeatedthe same TPA treatment time course with fibroblast cells. Acrossall three human ES cell lines 20.0% (standard error � 1.0%) of
the histone H4 population was hyperacetylated (3, 4, or 5acetylations), whereas only 6.0% (standard error � 0.5%) of theH4 tails exhibited such marks in fibroblasts. Moreover, after 30 h
Fig. 2. Map of the 74 histone H4 combinational codes detected in human ES cells (cell line H1). Bracketed isoforms are positional isomers that coeluted andthe corresponding percentages indicate the amount of this whole set (i.e., the global isoform percentage, GP). Shown in the right-hand column (Isomer Quant)is the amount of each positional isomer for each of these subsets. For instance, four diacetylated tails were detected and these four forms constituted 10% ofthe H4 population. By use of ETD-MS/MS we assigned the percentages of the four forms as 17, 6, 11, and 63. This means that the H4 tail having both the N terminusand K16 acetylated constitutes �6.3% of the entire histone H4 population in control human ES cells (0 h). Also shown are the percentages of each form at the15 and 30 h TPA treatment time points. NA indicates either that (i) that form was present in that particular sample at levels that were too low to acquire reliableETD data or (ii), in the case of triacetylated forms, that the combinations of modifications make it mathematically impossible to quantify coeluting isomers. Alltriacetylated isoforms were sequenced manually.
Phanstiel et al. PNAS � March 18, 2008 � vol. 105 � no. 11 � 4095
BIO
CHEM
ISTR
YCH
EMIS
TRY
of TPA treatment, the percentage of hyperacetylated histone H4decreased to levels similar to those seen in the fibroblastsamples—8.0% (standard error � 1.7%). Consistent with theacetylation results, all three human ES cell lines exhibited highlevels of isoforms that lacked silencing marks (e.g., K20 dim-ethylation, SI Fig. 5B). Unmethylated isoforms constituted19.5% (standard error � 0.5%) of the histone H4 populationamong human ES cells, compared with only 2.09% (standarderror � 0.05%) in the fibroblast samples. After TPA treatmentthe amount of these forms was considerably reduced and closelymatched that found in fibroblasts. As the human ES cellsprogressed through differentiation the abundance of the un-methylated forms continuously decreased and by 75 h of TPAtreatment only 0.40% (standard error � 0.01%) of the histoneH4 population remained unmethylated. A concomitant increasein the di- and trimethylated isoform of histone H4 was observed(SI Fig. 5 D and E). SI Fig. 5A displays the expression of Oct4,a pluripotency marker, as measured by quantitative PCR duringTPA treatment. It is intriguing that the methylation of H4K20occurs on a time scale that correlates precisely with the decisionto exit the pluripotent state.
Quantification of Coeluting, Positional Isomers. For coeluting iso-forms who share the same nominal mass, but only differ in theplacement of modifications (i.e., positional isomers), we adaptedan MS/MS-based quantification strategy (SI Fig. 6) to accom-modate ETD-MS/MS spectra of chromatographed peptides (21).The relative ratios of the unmodified-to-modified peak areas foreach fragment ion were used to construct a series of linearequations that were solved simultaneously by least squaresregression analysis. We validated this method by using syntheticpeptides as depicted in Fig. 3B. Here, two positional isomers ofhistone H4 tail (H41–23) were mixed in known ratios andfragmented simultaneously by using ETD-MS/MS. Ratios offragment ions distinguishing the two species were then comparedwith expected ratios (Fig. 3B); observed ratios matched closelywith expected values. The average difference between observed
and expected values was 7% (standard deviation � 5%). Weused this approach to calculate the abundance of each of the 74histone H4 isoforms presented in Fig. 2 (Isomer Quant column).
Evaluation of coeluting positional isomers from human EScells (H1) over the TPA treatment time course revealed that theratio of trimethylated K20 (K20me3) to monomethylated R3(R3me1) increased with TPA treatment—that is, the elevationin trimethylated histone H4 (SI Fig. 5E) is primarily due to thedeposition of an additional methyl group at K20me2 rather thanat R3. Further, R3 methylation was never observed in theabsence of K20 dimethylation (SI Fig. 7)—a strong indicationthat a functional relationship between the two modification sitesexists. These data suggest that K20me2 is a prerequisite formethylation of R3.
DiscussionHuman ES Cell Epigenetics. Untreated human ES cells exhibitedhigh levels of activating marks (acetylation of residues K5, K8,K12, and K16) and low levels of repressive marks (K20 dim-ethylation). On differentiation, the histone methylation andacetylation patterns closely match those seen in fibroblasts.These findings are consistent with previous studies and indicatethat ES cells exhibit more permissive chromatin overall and thatdifferentiation is associated with a move toward more highlysilenced chromatin (4, 15, 32–35). Both the presence of highlypermissive chromatin and the changes observed during differ-entiation support the hypothesis that these modification statesare required for the maintenance of pluripotency. The strikingcorrelation between K20 methylation and the loss of pluripo-tency (SI Fig. 5) is intriguing. We reasoned that these changeswere likely the result of differentiation, but previous work hassuggested that methylation of H4K20 may be cell cycle-dependent (36–38). Because stem cells divide more rapidly thanother cell lines (with �50% of the population in S phase at anygiven time), it is possible that cell cycle dependencies for histonemethylation may play a role in the observed changes. By usingflow cytometry analysis we determined that TPA treatment doesinduce changes in cell cycle state. After TPA treatment, thepopulation of human ES cells in S phase (�50%) was substan-tially reduced within 30 h of TPA treatment (�10%). Thenumber of cells in G2 increased initially, but declined after 30 hof TPA treatment, whereas the population of cells in G1continued to climb throughout the 75-h treatment window (from�30% to �80%, see SI Fig. 8). Rice et al. (36) have shown thatH4K20 methylation is most abundant during the G1 phase of thecycle. Because synchronization of human ES cells is not possibleat present, it is difficult to determine whether the methylationchanges we observe relate to differentiation, cell cycle changes,or both.
Histone H4 Combinatorial Codes. Among the �3 million possiblecombinatorial codes present on the histone H4 N terminus(based on the known modification sites) we have identified only74. Beyond that, we have discovered intriguing nuances thatreveal sequential mechanisms by which these modifications areencoded. For example, R3 methylation (mono- or di-) was onlyobserved in the presence of K20 dimethylation, suggesting thatK20Me2 is requisite for methylation of R3. Interestingly, R3Me1is associated with transcriptional activation, whereas K20 meth-ylation has been linked to transcriptionally inactive regions ofheterochromatin (39–41). It has not escaped our notice that thiscombination of modifications closely resembles the bivalentsignature exhibited by methylation of residues K4 and K27 ofhistone H3. In both cases the ‘‘active’’ mark is located near theN termini and the ‘‘repressive’’ mark �20 residues downstream.Here, we provide direct evidence that (i) both R3 methylationand K20 dimethylation are present on the same histone H4 tail,(ii) R3 methylation exists at detectable levels only in the presence
Fig. 3. Quantification of histone H4 isoforms. (A) Four synthetic H4 tailsvarying in the number of acetylation sites were prepared, mixed in knownratios, and analyzed by MS. These data show that a linear response thatmatches closely with the theoretical (solid line). Three technical replicates ofeach mixture were performed resulting in three observed GPs for each ex-pected GP. (B) Positional isomer quantification was validated by use of twosynthetic tails having the same number of modifications, but only varying inplacement. Here, the c- and z-type ion fragments generated by ETD are usedto localize and quantify the relative amounts of each. Each data point repre-sents the average of three or four consecutive ion ratios. Although there is acertain amount of systematic error as the ratio of K16Ac to K5Ac is increased,a good linearity is observed as the ratios are varied.
4096 � www.pnas.org�cgi�doi�10.1073�pnas.0710515105 Phanstiel et al.
of K20 dimethylation, and (iii) significant changes arise in theabundance of K20 methylation during human ES cell differen-tiation. We also discovered that a small percentage (�1%) of thehistone H4 tails exhibited nonacetylated N termini, and further-more, acetylation at other residues was never observed in theabsence of N-terminal acetylation. Thereafter, K16 was the mostcommonly acetylated residue followed by K5. However, thesetwo modifications rarely occur on the same histone H4 molecule,indicating that acetylation at these sites is, to some extent,mutually exclusive (Fig. 2). In a very real sense, these combina-torial PTM maps will serve as a foundation for numerousfollow-up experiments and provide a roadmap for targetedChIP-chip experiments.
The MS-based technology described here provides a sensitiveand rapid methodology to detect and quantify the combinatorialPTM codes present on the intact termini of histone H4. Wevalidated this method by using synthetic peptides and calculatedan overall estimate of experimental error. We have applied thetechnology to identify 74 distinct combinatorial PTM patternsoccurring on histone H4 and tracked their abundances in humanES cell lines progressing through TPA-induced differentiation.These data provide evidence that ES cells have unique epige-netic signatures and that these codes are imparted in a sequentialfashion. Finally, we note this procedure should be applicable toother core histones and any other protein of interest containinga high degree of variable modifications.
MethodsCell Culture and TPA Treatment. Human embryonic stem cells (lines H1, H7, andH9) were maintained in feeder-independent media (TeSR) as described in ref.42. Cells were treated for 0, 3, 15, 30, 60, and 75 h with 12-O-tetradecanoyl-phorbol-13-acetate (TPA) (Sigma–Aldrich) at a final concentration of 50 ng/ml.Human fibroblasts (line IMR90) were cultured according to American TypeCulture Collection recommendations and were likewise treated with 50 ng/mlTPA for 0, 3, 15, 30, 60, and 75 h. Cells were individualized for 10 min with anadequate volume of prewarmed (37°C), 0.05% Trypsin-EDTA to cover theculture surface. After cell detachment, an equivalent volume of ice-coldgrowth medium (10% FBS in DMEM) was used to neutralize the trypsin beforepelleting. Cell pellets were subsequently washed twice in ice-cold PBS andstored at �80°C.
Histone Purification and Digestion. Starting with �2 � 107 cells, nuclei werecollected as previously described, except hypotonic lysis buffer contained 5mM Tris�HCl (pH 8.0), 60 mM KCl, 15 mM NaCl, 5 mM MgCl2, 1 mM CaCl2, 250mM sucrose, 2 mM sodium vanadate, 1 mM DTT, 0.6% Nonidet P-40, and 2.5�g/ml each of the protease inhibitors, leupeptin, pepstatin, antipain, chymo-statin, and aprotinin (Sigma–Aldrich) (43). After 5 min on ice, nuclei werepelleted at 960 � g for 5 min. The resulting pellets were washed twice in thehypotonic lysis buffer, resuspended in 1.5 ml of 0.4 N H2SO4, and incubated for2 h at 4°C with agitation. The sample was then centrifuged at 4°C for 15 minat 20,800 � g. The supernatant was collected and histones were precipitatedovernight at 4°C with 20% trichloroacetic acid. The next day, samples werecentrifuged at 20,800 � g, washed once in 1.5 ml of acetone, and resuspendedin 0.1% trifluoroacetic acid. Histone proteins were then separated as previ-ously described, dried to remove organic solvent, and resuspended in 0.1%TFA acid (43). A small sample was removed from each fraction for quantifi-
cation by BCA assay (Pierce) and histone identities were confirmed by gelelectrophoresis and Coomassie staining. Purified histone H4 samples weredigested overnight with Asp-N (Roche) (1:20) at a pH 8 before MS analysis.Synthetic peptides were generated at the UW Biotechnology Center (Madi-son, WI) and resuspended in either 0.1% acetic acid or 30% acetonitrile with0.1% acetic acid before analysis.
Instrumentation. Chromatographic peptide separations were performed on areversed-phase self-prepared capillary column as described in ref. 44. Onlinepeptide separations were performed by using an Agilent 1100 Series binaryHPLC system that was coupled to either an ETD-enabled Finnigan LTQ massspectrometer or a Finnigan LTQ Orbitrap mass spectrometer (Thermo FisherScientific). The LTQ mass spectrometer was operated in a targeted fashion byusing a parent mass list. First, a full-scan (300–2,000 m/z) mass spectrum wasacquired and then five ETD/PTR scans were acquired on the most intense peakfrom the parent mass list. An isolation window of 2 m/z and a precursor targetvalue of 80,000 were used. ETD reactions were carried out by mutual storageof isolated cations and fluoranthene radical anions for 30 ms in the LTQ. Thiswas followed by 150 ms reaction with benzoic acid anions (PTR) before massanalysis. The LTQ Orbitrap was operated only in MS1 mode with a target valueof 500,000 and a resolving power of 60,000. LTQ Orbitrap data were decon-voluted by using Xtract software (Thermo Fisher Scientific) with a signal-to-noise (S/N) threshold of 2 and a fit factor of 0. A selected ion chromatogramwas constructed for the most abundant isotopic peak of each isoform (�0.02m/z) and areas were selected manually. Tandem mass spectra were exportedto .csv file and processed by software written in-house. First, the percentageof K20 methylation was determined by peak areas corresponding to modifiedand unmodified z4 fragment ions. Next, the percentage of N-terminal acety-lation and percentage of R3 methylation was determined by peak areascorresponding to c3 fragment ions. Then all peaks were use to determineacetylation composition and location. The software extracted peak areas (�2m/z) for each expected c- and z-type ion. Percentages of nonacetylated toacetylated values were used to construct equations summing to 100%. Matlab(The Mathworks) was used to solve the system of linear equations by using aleast squares regression analysis.
Flow Cytometry. ES cells were labeled with bromodeoxyuridine (BrdU) byadding BrdU to a concentration of 10 �M 30 min before harvest. Cells wereindividualized and collected as described earlier (�5 � 106 cells per experi-ment). After the wash steps, the cell pellet was resuspended in 100 �l of PBS.To fix the cells, ice-cold 70% ethanol was added dropwise while vortexing.Cells were pelleted and resuspended in 1 ml of cold 0.1 M HCl/50% TritonX-100. After a 10-min incubation on ice, the cells were centrifuged, resus-pended in 2 ml of water, boiled for 10 min, and placed on ice for 5 min. Then5 ml of PBS/0.5% Triton was added, followed by centrifugation and resuspen-sion in 100 �l of PBS containing 5 �g/ml of anti-BrdU-FITC antibody and 0.1%BSA. The cells were incubated in the dark for 30 min at room temperature.Next, 5 ml of PBS was added, cells were pelleted and resuspended in 500 �l ofPBS containing 5 �g/ml propidium iodide and 200 �g/ml RNase. After incu-bation for 30 min at 37°C, cells were analyzed by using an Aria flow cytometer(BD Biosciences).
ACKNOWLEDGMENTS. We thank April Jue, Guokai Chen, Ron Stewart, VictorRuotti, Chuhu Yang, Gheorghe Craciun, and Beatrix Ueberheide for helpfuldiscussions. This work was supported by the University of Wisconsin-Madison,Thermo Fisher, the Beckman Foundation, Eli Lilly, National Institutes of Health(NIH) Grant 1R01GM080148 (to J.J.C.), Genomic Sciences Training ProgramPredoctoral Fellowship NIH 5T32HG002706 (to D.H.P.), Biotechnology Train-ing Program Predoctoral Fellowship NIH 5T32GM08349 (to J.B.), and a Na-tional Science Foundation graduate research fellowship (to J.B.).
1. Bernstein BE, et al. (2006) A bivalent chromatin structure marks key developmentalgenes in embryonic stem cells. Cell 125:315–326.
2. Pan G, et al. (2007) Whole-genome analysis of histone H3 lysine 4 and lysine 27methylation in human embryonic stem cells. Cell Stem Cell 1:299–312.
3. Guenther MG, et al. (2007) A chromatin landmark and transcription initiation at mostpromoters in human cells. Cell 130:77–88.
4. Meshorer E, Misteli T (2006) Opinion—Chromatin in pluripotent embryonic stem cellsand differentiation. Nat Rev Mol Cell Biol 7:540–546.
5. Passeri D, et al. (2006) Btg2 enhances retinoic acid-induced differentiation by modu-lating histone H4 methylation and acetylation. Mol Cell Biol 26:5023–5032.
6. Torres-Padilla ME, Parfitt DE, Kouzarides T, Zernicka-Goetz M (2007) Histonearginine methylation regulates pluripotency in the early mouse embryo. Nature445:214 –218.
7. Pray-Grant MG, et al. (2005) Chd1 chromodomain links histone H3 methylation withSAGA- and SLIK-dependent acetylation. Nature 433:434–438.
8. Jenuwein T, Allis CD (2001) Translating the histone code. Science 293:1074–1080.
9. Margueron R, Trojer P, Reinberg D (2005) The key to development: Interpreting thehistone code? Curr Opin Genet Dev 15:163–176.
10. Turner BM (2002) Cellular memory and the histone code. Cell 111:285–291.11. Strahl BD, Allis CD (2000) The language of covalent histone modifications. Nature
403:41–45.12. Pokholok DK, et al. (2005) Genome-wide map of nucleosorne acetylation and meth-
ylation in yeast. Cell 122:517–527.13. Lin WC, Dent SYR (2006) Functions of histone-modifying enzymes in development. Curr
Opin Genet Dev 16:137–142.14. Kimura H, Tada M, Nakatsuji N, Tada T (2004) Histone code modifications on
pluripotential nuclei of reprogrammed somatic cells. Mol Cell Biol 24:5710 –5720.
15. Lee JH, Hart SRL, Skalnik DG (2004) Histone deacetylase activity is required for embry-onic stem cell differentiation. Genesis 38:32–38.
16. Agger K, et al. (2007) UTX and JMJD3 are histone H3K27 demethylases involved in HOXgene regulation and development. Nature 449:731-734.
Phanstiel et al. PNAS � March 18, 2008 � vol. 105 � no. 11 � 4097
BIO
CHEM
ISTR
YCH
EMIS
TRY
17. Lan F, et al. (2007) A histone H3 lysine 27 demethylase regulates animal posteriordevelopment. Nature 449:689-694.
18. Lee MG, et al. (2007) Demethylation of H3K27 regulates polycomb recruitment andH2A ubiquitination. Science 318:447–450.
19. Garcia BA, et al. (2007) Organismal differences in post-translational modifications inhistones H3 and H4. J Biol Chem 282:7641–7655.
20. Garcia BA, Pesavento JJ, Mizzen CA, Kelleher NL (2007) Pervasive combinatorialmodification of histone H3 in human cells. Nat Methods 4:487–489.
21. Pesavento JJ, Mizzen CA, Kelleher NL (2006) Quantitative analysis of modified proteinsand their positional isomers by tandem mass spectrometry: Human histone H4. AnalChem 78:4271–4280.
22. Taverna SD, et al. (2007) Long-distance combinatorial linkage between methylationand acetylation on histone H3N termini. Proc Natl Acad Sci USA 104:2086–2091.
23. Pesavento JJ, Kim YB, Taylor GK, Kelleher NL (2004) Shotgun annotation of histonemodifications: A new approach for streamlined characterization of proteins by topdown mass spectrometry. J Am Chem Soc 126:3386–3387.
24. Boyne MT, Pesavento JJ, Mizzen CA, Kelleher NL (2006) Precise characterization ofhuman histories in the H2A gene family by top down mass spectrometry. J ProteomeRes 5:248–253.
25. Thomas CE, Kelleher NL, Mizzen CA (2006) Mass spectrometric characterization ofhuman histone H3: A bird’s eye view. J Proteome Res 5:240–247.
26. Siuti N, et al. (2006) Gene-specific characterization of human histone H2B by electroncapture dissociation. J Proteome Res 5:233–239.
27. Medzihradszky KF, et al. (2004) Characterization of Tetrahymena histone H2B variantsand posttranslational populations by electron capture dissociation (ECD) Fourier trans-form ion cyclotron mass spectrometry (FT-ICR MS). Mol Cell Proteomics 3:872–886.
28. Zhang LW, Freitas MA (2004) Comparison of peptide mass mapping and electroncapture dissociation as assays for histone posttranslational modifications. Int J MassSpectrom 234:213–225.
29. Pesavento JJ, Yang H, Kelleher NL, Mizzen CA (2008) Certain and progressive methyl-ation of histone H4 at lysine 20 during the cell cycle. Mol Cell Biol 28:468–486.
30. Coon JJ, et al. (2005) Protein identification using sequential ion/ion reactions andtandem mass spectrometry. Proc Natl Acad Sci USA 102:9463–9468.
31. Ross PL, et al. (2004) Multiplexed protein quantitation in Saccharomyces cerevisiaeusing amine-reactive isobaric tagging reagents. Mol Cell Proteomics 3:1154 –1169.
32. Martens JHA, et al. (2005) The profile of repeat-associated histone lysine methylationstates in the mouse epigenome. EMBO J 24:800–812.
33. Keohane AM, et al. (1996) X-inactivation and histone H4 acetylation in embryonic stemcells. Dev Biol 180:618–630.
34. Francastel C, Schubeler D, Martin DIK, Groudine M (2000) Nuclear compartmentaliza-tion and gene activity. Nat Rev Mol Cell Biol 1:137–143.
35. Arney KL, Fisher AG (2004) Epigenetic aspects of differentiation. J Cell Sci 117:4355–4363.36. Rice JC, et al. (2002) Mitotic-specific methylation of histone H4 Lys 20 follows increased
PR-Set7 expression and its localization to mitotic chromosomes. Genes Dev 16:2225–2230.
37. Shepherd GR, Hardin JM, Noland BJ (1971) Methylation of lysine residues of histonefractions in synchronized mammalian cells. Arch Biochem Biophys 143:1–5.
38. Thomas G, Lange HW, Hempel K (1975) Kinetics of histone methylation in vivo and itsrelation to cell-cycle in Ehrlich ascites tumor-cells. Eur J Biochem 51:609–615.
39. Wang HB, et al. (2001) Methylation of histone H4 at arginine 3 facilitating transcrip-tional activation by nuclear hormone receptor. Science 293:853–857.
40. Huang SM, Litt M, Felsenfeld G (2005) Methylation of histone H4 by arginine methyl-transferase PRMT1 is essential in vivo for many subsequent histone modifications.Genes Dev 19:1885–1893.
41. Nishioka K, et al. (2002) PR-Set7 is a nucleosome-specific methyltransferase thatmodifies lysine 20 of histone H4 and is associated with silent chromatin. Mol Cell9:1201–1213.
42. Ludwig TE, et al. (2006) Feeder-independent culture of human embryonic stem cells.Nat Methods 3:637–646.
43. Hake SB, et al. (2005) Serine 31 phosphorylation of histone variant H3.3 is specific toregions bordering centromeres in metaphase chromosomes. Proc Natl Acad Sci USA102:6344–6349.
44. McAlister GC, et al. (2007) Implementation of electron-transfer dissociation on a hybridlinear ion trap-orbitrap mass spectrometer. Anal Chem 79:3525–3534.
4098 � www.pnas.org�cgi�doi�10.1073�pnas.0710515105 Phanstiel et al.