a summary report: 2006 utah state park boating … · survey: comparison with previous studies ......
TRANSCRIPT

1
A SUMMARY REPORT: 2006 UTAH STATE PARK BOATING SURVEY: COMPARISON WITH PREVIOUS STUDIES
Prepared for: Utah Department of Natural Resources,
Division of Parks and Recreation
William Spain Doug Reiter Dale Blahna Steve Burr
Utah State University Institute for Outdoor Recreation and Tourism
Professional Report IORT-PR-2007-3a
June 2007
2
Institute for Outdoor Recreation and Tourism Utah State University
Mission of the Institute for Outdoor Recreation and Tourism:
The Institute for Outdoor Recreation and Tourism (IORT) conducts a program of research, extension, and teaching for the benefit of the people of Utah, our country, and the world, directed
at improving our understanding of the relationships between outdoor recreation and tourism, natural resources management, community economic vitality, and quality of life.
Through statewide collaboration and cooperation, IORT will be a source for the creation,
communication, and transfer of knowledge on resource-based recreation and tourism issues affecting social, economic, and environmental systems, in order to assist Utah’s citizens in
making decisions that enhance both community and resource sustainability.
Institute for Outdoor Recreation and Tourism College of Natural Resources
Utah State University 5220 Old Main Hill
Logan, Utah 84322-5220 (435) 797-7094
e-mail: [email protected] IORT website at extension.usu.edu/cooperative/iort
Acknowledgement
The Institute for Outdoor Recreation and Tourism acknowledges support for this research project from Utah State University Cooperative Extension,
through funding provided by a Community-University Research Initiative Grant, and extends a thank you to the many partners who assisted with the project.
3
TABLE OF CONTENTS
1.0 INTRODUCTION AND REPORT SUMMARY ..................................................................5 2.0 METHODS ...............................................................................................................................7
2.1 Survey of Registered Boaters – 1989 ..........................................................................7 2.2 Survey of Registered Boaters – 1994 ..........................................................................8 2.3 Survey of Registered Boaters – 1999 ..........................................................................8 2.4 Survey of Registered Boaters – 2006 ..........................................................................9
3.0 RESULTS ...............................................................................................................................11 3.1 Results from 1994-2006 .............................................................................................11 3.2 Comparison between 1999 and 2006 ........................................................................18
4.0 SUMMARY AND CONCLUSIONS ....................................................................................23 5.0 APPENDIX A: 1989 Survey Data ........................................................................................27 6.0 APPENDIX B: 2006 Survey Instrument .............................................................................28 7.0 REFERENCES .......................................................................................................................38
4
LIST OF TABLES
Table 3-1. Registered Boaters Area of Residence 1994-2006 ...................................................11 Table 3-2. Boating Characteristics 1989-2006 ...........................................................................12 Table 3-3. Registered Boater Visitation 1994-2006 ...................................................................13 Table 3-4. Favorite Utah Boating Area 1994-2006 ...................................................................14 Table 3-5. Use of Boater Registration Funds 1994-2006 ..........................................................15 Table 3-6. Importance of Boater Education 1994-2006 ............................................................16 Table 3-7. Completed Boater Education Course 1994-2006 ....................................................16 Table 3-8. Boater Education and Licensing Requirements 1994-2006 ...................................16 Table 3-9. Support for PWC Use on Utah Water Bodies 1994-2006.......................................17 Table 3-10. Sources of Boating Safety Information 1994-2006................................................18 Table 3-11. Demographic Characteristics 1999, 2006 ..............................................................19 Table 3-12. Activity Participation 1999, 2006 ...........................................................................19 Table 3-13. Actions Detracting from Boating Enjoyment 1999, 2006 .....................................20 Table 3-14. Attitudes Toward Use Limitations 1999, 2006 ......................................................21 Table 3-15. Top Five Mentioned Reservoirs Needing Use Limits 1999, 2006 ........................22 Table 3-16. Potential Problems at Utah Boating Areas 1999, 2006 .........................................22 Table 3-17. Regulation of Personal Watercraft 1999, 2006 .....................................................22 Table A-1. Registered Boaters Area of Residence 1989-2006 ..................................................27

5
1.0 INTRODUCTION AND REPORT SUMMARY The purpose of this study is to provide the Utah Division of Parks and Recreation with
longitudinal data about registered boat owners in the state. This report compares the results of a
2006 telephone survey of registered boaters with the results of surveys from 1989, 1994 and 1999.
The report is divided into four sections: Section (1.0 Introduction) provides background
information about the study and a summary of key findings; Section 2.0 describes the methods
used in all four surveys; Section 3.0 (Results) provides descriptive data comparing the 2006
registered boater survey with previous surveys; and Section 4.0 (Summary and Conclusions)
provides a brief analysis of the results.
The 2006 telephone survey was part of a statewide planning project conducted by Utah
State Parks and Utah State University’s Institute for Outdoor Recreation and Tourism (IORT).
There were four data collection phases: Phase 1) in-depth interviews of managers of recreational
water bodies; Phase 2) regional meetings with state and federal employees who are
knowledgeable about recreational water use in Utah; Phase 3) telephone survey of registered boat
owners; and Phase 4) online survey of State Park managers. The results will also be included in
our final report “Recreational Water Use Capacity and Regional Planning on Utah’s Lakes and
Reservoirs” where regional and statewide management recommendations will be made. Key
findings include:
The number of Utah boat owners may be declining. The number of registered boats, boat
outings, and boats per household has decreased since 1999.
Boaters are taking fewer but longer lasting trips. The number of trips taken annually by
registered boaters has decreased from about 12 to 9 trips, but the average length of a
typical trip has increased from about 2 days to 5 days.
Large water bodies – Lake Powell, Flaming Gorge, and Bear Lake – and those with
6
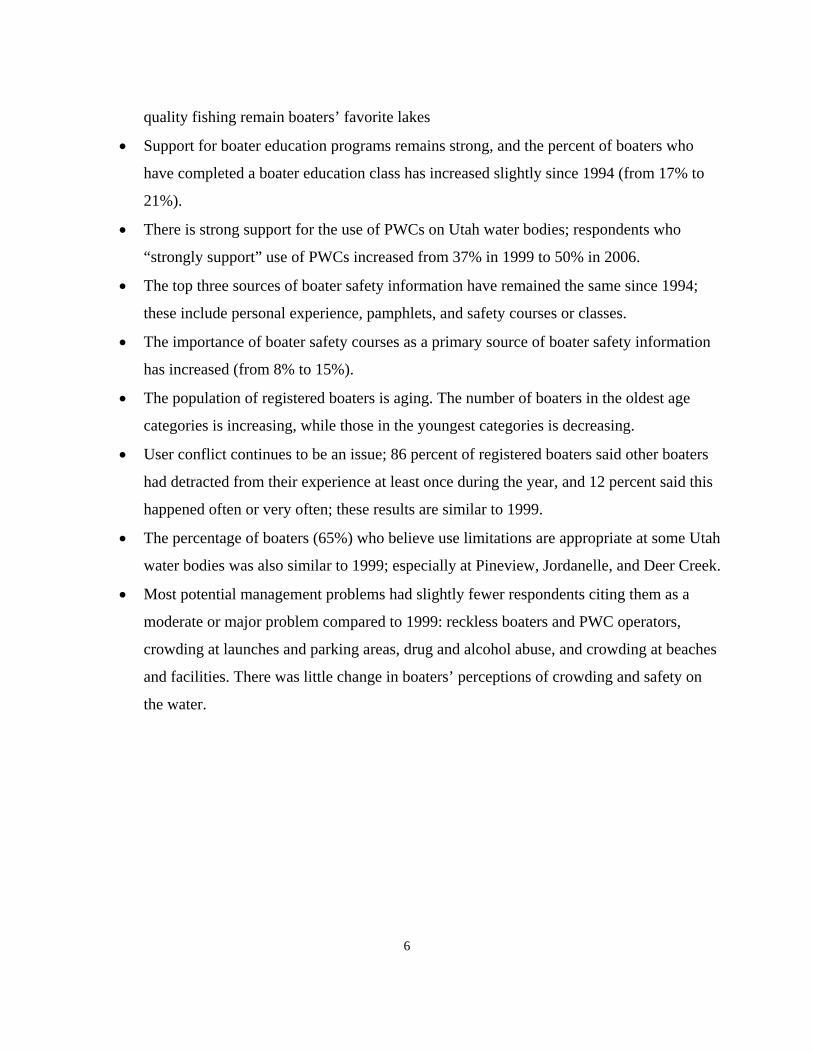
quality fishing remain boaters’ favorite lakes
Support for boater education programs remains strong, and the percent of boaters who
have completed a boater education class has increased slightly since 1994 (from 17% to
21%).
There is strong support for the use of PWCs on Utah water bodies; respondents who
“strongly support” use of PWCs increased from 37% in 1999 to 50% in 2006.
The top three sources of boater safety information have remained the same since 1994;
these include personal experience, pamphlets, and safety courses or classes.
The importance of boater safety courses as a primary source of boater safety information
has increased (from 8% to 15%).
The population of registered boaters is aging. The number of boaters in the oldest age
categories is increasing, while those in the youngest categories is decreasing.
User conflict continues to be an issue; 86 percent of registered boaters said other boaters
had detracted from their experience at least once during the year, and 12 percent said this
happened often or very often; these results are similar to 1999.
The percentage of boaters (65%) who believe use limitations are appropriate at some Utah
water bodies was also similar to 1999; especially at Pineview, Jordanelle, and Deer Creek.
Most potential management problems had slightly fewer respondents citing them as a
moderate or major problem compared to 1999: reckless boaters and PWC operators,
crowding at launches and parking areas, drug and alcohol abuse, and crowding at beaches
and facilities. There was little change in boaters’ perceptions of crowding and safety on
the water.
7
2.0 METHODS
IORT administered the 1999 and 2006 telephone surveys, while Business Strategies, Inc.
and the University of Utah conducted similar surveys in 1989 and 1994 respectively. In all cases
the sample was selected from a list of registered boat owners provided by the Utah Department of
Motor Vehicles. A random sample of registered boaters throughout the state was obtained in
1994, 1999, and 2006. Although the 1989 report stated that a random sample was selected, some
of the results suggest the sample was primarily residents in Salt Lake County.
Some of the questions were only asked in 1999 and 2006 and are compared in Section 3.2
of the results. Section 3.1 displays the results of questions asked primarily in the last three
studies. It should be noted that a couple of the questions asked in previous years were removed as
they were determined to be poor measures by IORT researchers.
2.1 Survey of Registered Boaters – 1989 The 1989 study was conducted by Business Strategies, Inc. (1990) of Salt Lake City. The
survey was conducted in 1990 to obtain information about the 1989 boating year. In reviewing
the results, however, it appears that the data were not representative of boat owners throughout
the entire state. For instance, 71% (n = 403) of the sampled respondents resided in Salt Lake
County while U.S. Census Bureau reported that about 41% of the state’s population lived in the
county in 1989. Other examples of misrepresentation are only two survey respondents (0.3%)
lived in Weber County, but this county contained 9% of Utah’s population, and 14% of the
respondents lived in counties other than Salt Lake, Davis, Weber, and Utah while nearly 23% of
the state’s population resided in these non-Wasatch Front counties in 1989. These results suggest
that the data is not representative of boat owners throughout the state, but the source of the
8
sampling error is unclear. Therefore, the 1989 survey results will not be presented in the
comparison tables in this report with the exception of showing the change in actual number of
register boats and owners over time (Table 3-2).
2.2 Survey of Registered Boaters - 1994
Researchers at the University of Utah’s Survey Research Center (1995) conducted the
1994 study. They completed 612 telephone interviews during February 1995 of a random
selection of registered boat owners throughout the state. Many of the questions contained in the
survey instrument were also asked in the two subsequent studies in 1999 and 2006. They
included questions about boat ownership, boating characteristics and use, water-based recreation
activities, management and policy characteristics, and household demographic information.
2.3 Survey of Registered Boaters – 1999
IORT scientists in the College of Natural Resources at Utah State University (USU)
collaborated with personnel from Utah Division of Parks and Recreation (2001) to conduct a
telephone survey in late 1999 and early 2000. The questionnaire contained statements and
questions designed to gather boating data beneficial to the management and policy needs of the
Division. The questionnaire contained items addressing boater demographic characteristics, boat
ownership and trip patterns, preferred use of boating fees, favorite and least favorite boating
areas, and water-based recreational activities. There were also questions designed to assess
sources of boater education and safety information, acceptability of mandatory boat operator
licensing, crowding problems on Utah’s lakes, and problems or concerns on those lakes.
The Division provided USU researchers with an electronic file of all boats registered in

9
Utah during 1999. This list included each boat owner’s name and address. Duplicate names were
removed to provide a list of the population of Utah boat owners, and to provide a single, equal
opportunity for each registered boat owner to be randomly selected for participation in the survey.
A sample was drawn using a computer random sampling program. In order to obtain about a 95%
sampling confidence level, it was calculated that a random sample of 350 respondents was needed
to complete the survey.
Research technicians conducted the survey by calling respondents between 6:00 pm and
9:00 pm on week nights and during the afternoon hours on weekends. They identified themselves
as USU students conducting a survey, asked the respondent if they would participate in the study,
and assured the respondent that their identity would be kept confidential. Telephone interviews
were conducted between November 1999 and early May 2000 when the sample size of 350 was
attained. Data entry and statistical analysis was conducted IORT researchers.
The original sample selected for the survey was 991 people, about 1.7% of the total
number of registered boaters. Due to disconnected and unlisted phone numbers, 430 of these
people were listed as non-contactable. The remaining 561 people were called up to six times or
until they completed a survey. The number of completed surveys was 350 for a 62.4% response
rate, the others (n=211) were considered not available, no answers, or rejections.
2.4 Survey of Registered Boaters - 2006
The 2006 telephone survey was conducted as a part of the third phase of the planning
process described in the Introduction and Report Summary. Most of the questions replicated
those from previous surveys to allow for comparison. The Division provided IORT researchers
with an electronic file of all boats registered in Utah during 2005. This list included the boat
10
owner’s name and address. Duplicate names were removed to provide a list of the population of
Utah boat owners, and to provide a single, equal opportunity for each registered boat owner to be
randomly selected for participation in the survey. A sample was drawn using a computer random
sampling program. In order to obtain a 95% sampling confidence level, it was calculated that a
random sample of 385 respondents was needed to complete the survey.
Discovery Research Group, a telephone survey firm, was contracted to conduct the survey
in 2006. Data were collected in Fall 2006 and early Winter 2007. Potential respondents were
contacted up to eleven times. The original sample selected for the survey included 1140
registered boaters; 227 of these numbers were unusable and 249 were listed as non-contactable or
ineligible. The remaining 664 people were called up to eleven times or until they completed a
survey. The number of completed surveys was 397 for a 59.8% response rate; the others were
rejections or refusals.

11
3.0 RESULTS The first section (3.1) of the results tallies the boater registration records for all four
survey years, and compares survey results from 1994, 1999, and 2006. The second section (3.2)
compares the results from questions asked in 1999 and 2006 only. The data collected about the
1989 boating year does not appear to represent the population of registered boaters in Utah (See
Appendix A for explanation).
3.1 Results from 1994-2006
Table 3-1 displays the county of residence of those surveyed in 1994, 1999, and 2006. In
general, the results indicate an increase in the proportion of registered boaters from outside of Salt
Lake County. The Metro counties of Utah, Davis, and Weber have seen an increase in the
proportion of registered boaters while the “other counties” have stayed relatively constant.
Table 3-1. Registered Boaters Area of Residence 1994-2006.
Area of the State 1994 1999 2006
Salt Lake County 38% 33% 26%
Utah County 10% 14% 16%
Davis County 14% 10% 13%
Weber County 7% 11% 12%
Other Counties 1 30% 32% 32%
1 On the 1994 survey, these counties were called “rural counties.”
One of the interesting trends is the change in the number of registered boats and boat
owners in Utah. Between 1989 and 1994, there was an 19.9% increase in the number of registered
boats, a 10.0% increase from 1994 to 1999, and a 2.0% decrease from 1999 to 2006 (Table 3-2).

12
In comparing these registration trends with Utah population trend data for the same time period,
there appears to be a steady growth rate between 1.1% and 1.7% for any five year period going
back to 1990, based on U.S. Census Bureau data. In other words, there was a larger increase in
registered boaters than can be accounted for by the statewide population increase. Even though
the number of registered boats in Utah decreased by 2.0% between 1999 and 2006, the number
of boat owners increased by 8.0%. This indicates that the average number of boats per owner
has decreased which is confirmed in Table 3-2. The number of boat operators per household has
stayed relatively constant since the 1994 survey.
Table 3-2. Boating Characteristics 1989-2006.
Characteristic
1989 1994 1999 2006
Number of registered boats in Utah 58,464 70,154 77,171 75,635
Registered motorboats1 56,842 68,753 75,961 74,424
Registered sailboats 1,622 1,401 1,210 1,211
Number of boat owners 39,335 NA 58,289 62,938
Number of boats owned2
0 to 1 boat * 68% 67.5% 75.3%
2 boats * 22 % 23.3% 17.4%
3 or more boats * 10% 9.2% 7.3%
Average per household * 1.4 1.5 1.4
Number of boat operators per boat owner household2
1 * 28.0% 31.8% 31.7%
2 * 37.0% 37.0% 38.3%
3 * 15.0% 13.1% 12.6%
4 * 9.0% 9.3% 11.1%
5 or more * 9.0% 8.8% 6.3%
Average per household * 2.4 2.3 2.3
1The term motorboat includes PWCs and traditional motorboats. 2Data in these sections was taken from the sample population and not the general population of registered boat owners.
13
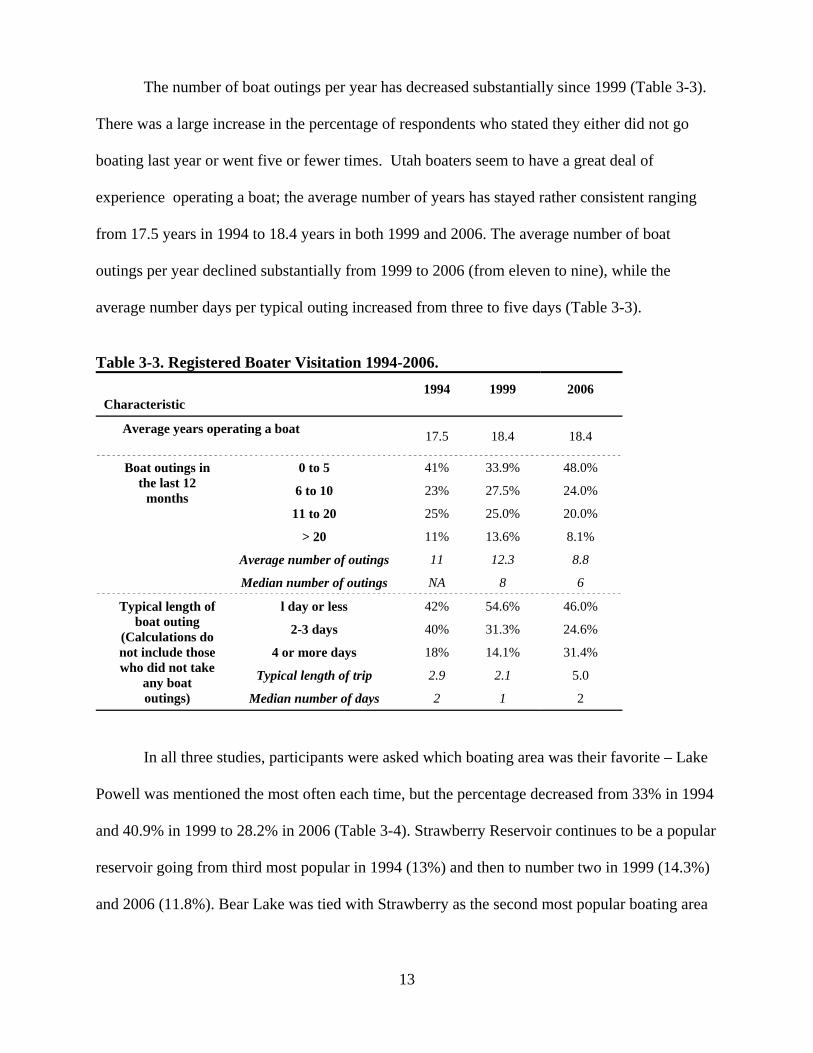
The number of boat outings per year has decreased substantially since 1999 (Table 3-3).
There was a large increase in the percentage of respondents who stated they either did not go
boating last year or went five or fewer times. Utah boaters seem to have a great deal of
experience operating a boat; the average number of years has stayed rather consistent ranging
from 17.5 years in 1994 to 18.4 years in both 1999 and 2006. The average number of boat
outings per year declined substantially from 1999 to 2006 (from eleven to nine), while the
average number days per typical outing increased from three to five days (Table 3-3).
Table 3-3. Registered Boater Visitation 1994-2006.
Characteristic
1994 1999 2006
Average years operating a boat 17.5 18.4 18.4
Boat outings in the last 12
months
0 to 5 41% 33.9% 48.0%
6 to 10 23% 27.5% 24.0%
11 to 20 25% 25.0% 20.0%
> 20 11% 13.6% 8.1%
Average number of outings 11 12.3 8.8
Median number of outings NA 8 6 Typical length of
boat outing (Calculations do not include those who did not take
any boat outings)
l day or less 42% 54.6% 46.0%
2-3 days 40% 31.3% 24.6%
4 or more days 18% 14.1% 31.4%
Typical length of trip 2.9 2.1 5.0
Median number of days 2 1 2
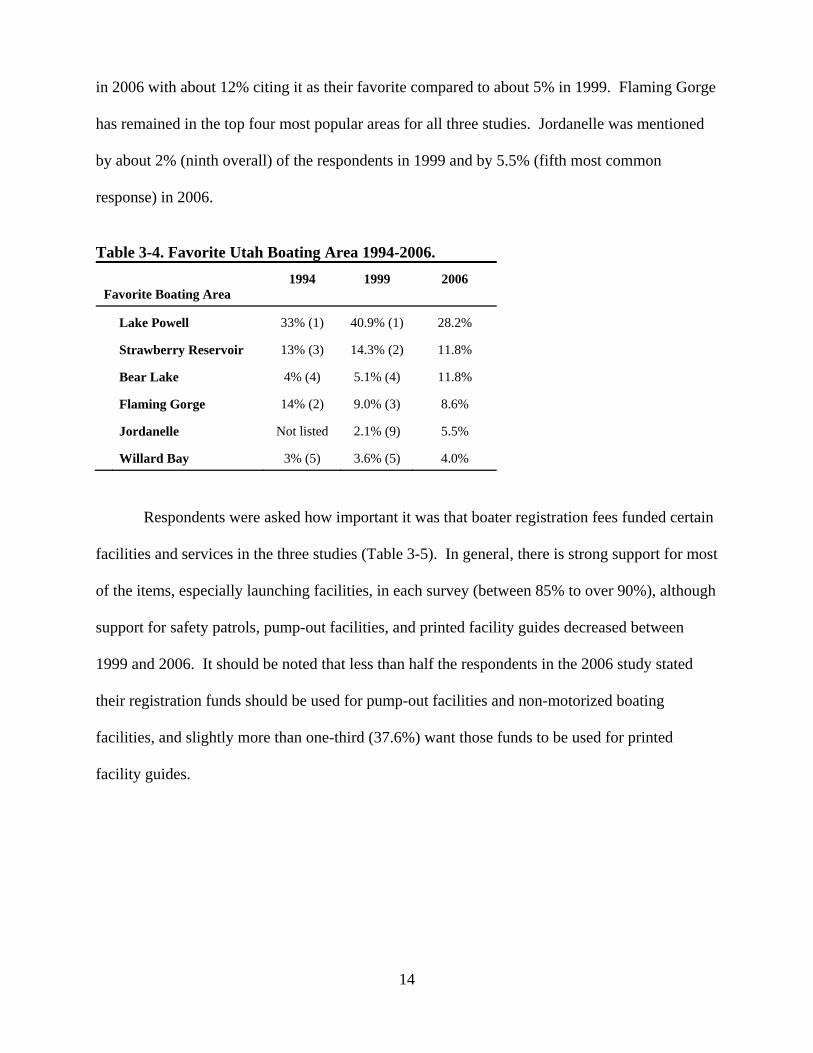
In all three studies, participants were asked which boating area was their favorite – Lake
Powell was mentioned the most often each time, but the percentage decreased from 33% in 1994
and 40.9% in 1999 to 28.2% in 2006 (Table 3-4). Strawberry Reservoir continues to be a popular
reservoir going from third most popular in 1994 (13%) and then to number two in 1999 (14.3%)
and 2006 (11.8%). Bear Lake was tied with Strawberry as the second most popular boating area
14
in 2006 with about 12% citing it as their favorite compared to about 5% in 1999. Flaming Gorge
has remained in the top four most popular areas for all three studies. Jordanelle was mentioned
by about 2% (ninth overall) of the respondents in 1999 and by 5.5% (fifth most common
response) in 2006.
Table 3-4. Favorite Utah Boating Area 1994-2006.
Favorite Boating Area
1994 1999 2006
Lake Powell 33% (1) 40.9% (1) 28.2%
Strawberry Reservoir 13% (3) 14.3% (2) 11.8%
Bear Lake 4% (4) 5.1% (4) 11.8%
Flaming Gorge 14% (2) 9.0% (3) 8.6%
Jordanelle Not listed 2.1% (9) 5.5%
Willard Bay 3% (5) 3.6% (5) 4.0%
Respondents were asked how important it was that boater registration fees funded certain
facilities and services in the three studies (Table 3-5). In general, there is strong support for most
of the items, especially launching facilities, in each survey (between 85% to over 90%), although
support for safety patrols, pump-out facilities, and printed facility guides decreased between
1999 and 2006. It should be noted that less than half the respondents in the 2006 study stated
their registration funds should be used for pump-out facilities and non-motorized boating
facilities, and slightly more than one-third (37.6%) want those funds to be used for printed
facility guides.

15
Table 3-5. Use of Boater Registration Funds 1994-2006.
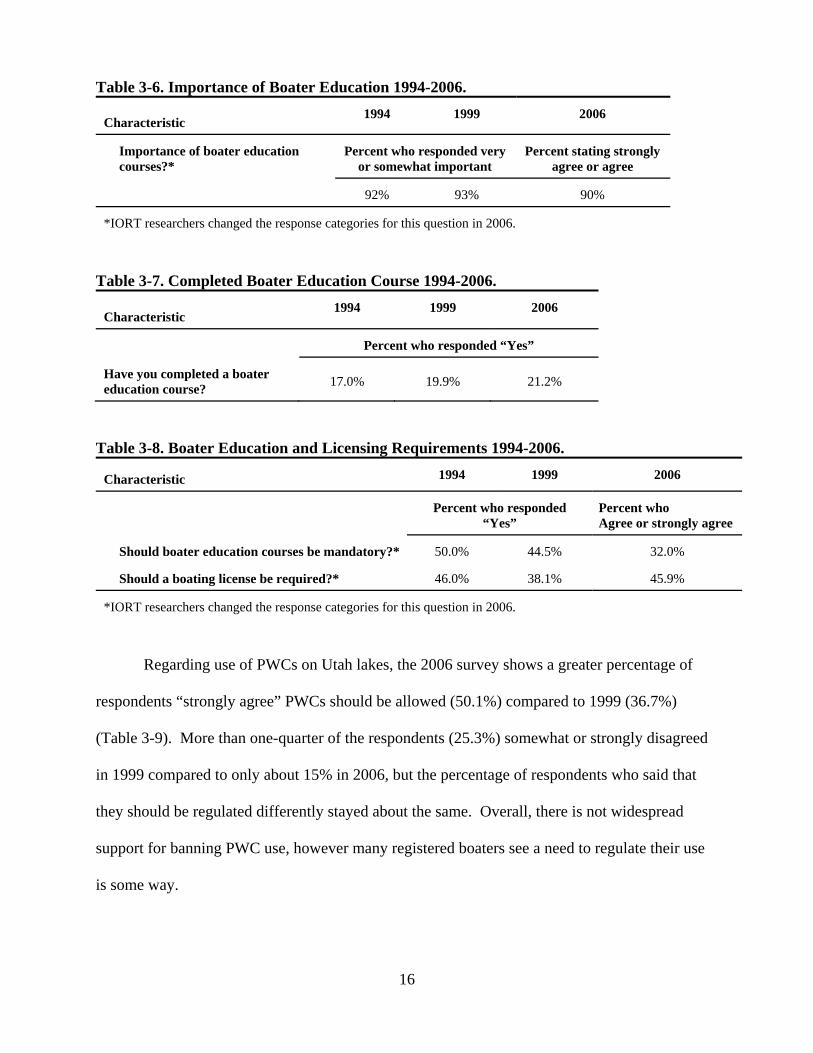
There were several questions about boater education. Over 90 percent of the respondents
of all three studies believe boater education classes are important. In 2006, the survey response
was changed for this question from “somewhat important” to “agree” and “strongly agree” in
order to make the responses the same as other similar questions and simplify the survey for the
respondent. However, the apparent support for boater education has not changed substantially
(Table 3-6). Additionally, there is an upward trend in owners completing a boater education
courses: 17.0% in 1994, 19.9% in 1999, and 21.2% in 2006 (Table 3-7). Support for mandatory
boater education classes, however, has decreased, while support for mandatory licensing has
increased. It should be noted the question was asked differently in 2006 compared to previous
years and this may have influenced the responses (Table 3-8).
Possible use of funds 19941 19991 20061
Launching facilities 93% 85.0% 90.4%
Restrooms _2 89.8% 89.8%
Parking 91% 84.8% 86.1%
Law enforcement _2 85.4% 85.4%
Boating education programs 86% 84.5% 84.5%
Picnic areas and campsites 89% 84.6% 84.1%
Safety patrols 90% 86.0% 81.1%
Pump-out facilities 54% 54.0% 45.3%
Non-motorized boating facilities
_2 _2 44.8%
Printed facility guides 48% 42.7% 37.6%
1 All percentages shown are those that said moderately or very important. 2 Not assessed in these studies.
16
Table 3-6. Importance of Boater Education 1994-2006.
Characteristic 1994 1999 2006
Importance of boater education courses?*
Percent who responded very or somewhat important
Percent stating strongly agree or agree
92% 93% 90%
*IORT researchers changed the response categories for this question in 2006.
Table 3-7. Completed Boater Education Course 1994-2006.
Characteristic 1994 1999 2006
Percent who responded “Yes”
Have you completed a boater education course?
17.0% 19.9% 21.2%
Table 3-8. Boater Education and Licensing Requirements 1994-2006.
Characteristic 1994 1999 2006
Percent who responded “Yes”
Percent who Agree or strongly agree
Should boater education courses be mandatory?* 50.0% 44.5% 32.0%
Should a boating license be required?* 46.0% 38.1% 45.9%
*IORT researchers changed the response categories for this question in 2006.
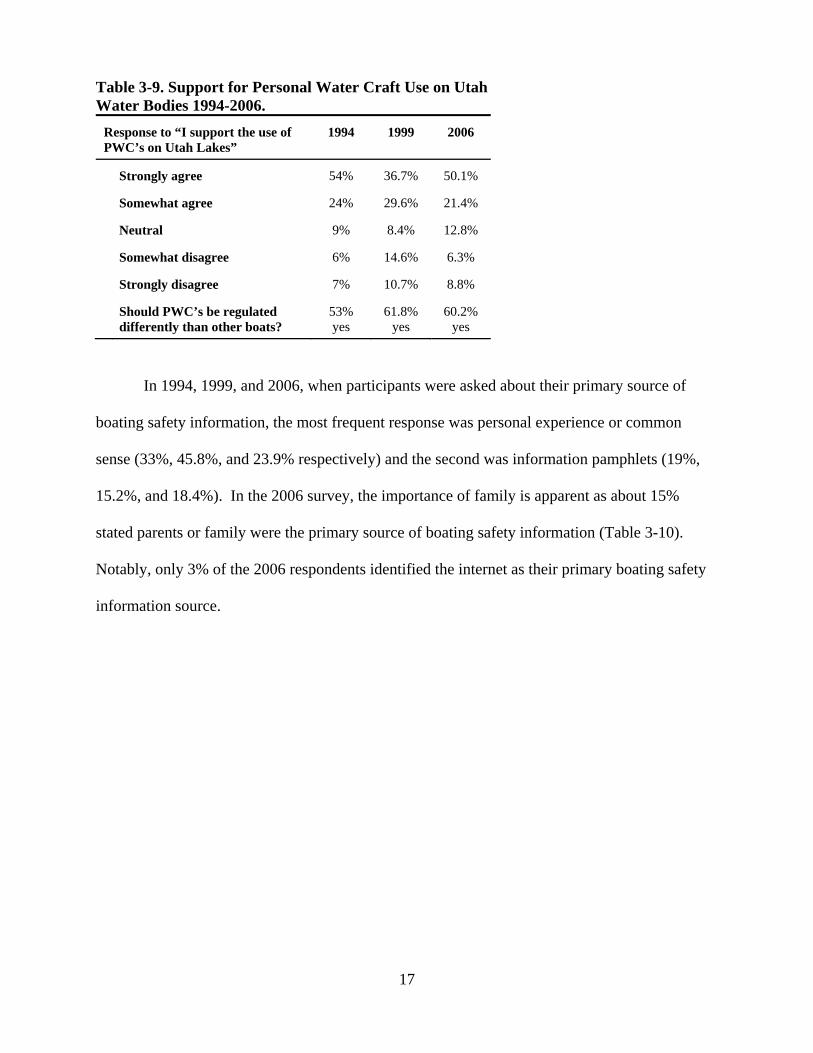
Regarding use of PWCs on Utah lakes, the 2006 survey shows a greater percentage of
respondents “strongly agree” PWCs should be allowed (50.1%) compared to 1999 (36.7%)
(Table 3-9). More than one-quarter of the respondents (25.3%) somewhat or strongly disagreed
in 1999 compared to only about 15% in 2006, but the percentage of respondents who said that
they should be regulated differently stayed about the same. Overall, there is not widespread
support for banning PWC use, however many registered boaters see a need to regulate their use
is some way.
17
Table 3-9. Support for Personal Water Craft Use on Utah Water Bodies 1994-2006.
Response to “I support the use of PWC’s on Utah Lakes”
1994 1999 2006
Strongly agree 54% 36.7% 50.1%
Somewhat agree 24% 29.6% 21.4%
Neutral 9% 8.4% 12.8%
Somewhat disagree 6% 14.6% 6.3%
Strongly disagree 7% 10.7% 8.8%
Should PWC’s be regulated differently than other boats?
53% yes
61.8% yes
60.2% yes
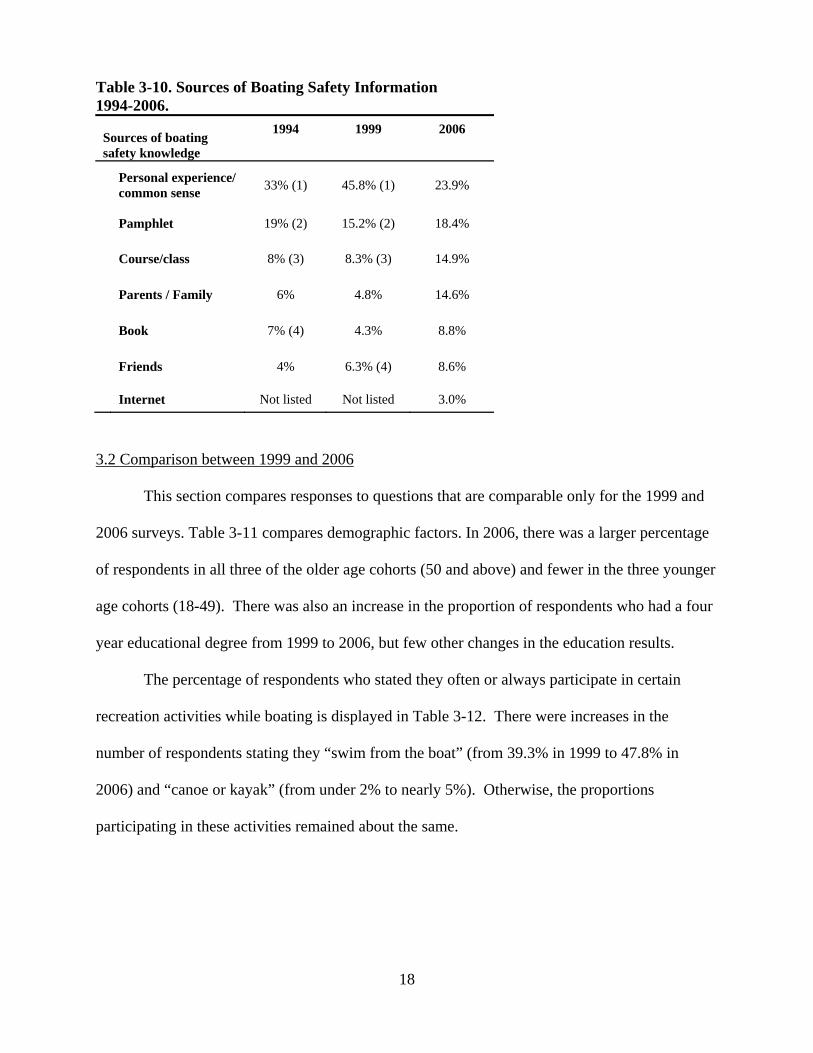
In 1994, 1999, and 2006, when participants were asked about their primary source of
boating safety information, the most frequent response was personal experience or common
sense (33%, 45.8%, and 23.9% respectively) and the second was information pamphlets (19%,
15.2%, and 18.4%). In the 2006 survey, the importance of family is apparent as about 15%
stated parents or family were the primary source of boating safety information (Table 3-10).
Notably, only 3% of the 2006 respondents identified the internet as their primary boating safety
information source.
18
Table 3-10. Sources of Boating Safety Information 1994-2006.
Sources of boating safety knowledge
1994 1999 2006
Personal experience/ common sense
33% (1) 45.8% (1) 23.9%
Pamphlet 19% (2) 15.2% (2) 18.4%
Course/class 8% (3) 8.3% (3) 14.9%
Parents / Family 6% 4.8% 14.6%
Book 7% (4) 4.3% 8.8%
Friends 4% 6.3% (4) 8.6%
Internet Not listed Not listed 3.0%
3.2 Comparison between 1999 and 2006
This section compares responses to questions that are comparable only for the 1999 and
2006 surveys. Table 3-11 compares demographic factors. In 2006, there was a larger percentage
of respondents in all three of the older age cohorts (50 and above) and fewer in the three younger
age cohorts (18-49). There was also an increase in the proportion of respondents who had a four
year educational degree from 1999 to 2006, but few other changes in the education results.
The percentage of respondents who stated they often or always participate in certain
recreation activities while boating is displayed in Table 3-12. There were increases in the
number of respondents stating they “swim from the boat” (from 39.3% in 1999 to 47.8% in
2006) and “canoe or kayak” (from under 2% to nearly 5%). Otherwise, the proportions
participating in these activities remained about the same.

19
Table 3-11. Demographic Characteristics 1999, 2006.
Characteristic
1999 2006
Age:
18 - 29 years old 4.7% 3.0%
30 – 39 17.4% 10.9%
40 – 49 30.2% 26.5%
50 – 59 21.8% 24.6%
60 – 69 17.4% 20.2%
70 and older (84) 8.4% 14.6%
Education:
8th grade or less 0.6% 0.3%
Some High School 2.9% 1.3%
HS Graduate or GED 24.3% 25.3%
Some College or Vocational School 26.2% 27.0%
Associates, Technical or Vocational Deg. 4.4% 3.1%
Bachelor’s/Four Year College Degree 20.9% 27.6%
Some Graduate Courses 2.7% 1.5%
Graduate/Professional Degree 14.7% 14.0%
Table 3-12. Activity Participation 1999, 2006.
Activity
Often or Always
Participate
1999 2006
Water-ski, tube, or knee board 50.0% 49.7%
Swim from a boat 39.3% 47.8%
Sail 3.0% 2.3%
Go sightseeing on the lake 44.4% 44.8%
Canoe or kayak 1.8% 4.5%
Fish from a boat 58.1% 56.9%
Just drive the boat around for fun 49.2% 46.8%
20
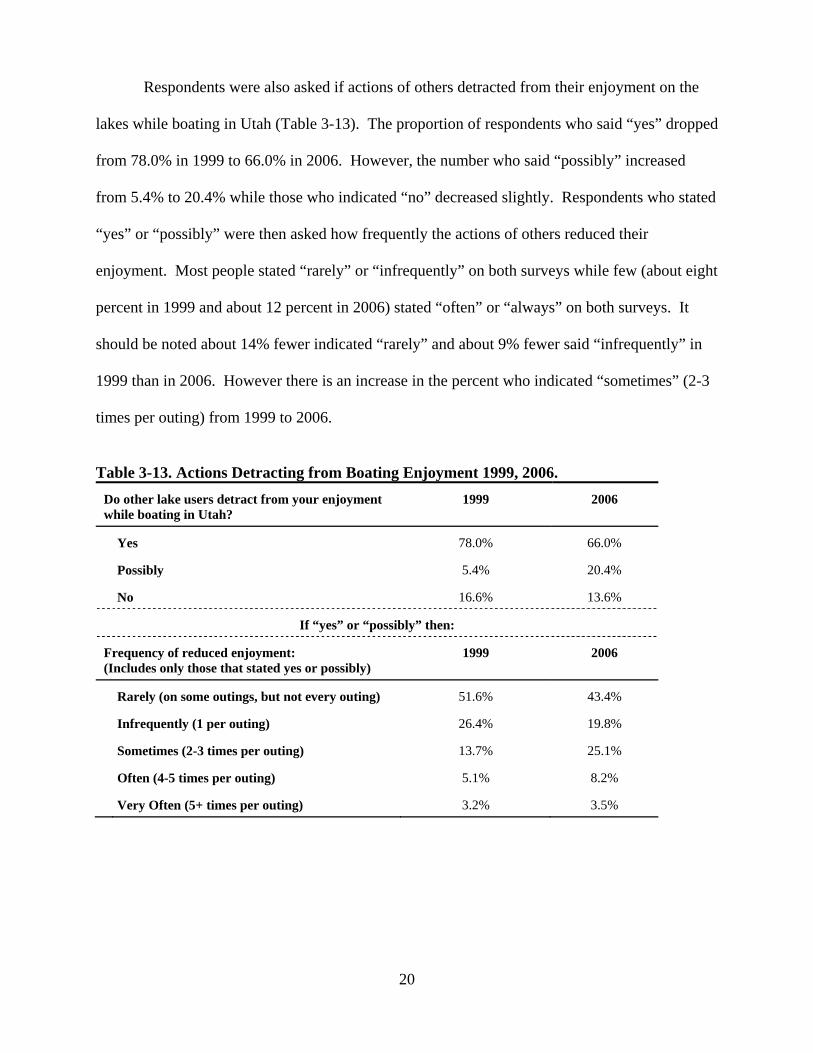
Respondents were also asked if actions of others detracted from their enjoyment on the
lakes while boating in Utah (Table 3-13). The proportion of respondents who said “yes” dropped
from 78.0% in 1999 to 66.0% in 2006. However, the number who said “possibly” increased
from 5.4% to 20.4% while those who indicated “no” decreased slightly. Respondents who stated
“yes” or “possibly” were then asked how frequently the actions of others reduced their
enjoyment. Most people stated “rarely” or “infrequently” on both surveys while few (about eight
percent in 1999 and about 12 percent in 2006) stated “often” or “always” on both surveys. It
should be noted about 14% fewer indicated “rarely” and about 9% fewer said “infrequently” in
1999 than in 2006. However there is an increase in the percent who indicated “sometimes” (2-3
times per outing) from 1999 to 2006.
Table 3-13. Actions Detracting from Boating Enjoyment 1999, 2006.
Do other lake users detract from your enjoyment while boating in Utah?
1999 2006
Yes 78.0% 66.0%
Possibly 5.4% 20.4%
No 16.6% 13.6%
If “yes” or “possibly” then:
Frequency of reduced enjoyment: (Includes only those that stated yes or possibly)
1999 2006
Rarely (on some outings, but not every outing) 51.6% 43.4%
Infrequently (1 per outing) 26.4% 19.8%
Sometimes (2-3 times per outing) 13.7% 25.1%
Often (4-5 times per outing) 5.1% 8.2%
Very Often (5+ times per outing) 3.2% 3.5%

21
When respondents were asked if there was a need to put limits on the number of boats on
a lake at one time, the percents that said “definitely yes” and “probably yes” (~65%) and who
said “definitely no” or “probably no” (~30%) did not change between 1999 and 2006 (Table 3-
14). Respondents who stated use limits were needed were asked to list up to six lakes or
reservoirs where use limits were needed. Very few respondents (n=20) stated more than two
water bodies needed use limits while only five respondents listed more than three. In both
surveys, the same five reservoirs (Pineview, Jordanelle, Deer Creek, Willard Bay, and East
Canyon) were mentioned the most often (Table 3-15), although all five reservoirs were
mentioned by fewer respondents in 2006 compared to 1999.
Table 3-14. Attitudes Toward Use Limitations 1999, 2006.
Is there a need to put a limit on the number of boats that use a lake at one time?
1999 2006
Definitely yes 24.6% 29.5%
Probably yes 39.9% 35.5%
Probably no 22.8% 17.4%
Definitely no 8.4% 12.3%
Don’t know 4.2% 5.3%
Respondents were read a list of potential problems at Utah boating areas and were asked
to state if they thought each was a problem, and if so, if it was a small, moderate, or major
problem. Table 3-16 shows the percentage of respondents who indicated the issues were
moderate or major problems. There was a small (3-5%) drop in five of the seven problems:
reckless PWC and boat operators, crowding at launches and parking areas, drug or alcohol abuse
by boaters, and crowding at beaches and facilities. There was little or no change in boaters
perceptions of problems related to crowding and safety on the lakes. Respondents felt “reckless

22
PWC operators” was still the largest problem in 2006, and as a result, in both surveys, support
for regulating PWCs differently was relatively high (about 80%) (Table 3-17).
Table 3-15: Top Five Mentioned Reservoirs Needing Use Limits 1999, 2006.
Reservoir 1999 2006
Pineview 38.4% 32.9%
Jordanelle 31.1% 24.8%
Deer Creek 21.6% 18.2%
Willard Bay 15.3% 8.9%
East Canyon 8.4% 5.0%
1 Participants were able to list six lakes or reservoirs; these frequencies are based on the first three responses. Percentages reflect only those who stated that use limits were needed.
Table 3-16. Potential Problems at Utah Boating Areas 1999, 2006.
Boating Problem
Percent stating major or moderate problem
1999 2006
Reckless personal watercraft operators? 82.7% 79.3%
Crowding at launch ramps & parking areas? 67.4% 64.5%
Reckless motorboat operators? 60.1% 55.6%
Drug or alcohol abuse by boaters? 56.1% 51.4%
Too many boats on the water at one time? 52.7% 53.7%
Safety problems on the water? 56.9% 56.9%
Crowding at beaches and facilities? 54.2% 49.6%
Table 3-17 Regulation of Personal Watercraft 1999, 2006.
“Do you believe personal water craft should be regulated differently than other boats?”
1999 2006
Yes 61.8% 60.2%
No 33.4% 36.3%
Don’t Know 4.8% 3.5%
23
4.0 SUMMARY AND CONCLUSIONS
This report compares survey results from 2006 with results obtained in 1994 and 1999.
The report provides the Utah Division of Parks and Recreation with longitudinal data and allows
respondent changes to be tracked over time. The surveys have been adjusted over time to
address current and emerging issues (such as PWC-use in the 1990s); also, USU researchers
made slight adjustments to certain questions to improve the measures in 1999 and again in 2006.
The results of this report will be considered in the final Recreational Water Use Capacity
and Regional Planning on Utah’s Lakes and Reservoirs Report. See this report for further
statewide and regional recommendations. It is suggested the longitudinal study be repeated as a
part of a statewide survey of registered boaters in five years. The statewide survey provides
insight into the management of Utah water bodies and both occasional and frequent users are
interviewed.
Boat Ownership and Trip Characteristics – The number of registered boats, boat outings, and
boats per household has decreased since 1999, and the number of individuals who own fewer
than two boats has increased. In addition, the number of trips taken annually by registered
boaters has decreased from about 12 trips to nine trips, while the average length of a typical trip
has increased from about two days to five days. In general, results indicate the large increase in
boat ownership and use in the 1990s may have leveled off or may even be declining. There are
probably several explanations for this high level of growth during the 1990s: boat ownership
became more affordable and desirable; an increase of boating opportunities (more reservoirs and
lakes open to boating); new laws required certain craft to be registered that were not previously
required; and increasing popularity of certain types of craft, especially PWCs. Some possible
explanations for the decrease between 1999 and 2006 include drought and low lake levels,
24
increased cost of fuel, market saturation, reduction in the popularity of boating nationally, and
competition from off-highway vehicles. In addition, upgrades and improvements to many of the
State Park campgrounds may have encouraged users to stay longer.
Favorite Boating Areas – Registered boat owners in Utah prefer large water bodies and those
with high quality fishing. Three large water bodies, Lake Powell, Flaming Gorge, and Bear
Lake, were among the four most commonly mentioned “favorite” Utah water bodies in all three
surveys. It should be noted the number of respondents who stated Lake Powell was their favorite
decreased from about 41% to 28% from 1999 to 2006. It is possible that lower lake levels
caused by drought have decreased Lake Powell’s popularity; increasing fuel costs may also be
impacting visitation. Strawberry Reservoir remains a favorite due to its high elevation and
quality fishing. Strawberry Reservoir has cold water and is subsequently not popular for PWC
use and waterskiing; this can indirectly improve fishing as motorized – non-motorized conflicts
are decreased.
Boater Registration Funds – Generally, the relative support for the use of boater registration
funds has stayed constant. Since the 1994 study, however, the number of registered boaters who
believe these various items are moderately or very important has decreased. This indicates either
these needs have been better met since 1996 or they are marginally less important to the users as
a whole.
Boater Education and Licensing – The percentage of boaters who have completed a boater
education class has increased slightly since 1994 (from 17% to 21%). This may be reflective of
the required PWC classes for youth. However, support for boater education appears to have
declined while support for mandatory licensing is steady and low. It is not exactly clear why this
25
is the case. However, it does appear both proposals would receive some resistance from
registered boaters.
Personal Water Craft – There is strong support for the use of PWCs on Utah lakes and
reservoirs and there was a substantial increase in the number of respondents who “strongly
support” the use of PWCs since 1999. It is possible boaters have become accustomed to PWCs;
it is also possible that PWC education courses and enforcement has led to increased support. It
should be noted although use of PWCs is generally supported, specific regulations for PWCs are
also supported. About two-thirds of the respondents in both 1999 and 2006 support regulating
PWCs differently than other boats. The final report will include information about how
registered boaters believe PWCs can be regulated differently.
Boater Safety Information – The top three sources of boater safety information are the same on
all three surveys. It is important to note that fewer respondents cited personal experience in 2006
while more cited safety courses or classes. This indicates boater safety courses may be
increasing in effectiveness.
Demographic Information – It appears the average age of registered boaters is increasing. Part
of this may be due to demographic change in the general population, and possibly to sampling
error, as the increasing use of cell phones among younger cohort groups makes it increasingly
difficult to reach using telephone surveys. While we still had about a 60% response rate, it took
up to 11 calls to get a similar response in 1999 when calls were limited to six. But still, given the
60% response rate, this effect should be relatively small. However, it is doubtful that these
explanations alone explain the near doubling of registered boaters older than 70. The data do
suggest some aging in the population, although this is consistent with the general aging of the
United States. The results indicate it is likely that fewer younger residents are boating. And
26
while there have been no studies, it is also possible the increase in Off-Highway Vehicle use is
impacting boating participation among younger residents
Activity Participation – There has been little change in the types of activities boaters participate
in while they are boating, although there was a small increase in those who swim from the boat
and those that use a canoe or kayak.
Conflict – User conflict continues to be an issue at Utah water bodies as the number of
registered boaters who said others possibly detracted from their experience is over 80 percent.
However, fewer than 12 percent said this happened often or very often, which is a slight increase
from 1999.
Use Limitations – The majority of users (65%) believe use limitations are appropriate at some
Utah water bodies. As in 1999, Pineview, Jordanelle, Deer Creek, and Willard Bay reservoirs
were still the most commonly cited lakes needing use limits in 2006 – but the proportion of
respondents identifying these recreation areas for use limits has decreased. One problem with
setting a use limitation at a particular water body is that users who cannot access the area may go
to other areas that currently have less use. This may change the experience at these other, less
used water bodies.
Potential Problems at Utah Boating Areas – There may have been some successes in
addressing certain management issues since 1999, but the differences are small. Seven of the
eight potential problems had fewer respondents citing them as a moderate or major problem in
2006 than in 1999.

27
5.0 APPENDIX A
The distribution of respondents in 1989 shows a high percentage of those surveyed were
still from Salt Lake County (71%) (Table A-1). In the later two studies, the percentage dropped
to 38% and 33%; however the highest percentage of those surveyed were from Salt Lake County.
In 1989, 86% of those surveyed lived on the Wasatch Front, and in 1994 and 1999 about 68%
lived on the Wasatch Front. In the 2006 study, about one-quarter of the respondents were from
Salt Lake County while the surrounding counties showed slight increases in the proportion of the
sample. It is possible there was a shift in ownership from 71% in Salt Lake County in 1989 to
38% in 1994 and 0.3% in Weber County in 1989 to 7% in 1994. However, we do not have
information confirming this trend. We think the 1989 survey may not be that representative of
all owners and will not be treated as such. Therefore, this report did not include the 1989 results.
Table A-1. Registered Boaters Area of Residence 1989-2006.
Area of the State 1989 1994 1999 2006
Salt Lake County 71% 38% 33% 26%
Utah County 9% 10% 14% 16%
Davis County 6% 14% 10% 13%
Weber County 0% 7% 11% 12%
Other Counties 1 14% 30% 32% 32%
1 On the 1989 and 1994 surveys, this area was called “rural counties.”
28
6.0 APPENDIX B
2006 Recreational Water Use Capacity on Utah’s Lakes and Reservoirs Telephone Survey
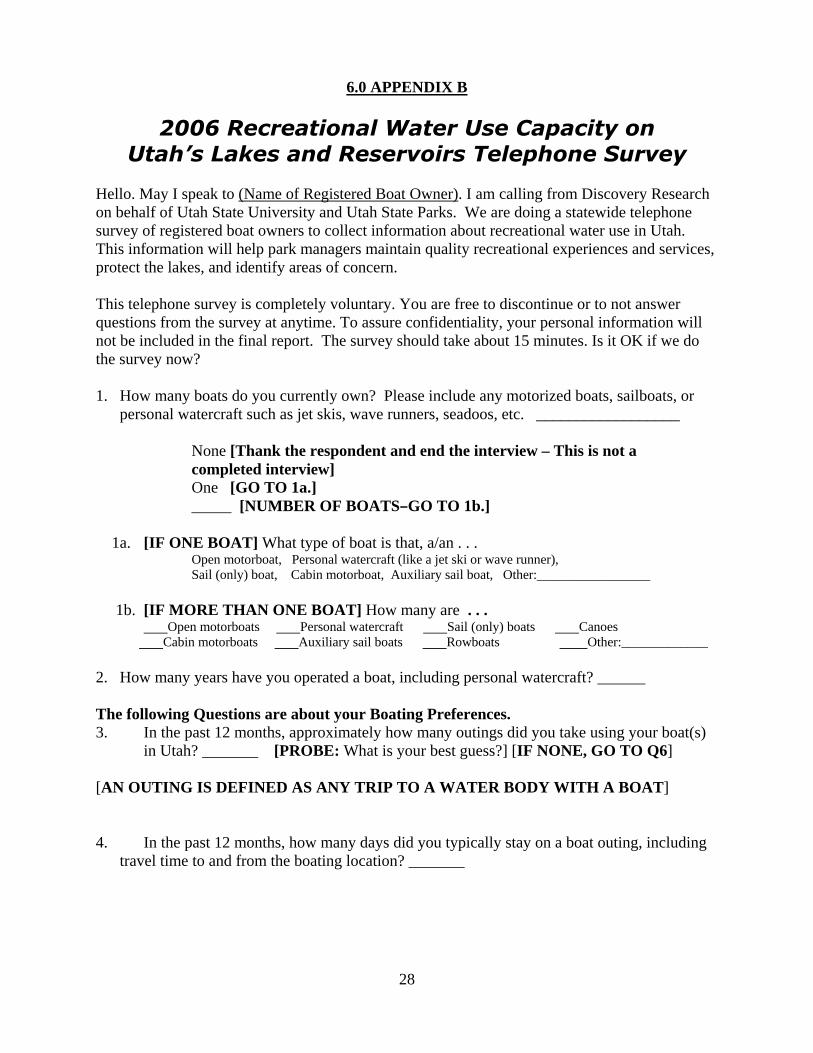
Hello. May I speak to (Name of Registered Boat Owner). I am calling from Discovery Research on behalf of Utah State University and Utah State Parks. We are doing a statewide telephone survey of registered boat owners to collect information about recreational water use in Utah. This information will help park managers maintain quality recreational experiences and services, protect the lakes, and identify areas of concern. This telephone survey is completely voluntary. You are free to discontinue or to not answer questions from the survey at anytime. To assure confidentiality, your personal information will not be included in the final report. The survey should take about 15 minutes. Is it OK if we do the survey now? 1. How many boats do you currently own? Please include any motorized boats, sailboats, or
personal watercraft such as jet skis, wave runners, seadoos, etc. __________________
None [Thank the respondent and end the interview – This is not a completed interview] One [GO TO 1a.]
_____ [NUMBER OF BOATSBGO TO 1b.] 1a. [IF ONE BOAT] What type of boat is that, a/an . . .
Open motorboat, Personal watercraft (like a jet ski or wave runner), Sail (only) boat, Cabin motorboat, Auxiliary sail boat, Other:_________________ 1b. [IF MORE THAN ONE BOAT] How many are . . .
Open motorboats Personal watercraft Sail (only) boats Canoes Cabin motorboats Auxiliary sail boats Rowboats Other:_____________ 2. How many years have you operated a boat, including personal watercraft? ______ The following Questions are about your Boating Preferences. 3. In the past 12 months, approximately how many outings did you take using your boat(s) in Utah? _______ [PROBE: What is your best guess?] [IF NONE, GO TO Q6] [AN OUTING IS DEFINED AS ANY TRIP TO A WATER BODY WITH A BOAT] 4. In the past 12 months, how many days did you typically stay on a boat outing, including
travel time to and from the boating location? _______
29
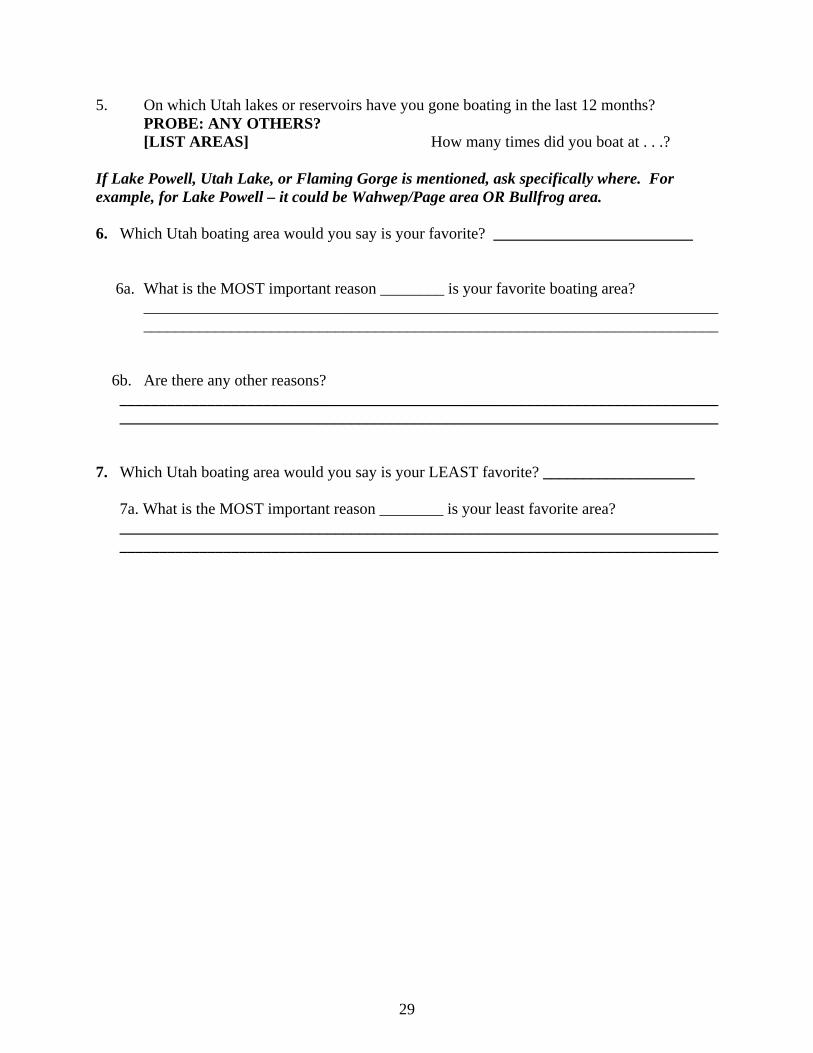
5. On which Utah lakes or reservoirs have you gone boating in the last 12 months? PROBE: ANY OTHERS?
[LIST AREAS] How many times did you boat at . . .? If Lake Powell, Utah Lake, or Flaming Gorge is mentioned, ask specifically where. For example, for Lake Powell – it could be Wahwep/Page area OR Bullfrog area. 6. Which Utah boating area would you say is your favorite? _________________________ 6a. What is the MOST important reason ________ is your favorite boating area?
________________________________________________________________________________________________________________________________________________
6b. Are there any other reasons? ___________________________________________________________________________ ___________________________________________________________________________ 7. Which Utah boating area would you say is your LEAST favorite? ___________________
7a. What is the MOST important reason ________ is your least favorite area? ______________________________________________________________________________________________________________________________________________________
30
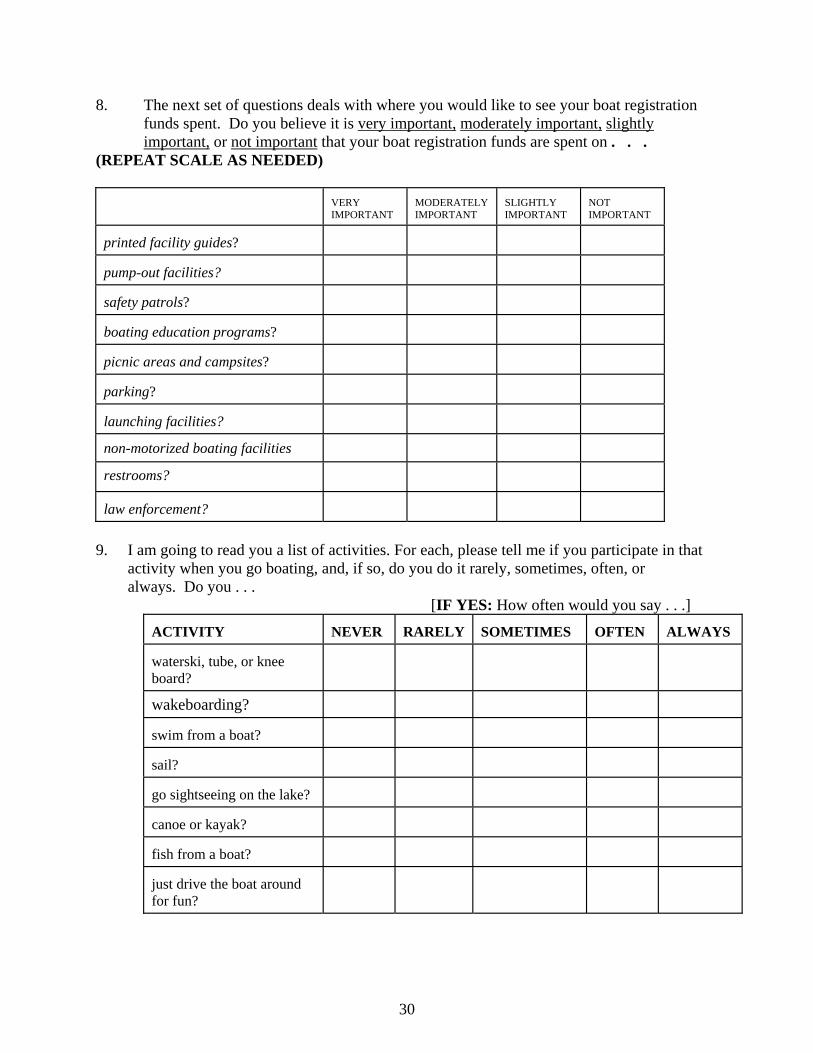
8. The next set of questions deals with where you would like to see your boat registration funds spent. Do you believe it is very important, moderately important, slightly important, or not important that your boat registration funds are spent on . . . (REPEAT SCALE AS NEEDED) VERY
IMPORTANT MODERATELY IMPORTANT
SLIGHTLY IMPORTANT
NOT IMPORTANT
printed facility guides?
pump-out facilities?
safety patrols?
boating education programs?
picnic areas and campsites?
parking?
launching facilities?
non-motorized boating facilities
restrooms?
law enforcement?
9. I am going to read you a list of activities. For each, please tell me if you participate in that activity when you go boating, and, if so, do you do it rarely, sometimes, often, or always. Do you . . .
[IF YES: How often would you say . . .] ACTIVITY NEVER RARELY SOMETIMES
OFTEN ALWAYS
waterski, tube, or knee board?
wakeboarding? swim from a boat?
sail?
go sightseeing on the lake?
canoe or kayak?
fish from a boat?
just drive the boat around for fun?
31
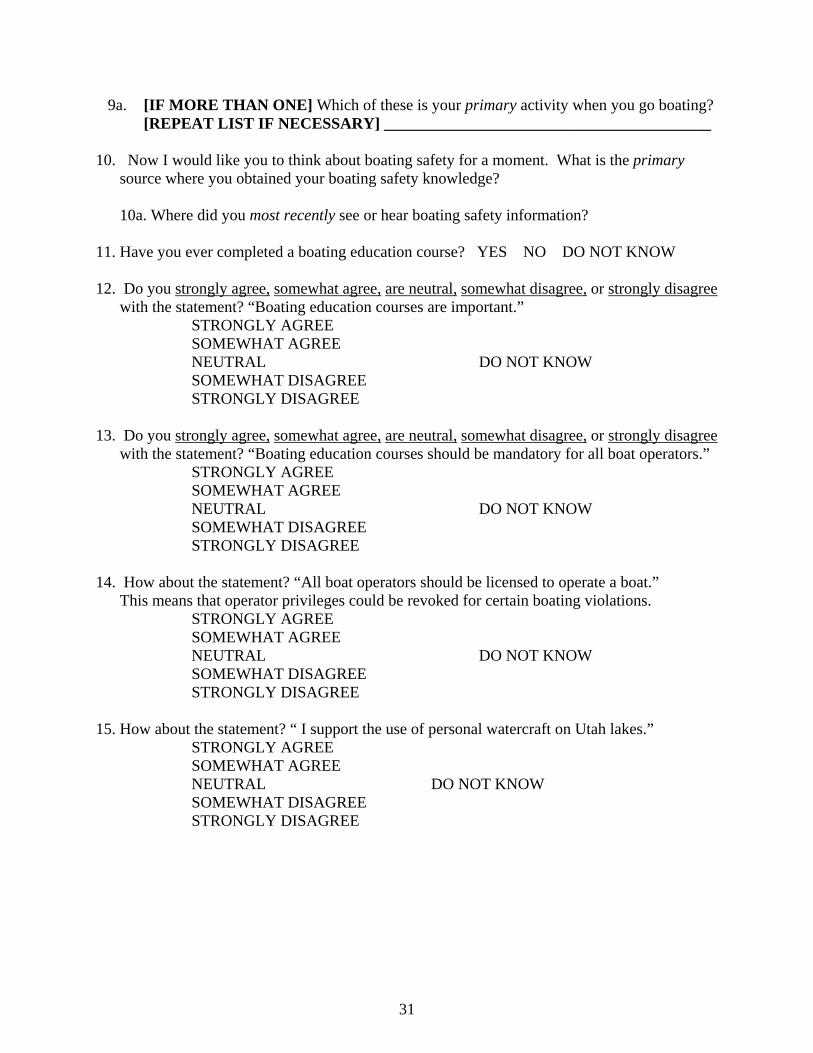
9a. [IF MORE THAN ONE] Which of these is your primary activity when you go boating? [REPEAT LIST IF NECESSARY] _________________________________________
10. Now I would like you to think about boating safety for a moment. What is the primary
source where you obtained your boating safety knowledge? 10a. Where did you most recently see or hear boating safety information?
11. Have you ever completed a boating education course? YES NO DO NOT KNOW 12. Do you strongly agree, somewhat agree, are neutral, somewhat disagree, or strongly disagree
with the statement? “Boating education courses are important.” STRONGLY AGREE SOMEWHAT AGREE NEUTRAL DO NOT KNOW SOMEWHAT DISAGREE STRONGLY DISAGREE
13. Do you strongly agree, somewhat agree, are neutral, somewhat disagree, or strongly disagree
with the statement? “Boating education courses should be mandatory for all boat operators.” STRONGLY AGREE SOMEWHAT AGREE NEUTRAL DO NOT KNOW SOMEWHAT DISAGREE STRONGLY DISAGREE
14. How about the statement? “All boat operators should be licensed to operate a boat.” This means that operator privileges could be revoked for certain boating violations.
STRONGLY AGREE SOMEWHAT AGREE NEUTRAL DO NOT KNOW SOMEWHAT DISAGREE STRONGLY DISAGREE
15. How about the statement? “ I support the use of personal watercraft on Utah lakes.”
STRONGLY AGREE SOMEWHAT AGREE NEUTRAL DO NOT KNOW SOMEWHAT DISAGREE STRONGLY DISAGREE
32
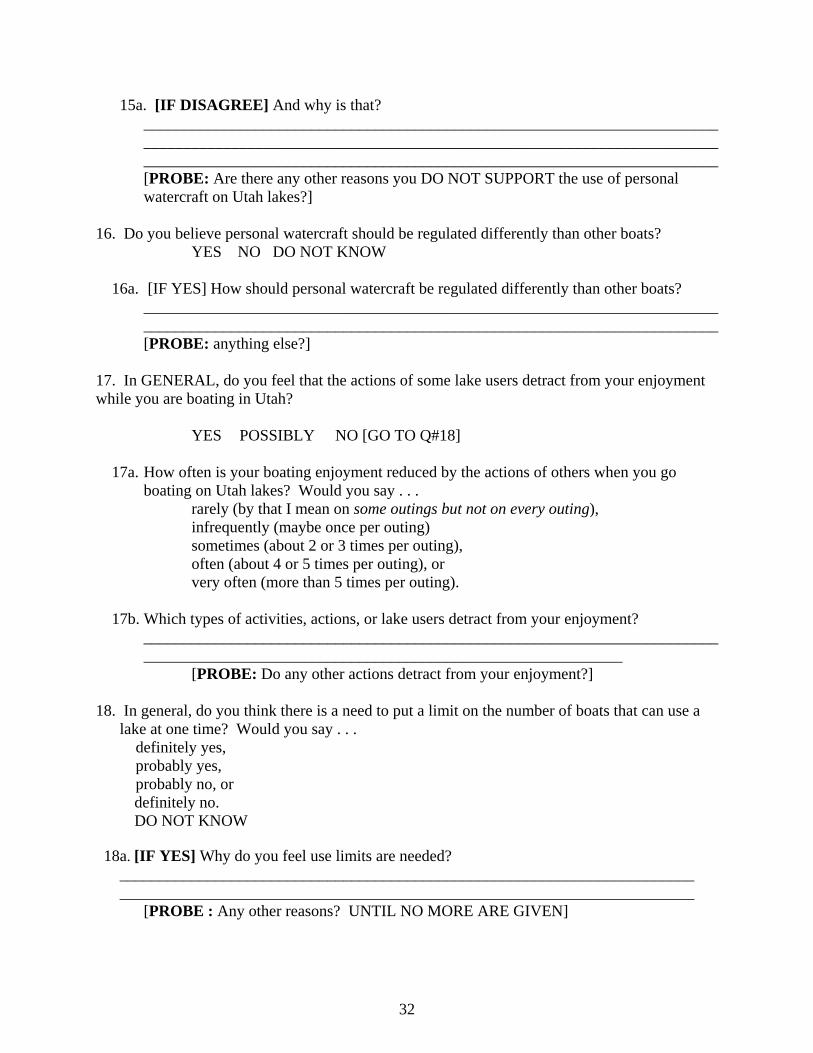
15a. [IF DISAGREE] And why is that? ________________________________________________________________________________________________________________________________________________________________________________________________________________________ [PROBE: Are there any other reasons you DO NOT SUPPORT the use of personal watercraft on Utah lakes?]
16. Do you believe personal watercraft should be regulated differently than other boats? YES NO DO NOT KNOW
16a. [IF YES] How should personal watercraft be regulated differently than other boats?
________________________________________________________________________________________________________________________________________________ [PROBE: anything else?]
17. In GENERAL, do you feel that the actions of some lake users detract from your enjoyment while you are boating in Utah?
YES POSSIBLY NO [GO TO Q#18] 17a. How often is your boating enjoyment reduced by the actions of others when you go
boating on Utah lakes? Would you say . . . rarely (by that I mean on some outings but not on every outing),
infrequently (maybe once per outing) sometimes (about 2 or 3 times per outing),
often (about 4 or 5 times per outing), or very often (more than 5 times per outing).
17b. Which types of activities, actions, or lake users detract from your enjoyment?
____________________________________________________________________________________________________________________________________
[PROBE: Do any other actions detract from your enjoyment?] 18. In general, do you think there is a need to put a limit on the number of boats that can use a
lake at one time? Would you say . . . definitely yes,
probably yes, probably no, or definitely no. DO NOT KNOW
18a. [IF YES] Why do you feel use limits are needed?
________________________________________________________________________ ________________________________________________________________________
[PROBE : Any other reasons? UNTIL NO MORE ARE GIVEN]
33
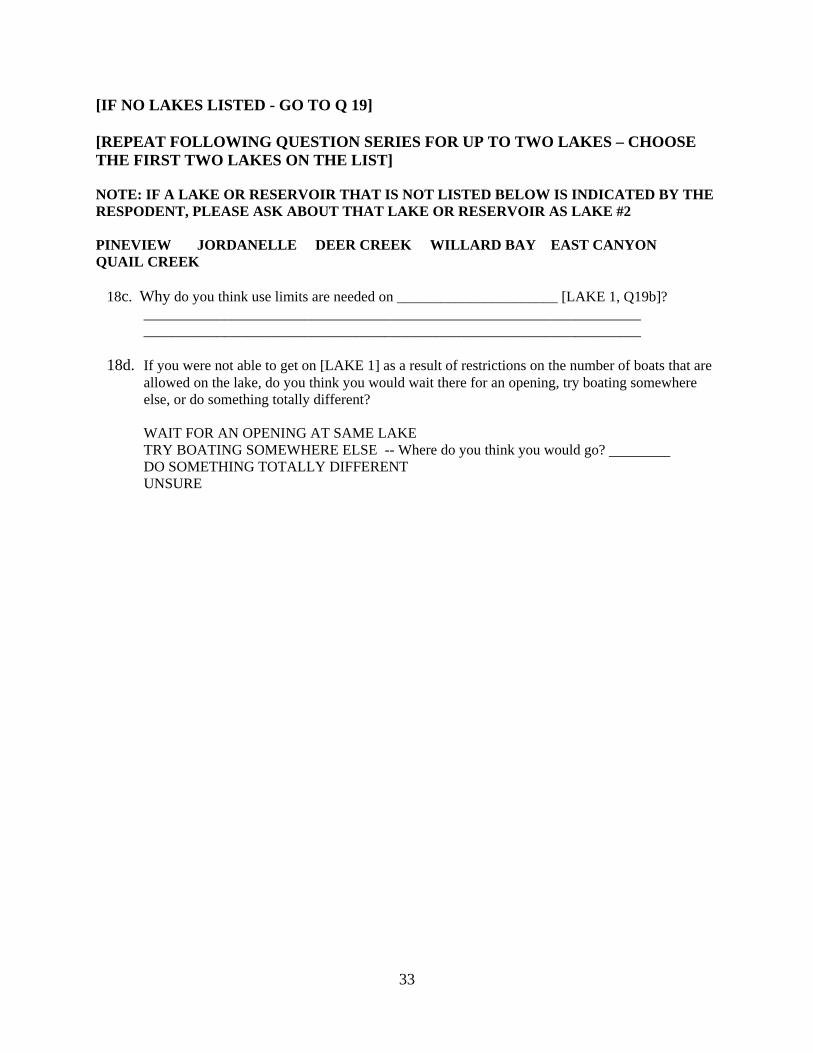
[IF NO LAKES LISTED - GO TO Q 19] [REPEAT FOLLOWING QUESTION SERIES FOR UP TO TWO LAKES – CHOOSE THE FIRST TWO LAKES ON THE LIST] NOTE: IF A LAKE OR RESERVOIR THAT IS NOT LISTED BELOW IS INDICATED BY THE RESPODENT, PLEASE ASK ABOUT THAT LAKE OR RESERVOIR AS LAKE #2 PINEVIEW JORDANELLE DEER CREEK WILLARD BAY EAST CANYON QUAIL CREEK 18c. Why do you think use limits are needed on ______________________ [LAKE 1, Q19b]?
____________________________________________________________________ ____________________________________________________________________
18d. If you were not able to get on [LAKE 1] as a result of restrictions on the number of boats that are
allowed on the lake, do you think you would wait there for an opening, try boating somewhere else, or do something totally different?
WAIT FOR AN OPENING AT SAME LAKE TRY BOATING SOMEWHERE ELSE -- Where do you think you would go? DO SOMETHING TOTALLY DIFFERENT UNSURE

34
19. Next I would like to read you a list of potential problems or concerns that may occur at various lakes. For each, please tell me if you think it is a problem on the Utah lakes you are familiar with, and if so, is it a small, moderate, or major problem.
[IF YES: Is it a small, moderate or major problem?] PROBLEM NOT
PROBLEM SMALL PROBLEM
MODERATE PROBLEM
MAJOR PROBLEM
Is drug or alcohol abuse by boaters a problem?
How about…reckless motorboat operators?
How about… reckless personal watercraft operators?
How about…too many boats on the water at one time?
How about…crowding at launch ramps & parking areas?
How about…crowding at beaches and facilities?
How about…fluctuating water levels?
How about…safety problems on the water?
20. For the following questions, please tell me if you would strongly agree, agree, disagree or strongly disagree with the following action at your favorite water-based State Park in Utah: Note: If the respondent mentioned Lake Powell or Flaming Gorge as their favorite (SEE QUESTION #6) – tell them that we want to hear about their favorite state park. If they say that they do not have a favorite state park – have them discuss a park they use frequently or live near (find out which one they are talking about). 20a. Increase the number of boater education programs
STRONGLY AGREE SOMEWHAT AGREE NEUTRAL SOMEWHAT DISAGREE STRONGLY DISAGREE

35
20b. Expand the parking lot to allow more boats on the water STRONGLY AGREE SOMEWHAT AGREE NEUTRAL SOMEWHAT DISAGREE STRONGLY DISAGREE
20c. Expand the boat ramp to increase the number of boats that could be launched at one time
STRONGLY AGREE SOMEWHAT AGREE NEUTRAL SOMEWHAT DISAGREE STRONGLY DISAGREE
20d. Increase fees to improve infrastructure (such as boat ramps, restrooms, picnic areas) STRONGLY AGREE SOMEWHAT AGREE NEUTRAL SOMEWHAT DISAGREE STRONGLY DISAGREE
20e. Increase the number of law enforcement patrols on the water
STRONGLY AGREE SOMEWHAT AGREE NEUTRAL SOMEWHAT DISAGREE STRONGLY DISAGREE
20f. Decrease the number of law enforcement patrols on the water
STRONGLY AGREE SOMEWHAT AGREE NEUTRAL SOMEWHAT DISAGREE STRONGLY DISAGREE
20g. Limit Personal Water Craft to certain areas on the water
STRONGLY AGREE SOMEWHAT AGREE NEUTRAL SOMEWHAT DISAGREE STRONGLY DISAGREE
36
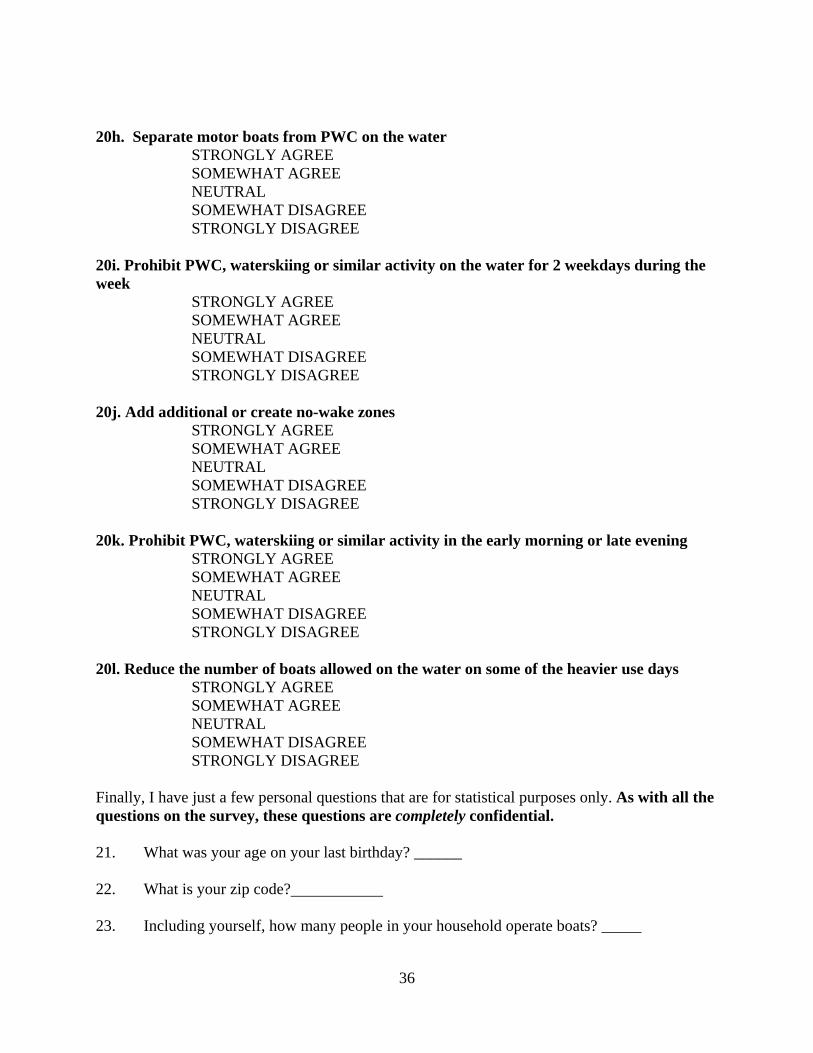
20h. Separate motor boats from PWC on the water STRONGLY AGREE SOMEWHAT AGREE NEUTRAL SOMEWHAT DISAGREE STRONGLY DISAGREE
20i. Prohibit PWC, waterskiing or similar activity on the water for 2 weekdays during the week
STRONGLY AGREE SOMEWHAT AGREE NEUTRAL SOMEWHAT DISAGREE STRONGLY DISAGREE
20j. Add additional or create no-wake zones
STRONGLY AGREE SOMEWHAT AGREE NEUTRAL SOMEWHAT DISAGREE STRONGLY DISAGREE
20k. Prohibit PWC, waterskiing or similar activity in the early morning or late evening
STRONGLY AGREE SOMEWHAT AGREE NEUTRAL SOMEWHAT DISAGREE STRONGLY DISAGREE
20l. Reduce the number of boats allowed on the water on some of the heavier use days
STRONGLY AGREE SOMEWHAT AGREE NEUTRAL SOMEWHAT DISAGREE STRONGLY DISAGREE
Finally, I have just a few personal questions that are for statistical purposes only. As with all the questions on the survey, these questions are completely confidential. 21. What was your age on your last birthday? ______ 22. What is your zip code? 23. Including yourself, how many people in your household operate boats? _____

37
24. How many people are there living or staying in your household, including yourself? 24a. Of these x people, how many are 17 or younger? 25. What was your total combined household income from all wage earners during the past 12 months? Please include money from all sources, not just wages and salaries, before taxes and other deductions. Was it . . . Less than $25,000, between $25,000 and $45,000, between $45,000 and $65,000, between $65,000 and $85,000. between $85,000 and $105,000, between $105,000 and $125,000, between $125,000 and $150,000, between $150,000 and $200,000, or more than $200,000 26. What is the highest year or grade of school you have completed? Junior high or less Some high school High school grad or GED Some college or vocational school Technical or vocational school grad. or Associates degree College graduate (4 years, Bachelors degree) Some graduate courses Graduate/Professional degree
Thank you for your time and participation in this survey. This information will assist Utah State Parks in making your water recreation experience more enjoyable for you.
38
7.0 REFERENCES
Utah Department of Natural Resources, Division of Parks & Recreation (1990). Utah Motorboat Survey. Completed by: Business Strategies.
Utah Department of Natural Resources (1995). Utah Department of Natural Resources
Motorboat Survey Report. Completed by University of Utah Survey Research Center. Utah Department of Natural Resources, Division of Parks & Recreation (2001). A Summary
Report: 1999 Utah State Park Boater Telephone Survey. Institute of Outdoor Recreation and Tourism, Utah State University.