a study of the organized retail scenario...
TRANSCRIPT

ISSN: 0971-1023 | NMIMS Management ReviewVolume XXXII November 2016
ISSN: 0971-1023 | NMIMS Management ReviewVolume XXXII November 2016
A Study of the Organized Retail Scenarioin India and Customer Impulsiveness
in Organized Retail Outlets
K. Venkateswara Raju
D. Prasanna Kumar
A Study of the Organized Retail Scenario in India andCustomer Impulsiveness in Organized Retail Outlets
Abstract
The organized retail sector is growing at a rapid pace
across states in India and is the prime driver of impulse
buying by youngsters and individuals with substantial
salaries. Most buying takes place during weekends at
these stores; this was not seen in the previous periods.
The research study was conducted to find the impact
of effective Visual Merchandising (VM) on the impulse
buying behaviour of customers at various retail stores
in Andhra Pradesh. The objective of this study is to
provide some insight into various segments of the
Indian organized retail sector - employment
opportunities, education profile of employees across
states, skill gaps, work force distribution - and to find
the satisfaction attributes of customers at organized
retail outlets, and most importantly, how VISUAL
MERCHANDISING is affecting impulse decisions of
the customer. In this study, we used various questions
on lifestyle attributes and satisfaction with life scale
variables for collecting information, and tried to study
their effect on customer impulse behaviour. A survey
of 600 retail customers was done and results
interpreted in this paper.
Key Words: RETAIL, FDI, GDP, BRAND, IMPULSE,
EMPLOYMENT
A Study of the Organized Retail Scenario in India andCustomer Impulsiveness in Organized Retail Outlets
INTRODUCTION
According to a KPMG report which focuses on various
segments of the Indian retail sector, the food & grocery
segment has a 31 percent share of retail employment,
lifestyle has 7 percent, entertainment & leisure has 1
percent and home improvement has 7 percent; health
& personal care has 3 percent, auto and auto
components has 26 percent, and gems and Jewellery
has 25 percent.
Share of Employment in Indian Retail Industry
Gems andJewellery, 25 Food and
Grocery, 31
Auto and AutoComponents, 26
HomeImprovement,
7
Lifestyle, 7
Health andPersonal Care, 3
Entertainmentand Leisure, 1
Source: KPMG INDIA
According to Pankaj Gupta, Practice Head – Consumer
and Retail, Tata Strategic Management Group, the
overall retail market in India has grown at a Compound
Annual Growth Rate of 5.5 percent (at constant prices)
to Rs 1,677,000 crore in 2015. He projected that the
organized retail sector will grow at a much faster CAGR
of 21.8 percent (at constant prices) to Rs. 246,000
crore and will constitute ~ 15 percent of total sales in
the retail sector. He projected that the top retail
categories in the organized retail sector would be
grocery, food & general merchandise, clothing &
textiles, mobiles & electronic durables, food servicing,
home improving decors and the like.
According to his estimate, the share of the 35 towns
with population greater than one million in the overall
population of India would grow much faster from
around 10 percent to reach around 14 percent by
2025. Simultaneously, the share of these towns in the
overall retail market would grow from 21 percent
today to 40 percent by 2025. According to him,
retailers should focus on the top 37 towns in this
decade; the opportunity in smaller towns and rural
India would be smaller and fragmented as compared
to the larger towns.
According to Pankaj Gupta, Practice Head – Consumer
and Retail, Tata Strategic Management Group, there
are some likely trends seen internationally that could
have a bearing on our country.
The first trend is top retailers consolidating their share
of the organized retail market - the big retailers may
get bigger at the early stages itself.
22 23
Changes
cities of India, and therefore street
Contents
mall farmers. Majority of the
farmers (82%) borrow less than
Rs 5 lakhs, and 18% borrow
between Rs 5 – 10 lakhs on a
per annum basis. Most farmers
(65.79%) ar
Table source heading
Table 23: The Results of Mann-Whitney U Test for DOWJONES Index Daily ReturnsDr. Rosy Kalra
Mr. Piyuesh Pandey
References

ISSN: 0971-1023 | NMIMS Management ReviewVolume XXXII November 2016
ISSN: 0971-1023 | NMIMS Management ReviewVolume XXXII November 2016
A Study of the Organized Retail Scenarioin India and Customer Impulsiveness
in Organized Retail Outlets
K. Venkateswara Raju
D. Prasanna Kumar
A Study of the Organized Retail Scenario in India andCustomer Impulsiveness in Organized Retail Outlets
Abstract
The organized retail sector is growing at a rapid pace
across states in India and is the prime driver of impulse
buying by youngsters and individuals with substantial
salaries. Most buying takes place during weekends at
these stores; this was not seen in the previous periods.
The research study was conducted to find the impact
of effective Visual Merchandising (VM) on the impulse
buying behaviour of customers at various retail stores
in Andhra Pradesh. The objective of this study is to
provide some insight into various segments of the
Indian organized retail sector - employment
opportunities, education profile of employees across
states, skill gaps, work force distribution - and to find
the satisfaction attributes of customers at organized
retail outlets, and most importantly, how VISUAL
MERCHANDISING is affecting impulse decisions of
the customer. In this study, we used various questions
on lifestyle attributes and satisfaction with life scale
variables for collecting information, and tried to study
their effect on customer impulse behaviour. A survey
of 600 retail customers was done and results
interpreted in this paper.
Key Words: RETAIL, FDI, GDP, BRAND, IMPULSE,
EMPLOYMENT
A Study of the Organized Retail Scenario in India andCustomer Impulsiveness in Organized Retail Outlets
INTRODUCTION
According to a KPMG report which focuses on various
segments of the Indian retail sector, the food & grocery
segment has a 31 percent share of retail employment,
lifestyle has 7 percent, entertainment & leisure has 1
percent and home improvement has 7 percent; health
& personal care has 3 percent, auto and auto
components has 26 percent, and gems and Jewellery
has 25 percent.
Share of Employment in Indian Retail Industry
Gems andJewellery, 25 Food and
Grocery, 31
Auto and AutoComponents, 26
HomeImprovement,
7
Lifestyle, 7
Health andPersonal Care, 3
Entertainmentand Leisure, 1
Source: KPMG INDIA
According to Pankaj Gupta, Practice Head – Consumer
and Retail, Tata Strategic Management Group, the
overall retail market in India has grown at a Compound
Annual Growth Rate of 5.5 percent (at constant prices)
to Rs 1,677,000 crore in 2015. He projected that the
organized retail sector will grow at a much faster CAGR
of 21.8 percent (at constant prices) to Rs. 246,000
crore and will constitute ~ 15 percent of total sales in
the retail sector. He projected that the top retail
categories in the organized retail sector would be
grocery, food & general merchandise, clothing &
textiles, mobiles & electronic durables, food servicing,
home improving decors and the like.
According to his estimate, the share of the 35 towns
with population greater than one million in the overall
population of India would grow much faster from
around 10 percent to reach around 14 percent by
2025. Simultaneously, the share of these towns in the
overall retail market would grow from 21 percent
today to 40 percent by 2025. According to him,
retailers should focus on the top 37 towns in this
decade; the opportunity in smaller towns and rural
India would be smaller and fragmented as compared
to the larger towns.
According to Pankaj Gupta, Practice Head – Consumer
and Retail, Tata Strategic Management Group, there
are some likely trends seen internationally that could
have a bearing on our country.
The first trend is top retailers consolidating their share
of the organized retail market - the big retailers may
get bigger at the early stages itself.
22 23
Changes
cities of India, and therefore street
Contents
mall farmers. Majority of the
farmers (82%) borrow less than
Rs 5 lakhs, and 18% borrow
between Rs 5 – 10 lakhs on a
per annum basis. Most farmers
(65.79%) ar
Table source heading
Table 23: The Results of Mann-Whitney U Test for DOWJONES Index Daily ReturnsDr. Rosy Kalra
Mr. Piyuesh Pandey
References

He cited the example of China where in 2003, the top
hundred players accounted for only 8 percent of the
total retail market while the top 10 accounted for a
little more than 3 percent share of the market.
According to a report of M+M Planet Retail, 30 retailers
accounted for 20 percent share of the total US retail
market in the 1990's whereas only 8 retailers account
for the same 20 percent share of the market in 2005.
Similarly, 37 retailers accounted for 20 percent share of
the European retail market in the nineties while only
10 retailers accounted for the same share of the
market in 2005.
The second trend is convenience stores and
hypermarket formats gaining more prominence driven
by the consumer's need for convenience and low price
with high value in the mass category. Even though
supermarkets are successful in emerging as successful
pioneers in the first stage of retail space expansion,
they are not able to match value propositions of
hypermarkets and convenience stores.
The third trend pertains to the rising importance of
private label products. Presently, private labels
account for 17 percent of global retail sales with the
highest share of 23 percent in Europe and around 4
percent in Asia. As per M+M Planet Retail data, private
label penetration varies in the range of 25-95 percent
among some of the largest retailers in the world. This is
due to rising acceptability of private store labels
among store customers and growing competition in
the pricing space.
VALUE CHAIN ANALYSIS OF RETAIL
OUTLETS
The value chain analysis is an important strategy and
forms a critical part of the retail operations of any
store. it consists of various steps like sourcing goods,
managing inventory, taking stock of the store
operations, setting up a proper display and selecting
the right promotional mix and marketing strategy,
taking stock of sales – product wise and amount wise -
and also maintaining an effective after-sales service.
Generally retailers procure their selection of goods
from distribution agents or manufacturing companies,
and sometimes even resort to backward integration to
manufacture their own store branded products. To
maintain their inventory, retailers generally have
national warehouses where they stock goods and
transfer them to regional warehouses based on the
demand for those goods. When it comes to marketing,
store managers try to identify the various segments
that they can and should target for improving the store
sales through effective visual merchandising and
proper designing of the store with suitable product
advertisements and through successful brand
promotions. The store managers try to convert people
visiting the store to customers by providing good
facilities inside the store, and training the store
employees to guide and help customers in choosing
their goods when needed. For retaining old customers
and developing new customers through positive word-
of-mouth, retailers now provide a separate and
effective customer sales service help desk which offers
attractive return options for rejected goods or
exchange options as well as guarantees or warranties
for almost all goods at the store, except consumables.
In India, some states allow multi-brand retail while
others don't allow this due to regional considerations.
States allowing FDI in Multi-Brand Retail States that don’t allow FDI in Multi-Brand Retail
Andhra Pradesh West Bengal
Assam Gujarat
Haryana Bihar
Jammu and Kashmir Tamil Nadu
Maharashtra Kerala
Manipur Madhya Pradesh
Uttarakhand Tripura
Daman & Diu Odisha (Orissa)
Dadra & Nagar Haveli Delhi
Karnataka Rajasthan
The segment-wise share of 'Lifestyle' in organized
retail is given as 'Apparel & Clothing' with 33 percent,
'Footwear' with 4 percent, 'Time wear' with 2 percent,
'Eyewear' with 1 percent, 'Accessories' with 1 percent,
'Mobile & Telecom' with 11 percent, 'Others' with 48
percent in a consolidated report from India Retail
Report 2013, KPMG analysis, CR IS IL report;
November 2013.
SEGMENT-WISE SHARE OF EMPLOYMENT
IN INDIAN RETAIL SECTOR
According to a KPMG report which focuses on various
segments of the Indian Retail sector, the Food &
Grocery segment has a 31 percent share of retail
employment whi le L i festyle has 7 percent,
Entertainment & Leisure has 1 percent and Home
Improvement has 7 percent; Health & Personal Care
has 3 percent, Auto and Auto Components has 26
percent, and Gems and Jewellery has 25 percent. The
report also concluded that unorganized retail has a 93
percent share of employment with the balance 7
percent share with organized retail.
Auto and AutoComponents, 26
Gems andJewellery, 25
Food andGrocery, 31
HomeImprovement,
7
Lifestyle, 7
Health andPersonal Care, 3
Entertainmentand Leisure, 1
Source: KPMG INDIA
Share of Employment in Indian Retail Industry
SEGMENT-WISE VALUE SHARE OF BEAUTY
& PERSONAL-CARE and PHARMACY
In the Beauty & Personal Care segment, 12 percent is in
the organized space while the unorganized space has
the remaining 88 percent.
In the Pharmacy segment, 5 percent is in the organized
space while the unorganized space has the remaining
95 percent.
ISSN: 0971-1023 | NMIMS Management ReviewVolume XXXII November 2016
ISSN: 0971-1023 | NMIMS Management ReviewVolume XXXII November 2016
A Study of the Organized Retail Scenario in India andCustomer Impulsiveness in Organized Retail Outlets
A Study of the Organized Retail Scenario in India andCustomer Impulsiveness in Organized Retail Outlets24 25
Changes
cities of India, and therefore street
Contents
mall farmers. Majority of the
farmers (82%) borrow less than
Rs 5 lakhs, and 18% borrow
between Rs 5 – 10 lakhs on a
per annum basis. Most farmers
(65.79%) ar
Table source heading
Table 23: The Results of Mann-Whitney U Test for DOWJONES Index Daily ReturnsDr. Rosy Kalra
Mr. Piyuesh Pandey
References

Segment Share by VALUE INR (Crores) Projected Therapeutic Spend INR (Billion)
The Pharmacy retail sector is showing steady growth
as indicated from the rise in value through the periods
2004-05, 2009-10 and 2004-15 across divisions of Anti-
diabetics, Cardiovascular drugs, Gastro-intestinal and
Pain/analgesics.
The Drug retail segment offers good growth potential
as the proportion of health spend in overall
consumption is on a steady rise in the periods from
2000 to 2010 to 2020.The proportion rose from 4.68
percent in 2000 to 4.97 percent in 2010 and is
projected to rise to 5.24 percent in 2020.
In the Food Services retail segment, quick service
restaurants are showing promising growth as we can
see that in TIER-I cities, QSR spend (in Rs billions) is
25.50 while Total Middle Class Households (in millions)
is 6.8 and QSR spend per household (per annum) is Rs
3,700. In TIER-II cities, QSR spend (in Rs billions) is
5.10 while Total Middle Class Households (in millions)
is 3.4 and QSR spend per household (per annum) is Rs
1,500.
A Comparative Assessment of Skills in
Unorganized and Organized Retail in India
According to India Retail Report 2013, KPMG analysis
reports which consolidated various insights regarding
the workforce characteristics in the cities of Mumbai,
Delhi, Bangalore, Chennai, Hyderabad, Kolkata, Pune,
Kochi, Chandigarh and Ahmedabad, the following are
the contrasting scenarios.
DIP-STICK SURVEY OF UNORGANIZED RETAIL ENTERPRISES
ASPECT DETAILS
FINANCIAL DISCIPLINE A significant number of unorganized retail outlets surveyed are lacking in
financial discipline with no records maintained for budgeting, accounting,
etc. Merchandising decisions are often based on intuition rather than data
analysis and this makes them reluctant to scale up.
JOB ROLESPECIFICATION
As employees are tasked with any and every activity from customer
handling to billing to procurement and delivery of goods to store
maintenance, there is a lack of job role distinction and thus a limited scope
for specialization in any of these activities.
UNDEREMPLOYMENT Underemployment is an inherent problem in unorganized retail, one of the
reasons being lack of distinct job roles. This is intensified by penetration of
organized retail, especially for those unorganized players with organized
retail stores in their vicinity.
WILLINGNESS OF
EMPLOYEES TO
MIGRATE TO
ORGANIZED RETAIL
While on one hand employees who were found to be very willing to move
to organized retail for reasons of better pay, working conditions and
benefits, there was a significant section of employees who weren’t willing
to migrate to organized retail, citing belongingness and loyalty t o the store
in unorganized retail. There was a third section which preferred
unorganized retail citing flexibility in work. The first section of employees
cite lack of educational qualification as a reason for inability to migrate.
SKILL REQUIREMENTS One of the strengths of unorganized retail being customer relationship
maintenance, many store owners cite knowledge of local language and
customer service orientation as necessary skills for their employees. In
addition, specialized stores insist that their e mployees possess good selling
skills and product knowledge which is not so much of a requirement in non -
specialized stores.
ATTRITION The results show huge variation with a segment of store owners observing
little or no attrition while another segment of store owners cite high
attrition rate among their employees.
Source: India Retail Report 2013, KPMG analysis
KEY FUNCTIONS IN ORGANIZED RETAIL
Store operations, which are at the core of the
Organized Retail sector, work in tandem with buying &
merchandising and SCM & logistics chain (centralized
departments), and together are the main areas that
provide new employment opportunities. These
functions are supported by other central functions like
HR, Marketing, Finance, IT, Quality Control, Business
Development, E-Tailing, Legal, Secretarial, etc.
Store operations command 70 to 95 percent of
employee requirement in Organized Retail whereas
buying & merchandising as well as SCM & Logistics
command about 5-10 percent each with the balance
having 2-5 percent.
Entry level and junior management level workforce
constitutes the maximum share (97 percent) of the
total workforce at store level operations in India. A
huge skill gap exists at all levels in the Indian retail
sector.
The following are the roles which have more paucity.
1. Entry Level - The front end staff whose involvement
will be directly with the customer.
2. Junior management - As the penetration of
organized retail is on the rise, demand for Advisors and
Specialists with specific knowledge about the various
sub-segments is on the rise.
According to India Retail Report 2013, KPMG analysis,
cities with growth potential for Organized Retail in
India are categorized into metropolitan cities, high
growth cities, and emerging potential cities.
Promotion of a well-planned layout of the store for the
ISSN: 0971-1023 | NMIMS Management ReviewVolume XXXII November 2016
ISSN: 0971-1023 | NMIMS Management ReviewVolume XXXII November 2016
A Study of the Organized Retail Scenario in India andCustomer Impulsiveness in Organized Retail Outlets
A Study of the Organized Retail Scenario in India andCustomer Impulsiveness in Organized Retail Outlets26 27
Changes
cities of India, and therefore street
Contents
mall farmers. Majority of the
farmers (82%) borrow less than
Rs 5 lakhs, and 18% borrow
between Rs 5 – 10 lakhs on a
per annum basis. Most farmers
(65.79%) ar
Table source heading
Table 23: The Results of Mann-Whitney U Test for DOWJONES Index Daily ReturnsDr. Rosy Kalra
Mr. Piyuesh Pandey
References

convenience of the customer by marketers will
maximize sales according to Crawford and Melewar
(2003). Successful retailers should design the layout of
the store in such a way that it consciously or
unconsciously directs the shoppers towards places in
the store where merchandise that has prospects of
generating high sales is on display thereby stimulating
the impulsiveness of the customer; this also results in
improved efficiency and productiveness of shelf space
according to Zentes, Morschett, and Schramm-Klein
(2007).
Retailers choose the best layouts suitable for them
from the different alternatives available to them; this
decision is based on the type of merchandise they sell
(Mc Goldrick, 2002). Supermarkets are designed
aiming to direct customers to places where items that
are sought the most and give margins to the retailer
are put on display - generally at the store's sides and
back walls (Peter and Olson, 1998). To display the most
sought after and highly sold products at the back of the
outlet will compel the shopper to browse the entire
store and make him encounter as many unlisted items
as possible. Tea and sugar, if on display at extreme ends
of the store, will make the customer pass a range of
other category products and encourage purchases on
impulse on the way to these products (Terrazas, 2006).
The layout should be designed in a manner that helps
the customer comprehend and grasp how the
merchandise has been displayed in the store.
Customers have the tendency to create a mental map
of the store layout – where products are displayed,
check-out, time spent, etc. The layout plan should thus
encourage convenience of the shopper as well as
increase his impulsiveness to purchase (Zentes,
Morschett, and Schramm-Klein, 2007). Retailers
generally choose between a grid store layout and free-
form store layout when it comes to designing a store.
B A S I C T Y P E S O F S TO R E L AYO U T ( Z E N T E S ,
MORSCHETT, AND SCHRAMM-KLEIN, 2007)
The grid store layout creates a feel of convenience for
customers who like to pin pointedly locate the
products they need with ease and also browse through
the store very quickly. It also facilitates retail managers
to take steps to avoid a crowded store and in general, it
is not a stimulus creating layout (Dunne and Lusch,
2008).
Service Counters (Meat, Cheese, Bread)
Grid Store Layuot
Fruit
Vegetables
Baby Care
Frozen Food
Soft Drinks
Pasta
Wine
Entrance
Checkouts
Co
nfe
ctio
nar
ySp
ices
Household Goods
Hard Goods
Toiletries
Magazines
Free-Form Store Layout
Entrance
Spo
rt S
ho
es
Golf
Running
Bicycling
Tennis
Accessories
Seasonal(Rollerblades
or Skiing)
Hiking,Climbing,Camping
Ch
ecko
ut
Co
un
ter
In contrast, the free-form layout provides customers a
path to free movement in desired areas and due to the
irregularity in its pattern, it is conducive to a relaxed
shopping experience.
Zentes, Morschett, and Schramm-Klein (2007)
emphasized the importance of allocating shelf space,
which according to them, must be designed on the
basis of quality of the available space. Different areas
in a store are given different preferences by different
shoppers and they browse the store with varying
speed. Some areas in particular will draw greater
customer attention than the rest. Also retail managers
must pay attention to checking-out points as
customers at these points are susceptible to impulse
purchases. On the whole, the layout should be
designed in such a way that it evokes the necessary
emotions in the customer, creates a sense of comfort
when they are inside the store and also helps in
differentiation of the store from the rest.
OBJECTIVES OF THE STUDY
1. Study the various factors affecting impulse buying
behaviour in Indian Organized retail outlets.
2. Study the effect of visual merchandizing on buying
decisions of customers.
3. Assess the impact of various factors of visual
merchandizing.
SCOPE OF THE STUDY
The inferences from the study are based on the
responses given by customers at some Retail Stores
only in specific areas. This study will be helpful in
getting an insight into the effectiveness of visual
merchandising on buying decisions of customers.
CONCEPTUAL MODEL
FACTORS AFFECTING PERCEPTION ABOUT STORE
ISSN: 0971-1023 | NMIMS Management ReviewVolume XXXII November 2016
ISSN: 0971-1023 | NMIMS Management ReviewVolume XXXII November 2016
A Study of the Organized Retail Scenario in India andCustomer Impulsiveness in Organized Retail Outlets
A Study of the Organized Retail Scenario in India andCustomer Impulsiveness in Organized Retail Outlets
VISIBILTY OF MRP DISPLAYS, DISCOUNTS, OFFERS
RECEPTION OF STORE PERSONNEL
QUALITY OF SERVICE
VARIETY IN PAYMENT OPTIONS
SERVICE THROUGH MEMBERSHIP CARDS
BILLING COUNTER VISIBILITY
TROLLEY SERVICE
PRODUCT ASSORTMENT
CHECKOUT TIME
HOME DELIVERY
EASE IN LOCATING PRODUCTS
PROMOTIONAL OFFERS
QUALITY OF PRODUCTS
AMBIENCE
PARKING FACILITY
PLEASANT AND PLEASURABLE EXPERIENCE IN STORE
SIZE OF STORE
AVAILABILITY OF PRODUCTS
NO REPEAT VISITS
DIS-SATISFIED CUSTOMER
FACTORS AFFECTING IMPULSULSIVENESS
PRESENCE OF BRANDED PRODUCTS
DISPLAY OF BRANDED PRODUCTS IN NEW ARRIVALS
ALTRUISTIC NATURE OF CUSTOMER
MATERIALISTIC NATURE OF RESPONDENT
CUSTOMER'S SELF IMAGE CONSCIOUSNESS
PLEASANT MUSIC
FRAGRANCE
MERCHANDISE COLOURS AND ARRANGEMENT
VISUAL DISPLAY/PRESENTATION OF PRODUCT
LAYOUT OF STORE
REPEAT VISITORSATISFIED CUSTOMER
NON-IMPULSIVE CUSTOMER
IMPULSIVE CUSTOMER
IMPROVED BOTTOMLINEOF ORGANIZED RETAIL STORE
28 29
Changes
cities of India, and therefore street
Contents
mall farmers. Majority of the
farmers (82%) borrow less than
Rs 5 lakhs, and 18% borrow
between Rs 5 – 10 lakhs on a
per annum basis. Most farmers
(65.79%) ar
Table source heading
Table 23: The Results of Mann-Whitney U Test for DOWJONES Index Daily ReturnsDr. Rosy Kalra
Mr. Piyuesh Pandey
References

ISSN: 0971-1023 | NMIMS Management ReviewVolume XXXII November 2016
ISSN: 0971-1023 | NMIMS Management ReviewVolume XXXII November 2016
A Study of the Organized Retail Scenario in India andCustomer Impulsiveness in Organized Retail Outlets
A Study of the Organized Retail Scenario in India andCustomer Impulsiveness in Organized Retail Outlets
CUSTOMER SURVEY AND
QUESTIONNAIRE METHOD
The survey method was used for collecting data from
customers at retail outlets. We requested all
respondents to fill in the questionnaire on their own
after explaining the various aspects mentioned in it. It
contained both open and close-ended questions in a
structured format which is very easy to understand at
the first look.
PILOT STUDY
The process of pilot testing involves administration
and testing of the designed questionnaire to a small
group of people from among the sample population
under study. This is done to detect any errors that may
have gone un-not iced whi le des igning the
questionnaire. All aspects of the questionnaire have to
be tested before undertaking the full study. A question
should be rephrased if it did not elicit a proper
SIZE OF SAMPLE
The formula for determining the sample size for a study is N (Sample Size) = Z^2 * α^2 / e^2
From the sample study, we obtained a standard deviation as 0.556053417
The confidence interval Z is 1.96
At 5 percent acceptable error e = 0.05
So N = 1.96 ^ 2 * 0.556053417 ^2 / 0.05 ^ 2
= 475.122023
response. Pilot studies should always involve face-to-
face interaction with respondents even if the mode of
administration in the main study is mail or internet.
The researcher may also get the questionnaire vetted
by experts from academia and industry to get their
opinions.
After making the necessary changes, the researcher
can carry out a pilot study and then undertake the
actual study. The pilot study should look like a small
replica of the original study. He can edit the
questionnaire and undertake further pilot tests. Upon
completion, he can consolidate the pilot test data and
carry out tests on it to find out if it is adequately able to
furnish the necessary information for which the
questionnaire was designed.
In the pilot study, 30 questionnaires were distributed
at Organized Retail outlets in Hyderabad to collect data
for determination of the sample size for the thesis.
From this calculation, we conclude that a sample size
of 476 is the minimum requirement for our study. To be
more precise, a sample size of 600 was taken by us to
remove any uncertainties while doing the survey.
VALIDITY OF CONSTUCTS
The validity process will ensure and check whether the
scale is able to assess the construct which was
intended (Cronbach & Meehl, 1995). Generally, this is
done by experts in that particular domain. The
constructs in the questionnaire were validated by Dr.
Prakash at KLUBS, KL University.
RELIABILITY ANALYSIS
Reliability is the precision level at which an instrument
(scale) will be able to assess a dimension. In case we
administer a scale to a respondent twice, we do not
expect the same response on both occasions. The
more the overlap of responses on both occasions the
higher is its reliability.
Experts have provided standards for reliability levels
but in general, the common acceptability or reliability
level is 0.6 or more.
Item Statistics
Mean Std. Deviation N
Do you agree with "I trust branded products"? 2.07 1.081 30
Does your brand always show up in the new arrivals section?
3.5
1.28 30
Your nature is altruistic
3.67 0.758
30
You are a materialistic person
3.43 1.104
30
You are conscious of your self image
4.1
0.305 30
The music playing in the store affects my purchase intention
3.43
1.073
30
If I
like the fragrance inside the store, my chances of buying become greater
3.93
0.944
30
I spend more time in the store looking around if I
like the ambience,
the
merchandise, colours and arrangement
3.6
1.07
30
Visual display/presentation of products influences my buying decision in the
store
3.8
1.031
30
Generally you follow the displays and layout to find a product 3.87 1.074 30
Reliability Statistics
Cronbach's Alpha Cronbach's Alpha Based on Standardized Items N of Items
0.57 0.61 10
From the test above, we can conclude that the various constructs related to impulse behaviour are valid as the
CRONBACH alpha is greater than 0.6.
Reliability Statistics
Cronbach's Alpha Cronbach's Alpha Based on Standardized Items N of Items
0.665 0.657 18
From the test, we can conclude that the various constructs related to organized retail outlets are valid as the
CRONBACH alpha is greater than 0.6.
30 31
Changes
cities of India, and therefore street
Contents
mall farmers. Majority of the
farmers (82%) borrow less than
Rs 5 lakhs, and 18% borrow
between Rs 5 – 10 lakhs on a
per annum basis. Most farmers
(65.79%) ar
Table source heading
Table 23: The Results of Mann-Whitney U Test for DOWJONES Index Daily ReturnsDr. Rosy Kalra
Mr. Piyuesh Pandey
References

ISSN: 0971-1023 | NMIMS Management ReviewVolume XXXII November 2016
ISSN: 0971-1023 | NMIMS Management ReviewVolume XXXII November 2016
A Study of the Organized Retail Scenario in India andCustomer Impulsiveness in Organized Retail Outlets
Item Statistics
Mean Std. Deviation N
VISIBILITY OF DISPLAY OF MRP, DISCOUNTS, OFFERS 2.33 1.155 30
RECEPTION OF STORE PERSONNEL TOWARDS YOU 2.07 1.112 30
QUALITY OF SERVICE AT ORGANIZED RETAIL OUTLETS 3 1.259 30
VARIETY IN PAYMENT OPTIONS PROVIDED
2.9
1.47
30
SERVICE PROVIDED
THROUGH MEMBERSHIP CARDS
3.67
1.155
30
VISIBILITY OF THE BILLING COUNTER
3
1.39
30
HOW IS THE TROLLEY SERVICE
2.83
1.289
30
HOW GOOD IS THE PRODUCT ASSORTMENT
3.33
1.213
30
IS THE CHECKOUT TIME TAKEN ACCEPTABLE?
2.93
1.437
30
HOW IS THE HOME DELIVERY SERVICE?
2.9
1.269
30
EASE IN LOCATING THE PRODUCTS AT THE STORE
2.9
1.296
30
SATISFIED WITH PROMOTIONAL OFFERS AT THE STORE
2.8
1.297
30
SATISFIED WITH THE QUALITY OF PRODUCTS AVAILABLE AT THE STORE
2.1
1.094
30
HOW IS THE AMBIENCE AT THE STORE?
2.93
1.285
30
IS THE PARKING FACILITY SATISFACTORY?
2.93
1.363
30
IS SHOPPING AT THE STORE A PLEASANT AND PLEASURABLE
EXPERIENCE?
2.73
1.172
30
WHAT DO YOU FEEL ABOUT SIZE OF THE STORE?
2.9
1.296
30
HOW IS THE AVAILABILITY OF PRODUCTS AT THE STORE? 3.17 1.289 30
GENERAL PROFILE OF RESPONDENTS
GENDER Male Female
241 359
AGE
<28 28-45 46-60 >60
65
225
207
103
EDUCATION
DIPLOMA
GRADUATION
PG
249
242
109
PROFESSION
PVT JOB
GOVT JOB
SELF-
EMPLOYED
OTHERS
278
121
102
99
INCOME
<10,000
10,000-
20,000
20,000-
35,000
>35000
52
194
268
86
FAMILY MEMBERS
ONE
TWO
THREE
FOUR
FIVE AND
ABOVE
93 69 232 164 42
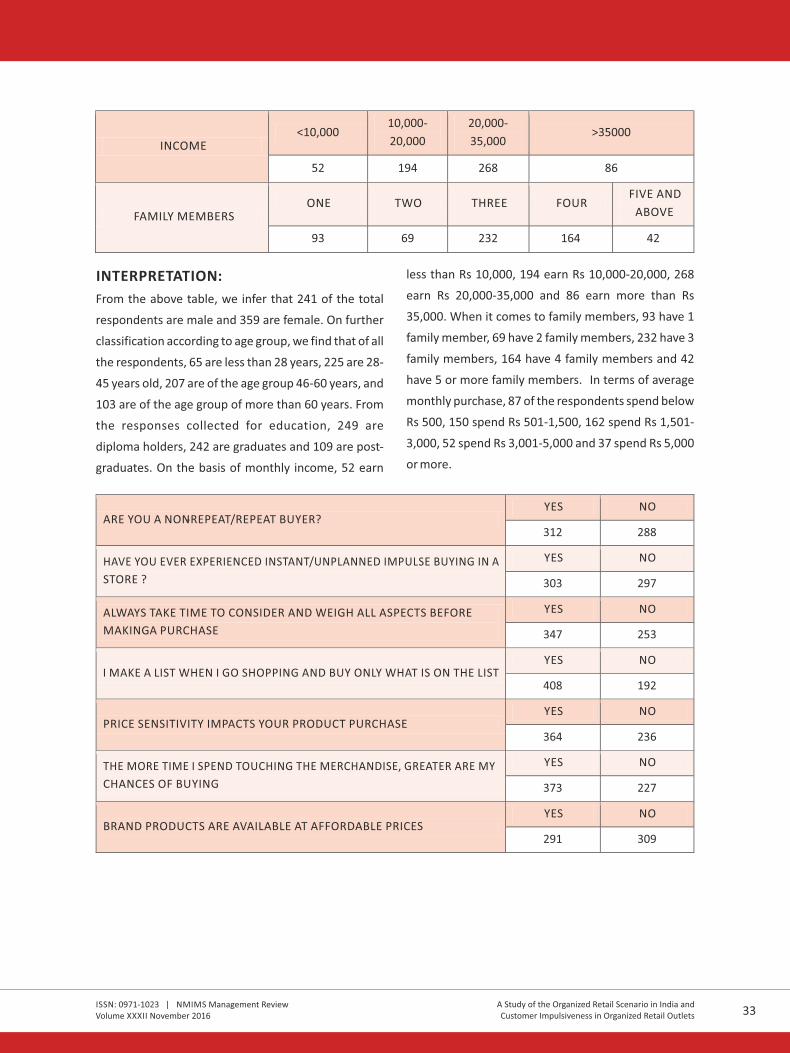
INTERPRETATION:
From the above table, we infer that 241 of the total
respondents are male and 359 are female. On further
classification according to age group, we find that of all
the respondents, 65 are less than 28 years, 225 are 28-
45 years old, 207 are of the age group 46-60 years, and
103 are of the age group of more than 60 years. From
the responses collected for education, 249 are
diploma holders, 242 are graduates and 109 are post-
graduates. On the basis of monthly income, 52 earn
less than Rs 10,000, 194 earn Rs 10,000-20,000, 268
earn Rs 20,000-35,000 and 86 earn more than Rs
35,000. When it comes to family members, 93 have 1
family member, 69 have 2 family members, 232 have 3
family members, 164 have 4 family members and 42
have 5 or more family members. In terms of average
monthly purchase, 87 of the respondents spend below
Rs 500, 150 spend Rs 501-1,500, 162 spend Rs 1,501-
3,000, 52 spend Rs 3,001-5,000 and 37 spend Rs 5,000
or more.
ARE YOU A NON-REPEAT/REPEAT BUYER? YES NO
312 288
HAVE YOU EVER EXPERIENCED INSTANT/UNPLANNED IMPULSE BUYING IN A
STORE ?
YES NO
303
297
ALWAYS TAKE TIME TO CONSIDER AND WEIGH ALL ASPECTS BEFORE
MAKING A PURCHASE
YES
NO
347
253
I MAKE A LIST WHEN I GO SHOPPING AND BUY ONLY WHAT IS ON THE LIST
YES
NO
408
192
PRICE SENSITIVITY IMPACTS YOUR PRODUCT PURCHASE
YES
NO
364
236
THE MORE TIME I SPEND TOUCHING THE MERCHANDISE, GREATER ARE MY
CHANCES OF BUYING
YES
NO
373
227
BRAND PRODUCTS ARE AVAILABLE AT AFFORDABLE PRICESYES
NO
291 309
A Study of the Organized Retail Scenario in India andCustomer Impulsiveness in Organized Retail Outlets32 33
Changes
cities of India, and therefore street
Contents
mall farmers. Majority of the
farmers (82%) borrow less than
Rs 5 lakhs, and 18% borrow
between Rs 5 – 10 lakhs on a
per annum basis. Most farmers
(65.79%) ar
Table source heading
Table 23: The Results of Mann-Whitney U Test for DOWJONES Index Daily ReturnsDr. Rosy Kalra
Mr. Piyuesh Pandey
References
ISSN: 0971-1023 | NMIMS Management ReviewVolume XXXII November 2016
ISSN: 0971-1023 | NMIMS Management ReviewVolume XXXII November 2016
A Study of the Organized Retail Scenario in India andCustomer Impulsiveness in Organized Retail Outlets
Item Statistics
Mean Std. Deviation N
VISIBILITY OF DISPLAY OF MRP, DISCOUNTS, OFFERS 2.33 1.155 30
RECEPTION OF STORE PERSONNEL TOWARDS YOU 2.07 1.112 30
QUALITY OF SERVICE AT ORGANIZED RETAIL OUTLETS 3 1.259 30
VARIETY IN PAYMENT OPTIONS PROVIDED
2.9
1.47
30
SERVICE PROVIDED
THROUGH MEMBERSHIP CARDS
3.67
1.155
30
VISIBILITY OF THE BILLING COUNTER
3
1.39
30
HOW IS THE TROLLEY SERVICE
2.83
1.289
30
HOW GOOD IS THE PRODUCT ASSORTMENT
3.33
1.213
30
IS THE CHECKOUT TIME TAKEN ACCEPTABLE?
2.93
1.437
30
HOW IS THE HOME DELIVERY SERVICE?
2.9
1.269
30
EASE IN LOCATING THE PRODUCTS AT THE STORE
2.9
1.296
30
SATISFIED WITH PROMOTIONAL OFFERS AT THE STORE
2.8
1.297
30
SATISFIED WITH THE QUALITY OF PRODUCTS AVAILABLE AT THE STORE
2.1
1.094
30
HOW IS THE AMBIENCE AT THE STORE?
2.93
1.285
30
IS THE PARKING FACILITY SATISFACTORY?
2.93
1.363
30
IS SHOPPING AT THE STORE A PLEASANT AND PLEASURABLE
EXPERIENCE?
2.73
1.172
30
WHAT DO YOU FEEL ABOUT SIZE OF THE STORE?
2.9
1.296
30
HOW IS THE AVAILABILITY OF PRODUCTS AT THE STORE? 3.17 1.289 30
GENERAL PROFILE OF RESPONDENTS
GENDER Male Female
241 359
AGE
<28 28-45 46-60 >60
65
225
207
103
EDUCATION
DIPLOMA
GRADUATION
PG
249
242
109
PROFESSION
PVT JOB
GOVT JOB
SELF-
EMPLOYED
OTHERS
278
121
102
99
INCOME
<10,000
10,000-
20,000
20,000-
35,000
>35000
52
194
268
86
FAMILY MEMBERS
ONE
TWO
THREE
FOUR
FIVE AND
ABOVE
93 69 232 164 42
INTERPRETATION:
From the above table, we infer that 241 of the total
respondents are male and 359 are female. On further
classification according to age group, we find that of all
the respondents, 65 are less than 28 years, 225 are 28-
45 years old, 207 are of the age group 46-60 years, and
103 are of the age group of more than 60 years. From
the responses collected for education, 249 are
diploma holders, 242 are graduates and 109 are post-
graduates. On the basis of monthly income, 52 earn
less than Rs 10,000, 194 earn Rs 10,000-20,000, 268
earn Rs 20,000-35,000 and 86 earn more than Rs
35,000. When it comes to family members, 93 have 1
family member, 69 have 2 family members, 232 have 3
family members, 164 have 4 family members and 42
have 5 or more family members. In terms of average
monthly purchase, 87 of the respondents spend below
Rs 500, 150 spend Rs 501-1,500, 162 spend Rs 1,501-
3,000, 52 spend Rs 3,001-5,000 and 37 spend Rs 5,000
or more.
ARE YOU A NON-REPEAT/REPEAT BUYER? YES NO
312 288
HAVE YOU EVER EXPERIENCED INSTANT/UNPLANNED IMPULSE BUYING IN A
STORE ?
YES NO
303
297
ALWAYS TAKE TIME TO CONSIDER AND WEIGH ALL ASPECTS BEFORE
MAKING A PURCHASE
YES
NO
347
253
I MAKE A LIST WHEN I GO SHOPPING AND BUY ONLY WHAT IS ON THE LIST
YES
NO
408
192
PRICE SENSITIVITY IMPACTS YOUR PRODUCT PURCHASE
YES
NO
364
236
THE MORE TIME I SPEND TOUCHING THE MERCHANDISE, GREATER ARE MY
CHANCES OF BUYING
YES
NO
373
227
BRAND PRODUCTS ARE AVAILABLE AT AFFORDABLE PRICESYES
NO
291 309
A Study of the Organized Retail Scenario in India andCustomer Impulsiveness in Organized Retail Outlets32 33
Changes
cities of India, and therefore street
Contents
mall farmers. Majority of the
farmers (82%) borrow less than
Rs 5 lakhs, and 18% borrow
between Rs 5 – 10 lakhs on a
per annum basis. Most farmers
(65.79%) ar
Table source heading
Table 23: The Results of Mann-Whitney U Test for DOWJONES Index Daily ReturnsDr. Rosy Kalra
Mr. Piyuesh Pandey
References

ISSN: 0971-1023 | NMIMS Management ReviewVolume XXXII November 2016
ISSN: 0971-1023 | NMIMS Management ReviewVolume XXXII November 2016
A Study of the Organized Retail Scenario in India andCustomer Impulsiveness in Organized Retail Outlets
A Study of the Organized Retail Scenario in India andCustomer Impulsiveness in Organized Retail Outlets
PARAMETERS HIGHLY DISSATISFACTORY
DISSATISFACTORY NEUTRAL SATISFACTORY HIGHLY SATISFACTORY
VISIBILITY OF DISPLAY OF MRP, DISCOUNTS, OFFERS
155 99 253 74 19
RECEPTION OF STORE PERSONNEL TOWARDS YOU
157
236
114
68
25
QUALITY OF SERVICE AT ORGANIZED RETAIL OUTLETS
43
68
188
134
167
VARIETY IN PAYMENT OPTIONS PROVIDED
129
64
81
186
140
SERVICE PROVIDED THROUGH MEMBERSHIP CARDS
13
46
212
124
205
VISIBILITY OF THE BILLING COUNTER
17
70
136
188
189
HOW IS THE TROLLEY SERVICE?
77
88
75
253
107
HOW GOOD IS THE PRODUCT ASSORTMENT?
14
89
191
165
141
IS THE CHECKOUT TIME TAKEN ACCEPTABLE?
98
56
92
197
157
HOW IS THE HOME DELIVERY SERVICE?
19
54
169
111
247
EASE IN LOCATING THE PRODUCTS AT THE STORE
7
59
159
177
198
SATISFIED WITH PROMOTIONAL OFFERS AT STORE
143
132
142
85
98
SATISFIED WITH THE QUALITY OF PRODUCTS AVAILABLE AT THE STORE
48
97
69
185
201
PARAMETERS HIGHLY DISSATISFACTORY
DISSATISFACTORY NEUTRAL SATISFACTORY HIGHLY SATISFACTORY
HOW IS THE AMBIENCE AT THE STORE?
27 59 182 104 228
IS THE PARKING
FACILITY SATISFACTORY?
12
159
192 137
100
IS SHOPPING AT THE
STORE A PLEASANT AND PLEASURABLE EXPERIENCE?
30
72
214 141
143
WHAT DO YOU FEEL ABOUT SIZE OF THE STORE?
7 35 191 115 252
HOW IS THE AVAILABILITY OF PRODUCTS AT THE STORE?
26
55
196
138
185
WHEN YOU ENTER THE STORE....
YOU GO STRAIGHT TO
THE PRODUCTS WHICH YOU
WANT
YOU WALK THROUGH THE
STORE AS IT LEADS YOU
YOU DO NOT FOLLOW ANY
PATTERN. YOU JUST WALK
RANDOMLY AND PICK UP
PRODUCTS
YOU SEEK THE HELP OF A SALESPERSON TO NAVIGATE IN
THE STORE
237
106
163
94
HOW DO YOU GET TO KNOW ABOUT NEW PRODUCT ARRIVALS IN THE STORE?
THROUGH DISPLAY OF
THE PRODUCT
THROUGH ANNOUNCEMENTS
BY ENQUIRING SALESPERSON
YOU WILL SEARCH ON YOUR OWN
166
112
179
143
WHILE SHOPPING, HOW DO YOU GET TO KNOW ABOUT THE OFFERS FOR THE DAY IN THE STORE?
SIGN BOARDS/DROP
DOWNS
PROMO AREAS (MELAS,
CELEBRATIONS)
SALES PEOPLE
PAMPHLETS
ANNOUNCEMENTS IN THE STORE
215
84
134
91
76
WHICH OF THESE IS MOST RELEVANT WITH REGARD TO YOUR SHOPPING?(AGGRESSIVE BUY)
I BOUGHT WHAT I CAME
TO BUY. NOTHING
MORE.
I BOUGHT A LITTLE MORE THAN
WHAT I CAME FOR.
I BOUGHT A LOT MORE THAN
WHAT I CAME FOR.
I BOUGHT EVERYTHING
THAT ATTRACTED
ME.
I DID NOT FIND WHAT I NEEDED. SO I DID NOT BUY
ANYTHING.
117
128
116
146
93
IF YOU HAVE BOUGHT SOME PRODUCTS OTHER THAN WHAT YOU CAME TO BUY, WHICH OF THE FOLLOWING FACTORS MADE YOU BUY MORE?
ATTRACTIVE DISPLAY OF
THE PRODUCT
INFORMATION PROVIDED BY SALESPERSON
WHEN I SEE A GOOD DEAL, I TEND TO BUY MORE THAN THAT I INTENDED TO BUY.
166
116
318
DO YOU GET ATTRACTED BY THE WAY PRODUCTS ARE ARRANGED/DISPLAYED?
ALWAYS MOSTLY SOMETIMES RARELY NEVER
153 124 167 89 67
WHICH FACTOR INFLUENCED YOU MORE TO MAKE YOUR BUYING DECISION?
INFLUENCE OF PRODUCT
ARRANGEMENT
INFLUENCE OF PROMOTIONAL
SIGNAGE
EXCITEMENT IN TRYING A NEW
PRODUCT
INFLUENCE OF
MANNEQUIN DISPLAY
NONE
73 231 95 89 112
34 35
Changes
cities of India, and therefore street
Contents
mall farmers. Majority of the
farmers (82%) borrow less than
Rs 5 lakhs, and 18% borrow
between Rs 5 – 10 lakhs on a
per annum basis. Most farmers
(65.79%) ar
Table source heading
Table 23: The Results of Mann-Whitney U Test for DOWJONES Index Daily ReturnsDr. Rosy Kalra
Mr. Piyuesh Pandey
References

ISSN: 0971-1023 | NMIMS Management ReviewVolume XXXII November 2016
ISSN: 0971-1023 | NMIMS Management ReviewVolume XXXII November 2016
A Study of the Organized Retail Scenario in India andCustomer Impulsiveness in Organized Retail Outlets
A Study of the Organized Retail Scenario in India andCustomer Impulsiveness in Organized Retail Outlets
AT WHICH PLACE DO YOU TEND TO DO MORE IMPULSIVE BUYING IN THE STORE?
PROMO AREA (MELAS,
CELEBRATIONS)
NEARBY CASH COUNTER WHILE WAITING FOR PAYMENT
NONE
202
162
236
WHICH OF THE FOLLOWING FACTORS INFLUENCE YOUR BUYING DECISIONS IN A STORE?
LOCATING PRODUCTS THROUGH
SIGNS, GRAPHICS, ETC.
LIGHTING
MUSIC
FRAGRANCE
COLOURS
137
116
191
112
44
WHAT DO YOU FEEL ABOUT THE PRODUCT ARRANGEMENT IN THESTORE?
EXCELLENT
VERY GOOD
GOOD
AVERAGE
POOR
188 165 102 94 51
PARAMETERS STRONGLY
DISAGREE DISAGREE NUETRAL AGREE
STRONGLY
AGREE
DO YOU AGREE WITH "I TRUST BRANDED
PRODUCTS" ?
234
174 78
78
36
DOES YOUR BRAND ALWAYS SHOW UP IN THE
NEW ARRIVALS SECTION
60
60
90
240
150
YOUR NATURE IS ALTRUISTIC
0
36
144
282
138
YOU ARE MATERIALISTIC PERSON
30
72
132
306
60
YOU ARE CONSCIOUS OF YOUR SELF IMAGE
0
18
24
414
144
THE MUSIC PLAYING IN THE STORE AFFECTS MY
PURCHASE INTENTION
6
30
156
264
144
IF I LIKE THE FRAGRANCE INSIDE THE STORE MY
CHANCES OF BUYING BECOME GREATER
12
24
102
264
198
I SPEND MORE TIME IN THE STORE LOOKING
AROUND, IF I LIKE THE AMBIENCE AND THE
MERCHANDISE COLORS AND ARRANGEMENT
6
30
48
306
210
VISUAL DISPLAY/PRESENTATION OF PRODUCTS
INFLUENCES MY BUYING DECISION IN THE
STORE
6
24
108
294
168
GENERALLY YOU FOLLOW THE DISPLAYS AND
LAYOUT TO FIND A PRODUCT12 6 96 312 174
PARAMETERS HIGHLY
DISSATISFACTORY DISSATISFACTORY NUETRAL SATISFACTORY
HIGHLY
SATISFACTORY
VISIBILITY OF DISPLAY OF
MRP, DISCOUNTS,OFFERS
155
99
253
74
19
RECEPTION OF STORE
PERSONNEL TOWARDS YOU?
157
236
114
68
25
QUALITY OF SERVICE AT
ORGANIZED RETAIL
OUTLETS?
43
68
188
134
167
VARIETY IN PAYMENT
OPTIONS PROVIDED?
129
64
81
186
140
SERVICE PROVIDED
THROUGH MEMBERSHIP
CARDS?
13
46
212
124
205
VISIBILITY OF THE BILLING
COUNTER?
17
70
136
188
189
HOW IS THE TROLLEY
SERVICE?
77
88
75
253
107
HOW WELL IS THE PRODUCT
ASSORTMENT?
14
89
191
165
141
IS THE CHECKOUT TIME
TAKEN EVEN?
98
56
92
197
157
HOW IS THE HOME DELIVERY
SERVICE?
19
54
169
111
247
EASINESS IN LOCATING THE
PRODUCTS AT THE STORE?
7
59
159
177
198
SATISFIED WITH
PROMOTIONAL OFFERS AT
STORE?
143
132
142
85
98
SATISFIED WITH THE QUALITY
OF PRODUCTS AVAILABLE AT
THE STORE?
48
97
69
185
201
HOW IS
THE AMBIENCE AT
THE STORE?
27
59
182
104
228
IS THE PARKING FACILITY
SATISFACTORY?
12
159
192
137
100
IS SHOPPING AT THE STORE
A PLEASANT AND
PLEASURABLE EXPERIENCE?
30
72
214
141 143
WHAT DO FEEL ABOUT SIZE
OF THE STORE?7 35 191 115 252
HOW IS THE AVAILABILITY OF
PRODUCTS AT THE STORE?
26
55
196
138 185
36 37
Changes
cities of India, and therefore street
Contents
mall farmers. Majority of the
farmers (82%) borrow less than
Rs 5 lakhs, and 18% borrow
between Rs 5 – 10 lakhs on a
per annum basis. Most farmers
(65.79%) ar
Table source heading
Table 23: The Results of Mann-Whitney U Test for DOWJONES Index Daily ReturnsDr. Rosy Kalra
Mr. Piyuesh Pandey
References

ISSN: 0971-1023 | NMIMS Management ReviewVolume XXXII November 2016
ISSN: 0971-1023 | NMIMS Management ReviewVolume XXXII November 2016
A Study of the Organized Retail Scenario in India andCustomer Impulsiveness in Organized Retail Outlets
A Study of the Organized Retail Scenario in India andCustomer Impulsiveness in Organized Retail Outlets
REGRESSION ANALYSIS
Variables Entered/Removed
Model Variables Entered Variables Removed Method
1
FAMILY MEMBERS, INCOME
.
Enter
a. All requested variables entered.
b. Dependent Variable: AVG MONTHLY PURCHASE
COEFFICIENTS
Coefficients
Model Unstandardized Coefficients
Standardized Coefficients
t Sig.
B Std. Error Beta
1 (Constant) 2.034 0.226 9.005 0
INCOME 0.153 0.059 0.106 2.594 0.01
FAMILY MEMBERS 0.206 0.043 0.196 4.785 0
a. Dependent Variable: AVG MONTHLY PURCHASE y=a+bx +cx1 2
y=2.0324+0.153x +0.206x1 2
The above Estimated Regression equation indicates that average monthly purchasing power is positively related
with income level and number of family members as it is evident that the positive coefficients indicate the same
(0.206 and 0.153). The results indicate that if income levels go up by one unit, the purchasing power will increase
by 0.153 units while keeping the number of family members as constant. Similarly, if the number of family
members goes up by one unit, monthly purchasing power will go up by 0.206 units while keeping income levels as
constant. The above table also indicates that both income and number of family members significantly influence
the purchasing power of the customer as both p values are less than 0.05.
DISCRIMINANT ANALYSIS
Group Statistics
ARE YOU AN NON-REPEAT/REPEAT BUYER Mean Std.
Deviation Valid N (listwise)
Unweighted Weighted
NON-
REPEAT STORE
CUSTOMER
SATISFIED WITH THE QUALITY OF PRODUCTS AVAILABLE AT THE STORE
3.8541667 1.2152845 288 288
SATISFIED WITH PROMOTIONAL OFFERS AT STORE
2.9166667
1.2959331
288
288
IS SHOPPING AT THE STORE A PLEASANT AND PLEASURABLE EXPERIENCE
3.6076389 1.1607147
288
288
HOW IS THE AMBIENCE AT THE STORE
3.6319444 1.2367572
288
288
WHAT DO FEEL ABOUT SIZE OF THE STORE
4.0173611 0.9858108
288
288
HOW IS THE AVAILABILITY OF PRODUCTS AT THE STORE
3.7395833 1.1160357
288
288
EASINESS IN LOCATING THE PRODUCTS AT THE STORE
3.7847222 1.0503903
288
288
VISIBILITY OF DISPLAY OF MRP, DISCOUNTS,OFFERS
2.4826389
1.091483
288
288
RECEPTION OF STORE PERSONNEL TOWARDS YOU?
2.3958333
1.0962003
288
288
QUALITY OF SERVICE AT ORGANIZED RETAIL OUTLETS
3.5798611
1.1509172
288
288
HOW WELL IS THE PRODUCT ASSORTMENT
3.5034722
1.0526167
288
288
IS THE CHECKOUT TIME TAKEN EVEN
3.3715278
1.4231125
288
288
SERVICE PROVIDED THROUGH MEMBERSHIP CARDS
3.7326389
1.0499929
288
288
VISIBILITY OF THE BILLING COUNTER
3.7395833
1.1222624
288
288
VARIETY IN PAYMENT OPTIONS PROVIDED
3.2048611
1.4873604
288
288
HOW IS THE TROLLEY SERVICE
3.3958333
1.3078096
288
288
IS THE PARKING FACILITY SATISFACTORY
3.2465278
1.0616806
288
288
HOW IS THE HOME DELIVERY SERVICE 3.8611111 1.1330395 288 288
38 39
Changes
cities of India, and therefore street
Contents
mall farmers. Majority of the
farmers (82%) borrow less than
Rs 5 lakhs, and 18% borrow
between Rs 5 – 10 lakhs on a
per annum basis. Most farmers
(65.79%) ar
Table source heading
Table 23: The Results of Mann-Whitney U Test for DOWJONES Index Daily ReturnsDr. Rosy Kalra
Mr. Piyuesh Pandey
References

ISSN: 0971-1023 | NMIMS Management ReviewVolume XXXII November 2016
ISSN: 0971-1023 | NMIMS Management ReviewVolume XXXII November 2016
A Study of the Organized Retail Scenario in India andCustomer Impulsiveness in Organized Retail Outlets
A Study of the Organized Retail Scenario in India andCustomer Impulsiveness in Organized Retail Outlets
REPEAT STORE
CUSTOMER
SATISFIED WITH THE QUALITY OF PRODUCTS AVAILABLE AT THE STORE
3.474359 1.3583076 312 312
SATISFIED WITH PROMOTIONAL OFFERS AT STORE
2.6378205 1.4524331 312 312
IS SHOPPING AT THE STORE A PLEASANT AND PLEASURABLE EXPERIENCE
3.3846154 1.0845986 312 312
HOW IS THE AMBIENCE AT THE STORE 3.849359 1.1396393 312 312
WHAT DO FEEL ABOUT SIZE OF THE STORE
3.8878205
1.0804812
312
312
HOW IS THE AVAILABILITY OF PRODUCTS AT THE STORE
3.6025641
1.1463881
312
312
EASINESS IN LOCATING THE PRODUCTS AT THE STORE
3.8782051
1.0165382
312
312
VISIBILITY OF DISPLAY OF MRP, DISCOUNTS,OFFERS
2.525641 1.1050816
312
312
RECEPTION OF STORE PERSONNEL TOWARDS YOU?
2.1730769
1.0887526
312
312
QUALITY OF SERVICE AT ORGANIZED RETAIL OUTLETS
3.4711538
1.2625453
312
312
HOW WELL IS THE PRODUCT ASSORTMENT
3.5929487
1.0955985
312
312
IS THE CHECKOUT TIME TAKEN EVEN
3.4871795
1.3632153
312
312
SERVICE PROVIDED THROUGH MEMBERSHIP CARDS
3.8044872
1.0893724
312
312
VISIBILITY OF THE BILLING COUNTER
3.7980769
1.0822729
312
312
VARIETY IN PAYMENT OPTIONS PROVIDED
3.2724359
1.4521776
312
312
HOW IS THE TROLLEY SERVICE
3.3557692
1.2698705
312
312
IS THE PARKING FACILITY SATISFACTORY
3.2660256
1.1067171
312
312
HOW IS THE HOME DELIVERY SERVICE 3.849359 1.1647556 312 312
As the two groups, namely 'Repeat Store Customer'
and 'Non-Repeat Store Customer' are to be compared
on the basis of 18 characteristics, namely - satisfaction
with the quality of products available at the store,
satisfied with promotional offers at the store, a
pleasant and pleasurable shopping experience at the
store, ambience at the store, size of the store,
availability of products at the store, ease in locating the
products at the store, visibility of display of MRP,
discounts, offers at the store, reception of store
personnel, quality of service at organized retail outlets,
product assortment, checkout time taken, service
provided through membership cards, visibility of the
billing counter, variety in payment options provided,
trolley service, satisfactory parking facility, and home
delivery service, it will be useful in computing the
mean values for getting an in-depth idea about the
differences in their mean scores. The mean scores
along with the standard deviation of the 18
characteristics of the perception of repeat/non-repeat
customers are presented in the table. It can be
observed that mean scores of satisfactory attributes
for shopping at the store - a pleasant and pleasurable
experience, ambience at the store, ease in locating the
products at the store, visibility of display of MRP,
discounts, offers at the store, product assortment,
checkout time taken, service provided through
membership cards, visibility of the billing counter,
variety in payment options provided, and parking
facility - are higher in case of repeat store customers
than in case of non-repeat store customers and thus,
we expect these predictor variables to be useful to
discriminate between prospective repeat store
customers and non-repeat store customers. When it
comes to variability, the standard deviation of almost
all variables is high.
Tests of Equality of Group Means
Wilks'
Lambda
F df1 df2 Sig.
SATISFIED WITH THE QUALITY OF PRODUCTS
AVAILABLE AT THE STORE
0.978805036 12.949043 1 598 0.0003466
SATISFIED WITH PROMOTIONAL OFFERS AT
STORE
0.989871767 6.1186546 1 598 0.0136529
IS SHOPPING AT THE STORE A PLEASANT AND
PLEASURABLE EXPERIENCE
0.990198167 5.9195186 1 598 0.0152661
HOW IS THE AMBIENCE AT THE STORE 0.991671598 5.0222116 1 598 0.0253904
WHAT DO FEEL ABOUT SIZE OF THE STORE
0.996100717
2.3408988
1
598
0.1265456
HOW IS THE AVAILABILITY OF PRODUCTS AT THE
STORE
0.99634377
2.1944488
1
598
0.1390355
EASINESS IN LOCATING THE PRODUCTS AT THE
STORE
0.997952929
1.2266595
1
598
0.268503
VISIBILITY
OF DISPLAY OF MRP, DISCOUNTS,
OFFERS
0.999616427
0.2294645
1
598
0.6320963
RECEPTION OF STORE PERSONNEL TOWARDS
YOU?
0.989692696
6.2279612
1
598
0.0128432
QUALITY OF SERVICE AT ORGANIZED RETAIL
OUTLETS
0.997983584
1.2082529
1
598
0.2721207
HOW WELL IS THE PRODUCT ASSORTMENT
0.998268614
1.0371648
1
598
0.3088936
IS THE CHECKOUT TIME TAKEN EVEN
0.998274982
1.0333431
1
598
0.3097859
SERVICE PROVIDED THROUGH MEMBERSHIP
CARDS
0.998873477
0.6744204
1
598
0.4118419
VISIBILITY OF THE BILLING COUNTER
0.999294462
0.4222095
1
598
0.5160861
VARIETY IN PAYMENT OPTIONS PROVIDED
0.99947047
0.316827
1
598
0.5737317
HOW IS THE TROLLEY SERVICE
0.999757829
0.1448531
1
598
0.7036384
IS THE PARKING FACILITY SATISFACTORY
0.999919183
0.0483328
1
598
0.8260652
HOW IS THEHOME DELIVERY SERVICE 0.999973831 0.0156496 1 598 0.9004877
40 41
Changes
cities of India, and therefore street
Contents
mall farmers. Majority of the
farmers (82%) borrow less than
Rs 5 lakhs, and 18% borrow
between Rs 5 – 10 lakhs on a
per annum basis. Most farmers
(65.79%) ar
Table source heading
Table 23: The Results of Mann-Whitney U Test for DOWJONES Index Daily ReturnsDr. Rosy Kalra
Mr. Piyuesh Pandey
References

ISSN: 0971-1023 | NMIMS Management ReviewVolume XXXII November 2016
ISSN: 0971-1023 | NMIMS Management ReviewVolume XXXII November 2016
A Study of the Organized Retail Scenario in India andCustomer Impulsiveness in Organized Retail Outlets
A Study of the Organized Retail Scenario in India andCustomer Impulsiveness in Organized Retail Outlets
Tests for differences in group means
To know which characteristics result in a significant
difference between means of the two groups, a one-
way Anova on them was tested for each of the
characteristics where each of the predictor variables
(perception of the customers) is taken as a dependent
variable and the repeat store customers/ non-repeat
store customers group as an independent variable.
From the table above, a significant difference in the
means exists for the variables 'quality of products
available at the store', 'satisfied with promotional
offers at the store', 'shopping experience at the store a
pleasant and pleasurable experience', 'ambience at
the store', and 'reception of store personnel' as all the
p-values in these cases is less than 0.05, which is the
assumed level of significance and it appears that there
is a significant difference in the means of the remaining
variables where p-value is more than 0.05.
Canonical Discriminant Function Coefficients
Function 1
SATISFIED WITH THE QUALITY OF PRODUCTS AVAILABLE AT THE STORE 0.398770727
SATISFIED WITH PROMOTIONAL OFFERS AT STORE 0.217419294
IS SHOPPING AT THE STORE A PLEASANT AND PLEASURABLE EXPERIENCE 0.461181211
HOW IS THE AMBIENCE AT THE STORE -0.260840592
WHAT DO FEEL ABOUT SIZE OF THE STORE 0.32420708
HOW IS THE AVAILABILITY OF PRODUCTS AT THE STORE -0.092408469
EASINESS IN LOCATING THE PRODUCTS AT THE STORE -0.134131497
VISIBILITY OF DISPLAY OF MRP, DISCOUNTS,OFFERS -0.193165783
RECEPTION OF STORE PERSONNEL TOWARDS YOU?
0.50923959
QUALITY OF SERVICE AT ORGANIZED RETAIL OUTLETS
0.016169557
HOW WELL IS THE PRODUCT ASSORTMENT
-0.402013872
IS THE CHECKOUT TIME TAKEN EVEN
-0.008513071
SERVICE PROVIDED THROUGH MEMBERSHIP CARDS
0.037143431
VISIBILITY OF THE BILLING COUNTER
-0.171192398
VARIETY IN PAYMENT OPTIONS PROVIDED
-0.031769059
HOW IS THE TROLLEY SERVICE
-0.038986144
IS THE PARKING FACILITY SATISFACTORY
0.21562303
HOW IS THE HOME DELIVERY SERVICE
0.05997981
(Constant)
-2.593043994
Unstandardized coefficients
Unstandardized Discriminant Function
The basic principle involved in estimation of
discriminant function is that the variance within the
group should be at maximum. The ratio of 'between
groups' variance to 'within groups' variance is
illustrated by Eigen values. Eigen values on the higher
side are desired. The results in the table can be written
in the form of a discriminant function.
Y= 2.59+ 0.40X +0.22 X +0.46 X -0.26 X +0.32 X -0.09 1 2 3 4 5
X -0.13 X -0.19 X +0.51 X +0.02 X -0.40 X -0.01 X 6 7 8 9 10 11 12
+0.04 X -0.17 -0.03 -0.04 +0.22 X +0.06 X .13 X14 X15 X16 17 18
The Eigen value for the above estimated discriminant
function is 0.084 as shown in the table with 100
percent of variance explained. The last column in the
same table indicates the canonical correlation, which
is the simple correlation coefficient between the
discriminant score and their corresponding group
membership (repeat store customers / non-repeat
store customers group).
Eigenvalues
Function Eigen value % of Variance Cumulative % Canonical Correlation
1 .084a 100 100 0.278042414
a. First 1 canonical discriminant functions were used in the analysis.
Classification of cases using the DISCRIMINANT FUNCTION
Functions at Group Centroids
ARE YOU AN NON-REPEAT/REPEAT BUYER Function
1
NON-REPEAT STORE CUSTOMER 0.300772825
REPEAT STORE CUSTOMER -0.277636454
Unstandardized canonical discriminant functions evaluated at group means
We can compute the mean discriminant scores of
repeat store customers/ non-repeat store customers
groups separately. This is known as group centroids. In
our case, it is 0.30 for non-repeat store customers and -
0.28 for repeat store customers. The value of the
function at group centroids can be used to design
decision rule for classifying a customer into the repeat
store customers/ non-repeat store customers
categories.
Structural Coefficients
One way to find the relative contribution of the
predicting variables while discriminating between
repeat store customers/ non-repeat store customers
groups is by comparing the structural coefficients of
those variables. The structural coefficients can be
obtained by computing the correlation between
discriminant score and each of the independent
variables, and they are called discriminant loadings.
The structure matrix is presented.
42 43
Changes
cities of India, and therefore street
Contents
mall farmers. Majority of the
farmers (82%) borrow less than
Rs 5 lakhs, and 18% borrow
between Rs 5 – 10 lakhs on a
per annum basis. Most farmers
(65.79%) ar
Table source heading
Table 23: The Results of Mann-Whitney U Test for DOWJONES Index Daily ReturnsDr. Rosy Kalra
Mr. Piyuesh Pandey
References

ISSN: 0971-1023 | NMIMS Management ReviewVolume XXXII November 2016
ISSN: 0971-1023 | NMIMS Management ReviewVolume XXXII November 2016
A Study of the Organized Retail Scenario in India andCustomer Impulsiveness in Organized Retail Outlets
A Study of the Organized Retail Scenario in India andCustomer Impulsiveness in Organized Retail Outlets
Structure Matrix
Function
1
SATISFIED WITH THE QUALITY OF PRODUCTS AVAILABLE AT THE STORE 0.5083767
RECEPTION OF STORE PERSONNEL TOWARDS YOU? 0.3525655
SATISFIED WITH PROMOTIONAL OFFERS AT STORE 0.3494579
IS SHOPPING AT THE STORE A PLEASANT AND PLEASURABLE EXPERIENCE 0.3437241
HOW IS THE AMBIENCE AT THE STORE -0.3166025
WHAT DO FEEL ABOUT SIZE OF THE STORE 0.2161514
HOW IS THE AVAILABILITY OF PRODUCTS AT THE STORE 0.2092809
EASINESS IN LOCATING THE PRODUCTS AT THE STORE -0.1564692
QUALITY OF SERVICE AT ORGANIZED RETAIL OUTLETS 0.1552908
HOW WELL IS THE PRODUCT ASSORTMENT -0.1438768
IS THE CHECKOUT TIME TAKEN EVEN -0.1436115
SERVICE PROVIDED THROUGH MEMBERSHIP CARDS -0.1160198
VISIBILITY OF THE BILLING COUNTER -0.0917975
VARIETY IN PAYMENT OPTIONS PROVIDED -0.0795203
VISIBILITY OF DISPLAY OF MRP, DISCOUNTS,OFFERS -0.0676744
HOW IS THE TROLLEY SERVICE 0.0537689
IS THE PARKING FACILITY SATISFACTORY -0.031059
HOW IS THE HOME DELIVERY SERVICE
0.0176733
Pooled within-groups correlations between discriminating variables and standardized c anonical discriminant functions.
Variables ordered by absolute size of correlation within function.
The correlation coefficient between discriminant
score and variable quality of products available at the
store is 0.51 (highest) while the rest carry lower scores.
The variables that are at higher position have greater
weight while discriminating between repeat store
customers/ non-repeat store customers groups.
FACTOR ANALYSIS
ESTABLISHING THE STRENGTH OF THE FACTOR
ANALYSIS SOLUTION
KMO and Bartlett's Test of Sphericity are used for
establishing the strength of factor analysis solution.
The results are shown in the table.
KMO and Bartlett's Test
Kaiser-Meyer-Olkin Measure of Sampling Adequacy. 0.662906937
Bartlett's Test of Sphericity Approx. Chi-Square 2108.727873
df 45
Sig. 0
The value of KMO statistics is more than 0.5 which
indicates that factor analysis can be used for the given
set of data. Furthermore, Bartlett's Test of Sphericity
testing for significance of correlation matrix of
variables 'music playing in the store', 'fragrance inside
the store', 'ambience and the merchandise colours and
arrangement', 'visual display/presentation of
products', 'displays and layout', 'altruistic nature',
'materialism', 'consciousness of your self-image,
'trusting branded products', 'brand showing up in the
new arrivals section' indicates that the correlation
matrix is significant as indicated by the p value
corresponding to the chi-square stated is <0.05. This
justifies the use of Factor Analysis for the problem.
Total Variance Explained
Component Initial
Eigenvalues
Extraction Sums of Squared
Loadings Rotation Sums of Squared
Loadings
Total
% of Variance
Cumulative % Total
% of
Variance Cumulative
% Total
% of
Variance Cumulative
%
1 3.08632
30.86324
30.86324
3.08632
30.86324
30.86324
2.85972
28.59715
28.59715
2 2.06043 20.60434 51.46758 2.06043 20.60434 51.46758 1.92372 19.23718 47.83433
3 1.24349 12.43491 63.90249 1.24349 12.43491 63.90249 1.60682 16.06816 63.90249
4 0.88608 8.86085 72.76334
5 0.70369 7.03691 79.80025
6 0.56470 5.64699 85.44724
7 0.55549
5.55487
91.00211
8 0.48419
4.84189
95.84400
9 0.27587
2.75874
98.60274
10
0.13973
1.39726
100.00000
Extraction Method: Principal Component Analysis.
The above table shows us that the extraction of actual
factors was successful. Looking at the “Rotation Sums
of Squared Loadings,” column, we understand that the
10 factors meet the cut-off criterion. Here we see the
presence of 3 factors whose Eigen value is more than 1.
The column named “Percentage of variance” shows
the extent of total variation which can be explained
and provides an account by each one of the
component factors. Here, the first factor accounts for
28.6% of the variability of the 10 factors and so on.
44 45
Changes
cities of India, and therefore street
Contents
mall farmers. Majority of the
farmers (82%) borrow less than
Rs 5 lakhs, and 18% borrow
between Rs 5 – 10 lakhs on a
per annum basis. Most farmers
(65.79%) ar
Table source heading
Table 23: The Results of Mann-Whitney U Test for DOWJONES Index Daily ReturnsDr. Rosy Kalra
Mr. Piyuesh Pandey
References

ISSN: 0971-1023 | NMIMS Management ReviewVolume XXXII November 2016
ISSN: 0971-1023 | NMIMS Management ReviewVolume XXXII November 2016
A Study of the Organized Retail Scenario in India andCustomer Impulsiveness in Organized Retail Outlets
A Study of the Organized Retail Scenario in India andCustomer Impulsiveness in Organized Retail Outlets
Communalities
Initial Extraction
THE MUSIC PLAYING IN THE STORE AFFECTS MY PURCHASE INTENTION 1 0.612853821
IF I LIKE THE FRAGRANCE INSIDE THE STORE MY CHANCES OF BUYING BECOME
GREATER
1 0.759636789
I SPEND MORE TIME IN THE STORE LOOKING AROUND, IF I LIKE THE AMBIENCE
AND THE MERCHANDISE COLORS AND ARRANGEMENT
1 0.567332427
VISUAL DISPLAY/PRESENTATION OF PRODUCTS INFLUENCES MY BUYING DECISION
IN THE STORE
1 0.575269497
GENERALLY YOU FOLLOW THE DISPLAYS AND LAYOUT TO FIND A PRODUCT
1
0.236618298
YOUR NATURE IS ALTRUISTIC
1 0.644252594
YOU ARE MATERIALISTIC PERSON
1
0.725485276
YOU ARE CONSCIOUS OF YOUR SELF IMAGE
1
0.513913395
DO YOU AGREE WITH "I TRUST BRANDED PRODUCTS" ?
1
0.887152084
DOES YOUR BRAND ALWAYS SHOW UP IN THE NEW ARRIVALS SECTION
1
0.867734848
Extraction Method: Principal Component Analysis.
From the SCREE plot, we observe that the slope of the curve is levelling out after three factors.
Rotated Component Matrix
Component
1
2
3
THE MUSIC PLAYING IN THE STORE AFFECTS MY PURCHASE INTENTION
0.7824864
0.0108904
-0.021218
IF I LIKE THE FRAGRANCE INSIDE THE STORE MY CHANCES OF BUYING BECOME GREATER
0.812817 0.2768512 0.1493943
I SPEND MORE TIME IN THE STORE LOOKING AROUND, IF I LIKE THE AMBIENCE AND THE MERCHANDISE COLORS AND ARRANGEMENT
0.7506396 0.057987 0.0225867
VISUAL DISPLAY/PRESENTATION OF PRODUCTS INFLUENCES MY BUYING DECISION IN THE STORE
0.7580019 -0.0171033 0.020252
GENERALLY YOU FOLLOW THE DISPLAYS AND LAYOUT TO FIND A PRODUCT
0.459713 0.1561415 -0.030035
YOUR NATURE IS ALTRUISTIC 0.0800027 -0.3041526 0.7384737
YOU ARE MATERIALISTIC PERSON -0.3124225 0.1757152 0.7726588
YOU ARE CONSCIOUS OF YOUR SELF IMAGE 0.2757216 -0.1857715 0.635122
DO YOU AGREE WITH "I TRUST BRANDED PRODUCTS”? -0.2071435 -0.905688 0.1548322
DOES YOUR BRAND ALWAYS SHOW UP IN THE NEW ARRIVALS SECTION
0.1202367 0.9169248 -0.1119237
Extraction Method: Principal Component Analysis.
Rotation Method: Varimax with Kaiser Normalization.
a. Rotation converged in 5 iterations.
The Rotated Component Matrix table shows the factor
loadings of each variable. On studying each row and
highlighting every factor being loaded by various
variables, it was concluded that the factors represent:
In the first row, the first 5 variables loaded strongly on
Factor 1, which we called 'visual merchandising'.
In the second row, the last 2 variables loaded strongly
on Factor 2, which we called 'brand behaviour'.
In the third row, the last 3 variables loaded strongly on
Factor 3, which we called 'attitude of the customer'.
FINDINGS
From the analysis of the results and based on the
literature review done keeping the objectives of the
study in the mind, the following findings can be
ascertained:
1. 303 of the 600 respondents experienced
instant/unplanned impulse buying in the store.
Price sensitivity impacted the product purchase of
364 out of the 600 people. 462 of the 600
respondents said that visual display/presentation
of products in the store had an influence on their
buying decision. 373 respondents said that more
time they spent touching the merchandise, greater
their chances of buying. 244 customers were
influenced in their decision to buy more than what
they intended to buy, the main reasons being
attractive product display and good deal/offer with
46 47
Changes
cities of India, and therefore street
Contents
mall farmers. Majority of the
farmers (82%) borrow less than
Rs 5 lakhs, and 18% borrow
between Rs 5 – 10 lakhs on a
per annum basis. Most farmers
(65.79%) ar
Table source heading
Table 23: The Results of Mann-Whitney U Test for DOWJONES Index Daily ReturnsDr. Rosy Kalra
Mr. Piyuesh Pandey
References

ISSN: 0971-1023 | NMIMS Management ReviewVolume XXXII November 2016
ISSN: 0971-1023 | NMIMS Management ReviewVolume XXXII November 2016
A Study of the Organized Retail Scenario in India andCustomer Impulsiveness in Organized Retail Outlets
A Study of the Organized Retail Scenario in India andCustomer Impulsiveness in Organized Retail Outlets
the product. 166 respondents got to know about a
new product arrival through the display of the
product, 112 through announcements, 179 by
enquiring from a salesperson and 143 by searching
on their own. Of the 600 respondents, 166
preferred to follow the displays and layout to find a
product.
2. When customers entered the store, 237 went
straight to the products they wanted, 106 walked
through the store as it led them, 163 did not follow
any pattern, they just walked randomly and picked
up products, 94 sought the help of a salesperson to
navigate in the store. While looking for different
offers in the store, 215 used signboards/drop
downs, 84 got to know through promo areas
(Melas, Celebrations), 134 through sales people,
9 1 t h ro u g h p a m p h l e t s a n d 7 6 t h ro u g h
announcements.
3. Out of the factors that influenced customers to
make more instant/unplanned buying decisions,
73 stated that they were influenced by the product
arrangement, 231 were influenced by promotional
signage, 95 were influenced with excitement to try
a new product, and 89 were influenced by the
display mannequin. This brought the conclusion
that the visual merchandising of the stores was
good. 162 respondents stated that the area near
the cash counter was a place where they tended to
make impulse purchases while 202 respondents
made impulse purchases in promo areas (Melas,
Celebrations). In terms of factors that influenced
buyers' purchase decisions, 137 mentioned signs,
graphics, etc., 116 attributed their buying
decisions to lighting, 191 to music, 112 to
fragrance, and 44 to colours.
4. Customers take a subconscious cognizance of the
way goods are presented at the store. Impulse
buying mainly depends on the personality traits of
the shopper. Retail displays are very significant as
the visual merchandizing makes or breaks the first
impression of the potential customers. The store
should be designed in such a way that the
customer is able to easily locate his desired
department and category. The colour of the
merchandise and various divisions of the store
definitely have a positive impact on the propensity
of consumers' purchases. Gen Y customers are as
active as the present and next gen customers when
it comes to buying at the marketplaces, and
frequent the stores mainly for groceries. Young
customers tend to be more impulsive than older
ones and they have a preference towards new
experiences and the urge to make spontaneous
purchases, whereas old shoppers may be better in
their ability to control urges for impulsive
purchases.
5. Customers who make impulse purchases have
higher levels of enthusiasm, delight, joy and
amusement. An impulsive purchase arises due to
factors like stimuli, joy of shopping, impulsive
nature and lack of self-control on part of the
customer. Customers desiring high levels of self-
esteem have a high tendency to purchase products
impulsively as they derive a sense of pleasure from
the process. A customer's attitude to enjoy
shopping will have an effect on his impulsiveness
and ability to stick to the buying list. Customers use
a shopping list for controlling their expenditure at
the store as well as making sure they are not buying
items that are not in their plan which tends to make
them exceed their budgeted spending. The store
environment which includes layout, size of the
store, ambience, cleanliness as well as format and
marketing along with advertisements, has an
impact on Impulse purchase behaviour of the
customer. Innovations l ike instant credit
availability, cash vending machines, and 24 /7 open
retail outlets will propel purchases. Shoppers'
buying behaviour will be impacted in a positive or
negative way due to the environment at the store.
An organized retail store is designed with an aim to
direct customers to places where items that are
sought the most and give margins to the retailer,
are put on display. Displaying the most sought after
and highly sold products at the back of the outlet
will compel the shopper to browse through the
entire store and make him encounter as many
unlisted items as possible. The layout should be
designed in such a manner that it creates an ease of
understanding and facilitates comprehension of
customers about the distribution of various
categories of merchandise across the store.
6. There are two major layouts observed in most
retail outlets - the grid store layout and free-form
layout. The grid store layout creates a feel of
convenience for customers who like to pin
pointedly locate the products they need with ease
and also quickly browse through the store. Free-
form layout provides the customers a path for free
movement in desired areas, and due to the
irregularity in its pattern, it is conducive for a
relaxed shopping experience. Different areas in a
store are given different preferences by different
shoppers and they browse the store with varying
speeds. Some areas in particular, draw greater
customer attention than the rest. Retail managers
must pay attention to checking-out counters as
customers at this point are susceptible to impulse
purchases. The layout should be designed in such a
way that it evokes the necessary emotions in the
customer, creates a sense of comfort when they
are inside the store and also helps in differentiating
the store from the rest. Interaction between
salesmen and customers is an important marketing
factor that improves the chances of customer
purchase. The customer's intentions of buying are
influenced by the way the customer reacts
emotively to a sales person. Customers have the
tendency of enjoying their shopping in the
company of supporting sales persons with a
friendly approach; they make a difference by
making shopping fun and enjoyable through their
service. Sometimes consumers have fun and enjoy
shopping in the absence of an interacting
salesperson even though appreciating his
presence and availability, if needed. Training a
salesman to guide and aid the customer will reduce
the frustration of the latter and will activate his
impulsive purchase behaviour.
7. The attitude and behaviour of employees at the
store may sometimes make customers feel
uncomfortable. Sometimes salespersons will show
some attitude to compel the customer to purchase
a product while providing little/no help to the
shopper; in such a circumstance, the shopper may
develop a tendency towards perceiving such an
experience to be uncomfortable and unpleasant.
The store's atmosphere can be used to stimulate
pleasantness, which motivates the customer to
purchase on impulse. Retailers perceive that store
atmospherics is a helpful tool to generate an
influence on the psychology of customers in
enhanc ing the i r tendency to purchase .
Environmental factors like store layout, playing
music, etc. play an important role to enhance
purchases. The in-store shopping environment has
an influence on impulsive purchases; it is also
established that discount coupons, gift vouchers,
attractive displays at the store, advertising and
promoting products, behaviour of staff at the
store, etc. are significant factors. Allocation of
shelf-space can be defined as allocation of total
retail space between different products and their
categories in a store. Positioning of the product
and increasing its space occupancy in the shelves
will translate into a rise in sales as its visibility is
increased. A positive relation exists between area
of shelf space occupied by an impulse brand and its
48 49
Changes
cities of India, and therefore street
Contents
mall farmers. Majority of the
farmers (82%) borrow less than
Rs 5 lakhs, and 18% borrow
between Rs 5 – 10 lakhs on a
per annum basis. Most farmers
(65.79%) ar
Table source heading
Table 23: The Results of Mann-Whitney U Test for DOWJONES Index Daily ReturnsDr. Rosy Kalra
Mr. Piyuesh Pandey
References

ISSN: 0971-1023 | NMIMS Management ReviewVolume XXXII November 2016
ISSN: 0971-1023 | NMIMS Management ReviewVolume XXXII November 2016
A Study of the Organized Retail Scenario in India andCustomer Impulsiveness in Organized Retail Outlets
A Study of the Organized Retail Scenario in India andCustomer Impulsiveness in Organized Retail Outlets
acceptance. Sight, sound and smell trigger desires
and motivate customers to make impulse
purchases. Sight, sound, smell and touch are the
factors inside a store that affect the choices of
customers. Colour will have a positive effect in
influencing the purchase behaviour of the
consumer, increase the time duration spent by the
customer at the store and wi l l enhance
pleasantness and good feelings, which, in turn, will
improve customer perception of the store.
8. Various colours generate a varied influence on the
psychology of the shopper. White and blue
symbolize cleanliness and calm; orange, red and
yellow are good for creating stimulus and arouse
the emotions of the customer. Very often, specific
colours that are also extensively used in branding
will be given preference by retailers. Some retailers
use very few colours in order to prevent conflict
with merchandise colours. Music has the capability
to evoke a complex behavioural and affective
response in customers and might have an impact
on the time spent by them in the store and the
quantity of products they purchase. A combination
of two in-store cues – colour and music - arranged
in the right proportions will have a positive effect
on the customers' impulse purchase behaviour.
Customers will spend more money and time if the
store plays slow tempo music. Fast music fosters
excitement and creates a vivid expression of
enhancing purchase behaviour; slow music drives
customers to make slow movements and hence,
devote more time at the store. Music was
successful in evoking a positive purchase response
and influencing the purchase behaviour of
shoppers in the retail store. Customers stay for long
periods at the POP if there are pleasant stimulating
cues of sight like well-designed architecture and
lighting along with good cues for scents; they also
appreciate the tangible feel of the products. This
will increase the chances of the customer
purchasing the product and also result in a rise in
sales at the store.
9. Retailers should consider the products and service
offered by them as also the customer category they
target before choosing an ambient scent which will
show consistency with the image of the outlet.
Shoppers have a tendency to positively evaluate a
retail store environment with an ambient scent
and customers differentiate a scent on the basis of
three attr ibutes - i ts effect iveness (e.g.
pleasantness of the scent), degree of arousal from
the scent, and intensity of the scent. An ambient
scent influences a customer's emotion and
feelings; retail managers can use it as a marketing
tool in-store to alleviate the mood of the customer.
Chances of impulse buy are more in customers
with a high tendency to touch the product than
customers with low tendency to touch the product;
if retailers invite them to feel the product by
touching it, they are more likely to purchase it even
if they don't have any prior plan of doing so before
entering the store. Allowing customers to touch
the products at the store, providing a free sample
to know the taste of food, sniff the aroma to entice
the customer, giving a free test drive in case of a
luxury vehicle, enhances their desire towards
purchasing on impulse. Promotions that are
commonly used are a price cut, allocating more
shelf space; POP displays, etc. Price cuts are
classified into three categories - features, displays
and pure price cuts. Features are a reduction in
price; retailers announce them through a leaflet.
As it is not an in-store option, it will not have an
impact on impulse buying. Display is used to
present a reduction in price of a particular product
or a group. Pure price cuts imply slashing the price
when compared to the actual price. Purchase of
products impulsively by customers is influenced by
advertisements and promotions inside the store.
Promotions can be useful in persuading a customer
to buy a product and in making its visibility greater,
and can help retailers to decrease the distance
between the customer and the product. Price of
the product is a determining factor in impulse
purchases; customers have the tendency to be
more impulsive when discounts are offered.
Reduction in the product price, savings on cost, and
promotional sales help persuade purchases that
are not intended.
10. Product display positively affects unplanned
purchases. Seeing a product that is put on sale will
increase chances of an impulse purchase.
Customers who undergo the impulse purchase
process are attentive to displays in the store as well
as products which are put in combo offers. Displays
and posters at the point of purchase are cost-
effective and enhance chances of impulse buy.
Retailers generally resort to displaying products
that are frequently purchased within short periods
of time in a clear distinct manner. Shoppers are
focused on visually appealing products at the eye
level; displaying at this level will enhance the
customer's impulse purchase in a significant way.
Br ick-and-mortar stores try to focus on
development of effective store displays. Designing
displays strategically helps increase impulse
purchases by customers. Retailers should identify
purchases that are made for a common need and
see that they display complementary goods next to
common goods. Display windows outside the store
can be used by retail managers for serving as a tool
for disseminating information and advertisements
to prospective customers. Product aspects like
greater number of uses, price and substitutes that
come to the mind of the customer when he is in the
store affect his impulsive purchasing behaviour.
There are three product conditions which will be
conducive to trigger an impulse purchase: The first
is the customer's physical proximity to the product;
presence of temporal proximity; and social
comparability of the stimulus. A distinct shape,
texture and colour may have an impact on the
shopper's impression towards a product and act as
an enhancement on his impulsiveness in making a
purchase. Crowd condition wil l alter the
psychology of the customer and will evoke a varied
pattern in his behaviour. Perception of feeling the
crowd at the store will vary with individual
customers. More crowd density will cause a
reduction in the ability of a customer to perform
the desired actions. An overcrowded store may
result in exerting a negative influence on
customers' satisfaction levels, the total purchase
count, joy of purchasing and also their opinion of
quality of goods and services at the store. Thus it is
better for retail managers to avoid a crowded store.
SUGGESTIONS
1. The focus must be on the merchandise. The aim of
the display is to set the scene and make the
products appear relevant to the consumer's needs.
Space is an important consideration in visual
merchandising. Customers don't like the feeling of
being cramped or awkward, especially around the
racks. Merchandise that moves will catch the eye,
so it is better to have anything that moves –from
clocks to toys to music boxes; take one out and set
it up. The right choice of colours is vital. Sound will
play an important role for creating the right
atmosphere to attract buyers. Display themes to
appropriately support the product.
2. Point-of-Sale materials like signs are necessary to
boost messages about the products. Setting up the
merchandise outside the store can create a sense
of excitement and buzz: consider a "Street Fair"
environment, with flags and balloons. Cleanliness
is the most important aspect which cannot be
ignored. Change the display settings at frequent
intervals, preferably once a week.
50 51
Changes
cities of India, and therefore street
Contents
mall farmers. Majority of the
farmers (82%) borrow less than
Rs 5 lakhs, and 18% borrow
between Rs 5 – 10 lakhs on a
per annum basis. Most farmers
(65.79%) ar
Table source heading
Table 23: The Results of Mann-Whitney U Test for DOWJONES Index Daily ReturnsDr. Rosy Kalra
Mr. Piyuesh Pandey
References

ISSN: 0971-1023 | NMIMS Management ReviewVolume XXXII November 2016
ISSN: 0971-1023 | NMIMS Management ReviewVolume XXXII November 2016
A Study of the Organized Retail Scenario in India andCustomer Impulsiveness in Organized Retail Outlets
A Study of the Organized Retail Scenario in India andCustomer Impulsiveness in Organized Retail Outlets
3. There are no real metrics for measuring the
effectiveness of visual merchandising. No accurate
way is available to find out what works and what
does not. One can only experiment. When product
promotions are done frequently, putting increased
efforts on visual merchandising will help to gauge
the response of customers. Periodic monitoring on
VM implementations can be a way to determine if
the VM efforts are paying off.
4. Easily stored products are more likely to be
purchased on impulse than products which pose
problems when stockpiled. So retailers should
facilitate methods of easy storage in order to make
customers opt for impulse purchases of these
products.
5. A shopper's decision regarding a purchase will be
made according to norms and values of his
reference group. Impulse buying is mostly
influenced by reference groups that the customer
follows. Reference groups consist of the
customer's peers, family or people who the
customer admires and would like to emulate.
Lower levels of self-esteem will cause impulse
purchases by customers to overcome this negative
self-image. Purchases by such customers are made
to overcome their vulnerability to the influence of
various reference groups. Retail managers should
focus on ways to reach these reference groups for
positively influencing the customer towards
making an impulse purchase decision.
6. Some retail stores place confectionary at the base
level at the checkout counter where babies and
kids pick them up and pester their parents to buy
them, and in some cases, unknowingly put them in
their mouth forcing the latter to pay up for the
same. Retail stores can offer some newly
introduced snacks and coffee free to the customers
on occasions to create a warm cosy feeling in the
customers.
7. Floor decor, light, scent, sound, room temperature,
clean surroundings, wall texture and colours will
come under the general interior stimulus category.
A stimulating store environment will have an
impact on emotions of customers. Continuous
arousal and a stimulating environment will
decrease the customer's self-control thereby
resulting in him making impulsive purchases. A
pleasant and stimulating store environment will
enhance the impulse buying process. Visual
merchandising plays an important role in inducing
impulse purchases and the factors include colour,
smell, lightning, sounds, packaging, etc.
8. Purchases made on impulse will create a sense of
displeasure generated due to malfunctioning of
the products bought at a high price; this leads to
creation of negative emotions and feelings among
the shoppers. So store managers must ensure that
they are not putting low quality products on their
shelves and should try to deliver maximum value to
the customers for the amount spent by them at the
store.
References
• Schiffman, Leon G. and Leslie Lazar Kanuk. 2000. Consumer Behavior 7th edition. Upper Saddle River, NJ:
Prentice-Hall, Inc.
• RETAILING MANAGEMENT-FIFTH EDITION, Michael Levy, Barton A Weitz
• The Future POPULATION of India A Long-range Demographic View - Population Reference Bureau
• Churchill, Gilbert A., Jr. 1979. "A Paradigm for Developing Better Measures of Marketing Constructs." Journal of
Marketing Research 16 (February): 64-73.
• Hansemark, O. C. & Albinson, M., 2004, Customer Satisfaction and Retention: The Experiences of Individual
Employees, Managing Service Quality, 14 (1),pp. 40- 57
• National Skill Development Corporation and KPMG Analysis Report, India Retail Report, NSS Survey and
MOSPI Reports.
• Hoch & Loewenstein, “Time-inconsistent Preferences and Consumer Self-Control,” Journal of Consumer
Research, 1991, 17(4), pp.492-507.
• Jon E, Ulysses and the Sirens, Cambridge University Press.,1984
• Kerfoot, S., Davies, B., Ward, P, “Visual Merchandising and the Creation of Discernible Retail Brands”,
International Journal of Retail and Distribution Management, 2003, 31(3), pp. 143-52.
• Kollat, D.T., Willett, R.P., Consumer impulse purchasing behaviour. Journal of Marketing Research, 1967, 4(1),
pp.21-31.
• O'Guinn, T. C., Faber, R. J., “Compulsive buying: a phenomenological exploration. Journal of Consumer
Research, 1989, 16(2), pp. 147-157.
• Shepard, “Personal Failures and the Bankruptcy Reform Act of 1978,” Journal of Law and Economics, 1984,
27(2), pp. 419-437.
• Silvera D H, Lavack A M, Kropp F, “Impulse Buying: The Role of Affect, Social Influence, and Subjective Well-
being”, Journal of Consumer Marketing, 2015, 25(1), pp. 23-33.
• Silvera, D. H., Neilands, T. B. , Perry, J. A., “A Norwegian translation of the self liking and competence scale”,
Scandinavian Journal of Psychology, 2001,42(5), pp. 417-427.
• Tafarodi, R. W., Swann, W. B., “Self-liking and self-competence as dimensions of global self-esteem: initial
validation of a measure”, Journal of Personality Assessment, 1995, 65(2), pp. 322–42.
• Weun S., Jones M.A. , Beatty S.E., The Development and Validation of the Impulse Buying Tendency Scale,
Psychological Reports,1998, 82(3), pp.1123-33 .
• Young-Bae Kim, A Tradeoff between National Income and Regional Growth: Evidence from the EU, Indian
journal of science and technology, Volume 8, Supplementary 1, January 2015.
• Crawford, G., & Melewar, T. C. (2003). The importance of impulse purchasing behavior in the international
airport environment. Journal of Consumer Behavior, 3(1), 85-98. http://dx.doi.org/10.1002/cb.124
• Zentes, J., Morschett, D. and Schramm-Klein, H., 2007. Strategic Retail Management.
• Terrazas, M. (2006). In-store displays that work. The Baker, [Online] 10(3). Retrieved 05 August 2008, from :
http://www.thebaker.co.za
• Dunne, P. M. and Lusch, R. F., 2008. Retailing. 6th ed. Mason: Thomson Higher Education.
52 53
Changes
cities of India, and therefore street
Contents
mall farmers. Majority of the
farmers (82%) borrow less than
Rs 5 lakhs, and 18% borrow
between Rs 5 – 10 lakhs on a
per annum basis. Most farmers
(65.79%) ar
Table source heading
Table 23: The Results of Mann-Whitney U Test for DOWJONES Index Daily ReturnsDr. Rosy Kalra
Mr. Piyuesh Pandey
References

ISSN: 0971-1023 | NMIMS Management ReviewVolume XXXII November 2016
A Study of the Organized Retail Scenario in India andCustomer Impulsiveness in Organized Retail Outlets
K. Venkateswara Raju is Assistant Professor in the area of Management. He is a Research Scholar at KLU
Business School, Guntur. He initially started his career as a Software Engineer for 3 years. He has 8 years of
teaching experience to his credit and published 40 research papers including 3 Scopus indexed cases and
articles in varied disciplines of management. His research and teaching areas include marketing, retail,
human resources, f inance, research methods and management. He can be reached at
D. Prasanna Kumar is Associate Dean of Academics at KLU Business School. He has been awarded with Ph.D.
degree by Nagarjuna University, Guntur and published 60 research papers including 12 Scopus indexed cases
and articles in varied disciplines of management. He is also actively involved in editorial work. He worked as
HOD, MGIM and HOD, Islamia College of Technology & Management, and Principal at Synergy School of
Business. His research and teaching areas include marketing, retail, human resources, finance, research
methods and management. He has 10 Ph.D. Research Scholars under his guidance. He can be reached at
54
Changes
cities of India, and therefore street
Contents
mall farmers. Majority of the
farmers (82%) borrow less than
Rs 5 lakhs, and 18% borrow
between Rs 5 – 10 lakhs on a
per annum basis. Most farmers
(65.79%) ar
Table source heading
Table 23: The Results of Mann-Whitney U Test for DOWJONES Index Daily ReturnsDr. Rosy Kalra
Mr. Piyuesh Pandey
References