empirical study of credit rating migration in...
TRANSCRIPT

ISSN: 0971-1023 | NMIMS Management ReviewVolume XXXIV | Issue 1 | April 2017
ISSN: 0971-1023 | NMIMS Management ReviewVolume XXXIV | Issue 1 | April 2017
Empirical Study of Credit Rating Migrationin India
Debasish Ghosh
Abstract
Credit rating agencies assess the credit worthiness of
specific debt instruments. To determine a bond's
rating, a credit rating agency analyzes the accounts of
the issuer and the legal agreements attached to it, to
produce the chance of default, expected loss or a
similar metric. The metrics vary between agencies. The
upgrade and downgrade of ratings is known as
notching. The probability of single and multiple
notching is represented by a matrix of transition
probabilities. The matrix is defined to describe the
probability for change in an underlying rating. Rating
migration refers to a change from an initial rating to a
new rating category. Transition matrix represents the
probability of a company moving from one credit
rating to another i.e. the chance of credit quality of a
firm improving or worsening. It represents moving
probabilities from one rating level to all other ratings,
including default for a given rating and time horizon. It
shows the complete possible states that a rating can
take over a given time horizon and therefore provides
detailed information on rating movements. When
credit quality of corporate bonds worsens, the
probability of future default also increases. We have
estimated transition matrix for companies rated by
ICRA using two estimation procedures built on
historical transitions - Cohort approach and Hazard
approach - using five years' data from Bloomberg
between 2012 and 2017.
Keywords: Credit Risk, Credit Rating, Credit Risk
Management, Probability of Default
Empirical Study of Credit Rating Migration in India Empirical Study of Credit Rating Migration in India
Introduction
In order to sustain high growth rates, India needs a
developed bond market. In its current state, it is a
market for highly rated, plain vanilla instruments,
issued by financial firms and Public Sector Enterprises
(PSEs). Also, issuance is fragmented and trading dries
up within a few days of issuance. The Indian bond
market comprises of three segments; government
bond market, corporate bond market and the
derivatives market. Corporate bond markets can be
split into domestic and international. The domestic
corporate bond market's size, depth and activity is
likely to be influenced by the size of the government
bond market, the number of listed companies, bank
assets as a percentage of GDP, etc. Another factor that
may be relevant in understanding the development of
the corporate bond markets in India is the role that
credit rating agencies play. This study is related to the
domestic corporate bond market in India and this
paper intends to study default risk and rating changes
to bring about greater understanding of credit risk
faced by corporate bonds in India.
The present paper is organised as follows. Section I
presents an overview of the corporate bond market in
India; Section II presents the role of rating agencies; in
Section III, we introduce the idea of transition matrix;
Section IV presents the survey of literature; Section V
presents the methodology to estimate transition
matrices used in this study; Section VI describes the
data used in this study; Section VII describes the
results and interpretations and Section VIII concludes
with policy implications.
The Corporate Bond Market in India
The Indian corporate debt market has experienced
considerable growth in recent years. Today, the size of
the corporate bonds' market is about Rs.19 trillion —
around 14% of the Gross Domestic Product (GDP). This
is large on an absolute basis but small compared to
bank assets (89% of GDP) and equity markets (80% of
GDP). Banks and equity markets are the dominant
sources of capital for business in India. Corporate bond
market financing in India continues to be dwarfed by
bank financing and equity financing. This is a puzzle.
Several committees have opined on how to fix this, yet
little has changed. As of December 2015, the total
volume of outstanding corporate bonds in the Indian
bond market amounted to approximately $287bn.
Table 1:Financial Market Development
As % of GDP 1996 2008 2015
Equities 32.1 108.4 80.0
Government bonds 14.3 36.1 34.3
Corporate bonds 0.9 3.9 14.0
Bank assets 46.5 73.8 89.0
Source: SEBI, RBI, World Economic Outlook
The corporate debt market can be classified into
primary market and secondary market. In the primary
market, corporate debt is via private placements like
corporate bonds placed with wholesale investors like
banks, financial institutions, mutual funds, etc. The
secondary market for corporate debt is available on
platforms offered by various exchanges in the country.
The following are the instruments available in the
corporate debt market - Non-convertible debentures;
partly-convertible debentures/ fully-convertible
debentures (convertible into equity shares); secured
premium notes; debentures with warrants; deep
discount bonds; PSU bonds/ tax-free bonds. The
participants in the retail debt market can be divided
into mutual funds, provident funds, pension funds,
private trusts, religious trusts and charitable
organizations having large investible corpus, state level
and district level co-operative banks, housing finance
companies, NBFCs and RNBCs, corporate treasuries,
Hindu-Undivided Families (HUFs) and individual
investors.
12 13
cities of India, and therefore street
Contents
mall farmers. Majority of the
farmers (82%) borrow less than
Rs 5 lakhs, and 18% borrow
between Rs 5 – 10 lakhs on a
per annum basis. Most farmers
(65.79%) ar
Table source heading
Table 23: The Results of Mann-Whitney U Test for DOWJONES Index Daily ReturnsDr. Rosy Kalra
Mr. Piyuesh Pandey
References

ISSN: 0971-1023 | NMIMS Management ReviewVolume XXXIV | Issue 1 | April 2017
ISSN: 0971-1023 | NMIMS Management ReviewVolume XXXIV | Issue 1 | April 2017
Table 2:Primary Market for Corporate Bonds
Year Issuance details % changein issuance
Netoutstanding
(As atend-March)
No. ofoutstandinginstruments
% change inoutstanding
amountNo. ofissues
Amount
2012-13 3,023 380,411.62 27.48 1,261,717.15 8,859 23.79
2013-14 3,136 383,320.05 0.76 1,466,057.68 9,186 14.61
2014-15 4,257 466,247.13 21.63 1,702,756.47 10,810 17.75
2015-16 4,696 564,099.70 20.99 1,956,445.64 12,624 14.90
Source: SEBI
Bond markets help diversify the sources of financing
and reduce credit risk concentration in the banking
sector. A liquid corporate debt market can play a
crucial role by supplementing the banking system to
meet the requirements in the corporate sector for
long-term capital investment and asset creation. In
India, various recommendations announced by
numerous committees (R H Patil Committee 2005,
Percy Mistry Committee 2007, Raghuram Rajan
Committee 2009, H R Khan Committee 2016) have
resulted in a series of reforms to deepen and develop
the corporate bond market. As a result, the corporate
bond issuance has increased by 77% between 2010-11
and 2014-15 while the number of issues has jumped
156%. Net outstanding too increased by 97% during
the same period. If we extend the period by one more
year, bond issuance between 2010-11 and 2015-16
increased 95%, issuance amount by 116% and net
outstanding by 127%.
Table 3:Secondary Market
Source: SEBI
Year No. of Value No. of Traded value Avg. trade Turnover issues outstanding trades size ratio (Rs. bn) (Rs. bn) (Rs. bn)
2008 19,079 958.9
2009 22,683 1,481.7
2010 38,230 4,011.9
2011 12,155 8,895.1 44,060 6,052.7 0.14 0.68
2012 13,721 10,516.4 51,533 5,937.8 0.12 0.61
2013 15,874 12.901.5 66,383 7,386.3 0.11 0.63
2014 13,104 14,673.9 70,887 9,708.0 0.14 0.70
2015 19,439 17,503.2 75,791 10,912.9 0.15 0.68
In the corporate bond market, funds are raised
through either public issues or via private placements.
While the private placement disclosure and
documentation requirements are viewed by the
market to be comprehensive, disclosure requirements
for public issuance of debt are viewed by the market as
being extremely arduous and difficult to comply with.
As an active market for corporate debt does not exist, it
does not make any economic sense to spend a good
amount in issuance. Hence, this market is dominated
by private placements. Out of total corporate debt
issuances, high rated bonds considered to be the safest
bet have the largest share. AAA and AA rated bonds
had a combined share of over 72% in total Corporate
Bond issuances over the years.
Table 4:Modes of Debt Issues Used by Corporate Sector
Source: SEBI
2012-13 16,982 4.49 361,462 95.51 378,444
2013-14 42,383 13.31 276,054 86.69 318,437
2014-15 9,713 2.35 404,137 97.65 413,850
2015-16 33,812 6.87 458,073 93.13 491,885
Year Debt issues (Rs Crore) Total
Public Private Placement
Amt Share (%) Amt Share (%)
The turnover ratio is the value of bonds traded in the
secondary market to the total outstanding bonds. It is
indicative of the liquidity in the bonds market as it
captures the extent of trading in the secondary market
relative to the amount of bonds outstanding. Hence,
higher the turnover ratio, more active is the secondary
market. The table below gives an overview of the
turnover ratios in government bonds, corporate bonds
and aggregate bonds in Asian countries. Japan has the
highest turnover ratio of 4.56 with government bonds
having a multiple of 4.9. The turnover in the corporate
bond market is relatively lower at 0.3. India is second
with a healthy turnover in the bond market at 3.46.
There is a strong secondary market for government
securities with a turnover of 4.7. India's position in
terms of turnover is mirrored in the corporate bonds
market as well with a turnover ratio of 0.67, which is
still higher than that of Japan. China leads in the
corporate segment with a multiple of 1.6. In fact, China
has a turnover ratio of above 1 in both the segments.
Thailand is third with a total turnover of 2.5, with a 3.1
turnover in government bonds and corporate bonds
turnover being 0.26. While South Korea has a larger
corporate debt market size relative to GSecs, the
turnover ratio is higher for gilts at 3.73 compared with
0.54 for corporate bonds. Domestic credit (i.e. credit
disbursed by banks) is the primary source for financing
in China (73.9%) and South Korea (73.9%) followed by
India which is second with a share of 71.5%. In
emerging markets, corporate bonds are not
significant; India has the highest share with 18.4%
followed by Malaysia with 12.4% and China, S Korea
and Singapore with 8% each. Interestingly, relative to
other countries, India lends the most through
corporate bond issuances at 18.4% standing well
above its peer countries in the sample. Hence, despite
a smaller contribution of corporate bonds in India (in
terms of outstanding issuances) relative to other
countries, corporate bonds play a larger role in
satisfying the finance needs of corporates compared
with other countries in the sample.
Empirical Study of Credit Rating Migration in India Empirical Study of Credit Rating Migration in India14 15
cities of India, and therefore street
Contents
mall farmers. Majority of the
farmers (82%) borrow less than
Rs 5 lakhs, and 18% borrow
between Rs 5 – 10 lakhs on a
per annum basis. Most farmers
(65.79%) ar
Table source heading
Table 23: The Results of Mann-Whitney U Test for DOWJONES Index Daily ReturnsDr. Rosy Kalra
Mr. Piyuesh Pandey
References

ISSN: 0971-1023 | NMIMS Management ReviewVolume XXXIV | Issue 1 | April 2017
ISSN: 0971-1023 | NMIMS Management ReviewVolume XXXIV | Issue 1 | April 2017
Table 5:Global Bond Markets – Market Size
Total Government Fl Non-Fl (USD Bn)
USA 207 90 86 30 17,348
China 60 17 23 19 10,357
Japan 243 182 48 14 4,602
UK 201 88 95 18 2,950
India 49 34 10 4 2,051
Korea 103 36 32 35 1,410
Indonesia 13 11 1 1 889
Thailand 81 28 32 21 405
Singapore 108 24 53 31 308
Country Bond market Size-2015 (as % of GDP) GDP
Source: BIS Debt Statistics: IMF World Economic Outlook; ADB Asian Bonds Online
A critical positive is that the turnover in the Indian
bond market is second only to Japan. However, this is
primarily owing to the active secondary market for
government bonds in the country. The secondary
corporate bond market, while being comparatively
Table 6:
Global Bond Markets - Turnover
passive, is still the second most active within Asian
countries. Hence, while overall, the secondary market
trading appears healthy, the same for corporate bonds
can be made more vibrant.
USA 15,614 9.7 20,147 1.6
China 1,779 1.3 4,390 0.9
Japan 8,363 5.3 2,839 0.3
UK 2,598 N.A. 3,327 N.A.
India 704 1.9 287 0.7
Korea 505 3.04 944 0.5
Indonesia 101 2.7 19 0.8
Thailand 112 2.6 215 0.3
Singapore 73 1.9 259 N.A.
Source: ADB Asian Bond Online, BIS Debt Statistics, SIFMA, SEBI, RBI
Govt. bondsOutstanding ($ Bn)
Turnover ratio Corporate bonds
Outstanding ($ Bn)
Turnover ratio
The above analysis indicates that despite having a large
bond market, countries like China and South Korea
have a relatively passive secondary market as opposed
to India which stands fourth in terms of the size of the
bond market, but is second with respect to the
turnover in the bond market as a whole and also in the
individual government and corporate bond markets.
Role of Rating Agencies
In India, as in other economies, credit ratings are
important for private contracting as well as regulation.
In carrying out these functions, rating agencies play a
key role in reducing asymmetric information which
helps in the formation of both primary and secondary
markets. Credit rating agencies are companies which
specialize in evaluating the creditworthiness of an
issuer of debt instruments (bonds, securities etc). The
issuer can be a company or a government. Credit rating
agencies use simple alphabetical or alphanumeric
symbols which help the investor differentiate between
debt instruments on the basis of their underlying
credit quality. Just like a school report card, these
grades serve as a marking system /score card designed
t o i n f o r m i n t e r e s t e d p a r t i e s a b o u t t h e
creditworthiness of countries, companies and
individuals.
A rating agency mainly assigns a rating to a bond. The
rating is based on two elements: the probability that
the entity will file for bankruptcy before the final bond
payment is due and what percentage of the
bondholders' claims creditors will receive if a
bankruptcy takes place. The upgrade and downgrade
of ratings is called Notching. Rating notches can be
single notching or multiple notching. The probability of
single and multiple notching is captured by a matrix of
transition probabilities. The matrix is defined to
describe the probability for change in an underlying
rating. Thus “rating migrations” refer to a change from
an initial rating to a new rating category.
The credit rating indicates the rating agency's opinion
on the likelihood of default by the issuer. Credit ratings
establish a link between risk and return. It is arrived at
by evaluating various quantitative as well as qualitative
parameters of the issuer. Lower credit ratings result in
higher borrowing costs because the borrower is
believed to carry a higher risk of default. In other
words, when you invest in an instrument issued by
someone with a weak credit score, you are hoping for a
higher rate of return.
The rating symbols provided by the agencies indicate
both the returns expected and the risk attached to the
instrument. Hence, it becomes easier for the investors
to base their decision by looking at the symbol
assigned by the rating agencies. Credit rating activity
began in March 1988 in India with CRISIL assigning a
rating to its first client IPCL.
Six agencies are currently recognized and regulated in
India: CRISIL Limited, incorporated in 1987; India
Ratings & Research (INDRA), incorporated originally
as Duff and Phelps Credit Rating India Private Limited
in 1996; ICRA Limited, incorporated in 1991; Credit
Analysis & Research Ltd. (CARE), incorporated in 1993;
Brickwork Ratings India Private Limited, incorporated
in 2007; and SME Rating Agency of India Ltd. (SMERA),
incorporated in 2005. In terms of revenue, CRISIL is
India's largest rating agency, followed by ICRA and
CARE.
For all debt market participants, accurate and reliable
default and transition rates are critical inputs in
formulating the following decisions. First, default and
transition rates are critical inputs for pricing a debt
instrument or loan exposure; this helps to decide
whether and how much to lend and at what price.
Second, the structuring, rating and pricing of credit-
enhanced instruments depend heavily on the default
and transition rates of underlying borrowers and
securities. Third, default and transition rates are key
inputs for many quantitative risk assessment models.
Investors in rated instruments can manage their risk
exposures efficiently if they have access to reliable
default and transition rates. Transition rates are also
important for debt funds that need to maintain a
certain threshold of credit quality in their portfolios
and for investors who are mandated to invest only in
securities that are rated at a certain level or above.
Empirical Study of Credit Rating Migration in India Empirical Study of Credit Rating Migration in India16 17
cities of India, and therefore street
Contents
mall farmers. Majority of the
farmers (82%) borrow less than
Rs 5 lakhs, and 18% borrow
between Rs 5 – 10 lakhs on a
per annum basis. Most farmers
(65.79%) ar
Table source heading
Table 23: The Results of Mann-Whitney U Test for DOWJONES Index Daily ReturnsDr. Rosy Kalra
Mr. Piyuesh Pandey
References

ISSN: 0971-1023 | NMIMS Management ReviewVolume XXXIV | Issue 1 | April 2017
ISSN: 0971-1023 | NMIMS Management ReviewVolume XXXIV | Issue 1 | April 2017
Table 7:Rating Analysis of the Issuances of Fixed Rate Corporate Bonds
Year AAA AA A BBB BB B C NA
2012-13 433 470 117 24 9 0 3 73
2013-14 481 846 125 41 26 7 3 179
2014-15 789 929 241 126 53 5 0 217
2015-16 907 963 204 103 50 8 0 267
Source: NSDL
Transition Matrix
Credit ratings rank borrowers according to their credit
worthiness. Institutions are also interested in knowing
how likely it is that borrowers in a particular rating
category will be upgraded or downgraded to a
different rating, and especially, how likely it is that they
will default. Transition probabilities offer one way to
characterize the past changes in credit quality of
obligors (typically firms), and are cardinal inputs to
many risk management applications.
Default is not an abrupt process; a firm's credit
worthiness and asset quality declines gradually.
Transition probability is the chance of credit quality of
a firm improving or worsening. The transition matrix
thus represents moving probabilities from one rating
level to all other ratings, including default for a given
rating and time horizon (say one year). It shows the
complete possible states that a rating can take over a
given time horizon and therefore, provides detailed
information on rating movements. Changes in
distribution of ratings provide a much richer picture of
changes in aggregate credit quality. When credit
quality of corporate bonds worsens, the probability of
future default also increases.
Rating transitions punctuate changes in the prices of
securities issued by firms. Firms such as Moody's and
Standard & Poor's announce ratings changes during
periodic reviews of the creditworthiness of firms.
There is now a vast history of rating transitions data
summarized into rating transition matrices.
Rating transitions are important for market players for
many reasons. First, they signal real changes in the
value of firms resulting in a series of re-pricing of
issued securities. Second, they impact investment
portfolios subject to rating-based restrictions. For
example, money market funds are not allowed to hold
more than a small fraction of low-grade paper. Third
securities that are indexed to rating are impacted.
Credit sensitive notes for example, are bonds whose
coupons are indexed to rating levels. Fourth, credit
portfolio risk is simulated according to rating
transitions. Hence, ratings are important in all aspects
of the credit markets.
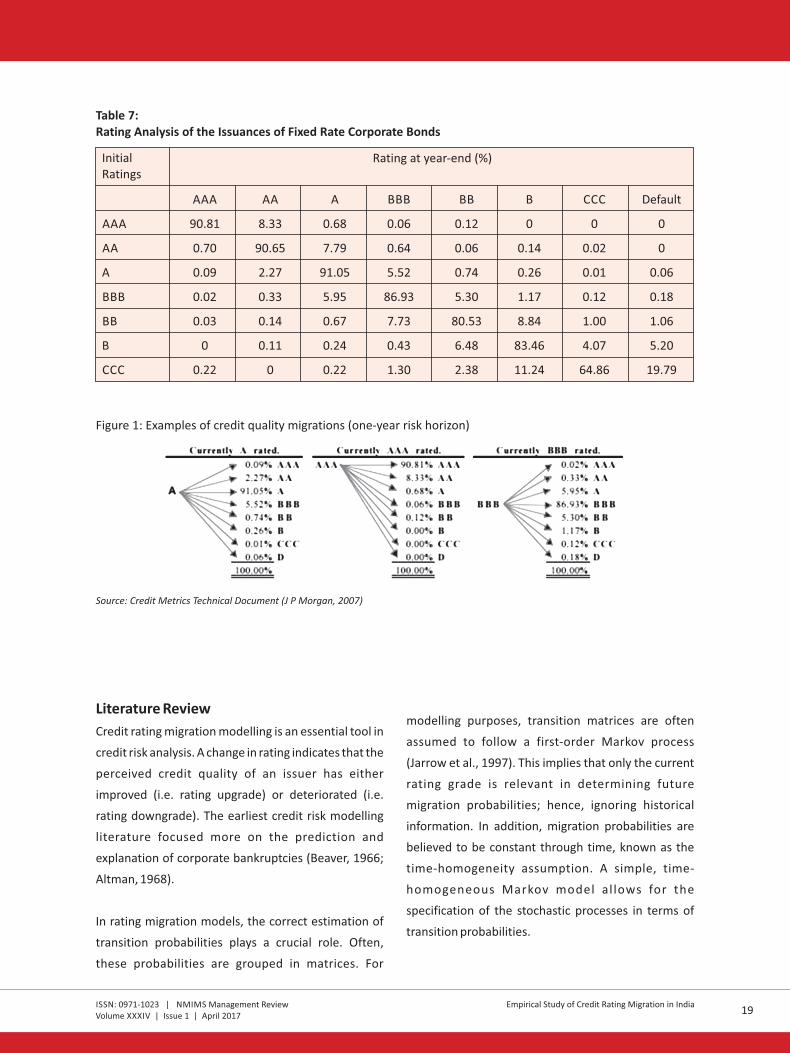
Figure 1 demonstrates some important features of a
rating transition matrix. It shows the complete
possible states a rating can take over the time horizon,
say one year. Such a square array is termed as the
matrix of transition probabilities. Information at only
two dates for each year of data is necessary to
calculate such a transition matrix. Essentially, the
measurement of risk as a result of the rating changes
was captured by a transition matrix where the
probability of rating changes are assigned a number as
shown below.
Table 7:Rating Analysis of the Issuances of Fixed Rate Corporate Bonds
Source: Credit Metrics Technical Document (J P Morgan, 2007)
AAA AA A BBB BB B CCC Default
AAA 90.81 8.33 0.68 0.06 0.12 0 0 0
AA 0.70 90.65 7.79 0.64 0.06 0.14 0.02 0
A 0.09 2.27 91.05 5.52 0.74 0.26 0.01 0.06
BBB 0.02 0.33 5.95 86.93 5.30 1.17 0.12 0.18
BB 0.03 0.14 0.67 7.73 80.53 8.84 1.00 1.06
B 0 0.11 0.24 0.43 6.48 83.46 4.07 5.20
CCC 0.22 0 0.22 1.30 2.38 11.24 64.86 19.79
InitialRatings
Rating at year-end (%)
Figure 1: Examples of credit quality migrations (one-year risk horizon)
Literature Review
Credit rating migration modelling is an essential tool in
credit risk analysis. A change in rating indicates that the
perceived credit quality of an issuer has either
improved (i.e. rating upgrade) or deteriorated (i.e.
rating downgrade). The earliest credit risk modelling
literature focused more on the prediction and
explanation of corporate bankruptcies (Beaver, 1966;
Altman, 1968).
In rating migration models, the correct estimation of
transition probabilities plays a crucial role. Often,
these probabilities are grouped in matrices. For
modelling purposes, transition matrices are often
assumed to follow a first-order Markov process
(Jarrow et al., 1997). This implies that only the current
rating grade is relevant in determining future
migration probabilities; hence, ignoring historical
information. In addition, migration probabilities are
believed to be constant through time, known as the
time-homogeneity assumption. A simple, time-
homogeneous Markov model al lows for the
specification of the stochastic processes in terms of
transition probabilities.
Empirical Study of Credit Rating Migration in India Empirical Study of Credit Rating Migration in India18 19
cities of India, and therefore street
Contents
mall farmers. Majority of the
farmers (82%) borrow less than
Rs 5 lakhs, and 18% borrow
between Rs 5 – 10 lakhs on a
per annum basis. Most farmers
(65.79%) ar
Table source heading
Table 23: The Results of Mann-Whitney U Test for DOWJONES Index Daily ReturnsDr. Rosy Kalra
Mr. Piyuesh Pandey
References
ISSN: 0971-1023 | NMIMS Management ReviewVolume XXXIV | Issue 1 | April 2017
ISSN: 0971-1023 | NMIMS Management ReviewVolume XXXIV | Issue 1 | April 2017
Table 7:Rating Analysis of the Issuances of Fixed Rate Corporate Bonds
Year AAA AA A BBB BB B C NA
2012-13 433 470 117 24 9 0 3 73
2013-14 481 846 125 41 26 7 3 179
2014-15 789 929 241 126 53 5 0 217
2015-16 907 963 204 103 50 8 0 267
Source: NSDL
Transition Matrix
Credit ratings rank borrowers according to their credit
worthiness. Institutions are also interested in knowing
how likely it is that borrowers in a particular rating
category will be upgraded or downgraded to a
different rating, and especially, how likely it is that they
will default. Transition probabilities offer one way to
characterize the past changes in credit quality of
obligors (typically firms), and are cardinal inputs to
many risk management applications.
Default is not an abrupt process; a firm's credit
worthiness and asset quality declines gradually.
Transition probability is the chance of credit quality of
a firm improving or worsening. The transition matrix
thus represents moving probabilities from one rating
level to all other ratings, including default for a given
rating and time horizon (say one year). It shows the
complete possible states that a rating can take over a
given time horizon and therefore, provides detailed
information on rating movements. Changes in
distribution of ratings provide a much richer picture of
changes in aggregate credit quality. When credit
quality of corporate bonds worsens, the probability of
future default also increases.
Rating transitions punctuate changes in the prices of
securities issued by firms. Firms such as Moody's and
Standard & Poor's announce ratings changes during
periodic reviews of the creditworthiness of firms.
There is now a vast history of rating transitions data
summarized into rating transition matrices.
Rating transitions are important for market players for
many reasons. First, they signal real changes in the
value of firms resulting in a series of re-pricing of
issued securities. Second, they impact investment
portfolios subject to rating-based restrictions. For
example, money market funds are not allowed to hold
more than a small fraction of low-grade paper. Third
securities that are indexed to rating are impacted.
Credit sensitive notes for example, are bonds whose
coupons are indexed to rating levels. Fourth, credit
portfolio risk is simulated according to rating
transitions. Hence, ratings are important in all aspects
of the credit markets.
Figure 1 demonstrates some important features of a
rating transition matrix. It shows the complete
possible states a rating can take over the time horizon,
say one year. Such a square array is termed as the
matrix of transition probabilities. Information at only
two dates for each year of data is necessary to
calculate such a transition matrix. Essentially, the
measurement of risk as a result of the rating changes
was captured by a transition matrix where the
probability of rating changes are assigned a number as
shown below.
Table 7:Rating Analysis of the Issuances of Fixed Rate Corporate Bonds
Source: Credit Metrics Technical Document (J P Morgan, 2007)
AAA AA A BBB BB B CCC Default
AAA 90.81 8.33 0.68 0.06 0.12 0 0 0
AA 0.70 90.65 7.79 0.64 0.06 0.14 0.02 0
A 0.09 2.27 91.05 5.52 0.74 0.26 0.01 0.06
BBB 0.02 0.33 5.95 86.93 5.30 1.17 0.12 0.18
BB 0.03 0.14 0.67 7.73 80.53 8.84 1.00 1.06
B 0 0.11 0.24 0.43 6.48 83.46 4.07 5.20
CCC 0.22 0 0.22 1.30 2.38 11.24 64.86 19.79
InitialRatings
Rating at year-end (%)
Figure 1: Examples of credit quality migrations (one-year risk horizon)
Literature Review
Credit rating migration modelling is an essential tool in
credit risk analysis. A change in rating indicates that the
perceived credit quality of an issuer has either
improved (i.e. rating upgrade) or deteriorated (i.e.
rating downgrade). The earliest credit risk modelling
literature focused more on the prediction and
explanation of corporate bankruptcies (Beaver, 1966;
Altman, 1968).
In rating migration models, the correct estimation of
transition probabilities plays a crucial role. Often,
these probabilities are grouped in matrices. For
modelling purposes, transition matrices are often
assumed to follow a first-order Markov process
(Jarrow et al., 1997). This implies that only the current
rating grade is relevant in determining future
migration probabilities; hence, ignoring historical
information. In addition, migration probabilities are
believed to be constant through time, known as the
time-homogeneity assumption. A simple, time-
homogeneous Markov model al lows for the
specification of the stochastic processes in terms of
transition probabilities.
Empirical Study of Credit Rating Migration in India Empirical Study of Credit Rating Migration in India18 19
cities of India, and therefore street
Contents
mall farmers. Majority of the
farmers (82%) borrow less than
Rs 5 lakhs, and 18% borrow
between Rs 5 – 10 lakhs on a
per annum basis. Most farmers
(65.79%) ar
Table source heading
Table 23: The Results of Mann-Whitney U Test for DOWJONES Index Daily ReturnsDr. Rosy Kalra
Mr. Piyuesh Pandey
References

ISSN: 0971-1023 | NMIMS Management ReviewVolume XXXIV | Issue 1 | April 2017
ISSN: 0971-1023 | NMIMS Management ReviewVolume XXXIV | Issue 1 | April 2017
The Markov and time-homogeneity property only
holds within one- or two-year horizons (Jafry &
Schuermann, 2004; Kiefer & Larson, 2007; Frydman &
Schuermann, 2008) . Furthermore, there is
overwhelming academic evidence that the rating
process is non-Markovian and not time-homogeneous
in the long run. For example, Altman & Kao (1992);
Kavvathas (2000); Lando & Skødeberg (2002);
Hamilton & Cantor (2004); Christensen et al. (2004);
Frydman & Schuermann (2008); Figlewski et al. (2012)
report the existence of a momentum effect in ratings.
Nickell et al. (2000) fit an ordered probit model and
conclude that rating transition probabilities vary
according to the state of the macro-economy. Using
survival analysis, Kavvathas (2000) reaches the same
conclusion. Bangia et al. (2002) divide the economy
into two regimes, expansion and contraction, and
condition the migration matrix on these states. They
find that ratings migration probabilities vary with the
business cycle. Frydman & Schuermann (2008) employ
Markov mixture models, estimating two economic
regimes, and find that ratings are not time-
homogeneous after controlling for the state of the
macro-economy. Figlewski et al. (2012) analyze macro-
economic and ratings history related factors by
applying survival analysis and decide that these factors
are significant in explaining rating transitions.
Estimation of Transition Matrix
In this paper, we discuss two estimation procedures
built on historical transitions: the Cohort approach and
the hazard approach. The cohort approach is a
traditional technique that estimates transition
probabilities through historical transition frequencies.
Though widely established, the cohort approach does
not make full use of the available data. The estimates
are not affected by the timing and sequencing of
transitions within a year. An approach that
circumvents such problems and makes efficient use of
the data would be to estimate transition rates using a
hazard rate approach. A cohort comprises all obligors
holding a given rating at the start of a given period. In
the cohort approach, the transition matrix is filled with
empirical transition frequencies that are computed as
follows. Let Ni,t denote the number of obligors in
category i at the beginning of period t (Ni,t is therefore
the size for the cohort i, t). Let Nij,t denote the number
of obligors from the cohort i, t that have obtained
grade j at the end of period t. The transition
frequencies in period t are computed as
Usually a transition matrix is estimated with data from
several periods. A common way of averaging the
period transition frequencies is the obligor-weighted
average which uses the number of obligors in a cohort
as weights:
Inserting (1) into (2) leads to:
Therefore, the obligor-weighted average can be
directly obtained by dividing the overall sum of
transitions from i to j by the overall number of obligors
that were in grade i at the start of the considered
periods.
An alternative approach which captures within-period
transitions is called the duration or hazard rate
approach. In the following, we demonstrate its
implementation without explaining the underlying
theory. We first estimate a so-called generator matrix
providing a general description of the transition
behaviour. The off-diagonal entries of Λ estimated
over the period [t0, t] are given as:
Where N is the observed number of transitions from i ij
to j during the time period considered in the analysis
and Y (s) is the number of firms rated i at time s. The i
denominator therefore contains the number of
obligor-years spent in rating class i. Note the similarity
to the cohort approach. In both cases, we divide the
number of transitions by a measure of how many
obligors are at risk of experiencing the transition. In
the cohort approach, we count the obligors at discrete
points in time (the cohort formation dates); in the
hazard approach, we count the obligors at any point of
time. The on-diagonal entries are constructed as the
negative value of the sum of the λ per row:ij
From Markov chain mechanics, a T-year transition
matrix P(T) is derived from the generator matrix as
follows;
Where ΛT is the generator matrix multiplied by the
scalar T and exp() is the matrix exponential function. If
we want a one-year matrix, we simply evaluate exp(Λ)
but generating matrices for other horizons is just as
easy. The one-year transition matrix based on this
generator is given by applying the exponential
function to the generator. Assuming for a moment that
we have just four categories including default and NR,
the matrix exponential exp(ΛT) would then be of the
form:
We can evaluate the matrix exponential by truncating
the infinite sum at some suitable point. In our
application, we have to evaluate the matrix
exponential of a special type of matrix, the generator
matrix. On the diagonal, the generator matrix has
negative values equal to minus the sum of the off-
diagonal elements in the respective row. Adding up
large positive and negative numbers can lead to
numerical problems, in turn, rendering the truncated
sum unreliable. To avoid such a programmed function
which adjusts the generator to contain only positive
values, the idea is as follows:
We first find the maximal absolute on-diagonal
element of array1; denote this by
Empirical Study of Credit Rating Migration in India Empirical Study of Credit Rating Migration in India20 21
cities of India, and therefore street
Contents
mall farmers. Majority of the
farmers (82%) borrow less than
Rs 5 lakhs, and 18% borrow
between Rs 5 – 10 lakhs on a
per annum basis. Most farmers
(65.79%) ar
Table source heading
Table 23: The Results of Mann-Whitney U Test for DOWJONES Index Daily ReturnsDr. Rosy Kalra
Mr. Piyuesh Pandey
References

ISSN: 0971-1023 | NMIMS Management ReviewVolume XXXIV | Issue 1 | April 2017
ISSN: 0971-1023 | NMIMS Management ReviewVolume XXXIV | Issue 1 | April 2017
Then, we construct a diagonal matrix D = diag ( )
with as entries, i.e. multiply the identity matrix
by . Here, D is shown for the case of a 4 x 4 matrix:
The sum of the generator itself and the thus obtained
diagonal matrix contains only positive entries. Let us
call this matrix Λ* with Λ*= Λ + D. Since the identity
matrix commutes with any other matrix, we obtain:
Exp(Λ) = exp (Λ*- D) = exp (Λ*) x exp (-D) = exp (- ) x
exp (Λ*)
We have therefore reduced our problem to that of the
matrix exponential of Λ* with only positive entries.
DATA DESCRIPTION
Ratings are based on the following alphanumeric
scale: AAA (highest creditworthiness), AA, A, BBB, BB,
B, C, D (default); for the symbols “AA” to “C” the
modifiers “+” and “-” are used to indicate the relative
strength within the rating categories concerned. The
variable Issuer Rating exhibits variation at the issuer-
rater-year level and is defined as follows.
We first assign numerical values to the alphanumeric
debt instrument ratings with a value of one denoting
the highest credit rating “AAA” and the value 18
denoting “D”. Our sample spans 5 years 2012 -2017.
Credit ratings are available from CRISIL, ICRA, CARE,
Brickwork and India Ratings. We decide to only
concentrate on the ratings of ICRA and focussed on
non-structured instruments that are assigned long
term credit ratings. Data for credit rating changes is
collected from Bloomberg database. Data consists of
2,575 companies and their respective credit rating
transitions year-wise. The total number of ratings
covered in the database is 5,000. Year-wise break up
for the five-year period credit rating category wise is
shown in Table 10. Credit transition sample from the
data can be seen as follows:
Table 9:Sample Data from Bloomberg
Company Name Date Rating
20 Microns Nano Minerals Ltd. 8-Feb-13 BBB-
24/7 Customer Pvt. Ltd. 6-Dec-13 BBB+
24/7 Customer Pvt. Ltd. 16-Dec-14 BBB+
24/7 Customer Pvt. Ltd. 28-Apr-15 BBB+
3 F Industries Ltd. 8-Jan-13 BBB+
3 F Industries Ltd. 17-Jun-14 BBB+
3 F Industries Ltd. 20-Nov-15 BBB+
A 2 Z Infra Engg. Ltd. 31-Dec-15 D
A 2 Z Infraservices Ltd. 8-Jan-15 BB
A B C India Ltd. 7-Mar-14 BBB
A B C India Ltd. 3-Apr-15 BBB
A B T Ltd. 22-Apr-15 B
A C I L Ltd. 16-Apr-14 A
A C I L Ltd. 7-Aug-15 A
Table 10:Year-Wise Break Up of Ratings Data
2012 2013 2014 2015 2016 2017 Sum
AAA 4 4 15 14 5 1 43
AA+ 10 4 18 16 11 2 61
AA 13 16 34 28 27 13 131
AA- 12 17 32 31 39 6 137
A+ 40 23 35 64 48 3 213
A 28 50 40 48 33 7 206
A- 25 40 68 58 59 13 263
B+ 69 70 41 32 27 5 244
B 42 49 37 20 18 0 166
B- 19 27 12 7 7 1 73
BB+ 112 101 84 52 58 2 409
BB 86 112 64 50 34 5 351
BB- 55 77 43 38 30 3 246
BBB+ 57 84 66 85 49 8 349
BBB 83 80 99 85 67 15 429
BBB- 94 127 102 85 54 7 469
C 9 26 26 12 9 2 84
D 70 66 55 75 53 3 322
NR 47 50 169 172 357 9 804
875 1023 1040 972 985 105 5000
Empirical Study of Credit Rating Migration in India Empirical Study of Credit Rating Migration in India22 23
cities of India, and therefore street
Contents
mall farmers. Majority of the
farmers (82%) borrow less than
Rs 5 lakhs, and 18% borrow
between Rs 5 – 10 lakhs on a
per annum basis. Most farmers
(65.79%) ar
Table source heading
Table 23: The Results of Mann-Whitney U Test for DOWJONES Index Daily ReturnsDr. Rosy Kalra
Mr. Piyuesh Pandey
References

ISSN: 0971-1023 | NMIMS Management ReviewVolume XXXIV | Issue 1 | April 2017
ISSN: 0971-1023 | NMIMS Management ReviewVolume XXXIV | Issue 1 | April 2017
Table 11:Sample Compiled Data Table
Id No. Date Rating Symbol Rating Number
1 8-Feb-13 BBB- 4
2 6-Dec-13 BBB+ 4
3 8-Jan-13 BBB+ 4
3 16-Dec-14 BBB+ 4
3 28-Apr-15 BBB+ 4
4 17-Jun-14 BBB+ 4
4 20-Nov-15 BBB+ 4
4 31-Dec-15 D 8
5 8-Jan-15 BB 5
6 7-Mar-14 BBB 4
For calculation simplicity, companies have been identified by specifying 'ID No.'. The rating symbols have been
grouped into 'Rating Number' as explained below:
Table 12:Rating Categories
Rating Symbol Rating Number Rating Symbol Rating Number
NR 0 0 BBB 9 4
AAA 1 1 BBB- 10 4
AA+ 2 2 BB+ 11 5
AA 3 2 BB 12 5
AA- 4 2 BB- 13 5
A+ 5 3 B+ 14 6
A 6 3 B 15 6
A- 7 3 B- 16 6
BBB+ 8 4 C 17 7
D 18 8
Results & Interpretation
After running the VBA program of Cohort approach, we get the following result. The matrices mirror two empirical
findings common to the matrices published by rating agencies. First, diagonal entries are the highest. This means
the rating system is relatively stable. Second, default frequencies for the best two-rating classes are zero.
Cohort Approach
1-Year Transition Matrix
AAA AA A BBB BB B C D NR
1 2 3 4 5 6 7 8 NR
AAA 1 96.49% 0.00% 0.00% 0.00% 0.00% 0.00% 0.00% 0.00% 3.51%
AA 2 0.26% 97.66% 1.04% 0.26% 0.00% 0.00% 0.00% 0.00% 0.78%
A 3 0.00% 2.41% 92.76% 1.45% 0.12% 0.12% 0.00% 0.24% 2.90%
BBB 4 0.00% 0.27% 3.68% 88.84% 1.79% 0.33% 0.00% 0.76% 4.33%
BB 5 0.00% 0.00% 0.35% 3.70% 85.03% 1.21% 0.12% 1.85% 7.75%
B 6 0.00% 0.00% 0.12% 0.12% 3.74% 84.00% 1.17% 3.50% 7.36%
C 7 0.00% 0.00% 0.00% 0.00% 2.56% 4.27% 75.21% 10.26% 7.69%
D 8 0.00% 0.00% 0.00% 0.00% 0.00% 0.00% 0.00% 100.00% 0.00%
NR NR 0.00% 0.00% 0.00% 0.00% 0.00% 0.00% 0.00% 0.00% 100.00%
2-Year Transition Matrix
AAA AA A BBB BB B C D NR
1 2 3 4 5 6 7 8 NR
AAA 1 93.11% 0.00% 0.00% 0.00% 0.00% 0.00% 0.00% 0.00% 6.89%
AA 2 0.51% 95.39% 1.99% 0.50% 0.01% 0.00% 0.00% 0.00% 1.59%
A 3 0.01% 4.60% 86.13% 2.64% 0.24% 0.22% 0.00% 0.48% 5.68%
BBB 4 0.00% 0.59% 6.70% 79.05% 3.12% 0.59% 0.01% 1.49% 8.45%
BB 5 0.00% 0.02% 0.75% 6.44% 72.41% 2.07% 0.20% 3.51% 14.60%
B 6 0.00% 0.00% 0.22% 0.34% 6.35% 70.65% 1.86% 6.64% 13.93%
C 7 0.00% 0.00% 0.01% 0.10% 4.27% 6.83% 56.62% 18.17% 13.99%
D 8 0.00% 0.00% 0.00% 0.00% 0.00% 0.00% 0.00% 100.00% 0.00%
NR NR 0.00% 0.00% 0.00% 0.00% 0.00% 0.00% 0.00% 0.00% 100.00%
3-Year Transition Matrix
AAA AA A BBB BB B C D NR
1 2 3 4 5 6 7 8 NR
AAA 1 86.69% 0.00% 0.00% 0.00% 0.00% 0.00% 0.00% 0.00% 13.31%
AA 2 0.95% 91.09% 3.65% 0.93% 0.03% 0.01% 0.00% 0.03% 3.31%
A 3 0.03% 8.36% 74.45% 4.40% 0.48% 0.36% 0.01% 0.96% 10.94%
BBB 4 0.00% 1.34% 11.10% 62.87% 4.79% 0.96% 0.03% 2.84% 16.07%
BB 5 0.00% 0.10% 1.63% 9.78% 52.78% 3.01% 0.30% 6.32% 26.08%
B 6 0.00% 0.02% 0.42% 0.93% 9.18% 50.17% 2.39% 11.90% 25.00%
C 7 0.00% 0.00% 0.07% 0.43% 5.95% 8.79% 32.20% 29.06% 23.50%
D 8 0.00% 0.00% 0.00% 0.00% 0.00% 0.00% 0.00% 100.00% 0.00%
NR NR 0.00% 0.00% 0.00% 0.00% 0.00% 0.00% 0.00% 0.00% 100.00%
Empirical Study of Credit Rating Migration in India Empirical Study of Credit Rating Migration in India24 25
cities of India, and therefore street
Contents
mall farmers. Majority of the
farmers (82%) borrow less than
Rs 5 lakhs, and 18% borrow
between Rs 5 – 10 lakhs on a
per annum basis. Most farmers
(65.79%) ar
Table source heading
Table 23: The Results of Mann-Whitney U Test for DOWJONES Index Daily ReturnsDr. Rosy Kalra
Mr. Piyuesh Pandey
References

ISSN: 0971-1023 | NMIMS Management ReviewVolume XXXIV | Issue 1 | April 2017
ISSN: 0971-1023 | NMIMS Management ReviewVolume XXXIV | Issue 1 | April 2017
Hazard Rate Approach
The main point to note is that on-diagonal entries of the generator matrix are constructed as negative values of the
sum of the entries per row. After running the VBA program of Hazard approach, we get the following result:
4-Year Transition Matrix
AAA AA A BBB BB B C D NR
1 2 3 4 5 6 7 8 NR
AAA 1 75.15% 0.00% 0.00% 0.00% 0.00% 0.00% 0.00% 0.00% 24.85%
AA 2 1.70% 83.30% 6.15% 1.59% 0.11% 0.04% 0.00% 0.11% 7.01%
A 3 0.14% 13.90% 56.23% 6.17% 0.86% 0.51% 0.02% 1.88% 20.29%
BBB 4 0.02% 3.00% 15.38% 40.50% 5.68% 1.27% 0.06% 5.16% 28.92%
BB 5 0.00% 0.42% 3.18% 11.41% 28.63% 3.23% 0.33% 10.39% 42.42%
B 6 0.00% 0.08% 0.78% 1.98% 9.64% 25.67% 1.99% 19.17% 40.69%
C 7 0.00% 0.02% 0.26% 1.08% 5.88% 7.42% 10.59% 39.85% 34.89%
D 8 0.00% 0.00% 0.00% 0.00% 0.00% 0.00% 0.00% 100.00% 0.00%
NR NR 0.00% 0.00% 0.00% 0.00% 0.00% 0.00% 0.00% 0.00% 100.00%
5-Year Transition Matrix
AAA AA A BBB BB B C D NR
1 2 3 4 5 6 7 8 NR
AAA 1 56.47% 0.00% 0.00% 0.00% 0.00% 0.00% 0.00% 0.00% 43.53%
AA 2 2.70% 70.29% 8.83% 2.36% 0.27% 0.10% 0.00% 0.43% 15.03%
A 3 0.42% 19.59% 33.46% 6.30% 1.15% 0.53% 0.03% 3.47% 35.07%
BBB 4 0.10% 5.88% 15.25% 18.07% 4.19% 1.11% 0.08% 8.40% 46.92%
BB 5 0.02% 1.26% 4.50% 8.16% 9.20% 1.94% 0.20% 14.76% 59.96%
B 6 0.00% 0.30% 1.26% 2.48% 5.47% 7.08% 0.76% 26.00% 56.66%
C 7 0.00% 0.12% 0.59% 1.39% 3.09% 2.90% 1.29% 46.17% 44.47%
D 8 0.00% 0.00% 0.00% 0.00% 0.00% 0.00% 0.00% 100.00% 0.00%
NR NR 0.00% 0.00% 0.00% 0.00% 0.00% 0.00% 0.00% 0.00% 100.00%
Generator Matrix
AAA AA A BBB BB B C D NR
1 2 3 4 5 6 7 8 NR
AAA 1 -0.140 0.084 0.000 0.000 0.000 0.000 0.000 0.000 0.056
AA 2 0.013 -0.112 0.071 0.013 0.003 0.000 0.000 0.000 0.013
A 3 0.000 0.039 -0.192 0.099 0.010 0.000 0.000 0.004 0.040
BBB 4 0.000 0.004 0.045 -0.164 0.054 0.004 0.000 0.009 0.048
BB 5 0.000 0.000 0.004 0.063 -0.206 0.025 0.003 0.028 0.082
B 6 0.000 0.000 0.001 0.003 0.058 -0.211 0.015 0.059 0.075
C 7 0.000 0.000 0.000 0.020 0.081 0.101 -0.525 0.222 0.101
D 8 0.000 0.000 0.000 0.000 0.000 0.000 0.000 0.000 0.000
NR NR 0.005 0.017 0.059 0.172 0.216 0.125 0.015 0.081 -0.690
1-Year
AAA AA A BBB BB B C D NR
1 2 3 4 5 6 7 8 NR
AAA 1 87.00% 7.45% 0.38% 0.42% 0.46% 0.26% 0.03% 0.19% 3.81%
AA 2 1.12% 89.63% 6.17% 1.51% 0.40% 0.07% 0.01% 0.07% 1.03%
A 3 0.03% 3.37% 82.95% 8.63% 1.40% 0.22% 0.02% 0.54% 2.84%
BBB 4 0.01% 0.47% 3.91% 85.53% 4.95% 0.62% 0.03% 1.06% 3.41%
BB 5 0.02% 0.07% 0.62% 5.84% 82.26% 2.47% 0.28% 2.90% 5.55%
B 6 0.01% 0.05% 0.28% 0.93% 5.33% 81.42% 1.12% 5.75% 5.10%
C 7 0.02% 0.07% 0.26% 2.26% 6.64% 7.53% 59.25% 17.94% 6.04%
D 8 0.00% 0.00% 0.00% 0.00% 0.00% 0.00% 0.00% 100.00% 0.00%
NR NR 0.34% 1.31% 4.23% 12.18% 14.70% 8.39% 0.89% 6.59% 51.37%
Empirical Study of Credit Rating Migration in India Empirical Study of Credit Rating Migration in India26 27
cities of India, and therefore street
Contents
mall farmers. Majority of the
farmers (82%) borrow less than
Rs 5 lakhs, and 18% borrow
between Rs 5 – 10 lakhs on a
per annum basis. Most farmers
(65.79%) ar
Table source heading
Table 23: The Results of Mann-Whitney U Test for DOWJONES Index Daily ReturnsDr. Rosy Kalra
Mr. Piyuesh Pandey
References

ISSN: 0971-1023 | NMIMS Management ReviewVolume XXXIV | Issue 1 | April 2017
ISSN: 0971-1023 | NMIMS Management ReviewVolume XXXIV | Issue 1 | April 2017
The main observation is that when we compare the
two approaches, the hazard rate results show the
probability of default for each category is slightly lower
than the findings of the cohort approach. This is
expected due to the richness of the hazard rate
approach of using all data points compared to the
cohort approach which does not use all the
information.
Conclusion
The analysis of corporate credit quality is a major
consideration in terms of investment evaluation. It is in
the interest of investors to be aware of credit quality
since no investor wishes to suffer loss due to decline in
rating quality. Two indicators that can be monitored to
evaluate credit quality are rating activity and rating
drift. These two indicators can highlight rating
movement trends and can provide an indication of the
creditworthiness of bond issuers. This paper presents
an estimation of credit quality transition matrices
using both cohort approach and hazard rate approach.
Being able to conduct this type of exercise becomes an
important tool for lending institutions as they would
be able to estimate and forecast the default probability
of their debtors and the provisions they must hold.
Notes
1. The transition matrix methodology applied to credit
ratings literature largely begins with Jarrow, Lando
and Turnbull (1997) and further refinements made
by Lando and Skodeberg (2002). Finding generator
matrices with applications to credit ratings is
credited to Israel et al (2001). Empirical stylized
facts present in transition matrices are discussed
by Altman et al (1992). The dependence of
migrations on credit cycles is analyzed by Nickell et
al. (2000).
2. The VBA codes used in this paper are largely
modified versions of codes used by Loffler and
Posch (2007).
3. The transition matrix methodology section largely
draws from Loffler and Posch (2007).
4. I would like to thank Shantanu Tammewar and
Apoorv Gupta for Research Assistance in
completing this paper.
5. I would like to thank Dr. Neeraj Hartekar and
Dr. Anuradha Patnaik for their comments to a
Preliminary version of this paper.
2-Year
AAA AA A BBB BB B C D NR
1 2 3 4 5 6 7 8 NR
AAA 1 75.78% 13.22% 1.29% 1.37% 1.41% 0.78% 0.08% 0.65% 5.42%
AA 2 1.99% 80.64% 10.75% 3.33% 1.00% 0.25% 0.02% 0.27% 1.75%
A 3 0.10% 5.89% 69.48% 15.02% 3.19% 0.69% 0.07% 1.33% 4.23%
BBB 4 0.04% 1.00% 6.80% 74.22% 8.89% 1.46% 0.10% 2.39% 5.09%
BB 5 0.05% 0.25% 1.49% 10.55% 68.93% 4.57% 0.48% 5.90% 7.78%
B 6 0.04% 0.18% 0.75% 2.54% 9.60% 66.95% 1.64% 11.13% 7.17%
C 7 0.05% 0.21% 0.78% 4.49% 10.80% 11.28% 35.26% 29.62% 7.52%
D 8 0.00% 0.00% 0.00% 0.00% 0.00% 0.00% 0.00% 100.00% 0.00%
NR NR 0.49% 2.08% 6.35% 18.02% 20.82% 11.65% 1.13% 11.20% 28.25%
3-Year
AAA AA A BBB BB B C D NR
1 2 3 4 5 6 7 8 NR
AAA 1 66.10% 17.61% 2.47% 2.55% 2.49% 1.34% 0.13% 1.28% 6.01%
AA 2 2.64% 72.82% 14.11% 5.27% 1.74% 0.48% 0.05% 0.59% 2.30%
A 3 0.19% 7.76% 58.79% 19.64% 5.03% 1.25% 0.12% 2.30% 4.94%
BBB 4 0.07% 1.55% 8.88% 65.24% 11.92% 2.32% 0.17% 3.91% 5.93%
BB 5 0.08% 0.48% 2.44% 14.18% 58.66% 6.18% 0.60% 8.88% 8.49%
B 6 0.07% 0.34% 1.28% 4.34% 12.76% 55.49% 1.81% 16.05% 7.84%
C 7 0.08% 0.38% 1.35% 6.36% 13.16% 12.76% 21.11% 37.45% 7.35%
D 8 0.00% 0.00% 0.00% 0.00% 0.00% 0.00% 0.00% 100.00% 0.00%
NR NR 0.55% 2.59% 7.46% 20.78% 22.97% 12.59% 1.12% 14.76% 17.17%
4-Year
AAA AA A BBB BB B C D NR
1 2 3 4 5 6 7 8 NR
AAA 1 57.72% 20.89% 3.77% 3.83% 3.55% 1.87% 0.18% 2.03% 6.16%
AA 2 3.13% 66.00% 16.52% 7.22% 2.56% 0.75% 0.07% 1.01% 2.74%
A 3 0.29% 9.11% 50.26% 22.89% 6.76% 1.82% 0.16% 3.40% 5.31%
BBB 4 0.11% 2.08% 10.35% 58.03% 14.17% 3.13% 0.24% 5.55% 6.33%
BB 5 0.12% 0.75% 3.35% 16.88% 50.61% 7.33% 0.67% 11.77% 8.53%
B 6 0.11% 0.52% 1.83% 6.09% 14.96% 46.32% 1.80% 20.51% 7.87%
C 7 0.11% 0.54% 1.87% 7.82% 14.32% 12.97% 12.76% 42.91% 6.69%
D 8 0.00% 0.00% 0.00% 0.00% 0.00% 0.00% 0.00% 100.00% 0.00%
NR NR 0.58% 2.96% 8.07% 22.03% 23.31% 12.49% 1.03% 17.75% 11.77%
5-Year
AAA AA A BBB BB B C D NR
1 2 3 4 5 6 7 8 NR
AAA 1 50.48% 23.25% 5.07% 5.14% 4.53% 2.34% 0.21% 2.86% 6.12%
AA 2 3.48% 60.01% 18.20% 9.10% 3.42% 1.05% 0.09% 1.54% 3.11%
A 3 0.39% 10.06% 43.42% 25.12% 8.33% 2.37% 0.20% 4.60% 5.52%
BBB 4 0.16% 2.59% 11.35% 52.19% 15.80% 3.83% 0.30% 7.28% 6.51%
BB 5 0.15% 1.02% 4.18% 18.81% 44.21% 8.10% 0.71% 14.54% 8.29%
B 6 0.14% 0.70% 2.34% 7.68% 16.38% 38.93% 1.70% 24.52% 7.61%
C 7 0.13% 0.71% 2.34% 8.92% 14.72% 12.49% 7.81% 46.90% 5.99%
D 8 0.00% 0.00% 0.00% 0.00% 0.00% 0.00% 0.00% 100.00% 0.00%
NR NR 0.59% 3.25% 8.42% 22.52% 22.86% 11.97% 0.93% 20.38% 9.07%
Empirical Study of Credit Rating Migration in India Empirical Study of Credit Rating Migration in India28 29
cities of India, and therefore street
Contents
mall farmers. Majority of the
farmers (82%) borrow less than
Rs 5 lakhs, and 18% borrow
between Rs 5 – 10 lakhs on a
per annum basis. Most farmers
(65.79%) ar
Table source heading
Table 23: The Results of Mann-Whitney U Test for DOWJONES Index Daily ReturnsDr. Rosy Kalra
Mr. Piyuesh Pandey
References

ISSN: 0971-1023 | NMIMS Management ReviewVolume XXXIV | Issue 1 | April 2017
• Altman, E. I. (1968): Financial Ratios, Discriminant Analysis and the Prediction of Corporate Bankruptcy. The
Journal of Finance, 23, 589-609.
• Altman, E. and Kao, D. (1992): Rating drift of high yield bonds, Journal of Fixed Income, 15-20.
• Bangia, A., Diebold, F. X., Kronimus, A., Schagen, C., & Schuermann, T. (2002): Ratings migration and the
business cycle, with application to credit portfolio stress testing. Journal of Banking & Finance, 26, 445-474.
• Beaver, W. H. (1966): Financial Ratios As Predictors of Failure. Journal of Accounting Research, 4 , 71-111.
• Christensen, J., Hansen, E. and Lando, D. (2004): Confidence sets for continuous time rating transition
probabilities, Journal of Banking & Finance 28, 2575-2602.
• Figlewski, S., Frydman, H., & Liang, W. (2012): Modeling the effect of macroeconomic factors on corporate
default and credit rating transitions. International Review of Economics & Finance, 21, 87-105.
• Frydman, H., & Schuermann, T. (2008). Credit rating dynamics and Markov mixture models. Journal of Banking
& Finance, 32, 1062-1075.
• Hanson, S. and Schuermann, T. (2006): Confidence intervals for probabilities of default, Journal of Banking and
Finance 30, 2281-2301.
• Hamilton, D. T., & Cantor, R. (2004): Rating Transition and Default Rates Conditioned on Outlooks. The Journal
of Fixed Income, 14, 54-70.
• Israel, R., Rosenthal, J. and Wei., J. (2001): Finding generators for Markov chains via empirical transitions
matrices, with applications to credit ratings, Mathematical Finance 11, 245- 265.
• Jafry, Y., & Schuermann, T. (2004): Measurement, estimation and comparison of credit migration matrices.
Journal of Banking & Finance, 28, 2603-2639.
• Jarrow, R.A., Lando, D. Turnbull, S.M. (1997): A Markov chain model for valuing credit risk derivatives, Journal
of Derivatives, 97-108.
• Kavvathas, D. (2000): Estimating Credit Rating Transition Probabilities for Corporate Bonds.
• Kiefer, N. M., & Larson, C. E. (2007): A simulation estimator for testing the time homogeneity of credit rating
transitions. Journal of Empirical Finance, 14, 818-835.
• Lando, D. and Skodeberg, T. (2002): Analyzing ratings transitions and rating drift with continuous observations,
Journal of Banking and Finance 26, 423-444.
• Loffler, G. And Posch, Peter N. (2007): Credit Risk Model Using Excel & VBA, John Wiley & Sons Ltd.
• Lando, D. (2004): Credit Risk Modelling, Princeton University Press.
• Nickell, P. Perraudin, W. and Varotto, S. (2000): Stability of ratings transition, Journal of Banking and Finance
24, 203-227.
References
Debasish Ghosh is Associate Professor, Finance, at the School of Business Management, NMIMS
University, for the last 14 years. His teaching interests include investments in fixed income, derivatives &
equity securities, and their risk management. His research interests include credit risk management and
intraday trading data analysis using tools like VBA Excel, R and Python. He can be reached at
Empirical Study of Credit Rating Migration in India
Perceived Risk in E-Commerce:A Demographic Perspective
Jitendra K. Sharma
Daisy Kurien
Abstract
The e-commerce market in India is witnessing
exponential growth since the last decade. With the
emergence of better marketing techniques, it is
expected to grow in leaps and bounds in future. As per
IAMAI Digital Commerce 2016, the e-commerce
market was valued at INR 1,25,732 crore in December
2015, which is expected to reach INR 2,11,005 crore in
December 2016. As per the IAMAI data, the e-
commerce market grew at 30% between 2011 and
December 2015.
In spite of the growth, one has to accept that the e-
commerce industry is still struggling to create a niche
in India. The industry is still at a nascent stage of the
technology acceptance curve. Majority of its
revenues and growth comes from eight metros of
India. Huge deviations are found in terms of its
acceptance in big cities too. The reason for relatively
slow growth of the e-commerce industry is perceived
risk that consumers feel while buying any product or
service online.
In order to grab the untapped opportunity of e-
commerce in the Indian market, marketers need to
understand issues related to perceived risk and
tactfully handle this sensitive issue.
The research paper tries to identify possible perceived
risks that customers feel while buying from e-
commerce websites. The paper is based on extensive
literature review conducted on e-commerce risk and
primary research conducted in Ahmedabad. Primary
research was conducted with the help of mixed
method research. First, qualitative research was
conducted, which was then followed by quantitative
research. This paper highlights the impact of
demographic profile of respondents on perceived risk.
The study reveals that of the seven identified risks,
impact of performance and financial risk were
significant among e-users in India. System related
perceived risk was found to be negligible among Indian
consumers. The research concludes that of the
demographic variables, gender and income levels have
a significant relationship with perceived risk. It was
also found that approximately all risks are perceived
equally by different occupation/professional group
segments. This research study does not support the
argument made in earlier research work that
education and risk-taking ability are inversely
proportional.
Key words: E-commerce, Perceived Risk, Demography,
Challenges, Suggestions
ISSN: 0971-1023 | NMIMS Management ReviewVolume XXXIV | Issue 1 | April 2017
Perceived Risk in E-Commerce: A Demographic Perspective30 31
cities of India, and therefore street
Contents
mall farmers. Majority of the
farmers (82%) borrow less than
Rs 5 lakhs, and 18% borrow
between Rs 5 – 10 lakhs on a
per annum basis. Most farmers
(65.79%) ar
Table source heading
Table 23: The Results of Mann-Whitney U Test for DOWJONES Index Daily ReturnsDr. Rosy Kalra
Mr. Piyuesh Pandey
References