a study of global warming in malaysia · a study of global warming in malaysia 7 y = 0.0284x -...
TRANSCRIPT

A STUDY OF GLOBAL WARMING IN MALAYSIA 1
Jurnal Teknologi, 42(F) Jun. 2005: 1–10© Universiti Teknologi Malaysia
1,2&3Faculty of Civil Engineering, Universiti Teknologi Malaysia, 81300 Skudai, Johor, Malaysia.*Corresponding author: Tel : 07-5531701
A STUDY OF GLOBAL WARMING IN MALAYSIA
NG MENG WAI1, ALEJANDRO CAMERLENGO2* &AHMAD KHAIRI ABDUL WAHAB3
Abstract. The aim of this investigation is to study the global warming trend in Malaysia. Thisinvestigation uses approximately 50 years of temperature data set. Least square regression line, coupledwith null hypothesis tests were carried out to detect any significant trend. The most significant resultsof this investigation are: (a) a significant increase of the mean annual temperature, ranging from 0.99to 3.44°C per 100 years is forecasted, and (b) the mean annual temperature regression lines (for all theanalyzed stations) exhibit that the global warming trend has increased in the past 30 years. This lastresult shows a perfect agreement with the latest report of the Intergovernmental Panel of ClimaticChange (IPCC).
Keywords: Global warming, Malaysia, temperature, significant trend, regression
Abstrak. Tujuan penyelidikan ini adalah untuk mengkaji tren pemanasan global di Malaysia.Data suhu sebanyak 50 tahun telah digunakan. Garis regresi kuasa dua terkecil dan ujian hipotesis noltelah digunakan untuk mengesan sebarang corak yang bererti. Keputusan yang paling nyata bagipenyelidikan ini ialah: (a) peningkatan yang nyata dalam suhu purata tahunan terletak antara 0.99°Cke 3.44°C bagi 100 tahun telah diramalkan, dan (b) garis regresi suhu purata tahunan (bagi kesemuastesen dikaji) menunjukkan tren pemanasan suhu telah meningkat dalam tempoh 30 tahun lalu.Keputusan ini menunjukkan persetujuan dengan laporan terbaru Intergovernmental Panel of ClimaticChange.
Kata kunci: Pemanasan global, Malaysia, suhu, corak bererti, regresi
1.0 INTRODUCTION
The temperature distribution of Jakarta has been analyzed [1]. In that particular study,using a data ranging from 1866 to 1993, the global warming increase of Jakarta was1.64°C.
Jakarta is located at approximately 6 degrees south. Therefore, a wet season followedby a dry season pattern is perfectly defined. This is not the case of Malaysia whereFebruary and June represent the “driest” months of Peninsular Malaysia. In spite ofthis, few stations in Malaysia register an average monthly rainfall lower than 100 mm(which is not the case of Jakarta).
Untitled-2 02/17/2007, 01:341

NG MENG WAI, ALEJANDRO CAMERLENGO & AHMAD KHAIRI ABDUL WAHAB2
A previous study analyzed the distribution of temperature, sea level pressure,evaporation, and insolation in East Malaysia [2]. Given the fact that Malaysia gainedits independence in not more than 60 years, the collected temperature data set of EastMalaysia is quite recent. Thus, in that particular study, only thirty years of data hasbeen available. Nevertheless, the results of [2] show a perfect agreement with thetemperature forecast for the next 100 years according with the IPCC latest report [3].This is due to the fact that the global warming rate has greatly increased in the last 30years [3].
This study represents both an extension of [1] and a continuation of [2].
2.0 DATA
The results of our study are expected to be different from [2] if we adopt data for alonger time period. For the sake of completeness, the present investigation will useapproximately 50 years of temperature data, provided mainly by the Global HistoricalClimate Network [4]. A second source of data is provided by the MalaysianMeteorological Service [5]. Efforts were made to find stations representing all thegeographical area of Malaysia. In Peninsular Malaysia, Penang and Kuala Lumpurwere selected to be the representation of the West Coast, Kota Bahru of the EastCoast, and Cameron Highland of highlands area. In East Malaysia, Kuching andKota Kinabalu were selected to represent Sarawak and Sabah, respectively. Thelocations of the stations as well as the geographical coordinates are shown in Figure 1and Table 1, respectively.
Table 1 Geographic coordinates of the stations
No. Station Latitude (°N) Longitude (°N) Height (m)
1 Penang 05° 18’ 100°16’ 2.8
2 Kota Bahru 06° 10’ 102° 17’ 4.6
3 Kuala Lumpur 03° 07’ 101° 33’ 16.5
4 Cameron Highland 04° 28’ 101° 22’ 1545.0
5 Kuching 01° 29’ 110° 20’ 21.7
6 Kota Kinabalu 05° 56’ 116° 03’ 2.3
3.0 METHODOLOGY
3.1 Secular Trend Analysis
The analysis of:
Untitled-2 02/17/2007, 01:342

A STUDY OF GLOBAL WARMING IN MALAYSIA 3
Figure 1 Location of the stations
Kota Kinabalu
Kota Bahru
Penang
Kuala Lumpur
CameronHighland
N
N
Kuching
Untitled-2 02/17/2007, 01:343

NG MENG WAI, ALEJANDRO CAMERLENGO & AHMAD KHAIRI ABDUL WAHAB4
(i) the regression lines of the mean annual value for the longest available yearspan,
(ii) the regression lines of the mean annual value for the past 30 years, oftemperature has been made.
The regression lines of the mean annual value are plotted to determine whetherthere is any (increasing/decreasing) trend. The increasing/decreasing rate is thenobtained from the slope of the linear regression equation. Due to the fact that theregression lines are plotted by using mean annual value, the seasonal (or monthly)effect is absent. Figure 2 shows the regression line of the mean annual temperature ofKuala Lumpur for the period of 1951-2001.
The correlation coefficients that are obtained from the regression line are tested fortheir statistical significance before any reasonable conclusion may be drawn. This isprimarily due to the fact that such correlations are calculated from the sample dataand therefore, subject to sampling error. It is essential to check whether the computedcorrelation is meaningful or it is merely a false value due to sampling error. Therefore,the Null Hypotheses Testing for the correlation coefficient of Kuala Lumpur meanannual temperature regression line is done.
y = 0.0269x - 26.406R = 0.700
29.0
28.5
25.5
26.0
26.5
27.0
27.5
28.0
1950 1955 1960 1965 1970 1975 1980 1985 1990 1995 2000 2005
Year
Tem
pera
ture
(°C
)
Figure 2 The regression line of the mean annual temperature of Kuala Lumpur from 1951-2001
y = 0.0269x – 26.406R = 0.700
It is convenient to define the null hypotheses and alternative hypothesis asfollows:
Null hypothesis, H0: ρ = 0 (no significant relationship between the twovariables)
Alternative hypotheses, H1: ρ ≠ 0 (The relationship between the two variablesis significant)
Untitled-2 02/17/2007, 01:344

A STUDY OF GLOBAL WARMING IN MALAYSIA 5
where ρ represents the population correlation coefficient; r, (= 0.696 in our case) thesample correlation coefficient; and n (=51), the extent of the sample.
For a sample larger than 30, the distribution of the sample correlation coefficient
estimate, r, is normal with a mean of ρ and a standard error −−
212
rn
[6].
Therefore, a z-test is conducted to test the hypotheses with respect to significance ofsuch statistics. The test statistics is given by:
21/{ }
2r
z rn−=−
that may be compared against normal distribution table values (or z distribution) at adesired level of significance.
This analysis is made to determine as to whether the sample correlation coefficient,r, is significantly different from zero, that is to say, are the variables truly related [6].
Furthermore, by taking a 5 % level of significance (95 % confidence level) that isperfectly adequate for our purpose. Therefore, the
Standard error of r, S.E. 2 21 1 0.696
0.1032 51 2
rr
n− −= = =− −
Thus, the test statistics
0.696 / 0.103 6.79z = =
The table values of the standard normal z distribution at a 5 % level of significance(95% confidence level) are approximately –1.96 and 1.96. Given the fact that thecalculated value, 6.79, is numerically larger than 1.96, the null hypothesis is rejected.In summary, the alternative hypothesis is accepted. This, in turn implies that there is asignificant relationship between the two variables.
Following Figure 2, if a similar analysis is done for the period of 1971-2001, i.e. 30years, the warming rate for Kuala Lumpur is 6.3°C/100 years as compared to the warmingrate of 2.7°C/100 years obtained previously. The Pearson correlation coefficient of0.886 shows that the warming rate for the past 30 years is very significant. This point tothe fact that “the global warming rate has greatly increased for the past 30 years”, assuggested by [3], is significant in Malaysia.
4.0 DISCUSSION OF RESULTS
4.1 Mean Annual Temperature Regression Line
Global warming has been studied using the linear analysis. While Figure 2 representsKuala Lumpur, Figures 3-7 show the regression line of the mean annual temperaturefor the other five selected stations.
Untitled-2 02/17/2007, 01:345

NG MENG WAI, ALEJANDRO CAMERLENGO & AHMAD KHAIRI ABDUL WAHAB6
The regression lines of the mean annual temperature of the selected meteorologicalstations are plotted and the Pearson correlation coefficients are tested for its statisticalsignificance with the null hypothesis test (Table 2).
Table 2 shows that all Pearson correlation coefficients are statistical significant at a95% confidence level. Therefore, the results are statistically significant.
It is observed that in Peninsular Malaysia, the global warming ranges from 0.99 to2.69°C/100 year. Kuala Lumpur has the highest warming trend with 2.69°C/100 year.This may be due to the fact that Kuala Lumpur, as a developed urban area, wasexperiencing a double effect: the urban heat-island effect and global warming. The
y = 0.0175x - 7.4064R = 0.752
y = 0.0165x - 5.8137R = 0.686
Figure 3 The regression line of the mean annual temperature of Penang from 1951-2001
Figure 4 The regression line of the mean annual temperature of Kota Bahru from 1951-2001
28.5
26.0
26.5
27.0
27.5
28.0
1950 1955 1960 1965 1970 1975 1980 1985 1990 1995 2000 2005
Year
Tem
pera
ture
(°C
)
25.5
26.0
26.5
27.0
27.5
28.0
1950 1955 1960 1965 1970 1975 1980 1985 1990 1995 2000 2005
Year
Tem
pera
ture
(°C
)
y = 0.0175x – 7.4064R = 0.752
y = 0.0165x – 5.8137R = 0.686
Untitled-2 02/17/2007, 01:346

A STUDY OF GLOBAL WARMING IN MALAYSIA 7
y = 0.0284x - 30.507
R = 0.667
y = 0.0099x - 1.8507R = 0.409
0
2
4
6
8
0
2
4
6
y = 0.0344x - 41.221R = 0.844
Figure 5 The regression line of the mean annual temperature of Kota Kinabalu from 1951-2001
Figure 6 The regression line of the mean annual temperature of Kuching from 1951-2001
Figure 7 The regression line of the mean annual temperature of Cameron Highland from 1951-2001
28.5
25.5
26.0
26.5
27.0
27.5
28.0
1960 1965 1970 1975 1980 1985 1990 1995 2000 2005
Year
Tem
pera
ture
(°C
)
26.8
25.6
25.8
26.0
26.2
26.4
26.6
1980 1985 1990 1995 2000 2005
Year
Tem
pera
ture
(°C
)
18.2
17.0
17.2
17.4
17.6
17.8
18.0
1960 1965 1970 1975 1980 1985 1990 1995 2000 2005
Year
Tem
pera
ture
(°C
)
18.4
18.6
y = 0.0099x – 1.8507R = 0.409
y = 0.0284x – 30.507R = 0.667
y = 0.0344x – 41.221R = 0.844
Untitled-2 02/17/2007, 01:347
NG MENG WAI, ALEJANDRO CAMERLENGO & AHMAD KHAIRI ABDUL WAHAB8
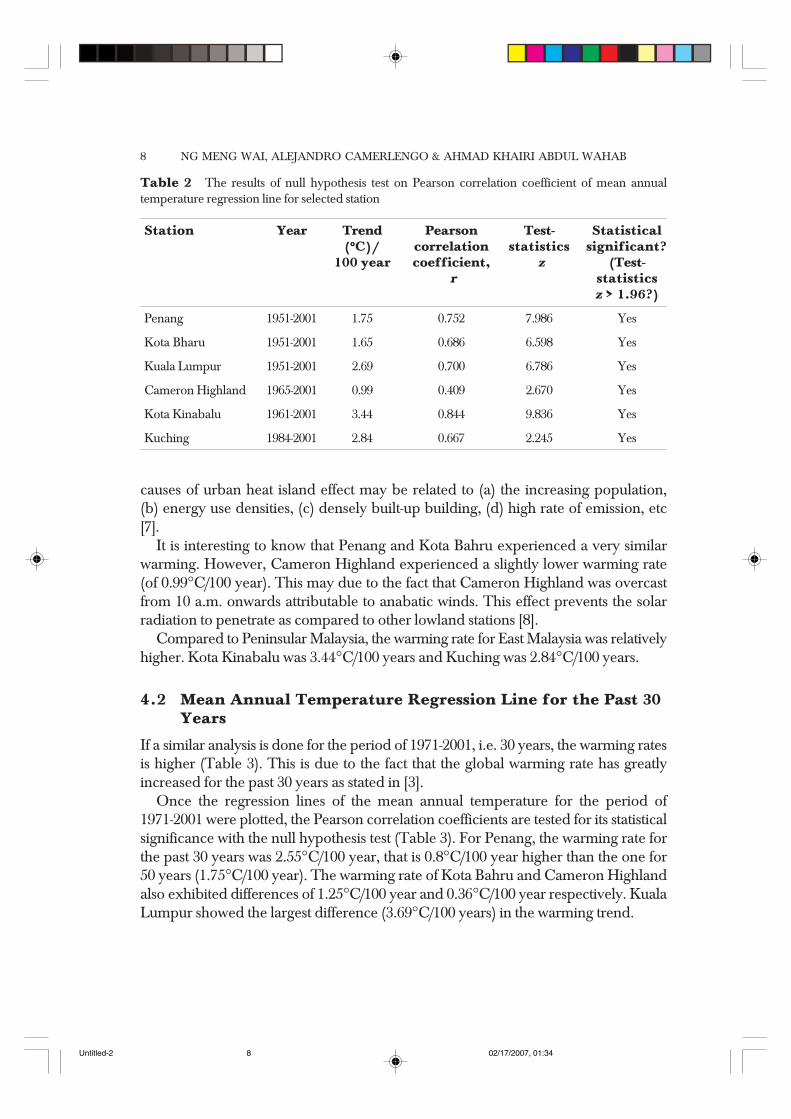
Table 2 The results of null hypothesis test on Pearson correlation coefficient of mean annualtemperature regression line for selected station
Station Year Trend Pearson Test- Statistical(°°°°°C)/ correlation statistics significant?
100 year coefficient, z (Test- r statistics
z > 1.96?)
Penang 1951-2001 1.75 0.752 7.986 Yes
Kota Bharu 1951-2001 1.65 0.686 6.598 Yes
Kuala Lumpur 1951-2001 2.69 0.700 6.786 Yes
Cameron Highland 1965-2001 0.99 0.409 2.670 Yes
Kota Kinabalu 1961-2001 3.44 0.844 9.836 Yes
Kuching 1984-2001 2.84 0.667 2.245 Yes
causes of urban heat island effect may be related to (a) the increasing population,(b) energy use densities, (c) densely built-up building, (d) high rate of emission, etc[7].
It is interesting to know that Penang and Kota Bahru experienced a very similarwarming. However, Cameron Highland experienced a slightly lower warming rate(of 0.99°C/100 year). This may due to the fact that Cameron Highland was overcastfrom 10 a.m. onwards attributable to anabatic winds. This effect prevents the solarradiation to penetrate as compared to other lowland stations [8].
Compared to Peninsular Malaysia, the warming rate for East Malaysia was relativelyhigher. Kota Kinabalu was 3.44°C/100 years and Kuching was 2.84°C/100 years.
4.2 Mean Annual Temperature Regression Line for the Past 30Years
If a similar analysis is done for the period of 1971-2001, i.e. 30 years, the warming ratesis higher (Table 3). This is due to the fact that the global warming rate has greatlyincreased for the past 30 years as stated in [3].
Once the regression lines of the mean annual temperature for the period of1971-2001 were plotted, the Pearson correlation coefficients are tested for its statisticalsignificance with the null hypothesis test (Table 3). For Penang, the warming rate forthe past 30 years was 2.55°C/100 year, that is 0.8°C/100 year higher than the one for50 years (1.75°C/100 year). The warming rate of Kota Bahru and Cameron Highlandalso exhibited differences of 1.25°C/100 year and 0.36°C/100 year respectively. KualaLumpur showed the largest difference (3.69°C/100 years) in the warming trend.
Untitled-2 02/17/2007, 01:348

A STUDY OF GLOBAL WARMING IN MALAYSIA 9
Table 3Table 3Table 3Table 3Table 3 Summary of mean annual temperature regression line for the past 30 years (1971-2001)
Station Statistical significant Trend (°°°°°C/100 year)at 95% confidence level?
Penang Yes 2.55
Kota Bharu Yes 2.90
Kuala Lumpur Yes 6.33
Cameron Highland Yes 1.35
Kota Kinabalu Yes 2.93
5.0 CONCLUSION
The temperature trend in Malaysia, due to global warming is addressed in this particularpaper. The most significant results of this study are:
(1) A significant increase of the mean annual temperature ranging from 0.99 to 3.44°Cper 100 years is observed.
(2) The mean annual temperature regression lines for all stations exhibit that thewarming trend has greatly increased significantly in the past 30 years, with valuesranging from 1.35 to 6.33°C per 100 years. This show perfect agreement with thelatest report of the IPCC [3].
ACKNOWLEDGEMENTS
This research has been supported by the no.74086 IRPA grant. The authors gracefullyacknowledge this support. Our thanks are also extended to the MalaysianMeteorological Service for providing us the necessary data to carry out this investigation.
REFERENCES[1] Harger, J. R. E. 1995. Air-temperature Variations and ENSO Effects in Indonesia, the Philippines and El
Salvador. ENSO Patterns and Changes from 1866-1993. Atmosph. Environ. 16: 1919-1942.[2] Camerlengo, A. L., M. N. Saadon, Y. R. Lim, N. Somchit, and M. Mahathir. 1999. Variability of the
Temperature, Evaporation, Insolation and Sea Level Pressure Distributions in East Malaysia. ASEAN Journalof Science & Technology for Development. 16(2): : : : : 39-58.
[3] Houghton, J. T., Y. Ding, D. J., Griggs, M., Noguer, P. J. van der Linden, and X. Dai. 2001. Climate Change2001: The Scientific Basis. Contribution of Working Group I to the Third Assessment Report of the IntergovernmentalPanel on Climate Change (IPCC). New York: Cambridge University Press.
[4] Vose, R. S., P. M., Schmoyer, R. L., Peterson, T. C., Steurer, R., Heim, T. R., Karl, and J. K. Eischeid. 1992.The GHCN: Long-term Monthly Temperature, Precipitation, Sea Level Pressure, and Station Pressure Data.ORNL/CDIAC-53, NDP-41.
Untitled-2 02/17/2007, 01:349

NG MENG WAI, ALEJANDRO CAMERLENGO & AHMAD KHAIRI ABDUL WAHAB10
[5] Malaysian Meteorological Service. Ministry of Science, Technology & Innovation. Monthly Summary ofMeteorological Observations (1965-98). Issued under the authority of the Director General, MalaysianMeteorlogical Service. Petaling Jaya, Malaysia.
[6] Sufi, M. N. 1988. Applied Time Series Analysis for Business and Economic Forecasting. New York: MarcelDekker Inc.
[7] Sham, S. 1980. The Climate of Kuala Lumpur: Petaling Jaya Area, Malaysia. Bangi: Penerbit UKM.[8] Camerlengo, A. L., A. K. Abd. Wahab, H. Noor Baharim, K. A. M. Nasir, and Y. R. Lim. 2003. Climatological
Distribution of Certain Meteorological Parameters in the Highland Areas and the Lowland Areas of PeninsularMalaysia. Malaysian Journal of Physics. 24(1): 39-49.
Untitled-2 02/17/2007, 01:3410