a study into western australia's open access and wetline
TRANSCRIPT

Fisheries Western Australia
Fisheries Research DivisionWA Marine Research Laboratories
PO Box 20 NORTH BEACHWestern Australia 6020
A study into Western Australia's open access andwetline fisheries
FISHERIES RESEARCH REPORT NO. 118, 1999
F. Crowe, W. Lehre and R.C.J. Lenanton
Integrating fisheries management Fish for the future

Fisheries Research ReportTitles in the fisheries research series contain technical and scientificinformation that represents an important contribution to existing knowledge,but which may not be suitable for publication in national or internationalscientific journals.
Fisheries Research Reports may be cited as full publications. The correctcitation appears with the abstract for each report.
Numbers 1-80 in this series were issued as Reports. Numbers 81-82were issued as Fisheries Reports, and from number 83 the series hasbeen issued under the current title.
EnquiriesFisheries Western Australia3rd floor SGIO Atrium168-170 St George’s TerracePERTH WA 6000Telephone (08) 9482 7333Facsimile (08) 9482 7389Website: http://www.wa.gov.au/westfish/res
Published byFisheries Western AustraliaPerth, Western AustraliaDecember 1999ISSN: 1035 - 4549ISBN: 0 7309 8434 6
An electronic copy of this report will be available at the above websitewhere parts may be shown in colour where this is thought to improveclarity.
Fisheries research in Western AustraliaThe Fisheries Research Division of Fisheries Western Australia is basedat the Western Australian Marine Research Laboratories, P.O. Box 20,North Beach (Perth), Western Australia, 6020. The Marine ResearchLaboratories serve as the centre for fisheries research in the State ofWestern Australia.
Research programs conducted by the Fisheries Research Division andlaboratories investigate basic fish biology, stock identity and levels,population dynamics, environmental factors, and other factors related tocommercial fisheries, recreational fisheries and aquaculture. The FisheriesResearch Division also maintains the State data base of catch and effortfisheries statistics.
The primary function of the Fisheries Research Division is to providescientific advice to government in the formulation of management policiesfor developing and sustaining Western Australian fisheries.

Contents
Page
i
Disclaimer ........................................................................................................................ 1
Executive summary .......................................................................................................... 2Executive summary introduction ................................................................................. 2Objective of study ....................................................................................................... 2Executive summary section 1 - Main findings of study ................................................. 3Executive summary section 2 - Profile of the wetline fleet ............................................ 4Executive summary section 3 - Effect of wetline fishing by species ............................... 5Executive summary section 4 - Major geographical areas for wetline fishing .................. 8
Glossary of terms ............................................................................................................ 12
Introduction .................................................................................................................... 14
1.0 Background ............................................................................................................ 141.1 Licensing under the Fish Resources Management Act 1994 ............................... 14
1.1.1 Definition of a fishing boat licence ......................................................... 141.2 History of the fishing boat licence...................................................................... 151.3 Objective of study ............................................................................................. 161.4 Methodology .................................................................................................... 161.5 The catch and effort statistics (CAES) system .................................................... 171.6 �No authority to fish� ....................................................................................... 17
2.0 Profile of the wetline fleet .................................................................................... 182.1 How wetline catch is taken ................................................................................ 182.2 Identification of wetline fleet ............................................................................. 20
2.2.1 Number of licensed fishing boats wetlining ............................................ 202.2.2 Licensed boats which operate under licence conditions .......................... 212.2.3 �Wetline only� licensed fishing boats ....................................................... 23
2.3 Identification of wetline catch ............................................................................ 242.3.1 Most targeted wetline species ................................................................ 24
2.4 Where wetline catch is taken ............................................................................. 402.4.1 Geographical fishing patterns of �wetline only�
licensed fishing boats ............................................................................. 402.4.2 Geographical wetline fishing patterns of boats operating
under licence conditions ........................................................................ 422.4.3 Geographical wetline fishing patterns of boats holding
managed fishery and interim managed fishery andsupplementary authorisations ................................................................. 42
2.4.4 Geographical breakdown by species ....................................................... 442.5 Seasonal variations in the wetline catch .............................................................. 44
2.5.1 Seasonal variations in the wetline fleet .................................................... 442.5.2 Seasonal variations in the �wetline only� fleet ........................................... 452.5.3 Seasonal variations in the wetline catches of the
managed fishery fleet ............................................................................. 46
ii
3.0 Effect of wetline fishing by species ..................................................................... 533.1 Dhufish (Glaucosoma hebraicum) ......................................................................... 53
3.1.1 How dhufish are caught ......................................................................... 543.1.2 Who targets dhufish? ............................................................................. 543.1.3 Geographical distribution of dhufish catches ........................................... 553.1.4 When dhufish are caught ....................................................................... 57
3.2 Spanish mackerel (Scomberomorus commerson)....................................................... 583.2.1 How Spanish mackerel are caught .......................................................... 593.2.2 Who targets the Spanish mackerel? ........................................................ 593.2.3 Geographical distribution of Spanish mackerel catches ........................... 603.2.4 When Spanish mackerel are caught ........................................................ 62
3.3 Pink snapper (Pagrus auratus) ............................................................................. 633.3.1 How pink snapper are caught ................................................................. 633.3.2 Who targets pink snapper? ..................................................................... 643.3.3 Geographical distribution of pink snapper catches .................................. 653.3.4 When pink snapper is caught ................................................................. 67
3.4 Baldchin groper (Choerodon rubescens) ................................................................ 683.4.1 How baldchin groper are caught ............................................................ 683.4.2 Who targets baldchin groper? ................................................................ 693.4.3 Geographical distribution of baldchin groper catches .............................. 693.4.4 When baldchin groper are caught .......................................................... 71
3.5 Blue groper (Achoerodus gouldii) .......................................................................... 723.5.1 How blue groper are caught .................................................................. 723.5.2 Who targets blue groper? ...................................................................... 733.5.3 Geographical distribution of blue groper catches .................................... 733.5.4 Seasonal variations in blue groper catches ............................................... 75
4.0 Major geographical areas for wetline fishing ..................................................... 764.1 Wetlining in the Abrolhos Islands ....................................................................... 76
4.1.1 How the wetline catch is taken in the Abrolhos Islands ........................... 774.1.2 Species taken by wetlining in the Abrolhos Islands ................................. 774.1.3 Who wetlines in the Abrolhos? .............................................................. 784.1.4 When wetlining takes place in the Abrolhos Islands ................................ 79
4.2 Wetlining near the Perth metropolitan area (blocks 31150 and 32150) ............... 804.2.1 How wetline catch is taken in the Perth metropolitan area ...................... 804.2.2 Species taken by wetlining near the Perth metropolitan area ................... 814.2.3 Who wetlines in the Perth metropolitan area? ........................................ 814.2.4 When wetlining takes place in the waters off the Perth
metropolitan area................................................................................... 824.3 Wetlining in the South West .............................................................................. 83
4.3.1 How wetline catch is taken in the South West ........................................ 844.3.2 Species taken by wetlining in the South West ......................................... 844.3.3 Who wetlines in the South West? ........................................................... 854.3.4 When wetlining takes place in the waters off the South West region........ 86
5.0 Conclusion .............................................................................................................. 88
6.0 Acknowledgments ................................................................................................. 89
7.0 References .............................................................................................................. 89
8.0 So you want to go wetlining? ............................................................................... 90How do fishers wetline? ............................................................................................. 92Who wetlines?........................................................................................................... 93Where is wetlining carried out? ................................................................................. 94What species are wetlined for? ................................................................................... 97When is wetlining carried out? ................................................................................ 101How much is wetlining worth? ................................................................................ 103
Appendix 1 - Fisheries WA announcements on �New study offishing boat licence� ...................................................................................... 104
Appendix 2 - Number of boats which have reported wetlining in themanaged and interim managed fisheries 1991-92 to 1997-98 ........................ 107
Appendix 3 - Reported wetline catches by species .......................................................... 112
Appendix 4 - Reported wetline catches of �wetline only�, West CoastRock Lobster, Southern Demersal Gillnet and Demersal Long Lineand Shark Bay Snapper licensed fishing boats ................................................. 114
Appendix 5 - Targeted wetline and recreational species .................................................... 122
Appendix 6 - Reported wetline catches by fishing block ................................................. 125
Appendix 7 - Wetline catches of the Abrolhos Islands, Perthmetropolitan region and South West region ................................................... 139
iii

Fish. Res. Rep. Fish. West. Aust.1999, 118, 1-142
1
A study into Western Australia’s open access andwetline fisheries.
F. Crowe1, W. Lehre2 and R.C.J. Lenanton2
1 Locked Bag 39, Cloisters Square Post Office, Perth 6850
2 Western Australian Marine Research LaboratoriesPO Box 20, North Beach, Western Australia 6020
Disclaimer
Under Regulation 64 of the Fish Resources Management Regulations 1995 fishing returns must besubmitted by all holders of a fishing boat licence. This study has used data provided by commercialfishermen under the Act and the Regulations.
This data is as accurate as the information provided by the fisherman themselves and it is thelegislated responsibility of the fishing industry to provide accurate and timely fishing returns.
The data provided and entered into the Catch and Effort Statistics (CAES) System is regularlyreviewed by Fisheries WA research staff. Occasionally data may be modified in response to advicefrom fishermen that earlier statistical returns have been misinterpreted, or that the data recordedin those returns was incorrect, or that errors were made in the process of data entry.
This study is based on CAES data taken from the database on 28 April 1999.
In addition, recreational fishing surveys are based on boat ramp and beach interviews and directcatch checking. The recreational catches quoted in this study are based on the information providedto Fisheries WA researchers by the recreational fishing community.

Fish. Res. Rep. Fish. West. Aust.1999, 118, 1-142
2
Executive summary
Western Australia�s wetline fishery potentially includes every licensed fishing boat in the State andencompasses a number of inter-relationships between various boats and commercial fisheries.This study covers the �wetline� or open access fishery, which encompasses those activities associatedwith the unrestricted Western Australian fishing boat licence (FBL). The activities associated withthis fishery involve any commercial fishing which is not covered by fisheries legislation.
A separate section entitled �So you want to go wetlining?� is provided at page 101 as an easyreference guide to industry and others interested in wetline fishing. It is recommended that it beread by those who require a more personalised explanation of wetline fishing.
When reading the report, also consider that many licensed fishing boats operating in the wetlinefishery are also authorised to fish in one or more other fisheries.
The reported catch of the wetline fishery (excluding the Pilbara demersal line fishery, which isbeing placed under management in the near future) during the 1997-98 financial year was 2,270tonnes. It was worth around $11.25 million, which represents about two per cent of the totalvalue of the Western Australian catch or harvest value of $538 million.
As it is easy to confuse terms such as �wetline only� and �wetline fleet� and to assist withunderstanding this paper a glossary of terms has been provided and follows this ExecutiveSummary.
Executive summary introduction
On 3 November 1997, Fisheries Western Australia announced a study would be undertaken intothe activities associated with the unrestricted Western Australian fishing boat licence and its associatedwetline fishery.
The reasons for the study were that there was a need to :
• determine the activities of the �residual� WA fishing fleet after a decade of active managementand place the majority of other licensees into more specific management arrangements, inorder to determine future strategic directions for management;
• obtain data on the impact of this sector/fishery on finfish species such as dhufish and Spanishmackerel, about which there are sustainability concerns; and
• obtain data on the geographical range of the fleet�s activities and its take of finfish, to help theresource sharing debate with the recreational marine angling and charter sectors.
As the management of wetline fishing in the Pilbara (the Pilbara demersal line fishery) is alreadybeing considered, this analysis focused on fishing boats operating south of North West Cape,except for those licensed fishing boats targeting pelagic species.
Objective of study
The objective of this study is to examine the historic and current status and dynamics of wetlinefishing, and to compare this with catches from the recreational and charter sectors of the fishery.This will enable the Minister for Fisheries to explore options for management of the wetlinefishery and determine an appropriate, cost effective approach that can address resource sustainabilityand allocation.

Fish. Res. Rep. Fish. West. Aust.1999, 118, 1-142
3
Executive summary section 1 - Main findings of study
This study provides a �snapshot� profile of the wetline activities of the Western Australian fishingfleet as at 30 June 1998. It aims to determine the �how�, �who�, �what�, �where� and �when� ofwetline fishing, to allow decisions to be made on future strategic directions for management ofwetlining in the state.
One of the study�s major findings is that over half (720 licensed fishing boats/fishing units) ofWestern Australia�s commercial fishing fleet of 1,361 licensed fishing boats/units as at 30 June1998 had taken part in wetlining in the past seven financial years.
Over the seven year period studied, dhufish, pink snapper and Spanish mackerel were the mosttargeted line caught species of the wetline fleet, with catches of 201, 230 and 536 tonnes in the1997-98 financial year, respectively. Two net caught species, Australian herring and whitebait,were also consistently over 100 tonnes. The 1997-98 catches for these two species were 112tonnes and 48 tonnes1 respectively.
The study also determines the geographical range of wetline fishing. While much wetlining takesplace in the inshore areas of the Perth metropolitan area and the South West, the Abrolhos Islandsline caught wetline catch is about two thirds of both these areas combined. Fisheries WA and theState�s fishing sectors must now make policy decisions on whether or not this situation should bepermitted to continue.
Most of the net caught open access fishing takes place in the south west and south coast. Only asmall amount of inshore line wetlining also takes place along the south coast of the State and mostof this catch is net caught species, such as Australian herring.
The resource sharing implications of the inshore fishing activities of the wetline fleet need to beexamined.
The first six years of study catch data did not confirm a commonly held myth that large amountsof finfish were taken by the rock lobster fleet by wetlining. In fact, during this period most oftheir reported wetline catches were relatively small and only about a third of the rock lobster fleetreported having wetlined at all.
However, during 1997-98 this pattern of reported catches changed and a much larger proportionof certain species of the wetline catch was taken by the rock lobster fleet. For instance, reportedcatches of dhufish during 1997-98 revealed nearly a 150 per cent increase, with 28 rock lobsterboats reporting catches of dhufish for the first time in 1997-98. However, the rock lobster fleetstill only took seven per cent of the total wetline catch in 1997-98. Also of interest in the rocklobster wetline fishing pattern were the zonal differences.
The question of latent wetline fishing effort by the rock lobster fleet was examined and althoughit was found that the average price of rock lobster did not affect the amount of wetline fishingbeing carried out during the first six years of the study, this was not the case during 1997-98. Theconcern that Government was about to rationalise the future of wetline access is also a considerationin the increase of wetlining by the rock lobster fleet during this period.
1 Note that the whitebait catch for 1997-98 was its lowest for several years, down from 256 tonnes in 1996-97.
Fish. Res. Rep. Fish. West. Aust.1999, 118, 1-142
4
Executive summary section 2 - Profile of the wetline fleet
How wetline catch is taken
• The usual methods are hand lining, drop lining, trolling and hand-hauled netting - mostlybeach seining.
• Other methods identified were beam tide trawling (in certain areas), drop netting, squid jigging,lift netting and diving.
Identification of the wetline fleet as at 30 June 1998
• 720 licensed fishing boats, or about half of the fishing fleet of 1,361 fishing units reportedwetlining in the last seven financial years ie. from 1991-92 to 1997-98. Usually between 370and 400 boats fished each year.
• About 90 �wetline only� boats fished each year during the seven year period, while 21 �wetlineonly� fishing units did not fish during the period.
• 201 West Coast Rock Lobster boats reported wetlining during the last seven financial years,with usually between 70 and 100 boats reporting wetlining each year (124 wetlined during1997-98).
• 60 of the 1,361 licensed fishing boats/fishing units which reported wetlining during the lastseven years have been sold to the Fisheries Adjustment Scheme.
• Most estuarine fishing units report wetlining during the last six financial years.
• Relatively few trawlers report wetlining.
Identification of the wetline catch
• The total reported wetline catch has been around 2,000 tonnes for the last four financial years,although in 1997-98 this had reached 2,270 tonnes.
• The reported wetline catches of three line caught species exceed 100 tonnes per annum overthe last seven financial years. The 1997-98 catches of these species were:
- dhufish (201 tonnes);
- Spanish mackerel (536 tonnes); and
- pink snapper (230 tonnes).
• The reported wetline catches of two net caught species usually exceed 100 tonnes per annumover the last seven financial years. The 1997-98 catches were :
- Australian herring (112 tonnes); and
- whitebait (48 tonnes).
Where the wetline catch is taken
• Many of the �wetline only� fleet are highly mobile, except where ownership has remainedstable.
• Depending on the nature of their licence conditions, licensed fishing boats operating underlicence conditions tend to report wetlining in or close to the areas permitted under theirlicence, in particular estuarine boats.

Fish. Res. Rep. Fish. West. Aust.1999, 118, 1-142
5
• Generally, licensed fishing boats holding managed fishery licences tended to report wetliningnear the geographical area of that managed fishery.
• The major areas of reported wetlining are the Kimberley and Pilbara (where almost all theSpanish mackerel are taken), the Abrolhos Islands (over 200 tonnes taken during 1997-98), thewest coast, the metropolitan area (around 170 tonnes taken during 1997-98), and the southwest coast (between 240 and 350 tonnes usually taken).
Seasonal variations in the wetline catch
• Spanish mackerel and whitebait dominate the wetline catches. Spanish mackerel catches arevery low in summer, while large net caught catches of whitebait and Australian herring in theSouth West and south of Western Australia are taken during the summer.
• The rock lobster fleet records higher wetline catches during August, September and October,which coincides with the closed season for the rock lobster fishery.
• Other managed fisheries, such as the Joint Authority Southern Demersal Gillnet and DemersalLongline Managed Fishery (hereinafter referred to as the Southern Demersal Gillnet andDemersal Longline Fishery), also exhibit some seasonal variation, with more recorded wetlinecatches in the summer months.
Executive summary section 3 - Effect of wetline fishing by species
This section examines the three line caught fish species where over 100 tonnes each year is takenby wetline activities, and also baldchin groper and blue groper, species that are popular withrecreational fishers.
Australian herring and whitebait are not examined because they have been studied elsewhere inrecently published Fisheries WA research papers.
Dhufish (Glaucosoma hebraicum)
Although difficult to assess with certainty, it appears that there are no immediate concerns aboutthe overall status of Western Australian dhufish.
The total commercial catch of dhufish in 1997-98 was 232 tonnes, with 202 tonnes reported asbeing caught by the wetline fleet. An estimated 132 tonnes was taken by recreational fishersduring 1996-97 from Kalbarri to Augusta.
How dhufish are caught?
• Dhufish are caught by hand line and drop line by the wetline fleet.
Who targets dhufish
• Dhufish are subject to heavy and increasing fishing pressure from the commercial sector (wetlineand demersal gillnet and longline fisheries) and the recreational and charter sectors.
• Two thirds or 442 of the wetline fleet have reported taking dhufish in the last seven financialyears.
• The catches of the �wetline only� fleet (97 boats in the last seven years) reflect a pattern of smallcatches, with only 27 taking more than one tonne a year for more than three of the last sevenyears.

Fish. Res. Rep. Fish. West. Aust.1999, 118, 1-142
6
• 113 Zone C, 42 Zone B and 23 Zone A rock lobster boats reported taking dhufish by wetlining.
• A variety of licensed fishing boats from other fisheries also take dhufish.
Geographical distribution of dhufish catches
• Dhufish is found predominantly in waters deeper than 20 metres with the wetline catch extendingfrom Kalbarri to near Esperance.
• There has been a large increase in the reported wetline catch of dhufish in the Abrolhos Islandsover the last six years.
• Few dhufish are taken by wetlining on the south coast.
When dhufish are caught
• Most recorded wetline catches of dhufish are in the summer months.
Spanish mackerel (Scomberomorus commerson)
There is limited data available on which to base an assessment of the status of Spanish mackerel inWestern Australian waters. However, according to scientific advice, at present it appears that thereare no immediate concerns about the stock.
The total commercial catch in 1997-87 was 560 tonnes, with 536 tonnes reported being taken bythe wetline fleet. This is an increase of 135 per cent over the last seven financial years. A roughestimate of the recreational catch during this period is about 150 tonnes.
How Spanish mackerel are caught
• They are mainly caught using troll lines (baits and lures) or drifting baits.
• Dedicated mackerel fishing boats use a �mother� boat and dories (dinghies) when trolling.
Who targets Spanish mackerel?
• 163 licensed fishing boats have reported targeting Spanish mackerel by wetline methods in thelast seven financial years, of which seven boats consistently recorded catches of between 20 and100 tonnes in three of the last seven years.
• There are a large number of opportunistic operators from other managed fisheries targetingSpanish mackerel.
Geographical distribution of Spanish mackerel catches
• The heaviest reported wetline fishing takes place in the northern Kimberley, with other largecatches occurring between Port Hedland and Broome. Some trolling also takes place offQuobba, in the Shark Bay area.
When Spanish mackerel is caught
• There are marked seasonal variations in the Spanish mackerel catch, with the vast majoritybeing caught in the winter months.

Fish. Res. Rep. Fish. West. Aust.1999, 118, 1-142
7
Pink Snapper (Pagrus auratus)
The total commercial catch of pink snapper was 764 tonnes in 1997-98, with 230 tonnes beingreported as taken by the wetline fleet. The preliminary estimates of the recreational catch fromKalbarri to Augusta was estimated to be around 27 tonnes during 1996-97.
Who targets pink snapper?
• Around 466 boats have reported taking pink snapper by wetlining in the last six financial years,of which 103 were �wetline only� boats and 165 were rock lobster boats.
• Only 45 boats have recorded taking more than one tonne in three of the last six years.
How pink snapper are caught
• Pink snapper are caught by hand line and drop line.
Geographical distribution of pink snapper catches
• The major wetline snapper catches are out of Kalbarri, the Abrolhos Islands and Geraldton.
When pink snapper are caught
• The highest reported pink snapper wetline catches are around August and March and April.
Baldchin Groper (Choerodon rubescens)
The total commercial catch for baldchin groper was 42 tonnes in 1997-98, with 35 tonnes beingtaken by the wetline fleet. Preliminary estimates of the wetline catch between Kalbarri andAugusta were around 30 tonnes. 46 per cent of the baldchin groper catch comes from theAbrolhos Islands.
How baldchin groper are caught
• Baldchin groper are taken by hand line and drop line by the wetline fleet.
Who targets baldchin groper?
Altogether 291 licensed fishing boats/fishing units reported taking baldchin groper by wetlinemethods, the breakdown is as follows :
• 86 �wetline only� boats have recorded taking baldchin groper in the last seven financial years.
• 67 Zone C, 29 Zone B and 20 Zone A rock lobster boats have reported taking baldchin groperin the last seven years.
• Assorted other boats have also taken them.
• Only seven boats, all but one �wetline only�, have taken over one tonne a year for three or moreof the last seven financial years.

Fish. Res. Rep. Fish. West. Aust.1999, 118, 1-142
8
Geographical distribution of baldchin groper catches
• Around 46 per cent of baldchin groper is reported as being taken from the Abrolhos Islands,with the rest distributed between the Perth metropolitan area and Ningaloo.
When baldchin groper are caught
• Although there is little seasonal variation, slightly more are reported taken in March, April andMay, coinciding with the opening of Zone A of the West Coast Rock Lobster ManagedFishery.
Blue Groper (Achoerodus gouldii)
There is little biological information and no stock assessments on western blue groper (bluegroper). The total reported commercial catch is around 35 tonnes in 1997-98, with seven and ahalf tonnes being caught by the wetline fleet. There is no estimate of the recreational catch.
How blue groper are caught
• Blue groper are reported taken by handline, dropline and hand hauled gillnets by the wetlinefleet.
Who targets blue groper?
• 178 boats have reported taking blue groper. Most are from the south or south west coast, froma variety of fisheries.
• Only one boat, a �wetline only� boat, have reported taking over one tonne a year for three of thelast six financial years.
Geographical distribution of blue groper catches
• Small catches have been recorded from Geraldton to the Great Australian Bight in virtuallyevery inshore block.
When blue gropers are caught
• More blue groper are caught in the summer months than the winter months.
Executive summary section 4 - Major geographical areas for wetlinefishing
This section examines the major wetline fishing areas of the Houtman Abrolhos Islands, the Perthmetropolitan area and the South West.
As relatively little reported wetlining takes place along Western Australia�s south coast, this area hasnot been included as a detailed study.
Wetlining in the Abrolhos Islands
There are large and increasing reported wetline catches of a number of species in the AbrolhosIslands, with over 200 tonnes being taken in the last three financial years.

Fish. Res. Rep. Fish. West. Aust.1999, 118, 1-142
9
Species taken by wetlining in the Abrolhos Islands
• There are a variety of finfish taken by hand line and drop line. The major species include pinksnapper, baldchin groper, dhufish, Spanish mackerel and coral trout.
• Dhufish catches rose from 11.9 tonnes in 1992-93 to 46.9 tonnes in 1997-98. While pinksnapper catches rose from 17.6 tonnes in 1992-93 to 53.2 tonnes in 1997-98.
• The Abrolhos Islands are the main breeding area for coral trout south of Ningaloo Reef.
• Around 46 per cent of the total baldchin groper catch is taken by wetlining in the AbrolhosIslands.
Who wetlines in the Abrolhos Islands?
• 92 licensed fishing boats have reported wetlining in the waters surrounding the AbrolhosIslands during the last six financial years, with 25 additional licensed fishing boats fishing in thearea in the last two years.
• Most boats demonstrate a sporadic pattern of wetline fishing.
• 38 �wetline only� boats have fished in the last six financial years, with 14 having fished for threeor more of the last six years.
• Three Zone C, three Zone B and 20 Zone A West Coast Rock Lobster licensed fishing boatshave wetlined, with most reporting only small catches of fish.
• Five Shark Bay Snapper licensed fishing boats of which four have fished for three or more ofthe last six years, have wetlined.
• Assorted other fishing boats also wetline.
• Most boats demonstrate a sporadic pattern of wetline fishing in the Abrolhos. Only 26 of thelicensed fishing boats have fished for three or more of the last six years.
When wetlining takes place in the Abrolhos
• There is not a very marked seasonal pattern of wetlining. However, more fishing takes place inthe spring and autumn months than the winter and summer months.
Wetlining near the Perth metropolitan area (Blocks 31150 and 32150)
There is a large but generally declining wetline catch reported from the inshore blocks betweenMandurah and Lancelin. The reported wetline catch has declined by a third from 247 tonnes in1991-92 to 171 tonnes in 1997-98.
Species taken by wetlining near the Perth metropolitan area
The wetline fleet reports taking a wide variety of species from the waters of the Perth metropolitanarea. The largest wetline catches in 1997-98, taken as being over five tonnes, were as follows :
• Dhufish, 39 tonnes;
• Sea mullet, 13.3 tonnes;
• Sand crabs, 10.9 tonnes;
• Samsonfish, 20 tonnes;
• Various shark species, 29.6 tonnes; and
• Pink snapper, 21.2 tonnes.
Fish. Res. Rep. Fish. West. Aust.1999, 118, 1-142
10
Who wetlines in the Perth metropolitan area?
• Over the last six financial years 241 licensed fishing boats have wetlined in this area. Thebreakdown is as follows :
− 84 rock lobster boats
− 52 �wetline only� boats
− 24 various Cockburn Sound Managed Fisheries boats
− 13 Estuarine boats, mainly from the Mandurah and Swan-Canning Estuaries
− Assorted other licensed fishing boats.
• Usually between 80 and 100 boats wetline each year.
• Only 34 boats have reported taking catches of over one tonne per annum for three or more ofthe last six financial years. Most boats wetlining in the Perth area record small, sporadic catches.
When wetlining takes place in the waters off the Perth metropolitan region
• Generally, more wetline fishing takes place in the summer and autumn months than in thewinter.
Wetlining in the South West Region
The reported wetline catch of Western Australia�s South West region is highly variable, dependingon the whitebait and Australian herring catches. The total recorded wetline catch ranges from312 tonnes in 1991-92, to 426 tonnes in 1996-97, to 243 tonnes in 1997-98. (The Australianherring and whitebait component of these wetline catches were 45.2 and 47 tonnes respectivelyin 1997-98).
Species taken by wetlining in the South West Region
• There is a large range of species reported taken in the South West. The major 1997-98 catcheswere as follows :
− Australian herring, 45.2 tonnes, taken by beach seine;
− Whitebait, 47.8 tonnes, taken by beach seine;
− Dhufish, 25 tonnes, taken by hand line and drop line;
− Sand crabs, 25.7 tonnes, taken by drop net;
− Sea mullet, 12.5 tonnes taken by beach seine and haul nets; and
− Pink snapper, 7.3 tonnes, taken by hand line and drop line.
Who wetlines in the South West Region?
• Although 71 boats reported wetlining in the area, there is a core of about 35 boats whichregularly wetline in the South West Region. Of those 35 boats, 27 regularly take over twotonnes of fish, with most taking between five and 25 tonnes, reflecting the whitebait componentof the catch.

Fish. Res. Rep. Fish. West. Aust.1999, 118, 1-142
11
• Most of the core boats are either �wetline only�, estuarine, South West Salmon or SouthernDemersal Gillnet and Demersal Longline boats, or a combination of these and otherauthorisations.
• The breakdown of licensed fishing boats reporting wetlining in the South West between 1991-92 and 1997-98 is as follows :
− 16 �wetline only� boats;
− 12 South West Salmon boats;
− five estuarine licensed fishing boats;
− 15 Southern Demersal Gillnet and Demersal Longline boats;
− Nine Zone C West Coast Rock Lobster boats; and
− Assorted other licensed fishing boats.
When wetlining takes place in the waters off the South West Region
• There are marked seasonal variations in the reported wetline catches of the South West, reflectingthe Australian herring and whitebait catch. Without Australian herring and whitebait therewould still be a slight increase in wetline catches over the summer months.

Fish. Res. Rep. Fish. West. Aust.1999, 118, 1-142
12
Glossary of terms
Authorisation: A licence or permit.
Commercial fishing: Fishing for a commercial purpose.
Commercial fishing licence: A licence authorising a person to engage in commercial fishing.
Condition: See licence condition.
Demersal: Found on or near the bottom of the sea.
Dinghy: A licensed fishing boat less than 6.5 metres in length, usually attached to a lead or�mother� boat in a fishing unit.
Dory: The name for a dinghy when it is used in conjunction with a �mother� boat for troll liningwhen targeting Spanish mackerel.
Endorsement: A colloquialism used to describe either a managed fishery licence, an interimmanaged fishery licence, or a licence condition.
Estuarine fishery: An estuarine fishery is one where the number of boats or fishermen authorisedto fish in an estuary is controlled by putting a ceiling on the numbers licensed, and the transferof entitlements is not permitted or is partially restricted for policy reasons. Control is usuallyformally achieved by special conditions on licences. Examples of an estuarine fishery are theMandurah Estuarine Fishery and the South Coast Estuarine Fishery.
Fishery: A fishery means one or more fish stocks or parts of stocks, that can be treated as a unitfor the purposes of conservation or management. For example this could mean a managedfishery such as the West Coast Rock Lobster Fishery, or a class of fishing activities in respect ofthose stocks or parts of stocks of fish, such as the Southern Demersal Gillnet and DemersalLongline Fishery.
Fishing boat licence: A fishing boat licence means a licence (granted under the fisheriesregulations) authorising a person to use a boat for commercial fishing.
Fishing unit: Usually a fishing unit means a single fishing boat, for example a rock lobster boat,but the term is also used to describe a group of boats which together make a fishing unit. Forexample, the combination of a �mother� (or lead) boat plus its dinghies used in an estuarinefishery is regarded as a single fishing unit. In some cases where a boat is not actually used forfishing, the fishing unit is the individual fisherman, eg. in the Marine Aquarium Fishery.
Interim Managed Fishery: A fishery declared by a management plan to be an interim managedfishery.
Licence condition: The ability to fish in certain fisheries (such as in an estuarine fishery), or touse certain fishing gear, (such as power operated net haulers or fish traps), or to take certainspecies of fish (such as mud crabs) is regulated by licence conditions on fishing boat licences.
Managed fishery: A fishery declared by a management plan to be a managed fishery.
Management plan: A management plan is the rules and regulations governing a managed orinterim managed fishery.
Fish. Res. Rep. Fish. West. Aust.1999, 118, 1-142
13
Open access fishery/fishing: �Open access� is a colloquialism to describe those fisheries orfishing activities (within the total number of licensed fishing boats in the overall fishery) forwhich there are no restrictions on the number of vessels with access or on the use of specifictypes or quantities of fishing gear by those boats. For example, hand lining, drop lining, trolllining and squid jigging are all methods associated with the �open access� or �wetline� fishery.
Pelagic: Found near the surface or middle depths of the sea.
Recreational fishing: Fishing for pleasure, to get a feed for oneself or one�s family and friends.
Supplementary licence: Supplementary licences were usually issued at the time when afishery became a managed fishery and the criteria for full access were not met by some fisherswho were subsequently issued with supplementary licences. A supplementary licence mayspecify the means, time period, area, or other requirements in respect of when fish, or a groupof fish, in a fishery may be taken.
Wetfish: Cartilaginous fish (for example, sharks and rays) and scale or finfish (for example,dhufish and snapper).
Wetfish fishery/fishing: Any fishery or fishing activity which targets cartilaginous fish andfinfish, (for example, it can include participants in managed fisheries such as the Shark BaySnapper Fishery, the Southern Demersal Gillnet and Demersal Longline Fishery and the openaccess fishery).
Wetline fishery/fishery: See open access fishery/fishing above.
Wetline fleet: The wetline fleet means all those licensed fishing boats which participate inwetline fishing.
�Wetline only� fleet: Those licensed fishing boats which only have access to the wetline fishery.

Fish. Res. Rep. Fish. West. Aust.1999, 118, 1-142
14
Introduction
On 3 November 1997, Fisheries Western Australia announced a study would be undertaken intothe activities associated with the unrestricted Western Australian Fishing Boat Licence (FBL)commonly known as �wetline� or �open access� fishing and its associated wetline fishery (Appendix 1).
Around 2,270 tonnes of fish worth around $11.25 million was taken in the wetline fishery duringthe 1997-98 financial year. This represents about two per cent of the value of the total WesternAustralian commercial catch or harvest value of $535.4 million (including pearling).
The study has been undertaken for a number of reasons, including the need to:• determine the activities of the �residual� Western Australian commercial fishing fleet after a
decade of active management and placement of the majority of other licensees into morefishery-by-fishery specific management arrangements, in order to determine future strategicdirections for management;
• obtain data on the impact of the wetline fishing sector on finfish species such as dhufish andSpanish mackerel, about which there were sustainability concerns; and
• obtain data on the geographical range of the fleet�s activities and its take of finfish, to help aresource sharing debate with the recreational marine angling and charter sectors.
The study is broken down into four sections.• Section 1 gives the background information to the study.
• Section 2 builds a �snapshot� profile of the activities of licensed fishing boats which carry outwetlining. It identifies how the catch is taken, the boats/fishing units which carry out thewetline activities, looks at the composition of their catch, where the catch is taken, and finally,considers seasonal variations in the wetline catch.
• Section 3 looks at the line caught species that are most affected by wetline fishing and identifieswho targets the fish, where the fish are taken, how they are taken and when they are taken.
• Section 4 examines the major geographical areas where wetlining is carried out, what speciesare taken from those areas, who fishes in those areas, and when they fish.
1.0 Backgound
1.1 Licensing under the Fish Resources Management Act 1994
1.1.1 Definition of a fishing boat licence
The Fish Resources Management Act 1994 (FRMA) defines a fishing boat licence as �� a licencegranted under the regulations authorising a person to use a boat for commercial fishing�. A WesternAustralian fishing boat licence (for a licensed fishing boat or LFB) is informally referred to as a�wetline licence�. It has also been referred to as an �open access� licence or an �open west coast�licence.
When used in conjunction with a Commercial Fishing Licence (CFL), a fishing boat licenceentitles the holder to conduct any fishing activity which is not otherwise prohibited, and to sellhis/her catch. This fishing activity is informally called �wetline fishing�.

Fish. Res. Rep. Fish. West. Aust.1999, 118, 1-142
15
A Commercial Fishing Licence (or CFL) is defined in the FRMA as �� a licence granted under theregulations authorising a person to engage in commercial fishing.� Fisheries WA is currently consideringoptions for the removal of the requirement for crew on licensed fishing boats to hold CFLs.
Fishing boat licences commonly have conditions attached which modify the permitted scope ofactivities possible under that licence. Generally, fishing boat licence conditions 16, 17 and 18 areaccepted as �wetline� conditions, that is, the conditions which make up the unrestricted WesternAustralian Fishing Boat Licence. These conditions are as follows :• Condition 16 : No fishing between Pt. Maud and Tantabiddi;
• Condition 17 : Crew shall not live on Abrolhos Islands; and
• Condition 18 : No river or estuarine fishing.
A fishing boat licence with only conditions 16, 17 and 18 is allowed access to those fisheries forwhich there are no restrictions on the number of licensed boats with access, or on the use ofspecific types or quantities of fishing gear. These unregulated informal �fisheries� include: thegeneral hand line and drop line fishery south of North West Cape; the troll line fishery; the squidjig fishery; the fishery for oceanic blue manna crabs by drop nets or hand hauled nets; and theunrestricted beach seine fishery. The licensed fishing boats who work in the aforementionedfisheries are generally regarded the core of the �wetline only� fleet.
Dinghies attached to a lead or mother boat so as to form a �fishing unit� may also have conditions16, 17 and 18 attached to their own fishing boat licences. For the purposes of this study, the �fishingunit� as a whole has been considered, rather than the main fishing boat and the licensed dinghies as separateentities. At 30 June 1998 there were 1,361 fishing units in the Western Australian commercialfishing fleet.
However, there are a range of licensed dinghies (ie. less than 6.5 metres long) which operate alongthe Western Australian coast as individual autonomous fishing units. Their licences are essentiallyneither transferable, nor tradeable, except to be attached to an �open west coast licence� withwhich the dinghy licence would be used in conjunction (ie. as part of a �fishing unit�).
Fishing boat licences may have other conditions attached to them which permit the licensedfishing boat to undertake certain fishing activities, such as estuarine fishing.
A Managed Fishery Licence or an Interim Managed Fishery Permit is required in addition to afishing boat licence for a boat to fish in a managed or interim managed fishery.
Other conditions which can be attached to fishing boat licences may permit licensed boats toundertake certain specific fishing activities, such as permitting the use of herring traps.
1.2 History of the fishing boat licence
The origins of the fishing boat licence or �wetline� licence lie in the first Fisheries Act of 1899 (R.Lenanton, 1984) which required commercial fishing boats and their operators to be licensed.From 1899 onwards, the system of regulating particular fisheries was carried out by closing offcertain Western Australian waters to fishing for a particular species, or at a particular time, or by aparticular method other than those used by commercial fishermen who were endorsed for thatfishery.

Fish. Res. Rep. Fish. West. Aust.1999, 118, 1-142
16
In the mid 1960s the concept of �Limited Entry Fishery� was introduced under the Fisheries Act1905. As at 30 June 1998 there were 31 Managed Fisheries (formerly Limited Entry Fisheries)and one Interim Managed Fishery under its successor, the FRMA. The licensed boats whichoperate in these fisheries tend to treat the Managed Fishery Licence and the fishing boat licenceas a package.
There are a variety of combinations of permitted fishing activities attached to the fishing boatlicences. These include Managed and Interim Managed Fishery authorisations, supplementaryauthorisations and licence conditions which permit the licensed boat to undertake certain restrictedfishing activities.
1.3 Objective of study
The objective of this study is to examine the historic and current status and dynamics of fishingundertaken using the Western Australian fishing boat licence, and to compare them with catchesthat are taken by the recreational and other fishing sectors. This will enable the Minister forFisheries to explore options for management of the wetline fishery and determine an appropriate,cost effective approach that can address resource sustainability and allocation issues.
1.4 Methodology
The following background data collection and analysis took place:
• Analysis of the licensing status of the �wetline fleet� as at 30 June 1998, ie. identify which boatsmake up:- the managed and interim managed fishing fleet and those licensed boats operating under
licence conditions which focus on wetline fishing as a supplementary (rather than primary)activity; and
- the fleet of licensed boats which operate under a fishing boat licence only and are totallydependent on wetline fishing.
As the management of the Pilbara demersal line fishery is proceeding under separateconsideration, this analysis focused on fishing boats operating south of North West Cape,except for those licensed boats targeting pelagic species north of North West Cape.
• Analysis of the catch and activities of the boats and individuals identified as making up the�wetline fleet� for the last seven years, ie. �who�, �what�, �where�, �how� and �when� they are takingfish.
• Comparison of commercial and recreational catches for the relevant species and areas.
• The catch records for the previous seven financial years were examined through the Catchand Effort Statistics (CAES) system to determine the historic and current status of wetlinefishing. This was achieved by the following method :
1 Examination of all catch data, then discarding catches associated with managed or interimmanaged fisheries and licence conditions, for example rock lobster catches taken by boatslicensed to fish in the West Coast Rock Lobster Fishery and rock lobster catches taken byboats not licensed to fish in that fishery were not taken into account. The catches wouldbe assigned as a managed fishery catch in the first instance and illegal or unauthorisedfishing in the rock lobster fishery in the second;
2 Examination of all by-catch of managed and interim managed fisheries and licenceconditions to ascertain whether catch was correctly assigned as �by-catch� or was actuallyopen access or wetline fishing. For example, Spanish mackerel is highly unlikely to be

Fish. Res. Rep. Fish. West. Aust.1999, 118, 1-142
17
caught in trawl nets, and was thus taken, after discussion with appropriate scientists andfield staff, as open access fishing. Herring and whitebait taken by salmon fishing unitsusing beach seine nets is taken as open access fishing because separate nets are used (althougha small allowance of 250 kgs was allowed as by-catch). However, demersal finfish otherthan pink snapper taken in Shark Bay has been recorded as a by-catch of the Shark BaySnapper Managed Fishery because the same gear/lines are used to take these species whichare not the target species. This accounted for about 100 tonnes a year over the period ofthe study;
3 Areas and/or fisheries which came under some form of management prior to and duringthe study (such as Cockburn Sound) and those that were likely to come under managementduring or shortly after the period of the study (such as the Pilbara) were not included inthe study as �wetline� catches; and
4 The final outcome of this process was taken as the residual or �wetline� catch.
1.5 The catch and effort statistics (CAES) system
In the provision of research advice to fisheries managers and industry, the most up-to-date data isextracted from the Fisheries WA Catch and Effort Statistics (CAES) database. Data within theCAES database is being continually maintained and updated, both by addition of new statisticalreturns and the modification of records to correct errors in data entry or interpretation that aredetected during ongoing analysis and data quality control by the research section responsible forstudying each fishery.
Occasionally data may be modified in response to advice from fishermen that earlier statisticalreturns have been misinterpreted, or that the data recorded in those returns was incorrect, or thaterrors were made in the process of data entry. The data stored within the CAES database is widelyregarded as being the most accurate and timely available for fisheries analysis purposes.
The data in the CAES system is regularly reviewed by Fisheries WA research staff. This study isbased on CAES data taken from the database on 28 April 1999.
1.6 “No authority to fish”
Some wetlining recorded in the Fisheries WA Research Division�s Catch and Effort Statistics(CAES) data is listed under �No Authority to Fish�. This may be, for example, where a boat haswetlined when its fishing boat licence has expired.
Where the fishing is relevant, it has been taken into account for the purposes of this study. Notethat there were no significant catches recorded under �No Authority to Fish�.

Fish. Res. Rep. Fish. West. Aust.1999, 118, 1-142
18
2.0 Profile of the wetline fleet
2.1 How wetline catch is taken
A fishing boat licence or �wetline licence� in conjunction with a Commercial Fisherman�s Licence,entitles the holder to do anything by way of fishing which is not otherwise prohibited, and to sellhis/her catch
The usual methods of wetline fishing are hand lining, drop lining, trolling, beach seining and handhauled netting. Some confusion exists as to what methods constitute wetline activities. For instance,gill netting may be considered wetlining if the net is hand hauled, but not if a power operated netis utilised. The CAES data does not discriminate between hand hauled and power operated gillnetting, but Fisheries WA Research Division�s log book data does attempt to discriminate betweenthe two types.
Consequently, during this study other methods of wetlining were identified. Beam tide trawlingin certain areas, drop netting, hand hauled gill netting, squid jigging, lift netting and diving wereall reported as wetline catches and taken into account.
Hand lining and drop lining were the usual catch methods of taking the most sought-after line-caught fish species such as dhufish, and pink snapper. Trolling was used to target Spanish mackerel.Australian herring and whitebait were taken by beach seine nets. Hand hauled gill netting wasmostly used for the inshore species such as cobbler and flathead, whilst drop nets and diving weregenerally used to take invertebrate species.
The increase in the reported 1997-98 dhufish catch by the rock lobster fleet (Section 2.3.1) wasprimarily due to an increase in drop line catches, which was directly related to an increase in thenumber of boats drop lining, ranging from 45 (777 block days fishing) in 1996-97 to 70 (1,745block/days fishing) in 1997-98. The continuous operation of drop lines by the rock lobster fleethas largely superseded the traditional methods of drifting over productive ground using handlines. Some rock lobster boats are reportedly using up to 150 drop lines at one time, although theCAES data is unable to confirm this.
Table 1 shows the overall different wetline methods used for the purposes of this study, while Table2 shows the different wetline methods used by the rock lobster fleet.

Fish. Res. Rep. Fish. West. Aust.1999, 118, 1-142
19
Table 1 Different methods of wetline fishing by all licensed fishing boats which wetline.
Catch method Number of boats
1991-92 1992-93 1993-94 1994-95 1995-96 1996-97 1997-98
Beach Seine 59 60 51 52 39 36 36
Beam Tide Trawl 1 - - - - - -
Drop Line 129 125 110 92 116 126 165
Diving 7 5 1 2 5 3 4
Drop Net 6 4 12 10 15 10 16
Gill Net 70 61 59 51 40 40 41
Hand Line 222 215 184 206 222 243 273
Haul Net 34 29 26 23 14 19 12
Lift Net 2 1 1 2 2 3 5
Squid Jig 42 41 42 41 35 33 34
Troll Line 61 45 67 51 62 56 67
*Trawl 18 22 19 17 19 25 23
*Note: Although trawling is not a wetline method, a number of species such as Spanish mackerel were reported as having been taken by trawl. As this would be highly unlikely the catch of these species has been taken as wetline fishing by this study even though it was reported as trawling.
Table 2 Different methods of wetline fishing by rock lobster licensed fishing boats which wetline
Catch method Number of boats
1991-92 1992-93 1993-94 1994-95 1995-96 1996-97 1997-98
Beach Seine 2 2 3 4 - 1 2
Drop Line 37 22 26 24 31 45 70
Drop Net - - - - - - 1
Gill Net 6 4 6 4 5 5 5
Hand Line 57 46 33 55 56 74 93
Haul Net 4 - 1 3 3 4 1
Squid Jig 4 2 - 2 2 3 3
Troll Line - 1 1 1 1 3 1

Fish. Res. Rep. Fish. West. Aust.1999, 118, 1-142
20
2.2 Identification of wetline fleet
The �wetline fleet� is made up of licensed fishing boats from the managed and interim managedfisheries; boats which operate under supplementary licences or various licence conditions; andboats operating under licence conditions 16, 17 and 18 (see Section 1.1.1) - which are classifiedas �wetline only� boats.
Most licensed fishing boats have multiple endorsements. Some authorisations are �fishing units�,made up of a mother boat and one or more dinghies adopting the same licence number. Differentdinghies within these fishing units may have different endorsements. As stated previously, thisstudy examines the wetline fishing activities of the �fishing unit� as a whole, except in cases wherea dinghy has obviously been fishing as a separate fishing unit.
This situation means that the make-up of the wetline fleet is extremely complex and difficult toboth describe and quantify.
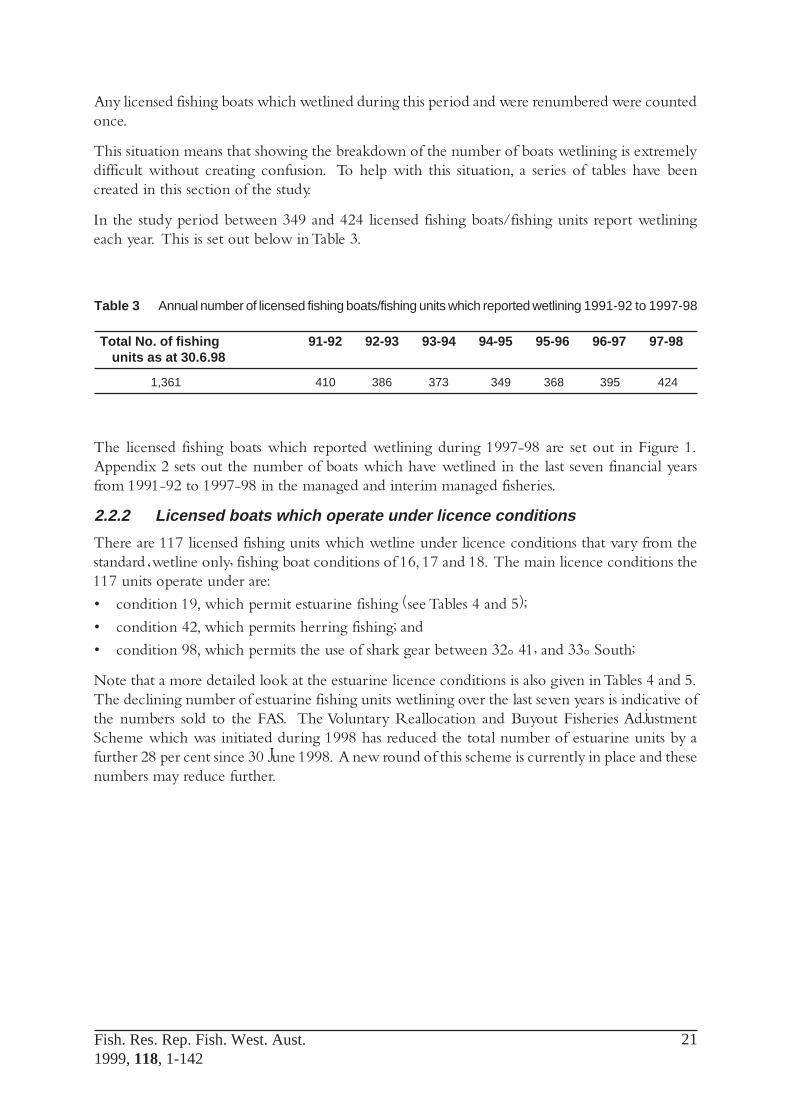
2.2.1 Number of licensed fishing boats wetlining
In total, 720 of the 1,361 licensed fishing boats/fishing units reported wetlining in the last sevenfinancial years, ie. from 1991-92 to 1997-98. It should be noted that this sub-section deals with thelicensed fishing boats/fishing units and the authorisations attached to those boats/units.
The breakdown of these fishing units that were part of managed and interim managed fisheries asat 30 June 1998 is shown at Appendix 2. Licensed fishing boats have moved in and out of managedfisheries during the seven years examined by this study. The picture presented here is the licensed fishingboats/fishing units as licensed as at 30 June 1998.
In addition the following information as at 30 June 1998 is relevant:
• 404 licensed fishing boats which wetlined during the past seven financial years had one ormore managed and/or interim managed fishery licence or supplementary licence attached tothem;
• 38 licensed fishing boats which wetlined during the past seven financial years had one or moremanaged and/or interim managed fishery licence or supplementary licence and a licencecondition other than the standard �wetline only� licence conditions attached;
• 125 licensed fishing boats which wetlined during the past seven financial years had conditions16, 17 and 18 or the standard �wetline only� conditions attached to them;
• 82 licensed fishing boats which wetlined during the past seven financial years operated underlicence conditions other than or as well as the standard �wetline only� conditions, such asestuarine conditions;
• 48 licensed fishing boats which wetlined during the past seven financial years were sold to theFisheries Adjustment Scheme, prior to 30 June 1998, while a further 12 have been sold sincethat date;
• 15 licensed fishing boats which wetlined during the past seven financial years had their licencescancelled under a total rock lobster pot redistribution prior to 30 June 1998, while a furtherone was cancelled after that date;
• Five licences expired and were not renewed; and
• Three were renumbered, but the renumbered licensed fishing boats/fishing units did notwetline.
Fish. Res. Rep. Fish. West. Aust.1999, 118, 1-142
21
Any licensed fishing boats which wetlined during this period and were renumbered were countedonce.
This situation means that showing the breakdown of the number of boats wetlining is extremelydifficult without creating confusion. To help with this situation, a series of tables have beencreated in this section of the study.
In the study period between 349 and 424 licensed fishing boats/fishing units report wetliningeach year. This is set out below in Table 3.
Table 3 Annual number of licensed fishing boats/fishing units which reported wetlining 1991-92 to 1997-98
Total No. of fishing 91-92 92-93 93-94 94-95 95-96 96-97 97-98 units as at 30.6.98
1,361 410 386 373 349 368 395 424
The licensed fishing boats which reported wetlining during 1997-98 are set out in Figure 1.Appendix 2 sets out the number of boats which have wetlined in the last seven financial yearsfrom 1991-92 to 1997-98 in the managed and interim managed fisheries.
2.2.2 Licensed boats which operate under licence conditions
There are 117 licensed fishing units which wetline under licence conditions that vary from thestandard �wetline only� fishing boat conditions of 16, 17 and 18. The main licence conditions the117 units operate under are:
• condition 19, which permit estuarine fishing (see Tables 4 and 5);
• condition 42, which permits herring fishing; and
• condition 98, which permits the use of shark gear between 32° 41� and 33° South;
Note that a more detailed look at the estuarine licence conditions is also given in Tables 4 and 5.The declining number of estuarine fishing units wetlining over the last seven years is indicative ofthe numbers sold to the FAS. The Voluntary Reallocation and Buyout Fisheries AdjustmentScheme which was initiated during 1998 has reduced the total number of estuarine units by afurther 28 per cent since 30 June 1998. A new round of this scheme is currently in place and thesenumbers may reduce further.

Fish. Res. Rep. Fish. West. Aust.1999, 118, 1-142
22
1,145 LICENSED FISHING BOATSREPORTED FISHING DURING 1997-98
88 wetline onlyboats
3 Shark Bay Prawn& Shark Bay Scallop
boats
124 Rock lobsterboats
37 Estuarineboats
38 Southern DemersalGillnet & Demersal
Longline boats
3 Pilbara Trawlboats
11 South CoastSalmon boats
13 Cockburn SoundLine & Pot boats
81 others withvarious access
424 Licensed FishingBoats reported
wetlining during1997-98
19 Shark BaySnapper boats
7 Abaloneboats
479 Rock lobsterboats
19 Abaloneboats
Rest of thecommercial fishing
fleet
721 Licensed FishingBoats did not report
wetlining during1997-98
38 Shark BayPrawn & Scallop
boats
12 South CoastSalmon boats
Figure 1 Number of boats wetline fishing during 1997-98.

Fish. Res. Rep. Fish. West. Aust.1999, 118, 1-142
23
Table 4 Number of boats in the estuarine fisheries which reported wetlining.
Estuarine Fishery Number of licensed Total no. of fishing boats (Condition 19) fishing boats/units in as licensed at 30.6.98
the fishery as at 30.6.98 which wetlined in thefishery 1991-92 to 1997-98
South Coast Estuarine Fishery 33 units 30
Hardy Inlet Estuarine Fishery 2 units 2
Leschenault Estuarine Fishery 6 units 6
Mandurah Estuarine Fishery 14 units 5
Swan Canning Estuarine Fishery 6 units 4
Exmouth Gulf Beach Seine Fishery 4 units 4
Table 5 Annual number of estuarine units which reported wetlining 1991-92 to 1997-98.
No. of fishing units in theestuarine fisheries 91-92 92-93 93-94 94-95 95-96 96-97 97-98
as at 30.6.98
66 units 71 60 59 48 45 43 37
2.2.3 ‘Wetline only’ licensed fishing boats
Usually about 90 �wetline only� boats fish each year (see Table 6).
Altogether, 214 �wetline only� fishing units have reported fishing during this period. According tolicensing records as at 30 June 1998, there were 225 �wetline only� licensed fishing boats, includingdinghies listed as part of fishing units. Catch records indicate that only 125 �wetline only� fishingunits licensed at 30 June 1998 have been active in the past seven years.
The records of the �non-fishing� �wetline only� licensed fishing boats show that their inactivity fallsinto two categories.
• Some of these �boats� are dinghies attached to a mother boat, where the mother boat has thefishing activities recorded against it, and the mother boat has not wetlined; and
• Others are licensed fishing boats that previously held either managed fishery authorisations orlicence conditions which were either transferred to another boat, sold to the Fisheries AdjustmentSchemes, or lost at transfer. These boats have been productive, but have not wetlined sincebecoming �wetline only� licensed fishing boats.
In total, 21 �wetline only� licensed fishing boats had the same licensing status for the whole of theseven year period and did not fish. Only two of these boats are dinghies.
Table 6 Annual number of ‘wetline only’ fishing units which reported wetlining 1991-92 to 1997-98.
No. of ‘wetline only’ 91-92 92-93 93-94 94-95 95-96 96-97 97-98fishing units as at 30.6.98
156 units 97 83 88 89 90 90 88

Fish. Res. Rep. Fish. West. Aust.1999, 118, 1-142
24
2.3 Identification of wetline catch
A full breakdown of wetline catches south of North West Cape and troll line figures, can be foundat Appendix 3. The total wetline catch has been around 2,000 tonnes for most of the period ofthis study, rising to 2,267 tonnes in 1997-98.
The wetline catches by species of the �wetline only� fleet, the West Coast Rock Lobster fleet, andtwo sample fisheries, the Southern Demersal Gillnet and Demersal Longline Fishery, and theShark Bay Snapper Fishery are shown at Appendix 4.
It is interesting to note that the �wetline only� fleet took 45 per cent of the total reported wetlinecatch and the West Coast Rock Lobster boats took seven per cent of the total reported wetlinecatch. However, the rock lobster boats took 24 per cent of the reported �wetline� caught dhufishand 21 per cent of the total commercial dhufish catch during 1997-98. The rock lobster fleet�sreported wetline catch increased by 74 per cent between 1996-97 and 1997-98.
The wetline catches of three line caught species of fish exceed 100 tonnes. These are dhufish,Spanish mackerel and pink snapper. Two net caught species, Australian herring and whitebaitusually exceed 100 tonnes.
2.3.1 Most targeted wetline species
Prior to the commencement of this study, anecdotal evidence suggested that dhufish and Spanishmackerel stocks may be at risk of overfishing from commercial wetline fishing and recreationalmarine angling. Anecdotal evidence also suggested that commercial fishing boats were increasinglytargeting other species prized by the recreational fishing sector.
Therefore, statewide wetline catches of dhufish, Spanish mackerel, and other popular recreationalfinfish species (identified through the preliminary results of the Lower West Coast RecreationalFishing Boat Survey from Augusta to Kalbarri) were examined. These were compared to theremainder of the commercial catch of these species.
The commercial catch (wetline and other commercial) from Augusta to Kalbarri was also comparedto the preliminary results of the recreational boat catch survey, and with respect to Australianherring, a recreational beach survey (the Western Australian Salmon and Australian Herring CreelSurvey). Data on the shore-based catch for species which have a large shore-based component,such as skipjack trevally and sea garfish, was not processed in a way that could be used at the timeof writing this study.
It should be noted the beach survey only reported catches between Augusta, and the Perthmetropolitan area. The recreational catches for many species used in this study are therefore under-reported.In addition, no allowance has been made for incidental mortality of demersal species, ie. even ifundersize, unwanted or excess fish are returned to the sea, some demersal species will die if theyhave been taken from deep waters.
The preliminary results of the boat survey, taken between Kalbarri and Augusta indicate largerecreational catches along this stretch of coastline. The survey area largely corresponds with thefishing blocks. However, there may be some slight discrepancies at the edges of the study area,with commercial fishing boats travelling further afield, but landing the catches at Kalbarri orAugusta.
The Western Australian Salmon and Australian Herring Creel Survey indicated that the 1994 and1995 recreational beach catches of Australian herring from the State�s South West ie. Perth to

Fish. Res. Rep. Fish. West. Aust.1999, 118, 1-142
25
Figure 2a
Augusta, were 247 tonnes and 177 tonnes respectively. The Australian salmon fishery is a managedfishery and there were few wetline catches recorded for this species (0.1 tonnes in 1997-98)
Tables 7-14 set out the commercial catch figures, beginning with the two species considered to beof most concern - dhufish and Spanish mackerel. Tables for those species where less than 10 percent of the catch is taken by the wetline fleet are shown in Appendix 5. Unless otherwise stated,the recreational catch shown is taken from preliminary data of the recreational boat catch surveyfrom Augusta to Kalbarri.
Because figures for catches from recreational fishing charter boats could be underestimated, theyhave not been used. The discussion paper �Future management of the aquatic charter industry inWestern Australia� of 1997 indicated there were 135 charter operators in 1997. This number ofoperators is not reflected in the catch figures, nor the boats which hold charter fishing licenceconditions.
Table 7a
DHUFISH Live weight (tonnes)
1991-92 1992-93 1993-94 1994-95 1995-96 1996-97 1997-98
Wetline catch 150.3 127.8 114.5 136.1 147.7 160.0 201.8
Other commercial catch 35.2 45.6 44.8 35.8 37.1 36.9 30.0
Total commercial catch 185.5 173.4 159.3 171.9 184.8 196.9 231.8
Wetline catch as % of 81.0% 73.7% 71.9% 79.2% 79.9% 81.2% 87.0%total commercial catch
Wetline catch of Rock 18.2 11.3 9.1 13.4 19.9 20.2 49.1 Lobster fleet
*Wetline catch of Rock 9.8% 6.5% 5.7% 7.8% 10.8% 10.3% 21.2%Lobster fleet as % oftotal commercial catch
* Note: the percentage wetline catch of the Rock Lobster fleet was shown in this instance as it is a frequent assertion that licensed fishingboats in the Rock Lobster fleet take large amounts of dhufish.
Dhufish catches 1991-92 - 1997-98
0
50
100
150
200
250
1991-92 1992-93 1993-94 1994-95 1995-96 1996-97 1997-98
Year
Ton
nes
Wetline catch Other commercial catch

Fish. Res. Rep. Fish. West. Aust.1999, 118, 1-142
26
Table 7b
DHUFISH Live weight Percentage of total(tonnes) 1996-97 catch, Kalbarri - Augusta
Preliminary findings of the recreational 132 40.8%catch survey, Kalbarri to Augusta
Wetline catch, Kalbarri to Augusta 156.1 48.3%
Other commercial catch, Kalbarri to Augusta 35.1 10.9%
Total catch including preliminary recreational 323.2 100%catch, Kalbarri to Augusta
Figure 2b
DhufishLive weight (tonnes) 1996-97
132
35.1
156.1
Preliminary findings ofthe recreational catchKalbarri to Augusta
Wetline catch Kalbarri toAugusta
Other commercial catchKalbarri to Augusta

Fish. Res. Rep. Fish. West. Aust.1999, 118, 1-142
27
Table 8a
SPANISH MACKEREL Live weight (tonnes)
1991-92 1992-93 1993-94 1994-95 1995-96 1996-97 1997-98
Wetline catch 228.6 228.4 425.3 445.7 470.7 476.7 536.5
Other commercial catch 160.8 142.6 35.7 25.3 31.3 10.0 23.3
Total commercial catch 389.4 371.0 461.0 471.0 502.0 486.7 559.8
Wetline catch as a % of total 58.7% 61.6% 92.2% 94.6% 93.8% 97.9% 95.8%commercial catch
Figure 3a
Spanish Mackerel catches 1991-92 to 1997-98
0
100
200
300
400
500
600
1991-92 1992-93 1993-94 1994-95 1995-96 1996-97 1997-98
Year
Ton
nes
Wetline catch Other commercial catch
Fish. Res. Rep. Fish. West. Aust.1999, 118, 1-142
28
Table 8b
SPANISH MACKEREL Live weight Percentage of total(tonnes) 1996-97 catch, Kalbarri - Augusta
Preliminary findings of the recreational catch 12.5 45.5%survey, Kalbarri to Augusta
Wetline catch, Kalbarri to Augusta 15.0 54.5%
Other commercial catch, Kalbarri to Augusta - -
Total catch including preliminary recreational 27.5 100%catch, Kalbarri to Augusta
* Note: The recreational catch is from the Kalbarri area only and as a predominantly northern species, Spanish mackerel is not often fishedcommercially south of the Shark Bay area.
Figure 3b
Spanish MackerelLive weight (tonnes) 1996-97
12.5
15 0
Preliminary findings ofthe recreational catchKalbarri to Augusta
Wetline catch Kalbarri toAugusta
Other commercial catchKalbarri to Augusta

Fish. Res. Rep. Fish. West. Aust.1999, 118, 1-142
29
Table 9a
GARFISH, SEA Live weight (tonnes)1991-92 1992-93 1993-94 1994-95 1995-96 1996-97 1997-98
Wetline catch 31.5 20.2 12.4 11.7 13.9 15.9 14.7
Other commercial catch 35.4 20.6 38.7 44.9 38.4 27.9 33.1
Total commercial catch 66.9 40.8 51.1 56.6 52.3 43.8 47.8
Wetline catch as a % of 47.1% 49.5% 24.3% 20.7% 26.6% 36.3% 30.8%total commercial catch
Figure 4a
Garfish catches 1991-92 to 1997-98
0
5
10
15
20
25
30
35
40
45
1991-92 1992-93 1993-94 1994-95 1995-96 1996-97 1997-98
Year
Ton
nes
Wetline catch Other commercial catch
Fish. Res. Rep. Fish. West. Aust.1999, 118, 1-142
30
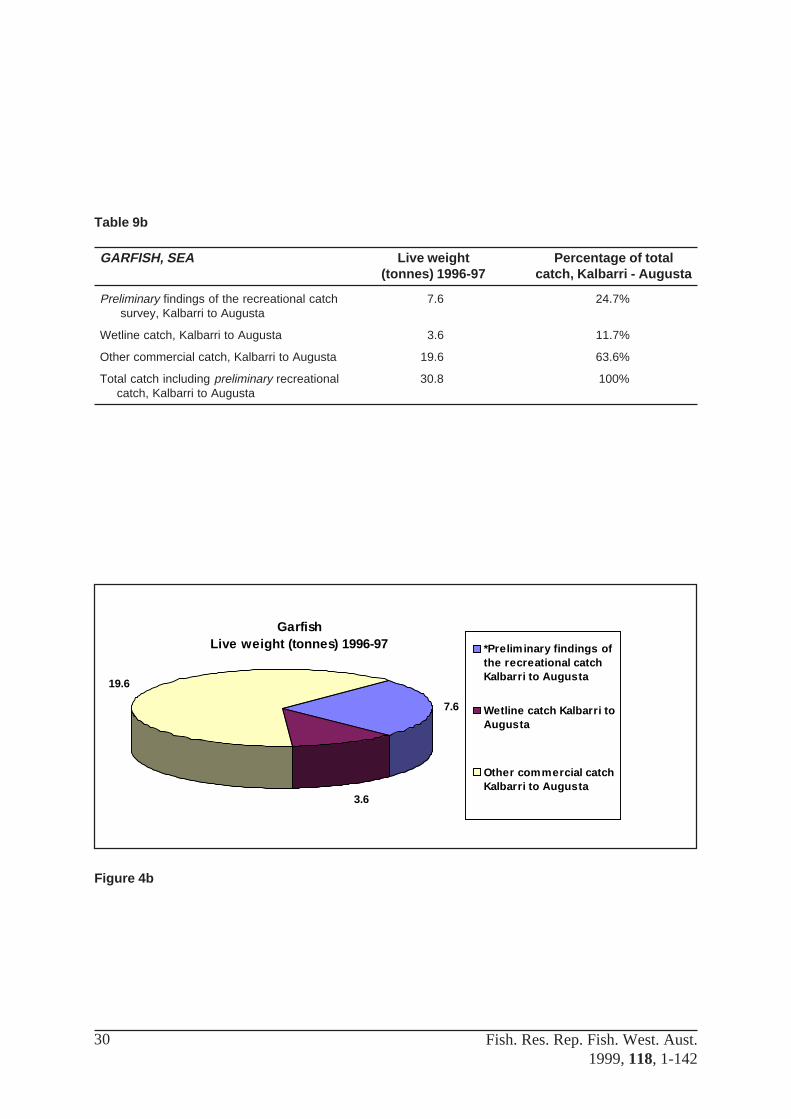
Table 9b
GARFISH, SEA Live weight Percentage of total(tonnes) 1996-97 catch, Kalbarri - Augusta
Preliminary findings of the recreational catch 7.6 24.7% survey, Kalbarri to Augusta
Wetline catch, Kalbarri to Augusta 3.6 11.7%
Other commercial catch, Kalbarri to Augusta 19.6 63.6%
Total catch including preliminary recreational 30.8 100%catch, Kalbarri to Augusta
Figure 4b
GarfishLive weight (tonnes) 1996-97
7.6
3.6
19.6
*Preliminary findings ofthe recreational catchKalbarri to Augusta
Wetline catch Kalbarri toAugusta
Other commercial catchKalbarri to Augusta
Fish. Res. Rep. Fish. West. Aust.1999, 118, 1-142
31
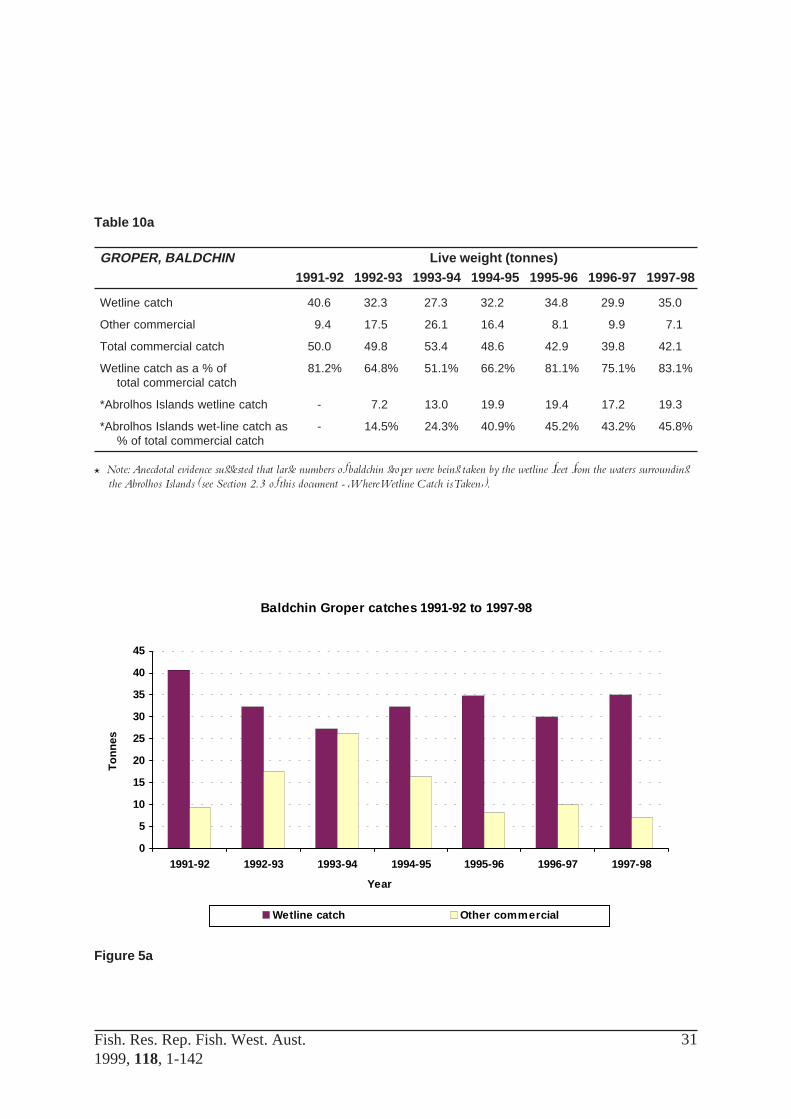
Table 10a
GROPER, BALDCHIN Live weight (tonnes)1991-92 1992-93 1993-94 1994-95 1995-96 1996-97 1997-98
Wetline catch 40.6 32.3 27.3 32.2 34.8 29.9 35.0
Other commercial 9.4 17.5 26.1 16.4 8.1 9.9 7.1
Total commercial catch 50.0 49.8 53.4 48.6 42.9 39.8 42.1
Wetline catch as a % of 81.2% 64.8% 51.1% 66.2% 81.1% 75.1% 83.1%total commercial catch
*Abrolhos Islands wetline catch - 7.2 13.0 19.9 19.4 17.2 19.3
*Abrolhos Islands wet-line catch as - 14.5% 24.3% 40.9% 45.2% 43.2% 45.8%% of total commercial catch
* Note: Anecdotal evidence suggested that large numbers of baldchin groper were being taken by the wetline fleet from the waters surroundingthe Abrolhos Islands (see Section 2.3 of this document - �Where Wetline Catch is Taken�).
Figure 5a
Baldchin Groper catches 1991-92 to 1997-98
0
5
10
15
20
25
30
35
40
45
1991-92 1992-93 1993-94 1994-95 1995-96 1996-97 1997-98
Year
Ton
nes
Wetline catch Other commercial

Fish. Res. Rep. Fish. West. Aust.1999, 118, 1-142
32
Table 10b
GROPER, BALDCHIN Live weight Percentage of total(tonnes) 1996-97 catch, Kalbarri - Augusta
Preliminary findings of the recreational catch 23.0 38%survey, Kalbarri to Augusta
Wetline catch, Kalbarri to Augusta 29.2 48.2%
Other commercial catch, Kalbarri to Augusta 8.4 13.8%
Total catch including preliminary recreational 60.6 100%catch, Kalbarri to Augusta
Figure 5b
Baldchin GroperLive weight (tonnes) 1996-97
23
9.2
8.4 Preliminary findings ofthe recreational catchKalbarri to Augusta
Wetline catch Kalbarri toAugusta
Other commercial catchKalbarri to Augusta

Fish. Res. Rep. Fish. West. Aust.1999, 118, 1-142
33
Table 11a
GROPER, BLUE Live weight (tonnes)1991-92 1992-93 1993-94 1994-95 1995-96 1996-97 1997-98
Wetline catch 4.4 9.3 6.4 7.6 6.8 3.5 7.4
Other commercial catch 31.6 35.9 29.9 29.7 26.9 31.8 28.0
Total commercial catch 36.0 45.2 36.3 37.3 33.7 35.3 35.4
Wetline catch as a % of total 12.2% 20.6% 17.6% 20.4% 20.2% 9.9% 20.9%commercial catch
Figure 6a
Blue Groper catches 1991-92 to 1997-98
0
5
10
15
20
25
30
35
40
1991-92 1992-93 1993-94 1994-95 1995-96 1996-97 1997-98
Year
Ton
nes
Wetline catch Other commercial catch

Fish. Res. Rep. Fish. West. Aust.1999, 118, 1-142
34
Table 11b
GROPER, BLUE Live weight Percentage of total(tonnes) 1996-97 catch, Kalbarri - Augusta
*Preliminary findings of the recreational 2.7 12.9%catch survey, Kalbarri to Augusta
Wetline catch, Kalbarri to Augusta 2.5 12.0%
Other commercial catch, Kalbarri to Augusta 15.7 75.1%
Total catch including preliminary recreational 20.9 100%catch, Kalbarri to Augusta
* Note: This species also occurs outside the area of the survey, particularly along WA�s south coast.
Figure 6b
Blue GroperLive weight (tonnes) 1996-97
2.7
2.5
15.7
Preliminary findings ofthe recreational catchKalbarri to Augusta
Wetline catch Kalbarri toAugusta
Other commercial catchKalbarri to Augusta

Fish. Res. Rep. Fish. West. Aust.1999, 118, 1-142
35
Table 12
HERRING, AUSTRALIAN Live weight (Tonnes)
1991-92 1992-93 1993-94 1994-95 1995-96 1996-97 1997-98
Wetline catch 305.6 220.3 156.3 157.5 129.6 124.5 111.8
Other commercial catch 1,016.2 563.2 844.4 630.0 936.2 958.6 652.0
Total commercial catch 1,321.8 783.5 1,000.7 787.5 1,065.8 1,083.1 763.8
Wetline catch as a % of 23.1% 28.1% 15.6% 20% 12.2% 11.5% 14.6%total commercial catch
Recreational catch *247.0 *177.0 **50.0
Total catch 1,247.7 964.5
Wetline catch as a % of 12.5% 16.3%total catch
Recreational catch as a 19.8% 18.4%% of total catch
* From the Western Australian Salmon and Australian Herring Creel Survey (shore and boat).
** Estimated recreational catch based on preliminary boat catch from Augusta to Kalbarri collected for the Lower West Coast RecreationalFishing Boat Survey (boat only).
Figure 7
Herring catches 1991-92 to 1997-98
0
200
400
600
800
1000
1200
1991-92 1992-93 1993-94 1994-95 1995-96 1996-97 1997-98
Year
Ton
nes
Wetline catch Other commercial catch Recreational catch

Fish. Res. Rep. Fish. West. Aust.1999, 118, 1-142
36
Table 13a
SNAPPER, PINK Live weight (tonnes)
1991-92 1992-93 1993-94 1994-95 1995-96 1996-97 1997-98
Wetline catch 224.5 175.7 235.7 277.3 336.2 264.9 230.5
Other commercial catch 501.1 634.3 526.9 573.8 509.7 636.8 534.0
Total commercial catch 725.6 810.0 762.6 851.1 845.9 901.7 764.5
Wetline catch as a % of 30.9% 21.7% 30.9% 32.6% 39.7% 29.4% 30.1%total commercial catch
Figure 8a
Pink Snapper catches 1991-92 to 1997-98
0
100
200
300
400
500
600
700
1991-92 1992-93 1993-94 1994-95 1995-96 1996-97 1997-98
Year
Ton
nes
Wetline catch Other commercial catch

Fish. Res. Rep. Fish. West. Aust.1999, 118, 1-142
37
Table 13b
SNAPPER, PINK Live weight Percentage of total(tonnes) 1996-97 catch, Kalbarri - Augusta
*Preliminary findings of the recreational 27.0 9.0%catch survey, Kalbarri to Augusta
Wetline catch, Kalbarri to Augusta 228.8 76.1%
Other commercial catch, Kalbarri to Augusta 45.0 14.9%
Total catch including preliminary recreational 300.8 100%catch, Kalbarri to Augusta
* Note: Since this species is distributed from South Australia to Coral Bay, much of the commercial and recreational catch (particularly inShark Bay) occurs outside the area of the survey. The total recreational and commercial catch will exceed the estimate available. The1996-97 year was considered to be a poor one for pink snapper by many recreational anglers (Neil Sumner, pers. comm. 1998).
Figure 8b
Pink SnapperLive weight (tonnes) 1996-97
27
228.8
45 Preliminary findings ofthe recreational catchKalbarri to Agust
Wetline catch Kalbarri toAugusta
Other commercial catchKalbarri to Augusta

Fish. Res. Rep. Fish. West. Aust.1999, 118, 1-142
38
Table 14a
TREVALLY, SKIPJACK Live weight (tonnes)1991-92 1992-93 1993-94 1994-95 1995-96 1996-97 1997-98
Wetline catch 3.7 3.0 4.5 4.7 3.1 4.9 6.1
Other commercial catch 2.0 6.2 4.5 3.1 3.2 2.9 2.8
Total commercial catch 5.7 9.2 9.0 7.8 6.3 7.8 8.9
Wetline catch as a % of 64.9% 32.6% 50.0% 60.3% 49.2% 62.8% 68.5% total commercial catch
Figure 9a
Trevally Skipjack catches 1991-92 to 1997-98
0
1
2
3
4
5
6
7
1991-92 1992-93 1993-94 1994-95 1995-96 1996-97 1997-98
Year
Ton
nes
Wetline catch Other commercial catch

Fish. Res. Rep. Fish. West. Aust.1999, 118, 1-142
39
Table 14b
TREVALLY, SKIPJACK Live weight Percentage of total(tonnes) 1996-97 catch, Kalbarri - Augusta
*Preliminary findings of the recreational catch 43.0 96.2%survey, Kalbarri to Augusta
Wetline catch, Kalbarri to Augusta 1.7 3.8%
Other commercial catch, Kalbarri to Augusta - -
Total catch including preliminary recreational 44.7 100%catch, Kalbarri to Augusta
* Note: Since this species is distributed from South Australia to NW Cape, much of the recreational catch occurs outside the area of thesurvey. Therefore, the total recreational catch will exceed the above estimate.
Figure 9b
Trevally SkipjackLive weight (tonnes) 1996-97
43
1.7Preliminary findings ofthe recreational catchKalbarri to Augusta
Wetline catch Kalbarri toAugusta
Other commercial catchKalbarri to Augusta

Fish. Res. Rep. Fish. West. Aust.1999, 118, 1-142
40
Other large wetline catches of species from the waters south of North West Cape, which are notgenerally regarded as recreationally important, are listed in Table 15 below.
Table 15 Wetline catches of fish not considered important to the recreational sector
SPECIES Live weight (tonnes)1991-92 1992-93 1993-94 1994-95 1995-96 1996-97 1997-98
Hapuku 12.6 8.4 13.3 9.3 19.3 22.0 21.4
Mullet, Sea 78.6 84.6 79.1 70.3 58.7 68.0 71.7
Samsonfish 58.6 49.3 48.3 52.7 40.0 55.8 101.9
Whitebait 158.9 122.7 137.3 91.0 181.5 256.1 47.8
2.4 Where wetline catch is taken
Appendix 6 shows the block by block breakdown of wetline fishing catches. The main areas southof North West Cape are the South West, from Mandurah to Jurien, Albany and Geraldton and theAbrolhos Islands, (see Map 1).
With the exception of the �wetline only� licensed boats, the majority of wetline activity takes placenear a licensed fishing boat�s home port. For example, if it is licensed fishing boat owned by anAlbany resident, it tend to fish around Albany, or if it is a licensed fishing boat with a Zone C WestCoast Rock Lobster Managed Fishery licence, it will wetline in Zone C. Changes in thegeographical fishing patterns of a licensed boat often indicate a change of ownership.
2.4.1 Geographical fishing patterns of ‘wetline only’ licensed fishing boats
Many of the active �wetline only� licensed fishing boats are highly mobile. The vast majority ofboats change ownership more frequently in comparison to those boats whose licensees also haveaccess to managed and other commercial fisheries.
The pattern of the �wetline only� fishing activity is often that a licensed fishing boat will fish acertain area or target a certain species for one or two years, prior to moving on to another area orspecies, either because its ownership has changed, or for marketing reasons. Wetline licensed boatsare often �held� by boat brokers and frequently change hands due to leasing arrangements, whichunder Fisheries WA�s licensing arrangements often registers as a �transfer�. Thus a licensed fishingboat may have four or five nominal owners in as many years, with fishing activity ranging fromnone for some owners to high with others.
Geraldton registered boats tend to fish near Geraldton and the Abrolhos Islands, while the southand South West registered boats tend to fish in the blocks near those areas, although they may fisha number of those blocks. The Fremantle registered boats tend to wetline in all geographic areasof the State. The most mobile �wetline only� registered boats are those registered in Mandurah andfrom the North West of Western Australia. A number of these vessels target Spanish mackerel.
Where ownership has remained stable, the �wetline only� licensed fishing boats tend to fish neartheir home port, or do not fish at all.
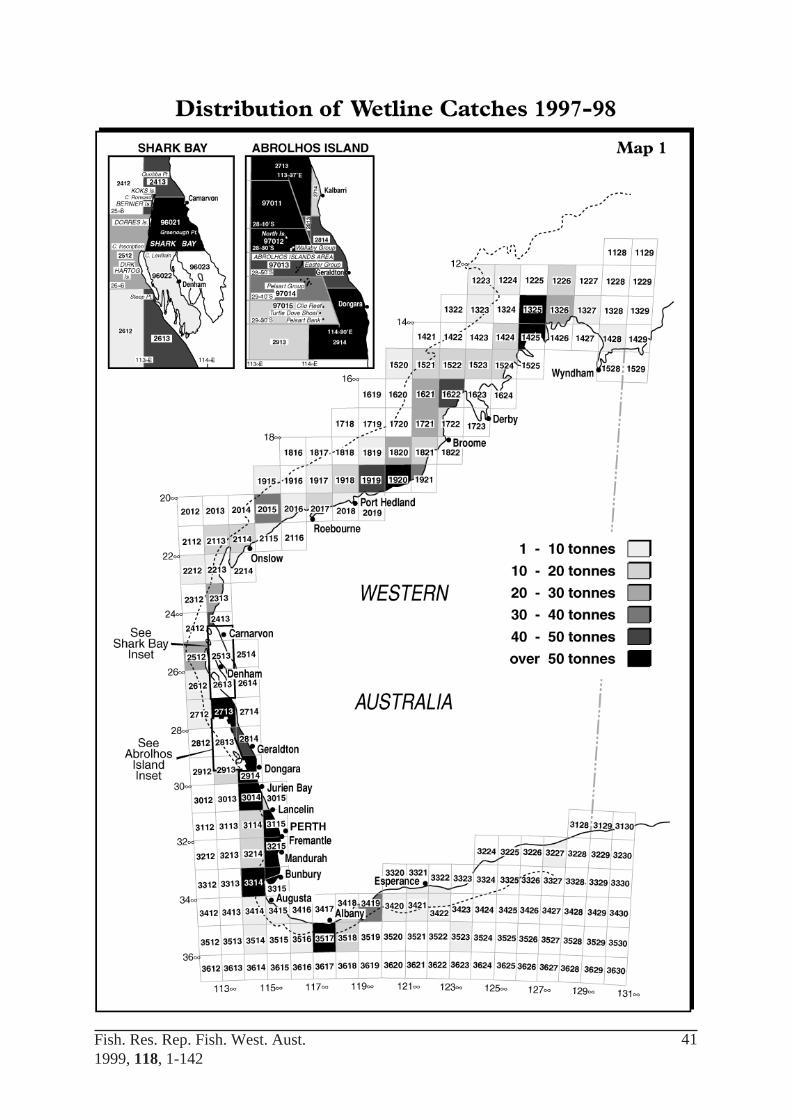
Fish. Res. Rep. Fish. West. Aust.1999, 118, 1-142
41

Fish. Res. Rep. Fish. West. Aust.1999, 118, 1-142
42
2.4.2 Geographical wetline fishing patterns of boats operating under licenceconditions
Licensed fishing boats operating under licence conditions that vary from the �standard� 16, 17 and18 of the �wetline only� fleet tend to be less mobile than the latter. The geographical wetlineactivities of these boats are influenced by changes of ownership, but not to the same extent as�wetline only� boats. This situation may be the result of the nature of these licence conditions.
Boats with estuarine and herring trap licence conditions exhibit the least geographical movement.
Licensed boats registered in the State�s south and South West tended to be less mobile than thoseregistered in the Perth metropolitan area and in the parts of the State north of Perth.
2.4.3 Geographical wetline fishing patterns of boats holding managed fisheryand interim managed fishery and supplementary authorisations
Generally, licensed fishing boats holding managed fishery licences tend to wetline near to thegeographical area associated with the particular managed fishery licence. Managed fisheryauthorisations which target cartilaginous fish or scale fish tend to have a larger percentage of theirlicence holders involved in wetlining.
Outlined below are the geographical wetline fishing patterns for the West Coast Rock LobsterFishery, and two sample managed fisheries - the Southern Demersal Gillnet and Demersal LonglineFishery and the Shark Bay Snapper Fishery.
2.4.3.1 West Coast Rock Lobster Managed Fishery
There appears to be a correlation between wetline fishing activity levels and the particular zoneassociated with a rock lobster boat (see Appendix 2 and Map 2, Western Rock Lobster FishingZones, shown over the page). Zone C licensed boats are the most likely to wetline, while ZoneB boats are the second most likely and Zone A the least likely. The reason for this may be levelsof cash flow associated with catch peaks, ie. the Zone A rock lobster fleet has two peaks in thecatch and therefore has more cash flow, while the Zone C fleet has one peak. Historically, theincome from the average Zone C licence supports a large number of licensees and there is anincentive to maximise the income stream. In addition, the Zone C lobster catches fluctuatearound the long term mean more than the other two zones, further reinforcing the incomemotivation to diversify operations as a hedge against uncertainty.

Fish. Res. Rep. Fish. West. Aust.1999, 118, 1-142
43
Western Rock Lobster Fishing Zones
The CAES data for 1997-98 revealed a doubling in dhufish catch reported by the rock lobsterfleet, from 20.2 tonnes in 1996-97 to 49.1 tonnes in 1997-98. Twenty eight rock lobster boatsreported catches of dhufish for the first time in 1997-98, with the majority of the increase beingrecorded from blocks 29140, 29142, 30140 and 31150.
The reasons for the increased finfish activity (mainly in the off season) are threefold;
• under-reporting of wetline catch in the first six years of the study;
• a concern that Government was about to rationalise the future level of wetline access, and thusentitlement of rock lobster fishers to wetline; and
• an anticipation that lower rock lobster prices would continue during the 1998-99 rock lobsterseason.
During 1998, Fisheries WA received information that strongly suggested that the rock lobster fleethad again increased its wetline fishing activities.
Of the 124 C Zone licensed boats identified as having wetlined during the last seven years, only13 have taken fish outside that zone. Of the 13, six have fished around Dongara, four have fishedthe Exmouth Gulf area, and two have gone to the Pilbara.
Eleven Zone B boats have reported wetlining outside their zone, mainly in the Abrolhos andaround Shark Bay - while no Zone A licensed boats have reported wetlining outside their zone.
Map 2

Fish. Res. Rep. Fish. West. Aust.1999, 118, 1-142
44
2.4.3.2 Southern Demersal Gillnet and Demersal Longline Fishery
Most licensed boats in this fishery reported wetlining close to their home port, and in the case ofsome units, there is a relatively large beach seine component. Some licensed fishing boats previouslyassociated with the fishery exhibited a mobile pattern, (fishing from the Kimberley to the GreatAustralian Bight), but this is no longer the case. The supplementary access holders in this fisheryexhibited the most mobility, with one fishing from Albany to the Abrolhos, and another fishingfrom Shark Bay to Albany.
2.4.3.3 Shark Bay Snapper Fishery
Most of the Shark Bay Snapper licensed boats wetlined between North West Cape and Dongara.None are permitted to fish within the Ningaloo Marine Park to 200 nautical miles offshore. Fiveof these licensed boats have wetlined in the Abrolhos Islands. Of those wetlining outside thisregion, most have done so at their home port, (for example, Albany) at the completion of theShark Bay Snapper Managed Fishery peak season.
2.4.4 Geographical breakdown by species
A block by block breakdown of the most targeted wetline species is provided at Appendix 6.Map 1 shows the current (1997-98) pattern of overall wetline fishing.
Also see Section 3 of this document.
2.5 Seasonal variations in the wetline catch
2.5.1 Seasonal variations in the wetline fleet
Spanish mackerel and whitebait dominate the reported wetline catches. There is a general fishingpattern of slightly (approximately 30 tonnes) more reported wetline fishing in winter than summermonths because this is when the most Spanish mackerel are caught. However, in years of highwhitebait catches, there is very little seasonal difference in the overall reported wetline catches, forexample in 1996-97.
This is shown in Table 16.
Table 16 Seasonal variations of the wetline fleet.
MONTH Catch live weight (tonnes)
1991-92 1992-93 1993-94 1994-95 1995-96 1996-97 1997-98
July 169.2 198.5 167.4 225.7 233.8 145.9 272.8
August 162.6 156.5 152.4 244.4 189.2 236.2 328.3
September 139.2 132.2 147.2 171.1 170.9 165.4 215.2
October 144.0 138.9 154.9 182.0 173.0 141.0 185.4
November 135.6 115.2 110.2 121.4 106.3 127.5 148.8
December 131.5 119.9 122.8 138.9 134.5 102.5 109.9
January 160.8 107.9 173.8 131.4 180.9 203.1 145.9
February 155.0 112.9 137.5 133.6 187.4 187.0 122.8
March 194.7 192.6 163.6 149.1 151.7 195.4 197.1
April 286.6 205.0 176.5 204.8 223.0 238.1 220.1
May 153.7 159.9 144.5 138.4 192.7 181.8 153.7
June 205.7 152.2 170.6 157.2 206.2 222.7 167.3
TOTAL 2,038.6 1,792.2 1,821.6 1,997.9 2,149.8 2,146.7 2,267.4

Fish. Res. Rep. Fish. West. Aust.1999, 118, 1-142
45
2.5.2 Seasonal variations in the ‘wetline only’ fleet
There is a marked difference in seasonal variations of reported catches of certain sectors of the�wetline only� fleet.
The northern �wetline only� fleet reports more catches in winter months than summer months.The reason for this situation are the very high catches of Spanish mackerel and some other speciesrecorded in the winter months.
The reported catches of dhufish and pink snapper further south averaged around 10 tonnes amonth each during 1997-98.
There are high west coast and South West catches of dhufish, pink snapper and usually whitebaitduring the summer.
Table 17 shows the total seasonal variations in the reported catch of the �wetline only� fleet.
Table 17 Seasonal variations of the ‘Wetline Only’ fleet.
MONTH Catch live weight (tonnes)1991-92 1992-93 1993-94 1994-95 1995-96 1996-97 1997-98
July 88.6 66.3 54.1 107.9 67.9 43.2 106.8
August 80.9 60.8 55.3 124.4 56.9 63.7 103.9
September 75.3 64.0 46.9 106.0 72.0 57.9 66.6
October 60.5 63.0 62.8 105.9 94.7 51.0 86.4
November 71.9 47.1 45.7 58.0 56.7 63.7 68.9
December 52.3 50.5 33.8 50.2 43.3 35.7 47.0
January 44.6 36.2 49.8 40.9 60.9 65.0 60.7
February 45.3 42.8 49.9 59.5 68.0 60.6 57.8
March 54.1 50.3 59.1 71.8 60.2 74.7 99.7
April 69.3 46.7 63.9 67.7 88.7 93.5 94.0
May 55.9 55.2 74.8 74.0 94.5 77.1 85.8
June 58.6 66.2 94.5 58.4 82.9 87.0 97.1
TOTAL 757.5 649.2 690.5 924.7 846.6 773.2 975.0

Fish. Res. Rep. Fish. West. Aust.1999, 118, 1-142
46
Figure 10
2.5.3 Seasonal variations in the wetline catches of the managed fishery fleet
Outlined below are the seasonal variations for the West Coast Rock Lobster and two samplemanaged fisheries - the Southern Demersal Gillnet and Demersal Longline Fishery and the SharkBay Snapper Fishery.
2.5.3.1 Seasonal variations in the wetline catches of the Rock Lobster fleet
Anecdotal evidence suggested that large numbers of the West Coast Rock Lobster fleet wetlinedduring the off-season. As a result, the month-by-month wetline catches of the rock lobster fleetwere examined.
Usually between 70 and 100 rock lobster boats wetline each year, although in 1997-98 124reported wetlining. Generally, each boat reports taking only small amounts of fish (under onetonne a year). Table 18 lists the reported monthly wetline fishing activity of the West Coast RockLobster fleet from 1991-92 to 1997-98.
As expected, the main months for reported wetline fishing activity by West Coast Rock Lobsterboats are August, September and October, which coincide with the closed season of the rocklobster fishery. This is particularly so in 1997-98 when the total reported wetline catch increasedby 73.9 per cent over the previous year, with the months of July, August and September beingconsiderably higher than previous years.
To ascertain the extent of latent �wetline� effort in the rock lobster fishery, the correlation betweenthe average price of rock lobster and wetline fishing activity by West Coast Rock Lobster boatsover 10 years was examined. The wetline catches of West Coast Rock Lobster boats by species areshown in Appendix 4. The results, shown in Table 19 and Figure 12 below, indicate very littlecorrelation, except in 1997-98 when other factors also need to be taken into account (these havebeen discussed in Section 2.4.3.1). Note that Figure 12 shows a logarithmic axis in relation toweight, which takes into account the economies of scale between the rock lobster catch and thewetline catch.
Seasonal variations of the 'Wetline Only' fleet
0
20
40
60
80
100
120
140
July
Aug
ust
Sep
tem
ber
Oct
ober
Nov
embe
r
Dec
embe
r
Janu
ary
Feb
ruar
y
Mar
ch
Apr
il
May
June
Month
Ton
nes
1991-92 1992-93 1993-94 1994-95 1995-96 1996-97 1997-98

Fish. Res. Rep. Fish. West. Aust.1999, 118, 1-142
47
Table 18 Seasonal variations of the West Coast Rock Lobster fleet.
MONTH Catch live weight (tonnes)1991-92 1992-93 1993-94 1994-95 1995-96 1996-97 1997-98
July 6.0 2.9 3.4 3.9 5.9 1.9 14.0
August 14.6 4.4 5.4 6.2 10.2 13.3 26.3
September 12.4 3.2 3.0 5.9 10.4 11.0 18.0
October 13.7 4.8 0.9 6.5 11.3 9.3 11.0
November 1.2 2.7 1.1 4.9 3.8 4.0 9.9
December 2.6 4.3 1.6 3.8 4.5 7.4 13.3
January 4.1 2.9 2.7 7.3 6.8 8.4 14.6
February 3.0 1.7 1.5 9.7 5.3 9.2 11.0
March 4.2 3.0 6.0 8.4 7.0 8.4 12.8
April 3.6 3.1 3.1 5.9 6.6 7.7 11.2
May 2.5 4.1 4.1 6.3 5.3 3.8 9.9
June 1.3 2.3 0.9 3.4 3.4 6.2 5.9
Grand Total 69.2 39.5 33.7 72.2 80.5 90.5 158.1
Figure 11
Seasonal variations of the West Coast Rock Lobster fleet
0
5
10
15
20
25
30
July
Aug
ust
Sep
tem
ber
Oct
ober
Nov
embe
r
Dec
embe
r
Janu
ary
Feb
ruar
y
Mar
ch
Apr
il
May
June
Month
Ton
nes
1991-92 1992-93 1993-94 1994-95 1995-96 1996-97 1997-98

Fish. Res. Rep. Fish. West. Aust.1999, 118, 1-142
48
Table 19 Correlation between price of rock lobster and wetline catches in the West Coast RockLobster fleet.
Live weight (tonnes)
1991-92 1992-93 1993-94 1994-95 1995-96 1996-97 1997-98
Wetline catch 69.2 39.5 33.7 72.2 80.5 90.5 158.1
Rock lobster catch 12,084.7 12,252.9 11,015.7 10,771.8 9,798.1 9,895.5 10,464.0
Approx. price of Rock $20.5 $18.13 $27.25 $27.5 $23.75 $26.75 $20.20lobster per kg.
Figure 12
Impact of price of rock lobster on wetline activity by the West Coast Rock Lobster fleet
1
10
100
1000
10000
100000
1991-92 1992-93 1993-94 1994-95 1995-96 1996-97 1997-98
Year
Ton
nes
$1.00
$11.00
$21.00
$31.00
Approx price of rock lobster
per kg.
Wetline catch Rock lobster catch Approx price of rock lobster per kg.

Fish. Res. Rep. Fish. West. Aust.1999, 118, 1-142
49
2.5.3.2 Seasonal variations in the wetline catch of the Southern Demersal Gillnet andDemersal Longline Managed Fishery
The average wetline component of the Southern Demersal Gillnet and Demersal Longline fleetcatch over the last seven financial years is around 175 tonnes per annum. This reported catch ishigher than the wetline catch of the rock lobster fleet, except for 1997-98. However, this catchhas been decreasing over the last seven years, with 153.3 tonnes being recorded in 1997-98.
During the summer months, some of the Southern Demersal Gillnet and Demersal LonglineFishery units with more diversified operations fish on the beaches, taking Australian herring andwhitebait. This net caught catch accounted for 86 tonnes or 48.6 per cent of the total reportedwetline catch of the Southern Demersal Gillnet and Demersal Longline Fishery during 1996-97and 28.9 tonnes or 18.8 per cent during 1997-98, when whitebait catches were unusually low.The net caught component of the wetline catch accounts for the particularly high summer catchesduring some years.
Also during the summer months, slightly higher drop line and hand line dhufish catches occur.The reason for this phenomenon may be higher consumer demand for dhufish at this time, orperhaps the result of greater catchability of dhufish at this time, or a combination of both. Thetotal reported wetline dhufish catch for this fleet is still relatively low, between 10 and 14 tonnesper annum.
Table 20 lists the seasonal variations of the reported Southern Demersal Gillnet and DemersalLongline Fishery wetline catches (ie. catches of cartilaginous and fin fish taken by methods otherthan demersal gillnet and longline).

Fish. Res. Rep. Fish. West. Aust.1999, 118, 1-142
50
Table 20 Seasonal variations in wetline catches for the Southern Demersal Gillnet and Demersal LonglineManaged Fishery.
MONTH Live weight (tonnes)1991-92 1992-93 1993-94 1994-95 1995-96 1996-97 1997-98
July 9.8 9.8 7.7 6.3 7.8 5.0 17.7
August 13.8 12.7 11.3 6.4 6.3 9.7 17.6
September 8.2 4.4 22.4 4.6 4.8 5.1 12.3
October 7.7 15.1 17.1 5.6 6.1 6.2 14.7
November 12.3 11.1 11.2 8.3 5.8 9.8 9.9
December 25.4 22.0 27.9 23.8 16.3 14.5 11.6
January 33.9 22.5 36.9 19.4 29.8 33.0 13.9
February 31.7 24.3 19.9 11.9 37.8 34.9 11.2
March 13.0 21.0 7.6 26.8 19.4 20.3 15.5
April 32.6 15.0 8.4 8.2 13.7 19.1 13.4
May 15.5 17.3 8.6 4.5 18.4 8.4 6.3
June 6.7 7.2 6.9 4.7 7.2 11.3 9.6
GRAND TOTAL 210.6 182.3 185.9 130.6 173.3 177.4 153.6
Figure 13
Seasonal variations in the wetline catch of the Southern Demersal Gillnet and Demersal Longline Managed Fishery
0
5
10
15
20
25
30
35
40
July
Aug
ust
Sep
tem
ber
Oct
ober
Nov
embe
r
Dec
embe
r
Janu
ary
Feb
ruar
y
Mar
ch
Apr
il
May
June
Month
Ton
nes
1991-92 1992-93 1993-94 1994-95 1995-96 1996-97 1997-98

Fish. Res. Rep. Fish. West. Aust.1999, 118, 1-142
51
2.5.3.3 Seasonal variations in the wetline catch of the Shark Bay Snapper Fishery
The reported wetline catches of the licensed fishing boats authorised to fish in the Shark BaySnapper Managed Fishery are relatively low and vary considerably from year-to-year. This mayreflect ownership changes and/or leasing arrangements within the fishery.
Because hand lines and drop lines are used in the Shark Bay Snapper Managed Fishery, demersalwetfish catches in the area of the Shark Bay Snapper Managed Fishery are classed as �by-catch� byFisheries WA Research Division�s Catch and Effort Statistics. Thus, only hand line and drop linecatches outside that fishery are recorded as wetline catch. The higher reported wetline catchesrecorded during the Shark Bay Snapper peak season reflect the Spanish and other mackerel takenby troll line off Quobba at the same time.
Table 21 shows the seasonal variation in the reported wetline catches of Shark Bay SnapperManaged Fishery boats.

Fish. Res. Rep. Fish. West. Aust.1999, 118, 1-142
52
Table 21 Seasonal variations in the wetline catches of the Shark Bay Snapper Managed Fishery.
MONTH Live weight (tonnes)1991-92 1992-93 1993-94 1994-95 1995-96 1996-97 1997-98
July 3.6 3.9 7.7 4.0 10.5 7.3 10.5
August 2.3 3.2 7.7 5.0 9.5 9.2 19.5
September 4.3 5.4 8.3 6.1 2.2 4.9 8.5
October 4.3 0.1 11.0 11.2 9.1 10.0 14.7
November 7.9 1.9 6.6 13.3 5.4 9.6 11.5
December 1.9 4.4 6.3 9.5 2.6 7.4 7.9
January 3.8 3.6 10.0 4.8 7.8 4.8 5.9
February 5.9 3.9 10.0 4.7 11.5 5.2 5.3
March 9.6 4.8 9.8 5.9 5.8 4.5 2.0
April 9.8 5.9 9.9 9.6 10.8 9.2 5.5
May 6.5 1.4 4.4 7.8 13.5 2.5 1.9
June 0.4 5.7 5.8 4.9 14.0 5.7 3.4
GRAND TOTAL 60.4 44.3 97.7 86.7 102.7 80.3 96.9
Seasonal variations in the wetline catch of the Shark Bay Snapper Managed Fishery
0
2
4
6
8
10
12
14
16
18
20
July
Aug
ust
Sep
tem
ber
Oct
ober
Nov
embe
r
Dec
embe
r
Janu
ary
Feb
ruar
y
Mar
ch
Apr
il
May
June
Month
Ton
nes
1991-92 1992-93 1993-94 1994-95 1995-96 1996-97 1997-98
Figure 14

Fish. Res. Rep. Fish. West. Aust.1999, 118, 1-142
53
3.0 Effect of wetline fishing by species
Concern about the sustainability of certain species, such as dhufish and Spanish mackerel was oneof the reasons for this study. Section 3 looks at these two species, and the other major line caughtwetline species - pink snapper (with an annual catch over 100 tonnes).
This section also examines the effect of wetlining on baldchin groper, a key Mid West species andblue groper, a popular species with the recreational sector mainly found in southern WesternAustralia. It provides an analysis of the licensed fishing boats which target these species and �how�,�where� and �when� they are caught.
The net caught catches of Australian herring and whitebait, which both usually have an annualcatch of over 100 tonnes, have been examined in detail in other papers. These are �Aspects of theBiology and Stock Assessment of the whitebait, Hyperlophus vittatus, in south western Australia�, byDJ Gaughan, WJ Fletcher, RJ Tregonning and J Goh, and �The Western Australian Salmon andAustralian Herring Creel Survey� by S. Ayvasian, R. Lenanton, B. Wise, R. Steckis and G. Nowara.They have therefore not been included in this section.
3.1 Dhufish (Glaucosoma hebraicum)
Dhufish is a long-lived resident demersal fish with a slow growth rate. It is estimated that maledhufish mature at three years and females at three to four years, with the size at maturity being250-300 mm for males and 300-350 mm for females.
Until recently this situation has created a �buffer� for the stock(s), as the legal minimum length of500 mm is reached at around six to seven years. Some northern age composition data alsoindicates that individuals are not fully recruited to the commercial fishery until around 11 years.The maximum age reached by male dhufish is 36 years, while females reach 29 years.
It is vital that full biological and behavioural knowledge of these stocks are obtained, and monitoringof catch and effort continues, in order that rigorous stock assessment can be undertaken and madeavailable as a basis for current and longer term management. Currently, concern is being expressedby Fisheries WA�s Research Division at the escalation of wetline fishing pressure on dhufishstocks), particularly by the rock lobster fleet (R. Lenanton, pers.com. 1998).
The annual reported dhufish wetline catches are shown graphically in Figure 15.
Figure 15
Annual Wetline Catches (tonnes) of Dhufish
0
50
100
150
200
250
1991-92 1992-93 1993-94 1994-95 1995-96 1996-97 1997-98
Year
Ton
nes
GRAND TOTAL
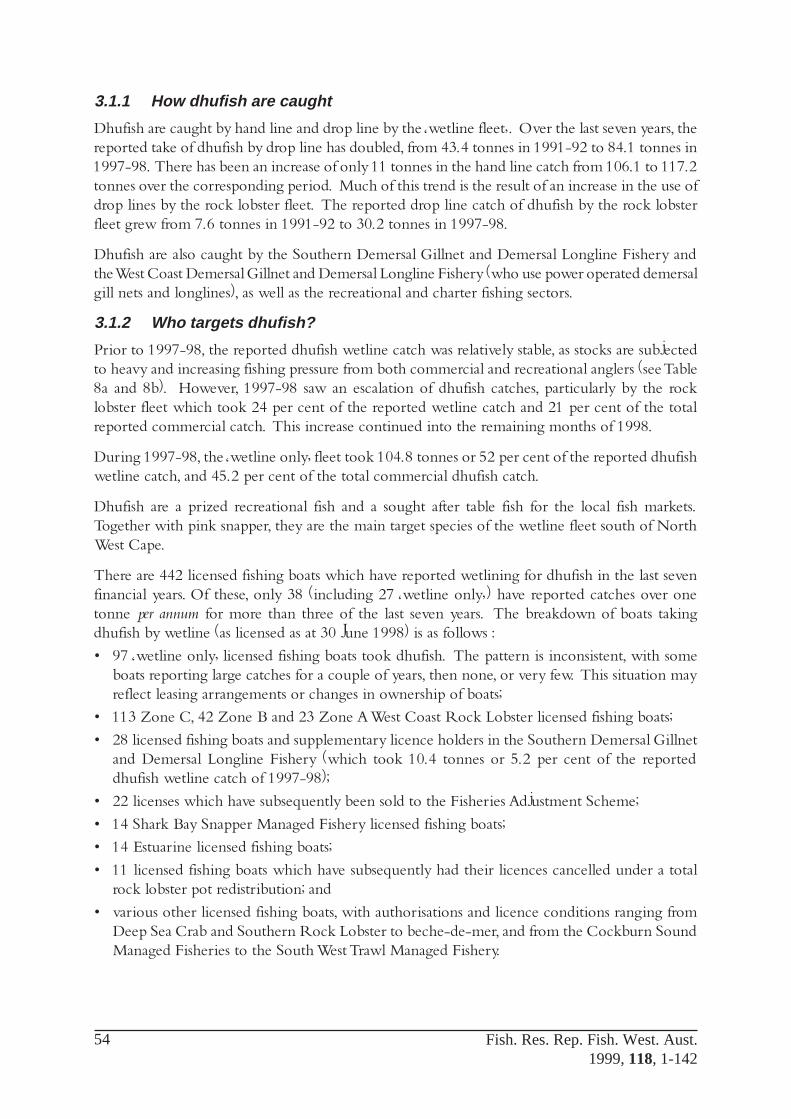
Fish. Res. Rep. Fish. West. Aust.1999, 118, 1-142
54
3.1.1 How dhufish are caught
Dhufish are caught by hand line and drop line by the �wetline fleet�. Over the last seven years, thereported take of dhufish by drop line has doubled, from 43.4 tonnes in 1991-92 to 84.1 tonnes in1997-98. There has been an increase of only 11 tonnes in the hand line catch from 106.1 to 117.2tonnes over the corresponding period. Much of this trend is the result of an increase in the use ofdrop lines by the rock lobster fleet. The reported drop line catch of dhufish by the rock lobsterfleet grew from 7.6 tonnes in 1991-92 to 30.2 tonnes in 1997-98.
Dhufish are also caught by the Southern Demersal Gillnet and Demersal Longline Fishery andthe West Coast Demersal Gillnet and Demersal Longline Fishery (who use power operated demersalgill nets and longlines), as well as the recreational and charter fishing sectors.
3.1.2 Who targets dhufish?
Prior to 1997-98, the reported dhufish wetline catch was relatively stable, as stocks are subjectedto heavy and increasing fishing pressure from both commercial and recreational anglers (see Table8a and 8b). However, 1997-98 saw an escalation of dhufish catches, particularly by the rocklobster fleet which took 24 per cent of the reported wetline catch and 21 per cent of the totalreported commercial catch. This increase continued into the remaining months of 1998.
During 1997-98, the �wetline only� fleet took 104.8 tonnes or 52 per cent of the reported dhufishwetline catch, and 45.2 per cent of the total commercial dhufish catch.
Dhufish are a prized recreational fish and a sought after table fish for the local fish markets.Together with pink snapper, they are the main target species of the wetline fleet south of NorthWest Cape.
There are 442 licensed fishing boats which have reported wetlining for dhufish in the last sevenfinancial years. Of these, only 38 (including 27 �wetline only�) have reported catches over onetonne per annum for more than three of the last seven years. The breakdown of boats takingdhufish by wetline (as licensed as at 30 June 1998) is as follows :
• 97 �wetline only� licensed fishing boats took dhufish. The pattern is inconsistent, with someboats reporting large catches for a couple of years, then none, or very few. This situation mayreflect leasing arrangements or changes in ownership of boats;
• 113 Zone C, 42 Zone B and 23 Zone A West Coast Rock Lobster licensed fishing boats;
• 28 licensed fishing boats and supplementary licence holders in the Southern Demersal Gillnetand Demersal Longline Fishery (which took 10.4 tonnes or 5.2 per cent of the reporteddhufish wetline catch of 1997-98);
• 22 licenses which have subsequently been sold to the Fisheries Adjustment Scheme;
• 14 Shark Bay Snapper Managed Fishery licensed fishing boats;
• 14 Estuarine licensed fishing boats;
• 11 licensed fishing boats which have subsequently had their licences cancelled under a totalrock lobster pot redistribution; and
• various other licensed fishing boats, with authorisations and licence conditions ranging fromDeep Sea Crab and Southern Rock Lobster to beche-de-mer, and from the Cockburn SoundManaged Fisheries to the South West Trawl Managed Fishery.

Fish. Res. Rep. Fish. West. Aust.1999, 118, 1-142
55
3.1.3 Geographical distribution of dhufish catches
Dhufish are predominantly found in waters deeper than 20 metres. Fish caught from this depthare frequently damaged by decompression effects, so the release of undersized fish does not meanthey will survive. There are no data on return rates of undersize fish from any sector.
The commercial dhufish catch extends from Kalbarri on the Mid West coast to near Esperance onthe south coast (see Map 3 and Appendix 6).
During 1997-98, the majority of the increasing reported wetline catches were in blocks 29140and 29142 (Dongara area) and 3014 and 31150 (Jurien to Fremantle area), where over 20 tonneswere reported in each block.
The reported wetline catch of dhufish in the Abrolhos Islands over the last six years, are listedbelow:
• 1992-93, 11.9 tonnes;
• 1993-94, 24.4 tonnes;
• 1994-95, 30.8 tonnes;
• 1995-96, 33.4 tonnes;
• 1996-97, 38.5 tonnes; and
• 1997-98, 46.9 tonnes.
There is very little dhufish caught along the State�s south coast.

Fish. Res. Rep. Fish. West. Aust.1999, 118, 1-142
56

Fish. Res. Rep. Fish. West. Aust.1999, 118, 1-142
57
3.1.4 When dhufish are caught
Usually the lowest reported wetline catches of dhufish are in June, July, August and September(the closed season of the West Coast Rock Lobster Fishery), with most being caught in thesummer months. This situation may be market-driven. The exception to this pattern was 1997-98, when the rock lobster fleet increased its take of dhufish considerably.
Table 22 and Figure 16 show the seasonal variation in the reported dhufish wetline catch.
Table 22 Seasonal wetline catches (tonnes) of Dhufish
MONTH Live weight (tonnes)1991-92 1992-93 1993-94 1994-95 1995-96 1996-97 1997-98
July 12.0 9.8 7.8 6.1 7.0 5.8 15.9
August 14.3 7.9 9.1 10.1 9.1 11.0 22.6
September 11.9 9.1 6.8 8.0 9.6 10.0 18.6
October 10.3 11.0 7.2 12.0 11.9 13.6 18.9
November 13.2 9.3 9.4 13.2 9.6 15.5 17.1
December 18.9 17.1 11.8 17.5 16.3 19.8 19.6
January 18.5 13.9 12.9 14.1 17.5 18.4 17.3
February 13.2 10.9 10.5 14.1 14.4 11.7 12.6
March 11.0 9.5 11.1 11.8 12.6 12.0 17.1
April 12.3 11.4 11.2 9.8 17.3 17.0 17.1
May 9.7 11.0 11.1 11.8 14.3 12.1 14.7
June 5.1 6.8 5.5 7.4 8.1 13.2 10.2
GRAND TOTAL 150.3 127.8 114.5 136.1 147.8 160.0 201.8
Figure 16
Seasonal variations in the wetline catch of Dhufish
0
5
10
15
20
25
July
Aug
ust
Sep
tem
ber
Oct
ober
Nov
embe
r
Dec
embe
r
Janu
ary
Feb
ruar
y
Mar
ch
Apr
il
May
June
Month
Ton
nes
1991-92 1992-93 1993-94 1994-95 1995-96 1996-97 1997-98
Fish. Res. Rep. Fish. West. Aust.1999, 118, 1-142
58
3.2 Spanish mackerel (Scomberomorus commerson)
Spanish mackerel are widespread throughout the tropical and subtropical waters of the Indo-Pacific region and distributed in Western Australian waters from Geographe Bay to the NorthernTerritory Border. Spanish mackerel can be found in shallow coastal waters and range offshore tothe edge of the continental shelf, with adults commonly associated with coral reefs, rocky shoalsand current lines on offshore reef areas.
Spanish mackerel are relatively large, fast growing, pelagic reef associated predatory fish. Theyform large aggregations to spawn and may undertake seasonal migrations to reach spawning sites.After spawning has occurred the aggregations disperse. Fishing activities are concentrated duringthe spawning season.
There are limited data available on which to base an assessment of the status of Spanish mackerelin Western Australian waters. Fishermen from the Kimberley region, from where most of thewetline catch is presently taken, have directly observed a decline in the average size of fish caughtover time. These same fishermen have had to greatly increase their total fishing effort, both innumber of hours fished and the number of tender vessels used, in order to maintain catch rates.They have reported that their mean annual catch has started to decline at a slow rate, but, at thesame time, the effort used (the number of dory hours fished) continues to increase. This situationindicates that actual catch per unit of real effort is showing a significant negative trend.
However, although the effort expended by the long-term, dedicated Spanish mackerel fishers hasgone up, the total catch of Spanish mackerel has also increased. This is due to increased opportunisticcatches by existing fishers who occasionally target Spanish mackerel and �new� licensed fishingboats which have moved into the Spanish mackerel fishery over the last two or three years, takingthe species when the opportunity presents itself.
To further complicate analysis, the recreational catch is likely to be substantial and will consequentlyhave a significant impact on the sustainability of the resource. Furthermore, the recreational catchin the northern regions is known to be increasing.
However, although the abundance of Spanish mackerel has decreased, there is no sign yet thatover-fishing has occurred. On the basis of available knowledge, it appears that there are noimmediate concerns about the Spanish mackerel stock (J. Penn pers. comm., 1998).
The total reported wetline catches of Spanish mackerel over the last seven financial years are setout graphically below in Figure 17. The wetline catch, which makes up the large majority of theSpanish mackerel catch has increased by 134.7 per cent over this period of time.

Fish. Res. Rep. Fish. West. Aust.1999, 118, 1-142
59
Figure 17
3.2.1 How Spanish mackerel are caught
Spanish mackerel are vulnerable to capture by both commercial and recreational fishing. They aremainly caught by the commercial fleet using troll lines (baits and lures) or drifting baits, whilesome are caught by hand line and drop line. Dedicated mackerel fishing units use a �mother� boatand dories (dinghies) when trolling.
There are also a number of opportunistic operators from other managed fisheries such as theKimberley Prawn Fishery, who do not operate dories.
3.2.2 Who targets the Spanish mackerel?
The overall reported Spanish mackerel wetline catch is increasing steadily and is subject to heavyand increasing fishing pressure from both the commercial sector and recreational anglers (seeTables 9a and 9b).
There are 163 licensed fishing boats which have reported wetlining for Spanish mackerel mainlyby trolling in the last seven financial years. There are seven boats which have recently recordedlarge Spanish mackerel catches of between 20 and 100 tonnes. Of these, four have consistentlycaught these amounts over at least four of the last seven financial years. Only one of the sevenlicensed fishing boats does not have access to other fisheries.
There are also a large number of opportunistic operators from other managed fisheries, such as theKimberley Prawn Fishery catching Spanish mackerel.
The breakdown of boats taking Spanish mackerel by wetline methods (as licensed at 30 June1998)is as follows :
• 58 �wetline only� licensed fishing boats, which took 198.1 tonnes or 37.1% of the total Spanishmackerel catch during 1997-98;
• 18 prawn trawlers, mostly with Kimberley Prawn, Exmouth Gulf Prawn and Onslow PrawnManaged Fishery licences;
• 10 licensed fishing boats with either Shark Bay Snapper Managed Fishery licences or SharkBay Snapper Supplementary authorisations;
• eight licensed fishing boats with Northern Demersal Scalefish Managed Fishery licences;
• seven licensed fishing boats have subsequently been sold to the Fisheries Adjustment Scheme;and
• various other licensed fishing boats, with authorisations and licence conditions including beche-de-mer, the South Coast Purse Seine Fishery and the North Coast Shark Fishery..
Annual Wetline Catches (tonnes) of Spanish Mackerel
0
100
200
300
400
500
600
1991-92 1992-93 1993-94 1994-95 1995-96 1996-97 1997-98
Year
Ton
nes
GRAND TOTAL

Fish. Res. Rep. Fish. West. Aust.1999, 118, 1-142
60
3.2.3 Geographical distribution of Spanish mackerel catches
Fishermen have located the places where spawning Spanish mackerel aggregate and concentratefishing activities on these areas until the fish either move on or are depleted. Therefore, almost allfishing blocks in the area where the aggregations occur are consistently fished. The major trollingareas extend from the Northern Territory border to the Abrolhos Islands (see Map 4 and Appendix6)
The most heavily fished blocks for Spanish mackerel (over 20 tonnes) based on the 1997-98catches are:
• Blocks 13250 (46.5 tonnes) and 13260 (25.7 tonnes) near Wyndham;
• Block 14250 (75.1 tonnes) between Wyndham and Derby;
• Blocks 16210 (20.4 tonnes) and 16220 (34.2 tonnes) between Derby and Broome;
• Block 17210 (20.5 tonnes) between Derby and Broome;
• Block 18200 (24.3 tonnes) near Broome;
• Block 19190 (43.0 tonnes) near Port Hedland; and
• Block 24131 near Carnarvon and Quobba (21.6 tonnes).
Although Spanish mackerel catches in the Kimberley continue to climb, anecdotal evidence suggeststhere also appears to be a lack of larger and presumably older fish in the catch, and localiseddepletions that are not immediately renewed by new fish are moving into existing fishing sites.Catches of Spanish mackerel in the Pilbara and further south are increasing.

Fish. Res. Rep. Fish. West. Aust.1999, 118, 1-142
61

Fish. Res. Rep. Fish. West. Aust.1999, 118, 1-142
62
3.2.4 When Spanish mackerel are caught
There is a marked seasonal variation in Spanish mackerel catches, with the summer monthsproviding considerably lower catches than the winter months. This situation may relate to fishingconditions and/or catchability of the fish.
Table 23 and Figure 18 show the seasonal variation in the reported Spanish mackerel catches.
Table 23 Seasonal wetline catches (tonnes) of Spanish Mackerel.
MONTH Live weight (tonnes)
1991-92 1992-93 1993-94 1994-95 1995-96 1996-97 1997-98
July 34.7 29.7 67.6 103.2 114.3 69.1 120.3
August 39.0 37.6 57.8 113.8 90.5 96.1 150.2
September 38.3 30.6 57.7 57.1 65.1 65.4 70.4
October 47.9 27.4 62.0 52.0 22.0 35.7 45.4
November 28.3 15.5 24.6 2.8 8.0 15.1 20.5
December 7.4 3.4 1.8 1.4 1.1 7.4 2.9
January 1.3 1.7 8.7 2.1 0.7 0.7 3.9
February 0.9 1.9 5.5 1.5 2.4 2.3 2.3
March 4.5 7.0 10.9 4.2 6.3 11.0 8.4
April 6.4 10.0 22.0 19.4 21.7 19.8 21.6
May 3.6 22.8 32.4 29.7 35.2 64.4 27.4
June 16.3 40.7 74.3 58.5 103.3 89.7 63.3
GRAND TOTAL 228.6 228.4 425.3 445.7 470.7 476.7 536.5
Figure 18
Seasonal variations in the wetline catch of Spanish Mackerel
0
20
40
60
80
100
120
140
160
July
Aug
ust
Sep
tem
ber
Oct
ober
Nov
embe
r
Dec
embe
r
Janu
ary
Feb
ruar
y
Mar
ch
Apr
il
May
June
Month
Ton
nes
1991-92 1992-93 1993-94 1994-95 1995-96 1996-97 1997-98

Fish. Res. Rep. Fish. West. Aust.1999, 118, 1-142
63
3.3 Pink snapper (Pagrus auratus)
Pink snapper are a generally wide-ranging demersal fish. They occur in waters from the DampierArchipelago in the north of the State to the South Australian border in the south. Majorconcentrations of adult fish occur off Shark Bay, the Abrolhos Islands and in Cockburn Sound.Juveniles are found in sheltered coastal embayments and estuaries, such as Wilson Inlet and CockburnSound. In the Shark Bay region, the inner bay populations are genetically distinct from fish in theoffshore areas, making the inner bay stocks especially vulnerable to overfishing.
The Shark Bay Snapper Managed Fishery exists in �outer� Shark Bay and the offshore region,where there is a total allowable catch of 550 tonnes per annum.
Each year, gatherings of spawning pink snapper, called �aggregations�, form, which are highlyvulnerable to capture by the commercial, charter boat and recreational fishing sectors. Measuresare in place to protect the aggregations of Shark Bay and Cockburn Sound pink snapper stocksfrom over exploitation by the three fishing sectors.
The total reported wetline catches of pink snapper over the last seven financial years are set outgraphically below in Figure 19.
Figure 19
3.3.1 How pink snapper are caught
Pink snapper are taken by hand line and drop line by the wetline fleet. They are also targeted byfishermen in the Southern Demersal Gillnet and Demersal Longline Fishery and the West CoastDemersal Gillnet and Demersal Longline Fishery (who use power operated demersal gill nets andlonglines), and the charter boat and recreational fishing sectors.
Annual Wetline Catches (tonnes) of Pink Snapper
050
100150200250300350
1991-92 1992-93 1993-94 1994-95 1995-96 1996-97 1997-98
Year
Ton
nes
GRAND TOTAL
Fish. Res. Rep. Fish. West. Aust.1999, 118, 1-142
64
3.3.2 Who targets pink snapper?
The overall reported pink snapper wetline catch has remained relatively stable around a mean. Itis also subject to heavy and increasing fishing pressure by recreational anglers (see Tables 14a and14b).
Pink snapper are a prized recreational fish and a sought after table fish in the local fish markets.Together with dhufish, they are the main target species of the wetline fleet south of North WestCape.
There are 466 licensed fishing boats which have taken pink snapper as part of their wetlineactivities in the last seven financial years. Most of these boats took small, inconsistent catches.Only 46 have taken more than one tonne in three of the last seven years.
The breakdown of boats taking pink snapper by wetline (as licensed at 30 June 1998) is as follows:
• 103 �wetline only� licensed fishing boats - 30 of these took over one tonne in three of the lastseven years. The �wetline only� fleet took 128.2 tonnes, or 55.6 per cent of the wetline catch ofpink snapper during 1997-98;
• 103 Zone C, 38 Zone B and 24 Zone A West Coast Rock Lobster licensed fishing boats;
• 42 Southern Demersal Gillnet and Demersal Longline and supplementary Southern DemersalGillnet and Demersal Longline licensed fishing boats;
• * 17 Shark Bay Snapper and Supplementary Shark Bay Snapper Managed Fishery licensedfishing boats, of which nine caught over one tonne by wetlining in three of the last sevenfinancial years. The 1997-98 pink snapper wetline catch of boats in this fishery was 33 tonnes,or 15.4 per cent of the total wetline catch;
• 17 South Coast Purse Seine licensed fishing boats;
• 12 Prawn Trawlers, mainly with Kimberley Prawn, Exmouth Gulf Prawn and Onslow PrawnManaged Fishery licences;
• seven South West Salmon licensed fishing boats; and
• various other licensed fishing boats, ranging from those with reef top molluscs and leatherjacketlicence conditions to the Esperance Southern Rock Lobster Managed Fishery.
* This does not include the pink snapper catch of these boats within the waters of the Shark Bay Snapper Managed Fishery.

Fish. Res. Rep. Fish. West. Aust.1999, 118, 1-142
65
3.3.3 Geographical distribution of pink snapper catches
The reported wetline pink snapper catch extends from the Dampier Archipelago to near Esperance(see Map 5 and Appendix 6). The most heavily fished wetline areas for pink snapper based on1997-98 reported catches are :
• Block 2713 off Kalbarri (36.4 tonnes); and
• The Abrolhos Islands (53.2 tonnes).
Note that these areas do not include Shark Bay, which contains a managed fishery for pink snapper.
There are three or four other blocks where wetline catches of over 20 tonnes had previously beenrecorded, but wetline catches of this magnitude were not taken in 1997-98. It is not knownwhether this is due to marketing reasons, or if there are localised depletions of stocks, or acombination of both.
Like dhufish, relatively high pink snapper catches are taken in the Abrolhos Islands. Catches fromthe Abrolhos Islands are listed below:
• 1992-93, 17.6 tonnes;
• 1993-94, 57.7 tonnes;
• 1994-95, 63.6 tonnes;
• 1995-96, 83.8 tonnes;
• 1996-97, 62.1 tonnes; and
• 1997-98, 53.2 tonnes.
Very little is known about the Abrolhos Islands stocks of pink snapper. There is some conjecturethat the islands may act as a nursery area for the oceanic stocks from Shark Bay (M. Moran, pers.comm. 1998).
Further south, near the Perth metropolitan area, catches initially showed a steady increase, but thishas been followed by a gradual decline; for example between Mandurah and Fremantle, catchesrose from 3.5 tonnes in 1991-92 to 15.7 tonnes in 1994-95, but fell to 8.3 tonnes in 1995-96 andin 1997-98 was 10.3 tonnes. A similar catch pattern occurred between Fremantle and Lancelin.
In the south west of the State, catches are steadily increasing, from a generally low base. Thus thefishing block between Cape Leeuwin and Cape Naturaliste shows catches increasing from 1.4tonnes in 1991-92 to 5.7 tonnes in 1996-97, falling to 4.7 tonnes in 1997-98.
Catches of pink snapper along the south coast of Western Australia are generally low.

Fish. Res. Rep. Fish. West. Aust.1999, 118, 1-142
66

Fish. Res. Rep. Fish. West. Aust.1999, 118, 1-142
67
3.3.4 When pink snapper is caught
The time when pink snapper are most catchable in the Shark Bay Snapper Fishery is in June andJuly, which generally corresponds with the lowest wetline catches of this species. The highestwetline catches of pink snapper are usually around August and March to April, which correspondwith the Shark Bay Snapper fleet moving into and out of the managed fishery area.
Table 24 nearby shows the reported seasonal wetline catches for pink snapper.
Table 24 Seasonal wetline catches (tonnes) for Pink Snapper.
MONTH Live weight (tonnes)
1991-92 1992-93 1993-94 1994-95 1995-96 1996-97 1997-98
July 24.3 22.4 15.1 20.0 25.1 13.5 13.7
August 25.5 12.1 16.1 24.8 26.4 25.7 29.5
September 16.7 13.8 18.9 21.4 24.7 18.0 17.4
October 17.5 14.3 13.9 25.0 38.5 24.7 21.3
November 18.4 12.5 12.6 19.6 24.9 25.1 22.2
December 16.6 15.0 15.5 18.3 18.2 19.4 14.8
January 16.9 11.5 18.1 15.9 29.8 23.8 14.1
February 17.0 14.9 21.2 30.1 32.7 20.8 14.7
March 21.3 17.2 30.7 35.2 33.2 20.3 26.9
April 23.9 12.7 24.9 26.2 35.4 34.3 24.0
May 16.2 16.0 28.9 23.4 33.4 19.3 16.9
June 10.2 13.3 19.8 17.4 13.9 19.8 14.9
GRAND TOTAL 224.5 175.7 235.7 277.3 336.2 264.9 230.5
Figure 20
Seasonal variations in the wetline catch of Pink Snapper
0
5
10
15
20
25
30
35
40
July
Aug
ust
Sep
tem
ber
Oct
ober
Nov
embe
r
Dec
embe
r
Janu
ary
Feb
ruar
y
Mar
ch
Apr
il
May
June
Month
Ton
nes
1991-92 1992-93 1993-94 1994-95 1995-96 1996-97 1997-98

Fish. Res. Rep. Fish. West. Aust.1999, 118, 1-142
68
3.4 Baldchin groper (Choerodon rubescens)
Baldchin groper is a long-lived resident demersal fish species. They are thought to change sexfrom female to male at around four years and a length of 40 cm. Baldchin groper are heavilytargeted by both commercial and recreational sectors, particularly in the Abrolhos Islands, wherethere is a high level of public concern about its diminishing numbers.
A research program on baldchin groper in the Easter and Wallabi Groups of the Abrolhos Islandsis being conducted by Fisheries WA to determine growth rates, reproductive biology and populationdensity.
The total reported wetline catches of baldchin groper over the last seven financial years are set outgraphically below in Figure 21.
Figure 21
3.4.1 How baldchin groper are caught
Baldchin groper are taken by hand line and drop line by the wetline fleet. They are also taken bythe Southern Demersal Gillnet and Demersal Longline and the West Coast Demersal Gillnet andDemersal Longline Fisheries (who use power operated demersal gill nets and longlines), and therecreational and charter fishing sectors.
Annual Wetline Catches (tonnes) of Baldchin Groper
0
10
20
30
40
50
1991-92 1992-93 1993-94 1994-95 1995-96 1996-97 1997-98
Year
Ton
nes
GRAND TOTAL
Fish. Res. Rep. Fish. West. Aust.1999, 118, 1-142
69
3.4.2 Who targets baldchin groper?
The overall reported baldchin groper wetline catch is steady around a mean of about 33 tonnes perannum.
Wetline catches reported from the Abrolhos Islands make up a significant proportion of the totalcommercial catch (see Table 10a).
There are 291 licensed fishing boats which have reported taking baldchin groper as part of theirwetline activities in the last seven financial years. Only seven, (including six �wetline only� licensedfishing boats) have taken over one tonne per annum in three or more of the last seven financialyears. The breakdown of boats taking baldchin groper by wetline activities (as licensed at 30 June1998) is as follows :
• 86 �wetline only� licensed fishing boats. During 1997-98 these boats accounted for 18.9 tonnes,or 54 per cent of the total wetline catch of baldchin groper;
• 67 Zone C, 29 Zone B and 20 Zone A West Coast Rock Lobster licensed fishing boats. Theseaccounted for 26 per cent (9.1 tonnes) of the 1997-98 wetline catch;
• 18 Shark Bay Snapper and Supplementary Shark Bay Snapper licensed fishing boats;
• various other licensed fishing boats, ranging from those from the Abalone Managed Fishery toones with beche-de-mer and octopus licence conditions and North Coast Shark authorisations.
3.4.3 Geographical distribution of baldchin groper catches
Around 45.8 per cent of the 1997-98 total commercial catch of baldchin groper is from thereported wetline fishing in the Abrolhos Islands (see Map 6, Table 10a and Appendix 6).

Fish. Res. Rep. Fish. West. Aust.1999, 118, 1-142
70

Fish. Res. Rep. Fish. West. Aust.1999, 118, 1-142
71
3.4.4 When baldchin groper are caught
There is little seasonal variation in the reported baldchin groper wetline catch. However, there aremore baldchin groper caught in March, April and May, coinciding with the opening of Zone A ofthe West Coast Rock Lobster Fishery.
The seasonal variations are shown below in Table 25.
Table 25 Seasonal wetline catches for Baldchin Groper
MONTH Live weight (tonnes)
1991-92 1992-93 1993-94 1994-95 1995-96 1996-97 1997-98
July 3.8 2.6 3.2 1.8 1.9 1.7 2.9
August 3.7 2.5 2.5 2.8 3.7 2.5 3.8
September 3.7 4.2 2.2 3.5 2.4 1.6 3.8
October 3.6 3.8 2.4 2.6 3.6 2.9 3.2
November 3.8 2.4 2.0 2.7 2.4 3.2 3.2
December 3.3 3.4 1.2 2.5 2.0 2.0 2.7
January 2.9 2.2 1.7 2.4 2.8 2.0 1.9
February 3.3 1.8 2.5 2.6 3.3 2.2 1.3
March 3.3 2.7 2.7 2.9 2.8 3.1 4.1
April 4.0 2.9 2.6 3.3 4.0 4.1 3.7
May 2.7 2.5 2.9 3.2 4.0 2.7 2.5
June 2.4 1.4 1.5 2.0 1.8 1.8 2.0
GRAND TOTAL 40.6 32.3 27.3 32.2 34.8 29.9 35.0
Figure 22
Seasonal variations in the wetline catch of Baldchin Groper
0
0.5
1
1.5
2
2.5
3
3.5
4
4.5
July
Aug
ust
Sep
tem
ber
Oct
ober
Nov
embe
r
Dec
embe
r
Janu
ary
Feb
ruar
y
Mar
ch
Apr
il
May
June
Month
Ton
nes
1991-92 1992-93 1993-94 1994-95 1995-96 1996-97 1997-98

Fish. Res. Rep. Fish. West. Aust.1999, 118, 1-142
72
3.5 Blue groper (Achoerodus gouldii)
Western blue groper (blue groper) ranges from Port Phillip Bay in Victoria to the Abrolhos Islandsin Western Australia. There is little biological information available on this species and no stockassessments on this species in Western Australia have been carried out. It is very closely related tothe eastern blue groper, which has been the subject of more scientific research. Western bluegroper is known to change sex, with males being the larger and blue in colour and females beingsmaller and greenish in colour.
The adults� habitat are coastal to offshore rocky reefs, while the juveniles usually inhabit shallowand relatively protected waters, including south coast estuaries.
It can be inferred from the biology of similar species that western blue groper are long lived(greater than 20 years) which makes them vulnerable to overfishing. The sex change that happensto blue groper during their lives makes them even more vulnerable to overfishing.
The total reported wetline catches of blue groper over the last seven financial years are set outgraphically below in Figure 23.
Figure 23
3.5.1 How blue groper are caught
Blue groper are taken by hand line, drop line and hand hauled gillnets by the wetline fleet. Theyare also taken by the Southern Demersal Gillnet and Demersal Longline and the West CoastDemersal Gillnet and Demersal Longline Fishery (who use power operated demersal gill nets andlonglines), as well as the recreational and charter boat fishing sectors.
Annual Wetline Catches (tonnes) of Blue Groper
0
2
4
6
8
10
1991-92 1992-93 1993-94 1994-95 1995-96 1996-97 1997-98
Year
Ton
nes
GRAND TOTAL

Fish. Res. Rep. Fish. West. Aust.1999, 118, 1-142
73
3.5.2 Who targets blue groper?
Because of its geographic spread, blue groper is mostly caught by licensed fishing boats based onthe south or south west coasts of the State. Most catches are very low per licensed fishing boat,with only one boat reporting wetline catches of more than one tonne in three of the last sevenyears.
Blue groper therefore appears to be an incidental catch, rather than a targeted species of thewetline fleet.
There are 178 licensed fishing boats which have reported taking blue groper as part of theirwetline activities over the last seven financial years. The breakdown of boats which reportedtaking blue groper by wetline activities (as licensed on 30 June 1998) is:
• 48 �wetline only� licensed fishing boats;
• 35 Zone C, four Zone B and three Zone A West Coast Rock Lobster licensed fishing boats;
• 27 Southern Demersal Gillnet and Demersal Longline (Managed Fishery and Supplementary)licensed fishing boats;
• 11 licensed fishing boats have subsequently been sold to the Fisheries Adjustment Scheme;
• seven licensed fishing boats with Estuarine licence conditions;
• six South Coast Salmon licensed fishing boats; and
• various other licensed fishing boats, ranging from those with herring conditions to ones fromthe South West Salmon, Abalone and Abrolhos Islands and Mid West Trawl Managed Fisheries.
3.5.3 Geographical distribution of blue groper catches
The geographical distribution of blue groper wetline catches are shown on Map 7 and Appendix6. During 1997-98, small catches of under one tonne were recorded between Geraldton to theGreat Australian Bight in virtually every inshore block.

Fish. Res. Rep. Fish. West. Aust.1999, 118, 1-142
74

Fish. Res. Rep. Fish. West. Aust.1999, 118, 1-142
75
3.5.4 Seasonal variations in blue groper catches
More blue groper appears to be caught by wetline fishing during the summer months than thewinter months (as for dhufish), which may be market driven.
Table 26 and Figure 24 show the seasonal variation in the reported blue groper wetline catch.
Table 26 Seasonal wetline catches for Blue Groper
MONTH Live weight (tonnes)
1991-92 1992-93 1993-94 1994-95 1995-96 1996-97 1997-98
July 0.1 0.4 0.1 0.3 0.1 0.2 1.3
August 0.2 0.1 - 0.4 0.2 0.1 0.5
September 0.4 0.2 0.5 0.4 0.1 - 0.5
October 0.2 0.5 0.5 0.9 0.9 0.2 0.4
November 0.5 0.4 0.4 1.2 0.5 0.5 0.4
December 0.4 0.7 0.6 0.8 1.1 0.9 0.6
January 0.4 1.3 1.1 0.3 0.5 0.3 0.5
February 0.3 1.7 1.0 0.7 0.9 0.3 0.7
March 0.5 1.3 0.5 0.9 0.7 0.3 0.7
April 0.4 1.1 0.5 0.9 0.6 0.3 1.0
May 0.3 0.8 0.4 0.5 0.7 0.2 0.6
June 0.7 0.8 0.8 0.3 0.4 0.2 0.3
GRAND TOTAL 4.4 9.3 6.4 7.6 6.8 3.5 7.4
Figure 24
Seasonal Variations in the wetline catch of Blue Groper
0
0.2
0.4
0.6
0.8
1
1.2
1.4
1.6
1.8
July
Aug
ust
Sep
tem
ber
Oct
ober
Nov
embe
r
Dec
embe
r
Janu
ary
Feb
ruar
y
Mar
ch
Apr
il
May
June
Month
Ton
nes
1991-92 1992-93 1993-94 1994-95 1995-96 1996-97 1997-98

Fish. Res. Rep. Fish. West. Aust.1999, 118, 1-142
76
4.0 Major geographical areas for wetline fishing
This section examines the major geographical wetline fishing areas in the State. These are the linecaught wetline �hot spot�, of the Abrolhos Islands, and waters in the Perth metropolitan area andthe South West, where the line caught species usually make up about two thirds of the wetlinecatch.
Little line caught wetlining is reported along the south coast of WA, so this area has not beenexamined in Section 4. Australian herring is the major wetline species reported on the southcoast. As discussed in Section 3, this species has already been the subject of the Australian Salmonand Australian Herring Creel Survey and has not been discussed in this paper.
4.1 Wetlining in the Abrolhos Islands
The reported wetline catches from the waters surrounding the Abrolhos Islands (taken as Blocks97011, 97012, 97013, 97014, 97015) is around two thirds of the catch from the Perth metropolitanarea and the line caught catch of the South West area combined (over 200 tonnes in the last threefinancial years).
Although the Abrolhos Islands fishing block numbers were initiated in 1989, they did not comeinto general use until 1992-93. From the current CAES data, it is difficult to estimate the wetlinecatches from the Abrolhos prior to that time.
Commercial fishing has been examined by the Abrolhos Islands Management Advisory Committeein their �Draft Management of the Houtman Abrolhos System� paper of December 1997 and thefinal management plan �Management of the Houtman Abrolhos System� released in December1998.
Both papers acknowledge there are large and increasing wetline catches of a number of species inthe Abrolhos, particularly those which are of prime importance to the recreational fishing sectorand to the local fish markets. The �Management of the Houtman Abrolhos System� recommendedthat immediate action be taken to reduce wetline fishing in the Abrolhos Islands to limit totalcatch. As part of reducing effort, the report recommends that negotiations should be undertakenwith fishing boat licence holders to prohibit commercial wetline activities within the shallows ofthe main island groups (Recommendation 71).
Wetline catches in the Abrolhos Islands are shown in Appendix 7. The total catches for the lastseven financial years are shown graphically in Figure 25.

Fish. Res. Rep. Fish. West. Aust.1999, 118, 1-142
77
Figure 25
4.1.1 How the wetline catch is taken in the Abrolhos Islands
The most significant reported wetline catch is taken by hand line (177.4 tonnes in 1997-98). Thishas increased from 60.2 tonnes in 1991-92. The reported use of drop lines has also increased, from5.1 tonnes taken in 1991-92 to 38.9 tonnes in 1997-98. Few other methods have been used.
4.1.2 Species taken by wetlining in the Abrolhos Islands
The wetline fleet targets a variety of finfish, largely reef species, taken by hand line and drop line.The major species targeted include pink snapper, baldchin groper, dhufish, Spanish mackerel andcoral trout.
The major part of the pink snapper stock is located off Shark Bay, but there is some scientificconjecture that the Abrolhos Islands may serve as a nursery area for this stock (M. Moran, pers.comm., 1998). The reported pink snapper catches in the Abrolhos Islands are shown on Map 5. Inthe last six financial years, the reported wetline catch of pink snapper rose from 17.6 tonnes in1992-93 to 83.8 tonnes in 1995-96, declining in 1997-98 to 53.4 tonnes.
According to the �Draft Management of the Houtman Abrolhos System� paper, the AbrolhosIslands system is the main breeding area for one species of coral trout that is found in WesternAustralian waters. Because the Abrolhos system is relatively isolated from other shelf-edge coralreef systems, it is highly probable that its coral trout population is genetically distinct from all otherpopulations of this species in Western Australia. The reported coral trout wetline catches in theAbrolhos are shown below :
• 1992-93, 1.7 tonnes;
• 1993-94, 4.3 tonnes;
• 1994-95, 4.7 tonnes;
• 1995-96, 4.3 tonnes;
• 1996-97, 8.8 tonnes; and
• 1997-98, 10.2 tonnes.
Annual Wetline Catches (tonnes) in waters surrounding the Houtman Abrolhos Islands
0
50
100
150
200
250
1992-93 1993-94 1994-95 1995-96 1996-97 1997-98
Year
Ton
nes
GRAND TOTAL

Fish. Res. Rep. Fish. West. Aust.1999, 118, 1-142
78
Baldchin groper and dhufish are thought to have a lower dependence on the Abrolhos reef systemthan coral trout, but it is likely that the Abrolhos supports an important component of the breedingstock of each of these species.
The wetline catches of baldchin groper and dhufish are discussed in Section 3. If numbers ofbaldchin groper, coral trout, pink snapper and dhufish are falling, this may affect the balance of themarine ecosystem at the Abrolhos.
4.1.3 Who wetlines in the Abrolhos?
In total, 92 licensed fishing boats have reported wetlining in the waters surrounding the AbrolhosIslands during the last six financial years. During 1997-98, 41 licensed fishing boats reportedwetlining in the Abrolhos Islands, up from 21 boats in 1992-93.
Large numbers of wetfish are caught by visiting family and friends of Zone A rock lobster fishinglicence holders. This catch cannot be estimated accurately, but may be as large as the total wetlinecatch (R. Owens, pers. comm. 1998).
The breakdown of licensed fishing boats wetlining in the Abrolhos over the last six financial years(as licensed at 30 June 1998) is:
• 38 �wetline only� licensed fishing boats. Of these only four have fished all six financial years, 10fished during 1992-93 and 18 fished during 1997-98;
• three Zone C, three Zone B and 20 Zone A West Coast Rock Lobster licensed fishing boats;
• five Shark Bay Snapper Managed Fishery licensed fishing boats; and
• assorted other licensed fishing boats, ranging from ones from the Abrolhos Islands Trawl Fishery,the Demersal Gillnet and Longline fisheries to Abalone Managed Fishery licensed fishingboats.
Only 26 of the licensed fishing boats have fished for three or more of the last six years. Of these14 are �wetline only� boats and four are Shark Bay Snapper boats. Most West Coast Rock Lobsterlicensed fishing boats report taking only small amounts of fish.
Most boats demonstrate a sporadic pattern of wetline fishing in the Abrolhos. Most wetline in theAbrolhos for a couple of years. Some report taking catches of one tonne or more, then do notwetline there again. Perhaps of some concern is that 25 new licensed fishing boats fished in thearea in the last two years. Slightly more boats appear to be taking larger catches; for exampleduring 1997-98 nine boats took over 10 tonnes and 17 boats took between one and 10 tonnes,whereas eight took over 10 tonnes and 14 took between one and 10 tonnes during 1994-95.
The other commercial group targeting the cartilaginous fish and finfish in the Abrolhos Islands arethe licensed fishing boats which had power operated net hauler licence conditions on 30 June1998. These boats are now under management and the fishery has become the West CoastDemersal Gillnet and Demersal Longline Interim Managed Fishery.
The charter and recreational fishing sectors also increasingly visit the Abrolhos Islands.
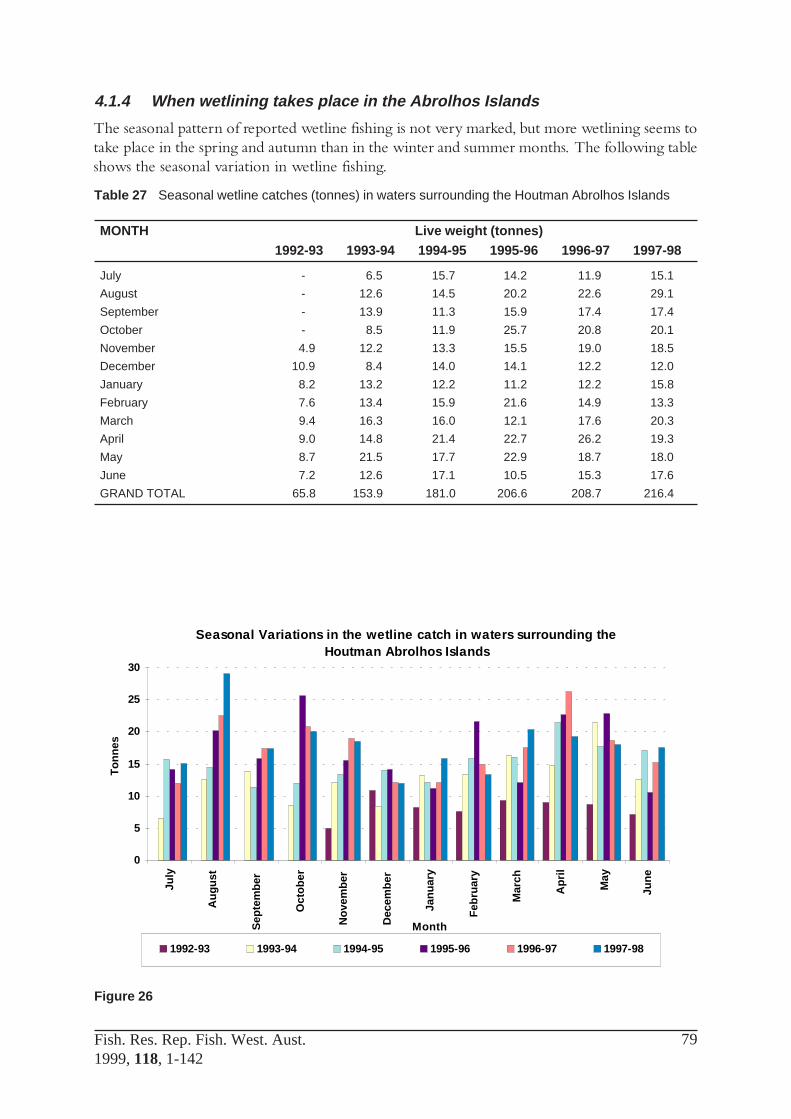
Fish. Res. Rep. Fish. West. Aust.1999, 118, 1-142
79
4.1.4 When wetlining takes place in the Abrolhos Islands
The seasonal pattern of reported wetline fishing is not very marked, but more wetlining seems totake place in the spring and autumn than in the winter and summer months. The following tableshows the seasonal variation in wetline fishing.
Table 27 Seasonal wetline catches (tonnes) in waters surrounding the Houtman Abrolhos Islands
MONTH Live weight (tonnes)1992-93 1993-94 1994-95 1995-96 1996-97 1997-98
July - 6.5 15.7 14.2 11.9 15.1
August - 12.6 14.5 20.2 22.6 29.1
September - 13.9 11.3 15.9 17.4 17.4
October - 8.5 11.9 25.7 20.8 20.1
November 4.9 12.2 13.3 15.5 19.0 18.5
December 10.9 8.4 14.0 14.1 12.2 12.0
January 8.2 13.2 12.2 11.2 12.2 15.8
February 7.6 13.4 15.9 21.6 14.9 13.3
March 9.4 16.3 16.0 12.1 17.6 20.3
April 9.0 14.8 21.4 22.7 26.2 19.3
May 8.7 21.5 17.7 22.9 18.7 18.0
June 7.2 12.6 17.1 10.5 15.3 17.6
GRAND TOTAL 65.8 153.9 181.0 206.6 208.7 216.4
Figure 26
Seasonal Variations in the wetline catch in waters surrounding the Houtman Abrolhos Islands
0
5
10
15
20
25
30
July
Aug
ust
Sep
tem
ber
Oct
ober
Nov
embe
r
Dec
embe
r
Janu
ary
Feb
ruar
y
Mar
ch
Apr
il
May
June
Month
Ton
nes
1992-93 1993-94 1994-95 1995-96 1996-97 1997-98

Fish. Res. Rep. Fish. West. Aust.1999, 118, 1-142
80
4.2 Wetlining near the Perth metropolitan area (blocks 31150 and32150)
There is a large and generally declining wetline catch reported in the inshore fishing blocks(31150 and 32150) between Mandurah and Lancelin (See Appendix 7). This catch has declinedby nearly one third over the last seven financial years, going from 247 tonnes in 1991-92, to 171tonnes in 1997-98. However, the 1997-98 catch is atypical of the general trend, and is 40 tonneshigher than the previous year. The reason for this is likely to be the increase in the number of rocklobster boats wetlining during this period. Other licensed fishing boats also reported wetlining orentered the wetline fishery for the first time during this period, perhaps in reaction to industryrumour about a wetline study.
The reasons for the general downward trend in reported wetline fishing are unclear. However, thePerth metropolitan area obviously has large and increasing recreational and charter boat fishingpressure - the decline in the wetline catch may reflect the increasing catch share from these twosectors, along with a regional decline in the abundance of the most important target species.
Reported wetline catches of the Perth metropolitan area are shown in Appendix 7. The totalcatches for the last seven financial years are shown graphically in Figure 27.
Figure 27
4.2.1 How wetline catch is taken in the Perth metropolitan area
A variety of methods are used to wetline in the Perth metropolitan region. However, hand liningand drop lining are the two most common methods. While the catches for all other methods havedropped or stayed the same, the reported wetline catches for these two methods have doubled,with drop lining catches rising from 29.6 tonnes in 1991-92 to 79.2 tonnes in 1997-98 and handlining catches rising from 29.4 tonnes in 1991-92 to 48.2 tonnes in 1997-98.
Annual Wetline Catches (tonnes) in the waters off the Perth Metropolian Area
0
50
100
150
200
250
1991-92 1992-93 1993-94 1994-95 1995-96 1996-97 1997-98
Year
Ton
nes
GRAND TOTAL
Fish. Res. Rep. Fish. West. Aust.1999, 118, 1-142
81
4.2.2 Species taken by wetlining near the Perth metropolitan area
As well as the recreational, charter and wetline sectors, there are a number of other fisheries in andaround the Perth metropolitan area which target cartilaginous fish and finfish stocks and crabs.These include the Cockburn Sound Managed Fisheries, the West Coast Purse Seine ManagedFishery, and those boats which now form part of the West Coast Demersal Gillnet and DemersalLongline Interim Managed Fishery.
The wetline fleet takes a wide variety of species from the waters off the Perth metropolitan area,contributing significantly to the overall level of pressure experienced by the finfish resources ofthis region. The largest reported wetline catches in 1997-98, in excess of five tonnes, were as follows:• dhufish, 39 tonnes;
• sea mullet, 13.3 tonnes;
• sand crabs, 10.9 tonnes;
• samsonfish, 20 tonnes;
• various species of shark, 29.6 tonnes; and
• pink snapper, 21.2 tonnes
Dhufish and pink snapper are prized recreational species. The dhufish catch remained around 20tonnes until 1997-98, but the pink snapper catch rose from 9.5 tonnes in 1991-92 to 26.4 tonnesin 1995-96, before falling to 12.7 tonnes in 1996-97 and rising again to 21.2 tonnes in 1997-98.
This situation may be a consequence of environmental conditions during 1994-95, when therewere large schools of spawning snapper aggregating in and around Cockburn Sound. However, itmay also be a reflection of broader overfishing trends being experienced in the Perth metropolitanarea. Seasonal conservation measures were introduced from 1996 onwards to protect the spawningaggregations of snapper in the Perth metropolitan area from excessive recreational fishing pressure.
4.2.3 Who wetlines in the Perth metropolitan area?
In total, 241 licensed fishing boats wetlined in the waters off the Perth metropolitan region overthe last seven financial years, with 106 reporting wetlining during 1997-98. Usually between 80and 100 boats wetline in this area each year.
There are a number of licensed fishing boats from the south and south west of the State whichhave recorded generally small, sporadic catches in the Perth metropolitan area, as have a smallernumber of Geraldton registered boats. The vast majority of the boats wetlining in the area areFremantle registered Zone C West Coast Rock Lobster boats and �wetline only� boats.

Fish. Res. Rep. Fish. West. Aust.1999, 118, 1-142
82
The breakdown of boats reporting wetlining in the Perth metropolitan area (as licensed at 30 June1998) is as follows:• 84 Zone C West Coast Rock Lobster Fishery licensed fishing boats. Rock lobster boats took
around 32 per cent of the reported wetline catch in 1997-98;
• 52 �wetline only� licensed fishing boats. �Wetline only� boats took around 31 per cent of thereported wetline catch in 1997-98;
• 24 various Cockburn Sound Managed Fishery licensed fishing boats;
• 17 licensed fishing boats which have subsequently been sold to the Fisheries Adjustment Scheme;
• 13 estuarine licensed fishing boats, from the Mandurah, Swan-Canning and Leschenault Estuaries;
• various other licensed fishing boats from fisheries such as the West Coast Purse Seine Fishery,the South West Trawl Fishery and the Abalone Fishery.
Only 34 boats have reported taking catches over one tonne per annum for three or more of the lastseven financial years. Only seven of these boats were �wetline only� boats, seven were boats withaccess to the Cockburn Sound Fisheries, and eight were Zone C West Coast Rock Lobster boats.
4.2.4 When wetlining takes place in the waters off the Perth metropolitan area
The seasonal pattern of reported wetline fishing in this area has become more marked over recentyears. Generally, more fishing takes place in the summer and autumn months than in the winter.The table below shows not only the seasonal variation in wetline fishing, but the general steadydecline in wetline catches.
It is interesting to note that the reported wetline catches in December and January have generallyremained fairly stable, perhaps reflecting market demands.
Table 28 Seasonal wetline catches (tonnes) in the waters off the Perth metropolitan area
MONTH Live weight (tonnes)
1991-92 1992-93 1993-94 1994-95 1995-96 1996-97 1997-98
July 19.6 17.3 18.9 14.7 7.8 2.1 9.6
August 12.7 21.7 16.0 18.3 12.9 7.4 16.9
September 8.3 23.2 13.9 13.0 9.4 7.6 11.2
October 17.0 28.2 9.2 15.7 8.8 13.7 17.3
November 12.8 21.0 16.7 17.3 6.3 9.1 12.8
December 14.6 14.3 24.9 14.1 8.4 14.8 14.2
January 25.0 18.7 26.8 21.2 15.2 19.1 18.2
February 27.9 15.8 20.7 20.9 20.3 16.2 16.2
March 21.4 18.4 17.9 20.2 18.0 13.2 15.7
April 40.6 17.7 22.5 17.5 16.1 14.0 18.4
May 18.2 23.1 20.9 17.2 13.5 11.6 16.0
June 28.6 18.5 14.2 17.9 6.0 9.8 4.2
GRAND TOTAL 246.7 237.8 222.4 208.2 143.1 138.7 170.8

Fish. Res. Rep. Fish. West. Aust.1999, 118, 1-142
83
Figure 28
4.3 Wetlining in the South West
The South West of Western Australia (taken as fishing blocks 33140, 33150, 33151 and 96010, seeFigures 29 and 30 and Appendix 7) has volatile wetline catches - from 312 tonnes recorded in1991-92 to 427 tonnes in 1996-97 and down to 242 tonnes in 1997-98. This makes the reportedwetline catch in this area considerably larger than that of the Perth metropolitan area. However,a large component of this catch is whitebait and Australian herring (45.2 and 47.8 tonnes respectivelyin 1997-98) which are taken by beach seining. Australian herring is a major �bread and butter�recreational species.
Excluding the Australian herring and whitebait catches, the reported wetline catch has increasedby around 45 tonnes over the last seven financial years, from 104.3 tonnes in 1991-92 to 149.6tonnes in 1997-98.
Fewer boats report wetlining in the South West than in the Perth metropolitan area - only 71boats as compared to 241. In any one year, only about 35 licensed fishing boats report wetliningin the South West.
Like the Perth metropolitan area the South West is a region of large and increasing recreationaland charter boat fishing, so an increasing wetline catch may in time place some additional strainson the fish resource of this region and lead to resource sharing conflicts, particularly over shorebased Australian herring catches.
Seasonal Variations in the wetline catch in the waters off the Perth Metropolitan area
0
5
10
15
20
25
30
35
40
45
July
Aug
ust
Sep
tem
ber
Oct
ober
Nov
embe
r
Dec
embe
r
Janu
ary
Feb
ruar
y
Mar
ch
Apr
il
May
June
Month
Ton
nes
1991-92 1992-93 1993-94 1994-95 1995-96 1996-97 1997-98

Fish. Res. Rep. Fish. West. Aust.1999, 118, 1-142
84
Figure 30
Figure 29
4.3.1 How wetline catch is taken in the South West
A broad range of species occur in the South West region, and this is reflected in the wide range offishing methods used to wetline in this area. Beach seine nets are used to target whitebait, Australianherring and other species, such as mullet. Sand crabs are taken by drop nets. Hand hauled gillnetsand haul nets, along with the usual hand line and drop line methods of wetlining, are also used inthe area.
4.3.2 Species taken by wetlining in the South West
The reported wetline catches of dhufish in this region have decreased from 27.9 tonnes in 1991-92 to 25.0 tonnes in 1997-98, with the majority of the catch coming from block 33140 (off CapeLeeuwin and Cape Naturaliste). The catch in this block has remained relatively stable over thisperiod, (between 20 and 25 tonnes), but the catch in the Geographe Bay and Bunbury areas hasincreased by about four to six tonnes over the past seven years, which may lead to future resourcesharing conflicts.
Annual Wetline Catches (tonnes) in the waters off the South West Region (including Whitebait and Herring)
0
100
200
300
400
500
1991-92 1992-93 1993-94 1994-95 1995-96 1996-97 1997-98
Year
Ton
nes
GRAND TOTAL
Annual Wetline Catches (tonnes) in the waters off the South West Region (excluding Whitebait and Herring)
0
50
100
150
1991-92 1992-93 1993-94 1994-95 1995-96 1996-97 1997-98
Year
Ton
nes
GRAND TOTAL

Fish. Res. Rep. Fish. West. Aust.1999, 118, 1-142
85
Also of interest is the reported increasing catch of hapuku in the South West, from 0.4 tonnes in1991-92 to 7.8 tonnes in 1997-98.
The reported catch of sand crabs rose from under one tonne seven years ago to 25.7 tonnes in1997-98, reflecting the use of new methods and opening of new markets for this species. A reviewof this fishery has taken place and management is expected to be put in place by the end of 1999.
There were very small, but regular wetline catches reported of various sharks recorded during theseven year period.
The reported pink snapper catch has increased from a low base of 1.8 tonnes in 1991-92 to 7.3tonnes in 1997-98, with the majority of the catch being taken in the Cape Leeuwin/CapeNaturaliste block 33140.
The reported whitebait catches are highly variable, ranging, for example, from 107.3 tonnes in1991-92 to 256 tonnes in 1996-97 to 47.8 tonnes in 1997-98. This scenario may reflect changingenvironmental conditions in the latter years, or may be related to other factors such as fishingeffort.
The reported Australian herring catch has steadily declined from 101.2 tonnes in 1991-92 to 45.2tonnes in 1997-98. A new research project is currently underway to determine the reasons forthis decline.
4.3.3 Who wetlines in the South West?
In total, 71 licensed fishing boats have reported wetlining in the waters of the South West regionduring the last seven financial years. The Southern Demersal Gillnet and Longline Fishery targetsthe same resource in this area. In addition, there is a large and increasing level of participation bythe recreational sector.
The breakdown of licensed fishing boats wetlining in the South West is:
• 16 �wetline only� licensed fishing boats;
• 15 Southern Demersal Gillnet and Demersal Longline licensed fishing boats (including thosewith supplementary authorisations);
• 12 South West Salmon licensed fishing boats;
• nine Zone C West Coast Rock Lobster licensed fishing boats;
• nine licensed fishing boats which have subsequently been sold to the Fisheries AdjustmentScheme;
• five Leschenault Estuarine licensed fishing boats; and
• various other licensed fishing boats including those with herring licence conditions.
Some of the licensed fishing boats which report wetlining in the waters off the South West aremulti-endorsed, reflecting the broad range of methods, fisheries and species taken in this area. Ofthe 71 boats reported to have wetlined, 26 fished only for one or two years in this area.
There is a core of about 35 boats which regularly wetline, recording larger wetline catches thanboats in other areas of the State. The largest catch component of these boats is whitebait. Of those35 boats, 27 regularly take over two tonnes of fish, with most of them taking between five and 25tonnes, reflecting the whitebait and Australian herring component of the catch. Most of the coreboats are either �wetline only�, or Estuarine, South West Salmon and Southern Demersal Gillnetand Demersal Longline boats, or a combination of these authorisations.

Fish. Res. Rep. Fish. West. Aust.1999, 118, 1-142
86
4.3.4 When wetlining takes place in the waters off the South West region
There are marked seasonal variations in the wetline catches of the South West, reflecting thewhitebait and Australian herring catches of the beach seiners (see Table 29).
Excluding whitebait and Australian herring, there was an increase of around 45 tonnes in theannual wetline catch in the South West from 1991-92 to 1997-98, as shown in Table 30.
Table 29 Seasonal wetline catches in the waters off the South West region (including whitebait andAustralian herring)
MONTH Live weight (tonnes)
1991-92 1992-93 1993-94 1994-95 1995-96 1996-97 1997-98
July 5.2 3.5 3.2 9.2 12.0 2.9 20.4
August 5.3 8.0 2.6 5.7 6.1 6.4 18.9
September 3.7 5.3 2.2 5.6 6.3 7.0 8.7
October 8.0 11.1 8.7 8.2 11.4 11.4 12.2
November 18.1 17.8 11.9 17.9 7.2 14.9 14.0
December 42.6 24.9 43.5 60.0 67.1 28.1 17.7
January 71.7 29.9 80.1 63.4 88.0 118.3 4.7
February 50.4 39.1 44.0 34.8 77.1 102.9 34.6
March 24.7 40.8 23.0 38.6 36.5 80.2 28.2
April 55.0 32.3 13.4 20.9 22.1 28.1 26.1
May 16.3 21.0 9.2 8.8 12.3 10.6 8.0
June 11.2 12.0 2.5 9.4 7.2 15.9 6.7
GRAND TOTAL 312.2 245.6 244.3 282.4 353.5 426.6 242.7
Figure 31
Seasonal Variations in the wetline catch in the waters off the South West region
0
20
40
60
80
100
120
July
Aug
ust
Sep
tem
ber
Oct
ober
Nov
embe
r
Dec
embe
r
Janu
ary
Feb
ruar
y
Mar
ch
Apr
il
May
June
Month
Ton
nes
1991-92 1992-93 1993-94 1994-95 1995-96 1996-97 1997-98

Fish. Res. Rep. Fish. West. Aust.1999, 118, 1-142
87
Table 30 Seasonal wetline catches in the waters off the South West region (excluding whitebait andAustralian herring)
MONTH Live weight (tonnes)
1991-92 1992-93 1993-94 1994-95 1995-96 1996-97 1997-98
July 5.2 3.5 3.1 8.1 12.0 2.9 20.4
August 4.9 8.0 2.6 5.7 6.1 6.4 18.9
September 2.7 4.4 2.2 5.6 6.2 7.0 8.6
October 5.5 6.3 4.9 7.7 11.3 11.4 10.5
November 10.4 7.0 6.1 16.6 7.1 9.5 11.9
December 13.9 13.4 8.5 17.6 12.4 15.7 14.7
January 15.2 11.5 14.2 19.1 22.3 15.8 21.4
February 13.4 10.3 7.4 15.2 13.8 15.6 11.5
March 8.6 21.9 4.9 7.7 12.7 8.6 9.6
April 6.8 10.4 4.0 5.7 7.9 8.2 8.2
May 6.9 15.1 5.9 6.4 6.4 7.6 7.2
June 10.8 11.0 2.5 9.4 5.1 15.9 6.7
GRAND TOTAL 104.3 122.8 66.3 124.8 123.3 124.6 149.6
Figure 32
Seasonal Variations in the wetline catch in the waters off the South West region (excluding whitebait and Australian Herring)
0
5
10
15
20
25
July
Aug
ust
Sep
tem
ber
Oct
ober
Nov
embe
r
Dec
embe
r
Janu
ary
Feb
ruar
y
Mar
ch
Apr
il
May
June
Month
Ton
nes
1991-92 1992-93 1993-94 1994-95 1995-96 1996-97 1997-98

Fish. Res. Rep. Fish. West. Aust.1999, 118, 1-142
88
5.0 Conclusion
This study has provided a �snapshot� profile of the reported wetline activities of the WesternAustralian fishing fleet as at 30 June 1998. It has attempted to determine the �who�, �what�,�where�, �how� and �when� of �wetline� fishing, in order to determine possible future strategic directionsfor management. The study confirmed that about half the fishing fleet in the State reportedwetlining in the past seven financial years, with most wetlining being reported in the 1997-98year.
It confirmed that dhufish, pink snapper and Spanish mackerel were the most targeted line caughtspecies by the wetline fleet, with catches of 201, 215 and 534 tonnes respectively reported in the1997-98 financial year.
Whitebait and Australian herring were the most targeted net caught species with catches of 48and 110 tonnes respectively reported in the 1997-98 financial years.
The study also determined the geographical range of wetline fishing. While much line caughtwetlining takes place in the inshore areas of the Perth metropolitan area and the South West, theAbrolhos Islands line caught wetline catch is the same as both these areas combined. Small amountsof inshore line fishing also takes place along the south coast of the State.
Most commercial net fishing within the wetline catch occurred in the South West and south ofthe State.
The first six years CAES data used by the study did not confirm a commonly held view that largeamounts of finfish were taken by the West Coast rock lobster fleet during years of �normal� fishingoperations. In fact, most of their reported wetline catches were relatively small and only about athird of the rock lobster fleet reported having wetlined at all. Even during 1997-98 when therewas a �blow out� of wetline catch, particularly dhufish, by the rock lobster fleet, they only reportedtaking seven per cent of the total wetline catch.
Possible reasons for this �blow out� are:
1 under reporting of wetline catch in the first six years of the study;
2 industry rumours of a wetline review, leading to boats attempting to gain wetline fishinghistory; and/or
3 lower prices for rock lobster during 1997-98 and lower forecast prices for 1998-99.
The zonal differences in reported wetline catches, and the increasing use of drop lines were ofmost interest in the rock lobster fishing pattern.
Anecdotal evidence that large amounts of dhufish were taken by the rock lobster fleet were alsonot verified with respect to the first six years of the study. However, reported dhufish catches bythe rock lobster fleet more than doubled from 1996-97 to 1997-98, when they took 24 per centof the reported wetline catch of dhufish. Dhufish catches were generally lower in the wintermonths - when the wetline catches of the rock lobster fleet were at their highest.
The question of latent effort in the West Coast Rock Lobster fleet was examined and it was foundthat generally the average price of rock lobster did not affect the reported amount of wetlinefishing being carried out by the rock lobster fleet. The combination of the three factors - includinga projected extremely low price for rock lobster - described above may have been the trigger forthe recent �blow out� of the rock lobster catch.

Fish. Res. Rep. Fish. West. Aust.1999, 118, 1-142
89
The �wetline only� fleet took 45 per cent of the total reported wetline catch.
The resource sharing implications of the inshore fishing activities of the wetline fleet will alsoneed to be examined.
Fisheries WA in consultation with key stakeholders must now make policy decisions on whetheror not wetline fishing should be permitted to continue in its present unregulated manner.
6.0 Acknowledgments
We would like to especially thank Bruce Stevenson, Neil Sumner and his research team, MikeMoran, Colin Simpfendorfer and their research teams, and Natalie Kennedy for their enormousassistance, patience and dedication in providing me with the information I needed to completethis paper.
We would also like to thank Peter Rogers, Peter Millington, Jane Borg, Lindsay Joll, RichardSellers, Andrew Cribb, Rebecca Metzner, Laurie Caporn, Eric Barker, Steve Newman, Suzy Ayvazianand Dan Gaughan for their help and many constructive suggestions during the course of thisstudy.
Thank you also to Jenny Hall for the wonderful maps, Sue Meiklejohn for helping complete theword processing and graphs and Steve Ireland and Carolyn Walker for their great editing, formattingand support in getting this paper to fruition.
7.0 References
Abrolhos Islands Management Advisory Committee, �Draft Management of the Houtman AbrolhosSystem�, 1997, Abrolhos Islands Management Advisory Committee and Fisheries WA, Perth
�Discussion Paper - Future Management of Western Australian Developed and UnderexploitedFisheries�, 1983, Department of Fisheries and Wildlife, Perth
�Discussion Paper - Arrangements for Entry to all Fisheries off and along the Western AustralianCoast�, 1985, Fisheries Department, Perth, Western Australia
Lenanton, R. �The Commercial Fisheries of Temperate Western Australian Estuaries: EarlySettlement to 1975�, 1984, Department of Fisheries and Wildlife, Perth.
Tour Operators Fishing Working Group, �Future management of the aquatic charter industry inWestern Australia�, 1997, Fisheries WA

Fish. Res. Rep. Fish. West. Aust.1999, 118, 1-142
90
8.0 So you want to go wetlining?
A USER�S GUIDE TO WETLINE FISHING
I am acutely aware of the complexity of this study. The wetline fishery is, after all, a multi-species, multi-user, multi-method and geographically widespread fishery. I have thereforeincluded this section as an explanation from an individual fisherman�s perspective. It includesthe answers to a number of the questions I have been asked while working on this study.
I hope it helps readers to interpret and unravel the various facts and figures associated withwetline fishing.
Fiona Crowe

Fish. Res. Rep. Fish. West. Aust.1999, 118, 1-142
91
Since the first Western Australian Fisheries Act of 1899, commercial fishing boats and their operatorshave had to be licensed.
Since then, commercial fishing in Western Australia has been regulated in three ways
• By area closures to fishing for a particular species, e.g. the Shark Bay Snapper Fishery;
• By seasonal closures, e.g. the West Coast Rock Lobster Fishery; and
• By method of capture, e.g. the South Coast Demersal Gillnet and Demersal Long Line Fishery.
On top of this, every fishing boat is able to fish in the unmanaged �wetline� fishery. This fisheryinvolves all commercial fishing which is not covered by fisheries legislation.
Let me give you an example of how wetline fishing works.
Mike Smith has invested in a fishing boat licence for a wetline boat. Mike doesn�t actually fish thelicence himself as he is a mining engineer. He leases it to a fisherman called Dave Brown. Davehas put the licence onto an old rock lobster boat so he can go wetlining.
Dave will be fishing in the State�s last unmanaged fishery, the Western Australian wetline fishery. Itis a multi-method, multi-user, multi-species, multi-seasonal and geographically-widespread fishery.
During the 1997-98 financial year, 2,270 tonnes of fish were reported as being taken in thewetline fishery. This is an increase of around 10 per cent or 230 tonnes on the wetline catch takenseven years before.
Five species account for about 60 per cent of the wetline catch. These are :
• Spanish mackerel (25 per cent);
• dhufish (10 per cent);
• pink snapper (10 per cent);
• whitebait (usually around 10 per cent); and
• Australian herring (around five per cent).
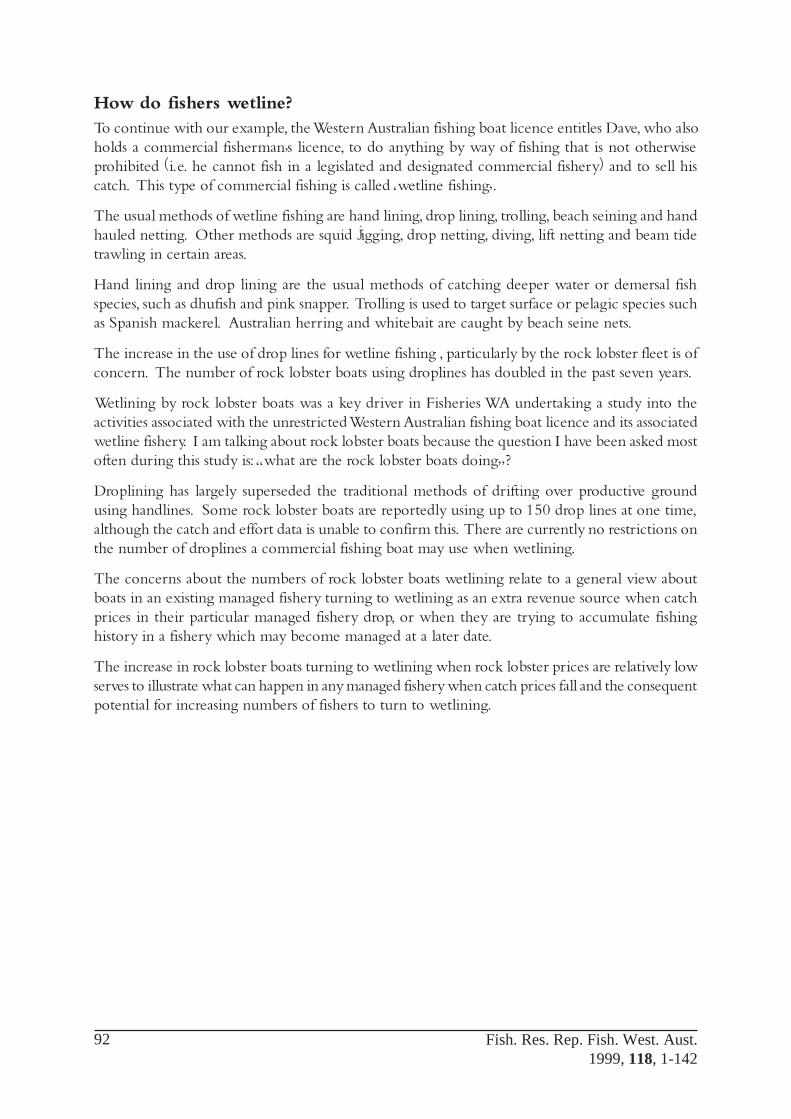
Fish. Res. Rep. Fish. West. Aust.1999, 118, 1-142
92
How do fishers wetline?To continue with our example, the Western Australian fishing boat licence entitles Dave, who alsoholds a commercial fisherman�s licence, to do anything by way of fishing that is not otherwiseprohibited (i.e. he cannot fish in a legislated and designated commercial fishery) and to sell hiscatch. This type of commercial fishing is called �wetline fishing�.
The usual methods of wetline fishing are hand lining, drop lining, trolling, beach seining and handhauled netting. Other methods are squid jigging, drop netting, diving, lift netting and beam tidetrawling in certain areas.
Hand lining and drop lining are the usual methods of catching deeper water or demersal fishspecies, such as dhufish and pink snapper. Trolling is used to target surface or pelagic species suchas Spanish mackerel. Australian herring and whitebait are caught by beach seine nets.
The increase in the use of drop lines for wetline fishing , particularly by the rock lobster fleet is ofconcern. The number of rock lobster boats using droplines has doubled in the past seven years.
Wetlining by rock lobster boats was a key driver in Fisheries WA undertaking a study into theactivities associated with the unrestricted Western Australian fishing boat licence and its associatedwetline fishery. I am talking about rock lobster boats because the question I have been asked mostoften during this study is: �what are the rock lobster boats doing�?
Droplining has largely superseded the traditional methods of drifting over productive groundusing handlines. Some rock lobster boats are reportedly using up to 150 drop lines at one time,although the catch and effort data is unable to confirm this. There are currently no restrictions onthe number of droplines a commercial fishing boat may use when wetlining.
The concerns about the numbers of rock lobster boats wetlining relate to a general view aboutboats in an existing managed fishery turning to wetlining as an extra revenue source when catchprices in their particular managed fishery drop, or when they are trying to accumulate fishinghistory in a fishery which may become managed at a later date.
The increase in rock lobster boats turning to wetlining when rock lobster prices are relatively lowserves to illustrate what can happen in any managed fishery when catch prices fall and the consequentpotential for increasing numbers of fishers to turn to wetlining.
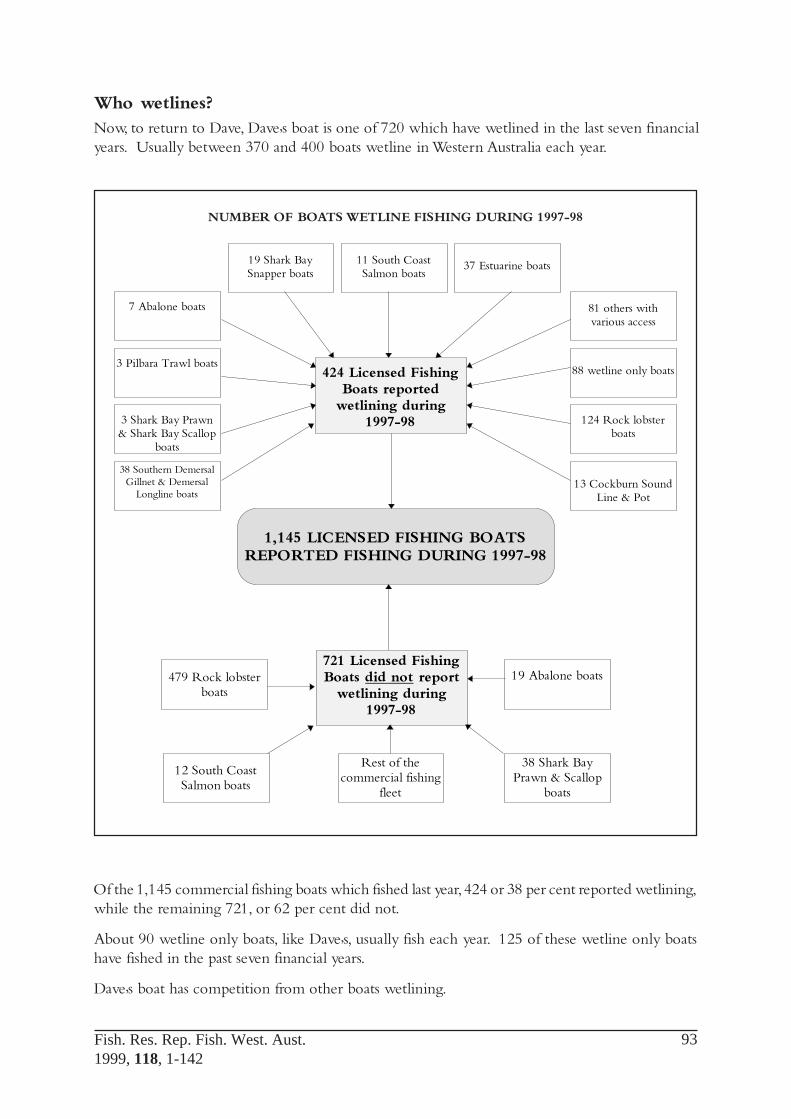
Fish. Res. Rep. Fish. West. Aust.1999, 118, 1-142
93
Who wetlines?Now, to return to Dave, Dave�s boat is one of 720 which have wetlined in the last seven financialyears. Usually between 370 and 400 boats wetline in Western Australia each year.
Of the 1,145 commercial fishing boats which fished last year, 424 or 38 per cent reported wetlining,while the remaining 721, or 62 per cent did not.
About 90 wetline only boats, like Dave�s, usually fish each year. 125 of these wetline only boatshave fished in the past seven financial years.
Dave�s boat has competition from other boats wetlining.
NUMBER OF BOATS WETLINE FISHING DURING 1997-98
1,145 LICENSED FISHING BOATSREPORTED FISHING DURING 1997-98
88 wetline only boats
3 Shark Bay Prawn& Shark Bay Scallop
boats
124 Rock lobsterboats
37 Estuarine boats
38 Southern DemersalGillnet & Demersal
Longline boats
3 Pilbara Trawl boats
11 South CoastSalmon boats
13 Cockburn SoundLine & Pot
81 others withvarious access
424 Licensed FishingBoats reported
wetlining during1997-98
19 Shark BaySnapper boats
7 Abalone boats
479 Rock lobsterboats
19 Abalone boats
Rest of thecommercial fishing
fleet
721 Licensed FishingBoats did not report
wetlining during1997-98
38 Shark BayPrawn & Scallop
boats
12 South CoastSalmon boats
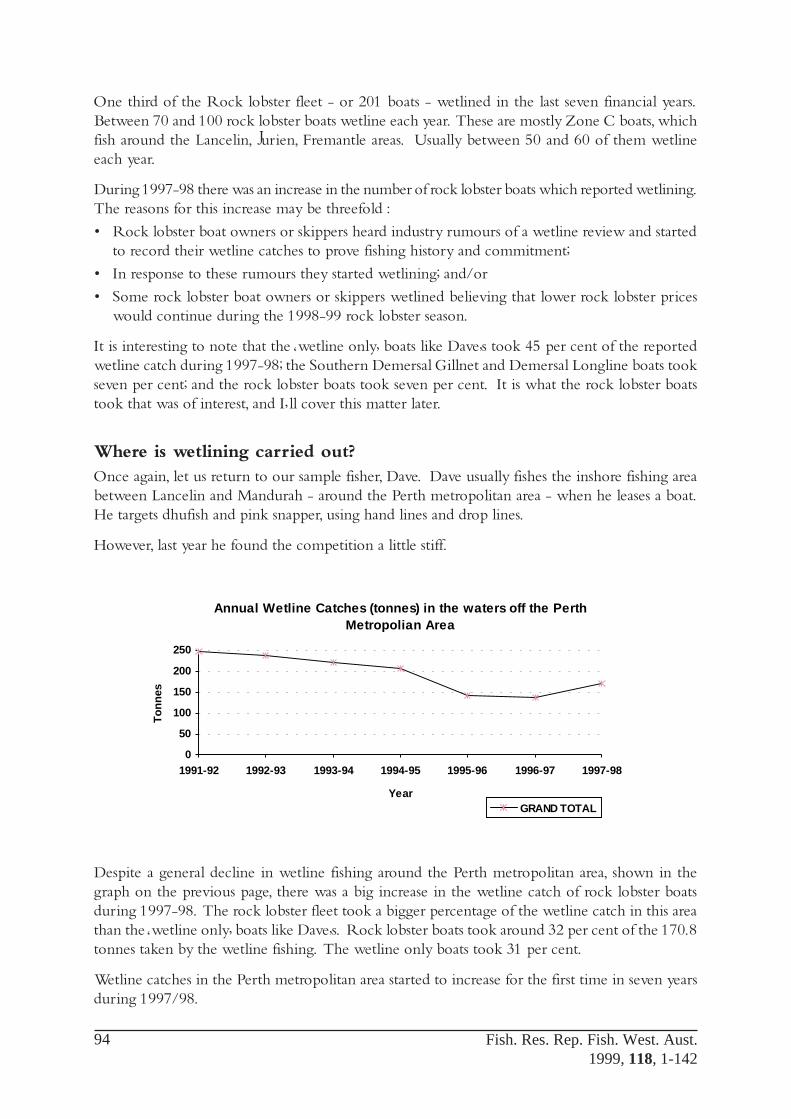
Fish. Res. Rep. Fish. West. Aust.1999, 118, 1-142
94
One third of the Rock lobster fleet - or 201 boats - wetlined in the last seven financial years.Between 70 and 100 rock lobster boats wetline each year. These are mostly Zone C boats, whichfish around the Lancelin, Jurien, Fremantle areas. Usually between 50 and 60 of them wetlineeach year.
During 1997-98 there was an increase in the number of rock lobster boats which reported wetlining.The reasons for this increase may be threefold :
• Rock lobster boat owners or skippers heard industry rumours of a wetline review and startedto record their wetline catches to prove fishing history and commitment;
• In response to these rumours they started wetlining; and/or
• Some rock lobster boat owners or skippers wetlined believing that lower rock lobster priceswould continue during the 1998-99 rock lobster season.
It is interesting to note that the �wetline only� boats like Dave�s took 45 per cent of the reportedwetline catch during 1997-98; the Southern Demersal Gillnet and Demersal Longline boats tookseven per cent; and the rock lobster boats took seven per cent. It is what the rock lobster boatstook that was of interest, and I�ll cover this matter later.
Where is wetlining carried out?Once again, let us return to our sample fisher, Dave. Dave usually fishes the inshore fishing areabetween Lancelin and Mandurah - around the Perth metropolitan area - when he leases a boat.He targets dhufish and pink snapper, using hand lines and drop lines.
However, last year he found the competition a little stiff.
Despite a general decline in wetline fishing around the Perth metropolitan area, shown in thegraph on the previous page, there was a big increase in the wetline catch of rock lobster boatsduring 1997-98. The rock lobster fleet took a bigger percentage of the wetline catch in this areathan the �wetline only� boats like Dave�s. Rock lobster boats took around 32 per cent of the 170.8tonnes taken by the wetline fishing. The wetline only boats took 31 per cent.
Wetline catches in the Perth metropolitan area started to increase for the first time in seven yearsduring 1997/98.
Annual Wetline Catches (tonnes) in the waters off the Perth Metropolian Area
0
50
100
150
200
250
1991-92 1992-93 1993-94 1994-95 1995-96 1996-97 1997-98
Year
Ton
nes
GRAND TOTAL

Fish. Res. Rep. Fish. West. Aust.1999, 118, 1-142
95
The map above shows the distribution of wetline catches during 1997-98. As Dave can fishanywhere in the State outside the regulated commercial fisheries, he is thinking about fishing inthe Abrolhos Islands. He has also heard the Spanish mackerel fishing off Quobba near Shark Bayis quite good. He is thinking about going up there to fish. This is a usual pattern of behaviour for�wetline only� fishermen.
Dave�s choices may see him hop out of the frying pan into the fire. The major areas of wetlinefishing are all along the West Coast.
Dave�s two main target species, dhufish and pink snapper are heavily fished in Western Australia�smid-west, and especially in the Abrolhos Islands.
The total reported wetline catch in the Abrolhos Islands, as shown graphically above, has risen by142 per cent from 65.8 tonnes to 216.4 tonnes over a period of six years. Wetline dhufish catchesin the Abrolhos rose by 395 per cent from 11.9 tonnes in 1992-93 to 46.9 tonnes 1997-98. Pink
Annual Wetline Catches (tonnes) in waters surrounding the Houtman Abrolhos Islands
0
50
100
150
200
250
1992-93 1993-94 1994-95 1995-96 1996-97 1997-98
Year
Ton
nes
GRAND TOTAL

Fish. Res. Rep. Fish. West. Aust.1999, 118, 1-142
96
snapper catches rose by 300 per cent from 17.6 tonnes to 53.2 tonnes during that same period. In1997-98 46 per cent of the statewide catch of baldchin groper came from wetline catches fromthe Abrolhos Islands. That is 19.3 tonnes out of a total of 42.1 tonnes. So, as wetliners have beenso successful catching baldchin groper in the Abrolhos, Dave may decide to target baldchin groperas well.
Can all this fishing pressure be sustained?
If Dave goes to the Abrolhos he will join 38 �wetline only� boats who have tried wetlining there inthe last six financial years. 92 boats have wetlined there altogether, but only 26 of these have fishedthere for three or more years. 14 of these are �wetline only� boats. Perhaps these figures are tellingus that wetlining in the Abrolhos may not be economically viable.
However, Dave�s wife Debbie would rather live in Dunsborough than Geraldton.
The graph shown above shows wetline catches in the waters off the South West. Debbie has donesome research into the diverse species and methods of capture used by wetliners in the SouthWest, that is Bunbury to Cape Leeuwin. Around 25 tonnes of dhufish are taken in this area eachyear, the snapper catch has increased from 1.8 to 7.3 tonnes and a deep water fish called hapukuis also caught there. 7.8 tonnes of hapuku were caught in the South West area last year.
Dave thinks he might drop net for blue swimmer crabs in the South West. Nearly 26 tonnes ofcrabs were caught by drop nets in this area during 1997-98. However, he has heard that FisheriesWA are bringing this fishery under management shortly.
Dave also thought he might do a bit of beach seining for whitebait and Australian herring. Thewhitebait catches of this fishery fluctuate widely, from 107.3 tonnes in 1991-92 to 256 tonnes in1996-97 and down to 47.8 tonnes in 1997-98. Environmental factors may be responsible for thisfluctuation.
Australian herring catches are consistently decreasing, from 101.2 tonnes in 1991-92 to 45.2tonnes in 1997-98. The reasons for this decrease are unknown, and a research project is currentlyunderway to try to find out why. However, this year there are reports of large schools of herring,but very little is being caught due to market related factors. Because of this uncertainty, Davewon�t be getting a dinghy to go beach seining.
Annual Wetline Catches (tonnes) in the waters off the South West Region (including Whitebait and Herring)
0
100
200
300
400
500
1991-92 1992-93 1993-94 1994-95 1995-96 1996-97 1997-98
Year
Ton
nes
GRAND TOTAL
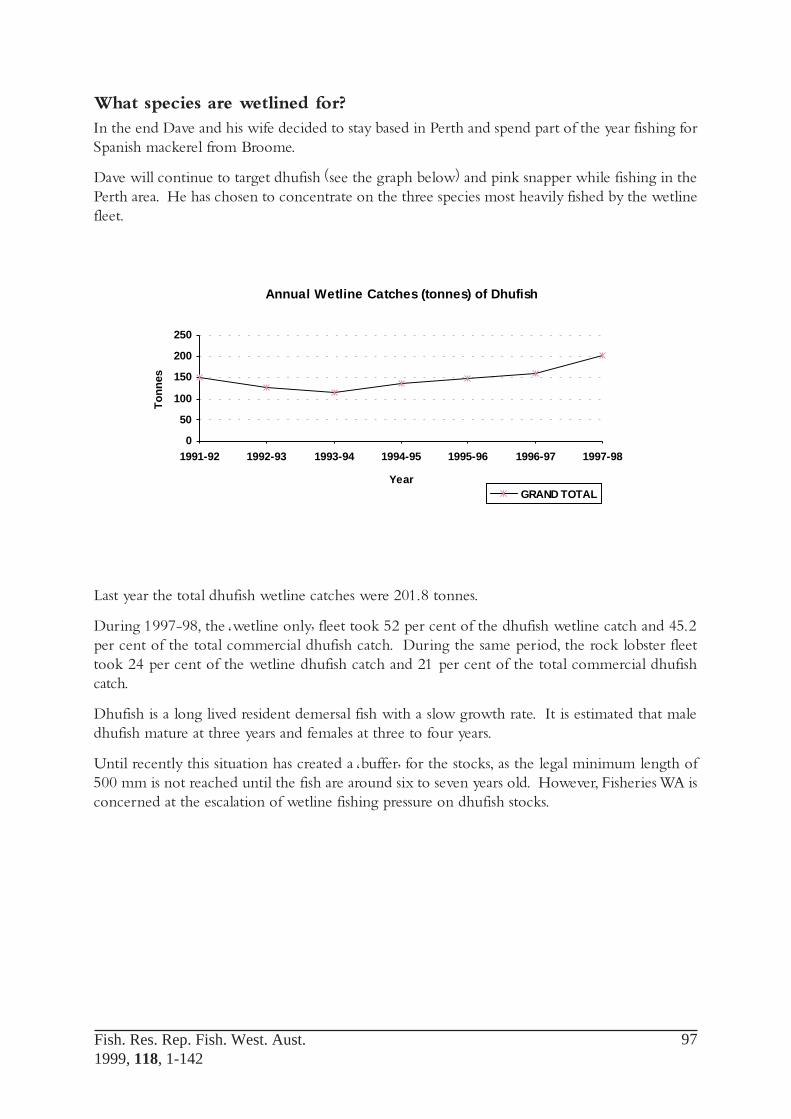
Fish. Res. Rep. Fish. West. Aust.1999, 118, 1-142
97
What species are wetlined for?In the end Dave and his wife decided to stay based in Perth and spend part of the year fishing forSpanish mackerel from Broome.
Dave will continue to target dhufish (see the graph below) and pink snapper while fishing in thePerth area. He has chosen to concentrate on the three species most heavily fished by the wetlinefleet.
Last year the total dhufish wetline catches were 201.8 tonnes.
During 1997-98, the �wetline only� fleet took 52 per cent of the dhufish wetline catch and 45.2per cent of the total commercial dhufish catch. During the same period, the rock lobster fleettook 24 per cent of the wetline dhufish catch and 21 per cent of the total commercial dhufishcatch.
Dhufish is a long lived resident demersal fish with a slow growth rate. It is estimated that maledhufish mature at three years and females at three to four years.
Until recently this situation has created a �buffer� for the stocks, as the legal minimum length of500 mm is not reached until the fish are around six to seven years old. However, Fisheries WA isconcerned at the escalation of wetline fishing pressure on dhufish stocks.
Annual Wetline Catches (tonnes) of Dhufish
0
50
100
150
200
250
1991-92 1992-93 1993-94 1994-95 1995-96 1996-97 1997-98
Year
Ton
nes
GRAND TOTAL

Fish. Res. Rep. Fish. West. Aust.1999, 118, 1-142
98
By staying put, Dave will remain in an area of relatively high wetline catches of dhufish, as most ofthe rock lobster taking dhufish are Zone C boats (see the map below).
Lets also remember that dhufish are highly sought after by recreational fishers.
The best idea of the scale of these recreational catches comes from the preliminary findings of theLower West Coast recreational fishing boat survey (from Augusta to Kalbarri), which comprises alarge part of Dave�s fishing area (see the chart overleaf).
Taking the same area for the commercial catches, so we can compare �apples with apples�, we findthat the recreational take of dhufish in 1996-97 was around 132 tonnes. This is around 41 per centof the total catch of 323 tonnes. The remainder of the catch is made up of wetline fishing (48 percent) and other commercial (mainly the boats endorsed to use demersal longlines and gillnets,commonly referred to as shark boats) 11 per cent.
DhufishLive weight (tonnes) 1996-97
132
35.1
156.1
Preliminary findings ofthe recreational catchKalbarri to Augusta
Wetline catch Kalbarri toAugusta
Other commercial catchKalbarri to Augusta
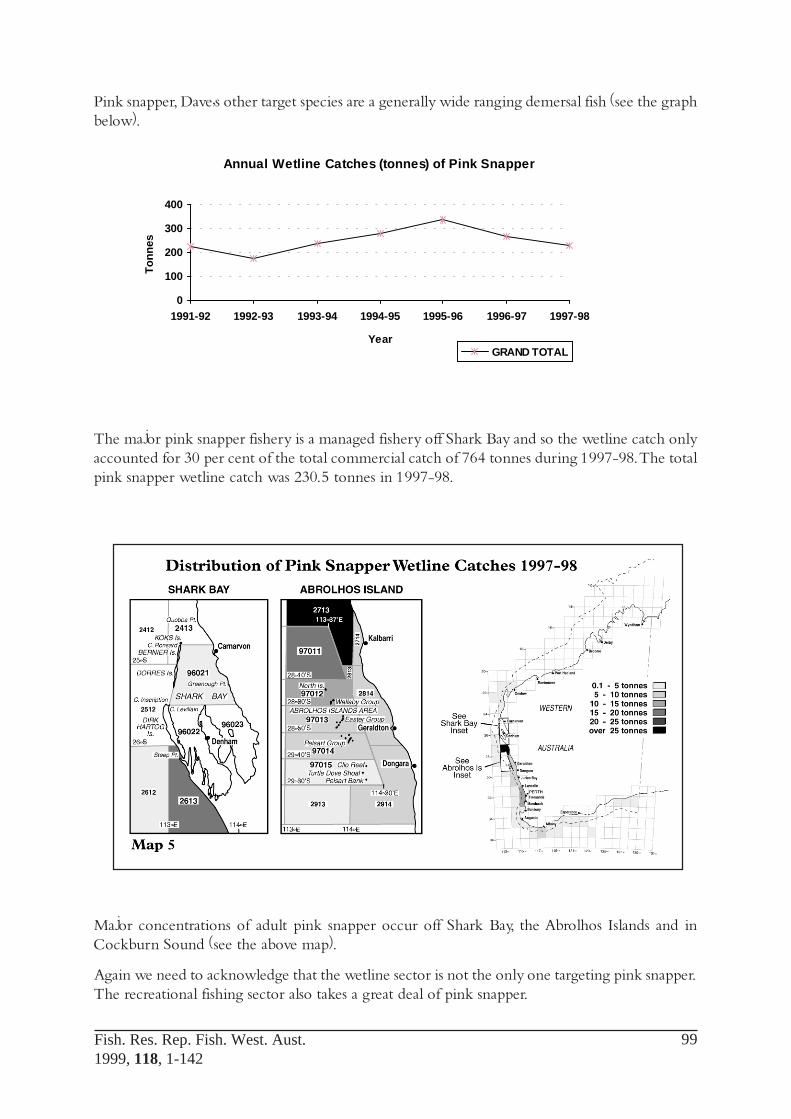
Fish. Res. Rep. Fish. West. Aust.1999, 118, 1-142
99
Pink snapper, Dave�s other target species are a generally wide ranging demersal fish (see the graphbelow).
The major pink snapper fishery is a managed fishery off Shark Bay and so the wetline catch onlyaccounted for 30 per cent of the total commercial catch of 764 tonnes during 1997-98. The totalpink snapper wetline catch was 230.5 tonnes in 1997-98.
Annual Wetline Catches (tonnes) of Pink Snapper
0
100
200
300
400
1991-92 1992-93 1993-94 1994-95 1995-96 1996-97 1997-98
Year
Ton
nes
GRAND TOTAL
Major concentrations of adult pink snapper occur off Shark Bay, the Abrolhos Islands and inCockburn Sound (see the above map).
Again we need to acknowledge that the wetline sector is not the only one targeting pink snapper.The recreational fishing sector also takes a great deal of pink snapper.

Fish. Res. Rep. Fish. West. Aust.1999, 118, 1-142
100
Once again, comparing �apples with apples� (see the chart above), in Dave�s major fishing area, theKalbarri to Augusta area, recreational fishers took 27 tonnes or 9 per cent of the total catch of 300tonnes of pink snapper. I understand that 1996-97 was considered a bad year for recreational pinksnapper fishermen. 76 per cent of the 300 tonnes of pink snapper was taken by wetline methods.
When Dave goes up to the Kimberley to troll for Spanish mackerel, he�ll find a fishery in whichthe wetline catch has increased by 135 per cent in recent years - from 228.6 tonnes in 1991-92 to536 tonnes in 1997-98 (see the above graph). Most of the current catch of Spanish mackerel iswetline.
Long term fishermen from the Kimberley region have directly observed a decline in the averagesize of Spanish mackerel caught over time and a decline in the catch per unit of effort. However,although the effort expended by the dedicated mackerel fishermen has gone up, the total catchhas also increased.
This is due to increased opportunistic catches by existing fishers who occasionally target Spanishmackerel, and �new� fishers that have moved into the fishery over the last two or three years, likeDave, who take the species when the opportunity presents itself.
It is difficult to make a meaningful comparison of the recreational Spanish mackerel catch, but arecent survey in the Northern Territory put the recreational catch at around 200 tonnes.
Annual Wetline Catches (tonnes) of Spanish Mackerel
0
100
200
300
400
500
600
1991-92 1992-93 1993-94 1994-95 1995-96 1996-97 1997-98
Year
Ton
nes
GRAND TOTAL
Pink SnapperLive weight (tonnes) 1 996-97
27
228.8
45 Preliminary findings ofthe recreational catchKalbarri to Agust
Wetline catch Kalbarri toAugusta
Other commercial catchKalbarri to Augusta

Fish. Res. Rep. Fish. West. Aust.1999, 118, 1-142
101
Spanish mackerel are a relatively large, fast growing, pelagic reef associated predatory fish. Asshown in the map above, they are distributed from Geographe Bay to the Northern Territoryborder and beyond.
Fisheries WA has recently begun a study into the stock structure of Spanish mackerel, and hasmoved to increase the legal minimum length from 75 cm to 90 cm, the estimated size at maturity.
When is wetlining carried out?Dave and his wife have decided to go up north to fish for Spanish mackerel during the winter.The reason for this is obvious when you see the table below.
Seasonal Variations in the wetline catch of Spanish Mackerel
0
20
40
60
80
100
120
140
160
July
Aug
ust
Sep
tem
ber
Oct
ober
Nov
embe
r
Dec
embe
r
Janu
ary
Feb
ruar
y
Mar
ch
Apr
il
May
June
Month
Ton
nes
1991-92 1992-93 1993-94 1994-95 1995-96 1996-97 1997-98

Fish. Res. Rep. Fish. West. Aust.1999, 118, 1-142
102
Like pink snapper, Spanish mackerel form large aggregations to spawn and may undertake seasonalmigrations to reach spawning sites. After spawning has occurred the aggregations disperse. Fishingactivities are concentrated during the spawning season, in Western Australia�s winter months.
Spanish mackerel and whitebait dominate the seasonality of wetline catches, contributing around25 per cent and 10 per cent of the total wetline catch.
The large whitebait and Australian herring catches usually caught every summer by open accessor wetline fishing, mean that there are very little seasonal differences in the wetline catches. Thedifferences between summer and winter wetline catches are in species caught in Western Australianwaters and the area in which the fish are caught in.
Dave knows that most demersal or deeper water finfish in Western Australian waters are caught inthe spring, summer and autumn months. The dhufish wetline catches, shown graphically belowshow this quite well.
It is interesting to note that apart from 1997-98, most of the wetline fishing for dhufish takes placeduring the summer months, not the off-season for rock lobster fishing.
Seasonal Variations in the wetline catch of Dhufish
0
5
10
15
20
25
July
Aug
ust
Sep
tem
ber
Oct
ober
Nov
embe
r
Dec
embe
r
Janu
ary
Feb
ruar
y
Mar
ch
Apr
il
May
June
Month
Ton
nes
1991-92 1992-93 1993-94 1994-95 1995-96 1996-97 1997-98

Fish. Res. Rep. Fish. West. Aust.1999, 118, 1-142
103
The snapper fishery, on the other hand seems to have two peaks, the spring and autumn whichcorresponds with the Shark Bay Snapper fleet moving into and out of the managed fishery area.This is shown below. Dave�s wife, Debbie, thinks this may also relate to marketing, as pink snapperprices are often lowest during the Shark Bay snapper season.
How much is wetlining worth?At the end of the day, I think the most telling figure for Dave and his wife and their future businessinterests will be when they look at the economics of the wetline fishery. During 1997-98 thisfishery was worth around $11.25 million. The �wetline only� fleet take around 45 per cent of thecatch, and say 45 per cent of the value. 88 �wetline only boats fished last year, and this makes theaverage earnings of a wetline only boat only around $55,000 gross - out of which must come yourrunning costs!.
If the $11.25 million is simply averaged out amongst the 424 boats which fished in the wetlinefishery, this figure averages out at $28,000 a year.
This $11.25 million represents only 2 per cent of the value of the total Western Australian commercialcatch or �harvest value� of $535.4 million (including pearling).
Will it be worth Dave�s while to carry on in this fishery?
Is it worth Western Australia�s while to allow this unmanaged fishery with all its latent effort tocontinue?
I trust that this study will enable the public to explore options for management of the wetlinefishery.
Seasonal Variations in the wetline catch of Pink Snapper
0
5
10
15
20
25
30
35
40
July
Aug
ust
Sep
tem
ber
Oct
ober
Nov
embe
r
Dec
embe
r
Janu
ary
Feb
ruar
y
Mar
ch
Apr
il
May
June
Month
Ton
nes
1991-92 1992-93 1993-94 1994-95 1995-96 1996-97 1997-98

Fish. Res. Rep. Fish. West. Aust.1999, 118, 1-142
104
Appendix 1 Fisheries WA announcements on ‘New study of fishing boatlicence’

Fish. Res. Rep. Fish. West. Aust.1999, 118, 1-142
105
Appendix 1 (continued)

Fish. Res. Rep. Fish. West. Aust.1999, 118, 1-142
106
Appendix 1 (continued)

Fish. Res. Rep. Fish. West. Aust.1999, 118, 1-142
107
Appendix 2 Number of boats which have reported wetlining in the managedand interim managed fisheries 1991-92 to 1997-98
The two columns on the right hand side of Appendix 2 headed “No. of fishing boats as licensedat 30.6.98 which wetlined in the zone/area 1991-92 to 1997-98” and “Total no. of fishing boatsas licensed at 30.6.98 which actually wetlined in the fishery 1991-92 to 1997-98” requireclarification.
There are a number of boats which wetline in a fishery that are endorsed to fish in one or morezones of a fishery or have two classes of licences in a fishery. For example, a licensed fishingboat may have both an A class and a B class licence in the Shark Bay Snapper Fishery. Thismeans that the same boat would be shown twice in the second last column of the table, but onlyonce in the last column.
In another example, there are several licensed fishing boats in the Cockburn Sound managedfisheries which are licensed for two or more of the managed fisheries in this area. Therefore,even though it appears there are quite a large number of boats reported to have wetlined in eachmanaged fishery, the total number of boats endorsed to fish in the Cockburn Sound ManagedFisheries that have actually wetlined is quite small.
Where the number of boats which have actually wetlined in a fishery each year does not correspondwith the number shown to have wetlined, this may indicate that the managed fishery was recentlyestablished and a boat wetlined prior to its establishment. It may also indicate that a managedfishery licence may have been purchased and attached to a boat in a ‘licence splitting’ exercise,whereby although the boat wetlined, it was not licensed to fish in that particular fishery when itdid so.

Fish. Res. Rep. Fish. West. Aust.1999, 118, 1-142
108
Fis
hery
No.
of
Num
ber
of li
cens
ed fi
shin
gN
o. o
f fis
hing
boa
ts a
sT
otal
no.
of f
ishi
ng b
oats
as
boat
s/un
itsbo
ats
wet
linin
g in
the
fishe
rylic
ense
d at
30.
6.98
whi
chlic
ense
d at
30.
6.98
whi
chin
the
by y
ear
wet
lined
in th
e zo
ne/a
rea
actu
ally
wet
lined
in
the
fishe
ry a
s91
9293
9495
9697
1991
-92
to 1
997-
98fis
hery
199
1-92
to 1
997-
98at
30.
6.98
9293
9495
9697
98
Aba
lone
Man
aged
Fis
hery
26Z
one
1 (6
)3
12
12
32
4)
Zon
e 2
(8)
22
1 1
11
33
)10
Zon
e 3
(12)
21
11
11
23
)
1 A
brol
hos
Isla
nd &
Mid
wes
t Tra
wl M
anag
ed F
ishe
ry17
64
32
31
26
6
2 B
room
e P
raw
n In
terim
Man
aged
Fis
hery
5-
--
--
--
-
3 C
ockb
urn
Sou
nd C
rab
Man
aged
Fis
hery
15A
Cla
ss L
icen
ce (
7)-
--
-2
12
4)
B C
lass
Lic
ence
(8)
--
--
32
46
)
3 C
ockb
urn
Sou
nd F
ish
Net
Man
aged
Fis
hery
4-
--
-2
13
4)
Tot
al N
o. o
f Coc
kbur
n
3 C
ockb
urn
Sou
nd L
ine
& P
ot M
anag
ed F
ishe
ry32
--
--
108
1320
) S
ound
boa
ts w
etlin
ing
3 C
ockb
urn
Sou
nd M
usse
l Man
aged
Fis
hery
3-
--
--
-1
1)
35
3 W
est C
oast
Bea
ch B
ait M
anag
ed F
ishe
ry13
)A
Cla
ss L
icen
ce (
10)
--
--
12
48
)B
Cla
ss L
icen
ce (
3)-
--
-2
21
3)
Kim
berle
y G
illne
t & B
arra
mun
di M
anag
ed F
ishe
ry10
54
43
44
45
5
Nor
ther
n D
emer
sal S
cale
fish
Man
aged
Fis
hery
10Z
one
1 (4
)-
--
--
-2
3)
9Z
one
2 (6
)-
--
--
-1
6)
Mar
ine
Aqu
ariu
m F
ish
Man
aged
Fis
hery
10-
--
-1
11
11
Appendix 2 (continued)
Num
ber
of b
oats
in th
e m
anag
ed a
nd in
terim
man
aged
fish
erie
s th
at w
etlin
ed
(con
tinue
d)

Fish. Res. Rep. Fish. West. Aust.1999, 118, 1-142
109
Pilb
ara
Tra
p M
anag
ed F
ishe
ry 6
Zon
e 1
(6)
15
72
22
35
) 5
Pilb
ara
Tra
wl M
anag
ed F
ishe
ry16
--
--
--
35
5
Sha
rk B
ay B
each
Sei
ne &
Mes
h N
et M
anag
ed F
ishe
ry 9
uni
ts-
35
3-
46
9 un
its9
units
Not
e :
The
re a
re 2
2 lic
ence
s in
thi
s fis
hery
.Mos
t fis
hing
uni
tsar
e m
ade
up o
f a ‘m
othe
r’ bo
at a
nd o
ne o
r m
ore
ding
hies
.
Sou
th C
oast
Pur
se S
eine
Man
aged
Fis
hery
25 u
nits
--
-9
1318
1820
20
Sou
ther
n D
emer
sal G
illne
t& D
emer
sal L
ongl
ine
Man
aged
Fis
hery
55 u
nits
Zon
e 1
(14)
1110
1211
99
1013
)Z
one
2 (1
5)9
117
512
89
14)
Zon
e 3
(0)
--
1-
11
--
)49
Zon
e 4
(1)
--
-1
1-
-1
)
Sup
plem
enta
ry)
Zon
e 1
(10)
1312
127
1011
9 9
)Z
one
2 (1
5)13
1212
99
1112
12)
Oth
er (
1)-
--
--
--
-
1 S
outh
Wes
t Tra
wl M
anag
ed F
ishe
ry 1
4Z
one
A (
2)-
1-
--
--
1)
Zon
e A
& B
(1)
--
--
--
--
)Z
one
B (
4)6
36
33
33
3)8
Zon
e B
& C
(4)
--
--
--
-3
)Z
one
D &
B (
3)1
)
2 K
imbe
rley
Pra
wn
Man
aged
Fis
hery
135
Zon
e 1
(126
)-
-11
2122
2322
38)4
2Z
one
2 (9
)-
--
12
12
4)
Fis
hery
No.
of
Num
ber
of li
cens
ed fi
shin
gN
o. o
f fis
hing
boa
ts a
sT
otal
no.
of f
ishi
ng b
oats
as
boat
s/un
itsbo
ats
wet
linin
g in
the
fishe
rylic
ense
d at
30.
6.98
whi
chlic
ense
d at
30.
6.98
whi
chin
the
by y
ear
wet
lined
in th
e zo
ne/a
rea
actu
ally
wet
lined
in
the
fishe
ry a
s91
9293
9495
9697
1991
-92
to 1
997-
98fis
hery
199
1-92
to 1
997-
98at
30.
6.98
9293
9495
9697
98
Appendix 2 (continued)
Num
ber
of b
oats
in th
e m
anag
ed a
nd in
terim
man
aged
fish
erie
s th
at w
etlin
ed
(con
tinue
d)
cont
inue
d ov
er

Fish. Res. Rep. Fish. West. Aust.1999, 118, 1-142
110
2 O
nslo
w P
raw
n M
anag
ed F
ishe
ry 3
1Z
one
A (
4)-
--
-1
23
2)
Zon
e B
(3)
22
11
22
11
)Z
one
C (
12)
1012
1110
1212
1211
)22
Zon
e D
(12
)5
55
13
25
8)
2 E
xmou
th G
ulf P
raw
n M
anag
ed F
ishe
ry16
1012
‘412
1516
1615
15
2 N
icko
l Bay
Pra
wn
Man
aged
Fis
hery
144
65
13
36
99
2, 4
Sha
rk B
ay P
raw
n M
anag
ed F
ishe
ry27
45
77
33
111
11
1, 4
Sha
rk B
ay S
callo
p M
anag
ed F
ishe
ry14
sca
llop
11
21
-1
23
3on
ly b
oats
Sha
rk B
ay S
napp
er M
anag
ed F
ishe
ry22
A C
lass
lice
nces
(12
lice
nses
and
11
boat
s)1
64
48
99
11)
B C
lass
lice
nces
(11
lice
nses
and
10
boat
s)6
44
56
69
10)2
2S
uppl
emen
tary
(5
licen
ses
and
5 bo
ats)
66
65
55
5 5
)N
ote:
the
re a
re 5
lice
nsed
fis
hing
boa
ts w
ith m
ore
than
one
licen
ce o
r ty
pe o
f lic
ence
in t
his
fishe
ry.
Hen
ce t
henu
mbe
r of
lice
nces
and
boa
ts d
o no
t co
rres
pond
.
Sou
th C
oast
Sal
mon
Man
aged
Fis
hery
23 u
nits
1816
1615
1214
1121
uni
ts21
uni
tsN
ote:
the
re a
re 7
0 lic
ense
d fis
hing
boa
ts in
thi
s fis
hery
.M
ost
units
are
mad
e up
of
a ‘m
othe
r’ bo
at a
nd o
ne o
rm
ore
ding
hies
.
Sou
th W
est S
alm
on M
anag
ed F
ishe
ry13
uni
ts12
1312
1212
1313
13 u
nits
13 u
nits
Not
e: t
here
are
48
licen
sed
fishi
ng b
oats
in t
his
fishe
ry.
Mos
t un
its a
re m
ade
up o
f a
“mot
her”
boa
tan
d o
ne o
r m
ore
ding
hies
.
Fis
hery
No.
of
Num
ber
of li
cens
ed fi
shin
gN
o. o
f fis
hing
boa
ts a
sT
otal
no.
of f
ishi
ng b
oats
as
boat
s/un
itsbo
ats
wet
linin
g in
the
fishe
rylic
ense
d at
30.
6.98
whi
chlic
ense
d at
30.
6.98
whi
chin
the
by y
ear
wet
lined
in th
e zo
ne/a
rea
actu
ally
wet
lined
in
the
fishe
ry a
s91
9293
9495
9697
1991
-92
to 1
997-
98fis
hery
199
1-92
to 1
997-
98at
30.
6.98
9293
9495
9697
98
Appendix 2 (continued)
Num
ber
of b
oats
in th
e m
anag
ed a
nd in
terim
man
aged
fish
erie
s th
at w
etlin
ed
(con
tinue
d)

Fish. Res. Rep. Fish. West. Aust.1999, 118, 1-142
111
Spe
cim
en S
hell
Man
aged
Fis
hery
24 b
oats
&-
- -
-1
21
11
Not
e: 1
0 S
peci
men
She
ll M
anag
ed F
ishe
ry li
cenc
es34
lice
nces
do n
ot h
ave
boat
s at
tach
ed t
o th
em.
War
nbro
Sou
nd C
rab
Man
aged
Fis
hery
1-
--
--
--
1)
Esp
eran
ce S
outh
ern
Roc
k lo
bste
r M
anag
ed F
ishe
ry11
Zon
e A
(10
)5
65
16
55
7)
Zon
e B
(1)
12
--
11
11
)8
Wes
t Coa
st P
urse
Sei
ne M
anag
ed F
ishe
ry
(6)
11 u
nits
1-
11
-5
41
)S
uppl
emen
tary
(5)
65
45
33
34
)5
Wes
t Coa
st R
ock
Lobs
ter
Man
aged
Fis
hery
603
Zon
e A
(14
9)5
114
99
1115
27)
Zon
e B
(15
1)14
89
1412
2329
50)2
01Z
one
C (
303)
6044
4048
5164
8012
4)
Win
dy H
arbo
ur R
ock
Lobs
ter
Man
aged
Fis
hery
28
106
46
42
22
1T
here
are
inte
r-re
latio
nshi
ps b
etw
een
the
Sha
rk B
ay S
callo
p F
ishe
ry,
the
Abr
olho
s Is
land
s &
Mid
wes
t T
raw
l Fis
hery
and
the
Sou
th W
est
Tra
wl F
ishe
ry e
g. 2
boa
ts w
hich
wet
line
in t
he A
IMW
TF
are
also
in th
e S
B S
callo
p F
ishe
ry &
one
boa
t whi
ch w
etlin
es in
the
SW
TF
is a
lso
in th
e A
IMW
TF
.
2T
here
are
sig
nific
ant
inte
r-re
latio
nshi
ps b
etw
een
the
praw
n tr
awl f
ishe
ries.
O
f th
e 46
pra
wn
traw
lers
whi
ch w
etlin
e, 1
8 ha
ve a
cces
s to
thr
ee p
raw
n tr
awl f
ishe
ries,
17
have
acc
ess
to t
wo,
and
ele
ven
have
acc
ess
to o
ne f
ishe
ry.
3T
here
are
a n
umbe
r of
boa
ts in
the
Coc
kbur
n S
ound
Fis
herie
s w
hich
are
lice
nsed
in m
ore
than
one
fis
hery
. H
ence
, on
ly 3
0 bo
ats
from
all
thes
e fis
herie
s w
etlin
ed.
In
addi
tion,
the
fis
herie
s on
ly c
ame
unde
r m
anag
emen
t in
199
5.
Man
y w
etlin
ed b
efor
e th
at d
ate,
but
the
dat
a w
as n
ot c
olla
ted
unde
r th
at p
artic
ular
fis
hery
. T
heir
his
tory
has
bee
n ca
rrie
d w
ith t
he b
oat.
4 2
7 S
hark
Bay
Pra
wn
Fis
hery
boa
ts a
lso
fish
in t
he S
hark
Bay
Sca
llop
Fis
hery
. H
owev
er,
only
the
14
dedi
cate
d sc
allo
p tr
awle
rs a
re in
clud
ed h
ere.
Fis
hery
No.
of
Num
ber
of li
cens
ed fi
shin
gN
o. o
f fis
hing
boa
ts a
sT
otal
no.
of f
ishi
ng b
oats
as
boat
s/un
itsbo
ats
wet
linin
g in
the
fishe
rylic
ense
d at
30.
6.98
whi
chlic
ense
d at
30.
6.98
whi
chin
the
by y
ear
wet
lined
in th
e zo
ne/a
rea
actu
ally
wet
lined
in
the
fishe
ry a
s91
9293
9495
9697
1991
-92
to 1
997-
98fis
hery
199
1-92
to 1
997-
98at
30.
6.98
9293
9495
9697
98
Appendix 2 (continued)
Num
ber
of b
oats
in th
e m
anag
ed a
nd in
terim
man
aged
fish
erie
s th
at w
etlin
ed
(con
tinue
d)

Fish. Res. Rep. Fish. West. Aust.1999, 118, 1-142
112
Appendix 3 Reported wetline catches by species

Fish. Res. Rep. Fish. West. Aust.1999, 118, 1-142
113
Appendix 3 (continued)

Fish. Res. Rep. Fish. West. Aust.1999, 118, 1-142
114
Appendix 4 Reported wetline catches of ‘wetline only’, West Coast RockLobster, Southern Demersal Gillnet and Demersal Long Lineand Shark Bay Snapper licensed fishing boats

Fish. Res. Rep. Fish. West. Aust.1999, 118, 1-142
115
Appendix 4 (continued)

Fish. Res. Rep. Fish. West. Aust.1999, 118, 1-142
116
Appendix 4 (continued)

Fish. Res. Rep. Fish. West. Aust.1999, 118, 1-142
117
Appendix 4 (continued)

Fish. Res. Rep. Fish. West. Aust.1999, 118, 1-142
118
Appendix 4 (continued)

Fish. Res. Rep. Fish. West. Aust.1999, 118, 1-142
119
Appendix 4 (continued)
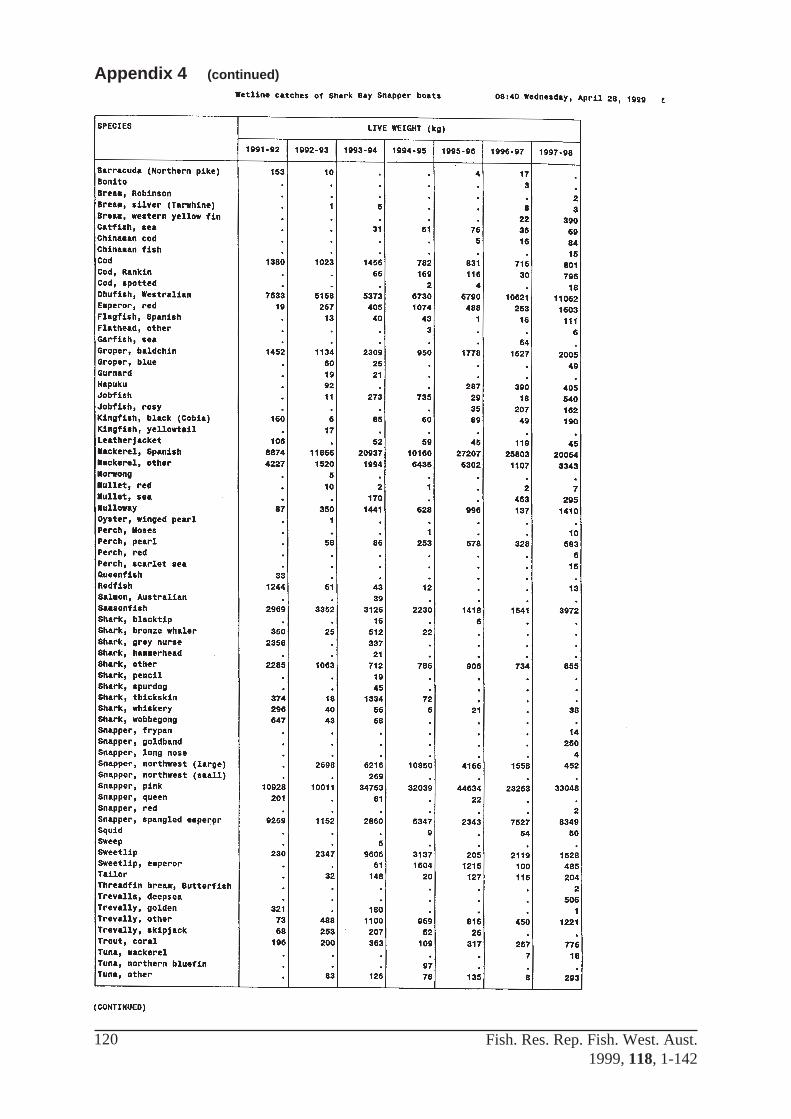
Fish. Res. Rep. Fish. West. Aust.1999, 118, 1-142
120
Appendix 4 (continued)

Fish. Res. Rep. Fish. West. Aust.1999, 118, 1-142
121
Appendix 4 (continued)

Fish. Res. Rep. Fish. West. Aust.1999, 118, 1-142
122
Appendix 5 Targeted wetline and recreational species
NOTE: Recreational catch shown is preliminary boat catch from Augusta to Kalbarri for thelower West Coast Recreational Fishing Boat Survey.
Appendix Table 1a
BREAM, SILVER (TARWHINE) LIVE WEIGHT (Tonnes)
1991-92 1992-93 1993-94 1994-95 1995-96 1996-97 1997-98
Wetline catch 1.4 1.4 0.6 1.5 0.1 0.1 0.2
Other commercial catch 6.5 5.7 5.4 14.6 2.4 2.8 4.6
Total commercial catch 7.9 7.1 6.0 16.1 2.4 2.9 4.8
Wetline catch as a % of 17.7% 19.7% 10% 9.3% 4.1% 3.4% 4.2%total commercial catch
Appendix Table 1b
BREAM, SILVER (TARWHINE) Live weight Percentage of total catch,(Tonnes) 1996-97 Kalbarri - Augusta
Preliminary findings of the recreational 1.4 87.5%catch survey, Kalbarri to Augusta
Wetline catch, Kalbarri to Augusta 0.1 6.2%
Other commercial catch, Kalbarri to Augusta 0.1 6.3
Total catch including preliminary 1.6 100%recreational catch, Kalbarri to Augusta
Note: This species is distributed from Albany to Coral Bay. Much of the catch occurs outside the area surveyed. The shore-based catch of the recreational sector also needs to be considered.
Appendix Table 2
COD, SPOTTED LIVE WEIGHT (Tonnes)
1991-92 1992-93 1993-94 1994-95 1995-96 1996-97 1997-98
Wetline catch - 0.1 0.06 0.2 0.3 0.2 0.2
Other commercial catch 10.6 42.1 41.3 48.4 68.7 52.0 39.4
Total commercial catch 20.9 42.2 41.3 48.6 69.0 52.2 39.6
Wetline catch as a % of total - 0.2% - 0.4% 0.4% 0.4% 0.5%commercial catch

Fish. Res. Rep. Fish. West. Aust.1999, 118, 1-142
123
Appendix Table 3a
FLATHEADS LIVE WEIGHT (Tonnes)
1991-92 1992-93 1993-94 1994-95 1995-96 1996-97 1997-98
Wetline catch 0.3 0.2 0.1 0.1 0.4 0.2 0.4
Other commercial catch 35.3 36.9 12.6 10.7 8.0 10.3 7.3
Total commercial catch 35.6 37.1 12.7 10.8 8.4 10.5 7.7
Wetline catch as a % of total 0.8% 0.5% 0.8% 0.9% 4.8% 1.9% 5.2%commercial catch
Appendix Table 3b
FLATHEADS Live weight Percentage of total catch,(Tonnes) 1996-97 Kalbarri - Augusta
Preliminary findings of the recreational 5.4 87.1%catch survey, Kalbarri to Augusta
Wetline catch, Kalbarri to Augusta 0.1 1.6%
Other commercial catch, Kalbarri to Augusta 0.7 11.3%
Total catch including preliminary recreational 6.2 100%catch, Kalbarri to Augusta
Appendix Table 4a
TAILOR LIVE WEIGHT (Tonnes)
1991-92 1992-93 1993-94 1994-95 1995-96 1996-97 1997-98
Wetline catch 10.2 4.4 4.8 1.4 5.3 5.6 8.0
Other commercial catch 37.6 44.6 44.5 52.4 50.7 45.7 45.9
Total commercial catch 47.8 49.0 49.3 53.8 56.0 51.3 53.9
Wetline catch as a % of 21.3% 9.0% 9.7% 2.6% 9.4% 10.9% 14.8%total commercial catch
Appendix 5 (continued)

Fish. Res. Rep. Fish. West. Aust.1999, 118, 1-142
124
Appendix Table 4b
TAILOR Live weight Percentage of total catch,(Tonnes) 1996-97 Kalbarri - Augusta
Preliminary findings of the recreational 10.0 85.5%catch survey, Kalbarri to Augusta
Wetline catch, Kalbarri to Augusta 1.5 12.8%
Other commercial catch, 0.2 1.7%Kalbarri to Augusta
Total catch including preliminary 11.7 100%recreational catch, Kalbarri to Augusta
Appendix Table 5a
KING GEORGE WHITING LIVE WEIGHT (Tonnes)1991-92 1992-93 1993-94 1994-95 1995-96 1996-97 1997-98
Wetline catch 8.2 6.4 2.0 1.9 2.1 2.4 0.9
Other commercial catch 30.1 27.4 23.9 18.3 20.9 32.4 75.2
Total commercial catch 38.3 33.8 25.9 20.2 23.0 34.8 76.1
Wetline catch as a % of 21.4% 18.9% 7.7% 9.4% 9.1% 6.8% 1.1% total commercial catch
Appendix Table 6b
KING GEORGE WHITING Live weight Percentage of total catch,(Tonnes) 1996-97 Kalbarri - Augusta
Preliminary findings of the recreational 21.0 94.3%catch survey, Kalbarri to Augusta
Wetline catch, Kalbarri to Augusta 0.8 3.5%
Other commercial catch, Kalbarri to Augusta 0.5 2.2%
Total catch including preliminary recreational 22.3 100%catch, Kalbarri to Augusta
Appendix 5 (continued)

Fish. Res. Rep. Fish. West. Aust.1999, 118, 1-142
125
Appendix 6 Reported wetline catches by fishing block
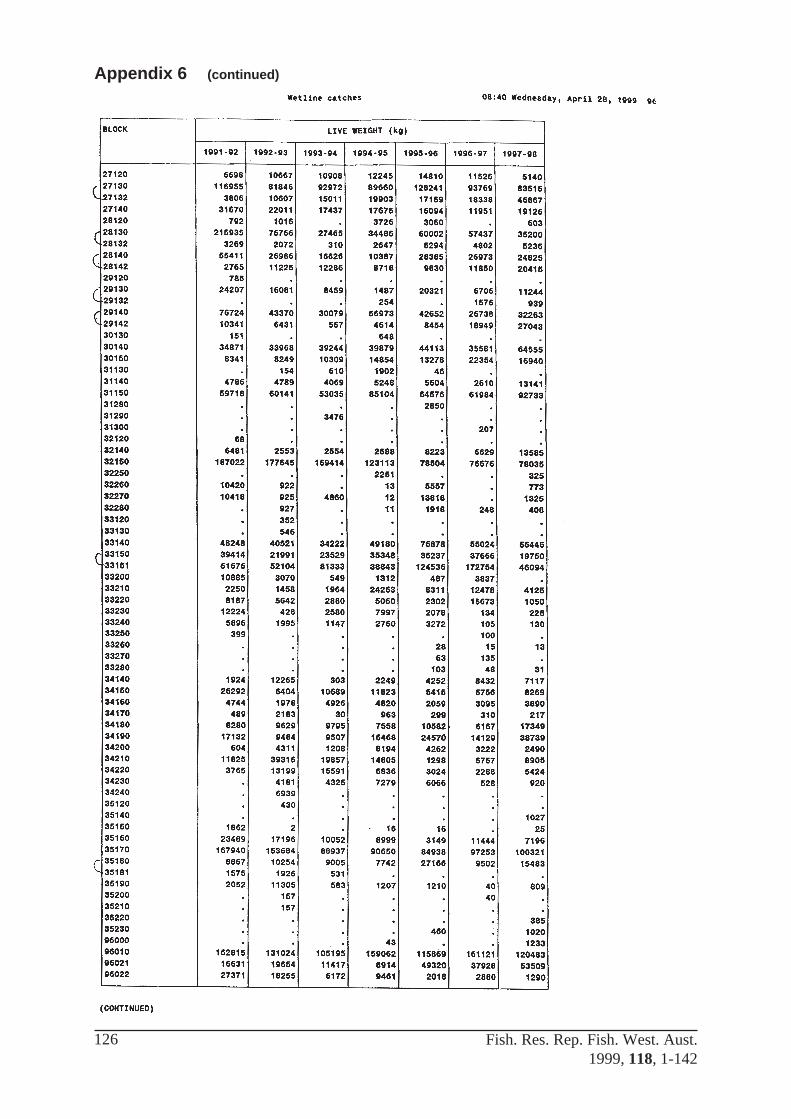
Fish. Res. Rep. Fish. West. Aust.1999, 118, 1-142
126
Appendix 6 (continued)

Fish. Res. Rep. Fish. West. Aust.1999, 118, 1-142
127
Appendix 6 (continued)

Fish. Res. Rep. Fish. West. Aust.1999, 118, 1-142
128
Appendix 6 (continued)

Fish. Res. Rep. Fish. West. Aust.1999, 118, 1-142
129
Appendix 6 (continued)

Fish. Res. Rep. Fish. West. Aust.1999, 118, 1-142
130
Appendix 6 (continued)
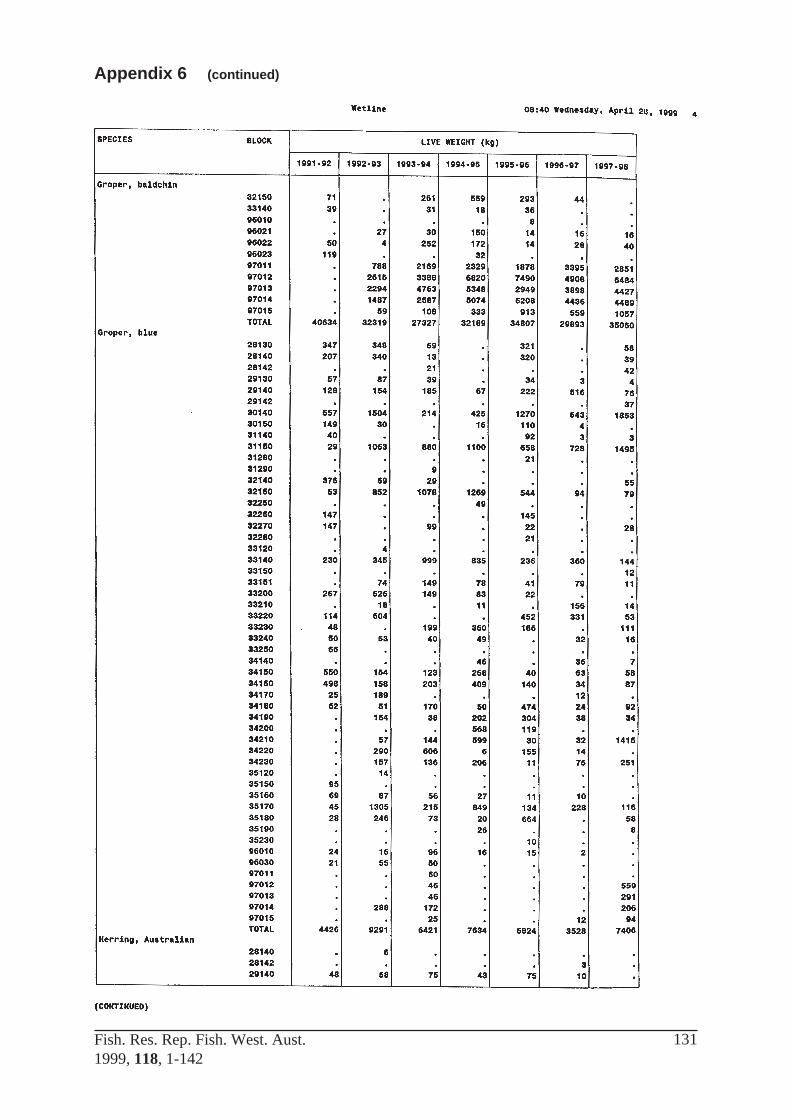
Fish. Res. Rep. Fish. West. Aust.1999, 118, 1-142
131
Appendix 6 (continued)

Fish. Res. Rep. Fish. West. Aust.1999, 118, 1-142
132
Appendix 6 (continued)

Fish. Res. Rep. Fish. West. Aust.1999, 118, 1-142
133
Appendix 6 (continued)
Fish. Res. Rep. Fish. West. Aust.1999, 118, 1-142
134
Appendix 6 (continued)
Fish. Res. Rep. Fish. West. Aust.1999, 118, 1-142
135
Appendix 6 (continued)
Fish. Res. Rep. Fish. West. Aust.1999, 118, 1-142
136
Appendix 6 (continued)

Fish. Res. Rep. Fish. West. Aust.1999, 118, 1-142
137
Appendix 6 (continued)

Fish. Res. Rep. Fish. West. Aust.1999, 118, 1-142
138
Appendix 6 (continued)

Fish. Res. Rep. Fish. West. Aust.1999, 118, 1-142
139
Appendix 7 Wetline catches of the Abrolhos Islands, Perth metropolitanregion and South West region
Fish. Res. Rep. Fish. West. Aust.1999, 118, 1-142
140
Appendix 7 (continued)

Fish. Res. Rep. Fish. West. Aust.1999, 118, 1-142
141
Appendix 7 (continued)

Fish. Res. Rep. Fish. West. Aust.1999, 118, 1-142
142
Appendix 7 (continued)