western australia's transition to a competitive capacity auction
TRANSCRIPT

Western Australia’s Transition to a Competitive Capacity Auction PREPARED FOR
PREPARED BY
Kathleen Spees
Samuel A. Newell
Colin A. McIntyre
29 January, 2016

This report was prepared for EnerNOC. All results and any errors are the responsibility of
the authors and do not represent the opinion of The Brattle Group or its clients.
Copyright © 2016 The Brattle Group, Inc.

i | brattle.com
Table of Contents Executive Summary ..................................................................................................................... ii
I. Background on the PUO Transition Mechanism Proposal ................................................... 1
II. Assessment of the Proposed Transition Mechanism ............................................................. 2
A. Resource Discrimination Will Reduce Economic Efficiency .................................... 2
B. The Transition’s Static Payment Function Will Maintain Medium-High Prices
for an Extended Period Followed by a Second Shock When Auctions are
Triggered ................................................................................................................... 5
C. The Proposed Outcomes-Based Trigger for Implementing the Auction Further
Distorts Generators’ Incentives ................................................................................ 8
III. Suggestions for a More Economically Efficient and Smoother Glide Path to Auctions ...... 8
A. Alternative Transition Mechanism Proposal .............................................................. 9
B. Illustrative Price Trajectory ....................................................................................... 11
C. Comparison of Transition Proposals ......................................................................... 12
List of Acronyms ........................................................................................................................ 14
Bibliography ............................................................................................................................... 15
13

ii | brattle.com
Executive Summary
The Western Australia Public Utilities Office (PUO) outlined its proposal for reforming the
Reserve Capacity Mechanism (RCM) into a competitive auction-based mechanism that meets
reliability objectives at lower cost. However, the PUO was concerned that if it instituted the
auction immediately, a sudden large drop in capacity payments could impair suppliers and
threaten the sustainability of the electricity market. The PUO therefore proposed a
transitional mechanism intended to balance the competing objectives of reducing excess
capacity and customer costs, while mitigating price impacts on suppliers.
A key element of the PUO’s transition proposal is that it would discriminate against demand
response (DR), paying a much lower price for it than for generation, to incentivize some DR
to exit. Generation would be paid according to an RCM payment curve that declines
somewhat more steeply than today’s curve. The curve would remain static until the reserve
margin tightens to 5–6%. If and when that occurs, the final auction design would be
triggered, with a much steeper demand curve for capacity, and with DR and generation
competing on a level playing field.
The PUO’s proposed transition mechanism will meet or exceed the reliability objectives, and
it will partly meet the objective of reducing customer costs at least compared to the status
quo. However, we believe the proposed transition mechanism will largely fail to meet its
goals of reducing costs and eliminating economically inefficient resources, and that these
inefficiencies will persist for well over a decade before shifting to the more efficient
competitive auction design. This is due to the proposed resource discrimination and other
related problems:
Discriminating between generation and demand response will distort investment and
exit decisions away from least-cost, economically-efficient outcomes. Generators will
have incentives to reinvest in their capacity even when it is unneeded and less cost-
effective than demand response.
The proposed static pricing schedule will maintain uneconomically high prices for a
protracted period that may last more than a decade before the auction is triggered.
The proposed outcomes-based trigger for moving to an auction (with lower prices)
further distorts generators’ incentives to uneconomically maintain and invest in their
capacity in order to delay triggering an auction.
In this paper, we propose an alternative transition mechanism designed to balance the PUO’s
competing objectives of reducing customer costs and mitigating supplier impacts, while
correcting the concerns we have identified. This proposal would treat all generation and
demand response resources on a level playing field, move to an auction format as quickly as
possible, and mitigate price shocks with a phased introduction of a demand curve. The initial
demand curve would be relatively flat but would become steeper each year according to a
pre-determined schedule. The curve would match the final proposed PUO curve after a
known period, possibly five or ten years.

iii | brattle.com
The result of our proposal would be to introduce an initial price shock that is similar to that
under the PUO proposal, then gradually decrease prices as the demand curve becomes
steeper, and move to the final auction design over the course of a pre-specified number of
years. This alternative approach would limit the time of the transition period and provide a
more concrete timeline for achieving the final design, while mitigating price shocks along the
way. And it would eliminate the inefficiencies associated with resource discrimination.

1 | brattle.com
I. Background on the PUO Transition Mechanism Proposal
The Western Australia Public Utilities Office (PUO) outlined its proposal for reforming the
Reserve Capacity Mechanism (RCM) into a competitive auction-based mechanism that meets
reliability objectives at lower cost. The proposed auction design is generally consistent with
best practices from successful capacity markets in the U.S. The auction would determine a
clearing price and quantity based on the intersection of an administratively-determined
demand curve and a supply curve made up of offers from all types of qualified suppliers
competing against each other on cost. The demand curve would be constructed to procure
just enough capacity to meet reliability objectives, without being so steep as to produce
excessively volatile prices or invite the exercise of market power. Because the proposed curve
for the final auction will be much steeper than the current RCM payment function, prices
would decline more rapidly with excess capacity. At a high reserve margin, the price would
be much lower than it is under the current RCM, so capacity would exit and avoid the
present situation with high prices under excess supply conditions.
However, the PUO was concerned that if it instituted the auction immediately, the large and
sudden price drop would be “financially disruptive for participants and create risks for the
sustainability of the market as a whole.”1 The PUO noted a risk of “flow on effects to the
energy market…from a widespread impairment of generation assets.”2 Hence they proposed
a transition mechanism to ease that shock, while reducing customer cost, discouraging new
entrants, and encouraging the exit of inefficient resources.3
The PUO’s proposed transition mechanism administratively sets the capacity price using a
curve proposed by the Independent Market Operator (IMO) with a slope of -5 instead of the
more gradual curve in effect today.4 The PUO suggested using a single slope throughout the
transition in lieu of a progressively steepening slope year to year.5
A key element of the PUO’s proposed transition mechanism is that it would discriminate
against demand response, paying a much lower price for it than for generation to incentivize
some DR to exit. The PUO’s rationale for this discrimination appears to be that it wants to
reduce the excess capacity of both generation and demand response, but that a lower price is
needed to cause demand response to exit due to its fundamentally different cost structure:
1 See PUO (2015), p.13.
2 Ibid.
3 See PUO (2015), p. 45.
4 The proposed curve is defined as Price = Price Cap * ((1-(Surplus % + 3%))*slope))-1. A more
negative slope parameter would correspond to steeper payment curves. The current formula sets
Price = Price Cap * (Surplus %)-1. An illustration of both curves is provided in Figure 3 in a later
section. See IMO (2013), p. 32.
5 See PUO (2015), p. 46.

2 | brattle.com
The reforms to the capacity price formula during the transition period will
result in the price paid for capacity being discounted more heavily when there
is excess capacity than is currently the case. This adjustment will result in a
lower capacity price and reduce incentives for generation capacity to be
maintained in the market or new generation capacity to enter the market.
A lower capacity price will not have the same effect on incentives for demand
side management capacity, as it has fundamentally different cost drivers to
other forms of capacity.6
The PUO explains that demand response’s cost structure reflects minimal capital costs and
high dispatch costs that exceed the energy price cap. DR would incur high opportunity costs
when dispatched, but the likelihood of being dispatched is low under excess supply
conditions, so demand response will stay in the market until the capacity revenue is at levels
far below what the proposed transition mechanism would produce.
II. Assessment of the Proposed Transition Mechanism
The PUO’s proposed transition mechanism will meet or exceed the reliability objectives, and
it will partly meet the objective of reducing customer costs at least compared to the status
quo. However, we believe the proposed transition mechanism will largely fail to meet its
goals of reducing costs and eliminating economically inefficient resources, and that these
inefficiencies will persist for well over a decade before shifting to the more efficient
competitive auction design. This is due to the proposed resource discrimination and other
related problems:
Discriminating between generation and demand response will distort investment and
exit decisions away from least-cost, economically-efficient outcomes. Generators will
have incentives to reinvest in their capacity even when it is unneeded and less cost-
effective than demand response.
The proposed static pricing schedule will maintain uneconomically high prices for a
protracted period that may last more than a decade before the auction is triggered.
The proposed outcomes-based trigger for moving to an auction (with lower prices)
further distorts generators’ incentives to uneconomically maintain and invest in their
capacity in order to delay triggering an auction.
These effects are likely to extend economic inefficiencies and high prices for many years,
without providing price stability or predictability to the market.
A. RESOURCE DISCRIMINATION WILL REDUCE ECONOMIC EFFICIENCY
The PUO’s proposal recognizes that the current excess of capacity is costly and provides little
marginal value, so some resources must be let go. Ideally, the resources that stay should be
6 See PUO (2015), p. 47.

3 | brattle.com
the most competitive, and those that go should be the costliest. Indeed, one of the PUO’s
goals is “encouraging mothballing/retirement of inefficient capacity” in the transition.7 But
this is not what the proposed transition mechanism would do. The proposal instead targets
demand response, but without having demonstrated that all demand response is less
economic than all generation, other than referencing its higher dispatch costs. But dispatch
costs are only one component of a resource’s total costs. It would similarly miss the whole
story if one were to focus on aging generators and note that they would likely have the
highest capital reinvestment costs and so determine that the oldest generators should be
targeted for price discrimination.
The missing pieces of this story are:
First, capacity is a different product from energy. It is a megawatt of supply that has
committed to be available so the system operator can avoid involuntary load shedding
due to total supply being inadequate to meet demand. The ability of any resource to
provide such a product should be established on technical grounds that are indifferent
to the underlying asset’s dispatch costs (those differences are fully recognized in the
energy market). Resource qualification should however account for the true
availability of each resource to help avoid load shedding. In the case of demand
response, qualification requirements should include accurate measurement and
verification standards as well as a measure of performance during reliability events (or
surprise test events if there are no realized reliability events).
And second, the most economically efficient resources to keep online to meet the
capacity requirements are those with the lowest net costs, and that are willing to
accept the lowest capacity payment.8 The resources needing the highest capacity
payment are the costliest and so should be the first to exit.
In many cases, existing generators will have lower net going forward costs than demand
response and would be willing to accept very low capacity prices before retiring or
mothballing. This is because existing generators’ capital costs are largely sunk, and they
7 See PUO (2015), p. 45.
8 A capacity supplier’s net costs are given by the going-forward fixed operating and maintenance
(FOM) and capital costs minus net energy revenues. “Net energy revenues” are the revenues
earned in the energy market minus any fuel and other variable costs, thus fully reflecting each
resource’s value related to its dispatch costs. Net revenues from the energy market help cover a
portion of a resource’s fixed costs. This is particularly true for baseload generation that accrues
substantial net revenues from the energy market. This is why the more capital-intensive baseload
units need not earn a higher capacity payment than less capital-intensive combustion turbine
units. Both baseload and peaking capacity will recover their capital costs in an efficient market,
but baseload will earn proportionally more out of the energy market and less from capacity.
Similarly, demand response will earn nothing from the energy market if it is not dispatched, or
even face net costs from dispatch given the low energy price cap in Western Australia. If all
resources are paid the same energy price for dispatch and the same capacity price for availability,
then competitive forces will incentivize the lowest-cost combination of these resources to meet
both energy and capacity needs.

4 | brattle.com
would earn sufficient margins out of the energy market to stay online even without earning
any capacity revenues. However, other existing generators would have very high net going
forward costs, for example if they faced a major retrofit or plant reinvestment to continue
operating. Overall, there will be a diversity of high-cost and low-cost resources amongst both
demand response and generation. We have seen this in PJM, where demand response
resources have out-competed many existing generators.9
The PUO’s proposed mechanism is not set up to discover the relative economics of generation
and demand response resources because it discriminates between them. With generation
receiving a much higher price, high-cost generators may stay online while low-cost demand
response exits. The high price paid to generation will shield it from the pressure to retire
even when uncompetitive and uneconomic. This will create incentives for generators to
undertake high-cost retrofits to uneconomically prolong the life of the unit even under
current overbuilt conditions. Generators may even find it profitable to invest in uneconomic
capacity uprates to their existing plants. Such capital expenditures would be economically
wasteful and run counter to the goals of the energy market review.
The best way to identify the lowest-cost resources is through a competitive auction with a
level playing field for all qualified resources, rather than administratively selecting winners
and losers.10 Every resource will offer to sell capacity at the minimum price they would need
to recover their costs. Those with the highest offers would not clear. The result is to
minimize total costs across the resource base, and minimize the customer costs associated
with meeting a particular capacity requirement. The PUO recognizes the value of using a
competitive auction: “When the auction arrangements commence, demand side management
capacity will be subjected to the correct signals to compete on a level playing field with other
capacity providers.”11 But a level playing field would be just as valuable during a transition,
when it will be equally important to allow competitive forces to push the most uneconomic
resources out of the market.
It is true that under the PUO’s proposed transition mechanism, demand response would be
compensated at uneconomically high prices if it were included in the payment scheme. But
the same is true for generation. The medium-high prices contemplated in the transition
mechanism are lower than under the current RCM, but still far above the economic value of
capacity, far above the long-term proposed demand curve level, and far above the price levels
that are likely needed to encourage substantial exit (of both generation and demand response)
from the market. These concerns suggest that an even steeper demand curve should be
implemented more quickly to reduce the magnitude of overcompensation across the board.
9 See Pfeifenberger et al. (2011), p. 17.
10 By “level playing field” we mean equal competitive treatment across all resources that provide the
same or nearly the same capacity value, being available to balance supply and demand and thus
prevent involuntary load-shedding during peak conditions when supply can become inadequate.
Differences in resources’ availability and reliability can be accounted for through appropriate
adjustments to their capacity ratings.
11 See PUO (2015), p. 14.

5 | brattle.com
B. THE TRANSITION’S STATIC PAYMENT FUNCTION WILL MAINTAIN MEDIUM-HIGH PRICES FOR AN EXTENDED PERIOD FOLLOWED BY A SECOND SHOCK WHEN AUCTIONS ARE TRIGGERED
Consistent with the PUO’s transition objectives, the proposed mechanism would prevent
prices from plummeting as quickly as they would if the ultimate auction design were
implemented right away. However, it will likely not provide a smooth price path toward a
competitive auction. Prices would drop when the “-5” curve is first introduced, even though
we expect some capacity to exit at that time due to the lower, but still relatively high prices.
Thereafter, prices would turn around and begin increasing over time as the supply excess
slowly erodes with load growth and possibly some exit. This would result in a potentially
long period of a decade or more during which the RCM curve remains static and produces
prices well above the eventual auction demand curve. Over that period, the rising prices
would provide incentives in the wrong direction regarding the PUO’s goal to trim excess
capacity; the prospect of rising prices would reduce generation exit both initially and
thereafter. But once the reserve margin reaches the approximate 6% target the auction would
be triggered. Prices would then drop again because: (1) the proposed auction demand curve is
so much lower than the proposed transition price curve, and (2) supply from demand
response that would be excluded throughout the transition could suddenly be re-introduced
upon triggering competitive auctions.
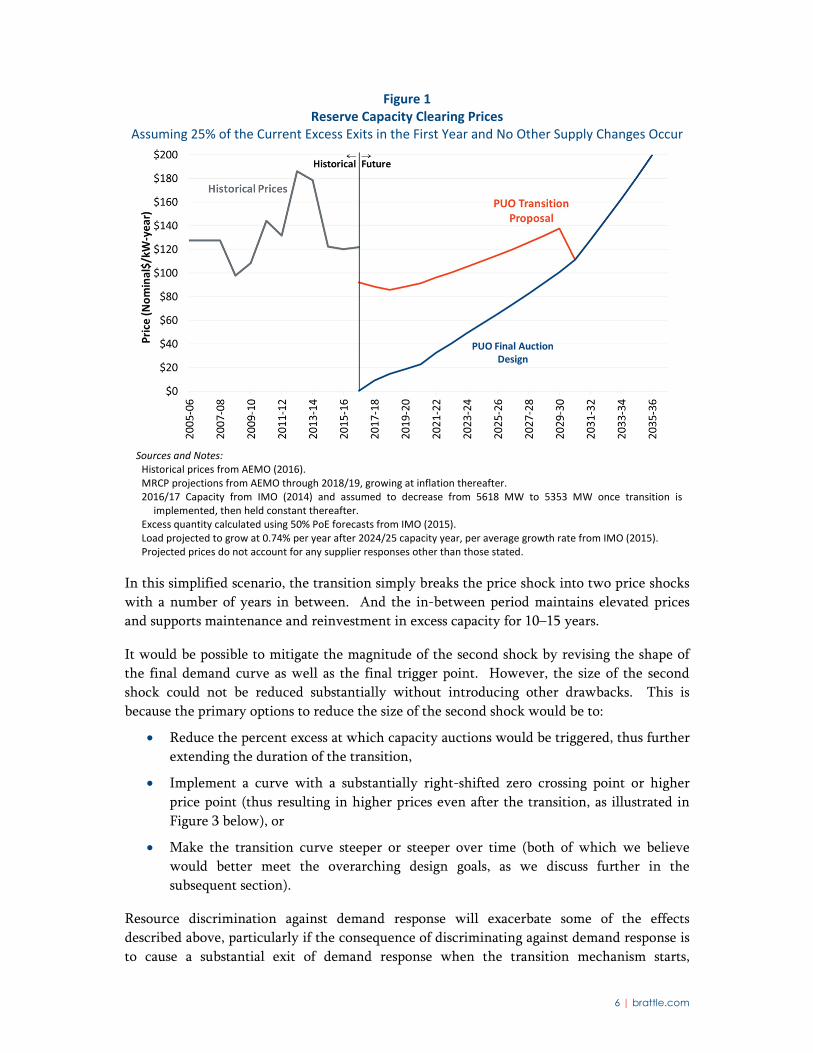
To illustrate, we provide an example in Figure 1: we assume 25% (265 MW) of excess capacity
exits upon the first price drop. Then no further capacity exits as prices rise along the static
transition pricing curve with load growing by 0.75% per year. Prices are determined by the
curve as follows: the price in the first year (2017/18) drops by 28%. Then prices rise by
3.8%/yr over the following 12 years until an auction is triggered in 2030/31 and prices drop
by 20%. In other words, this scenario illustrates how uneconomically high prices could
perpetuate for more than a decade. It is also possible that the transition period could last far
longer than that, particularly if net load growth becomes very low due to rooftop
photovoltaic installations or energy efficiency.
6 | brattle.com
Figure 1 Reserve Capacity Clearing Prices
Assuming 25% of the Current Excess Exits in the First Year and No Other Supply Changes Occur
Sources and Notes: Historical prices from AEMO (2016). MRCP projections from AEMO through 2018/19, growing at inflation thereafter. 2016/17 Capacity from IMO (2014) and assumed to decrease from 5618 MW to 5353 MW once transition is
implemented, then held constant thereafter. Excess quantity calculated using 50% PoE forecasts from IMO (2015). Load projected to grow at 0.74% per year after 2024/25 capacity year, per average growth rate from IMO (2015). Projected prices do not account for any supplier responses other than those stated.
In this simplified scenario, the transition simply breaks the price shock into two price shocks
with a number of years in between. And the in-between period maintains elevated prices
and supports maintenance and reinvestment in excess capacity for 10–15 years.
It would be possible to mitigate the magnitude of the second shock by revising the shape of
the final demand curve as well as the final trigger point. However, the size of the second
shock could not be reduced substantially without introducing other drawbacks. This is
because the primary options to reduce the size of the second shock would be to:
Reduce the percent excess at which capacity auctions would be triggered, thus further
extending the duration of the transition,
Implement a curve with a substantially right-shifted zero crossing point or higher
price point (thus resulting in higher prices even after the transition, as illustrated in
Figure 3 below), or
Make the transition curve steeper or steeper over time (both of which we believe
would better meet the overarching design goals, as we discuss further in the
subsequent section).
Resource discrimination against demand response will exacerbate some of the effects
described above, particularly if the consequence of discriminating against demand response is
to cause a substantial exit of demand response when the transition mechanism starts,
7 | brattle.com
followed by a return of those same resources once the final auction is triggered. Their return
would depress prices once the auction is triggered.
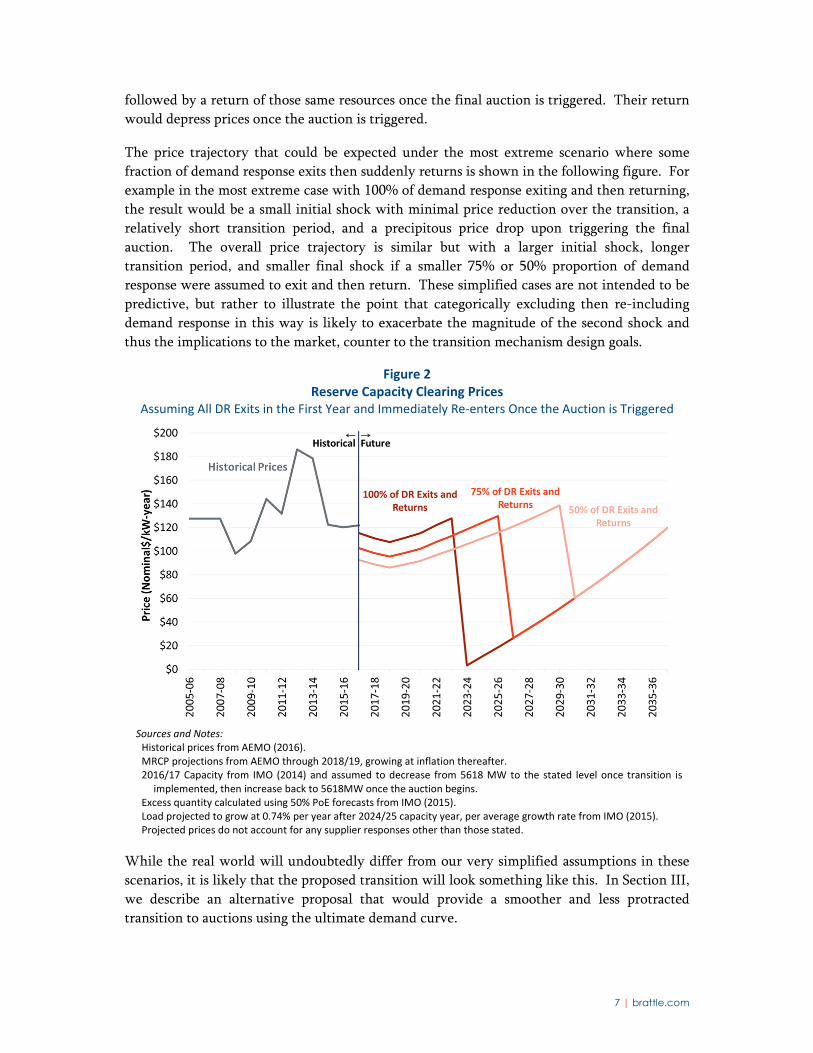
The price trajectory that could be expected under the most extreme scenario where some
fraction of demand response exits then suddenly returns is shown in the following figure. For
example in the most extreme case with 100% of demand response exiting and then returning,
the result would be a small initial shock with minimal price reduction over the transition, a
relatively short transition period, and a precipitous price drop upon triggering the final
auction. The overall price trajectory is similar but with a larger initial shock, longer
transition period, and smaller final shock if a smaller 75% or 50% proportion of demand
response were assumed to exit and then return. These simplified cases are not intended to be
predictive, but rather to illustrate the point that categorically excluding then re-including
demand response in this way is likely to exacerbate the magnitude of the second shock and
thus the implications to the market, counter to the transition mechanism design goals.
Figure 2 Reserve Capacity Clearing Prices
Assuming All DR Exits in the First Year and Immediately Re‐enters Once the Auction is Triggered
Sources and Notes: Historical prices from AEMO (2016). MRCP projections from AEMO through 2018/19, growing at inflation thereafter. 2016/17 Capacity from IMO (2014) and assumed to decrease from 5618 MW to the stated level once transition is
implemented, then increase back to 5618MW once the auction begins. Excess quantity calculated using 50% PoE forecasts from IMO (2015). Load projected to grow at 0.74% per year after 2024/25 capacity year, per average growth rate from IMO (2015). Projected prices do not account for any supplier responses other than those stated.
While the real world will undoubtedly differ from our very simplified assumptions in these
scenarios, it is likely that the proposed transition will look something like this. In Section III,
we describe an alternative proposal that would provide a smoother and less protracted
transition to auctions using the ultimate demand curve.

8 | brattle.com
C. THE PROPOSED OUTCOMES-BASED TRIGGER FOR IMPLEMENTING THE AUCTION FURTHER DISTORTS GENERATORS’ INCENTIVES
The PUO proposes to maintain the static transitional payment schedule until excess capacity
dwindles to 5–6%.12 This approach may initially seem to be a reasonable way to limit the
second price drop, but it would have the unintended effect of distorting generators’
incentives. Generators with large net portfolios would realize that retiring a resource today
would accelerate the implementation of an auction.13 All the remaining resources in its
portfolio would then receive a lower price, since the auction demand curve is so much lower
than the transition price curve (e.g., prices drop by 20% in the first example above, and even
more precipitously in the second more extreme case). This prospect would introduce large
incentives to portfolio owners to maintain existing generation capacity. Portfolio owners
may be willing to keep an uneconomic unit operating for many years, even if operating that
unit at a financial loss the entire time. By postponing that retirement, the portfolio supplier
would avoid triggering the auction and keep earning uneconomically high profits on its other
units. Very large portfolio owners could even decide to invest in new capacity if needed to
support excess capacity above 5–6% and maintain transition pricing.
This effect would compound the economic inefficiencies described above from resource
discrimination and a static transition payment function. The “transition” could theoretically
last indefinitely, with high prices being paid to support uneconomic investments in excess
capacity. Absent another re-design of the transition mechanism, the efficient auction
mechanism proposed as the final design could remain an elusive target that is never adopted.
III. Suggestions for a More Economically Efficient and Smoother Glide Path to Auctions
The PUO’s proposed transition mechanism is intended to balance two competing objectives of
reducing customer costs from RCM payments as quickly as possible, while mitigating the
magnitude of the price shock affecting suppliers. However, the proposal as it stands would
introduce economic inefficiencies and other concerns.
In this section, we describe an alternative proposed transition mechanism designed to meet
those same objectives while correcting some of the concerns we have identified. We propose
a transition mechanism that would treat all generation and demand response resources on a
level playing field, move to an auction format as quickly as is practical, and mitigate price
12 We assume a 6% trigger throughout our analyses, a 5% trigger would prolong the transition
period.
13 The incentive we describe applies to any entity that has a large net generation supply portfolio,
“net” meaning the net position of generation less any demand-side position serving loads. An
entity with fully balanced generation and load positions will have no incentive to inflate or
suppress capacity prices. An entity with more generation than load wishes capacity prices to be
higher; an entity with more load than generation wishes prices to be lower.

9 | brattle.com
shocks by steepening the demand curve over time according to a pre-determined schedule.
The result of our proposal would be to introduce an initial price shock that is similar to that
under the PUO proposal, gradually decrease prices as the demand curve becomes steeper, and
move to the final auction design over the course of a pre-specified number of years.
Compared to the PUO’s initial proposal, the alternative approach would limit the time of the
transition period, eliminate the second price shock, provide a more concrete timeline for
achieving the final design, and eliminate the inefficiencies associated with resource
discrimination.
A. ALTERNATIVE TRANSITION MECHANISM PROPOSAL
To address the concerns we have identified with the transition mechanism proposal, we
propose an alternative approach, along with a few variations designed to reduce the economic
distortions, maintain a level playing field between demand response and generation, and
provide a glide path for moving to the final design on a concrete timetable. The primary
elements of this approach would include:
A Level Playing Field for All Resource Types. To achieve the most economically
efficient resource retirement, retrofit, and reinvestment decisions, we propose to treat
all resources on a level playing field with the same capacity prices paid to all resource
types including demand response and generation.
Introducing Auctions as Soon as Possible. We propose moving to an auction format as
soon as is practically feasible, perhaps after one or two years. This would maximize
competition among different resource types, thus ensuring that the costliest resources
exit the market first and that the lowest-cost resources are retained. Early auction
introduction would allow for steeper demand curves to be implemented sooner.14
Earlier introduction of auctions will also provide an opportunity to refine the auction
structure while supply is plentiful and prices will presumably remain relatively lower.
Until auctions are implemented, the payment mechanism would work like the
current mechanism, but according a payment curve equivalent to the demand curves
described below.
Flat Initial Demand Curve Similar to the PUO Proposal. The initial demand curve
would be relatively flat to mitigate the size of the initial shock, for example it could
have the same shape as the final demand curve proposal, but with a right-stretched
14 Conducting an auction with a very flat demand curve would yield very similar results to an
administrative mechanism, however as the curve becomes steeper it becomes more important to
use an auction rather than administrative payments. This is because with a very steep demand
curve there is a greater uncertainty in what the auction-clearing or administrative payment price
will be as small changes in system quantity can cause larger changes in price. Thus, an
administrative payment system with a steep demand curve would introduce large risks for
suppliers that have to commit to selling capacity before they know the price. An auction solves
this problem by allowing sellers to specify their offer price, reflecting the minimum payment they
are willing to accept.

10 | brattle.com
zero crossing point to make it flatter and have an expected price shock similar to the
proposed transitional curve with a -5 slope.
Steepening Demand Curves over Time. The curve would then become steeper each
year according to a pre-determined schedule until it equals the final demand curve
after perhaps five or ten years. After the initial shock, this would result in gradually
lower prices over time to levels reflective of the final auction design. A shorter
transition period would allow for greater price reductions, lower customer costs, and
fewer incentives for uneconomic supply-side (re-)investments. But the shorter period
would come at the expense of a more rapid decline in supplier revenues and thus
financial harm to those generators compared to the status quo. Selecting an
appropriate transition period would need to balance these competing interests.
A Fixed Timetable for Achieving the Final Design. We propose that this transition to
the final demand curve would be pursued according to a fixed, pre-determined
schedule. A fixed timeline will eliminate the incentive for generators to maintain
excess capacity to delay the final auction. It would reduce regulatory uncertainties
and allow suppliers to offer their capacity based on more reliable long-term
expectations of future prices and market design.
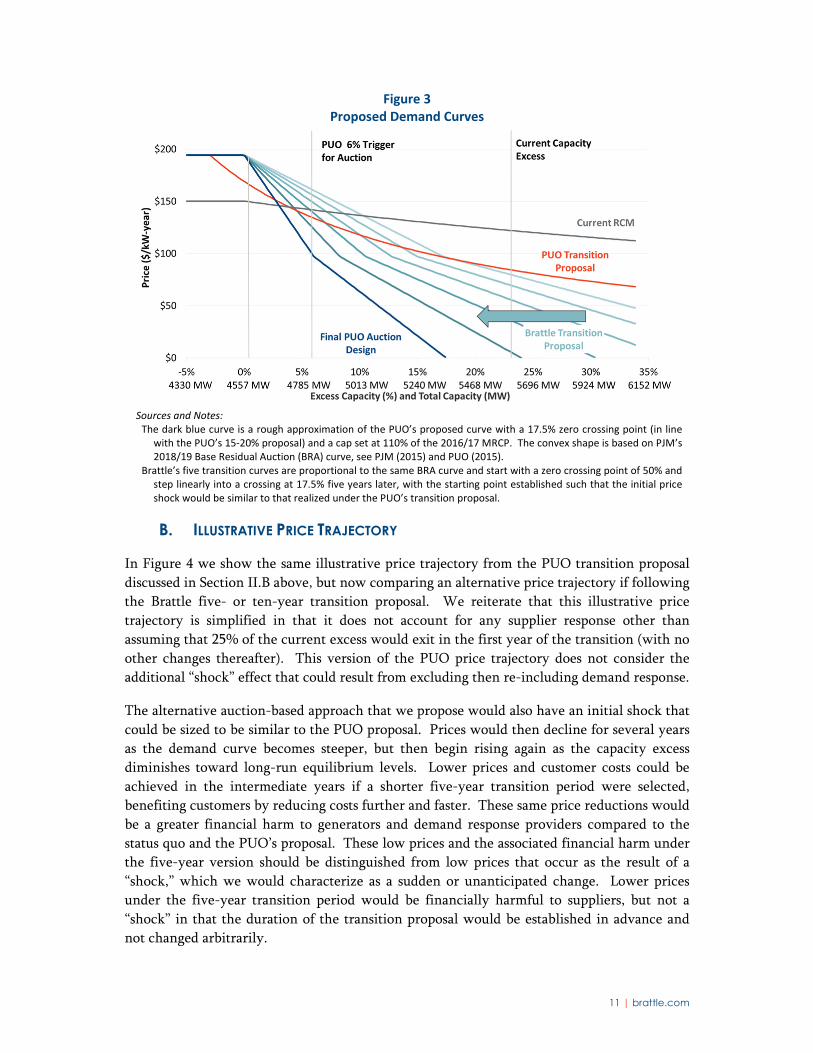
Figure 3 illustrates how this proposal could be implemented with progressively steeper
demand curves over a pre-specified five-year transition period until it equals the final PUO
demand curve proposal. While the exact form of the final demand curve is yet to be
specified, the interim demand curve proposal could adopt some reasonable approximation (as
we have done in this illustration), or could start with the proposed transition curve with a
slope of -5.
11 | brattle.com
Figure 3 Proposed Demand Curves
Sources and Notes: The dark blue curve is a rough approximation of the PUO’s proposed curve with a 17.5% zero crossing point (in line
with the PUO’s 15‐20% proposal) and a cap set at 110% of the 2016/17 MRCP. The convex shape is based on PJM’s 2018/19 Base Residual Auction (BRA) curve, see PJM (2015) and PUO (2015).
Brattle’s five transition curves are proportional to the same BRA curve and start with a zero crossing point of 50% and step linearly into a crossing at 17.5% five years later, with the starting point established such that the initial price shock would be similar to that realized under the PUO’s transition proposal.
B. ILLUSTRATIVE PRICE TRAJECTORY
In Figure 4 we show the same illustrative price trajectory from the PUO transition proposal
discussed in Section II.B above, but now comparing an alternative price trajectory if following
the Brattle five- or ten-year transition proposal. We reiterate that this illustrative price
trajectory is simplified in that it does not account for any supplier response other than
assuming that 25% of the current excess would exit in the first year of the transition (with no
other changes thereafter). This version of the PUO price trajectory does not consider the
additional “shock” effect that could result from excluding then re-including demand response.
The alternative auction-based approach that we propose would also have an initial shock that
could be sized to be similar to the PUO proposal. Prices would then decline for several years
as the demand curve becomes steeper, but then begin rising again as the capacity excess
diminishes toward long-run equilibrium levels. Lower prices and customer costs could be
achieved in the intermediate years if a shorter five-year transition period were selected,
benefiting customers by reducing costs further and faster. These same price reductions would
be a greater financial harm to generators and demand response providers compared to the
status quo and the PUO’s proposal. These low prices and the associated financial harm under
the five-year version should be distinguished from low prices that occur as the result of a
“shock,” which we would characterize as a sudden or unanticipated change. Lower prices
under the five-year transition period would be financially harmful to suppliers, but not a
“shock” in that the duration of the transition proposal would be established in advance and
not changed arbitrarily.

12 | brattle.com
On the other hand, a longer duration transition period could be selected, with a ten-year
transition resulting in relatively flat and more stable prices for the duration of the transition.
Selecting the transition period will necessarily require balancing the interests of customers
(who would benefit from lower prices under a shorter transition), versus suppliers (who
would benefit from higher prices under a longer transition).
In either case, this alternative transition proposal would reach the final auction design after a
pre-specified number of years, and would avoid the second price shock at auction
implementation that would occur under the PUO proposal.
Figure 4 Reserve Capacity Clearing Prices
Assuming 25% of the Current Excess Exits in the First Year and No Other Supply Changes Occur
Sources and Notes: Historical price data from AEMO (2016), 2016‐17 supply data are from IMO (2014). All price trajectories assume that 25% of the current excess exits the market in the first year of the transition, with no
other supply changes thereafter. Excess quantity calculated using 50% PoE forecasts from IMO (2015). Load projected to grow at 0.74% per year after 2024/25 capacity year, per average growth rate from IMO (2015).
C. COMPARISON OF TRANSITION PROPOSALS
We believe that our proposed mechanism will better meet the PUO’s stated design goals for
the transition mechanism, as summarized in Table 1. Our alternative proposal would be less
likely to encourage uneconomic (re-)investments in generation, result in lower customer
costs, and depending on the transition duration could be designed to achieve a greater level of
price stability over time. It levels the playing field in a way that will enable the most cost-
effective resources to supply capacity, thus ensuring that the highest-cost resources exit the
market first. Our proposal does not avoid the fundamental tradeoff between customer costs
and suppliers’ revenues however, but does allow for a reasonable balance to be made through
the selection of the transition period.

13 | brattle.com
Table 1 Comparison of Transition Proposals against the PUO’s Design Goals
Goal15 PUO's Initial Proposal Alternative Proposal
Reduce cost of excess capacity to consumers
Capacity prices would initially drop below current levels, but then begin increasing each year thereafter
Prices would remain substantially above economically efficient levels for a protracted period
Lower capacity prices throughout the transition and a shorter transition period
Prices could be substantially lower with a shorter transition period
Gradual price movement to minimise price shocks
Two sharp downward price shocks will bookend a period of price increases (the second shock could be mitigating by adjusting the trigger, but that would prolong the transition period)
Timing of second shock will not be pre‐determined
An initial price shock similar to the PUO transition, with steady or declining prices over time
Approximate changes to price can be anticipated by the market based on the pre‐determined schedule of steepening demand curves
Shorter transition period will have steeper yearly price declines (but still somewhat predictable if the schedule is pre‐determined)
Discouraging new entry
Medium‐high capacity prices may attract more investment, including through uprates and possibly even new generation (though less likely)
Lower prices would be less likely to attract incremental investment compared to the PUO proposal
But a longer transition proposal would still maintain moderate prices at which uprates could still be inefficiently incentivized
Encouraging mothball/retirement of inefficient capacity
Medium‐high prices may encourage reinvestment in aging units rather than retirement or mothballing
Trigger proposal may further encourage reinvestment in uneconomic resources in order to postpone the shift to auction
Level playing field among resources incents the most competitive resources to stay and the most costly to leave
Lower prices would be less likely to incentivize uneconomic re‐investments (particularly with shorter transition periods)
15 See PUO (2015), p. 45.

14 | brattle.com
List of Acronyms
AEMO Australian Energy Market Operator
BRA Base Residual Auction
DR Demand Response
IMO Independent Market Operator
kW kilowatt
MRCP Maximum Reserve Capacity Price
MW Megawatt
PJM PJM Interconnection
PoE Probability of Exceedance
PUO Public Utilities Office
RCM Reserve Capacity Mechanism

15 | brattle.com
Bibliography
Australian Energy Market Operator (2016). Maximum Reserve Capacity Price. Retrieved
from http://wa.aemo.com.au/home/electricity/reserve-capacity/maximum-reserve-
capacity-price
Independent Market Operator (2013). Reserve Capacity Mechanism Working Group Agenda, 28 February 2013. Retrieved from http://wa.aemo.com.au/docs/default-
source/Governance/Market-Advisory-Committee/MAC-Working-
Groups/combined_rcmwg_mtg_10_papers.pdf?sfvrsn=2
Independent Market Operator (2014). Summary of Certified Reserve Capacity for the 2014 Reserve Capacity Cycle. Retrieved from http://wa.aemo.com.au/docs/default-
source/Reserve-Capacity/certification-of-reserve-capacity/certified-reserve-capacity--
-2014-cycle.pdf?sfvrsn=0
Independent Market Operator (2015). Electricity Statement of Opportunities, 17 June
2015. Retrieved from http://wa.aemo.com.au/docs/default-source/Reserve-
Capacity/2014-esoo-data-registerC6180784BD69.xlsx?sfvrsn=0
Pfeifenberger, Johannes, Samuel Newell, Kathleen Spees, Atilla Hajos, and Kamen
Madjarov (2011). Second Performance Assessment of PJM’s Reliability Pricing Model, 26 August 2011.
PJM Interconnection(2015). 2018-2019 Base Residual Auction Results. Retrieved from
http://www.pjm.com/~/media/markets-ops/rpm/rpm-auction-info/2018-2019-base-
residual-auction-results-xls.ashx
Public Utilities Office (2015). Position Paper on Reforms to the Reserve Capacity Mechanism, 3 December 2015. Retrieved from
https://www.finance.wa.gov.au/cms/uploadedFiles/Public_Utilities_Office/Electricity_
Market_Review/Position-Paper-on-Reforms-to-the-Reserve-Capacity-Mechanism.pdf