a point-infiltration model for estimating runoff from ... · pdf filea point-infiltration...
TRANSCRIPT
A Point-Infiltration Model for Estimating Runoff from Rainfall on Small Basins in Semiarid Areas of Wyoming
United States Geological SurveyWater-Supply Paper 2366
Prepared in cooperation with the U.S. Bureau of Land Management

AVAILABILITY OF BOOKS AND MAPS OF THE U.S. GEOLOGICAL SURVEY
Instructions on ordering publications of the U.S. Geological Survey, along with prices of the last offerings, are given in the current-year issues of the monthly catalog "New Publications of the U.S. Geological Survey." Prices of available U.S. Geological Survey publications released prior to the current year are listed in the most recent annual "Price and Availability List." Publications that are listed in various U.S. Geological Survey catalogs (see back inside cover) but not listed in the most recent annual "Price and Availability List" are no longer available.
Prices of reports released to the open files are given in the listing "U.S. Geological Survey Open-File Reports," updated monthly, which is for sale in microfiche from the U.S. Geological Survey, Books and Open-File Reports Section, Federal Center, Box 25425, Denver, CO 80225. Reports released through the NTIS may be obtained by writing to the National Technical Information Service, U.S. Department of Commerce, Springfield, VA 22161; please include NTIS report number with inquiry.
Order U.S. Geological Survey publications by mail or over the counter from the offices given below.
BY MAIL
Books
Professional Papers, Bulletins, Water-Supply Papers, Tech niques of Water-Resources Investigations, Circulars, publications of general interest (such as leaflets, pamphlets, booklets), single copies of Earthquakes & Volcanoes, Preliminary Determination of Epicenters, and some miscellaneous reports, including some of the foregoing series that have gone out of print at the Superintendent of Documents, are obtainable by mail from
U.S. Geological Survey, Books and Open-File ReportsFederal Center, Box 25425
Denver, CO 80225
Subscriptions to periodicals (Earthquakes & Volcanoes and Preliminary Determination of Epicenters) can be obtained ONLY from the
Superintendent of DocumentsGovernment Printing Office
Washington, D.C. 20402
(Check or money order must be payable to Superintendent of Documents.)
OVER THE COUNTER
Books
Books of the U.S. Geological Survey are available over the counter at the following U.S. Geological Survey Public Inquiries Offices, all of which are authorized agents of the Superintendent of Documents:
WASHINGTON, D.C. Main Interior Bldg., 2600 corridor, 18th and CSts.,NW.
DENVER, Colorado-Federal Bldg., Rm. 169, 1961 Stout St. LOS ANGELES, California-Federal Bldg., Rm. 7638,300 N.
Los Angeles St. MENLO PARK, California Bldg. 3 (Stop 533), Rm. 3128, 345
Middlefield Rd. RESTON, Virginia-503 National Center, Rm. 1C402, 12201
Sunrise Valley Dr. SALT LAKE CITY, Utah-Federal Bldg., Rm. 8105, 125 South
State St. SAN FRANCISCO, California-Customhouse, Rm. 504, 555
Battery St. SPOKANE, Washington-U.S. Courthouse, Rm. 678, West 920
Riverside Ave. ANCHORAGE, Alaska-Rm. 101, 4230 UniversityDr. ANCHORAGE, Alaska Federal Bldg, Rm. E-146, 701 C St.
Maps
For maps, address mail orders to
U.S. Geological Survey, Map DistributionFederal Center, Box 25286
Denver, CO 80225
Residents of Alaska may order maps from
Alaska Distribution Section, U.S. Geological SurveyNew Federal Building - Box 12
101 Twelfth Ave., Fairbanks, AK 99701
Maps
Maps may be purchased over the counter at the U.S. Geological Survey offices where books are sold (all addresses in above list) and at the following U.S. Geological Survey offices:
ROLLA, Missouri 1400 Independence Rd. DENVER, Colorado Map Distribution, Bldg. 810, Federal
Center FAIRBANKS, Alaska New Federal Bldg., 101 Twelfth Ave.
A Point-Infiltration Model for Estimating Runoff from Rainfall on Small Basins in Semiarid Areas of Wyoming
By J.G. RANKL
Prepared in cooperation with the U.S. Bureau of Land Management
U.S. GEOLOGICAL SURVEY WATER-SUPPLY PAPER 2366

DEPARTMENT OF THE INTERIOR
MANUEL LUJAN, Jr., Secretary
U.S. GEOLOGICAL SURVEY
Dallas L. Peck, Director
Any use of trade, product, or firm names in this publication is for descriptive purposes only and does not imply endorsement by the U.S. Government
UNITED STATES GOVERNMENT PRINTING OFFICE : 1990
For sale by the Books and Open-File Reports Section, U.S. Geological Survey, Federal Center, Box 25425, Denver, CO 80225
Library of Congress Cataloging in Publication Data
Rankl, james G.A point-infiltration model for estimating runoff from rainfall on small basins
in semiarid areas of Wyoming
p. cm. (U.S. Geological Survey water-supply paper ; 2366)"Prepared in cooperation with the U.S. Bureau of Land Management."Includes bibliographical references.Supt. of Docs, no.: I 19.3:23661. Runoff Wyoming. I. United States. Bureau of Land Management.
tl. Title. III. Series. GB991.W8R35 1990551.48'8'09787-dc20 89-600229
CIP

CONTENTS
Abstract 1 Introduction 1
Purpose and Scope 2Acknowledgments 2Study Basins 2
Incipient-Runoff Curves 3Empirical Incipient-Runoff Curve 3Physically Based Incipient-Runoff Curve 4
Incipient-Ponding Curve 4 Surface-Retention Storage Curve 4
Point-Infiltration Model 5Infiltration Equation 5Computation of Runoff from Single-Soil Basins 7Test of Parameter Sensitivity 8Test of Nonuniform Rainfall Intensities 9
Computation of Runoff from Multiple-Soil Basins 10Ranking of Soil Permeability 10Optimization of Incipient-Runoff Curves 11
Split-Sample Test 13 Interbasin Transfer of Soil Parameters 14
Data Analysis 14 Application of Model 18
Flowchart 19Example Basin 19Limitations 22
Rainfall-Simulator Infiltrometer Tests 22Selection and Location of Sites 22Description of Equipment 23Infiltrometer Tests and Corrections 23Comparison of Measured and Computed Infiltration Data 24
Summary 26 References 28 Metric Conversion Factors 29
FIGURES
1. Map showing location of streamflow-gaging stations and example basinin Wyoming 3
2-8. Graphs showing:2. Relation of average rainfall intensity and storm length, and incipient-
runoff curve for Dugout Creek tributary near Midwest (basin 5) 43. Incipient-ponding curve, surface-retention storage curve, and the
composite incipient-runoff curve 54. Relation between time and infiltration rate for both the ponded and
flux-controlled forms of the Green-Ampt equation 65. Comparison of incipient-runoff curves for three small basins contain
ing soils derived from the Cody Shale near Midwest 76. Incipient-runoff curves for changes in hydraulic conductivity for
Dugout Creek tributary near Midwest (basin 5) 9
Contents III

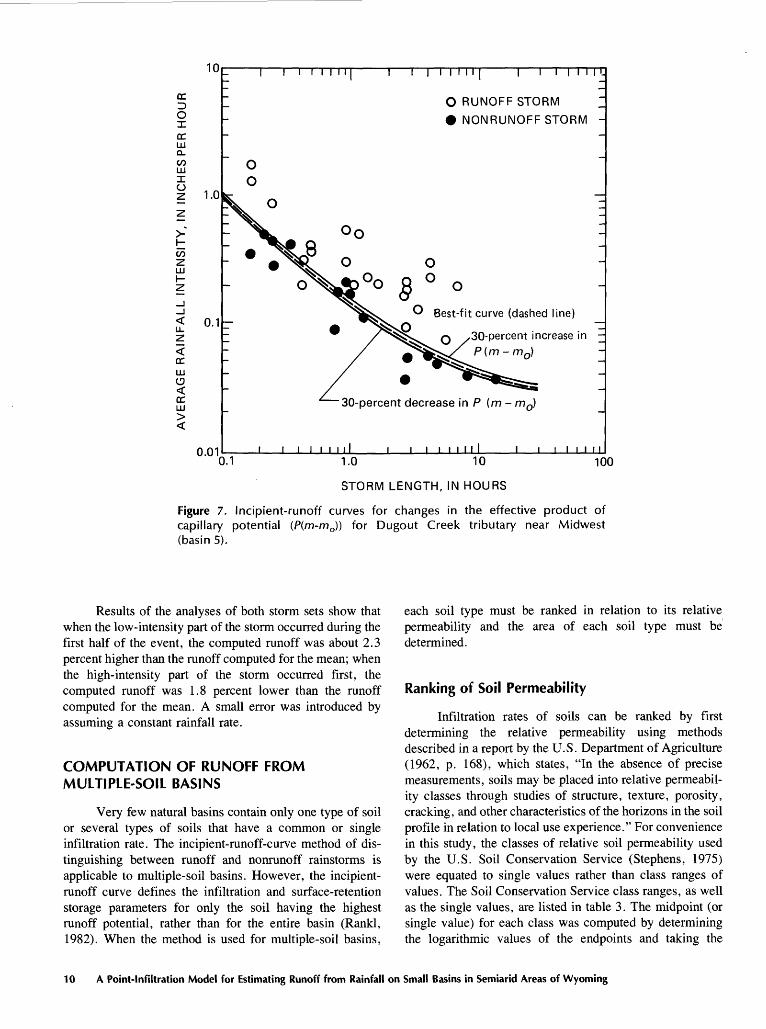
7. Incipient-runoff curves for changes in the effective product of capil lary potential for Dugout Creek tributary near Midwest (basin 5) 10
8. Incipient-runoff curves for changes in surface-retention storage forDugout Creek tributary near Midwest (basin 5) 11
9. Schematic model of subbasin infiltration rates 12 10-18. Graphs showing:
10. Common incipient-runoff curve for North Prong East Fork No water Creek near Worland (basin 1) and North Prong East Fork Nowater Creek tributary near Worland (basin 2) 12
11. Comparison of simulated runoff and measured runoff for North Prong East Fork Nowater Creek tributary near Worland (basin 2) 14
12. Split-sample test for North Prong East Fork Nowater Creek tributary near Worland (basin 2), control sample 1 14
13. Split-sample test for North Prong East Fork Nowater Creek tributary near Worland (basin 2), control sample 2 14
14. Comparison of simulated runoff and measured runoff for NorthProng East Fork Nowater Creek near Worland (basin 1), using fitted infiltration parameters from North Prong East Fork Nowater Creek tributary near Worland (basin 2) 15
15. Incipient-runoff curves for North Prong East Fork Nowater Creek near Worland, North Prong East Fork Nowater Creek tributary near Worland, Medicine Bow River tributary near Hanna, and Hanna Draw tributary near Hanna, and average curve for soils having a relative permeability of 0.06 19
16. Incipient-runoff curves for North Prong East Fork Nowater Creek near Worland, North Prong East Fork Nowater Creek tributary near Worland, Medicine Bow River tributary near Hanna, Hanna Draw tributary near Hanna, Frank Draw tributary near Orpha, and Sage Creek tributary near Orpha, and average curve for soils having a relative permeability of 0.11 22
17. Incipient-runoff curves for North Prong East Fork Nowater Creek near Worland, North Prong East Fork Nowater Creek tributary near Worland, Medicine Bow River tributary near Hanna, Hanna Draw tributary near Hanna, and Frank Draw tributary near Orpha, and average curve for soils having a relative permeability of 0.35 23
18. Incipient-runoff curves for Medicine Bow River tributary near Hanna, Hanna Draw tributary near Hanna, Frank Draw tributary near Orpha, and Sage Creek tributary near Orpha, and average curve for soils having a relative permeability of 1.10 24
19. Map showing location of infiltrometer-test sites in Dugout Creek tributary near Midwest (basin 5) 25
20. Sketch of total wetted volume and volume of infiltrometer tests for cylinders and cones 26
21. Graph showing comparison of infiltrometer data and computed infiltration data for Dugout Creek tributary near Midwest (basin 5) 27
TABLES
1. Rainfall data, measured runoff data, and simulated runoff data for single-soil basins 8
2. Soil parameters, fitting statistics, and average values for three small basins having single-soil cover 9
3. Class values of relative soil permeability 114. Soil types and groupings for North Prong East Fork Nowater Creek tributary near
Worland (basin 2) 13
IV Contents

5. Soil types and groupings for North Prong East Fork Nowater Creek near Worland (basin 1) 13
6. Soil groups, infiltration parameters, and percent area of soil groups for North Prong East Fork Nowater Creek tributary near Worland (basin 2) 13
7. Rainfall data, measured runoff data, and simulated runoff data for North Prong East Fork Nowater Creek tributary near Worland (basin 2) 13
8. Soil types, texture, relative permeability, and percent area for multiple-soil basins 15
9. Rainfall data, measured runoff data, and simulated runoff data for multiple-soil basins 17
10. Relative permeabilities, infiltration parameters, and fitting errors for multiple-soil basins 18
11. Average infiltration parameter values for soils classified by relative permeability 18
12. Infiltrometer data for soil in Dugout Creek tributary near Midwest (basin 5) 27
SYMBOLS
aCL
dEVAR
fc
H
IRCKhm
m0n
PP(m-m0)
R s
SEE t
pt*
y y
M
Constant for a soil type, in inches Confidence limitsSurface-retention storage, in inches Estimated error of variance Minimum infiltration rate, in inches per hour Depth of ponded water, in inchesAccumulated infiltration in the soil column, in inches per hour Water uptake at incipient ponding, in inches per hour Rate of infiltration, in inches per hour Incipient-runoff curveHydraulic conductivity at moisture content m, in inches per hour Moisture content of the soil near saturation Initial moisture content of the soilExponent parameter in empirical infiltration equation; a counter else whereCapillary potential at the wetting front Effective product of capillary potential and moisture deficit Supply rate or storm intensity, in inches per hour Standard deviation Standard error of estimate Time, in hoursTime to satisfy retention storage, in hours Time of equivalent duration to satisfy retention storage, in hours Time to incipient ponding for a given intensity, in hours Time required to yield an equivalent infiltration for the ponded Green- Ampt equation, in hours Duration of rainfall, in hoursTime of equivalent duration of infiltration for the ponded Green-Ampt equation, in hours Measured runoff value Mean of measured runoff values Simulated runoff value Incremental infiltration during period,
Contents

A Point-Infiltration Model for Estimating Runoff from Rainfall on Small Basins in Semiarid Areas of WyomingBy J.G. Rankl
Abstract
A physically based point-infiltration model was developed for computing infiltration of rainfall into soils and the resulting runoff from small basins in Wyoming. The user describes a "design storm" in terms of average rainfall intensity and storm duration. Information required to compute runoff for the design storm by using the model include (1) soil type and description, and (2) two infiltration parameters and a surface-retention storage parameter. Parameter values are tabulated in the report.
Rainfall and runoff data for three ephemeral-stream basins that contain only one type of soil were used to develop the model. Two assumptions were necessary: antecedent soil moisture is some long-term average, and storm rainfall is uniform in both time and space. The infiltration and surface-retention storage parameters were determined for the soil of each basin. Observed rainstorm and runoff data were used to develop a separation curve, or incipient-runoff curve, which distinguishes between runoff and nonrunoff rainfall data. The position of this curve defines the infiltration and surface-retention storage parameters.
A procedure for applying the model to basins that contain more than one type of soil was developed using data from 7 of the 10 study basins. For these multiple-soil basins, the incipient-runoff curve defines the infiltration and retention-storage parameters for the soil having the highest runoff potential. Parameters were defined by ranking the soils according to their relative permeabilities and optimizing the position of the incipient-runoff curve by using measured runoff as a control for the fit.
Analyses of runoff from multiple-soil basins indicate that the effective contributing area of runoff is less than the drainage area of the basin. In this study, the effective drainage area ranged from 41.6 to 71.1 percent of the total drainage area. Information on effective drainage area is useful in evaluating drainage area as an independent variable in statistical analyses of hydrologic data, such as annual peak frequency distributions and sediment yield.
Manuscript approved for publication June 1, 1989.
A comparison was made of the sum of the simulated runoff and the sum of the measured runoff for all available records of runoff-producing storms in the 10 study basins. The sums of the simulated runoff ranged from 12.0 per cent less than to 23.4 percent more than the sums of the measured runoff. A measure of the standard error of estimate was computed for each data set. These values ranged from 20 to 70 percent of the mean value of the measured runoff.
Rainfall-simulator infiltrometer tests were made in two small basins. The amount of water uptake measured by the test in Dugout Creek tributary basin averaged about three times greater than the amount of water uptake computed from rainfall and runoff data. Therefore, infil trometer data were not used to determine infiltration rates for this study.
INTRODUCTION
The usual method of estimating runoff in ungaged streams is to apply regression equations previously devel oped from data from gaged streams. The equations relate runoff characteristics for a specified frequency (or proba bility) of occurrence to physical characteristics of the drainage basins. For small, ephemeral-stream basins in Wyoming, the equations for estimating the volume of runoff for a specified frequency were developed by Craig and Rankl (1978). The regression method, however, is independent of the magnitude, intensity, duration, and frequency of the precipitation that produces the runoff.
Rules and regulations of the Surface Mining Control and Reclamation Act of 1977 require that drainage and water-impoundment structures at surface mines be designed for runoff estimated on the basis of precipitation-frequency criteria. Because extensive surface mining of coal is taking place in Wyoming, there is need for a method of making such estimates. The question to be answered is, How much runoff from a given basin will occur as the result of a specified storm, such as a 100-year, 6-hour rainfall? If sufficient information is available, runoff can be computed
Introduction 1

by subtracting rainfall losses due to interception, retention storage, and infiltration from total rainfall. Although rainfall-frequency data are available from the National Weather Service, data on interception, retention storage, and infiltration rates are almost nonexistent. Soil-index data are available, but the soil-index method of estimating runoff does not take rainfall intensity into account.
During 1980-82 the U.S. Geological Survey (USGS), in cooperation with the U.S. Bureau of Land Management, conducted a study to develop a method of estimating runoff volumes from specified precipitation on small drainage basins. The study was an extension of work by Rankl (1982) to develop an empirical method of making such estimates. The empirical method was based on a power decay type of equation, called a separation curve, which differentiates between runoff-producing rainstorms and nonrunoff rainstorms. For this study, it was reasoned that the infiltration parameters, which control water uptake, also define the separation curve; therefore, the separation curve defines the infiltration parameters.
The objectives of the study were to1. Investigate the use of a separation curve that is based on
a physically based infiltration equation.2. Develop a method for estimating runoff that is based on
precipitation.3. Define infiltration parameters for as many soils and
basins as possible.4. Evaluate the use of data from infiltrometer tests to define
infiltration parameters for soils.
Purpose and Scope
The purpose of this report is to describe the point- infiltration model for estimating runoff the principles and theory applied, the development and testing of the model, the applications of the model and the data required, and the limitations of the model. Also described and evaluated are the results of field tests with an infiltrometer.
Rainfall and runoff data used in this study were collected by the USGS (Craig and Rankl, 1978) from 1965 to 1973 at streamflow stations on small, ephemeral streams having drainage areas of less than 11.0 square miles (mi2). Average storm intensity and storm length were computed for each storm selected, and the storm was identified as one that produced runoff or one that did not. The volume of runoff for each event was used to verify the method proposed in this report and to determine infiltration param eters in basins having multiple soils.
Soil maps for each basin were used to determine the area of each soil type. In addition, a description of the soils was used to rank the soils on the basis of relative perme ability. Because it is important that the mapping units be consistent, soil maps and descriptions used in this study
were obtained from the U.S. Department of Agriculture, Soil Conservation Service.
Acknowledgments
The data used were collected during a previous study by personnel of the the USGS in cooperation with the Wyoming State Highway Department and the Federal Highway Administration (Craig and Rankl, 1978).
The author is indebted to many individuals for assist ance throughout the course of this project. A special acknowledgment is made to Robert W. Lichty, USGS, for his time and effort spent on discussion and assistance in developing the equations used in this study.
Study Basins
Rainfall and runoff data from 10 small basins drained by ephemeral streams were analyzed for this study. Basin sizes ranged from 0.81 to 3.77 mi2 . Although hydrologic data were available for 12 additional stations, soil maps and descriptions were not. Three of the 10 study basins are underlain by the Cody Shale of Cretaceous age and are assumed to have spatially uniform soil types and infiltration characteristics. The other seven basins have multiple soils and are underlain by the Wasatch Formation and Willwood Formation of Eocene age, or by the Hanna Formation of Paleocene age. The rolling upland areas and areas along the main channels generally are covered with native grasses and sagebrush. The sparsely vegetated middle parts of the basins are dissected by head-cutting streams, resulting in exposed bedrock and deep gullies.
Basin numbers and station names are listed in the following table, and locations are shown in figure 1. Stations mentioned in this report have been assigned per manent USGS numbers. Each eight-digit number consists
Basin number
1
2
34
56
789
1011
Basin name
North Prong East Fork Nowater Creeknear Worland
North Prong East Fork Nowater Creektributary near Worland
Dead Horse Creek tributary near MidwestDead Horse Creek tributary No. 2 nearMidwest
Dugout Creek tributary near MidwestHeadgate Draw at upper station near
BuffaloMedicine Bow River tributary near HannaHanna Draw tributary near HannaFrank Draw tributary near OrphaSage Creek tributary near OrphaDemott Draw (example basin)
Station number
06267260
06267270
0631291006312920
0631318006316480
06634910066349500664872006648780
2 A Point-Infiltration Model for Estimating Runoff from Rainfall on Small Basins in Semiarid Areas of Wyoming

44
- 4 --.i~-~.--4
SUBLETTE I
"4-- -- -. 4Jj_ . _ __£ £ Reservoir ,__ __
20 40 60 80 100 MILES _i____i____i____i____i
0 20 40 60 80 100 KILOMETERS
EXPLANATION
8̂ STREAM FLOW-GAG ING STATION AND BASIN NUMBER
11A EXAMPLE BASIN AND NUMBER
Figure 1. Location of streamflow-gaging stations and example basin in Wyoming.
of two parts: The first two digits, 06, indicate that the station is in the Missouri River drainage basin; the remain ing six digits are the station number. The station numbers increase in a downstream direction.
INCIPIENT-RUNOFF CURVES
Empirical Incipient-Runoff Curve
The empirical incipient-runoff curve was developed using a combination of graphical and mathematical proce
dures. Average intensities of rainstorms that produced runoff and those that did not produce runoff were plotted against storm duration on graph paper having logarithmic scales. A power decay type of equation with a constant (Rankl, 1982) was mathematically fitted between the two types of events by trial and error:
Ip =a (1)
where/p =rate of infiltration when rainfall flux equals in
filtration rate, in inches per hour;
Incipient-Runoff Curves

10
1.0
0.1
O RUNOFF STORM NONRUNOFFSTORM
V
0.1 1.0 10
STORM LENGTH, IN HOURS
100
Figure 2. Relation of average rainfall intensity and storm length, and incipient-runoff curve for Dugout Creek trib utary near Midwest (basin 5).
a= constant for a soil type, in inches; ?=time, in hours;
n = exponent parameter; and /c =minimum infiltration rate, in inches per hour.
Different combinations of values for the parameters were used. The best fit was determined visually. The data points and the empirical incipient-runoff curve for Dugout Creek tributary are shown in figure 2.
The incipient-runoff curve (IRC) reflects losses due to infiltration, interception, surface retention, and channel storage. R.W. Lichty (USGS, written commun., 1980) suggested that the empirical incipient-runoff curve can be represented by a physically based incipient-runoff curve that is a composite of an incipient-ponding curve and a surface-retention storage curve.
Physically Based Incipient-Runoff Curve
Incipient-Ponding Curve
Given a constant rainfall rate, incipient ponding can be defined as the state at which the rainfall rate is equal to the infiltration rate and free water begins to form at the soil surface. The following infiltration equation, developed by Green and Ampt (1911) and modified by Philip (1954) and Dawdy and others (1972), was used to compute the incipient-ponding component of the incipient-runoff curve:
(2)Ul "|_ I J
wheredi/dt= infiltration rate;
Kh = hydraulic conductivity at moisture contentm;
(P+H)(m-m 0)= effective product of the capillary potential,head, and moisture deficit;
P= capillary potential at the wetting front; H= depth of ponded water; m= relative moisture content of the soil near
saturation; m 0 = initial relative moisture content of the soil;
and/' = accumulated infiltration in the soil col
umn.
This formulation, known as the Green-Ampt equa tion, was derived to describe the relation between infiltra tion rate and cumulative infiltration when the rate of water uptake is not limited by the supply of water. However, in this study it was assumed that the equation will describe soil water dynamics for both flux-controlled and ponded infil tration processes. In addition, it was assumed that an average antecedent-moisture condition exists (initially dry), and also that for a given soil the effective product of the capillary potential, the head, and the moisture deficit, (P+H)(m m 0), is a constant value. At the time of incipient ponding, tp , the infiltration rate, di/dt, equals the supply rate, R, and the depth of water, H, is 0.00. Accumulated infiltration in the soil column, i, at the time of incipient ponding equals tpR. Equation 2 is redefined using the above assumptions. Thus, equation 2 becomes
(3)
time to incipient ponding is computed by solving for tp equation 3,
n
and water uptake at incipient ponding is defined as
-P(m-m0)-_ _ \r(m m0)~\ ip =Rtp =Kh [ R_^ J.
(4)
(5)
A graphical representation of the incipient-ponding compo nent of the incipient-runoff, or separation curve is shown in figure 3.
Surface-Retention Storage Curve
Surface-retention storage, d, is the amount of water that is intercepted and temporarily stored in depressions and
4 A Point-Infiltration Model for Estimating Runoff from Rainfall on Small Basins in Semiarid Areas of Wyoming

10
I 1.0
0.1
0.01
Surface-retention storage curve
ncipient-runoff curve
0.1 1.0 10
STORM LENGTH, IN HOURS
100
Figure 3. Incipient-ponding curve, surface-retention stor age curve, and the composite incipient-runoff curve.
channels and on vegetation. This water remains in storage until it can infiltrate or evaporate.
Values for depression storage have been found to range from 0. 10 inch (in) for clay soils to 0.20 in for sandy soils (Overton and Meadows, 1976, p. 21). As slope decreases, values for depression storage increase. Larger values for depression storage can be expected on flat, sandy, upland areas of natural basins. Values for channel storage were not available, but some stored water can be expected. In a semiarid climate, such as that of the study area, interception of water by vegetation is minimal.
The time required to satisfy surface retention, td , can be determined in two steps using the integrated form of equation 2, when the head is 0.0. The relation between time and accumulated infiltration is given as
First, the water uptake at incipient ponding, ip , is used to solve for the time period, t*, which is the time required to yield an equivalent infiltration under ponded conditions that is, infiltration not limited by supply rate:
(7)
The relation between t* and tp is shown graphically in figure 4; both the flux-controlled and ponded forms of the Green- Ampt equation are depicted.
Next, an equation relating the pertinent variables is formulated to express surface-retention storage as a function of rainfall intensity:
d=R(t%-t*)-ki, (8)
where(t$ t*) =time period required to generate a rainfall excess
equivalent to surface-retention storage; andAz = incremental infiltration during the period
(?* ?*), where f$=time of equivalent dura tion to satisfy retention storage.
Surface-retention storage, d, is shown as the cross- hatched area in figure 4, and water uptake by soil infiltra tion, i, is shown as the patterned area. Equation 2 is solved iteratively with short time steps to determine the infiltration, A/, between incipient ponding and the beginning of runoff. The ratio between m and m0 for initially dry soil was, for this study, assumed to be 1.0. The change in (P+H}(m-m0) from head equal to 0.00 to head equal to retention storage was determined by fitting equations 2 and 8 to the runoff and nonrunoff data shown in figure 2. The difference between the values for the effective product of capillary potential, head, and moisture deficit at incipient ponding and at the point of runoff was the retention-storage value, d. In the final fit of the incipient-runoff curve, the value was varied linearly between the value determined at incipient ponding and the value determined at incipient runoff.
To determine the infiltration and retention-storage parameters for each basin, the procedure described above was repeated. Different combinations of parameter values were used to locate the incipient-runoff curve between the runoff and nonrunoff rainstorms. The best fit curve was determined visually for each basin.
POINT-INFILTRATION MODEL
Infiltration Equation
Water uptake by the soil for a rainfall event is computed as follows. First, the time to incipient ponding for a given rainfall intensity is computed using equation 4,
[P(m-m0)] TP ** R(R-Kh) '
and the uptake at incipient ponding, ip , is given as Rtp . Then from equation 7, the time required to yield an equivalent infiltration under ponded conditions is computed as
Point-Infiltration Model

0.4
§ 0.3
OI ocUJ Q_CO LLII O
<cc
ccI-
0.2
0.1
I I I I I T I T
Ponded infiltration rate via Green-Ampt equation =
f [Kh , P(m-m0)] and t]
,Flux-controlled infiltration via Green-Ampt equation =
f [Kh , P(m- m0), R, and t]
, * " 7
Water uptake by soil 4 V4 v 7
Rainfall rate
Surface-retention storage
TIME, IN HOURS
Figure 4. Relation between time and infiltration rate for both the ponded and flux-controlled forms of the Green-Ampt equation.
The duration of rainfall, tr , and the variables tp and r* are related to give an equivalent duration of infiltration, t*, for the ponded Green-Ampt equation:
t*=t t +t*l r l r lp p ' (9)
Next, infiltration is computed for the period (t$ t*) to satisfy surface-retention storage, d. Then equation 2 is used to compute infiltration for the period f| to t*:
or 1+ (P+H)(m-m0)
The starting value for i for the initial time step is Finally, runoff is computed by a water-balance equation:
Runoff = Rainfall Infiltration Surface retention. (10)
An estimate of the error variance, EVAR, is computed by dividing the sum of the squares of the deviations by the number of events, minus 2 degrees of freedom,
(11)
6 A Point-Infiltration Model for Estimating Runoff from Rainfall on Small Basins in Semiarid Areas of Wyoming

10
DC
sDC LU
w£ 1-0Q £!
0.1
DC
0.01
,Dead Horse Creek tributary
Dead Horse Creek tributary No. 2
Average curve (dashed line)
0.1 1.0 10
STORM LENGTH, IN HOURS
100
Figure 5. Comparison of incipient-runoff curves for three small basins containing soils derived from the Cody Shale near Midwest.
wheren= number of events;y{ = measured runoff value; and)>,.=simulated runoff value.
A measure of the standard error of estimate, SEE, was calculated by computing the square root of the estimated error of variance and expressing this as a percentage of the mean of measured runoff:
(12)
where y is the mean of the measured runoff values.
Computation of Runoff from Single-Soil Basins
Three small basins, Dugout Creek tributary, Dead Horse Creek tributary, and Dead Horse Creek tributary No. 2, were used to evaluate the point-infiltration model. These basins are located in northern Natrona County, Wyo., in an area underlain by the Cody Shale. The basins have not been mapped for soil types, but soil maps and descriptions (Stephens, 1975) were available for soils derived from the
Cody Shale a few miles to the north, in southern Johnson County, Wyo. Soils mapped in areas underlain by the Cody Shale or mapped as badlands consist of tight silty clays and clay loams. It was assumed that soils derived from the Cody Shale have one common low retention-storage value and infiltration rate for each basin. Retention-storage and infil tration parameters determined by the position of the incipient-runoff curve were used to compute runoff. Rain fall data, measured runoff, and simulated runoff for the three basins are listed in table 1. Average parameter values for the three basins, and statistics computed from equation 12 comparing measured and simulated runoff, are presented in table 2. Figure 5 is a graphical presentation of the three incipient-runoff curves and the average curve.
The relatively large values of the standard error of estimate for the three small basins can be explained in part by the difference in antecedent-moisture conditions for various runoff events. Because evaporation and evapotran- spiration rates are large and drying is rapid, an average antecedent-moisture condition (initially dry) was assumed in order to permit computation of runoff for a design storm when the antecedent conditions are unknown.
Point-Infiltration Model

Table 1. Rainfall data, measured runoff data, and simu lated runoff data for single-soil basins
Table 1. Rainfall data, measured runoff data, and simu lated runoff data for single-soil basins Continued
DateRainfall(inches)
Length of storm (hours)
Intensity Measured (inches runoff
per hour) (inches)
Simulated runoff
(inches)
Dugout Creek tributary near Midwest, Wyoming (basin 5)
05/23/6506/24/6507/01/6509/01/6606/09/6706/13/6706/14/6706/15/6709/18/6709/26/6706/05/6806/06/6809/03/6806/19/6905/22/7005/24/7005/30/7006/17/7206/18/7206/19/7206/30/7208/02/7208/24/7209/11/72
0.49.91.30.50.30.26.29
1.36.46.09.22.37.41.22
1.25.59.20.22.29.57.18.34
1.54.14
0.924.08
.172.751.332.67
.926.752.76
.421.085.583.33
.254.251.17
.50
.17
.922.75
.501.676.08
.42
Dead Horse Creek tributary
06/16/6509/13/6609/14/6606/15/6706/22/6707/12/6707/15/6707/18/6709/18/6705/22/6805/23/6805/25/6806/06/6806/06/6806/07/6805/22/7008/08/7106/03/7206/03/7208/02/7208/24/72
.45
.23
.101.311.13
.41
.33
.29
.33
.25
.77
.34
.55
.11
.22
.44
.101.23.40.79
1.07
Dead Horse Creek
05/23/6507/05/6507/25/6506/22/6609/01/6609/01/6606/07/6706/14/6706/14/6706/20/67
.22
.34
.19
.52
.44
.41
.12
.211.31.12
.83
.671.007.00
13.00.33.17
1.663.924.588.502.66
11.661.001.50
.50
.171.001.084.58
10.25
0.533.233
1.760.182.266.094.315.201.172.214.204.073.123.880.294.504.400
1.290.315.207.360.204.252.333
near Midwest,
.542
.343
.210
.187
.0871.2421.941
.175
.084
.054
.091
.128
.047
.130
.147
.8801.2351.230
.370
.172
.104
0.140.440.140.148.088.076.130.815.206.022.027.106.202.037.661.213.035.025.085.330.050.120.820.041
0.305.578.173.228.097.000.108.925.191.000.033.034.117.086.909.390.047.094.108.295.028.119
1.123.000
Wyoming (basin 3)
.292
.057
.026
.939
.716
.019
.018
.018
.066
.047
.289
.209
.413
.089
.179
.091
.0061.114
.389
.337
.531
.268
.060
.027
.926
.608
.256
.190
.079
.049
.000
.360
.094
.076
.000
.019
.275
.0001.036
.207
.474
.606
tributary No.2 near Midwest, Wyoming (basin 4)
1.582.58
.75
.751.582.25
.081.00
11.83.42
.139
.132
.253
.693
.278
.1821.500.210.099.286
.043
.099
.046
.136
.130
.146
.059
.072
.488
.106
.007
.093
.006
.328
.217
.168
.000
.016
.707
.000
Rainfall Date (inches)
Length of storm (hours)
Intensity (inches
per hour)
Measured runoff
(inches)
Simulated runoff
(inches)
Dead Horse Creek tributary No. 2 near Midwest, Wyoming(basin 4) Continued
06/20/6706/22/6706/22/6707/15/6706/07/6807/20/6908/09/7106/19/7208/02/7208/02/7208/24/72
.35
.39
.65
.46
.24
.09
.31
.46
.43
.35
.97
.422.838.17
.58
.50
.17
.173.332.501.429.75
.833
.138
.080
.793
.480
.5291.824
.138
.164
.246
.079
.230
.120
.201
.262
.093
.015
.119
.116
.030
.057
.233
.176
.134
.271
.277
.065
.000
.154
.188
.161
.135
.353
Test of Parameter Sensitivity
Information on model response to changes in param eter values is useful in understanding the model. A mathe matical fit of the data, using some fitting criteria, is necessary to determine sensitivity of the parameters. Unfor tunately, a mathematical fitting scheme for the incipient- runoff curve was not available, so the best fit had to be determined visually. Therefore, a graphical approach to the sensitivity test was used. Values 10, 20, and 30 percent greater than, and 10, 20, and 30 percent less than, the optimum parameter values were used for each of the three parameters and plotted on a graph with the data points. The best fit curve and the curves of +30 percent and 30 percent for the parameters for Dugout Creek tributary are shown in figures 6 through 8. The largest change in runoff is the result of the most sensitive parameter, retention storage (d). A change in the retention-storage parameter affects simulated runoff from short-duration high-intensity storms (fig. 8). A change in the saturated hydraulic con ductivity parameter (Kh) affects simulated runoff from long-duration storms (fig. 6).
Rainfall-intensity and storm-length data from Dugout Creek tributary were used to evaluate the effects of param eter changes on simulated runoff. The results are tabulated below:
Parameter
KhKhP(m-m0)P(m-m0)dd
Parameter change (percent)
+ 30-30+30-30+ 30-30
Runoff change (percent)
-8.6
+ 10.2-2.6
+2.9-11.4+ 12.8
8 A Point-Infiltration Model for Estimating Runoff from Rainfall on Small Basins in Semiarid Areas of Wyoming

Table 2. Soil parameters, fitting statistics, and average values for three small basins having single-soil cover
Basin number Basin name
3 Dead Horse Creek tributary 4 Dead Horse Creek tributary No. 5 Dugout Creek tributary
Average
Soil parameters Data-fitting errors
Kh Standard (inches per P(m-m0) d Difference error
hour) (inches) (inches) (percent)1 (percent)2
0.017 0.049 0 2 .013 .053
.025 .060
.018 .054
.110 -2.9 50
.129 23.4 70
.090 20.8 55
.118
1 Difference between the sum of the measured and simulated events.2 Percent standard error of the mean value of the data set.
Test of Nonuniform Rainfall Intensities
Tests were made to evaluate the assumption of "an average" storm intensity. Two assumed storms, each having an average intensity of 0.30 inch per hour (in/h) and a storm duration of 1.60 hours, were used in the analyses. The storm for the first test was designed so that one-third of the total precipitation fell during the first half of the storm (from beginning of rainfall to beginning of runoff) and two-thirds fell during the second half. The second test storm
had the same duration as the first, but with two-thirds of the total precipitation falling during the first half and one-third during the second half. Runoff was computed for the two assumed storms and for the mean of the two tests. The same incipient-runoff curve was used for all computations. A second set of assumed storms, each having an average intensity of 0.08 in/h and a storm duration of 10.00 hours, was used to check lower intensity storms. The same methods were used for this set of storms as were used for the first set.
10
DCD O I cc.UJ Q-C/3 UJI O
c/5zUJt-
CC. UJ
cc.UJ
1.0
0.1
0.01
O RUNOFF STORM
NONRUNOFFSTORM
O O
Best-fit curve (dashed line)
30-percent increase in Kh
30-percent decrease in
0.1 1.0 10
STORM LENGTH, IN HOURS
100
Figure 6. Incipient-runoff curves for changes in hydraulic conductivity (Kh ) for Dugout Creek tributary near Midwest (basin 5).
Point-Infiltration Model
10
DCD OX<r LU a. wLUX O
c/52 LU\-
ccLU
QC LU
1.0
< 0.1
0.01
1 I I I I I 111 I I I I I I I 1 I I I I I IL
O RUNOFF STORM
NONRUNOFFSTORM -
°0
O
Best-fit curve (dashed line)
30-percent increase in - P(m-m0)
30-percent decrease in P (m - mo)
i iii0.1 1.0 10
STORM LENGTH, IN HOURS
100
Figure 7. Incipient-runoff curves for changes in the effective product of capillary potential (P(m-m0)) for Dugout Creek tributary near Midwest (basin 5).
Results of the analyses of both storm sets show that when the low-intensity part of the storm occurred during the first half of the event, the computed runoff was about 2.3 percent higher than the runoff computed for the mean; when the high-intensity part of the storm occurred first, the computed runoff was 1.8 percent lower than the runoff computed for the mean. A small error was introduced by assuming a constant rainfall rate.
COMPUTATION OF RUNOFF FROM MULTIPLE-SOIL BASINS
Very few natural basins contain only one type of soil or several types of soils that have a common or single infiltration rate. The incipient-runoff-curve method of dis tinguishing between runoff and nonrunoff rainstorms is applicable to multiple-soil basins. However, the incipient- runoff curve defines the infiltration and surface-retention storage parameters for only the soil having the highest runoff potential, rather than for the entire basin (Rankl, 1982). When the method is used for multiple-soil basins,
each soil type must be ranked in relation to its relative permeability and the area of each soil type must be determined.
Ranking of Soil Permeability
Infiltration rates of soils can be ranked by first determining the relative permeability using methods described in a report by the U.S. Department of Agriculture (1962, p. 168), which states, "In the absence of precise measurements, soils may be placed into relative permeabil ity classes through studies of structure, texture, porosity, cracking, and other characteristics of the horizons in the soil profile in relation to local use experience." For convenience in this study, the classes of relative soil permeability used by the U.S. Soil Conservation Service (Stephens, 1975) were equated to single values rather than class ranges of values. The Soil Conservation Service class ranges, as well as the single values, are listed in table 3. The midpoint (or single value) for each class was computed by determining the logarithmic values of the endpoints and taking the
10 A Point-Infiltration Model for Estimating Runoff from Rainfall on Small Basins in Semiarid Areas of Wyoming

10
ocD OXQC LUa. wLUXo 1.0
zLU
0.1
QC LU
QC LU
0.01
O RUNOFF STORM
NONRUNOFF STORM
0 0 Best-fit curve (dashed line)
30-percent increase in d
O30-percent decrease in d
0.1 1.0 10
STORM LENGTH, IN HOURS
100
Figure 8. Incipient-runoff curves for changes in surface-retention storage (c/) for Dugout Creek tributary near Midwest (basin 5).
antilog of their mean. This single value of relative soil permeability is used as a soil-group identifier in this report.
The next steps in computing runoff from multiple-soil basins are to determine the percentage of each basin covered by each soil group and to arrange the soil groups in the order of their relative infiltration rates.
In the empirical analysis of infiltration, Rankl (1982) computed values of relative permeability for soil complexes or associations. That approach made it difficult to estimate infiltration-rate curves for soil complexes other than those tested. In this study, an alternative approach using only soil
Table 3. Class values of relative soil permeability
Class description
1 Very slow 2 Slow3 Moderately slow 4 Moderate5 Moderately rapid 6 Rapid
Numericalclass range
(inches per hour)
less than 0.06 .06 to .2
.2 to .6
.6 to 2.02.0 to 6.0 6.0 to 20.0
Relative soilpermeability
(inches per hour)
'0.06 .11.35
1.103.46
11.0
Upper endpoint was used.
texture clay, silty clay loams, clay loams, loams, and sandy loams as a criterion for grouping soils was investi gated. It was found that soil texture generally was related to relative permeability, but numerous anomalies made the method impractical.
Soil complexes and associations mapped and described by the Soil Conservation Service were divided into individual soil units and were assigned a value of relative soil permeability based on the class description. The soils were regrouped using the relative permeability value as a criterion. These soil groups were then used with the procedure outlined in the next section to determine infiltration rates.
Optimization of Incipient-Runoff Curves
A storm whose average intensity and duration is greater than the average intensity and duration needed to define the IRC (incipient-runoff curve) for the soil having the highest runoff potential, but whose average intensity and duration is less than that needed to define the IRC for the remainder of the soils, will produce runoff from only the soil having the highest runoff potential. The IRC of all the
Computation of Runoff from Multiple-Soil Basins 11

Storm 4
Storm 3
Storm 2
Storm!
A *\ A * V . 7
T Aft. <1 V A
A 7
50 100CUMULATIVE AREA OF BASIN, IN PERCENT
Figure 9. Schematic model of subbasin infiltration rates.
soil types in a basin can be evaluated by using data for a number of storms, with a range in average intensities and durations from just greater than the lowest IRC to intensities and durations greater than the highest IRC. A schematic model of subbasin infiltration rates is shown in figure 9.
A solution is possible by assuming a series of incipient-runoff curves parallel to the lowest curve and using them to compute runoff for the subbasin areas. The runoffs from the subbasin areas are summed to obtain the total runoff for the storm. Each simulated value of runoff is compared with the measured value of runoff. This process is repeated until the difference between simulated runoff and measured runoff is some acceptable sum of the least squares fit of all the events for the basin. Infiltration and retention-storage parameters are determined for each sub- basin by the fitting process, while the original order, based on permeability of soils, is maintained. The assumption that the IRC's are parallel to the lowest, or base, IRC is made in order to use a single multiplier for the three parameters needed to define the IRC for each soil.
The large number of trials required to obtain an acceptable fit is nearly impossible without the aid of a computer and an optimization technique. A modified Rosenbrock-optimization technique used by Dawdy and others (1972) for rainfall-runoff studies was adapted to aid in the data fit. Upper and lower constraints were set on the multiplier of infiltration and retention parameters to keep the ranking of permeabilities of soil types in the correct order.
Rainfall data and measured runoff data for North Prong East Fork Nowater Creek tributary were used to
O RUNOFF STORM
NONRUNOFFSTORM
0.011.0 10
STORM LENGTH, IN HOURS
100
Figure 10. Common incipient-runoff curve for North Prong East Fork Nowater Creek near Worland (basin 1) and North Prong East Fork Nowater Creek tributary near Worland (basin 2).
develop the procedure for determining values for IRC parameters for small basins containing more than one soil type. This basin was selected because of the range of rainfall data available, the limited number of soil types, and available infiltrometer data. Rainfall and runoff data for North Prong East Fork Nowater Creek, a small basin in the same area, were available to test transferability of fitted parameters. The IRC was defined using runoff and nonrun- off rainstorm data for both North Prong East Fork Nowater Creek tributary and North Prong East Fork Nowater Creek. Both basins contain areas of shale outcrop and gullies having low permeability, and this similarity resulted in a common incipient-runoff curve (fig. 10). Soil types, soil groups, textures, relative permeabilities, and percentages of basin area are listed in tables 4 and 5.
Data for 15 rainfall-runoff events in North Prong East Fork Nowater Creek tributary were used to determine the position of the IRC for each soil. The base IRC (fig. 10) defines the parameters for the soil and soil material having the highest runoff potential. The lower constraints for the parameters were set to be equal to the base curve values, and the upper constraints were set to be equal to the values for the storm of greatest intensity and duration. The results of the optimization of IRC parameter values from data collected for the drainage basin during an 8-year period show that only two soil types had a retention-storage loss and an infiltration rate small enough to produce runoff from the rainstorms; that is, runoff occurred from only 37.2
12 A Point-Infiltration Model for Estimating Runoff from Rainfall on Small Basins in Semiarid Areas of Wyoming

Table 4. Soil types and groupings for North Prong East Fork Nowater Creek tributary near Worland (basin 2)
Percentage Soil name Soil texture of basin area
Soils with a relative permeability of 0.06 inch per hour Rock outcrop Shale 18.6
Total TOSoils with a relative permeability of 0.11 inch per hour
Muff Fine sandy loam 18.6 Total
Table 6. Soil groups, infiltration parameters, and percent area of soil groups for North Prong East Fork Nowater Creek tributary near Worland (basin 2)
Soils with a relative permeability of 0.35 inch per hour Persayo Clay loam 21.2 Youngston Silty clay loam 1.8 Uffens Fine sandy loam 1.8 Greybull Clay loam 1.7
TotalSoils with a relative permeability of 1.10 inches per hour
Neiber Fine sandy loam 20.6 Fruita Fine sandy loam 7.8 Lostwell Sandy clay loam 4.8
TotalSoils with a relative permeability of 3.46 inches per hour
Wallson Loam fine sand 3.1 Total
percent of the basin. The optimized parameters for the soil groups listed in table 4 are tabulated in table 6.
Rainstorm dates, amounts, lengths, intensities, and measured and simulated runoff values for North Prong East Fork Nowater Creek tributary are presented in table 7. Standard deviation as computed by equation 12 is 0.015 in,
Table 5. Soil types and groupings for North Prong East Fork Nowater Creek near Worland (basin 1)
Percentage Soil name Soil texture of basin area
Soils with a relative permeability of 0.06 inch per hour Rock outcrop Shale 29.3
TotalSoils with a relative permeability of 0.11 inch per hour
Muff Fine sandy loam 9.6 TotalSoils with a relative permeability of 0.35 inch per hour
Persayo Clay loam 20.0 Youngston Silty clay loam 11.6 Uffens Fine sandy loam 7.3 Greybull Clay loam 3.3
Total 42.2Soils with a relative permeability of 1.10 inches per hour
Neiber Fine sandy loam 7.7Fruita Fine sandy loam 0.6Lostwell Sandy clay loam 8.8
Total TTTSoils with a relative permeability of 3.46 inches per hour
Wallson Loam fine sand 0.2 Sandy alluvium Sandy 1.6
Total
Soil-infiltration parameters
Soil-group identifier
0.06.11
1 .35 2 1.10 23.46
(inches per hour)
0.011.037 .074 .074 .074
P(m-m0) (inches)
0.050.168 .340 .340 .340
d (inches)
0.073.245 .496 .496 .496
Percentage of basin area
18.618.6 26.5 33.2
3.1
1 Infiltration rates maybe greater than the parameter values indicate.2 Infiltration rates are undefined.
or about 20 percent of the mean runoff value. The sum of simulated runoff for all available runoff events is 1.3 percent greater than the sum of measured runoff. Figure 11 is a graphical comparison of measured and simulated runoff.
Split-Sample Test
To test the prediction capabilities of the point- infiltration model, the data set for North Prong East Fork Nowater Creek tributary (table 7) was divided into two sets of eight and seven rainstorms. A random numbers table (Dixon and Massey, 1957, p. 366-370) was used to select the eight storms for control sample 1. The remaining seven storms were used for test sample 2 (and later for control sample 2).
The control samples were optimized using the same soil grouping and parameter constraints as the full set. Optimized parameters from control sample 1 were used to simulate runoff by using rainfall data from test sample 2.
Table 7. Rainfall data, measured runoff data, and simu lated runoff data for North Prong East Fork Nowater Creek tributary near Worland (basin 2)
Date05/23/6506/06/6706/23/6709/18/6706/05/6806/07/6807/27/6808/23/6805/21/7005/28/7105/29/7105/30/7108/23/7209/08/7309/08/73
Rainfall (inches)
0.12.51.70
1.40.46.14.14
1.40.24.41.32.79.30.31.27
Length of storm (hours)
0.33.67
6.759.081.831.08
.926.253.421.833.25
13.422.836.71
.42
Intensity (inches
per hour)0.364
.761
.104
.154
.251
.130
.152
.224
.070
.224
.098
.059
.106
.050
.643
Measured runoff
(inches)0.006
.094
.083
.304
.055
.004
.008
.301
.009
.025
.022
.116
.016
.018
.034
Simulated runoff
(inches)0.003
.095
.083
.284
.057
.002
.003
.322
.010
.048
.025
.080
.023
.016
.030
Computation of Runoff from Multiple-Soil Basins 13

1.0
I 0.1z
0.01
0.001
Line of equal value-
il
1.0
0.001 0.01 0.1
MEASURED RUNOFF, IN INCHES
1.0
| 0.1
D ocQ LUI-
< 0.01D
o.ooi
I I I I I ll| I I I I I I I I I I I I I I I II-
Line of equal value..
00 CONTROL SAMPLE 1
O TEST SAMPLE 2
I I I I 111 i i i i 1.1.0.001 0.01 0.1
MEASURED RUNOFF, IN INCHES
10
Figure 11. Comparison of simulated runoff and measured Figure 12. Split-sample test for North Prong East Fork runoff for North Prong East Fork Nowater Creek tributary Nowater Creek tributary near Worland (basin 2), controlnear Worland (basin 2). sample 1.
The process was reversed by using test sample 2 as control sample 2. The results of the split-sample tests are shown graphically in figures 12 and 13.
The fitting errors for the test using equations 11 and 12 are as follows:
Control sample
12
All
Standard deviation (inches)
0.0040.0230.015
Percentage of mean
151920
Results of the tests show that the model was capable of predicting runoff from the uncalibrated half of the data set within 19 percent.
Interbasin Transfer of Soil Parameters
Tests were conducted to determine if infiltration parameters could be transferred from one basin to another. Rainfall data and areal extent of soils for North Prong East Fork Nowater Creek and the optimized infiltration param eters for North Prong East Fork Nowater Creek tributary were used to simulate runoff for each storm. The standard deviation of the simulated runoff when compared with the measured runoff was 0.031 in, about 46 percent of the mean measured runoff. The sum of the simulated runoff events was 10.2 percent less than the sum of the measured runoff events. The distribution appears uniform about the line of equal value, as shown in figure 14.
Data Analysis
Seven basins having multiple soils, rainfall data, and runoff data were available for this study. Soil names, textures, relative permeabilities, and percentages of basin
1.0
0.1
0.01
0.001
I I I I
Line of equal value-
CONTROL SAMPLE 2 O TEST SAMPLE 1
J I I I I0.001 0.01 0.1
MEASURED RUNOFF, IN INCHES
1.0
Figure 13. Split-sample test for North Prong East Fork Nowater Creek tributary near Worland (basin 2), control sample 2.
14 A Point-Infiltration Model for Estimating Runoff from Rainfall on Small Basins in Semiarid Areas of Wyoming

1.0
I 0.1
1-< 0.01
0.001
I i i i 11 i I I I n ire
Line of equal value.
i i i 111 i i i i i i i I0.001 0.01 0.1 1.0
MEASURED RUNOFF, IN INCHES
Figure 14. Comparison of simulated runoff and measured runoff for North Prong East Fork Nowater Creek near Worland (basin 1), using fitted infiltration parameters from North Prong East Fork Nowater Creek tributary near Wor land (basin 2).
area for five of the basins are listed in table 8. Soil data for the other two basins, North Prong East Fork Nowater Creek tributary and North Prong East Fork Nowater Creek, are listed in tables 4 and 5.
Incipient-runoff curves for the soil groups were opti mized to determine the best values of infiltration parameters for computing runoff from rainfall data. Rainfall data, measured runoff data, and simulated runoff data for the multiple-soil basins are listed in tables 7 and 9.
Optimized infiltration and retention-storage parame ters for the incipient-runoff curve for each soil group in each of the seven basins are listed in table 10. Also listed are fitting errors for each data set. The difference between the sum of the measured runoff events and the sum of the simulated runoff events is a measure of the fit of the data. A measure of dispersion is computed by dividing the standard deviation by the mean value of the data set. For a given basin, soil groups having an infiltration rate greater than that of the highest intensity rainstorm have a set of soil-parameter values that are defined by the intensity of the rainstorm. The loss rate equals the supply rate. These soil groups are flagged in table 10. Soil groups having infiltra tion and retention-storage values greater than those that are set equal to the values defined by the largest storm are flagged in table 10 as undefined.
When the combination of infiltration rate and reten tion storage equals or exceeds the supply rate for a soil group, runoff does not occur. The data for each multiple-
Table 8. Soil types, texture, relative permeability, and percent area for multiple-soil basins
Percentage Soil name Soil texture of basin area
Headgate Draw at upper station, ________near Buffalo, Wyoming (basin 6)________
Soils with a relative permeability of 0.06 inch per hourRockland Shale 15.3
Total 133Soils with a relative permeability of 0.11 inch per hour
Gaynor Silty clay loam 7.0Razor Silty clay loam 3.4Renohill Clay loam 9.2Samsil Silty clay loam 19.9
Total 393Soils with a relative permeability of 0.35 inch per hour
Briggsdale Fine sandy loam 6.2Total ~6T2
Soils with a relative permeability of 1.10 inches per hourAscolon Cushman KirnOlney Shingle StonehamThedalundUndefined loams WorfZigwield
Total
Fine sandy loam Fine sandy loam LoamFine sandy loam Silty clay loam Sand loamLoamSandy clay loam LoamLoam
1.4 4.5 3.02.3
17.2 1.66.11.0 1.1
.8 39.0
Medicine Bow River tributary near Hanna, Wyoming (basin 7)
Soils with a relative permeability of 0.06 inch per hour Rockland Shale and sandstone 10.0
Total TCTOSoils with a relative permeability of 0.11 inch per hour
Abston Sandy loam 17.1 Playa Silt 0.1 Tisworth Sandy clay loam 2.4
Total W6Soils with a relative permeability of 0.35 inch per hour
Blazon Clay loam 36.9 Seaverson Clay loam 1.3
Total 31T2 Soils with a relative permeability of 1.10 inches pur hour
Blackball Sandy loam 0.5 Delphill Loam 1.3 Shinbara Loam 9.0 Yamac Loam 3.7
Total T475 Soils with a relative permeability of 3.46 inches per hour
Absher Fine sandy loam 2.1 Forelle Loamy 1.8 Rentsac Channery sandy loam 5.3 Rock River Sandy loam 0.4 Stanka Sandy loam 7.5 Spool Loamy sand 0.6
Total_________________________1777
Hanna Draw tributary near Hanna, Wyoming (basin 8)Soils with a relative permeability of 0.06 inch per hour
Rockland Total
Shale and sandstone 17.617.6
Computation of Runoff from Multiple-Soil Basins 15
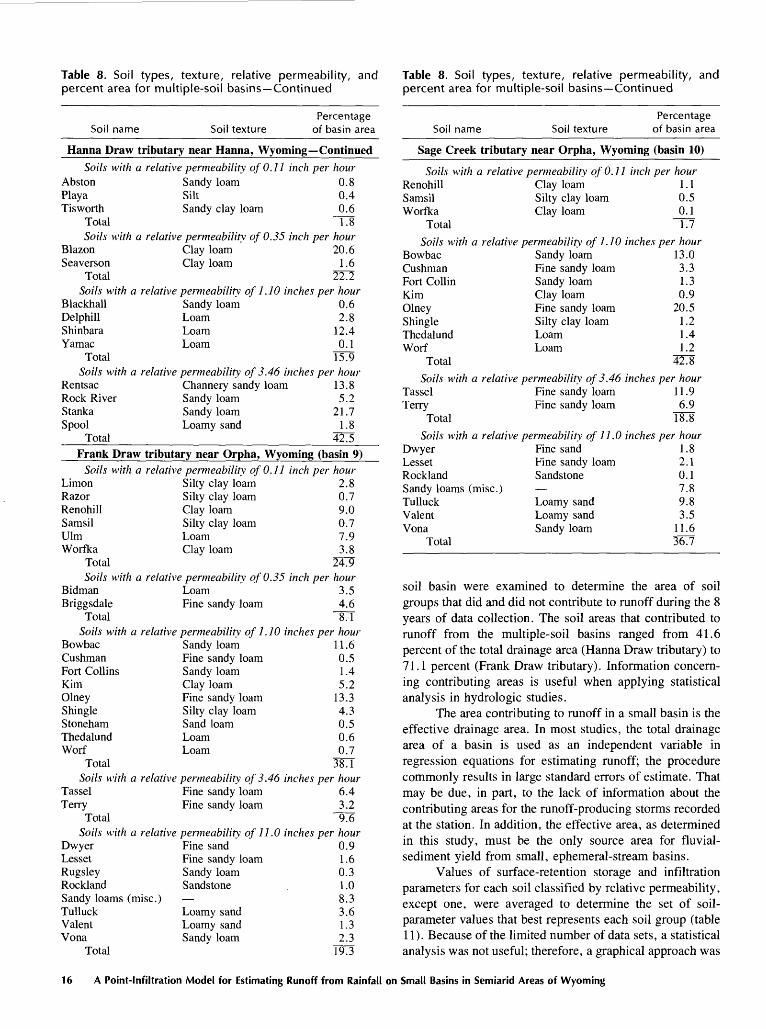
Table 8. Soil types, texture, relative permeability, and percent area for multiple-soil basins Continued
Percentage Soil name Soil texture of basin area
Hanna Draw tributary near Hanna, Wyoming ContinuedSoils with a relative permeability of 0.11 inch per hour
Abston Sandy loam 0.8 Playa Silt 0.4 Tisworth Sandy clay loam 0.6
Total ~T78Soils with a relative permeability of 0.35 inch per hour
Blazon Clay loam 20.6 Seaverson Clay loam 1.6
Total 2272 Soils with a relative permeability of 1.10 inches per hour
Blackball Sandy loam 0.6 Delphill Loam 2.8 Shinbara Loam 12.4 Yamac Loam 0.1
Total HT9 Soils with a relative permeability of 3.46 inches per hour
Rentsac Channery sandy loam 13.8 Rock River Sandy loam 5.2 Stanka Sandy loam 21.7 Spool Loamy sand 1.8
TotalFrank Draw tributary near Orpha, Wyoming (basin 9)
Soils with a relative permeability of 0.11 inch per hour Limon Silty clay loam 2.8 Razor Silty clay loam 0.7 Renohill Clay loam 9.0 Samsil Silty clay loam 0.7 Ulm Loam 7.9 Worfka Clay loam 3.8
Total 24T9Soils with a relative permeability of 0.35 inch per hour
Bidman Loam 3.5 Briggsdale Fine sandy loam 4.6
Total 8.1 Soils with a relative permeability of 1.10 inches per hour
BowbacCushmanFort CollinsKimOlneyShingleStonehamThedalundWorf
Total
Sandy loam Fine sandy loam Sandy loam Clay loam Fine sandy loam Silty clay loam Sand loam Loam Loam
11.60.51.45.2
13.34.30.50.60.7
38.1Soils with a relative permeability of 3.46 inches per hour
Tassel Fine sandy loam 6.4 Terry Fine sandy loam 3.2
Total "976Soils with a relative permeability of 11.0 inches per hour
DwyerLessetRugsleyRocklandSandy loams (misc.)TulluckValentVona
Total
Fine sand Fine sandy loam Sandy loam Sandstone
Loamy sand Loamy sand Sandy loam
0.91.60.31.08.33.61.32.3
193
Table 8. Soil types, texture, relative permeability, and percent area for multiple-soil basins Continued
Percentage Soil name Soil texture of basin area
Sage Creek tributary near Orpha, Wyoming (basin 10)
Soils with a relative permeability of 0.11 inch per hour Renohill Clay loam 1.1 Samsil Silty clay loam 0.5 Worfka Clay loam 0.1
Total T77Soils with a relative permeability of 1.10 inches per hour
BowbacCushmanFort CollinKimOlneyShingleThedalundWorf
Total
Sandy loam Fine sandy loam Sandy loam Clay loam Fine sandy loam Silty clay loam Loam Loam
13.03.31.30.9
20.51.21.41.2
42.8Soils with a relative permeability of 3.46 inches per hour
Tassel Fine sandy loam 11.9 Terry Fine sandy loam 6.9
TotalSoils with a relative permeability of 11.0 inches per hour
DwyerLessetRocklandSandy loams (misc.)TulluckValentVona
Total
Fine sandFine sandy loamSandstone Loamy sandLoamy sandSandy loam
1.82.10.17.89.83.5
11.63^7
soil basin were examined to determine the area of soil groups that did and did not contribute to runoff during the 8 years of data collection. The soil areas that contributed to runoff from the multiple-soil basins ranged from 41.6 percent of the total drainage area (Hanna Draw tributary) to 71.1 percent (Frank Draw tributary). Information concern ing contributing areas is useful when applying statistical analysis in hydrologic studies.
The area contributing to runoff in a small basin is the effective drainage area. In most studies, the total drainage area of a basin is used as an independent variable in regression equations for estimating runoff; the procedure commonly results in large standard errors of estimate. That may be due, in part, to the lack of information about the contributing areas for the runoff-producing storms recorded at the station. In addition, the effective area, as determined in this study, must be the only source area for fluvial- sediment yield from small, ephemeral-stream basins.
Values of surface-retention storage and infiltration parameters for each soil classified by relative permeability, except one, were averaged to determine the set of soil- parameter values that best represents each soil group (table 11). Because of the limited number of data sets, a statistical analysis was not useful; therefore, a graphical approach was
16 A Point-Infiltration Model for Estimating Runoff from Rainfall on Small Basins in Semiarid Areas of Wyoming

Table 9. Rainfall data, measured runoff data, and simu lated runoff data for multiple-soil basins
Table 9. Rainfall data, measured runoff data, and simu lated runoff data for multiple-soil basins Continued
Length Intensity MeasuredRainfall of storm (inches runoff
Date (inches) (hours) per hour) (inches)
North Prong East Fork Nowater Creeknear Worland, Wyoming (basin 1)
05/08/65 0.35 3.92 0.089 0.01806/15/65 .08 .33 .242 .00206/04/67 .14 1.33 .105 .00606/05/67 .16 .83 .193 .01206/06/67 .32 .67 .478 .04106/11/67 .15 2.58 .058 .00606/23/67 .69 7.00 .099 .13909/18/67 1.40 9.08 .154 .44105/23/68 .33 .67 .493 .03705/21/70 .27 .58 .465 .09205/28/71 .56 5.17 .108 .06805/29/71 .20 2.67 .075 .03605/30/71 .66 5.00 .132 .15708/23/72 .30 2.83 .106 .01107/29/73 .25 4.00 .062 .00609/08/73 .31 6.25 .050 .02009/08/73 .30 .42 .714 .106
Headgate Draw at upper station,near Buffalo, Wyoming (basin 6)
08/15/68 .18 .25 .720 .00408/23/68 .50 2.67 .187 .00607/16/69 1.39 .58 2.397 .40005/23/70 .46 .50 .920 .00506/19/70 1.06 .92 1.152 .24106/29/70 .17 .17 1.000 .00207/08/70 .29 .25 1.160 .00507/10/70 .37 .42 .881 .02806/09/72 .95 1.83 .519 .07007/23/72 .34 .75 .453 .00609/11/72 .30 .50 .600 .008
Medicine Bow River tributarynear Hanna, Wyoming (basin 7)
06/27/65 .35 2.08 .168 .04209/16/65 .28 1.58 .177 .01506/12/67 .33 .75 .440 .03406/13/67 .39 1.83 .213 .05106/15/67 .40 3.17 .126 .02509/18/67 .17 3.10 .055 .00709/26/67 .16 .58 .276 .00907/11/69 .28 .92 .304 .00208/05/70 .23 .58 .396 .01208/09/71 .30 .58 .517 .02408/29/71 .36 .67 .537 .02706/09/72 .26 .50 .520 .03607/22/72 .32 .42 .762 .01508/02/72 .56 .67 .836 .11406/28/73 1.02 .67 1.522 .347 07/13/73 .73 4.00 .182 .031 07/19/73 .67 7.67 .087 .05707/19/73 .24 2.25 .107 .00207/21/73 .33 1.00 .330 .10809/01/73 .59 4.92 .120 .04409/09/73 .97 1.75 .554 .246 09/10/73 1.78 3.17 .561 .630 09/11/73 1.94 13.92 .139 .569
Simulatedrunoff
(inches)
0.044.000.002.011.059.000.127.437.063.045.097.009.133.036.015.021.057
.000
.010
.438
.030
.222
.000
.009
.018
.086
.008
.006
.022
.010
.040
.037
.014
.000
.002
.022
.015
.036
.051
.026
.045
.109
.381
.102
.036
.000
.035
.049
.234
.643
.331Hanna Draw tributary near Hanna, Wyoming (basin 8)
07/23/65 .76 .92 .826 .085 .11209/01/66 .48 5.25 .091 .028 .023
Length Intensity Measured SimulatedRainfall of storm (inches runoff runoff
Date (inches) (hours) per hour) (inches) (inches)
Hanna Draw tributary near Hanna, Wyoming Continued06/11/67 .25 '.58 .431 .003 .01906/20/67 .23 1.75 .131 .016 .00506/23/67 .26 1.75 .149 .021 .01006/23/67 .33 3.00 .110 .025 .01306/28/67 .39 6.17 .063 .014 .00207/15/67 .71 .92 .772 .181 .10208/12/67 .12 .17 .706 .004 .00208/05/70 .86 .75 1.147 .138 .13808/09/71 .15 .58 .258 .004 .00208/29/71 .20 .42 .476 .005 .01207/20/72 .25 .33 .758 .031 .02208/01/72 .27 .33 .818 .031 .02608/23/72 .47 2.50 .188 .030 .04009/01/72 .15 .92 .159 .005 .00007/19/73 .32 3.00 .107 .011 .01107/23/73 .16 1.08 .148 .006 .00009/01/73 .68 6.92 .098 .029 .04709/11/73 1.96 14.00 .140 .302 .242
Frank Draw tributary near Orpha, Wyoming (basin 9)05/23/65 1.06 2.75 .385 .194 .22506/10/65 .50 2.58 .194 .094 .02906/24/65 .88 .83 1.060 .287 .24108/19/66 1.62 .50 3.240 .586 .79506/15/67 1.30 9.50 .137 .225 .15407/15/68 .84 .92 .967 .131 .23906/11/69 .64 1.21 .529 .016 .08105/30/71 1.19 .92 1.290 .473 .44508/02/72 .40 1.67 .240 .006 .01707/30/73 1.25 4.92 .254 .358 .23408/11/73 .37 .50 .740 .037 .028
Sage Creek tributary near Orpha, Wyoming (basin 10) 06/10/65 .51 1.17 .436 " .015 .00306/14/65 .37 .50 .740 .011 .00206/16/65 .65 .58 1.121 .063 .07007/25/65 1.19 .66 1.803 .303 .30308/19/66 .57 .50 1.140 .033 .04106/15/67 1.16 7.66 .151 .040 .03106/22/67 1.09 7.00 .156 .057 .02406/12/70 1.28 7.50 .171 .033 .08605/30/71 .69 .92 .750 .052 .06708/02/72 .82 1.58 .519 .053 .09007/22/73 .65 1.05 .600 .073 .03609/09/73 .68 2.92 .233 .026 .005
used to show the distribution and average curves for eachsoil group. Figures 15 through 18 illustrate incipient- runoff curves and the average curve for the four soil groups. Soilgroup 1.10 (that is, soils having a relative permeability of1.10 in per hour) (fig. 18, table 10) is an average for twosets of parameter values based on maximum rainfall intensity and the two sets of optimized parameter values. The parameter values for this soil group become the upper limitof the study.
Optimized parameter values for Headgate Draw werenot used in the computation of the average parameter
Computation of Runoff from Multiple-Soil Basins 17
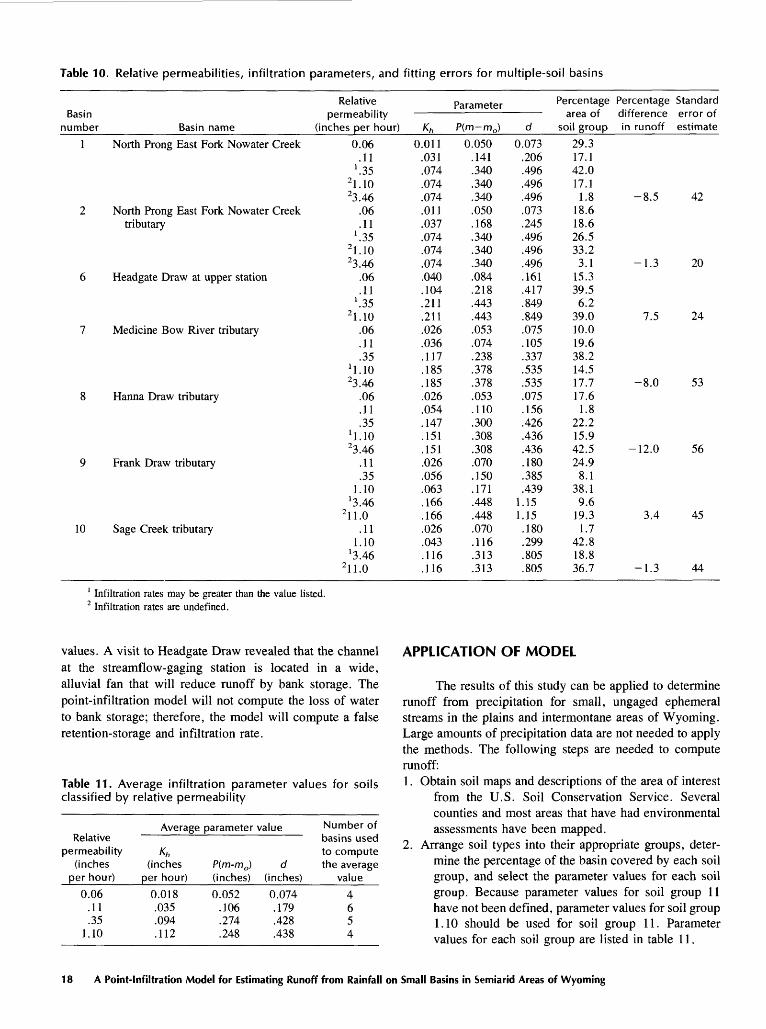
Table 10 . Relative permeabilities, infiltration parameters, and fitting errors for multiple-soil basins
Relative Basin permeability
number Basin name (inches per houi
1 North Prong East Fork Nowater Creek 0.06.11
'.35
2 1.1023.46
2 North Prong East Fork Nowater Creek .06tributary . 1 1
'.35
2 1.1023.46
6 Headgate Draw at upper station .06.11
'.35
2 1.107 Medicine Bow River tributary .06
.11
.35U.IO23.46
8 Hanna Draw tributary .06.11.35
4. 1023.46
9 Frank Draw tributary . 1 1.35
1.10J 3.46
2 11.010 Sage Creek tributary . 1 1
1.10'3.46
2 11.0
r) Kh0.011
.031
.074
.074
.074
.011
.037
.074
.074
.074
.040
.104
.211
.211
.026
.036
.117
.185
.185
.026
.054
.147
.151
.151
.026
.056
.063
.166
.166
.026
.043
.116
.116
Parameter
P(m-m0)
0.050.141.340.340.340.050.168.340.340.340.084.218.443.443.053.074.238.378.378.053.110.300.308.308.070.150.171.448.448.070.116.313.313
1
d
0.073.206.496.496.496.073.245.496.496.496.161.417.849.849.075.105.337.535.535.075.156.426.436.436.180.385.439
1.151.15.180.299.805.805
Percentage area of
soil group
29.317.142.017.1
1.818.618.626.533.2
3.115.339.56.2
39.010.019.638.214.517.717.6
1.822.215.942.524.9
8.138.19.6
19.31.7
42.818.836.7
Percentage Standard difference error of in runoff estimate
-8.5 42
-1.3 20
7.5 24
-8.0 53
-12.0 56
3.4 45
-1.3 44
1 Infiltration rates may be greater than the value listed.2 Infiltration rates are undefined.
values. A visit to Headgate Draw revealed that the channel at the streamflow-gaging station is located in a wide, alluvial fan that will reduce runoff by bank storage. The point-infiltration model will not compute the loss of water to bank storage; therefore, the model will compute a false retention-storage and infiltration rate.
Table 11. Average infiltration parameter values for soils classified by relative permeability
Relative permeability
(inches per hour)
0.06 .11 .35
1.10
Average
Kh (inches
per hour)
0.018 .035 .094 .112
parameter value
P(m-m0) (inches)
0.052 .106.274 .248
d (inches)
0.074 .179 .428 .438
Number of basins used to compute the average
value
4 65 4
APPLICATION OF MODEL
The results of this study can be applied to determine runoff from precipitation for small, ungaged ephemeral streams in the plains and intermontane areas of Wyoming. Large amounts of precipitation data are not needed to apply the methods. The following steps are needed to compute runoff:1. Obtain soil maps and descriptions of the area of interest
from the U.S. Soil Conservation Service. Several counties and most areas that have had environmental assessments have been mapped.
2. Arrange soil types into their appropriate groups, deter mine the percentage of the basin covered by each soil group, and select the parameter values for each soil group. Because parameter values for soil group 11 have not been defined, parameter values for soil group 1.10 should be used for soil group 11. Parameter values for each soil group are listed in table 11.
18 A Point-Infiltration Model for Estimating Runoff from Rainfall on Small Basins in Semiarid Areas of Wyoming

10
ccD OXccUJa.CO
u1.0
ccUJ
!< 0.1
0.01
I I i i i i i I I i i I I I I I MIL
.Medicine Bow River tributary and Hanna Draw tributary
Average curve (dashed line)
_ North Prong East Fork _ Nowater Creek and
North Prong East Fork - Nowater Creek tributary
i i iii i i0.1 1-0 10
STORM LENGTH, IN HOURS
100
Figure 15. Incipient-runoff curves for North Prong East Fork Nowater Creek near Worland, North Prong East Fork Nowater Creek tributary near Worland, Medicine Bow River tributary near Hanna, and Hanna Draw tributary near Hanna, and average curve for soils having a relative permeability of 0.06.
3. Define the design storm: total precipitation (inches), storm length (hours), and average intensity (inches per hour). Design storm information can be obtained from a report entitled "Precipitation-Frequency Atlas of the Western United States" by Miller and others (1973). Average intensity is total precipitation divided by storm length.
4. Follow the procedures outlined in the flowchart in the next section to apply the point-infiltration model.
Flowchart
The computation of infiltration using equation 2 is iterative and requires a computer program. The program to compute water uptake and runoff can be written for a hand-held programmable calculator. The flowchart on pages 20 and 21 outlines the necessary steps.
Example Basin
Demott Draw, a 0.91-mi2 basin (basin 11, fig. 1) on Mobil Oil Corporation's Federal coal lease in Campbell
County, is used as an example for computing runoff. Soils data and descriptions compiled by the U.S. Soil Conserva tion Service were published in an environmental impact report prepared for Mobil Oil Corporation (D'Appolonia Consulting Engineers, Inc., 1976). The following soil groups were identified for the basin:
Soil group
0.06.11
1.1011.0
Percentage of basin area
5.57.2
85.71.6
The design storm is a 100-year, 6-hour event (Miller and others, 1973, fig. 25). Total precipitation for the storm is 3.4 in. Runoff can be computed by applying average storm intensity, storm length, and the soil parameters for the identified soil groups. The procedures for doing so are listed in the flowchart in the preceding section. The computed runoff for the design storm is 1.83 in, or 89 acre-feet (acre-ft).
Application of Model 19

( START J
READStation
identificationnumber
I/ READ f Number of soil I groups (L) and I percent area A (L)
K-lSum = 0.00
LL=I
f READTotal rainfall.
storm intensity (R)and duration (t r )
TPRINTStation
identificationnumber
PRINTSoil parameters and rainfall data
20 A Point-Infiltration Model for Estimating Runoff from Rainfall on Small Basins in Semiarid Areas of Wyoming

Rt,
[ip-P(m-m0 )
P(m
t?- tr-tp-t-t'p
Td,dt
., r (P+H) (m moh" KhL14 j J
Runoff - R(t r ) i d
T
Runoff 0.00
Sum - Sum « Runoff *A(K)
ftp'"'P
H =0.00At =0.001
PRINT Station identification number
PRINT Soil group A(k)Precipitation Total runoff
Application of Model 21

10
ECID OIocLU Q_C/) 1 nin 1.0I O
Q_ID
0.1
tcOC
0.01
North Prong East Fork Nowater Creek tributary
Average curve (dashed line)
North Prong East Fork Nowater Creek ~
Medicine Bow River tributary
Sage Creek tributaryand Frank Draw tributary
i i i i i i i i I i i i i i i 110.1 1.0 10 100
TIME, IN HOURS
Figure 16. Incipient-runoff curves for North Prong East Fork Nowater Creek near Worland, North Prong East Fork Nowater Creek tributary near Worland, Medicine Bow River tributary near Hanna, Hanna Draw tributary near Hanna, Frank Draw tributary near Orpha, and Sage Creek tributary near Orpha, and average curve for soils having a relative permeability of 0.11.
Limitations
All of the basins included in this study are located in the plains and intermontane areas of Wyoming where runoff is in response to intense thunderstorms; the equations described herein should not be applied to other physio graphic areas of Wyoming. The drainage areas of the basins in the study ranged from 0.81 to 3.77 mi2 ; the incipient- runoff method should not be applied to larger basins. The values of the infiltration and retention-storage parameters from this study may be applicable to larger basins, but the assumptions concerning antecedent-moisture conditions and uniform rainfall have not been tested for larger basins. The incipient-runoff curves were defined for soil groups 0.06, 0.11, and 0.35. Parameter values for soil group 1.10, which defines infiltration rates just slightly greater than those of soil group 0.35, constitute the upper limit of the study.
RAINFALL-SIMULATOR INFILTROMETER TESTS
Selection and Location of Sites
Rainfall-simulator infiltrometer tests were run for two of the study basins one single-soil basin, and a multiple- soil basin to compare infiltration rates of different soils in the same basin. Dugout Creek tributary (basin 5, fig. 1) was selected as the single-soil basin because of the small size of its drainage area and the uniformity of its silty-clay loam soil. Infiltrometer tests were run on the three soil types in the North Prong East Fork Nowater Creek tributary (basin 2, fig. 1), the multiple-soil basin.
The infiltrometer-test sites in Dugout Creek tributary were selected by laying a grid pattern over a topographic map of the drainage basin. Thirteen sample sites were selected (fig. 19). Final field selection of the sample points
22 A Point-Infiltration Model for Estimating Runoff from Rainfall on Small Basins in Semiarid Areas of Wyoming

10
ccD O I CC
2 1.0O
LU ^i*D_DCC LUb 0.1
0.01
n i i i i i i I i I i i i i i i i i i i i i.
,North Prong East Fork Nowater Creek and North Prong East Fork Nowater Creek tributary
Medicine Bow River tributary
Frank Draw tributary
Average curve (dashed line)
i i i i i i i i i 110.1 1.0 10 100
STORM LENGTH, IN HOURS
Figure 17. Incipient-runoff curves for North Prong East Fork Nowater Creek near Worland, North Prong East Fork Nowater Creek tributary near Worland, Medicine Bow River tributary near Hanna, Hanna Draw tributary near Hanna, and Frank Draw tributary near Orpha, and average curve for soils having a relative permeability of 0.35.
was made randomly. The test sites for soils in North Prong East Fork Nowater Creek tributary were selected from a Soil Conservation Service soil map. For each soil type, four tests were conducted at 100-foot (ft) intervals along a transect.
water seal. The only change in the equipment from the McQueen design was to add a battery-operated, peristaltic pump to collect and remove runoff from the sample plot. The pump was run continuously to prevent head buildup on the soil surface.
Description of Equipment
A hand-portable rainfall-simulator infiltrometer designed by McQueen (1963) was used for the tests. The equipment is lightweight and easy to set up, and it simulates a rainfall rate and drop impact similar to those of a natural storm (about 1.9 in/h). The test area covered by the simulator is 26.0 square inches (in2), with a 5.75-in diameter. The base of the infiltrometer is attached to the soil surface without disturbing the soil by using a bentonite-
Infiltrometer Tests and Corrections
The rainfall-simulator infiltrometer tests were run for 1 hour at each sample site in the two basins. Amounts of simulated rainfall and runoff were determined and recorded at 5-minute (min) intervals for each test. Rainwater was simulated by using distilled water for all infiltrometer tests. For Dugout Creek tributary, the distilled water was chilled to 5 to 12 °C, approximating temperatures typical of rainfall in Wyoming (J.D. Alyea, oral commun., 1980). For North
Rainfall-Simulator Infiltrometer Tests 23

10
QC=)oQC LU Q_
C/) 1 n LU ' -UI O
QC LU
O LU
£QC
0.1
0.01
'Hanna Draw tributary
Average curve (dashed line)
-Medicine Bow River tributary
Sage Creek tributary-
Frank Draw tributary'
I I I I I I I 11 i i i i 110.1 1.0 10
STORM LENGTH, IN HOURS
100
Figure 18. Incipient-runoff curves for Medicine Bow River tributary near Hanna, Hanna Draw tributary near Hanna, Frank Draw tributary near Orpha, and Sage Creek tributary near Orpha, and average curve for soils having a relative permeability of 1.10.
Prong East Fork No water Creek tributary, the distilled water was not chilled; therefore, the water temperature approximated air temperature. The time required to make the initial instrument readings precluded observation of the time to ponding.
Immediately after each test, the equipment was removed from the test plot and the soil column of the test area was sliced vertically to determine the depth and lateral movement of the wetting front. Two approaches were used to estimate the wetted volume. In Dugout Creek tributary, the wetted volume of the soil was best estimated by a cylinder (fig. 20A). The average depth to the wetted front was 1.2 in. In North Prong East Fork No water Creek tributary, the best estimate of the wetted volume of soils was a cone (fig. 205). For both basins, the measured water uptake was adjusted by a ratio of the wetted volume of soil under the infiltrometer to the total wetted volume of soil (Hely and Peck, 1964, p. B13).
Adjusted values of water uptake for the infiltrometer tests in Dugout Creek tributary are presented in table 12. The mean and standard deviation of water uptake were
computed for each 5-min interval of the data set. Values of water uptake for sample 9 are considerably larger than for the other samples. After the first 5 min of the test, the water uptake by the soil was abnormally large. The wetting front, when the soil column was sliced, was found to have followed an old root channel or a crack. This type of phenomenon is typical for this soil; therefore, sample 9 was left in the data set.
Soil-moisture samples were collected at 9 of the 13 sample sites to determine the antecedent-moisture condi tion. The moisture content was determined using methods described by Yong and Warkentin (1975, p. 101). The average moisture content by weight was 2.6 percent.
Comparison of Measured and Computed Infiltration Data
Water uptake was computed for Dugout Creek tribu tary using infiltration and retention values obtained from the fitted incipient-runoff curve and a hypothetical rainstorm
24 A Point-Infiltration Model for Estimating Runoff from Rainfall on Small Basins in Semiarid Areas of Wyoming
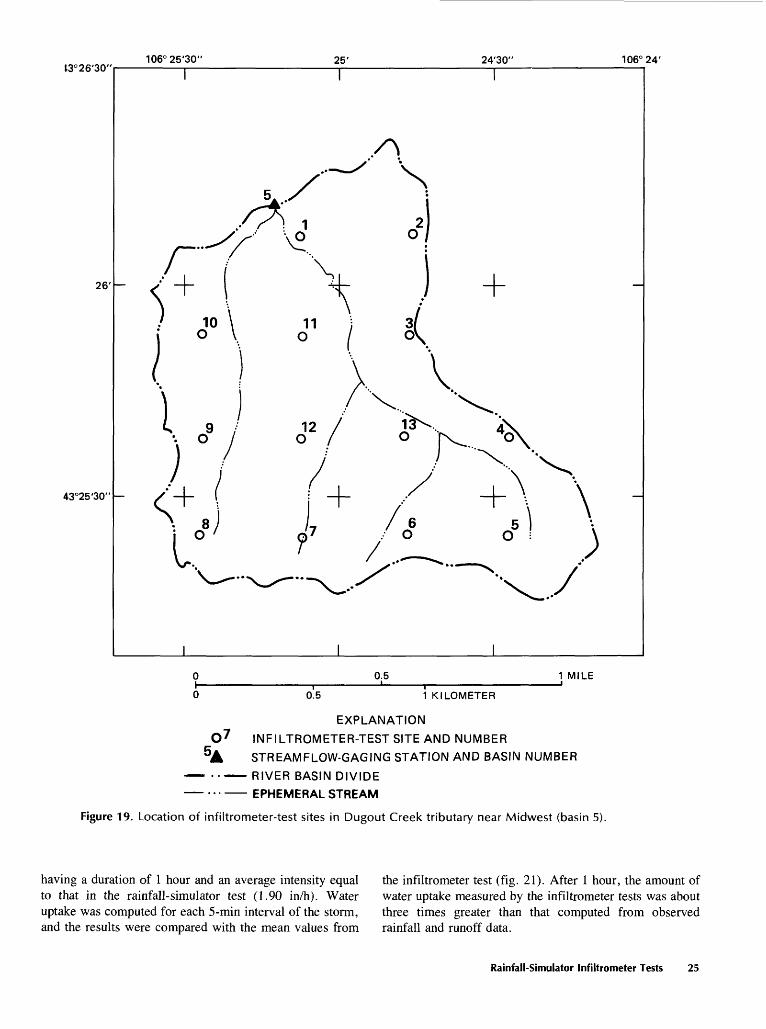
13°26'30"
26'
43°25'30"
106°25'30' T~
25' 24'30" 106° 24'
0.5 1 MILE
0.5 1 KILOMETER
EXPLANATION
O 7 INFILTROMETER-TEST SITE AND NUMBER
5A STREAMFLOW-GAGING STATION AND BASIN NUMBER
RIVER BASIN DIVIDE ... EPHEMERAL STREAM
Figure 19. Location of infiltrometer-test sites in Dugout Creek tributary near Midwest (basin 5).
having a duration of 1 hour and an average intensity equal to that in the rainfall-simulator test (1.90 in/h). Water uptake was computed for each 5-min interval of the storm, and the results were compared with the mean values from
the infiltrometer test (fig. 21). After 1 hour, the amount of water uptake measured by the infiltrometer tests was about three times greater than that computed from observed rainfall and runoff data.
Rainfall-Simulator Infiltrometer Tests 25

Figure 20. Total wetted volume (solid lines) and volume of infiltrometer tests (dashed lines) for cylinders (A) and cones (6).
Confidence limits (CL) were computed for the infiltrometer-test results using a confidence limit of 0.90 (Mendenhall, 1975, p. 400):
CL=y±1.7715
(13)
whereJ'^mean of the sample;s sample standard deviation; andn= sample size.
From figure 21, it can be concluded that the infiltration rates determined from the infiltrometer tests are too large and should not be used to compute runoff from the basin.
Four infiltrometer tests were run on each of three soil complexes in North Prong East Fork Nowater Creek tribu tary. Two of the 12 tests failed owing to leakage between the soil and the test ring. Each of the 10 remaining tests was adjusted for the lateral movement of the wetted front as described in the preceding section on "Infiltrometer Tests and Corrections." The soil complexes tested, number of samples, average water uptake, and adjusted water uptake for the 1-hour tests are as follows:
Soil Number of complex samples
Fruita-Neiber Muff-Neiber Persayo-Rock
outcrop
4 3
3
Average water uptake (inches)
1.14 1.00
.69
Adjusted water uptake (inches)
0.62.82
.65
Rainfall intensity data for North Prong East Fork Nowater Creek tributary, listed in table 7, show only two storms having an intensity slightly greater than water uptake measured in a 1-hour period. If the infiltration measured by the infiltrometer test were to represent natural infiltration rates, the basin would have had only two small runoff events during the 9-year period of record, when in fact 53 were recorded. As was the case for the single-soil basin, it is concluded that infiltrometer data should not be used to compute runoff.
SUMMARY
A point-infiltration model was developed and tested to estimate the volume of storm runoff from small ephemeral-stream drainage basins in Wyoming. For a design storm (having a user-specified average rainfall inten sity and duration), data that are required to compute runoff for a given basin are (1) the distribution of soils by type and description, and (2) infiltration parameters and a retention- storage parameter.
To compute infiltration and runoff using the point- infiltration model, two assumptions are necessary: (1) antecedent-moisture condition (initially dry) for a storm is some long-term average, and (2) rainfall for a storm is uniform in both time and space.
In this study, two infiltration parameters, Kh and P(m m0}, and a retention-storage parameter, d, were determined for the soil of each basin covered by only one type of soil. Each rainstorm was identified as a runoff or nonrunoff rainstorm. An incipient-runoff curve, which was fitted between the two types of rainfall data, was used to define the infiltration and retention-storage parameters.
For basins covered by more than one soil type, only the incipient-runoff curve for the soil type having the lowest infiltration rate can be defined by the curve. Incipient-
26 A Point-Infiltration Model for Estimating Runoff from Rainfall on Small Basins in Semiarid Areas of Wyoming
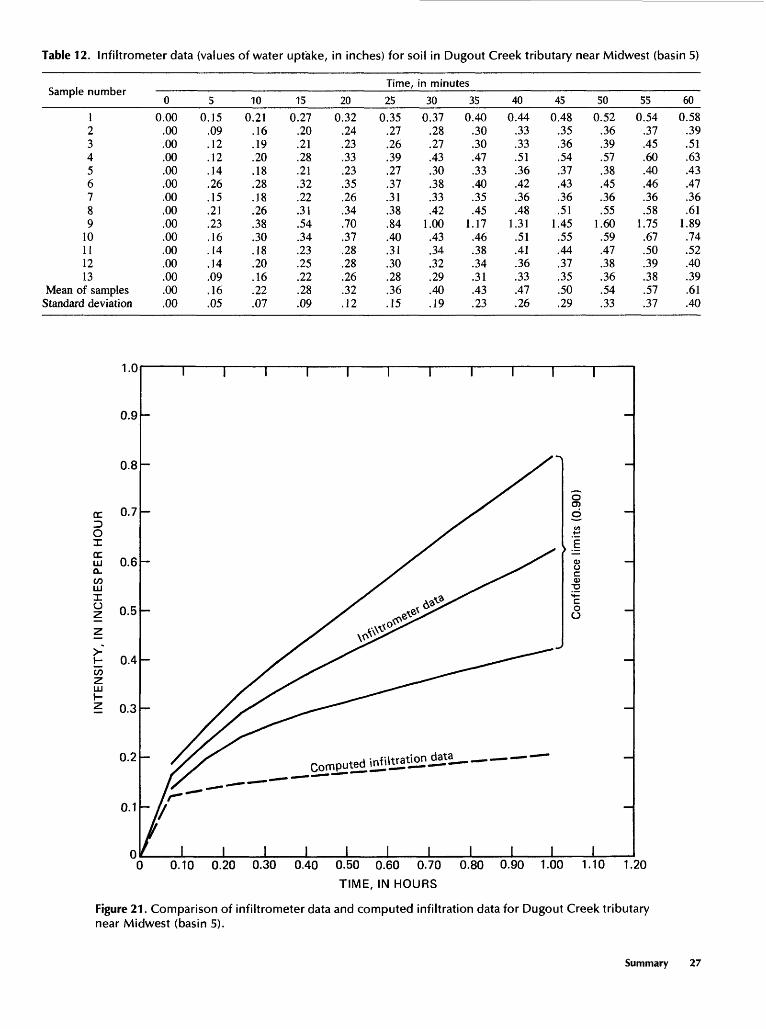
Table 12. Infiltrometer data (values of water uptake, in inches) for soil in Dugout Creek tributary near Midwest (basin 5)
Time, in minutessample numoer
123456789
10111213
Mean of samplesStandard deviation
00.00
.00
.00
.00
.00
.00
.00
.00
.00
.00
.00
.00
.00
.00
.00
50.15
.09
.12
.12
.14
.26
.15
.21
.23
.16
.14
.14
.09
.16
.05
100.21
.16
.19
.20
.18
.28
.18
.26
.38
.30
.18
.20
.16
.22
.07
150.27
.20
.21
.28
.21
.32
.22
.31
.54
.34
.23
.25
.22
.28
.09
200.32
.24
.23
.33
.23
.35
.26
.34
.70
.37
.28
.28
.26
.32
.12
25
0.35.27.26.39.27.37.31.38.84.40.31.30.28.36.15
300.37
.28
.27
.43
.30
.38
.33
.421.00
.43
.34
.32
.29
.40
.19
350.40
.30
.30
.47
.33
.40
.35
.451.17.46.38.34.31.43.23
40
0.44.33.33.51.36.42.36.48
1.31.51.41.36.33.47.26
45
0.48.35.36.54.37.43.36.51
1.45.55.44.37.35.50.29
500.52
.36
.39
.57
.38
.45
.36
.551.60
.59
.47
.38
.36
.54
.33
550.54
.37
.45
.60
.40
.46
.36
.581.75
.67
.50
.39
.38
.57
.37
600.58
.39
.51
.63
.43
.47
.36
.611.89.74.52.40.39.61.40
1.0
0.9
0.8
o: 0.7D OT.QCuj 0.6Q.CO LLJ
0.5
H 0.4COZ UJh-? 0.3
0.2
0.1
0
\ \
oO)
IEoc0)
T5M-
O
O
I0 0.10 0.20 0.30 0.40 0.50 0.60 0.70 0.80 0.90 1.00 1.10 1.20
TIME, IN HOURS
Figure 21 . Comparison of infiltrometer data and computed infiltration data for Dugout Creek tributary near Midwest (basin 5).
Summary 27

runoff curves for the soils having infiltration rates greater than the lowest curve were defined by ranking the soils according to their relative permeabilities and optimizing the position of the curve using measured runoff as a control for the fit.
The study shows that the effective contributing area of runoff is less than the total drainage area of the basin. For multiple-soil basins, the effective areas ranged from 41.6 to 71.1 percent of the drainage area. Information on effective contributing drainage area is useful in evaluating drainage area as an independent variable in statistical analysis of hydrology, such as annual peak frequency distributions and sediment yields.
A comparison was made of the sums of the simulated runoff and the sums of the measured runoff for all runoff events in the 10 basins studied for which data were available. Summation of the simulated runoff events ranged from 12.0 percent less than to 23.4 percent more than the summation of the measured runoff events. The standard error of estimate, computed for each data set, ranged from 20 to 70 percent of the mean value of the measured data set.
Using the point-infiltration model, runoff for small ungaged ephemeral streams can be estimated for a user- designated storm, soil data, and infiltration and retention- storage parameters, which are defined in this report. The use of the point-infiltration model is limited to small basins (drainage areas less than 3.77 mi2) in the plains and intermontane areas of Wyoming.
Rainfall-simulator infiltrometer tests were made in two of the small basins used in this study. In Dugout Creek tributary, the amount of water uptake measured by the tests was three times greater than the water uptake computed from rainfall and runoff data. From this study it was concluded that runoff cannot be estimated from infiltration rates computed from infiltrometer data.
REFERENCES
Craig, G.S., Jr., and Rankl, J.G., 1978, Analysis of runoff from small drainage basins in Wyoming: U.S. Geological Survey Water-Supply Paper 2056, 70 p.
D'Appolonia Consulting Engineers, Inc., 1976, Environmental impact report, proposed plan of mining and reclamation, Mobil Oil Corporation Federal Coal Lease W-23929, Camp bell County, Wyoming: Denver, Colo., Mobil Oil Corp. and Consolidation Coal Co., v. 1, variable pagination.
Dawdy, D.R., Lichty, R.W., and Bergmann, J.M., 1972, A rainfall-runoff simulation model for estimation of flood peaks for small drainage areas: U.S. Geological Survey Profes sional Paper 506-B, 20 p.
Dixon, W.J., and Massey, F.J., Jr., 1957, Introduction to statistical analysis: New York, McGraw-Hill Book Co., 488 p.
Green, W.H., and Ampt, G.A., 1911, Studies on soil physics: 1, Flow of air and water through soils: Journal of Agricultural Research, v. 4, p. 1-24.
Hely, A.G., and Peck, E.L., 1964, Precipitation, runoff, and water loss in the lower Colorado River Salton Sea area: U.S. Geological Survey Professional Paper 486-B, 16 p.
McQueen, I.S., 1963, Development of a hand portable rainfall- simulator infiltrometer: U.S. Geological Survey Circular 482, 16 p.
Mendenhall, William, 1975, Introduction to probability and sta tistics: North Scituate, Mass., Duxbury Press, 460 p.
Miller, J.F., Frederick, R.H., and Tracey, R.J., 1973, Precipitation-frequency atlas of the Western United States: U.S. Department of Commerce, National Oceanic and Atmos pheric Administration, National Weather Service, Atlas 2, v. 2, 43 p.
Overton, D.E., and Meadows, M.E., 1976, Storm water model ing: New York, Academic Press, 358 p.
Philip, J.R., 1954, An infiltration equation with physical signifi cance: Soil Science, v. 77, p. 153-157.
Rankl, J.G., 1982, An empirical method for determining average soil infiltration rates and runoff, Powder River structural basin, Wyoming: U.S. Geological Survey Water-Resources Investigations 81-76, 38 p.
Stephens, J.R., Jr., 1975, Soil survey of Johnson County, Wyoming, southern part: U.S. Department of Agriculture, Soil Conservation Service, 156 p.
U.S. Department of Agriculture, 1962, Soil survey manual: U.S. Department of Agriculture Handbook 18, 487 p.
Yong, R.N., and Warkentin, B.P., 1975, Soil properties and behavior: New York, Elsevier Scientific Publishing Co., 449 p.
28 A Point-Infiltration Model for Estimating Runoff from Rainfall on Small Basins in Semiarid Areas of Wyoming

METRIC CONVERSION FACTORS
For readers who wish to convert measurements from the inch-pound system of units to the metric system of units, the conversion factors are listed below:
Multiply inch-pound units
acre-foot (acre-ft)foot (ft)
inch (in)inch per hour (in/h)
square inch (in2)square mile (mi2)
By
1,2330.3048
25.425.46.4522.590
To obtain metric units
cubic metermetermillimetermillimeter per hoursquare centimetersquare kilometer
Temperature in degrees Celsius (°C) can be converted to degrees Fahrenheit (°F) as follows:
°F = 9/5 (°C) + 32
Metric Conversion Factors 29
SELECTED SERIES OF U.S. GEOLOGICAL SURVEY PUBLICATIONS
PeriodicalsEarthquakes & Volcanoes (issued bimonthly). Preliminary Determination of Epicenters (issued monthly).
Technical Books and ReportsProfessional Papers are mainly comprehensive scientific reports
of wide and lasting interest and importance to professional scientists and engineers. Included are reports on the results of resource studies and of topographic, hydrologic, and geologic investigations. They also include collections of related papers addressing different aspects of a single scientific topic.
Bulletins contain significant data and interpretations that are of lasting scientific interest but are generally more limited in scope or geographic coverage than Professional Papers. They include the results of resource studies and of geologic and topographic investigations, as well as collections of short papers related to a specific topic.
Water-Supply Papers are comprehensive reports that present significant interpretive results of hydrologic investigations of wide interest to professional geologists, hydrologists, and engineers. The series covers investigations in all phases of hydrology, including hydrogeology, availability of water, quality of water, and use of water.
Circulars present administrative information or important scien tific information of wide popular interest in a format designed for distribution at no cost to the public. Information is usually of short-term interest.
Water-Resources Investigations Reports are papers of an interpretive nature made available to the public outside the formal USGS publications series. Copies are reproduced on request unlike formal USGS publications, and they are also available for public inspection at depositories indicated in USGS catalogs.
Open-File Reports include unpublished manuscript reports, maps, and other material that are made available for public consultation at depositories. They are a nonpermanent form of publication that may be cited in other publications as sources of information.
MapsGeologic Quadrangle Maps are multicolor geologic maps on
topographic bases in 7.5- or 15-minute quadrangle formats (scales mainly 1:24,000 or 1:62,500) showing bedrock, surficial, or engineer ing geology. Maps generally include brief texts; some maps include structure and columnar sections only.
Geophysical Investigations Maps are on topographic or plani- metric bases at various scales; they show results of surveys using geophysical techniques, such as gravity, magnetic, seismic, or radio activity, which reflect subsurface structures that are of economic or geologic significance. Many maps include correlations with the geol ogy-
Miscellaneous Investigations Series Maps are on planimetric or topographic bases of regular and irregular areas at various scales; they present a wide variety of format and subject matter. The series also includes 7.5-minute quadrangle photogeologic maps on planimetric bases that show geology as interpreted from aerial photographs. Series also includes maps of Mars and the Moon.
Coal Investigations Maps are geologic maps on topographic or planimetric bases at various scales showing bedrock or surficial geology, stratigraphy, and structural relations in certain coal-resource areas.
Oil and Gas Investigations Charts show stratigraphic informa tion for certain oil and gas fields and other areas having petroleum potential.
Miscellaneous Field Studies Maps are multicolor or black- and-white maps on topographic or planimetric bases on quadrangle or irregular areas at various scales. Pre-1971 maps show bedrock geology in relation to specific mining or mineral-deposit problems; post-1971 maps are primarily black-and-white maps on various subjects such as environmental studies or wilderness mineral investigations.
Hydrologic Investigations Atlases are multicolored or black- and-white maps on topographic or planimetric bases presenting a wide range of geohydrologic data of both regular and irregular areas; principal scale is 1:24,000, and regional studies are at 1:250,000 scale or smaller.
CatalogsPermanent catalogs, as well as some others, giving comprehen
sive listings of U.S. Geological Survey publications are available under the conditions indicated below from the U.S. Geological Survey, Books and Open-File Reports Section, Federal Center, Box 25425, Denver, CO 80225. (See latest Price and Availability List.)
"Publications of the Geological Survey, 1879-1961" may be purchased by mail and over the counter in paperback book form and as a set of microfiche.
"Publications of the Geological Survey, 1962-1970" may be purchased by mail and over the counter in paperback book form and as a set of microfiche.
"Publications of the U.S. Geological Survey, 1971-1981" may be purchased by mail and over the counter in paperback .book form (two volumes, publications listing and index) and as a set of microfiche.
Supplements for 1982, 1983, 1984, 1985, 1986, and for sub sequent years since the last permanent catalog may be purchased by mail and over the counter in paperback book form.
State catalogs, "List of U.S. Geological Survey Geologic and Water-Supply Reports and Maps For (State)," may be purchased by mail and over the counter in paperback booklet form only.
"Price and Availability List of U.S. Geological Survey Pub lications," issued annually, is available free of charge in paperback booklet form only.
Selected copies of a monthly catalog "New Publications of the U.S. Geological Survey" are available free of charge by mail or may be obtained over the counter in paperback booklet form only. Those wishing a free subscription to the monthly catalog "New Publications of the U.S. Geological Survey" should write to the U.S. Geological Survey, 582 National Center, Reston, VA 22092.
Note. Prices of Government publications listed in older cata logs, announcements, and publications may be incorrect. Therefore, the prices charged may differ from the prices in catalogs, announce ments, and publications.