a multilayer circuit architecture for the generation of
TRANSCRIPT

*For correspondence:
[email protected] (AAZ);
[email protected] (CQD)
†These authors contributed
equally to this work
Present address: ‡Department
of Biology, Texas A&M
University, College Station,
United States
Competing interests: The
authors declare that no
competing interests exist.
Funding: See page 29
Received: 11 September 2019
Accepted: 22 December 2019
Published: 23 December 2019
Reviewing editor: Kristin Scott,
University of California, Berkeley,
United States
Copyright Zarin et al. This
article is distributed under the
terms of the Creative Commons
Attribution License, which
permits unrestricted use and
redistribution provided that the
original author and source are
credited.
A multilayer circuit architecture for thegeneration of distinct locomotorbehaviors in DrosophilaAref Arzan Zarin1†‡*, Brandon Mark1†, Albert Cardona2, Ashok Litwin-Kumar3,Chris Q Doe1*
1Institute of Neuroscience, Howard Hughes Medical Institute, University of Oregon,Eugene, United States; 2Janelia Research Campus, Howard Hughes MedicalInstitute, Ashburn, United States; 3Mortimer B Zuckerman Mind Brain BehaviorInstitute, Department of Neuroscience, Columbia University, New York, UnitedStates
Abstract Animals generate diverse motor behaviors, yet how the same motor neurons (MNs)
generate two distinct or antagonistic behaviors remains an open question. Here, we characterize
Drosophila larval muscle activity patterns and premotor/motor circuits to understand how they
generate forward and backward locomotion. We show that all body wall MNs are activated during
both behaviors, but a subset of MNs change recruitment timing for each behavior. We used TEM
to reconstruct a full segment of all 60 MNs and 236 premotor neurons (PMNs), including
differentially-recruited MNs. Analysis of this comprehensive connectome identified PMN-MN
‘labeled line’ connectivity; PMN-MN combinatorial connectivity; asymmetric neuronal morphology;
and PMN-MN circuit motifs that could all contribute to generating distinct behaviors. We
generated a recurrent network model that reproduced the observed behaviors, and used functional
optogenetics to validate selected model predictions. This PMN-MN connectome will provide a
foundation for analyzing the full suite of larval behaviors.
IntroductionLocomotion is a rhythmic and flexible motor behavior that enables animals to explore and interact
with their environment. Birds and insects fly, fish swim, limbed animals walk and run, and soft-body
invertebrates crawl. In all cases, locomotion results from coordinated activity of muscles with differ-
ent biomechanical outputs. This precisely regulated task is mediated by neural circuits composed of
motor neurons (MNs), premotor interneurons (PMNs), proprioceptors, and descending command-
like neurons (Marder and Bucher, 2001; Arber, 2017; Arber and Costa, 2018). A partial map of
neurons and circuits regulating rhythmic locomotion have been made in mouse (Crone et al., 2008;
Grillner and Jessell, 2009; Zagoraiou et al., 2009; Dougherty et al., 2013; Goetz et al., 2015;
Bikoff et al., 2016), cat (Kiehn, 2006; Nishimaru and Kakizaki, 2009), fish (Kimura et al., 2013;
Song et al., 2016), tadpole (Roberts et al., 2008; Roberts et al., 2010), lamprey (Grillner, 2003;
Mullins et al., 2011), leech (Brodfuehrer and Thorogood, 2001; Kristan et al., 2005; Marin-
Burgin et al., 2008; Mullins et al., 2011), crayfish (Mulloney and Smarandache-Wellmann, 2012;
Mulloney et al., 2014), and worm (Tsalik and Hobert, 2003; Wakabayashi et al., 2004;
Haspel et al., 2010; Kawano et al., 2011; Piggott et al., 2011; Wen et al., 2012; Zhen and Sam-
uel, 2015; Roberts et al., 2016). These pioneering studies have provided a wealth of information on
motor circuits, but with the exception of C. elegans (White et al., 1986), there has been no system
where all MNs and PMNs have been identified and characterized. Thus, we are missing a
Zarin et al. eLife 2019;8:e51781. DOI: https://doi.org/10.7554/eLife.51781 1 of 34
RESEARCH ARTICLE

comprehensive picture of how an ensemble of interconnected neurons generates diverse locomotor
behaviors.
Muscle recruitment patterns during different locomotor behaviors have been previously studied
in multiple organisms, including human (Grasso et al., 1998; van Deursen et al., 1998;
Neptune et al., 2000), cat (Buford and Smith, 1990), stick insect (Gruhn et al., 2006; Toth et al.,
2012), and leech (Friesen and Kristan, 2007). In the case of forward and backward locomotion, it
has been suggested that only a subset of muscles change their activity timing in one behavior versus
another, indicating an overall similarity in muscle recruitment patterns between these seemingly dis-
tinct behaviors (Buford and Smith, 1990; Neptune et al., 2000). We are interested in understand-
ing how the Drosophila larva executes multiple behaviors, in particular forward versus backward
crawling (Carreira-Rosario et al., 2018). Are there different MNs used in each behavior? Are the
same MNs used but with distinct patterns of activity determined by premotor input? A rigorous
answer to these questions requires both comprehensive anatomical information – that is a PMN/MN
connectome – and the ability to measure rhythmic neuronal activity and perform functional experi-
ments. All of these tools are currently available in Drosophila, and here we use them to characterize
the neuronal circuitry used to generate forward and backward locomotion.
The Drosophila larva is composed of 3 thoracic (T1-T3) and nine abdominal segments (A1-A9;
Figure 1A), with sensory neurons extending from the periphery into the CNS, and motor neurons
extending out of the CNS to innervate body wall muscles. Most segments contain 30 bilateral body
wall muscles that form ‘spatial muscle groups’ based on common location and orientation: dorsal
longitudinal (DL; includes previously described DA and some DO muscles), dorsal oblique (DO), ven-
tral longitudinal (VL), ventral oblique (VO), ventral acute (VA) and lateral transverse (LT)
(Figure 1B) (Crossley, 1978; Hooper, 1986; Bate, 1990). Using these muscles, the larval nervous
system can generate both forward and backward locomotion (reviewed in Kohsaka et al., 2017;
Clark et al., 2018). Forward crawling behavior in larvae involves a peristaltic contraction wave from
posterior to anterior segments; backward crawling entails a posterior propagation of the contraction
wave (Crisp et al., 2008; Dixit et al., 2008; Berni et al., 2012; Gjorgjieva et al., 2013;
Heckscher et al., 2015; Pulver et al., 2015; Loveless et al., 2018; Kohsaka et al., 2019)
(Figure 1A).
There are ~30 bilateral pair of MNs in each segment: 26 pair of type Ib MNs with big boutons
that typically innervate one muscle; two pair of type Is MNs with small boutons that innervate large
groups of dorsal or ventral muscles; one or two type III insulinergic MNs innervating muscle 12; and
three type II ventral unpaired median (VUM) MNs that provide octopaminergic innervation to most
muscles (Table 1) (Gorczyca et al., 1993; Landgraf et al., 1997; Hoang and Chiba, 2001;
Landgraf et al., 2003; Choi et al., 2004; Mauss et al., 2009; Koon et al., 2011; Koon and Budnik,
2012; Arzan Zarin and Labrador, 2019). Elegant pioneering work showed that type Ib MNs inner-
vating muscles in the same spatial muscle group typically project dendrites to the same region of
the dorsal neuropil, creating a myotopic map (Landgraf et al., 1997; Mauss et al., 2009). Several
MNs have been shown to be rhythmically active during larval locomotion (Heckscher et al., 2012;
Zwart et al., 2016), but only a few of their premotor inputs have been described (Kohsaka et al.,
2014; Heckscher et al., 2015; Fushiki et al., 2016; Hasegawa et al., 2016; Zwart et al., 2016;
Takagi et al., 2017; Carreira-Rosario et al., 2018; Kohsaka et al., 2019). Some excitatory PMNs
are involved in initiating activity in their target MNs (Fushiki et al., 2016; Hasegawa et al., 2016;
Zwart et al., 2016; Takagi et al., 2017; Carreira-Rosario et al., 2018), while some inhibitory PMNs
limit the duration of MN activity (Kohsaka et al., 2014; MacNamee et al., 2016; Schneider-
Mizell et al., 2016) or produce intrasegmental activity offsets (Zwart et al., 2016). Interestingly,
some PMNs are active specifically during forward locomotion or backward locomotion
(Kohsaka et al., 2014; Heckscher et al., 2015; Fushiki et al., 2016; Hasegawa et al., 2016;
Takagi et al., 2017; Carreira-Rosario et al., 2018; Kohsaka et al., 2019). Yet a comprehensive map
of the activity and connectivity of the PMN-MN-muscle network, which is essential for a full under-
standing of how locomotor behavior is generated, remains unknown.
Here, we address the question of how the same MNs and muscles generate two distinct behav-
iors: forward and backward locomotion. There are multiple mechanisms that could generate differ-
ent forward and backward locomotor behaviors. (1) Forward and backward locomotion may use the
same intrasegmental contraction patterns, and only the direction of the wave changes. (2) Different
muscles/MNs could be used in each behavior. (3) One or more muscles/MNs may show a different
Zarin et al. eLife 2019;8:e51781. DOI: https://doi.org/10.7554/eLife.51781 2 of 34
Research article Neuroscience

1
23
12
24 822215
18
11
19
20
4
3
10
2
9
29
27
26
28
17
16
15
25
7
6
13
1
23
12
24 822215
18
11
19
20
3
10
2
9
29
27
26
17
16
15
25
14
30
13
14
DL
A
B Internal view External view Spatial
muscle
group
VL
VO
LT
VA
DO
A1 A2 A3 A4 A5 A6 A7 A8/9
VNCbrain
T2 T3
muscle contraction wave (forward)
muscle contraction wave (backward)
4
* *
Figure 1. Schematic depiction of the larval neuromuscular system. (A) Drosophila larva contain three thoracic and nine abdominal segments, the
muscles of which are innervated by MNs located in the corresponding thoracic and abdominal segments of the CNS. (B) Schematic of the 29 muscles of
abdominal segments (A1) from internal and external view. Segments A2-A6 are similar to A1, with the exception that they have a muscle 25 (dashed
line, asterisk) here overlaid on the A1 muscle pattern.
Zarin et al. eLife 2019;8:e51781. DOI: https://doi.org/10.7554/eLife.51781 3 of 34
Research article Neuroscience

Table 1. Motor neurons present in the CATMAID reconstruction.
All MNs were identified in the first abdominal segment on both left and right sides, with the exception of MN25 which is not present
in A1 and thus annotated in A2. See text for abbreviations.
Spatial muscle group NerveMotor neurons(synonyms)
Target muscles(synonyms)
SynapseType
DL ISNDM MN1 (aCC) 1 (DA1) Ib
DL ISNDM MN2 (U3) 2 (DA2) Ib
DL ISNDM MN3 (U4) 3 (DA3) Ib
DL ISNDM MN4 (U5) 4 (LL1) Ib
DL ISNDM MN9 (U1) 9 (DO1) Ib
DL ISNDM MN10 (U2) 10 (DO2) Ib
DO ISNL MN11 11 (DO3) Ib
DO ISNL MN19 19 (DO4) Ib
DO ISNL MN20 20 (DO5) Ib
DO SNa MN5 (LO1) 5 (LO1) Ib
VL ISNb MN6/7 (RP3) 6/7 (VL3/VL4) Ib
VL ISNb MN12 (V-MN) 12 (VL1) III
VL ISNb MN13 (MN-VL2) 13 (VL2) Ib
VL ISNb MN14 (RP1) 14 (VO2) Ib
VL ISNb MN30 (RP4) 30 (VO1) Ib
VA SNc MN26 26 (VA1) Ib
VA SNc MN27 27 (VA2) Ib
VA SNc MN29 29 (VA3) Ib
VO ISNd MN15/16 (MN-VO4/5) 15/16 (VO4/VO5) Ib
VO ISNd MN15/16/17 (MN-VO4-6) 15/16/17 (VO4/VO5/VO6) Ib
VO ISNb MN28 28 (VO3) Ib
T SNa MN8 (SBM) 8 (SBM) Ib
T SNa MN21/22 (LT1/LT2) 21/22 (LT1/LT2) Ib
T SNa MN22/23 (LT2/LT3) 22/23 (LT2/LT3) Ib
T SNa MN23/24 (LT3/LT4) 23/24 (LT3/LT4) Ib
T ISNL MN18 18 (DT1) Ib
T TN MN25 (VT1) 25 (VT1) Ib
Broad ISNDM MNISN (RP2) 1/2/3/4/9/10/11/[18]/19/20 (DA/DO) Is
Broad ISNb MNISNb/d (RP5) 6/7/12/13/14/15/16/30 (VL/VO) Is
Broad SNa MNSNa-II (VUM) 21/22/[23/24/25] (LT) II
Broad ISNDM MNISN-II (VUM) 1/2/3/4/9/10/11/18/19/20 (DA/DO) II
Broad ISNb MNISNb/d-II (VUM) 12/13/14/15/16/17/30 (VL/VO) II
Zarin et al. eLife 2019;8:e51781. DOI: https://doi.org/10.7554/eLife.51781 4 of 34
Research article Neuroscience

time of recruitment in each behavior. (4) PMNs or MNs could have asymmetric morphology along
the anteroposterior body axis, resulting in a different time of recruitment in each behavior. (5) One
or more PMNs could be active only in forward or backward locomotion, changing the phase relation-
ship of their target MNs. Here we use pan-muscle activity imaging, comprehensive TEM reconstruc-
tion of all MNs and well-connected PMNs, functional optogenetics, and development of a recurrent
network model to sequentially test each of these hypotheses.
Results
All body wall muscles are activated during forward and backwardlocomotionIntrasegmental differences between forward and backward locomotion could be due to recruitment
of different muscles for each behavior, or changes in the timing of muscle recruitment. To distinguish
between these mechanisms, we performed ratiometric calcium imaging to map the activation onset
of each body wall muscle during forward and backward locomotion. To date only muscle contraction
data have been reported, not muscle activity data, and only for five of the 30 body wall muscles (5,
9, 12, 21, and 22), showing that individual longitudinal muscles contract prior to individual transverse
muscles during forward locomotion (Heckscher et al., 2012; Zwart et al., 2016). Muscle contraction
could occur passively due to biomechanical linkage between adjacent muscles, so it may not be a
perfect substitute for directly measuring muscle activity. Conversely, elevated GCaMP fluorescence
may be insufficient to trigger muscle contraction, but it is a better proxy for monitoring excitatory
inputs than is muscle contraction.
Here, we used GCaMP6f/mCherry live imaging to measure the activation time of individual body
wall muscles in the abdominal segments during forward and backward locomotion. We expressed
GCaMP6f and mCherry using the muscle line R44H10-LexA, which has variable expression in sparse
to dense patterns of muscles. For this experiment we analyzed larvae with dense muscle expression.
We imaged both forward and backward locomotion in 1 st and 2nd instar larvae (a representative
animal shown in Figure 2A,D). We found that an increased GCaMP6f signal correlated with muscle
contraction during both forward and backward locomotion (representative examples of muscle 6
shown in Figure 2B,E). Most importantly, all imaged muscles showed a significant rise in GCaMP6f
fluorescence during forward and backward locomotion (Figure 2C,F; Videos 1 and 2). In addition,
because each type Ib MN typically innervates a single muscle, we can use muscle depolarization as a
proxy for the activity of its innervating MN. We conclude that all MNs and their target muscles are
activated during forward and backward locomotion.
A small number of muscles are differentially recruited during forwardand backward locomotionAll muscles are recruited in both forward and backward locomotion, leading to the hypothesis that
any possible difference in forward and backward locomotion should result from different muscle
recruitment times. If so, we predicted VO and DO muscles to behave differently in forward versus
backward, because they have asymmetric localization along the anteroposterior axis (Figure 1). To
test this hypothesis, we embedded the multidimensional crawl cycle data in two-dimensional space
using principal component analysis (PCA)(Lemon et al., 2015). We aligned crawl trials by finding
peaks in this 2D space which corresponded to the highest contraction amplitude of the most
muscles in a given crawl (Figure 3—figure supplement 1). Muscle activity appeared as a continuum
with the sequential recruitment of individual muscles, yet hierarchical clustering of the mean activity
of each muscle during forward and backward crawling revealed four groups of co-active muscles for
both behaviors (Figure 3A–E; Table 2). We call these co-activated muscle groups F1-F4 for forward
and B1-B4 for backward crawling. Overall, we analyzed 27 muscles during forward locomotion and
25 muscles during backward locomotion (the missing muscles were too tightly packed to extract
clear activity profiles). The activation time of each co-activated muscle group was more coherent
than the time of their inactivation (Figure 3B–E). Notably, these co-activated muscle groups do not
fully match previously identified spatial muscle groups (compare Figures 1B and 3F,G).
We found that the largest change in recruitment time between forward and backward locomotion
was in six muscles: the three muscles in the VO spatial muscle group (muscles 15–17), and muscles 2,
Zarin et al. eLife 2019;8:e51781. DOI: https://doi.org/10.7554/eLife.51781 5 of 34
Research article Neuroscience

Figure 2. All body wall muscles are utilized during forward and backward locomotion. (A,D) Sequential images of
muscle GCaMP6f DF/F signal during forward (A) or backward (D) locomotion. GCaMP6f levels were normalized to
mCherry. Anterior to left, dorsal up; time in seconds. Genotype: GMR44H10-LexA lexAOP-GCaMP6f; -LexA
lexAOP–mCherry. Arrowheads mark the same segment at each timepoint; A2 in (A) and A4 in (D). (B,E) Mean
Figure 2 continued on next page
Zarin et al. eLife 2019;8:e51781. DOI: https://doi.org/10.7554/eLife.51781 6 of 34
Research article Neuroscience

11, and 18 (each in a different spatial muscle group) (Figure 3H,I; Figure 3—figure supplement 2).
The VO spatial muscle group (muscles 15–17) switched from late activity during forward locomotion
(F3) to early activity during backward locomotion (B1), whereas the three other neurons switched
from early activity during forward locomotion (F1/2) to late activity during backward locomotion (B3/
4) (Figure 3H,I). Other spatial muscle groups typically did not change their timing of activation;
for example longitudinal muscles tended to be active early and transverse muscles activated late in
both behaviors (Figure 3F,G), consistent with prior reports tracking single muscles within each
group (Heckscher et al., 2012; Zwart et al., 2016). We conclude that differences between forward
and backward locomotor behaviors may arise from the relatively small number of MN/muscles that
show differential recruitment during each behavior. Our results raise two new questions. (1) What
mechanisms produce co-active muscle groups? (2) What mechanism produce the differential timing
of the VO and 2/11/18 muscles in forward and backward locomotion? Answering these questions
will help determine how the same MNs and muscles can generate two different locomotor
behaviors.
TEM reconstruction of motor neurons in A1 segmentTo understand how motor patterns are generated, it is essential to map connectivity from muscles
to MNs, and from MNs to PMNs. In this section, we fully reconstruct all 31 MNs in segment A1, and
below we fully reconstruct 118 PMNs providing input to these MNs. These data on neuronal mor-
phology, synapse localization, and connectivity will generate testable hypotheses for how different
motor behaviors are generated.
To date, only less than half of the 31 abdominal MNs have been fully reconstructed at synapse
level resolution (1, 5, 6/7, 9,10,18, 21/22, 22/23, 23/24, 30, MNISN, and MNISNb/d)
(Heckscher et al., 2015; Fushiki et al., 2016; Schneider-Mizell et al., 2016; Zwart et al., 2016;
Takagi et al., 2017; Carreira-Rosario et al., 2018; Kohsaka et al., 2019). Here, we identify, com-
prehensively reconstruct, and map dendritic postsynaptic sites for all remaining A1 MNs, which can
be used as a proxy for other abdominal segments. We reconstructed 16 pair of type Ib MNs, includ-
ing MNs innervating muscles that are differentially active in forward versus backward locomotion
(Figure 4, red outlines). We identified one pair
of type III MNs that target muscle 12, and the
three unpaired midline octopaminergic MNs
(VUMs) (Figure 4; Table 1). In subsequent analy-
ses, we did not include the neuromodulatory
VUM MNs due to their relatively undifferentiated
state (few postsynapses). In addition to the two
previously identified Is MNs (MNISN and
MNISNb/d), the presence of yet another type Is
MN has been suggested (Hoang and Chiba,
2001), but we did not find it in the TEM volume;
it may be late-differentiating or absent in A1.
We linked all bilateral MNs in the TEM volume
to their muscle target by matching the dendritic
morphology in the EM reconstruction to the
dendritic morphology determined experimen-
tally (Landgraf et al., 1997; Landgraf et al.,
2003; Mauss et al., 2009) (Figure 4; Figure 4—
figure supplement 1; Table 1). A dataset of all
Figure 2 continued
calcium transient (blue) vs mean muscle length (red) measurements for muscle six during forward (B) or backward
(E) locomotion. N = 3 segments. T0 was set as the point of maximum contraction as determined by muscle length
for each crawl. Shaded bars represent standard deviation. (C,F) All observed muscles show calcium transients
greater than 100% DF/F during forward (C) or backward (F) locomotion. Each dot represents the maximum GCaMP
DF/F signal in the indicated muscle during a single crawl, normalized to mCherry. Error bars represent standard
deviation. Muscle names as in Figure 1.
Video 1. GCaM6f muscle activation during forward
locomotion in a Drosophila second instar larva.
Dorsolateral view; anterior left.
https://elifesciences.org/articles/51781#video1
Zarin et al. eLife 2019;8:e51781. DOI: https://doi.org/10.7554/eLife.51781 7 of 34
Research article Neuroscience

MNs that can be opened in CATMAID
(Saalfeld et al., 2009) is provided as
Supplementary file 1. Note that the transverse
nerve MN (MN25-1b) is only present in the A2-
A7 segments (Hessinger et al., 2017), so we
traced it in A2. We found that all MNs had a
dense array of postsynapses on their dendritic
projections, but unlike C. elegans (Wen et al.,
2012), we observed no presynaptic contacts to
other MNs or interneurons (Figure 4—figure
supplement 1). In conclusion, we have success-
fully identified and reconstructed, at single syn-
apse-level resolution, all differentiated MNs in
segment A1 of the newly hatched larval CNS.
This is a pre-requisite for mapping the location
of postsynaptic sites, as well as for mapping
PMN-MN connectivity (below).
Co-active motor neurons havedispersed postsynaptic sites within
the dorsal neuropilMotor neurons innervating a single spatial muscle group target their dendrites to a similar region of
the neuropil, creating a myotopic map in the neuropil (Landgraf et al., 2003; Mauss et al., 2009).
Here we validate this conclusion at the level of postsynapse neuropil localization, and determine
whether similar clustering is found for MNs in a co-active muscle group. To begin, we calculated
pairwise synapse similarity scores (Schlegel et al., 2016) for MNs in the left and right A1 hemiseg-
ments and observed highly similar postsynapse clustering within the neuropil volume (Pearson corre-
lation coefficient, r = 0.97), which we averaged for subsequent analysis. This validated the quality
and reproducibility of the MN dendritic synapse data and highlighted the stereotypy of MN postsyn-
aptic locations in the neuropil. Next, we performed unbiased clustering of MNs based on postsynap-
tic synapse similarity, and found a highly ordered hierarchical relationship between postsynapse
localization and innervation of spatial muscle groups (Figure 5A). We also found that MNs innervat-
ing each spatial muscle group have different postsynaptic distributions along two axes (two sample
Kolmogorov-Smirnov test; p<0.05) (Figure 5B). Our data strongly support and extend prior work
showing that MNs innervating spatial muscle groups form a myotopic map in the neuropil, providing
a first layer of functional organization of the motor neuropil.
Next we asked: do co-active MNs generate a ‘co-active’ neuropil map? Interestingly, MNs inner-
vating each forward or backward co-active muscle group had distinct postsynapse density maxima
along the mediolateral axis, and often along a second axis (either dorsoventral or anterioposterior)
(Figure 5C,D arrowheads). Although the maxima are different along each axis, there is considerable
overlap, such that there are only a few regions of unique postsynapse targeting (Figure 5C,D aster-
isks). We conclude that there is an ordered distribution along the mediolateral axis of postsynapses
from MNs that innervate distinct forward or backward co-active muscles. Whether these distinct
maxima or unique neuropil locations of MN postsynapses are functionally important for generating
locomotor behavior remains a question for future functional studies.
We next addressed the question of how specific muscles can be recruited at different times dur-
ing forward and backward locomotion, as seen for muscles 2, 11, 18, and the three VO muscles. We
first ask whether each of the MNs innervating these six muscles target their postsynapses to a differ-
ent region of the neuropil compared to the surrounding neurons in the same co-active muscle
group. There are single MNs innervating each of the muscles 2, 11, and 18 (MN2, MN11, MN18);
and two MNs innervating the three VO muscles (MN15/16, MN15/16/17). We found that MNs inner-
vating muscles 11, 18 and the VOs each targeted postsynapses to a unique region of the neuropil.
The VO MNs have a medial postsynaptic distribution not seen in other neurons in the same co-active
muscle group (Figure 5E); MN11 has a synapse localization maxima that is distinct from other co-
active neurons (Figure 5F); and MN18 has a posterior postsynaptic distribution not seen in other co-
active neurons (Figure 5G). In contrast, MN2 did not have a distinct distribution in any axis
Video 2. GCaM6f muscle activation during backward
locomotion in a Drosophila second instar larva.
Dorsolateral view; anterior left.
https://elifesciences.org/articles/51781#video2
Zarin et al. eLife 2019;8:e51781. DOI: https://doi.org/10.7554/eLife.51781 8 of 34
Research article Neuroscience

Figure 3. Larval body wall muscles form four co-activated muscle groups during forward and backward locomotion. (A) Hierarchical clustering of mean
activity for all observed muscles yields four co-activated muscle groups during forward locomotion (F1–F4) and a different group of four during
backward locomotion (B1–B4). Heatmaps represent the mean range-normalized calcium activity of each muscle (n > 3 crawl bouts for each muscle, with
a total of 337 individual muscles analyzed across 23 crawls for forward and 188 individual muscles analyzed across 14 crawls for backward locomotion).
Muscles 6/7 are grouped because they are both innervated by the same MN. Clustering was performed only on the first half of the crawl cycle to
determine the onset time for each co-activated muscle group. Cluster number was determined by visual inspection of the dendrogram as well as the
gap-criterion optimal cluster number. (B,D) Plots of average muscle activity for muscles in each forward or backward co-activated muscle group. Error
bars represent the standard deviation of individual muscles. (C,E) Plots of average forward or backward co-activated muscle group activity timing. Error
bars represent the standard deviation of the average muscle activity of each muscle in a given co-activated muscle group. Dotted lines represent the
average muscle activity for each muscle in a given co-activated muscle group. Red line along the x-axis represents the fraction of the crawl cycle that
was used for clustering. (F,G) Schematic representation of the co-activated muscle group for forward or backward locomotion. (H) Plots of muscles that
are differentially active during forward or backward crawling. For forward panels, the gray trace represents the mean calcium activity of all muscles
during a forward crawl, while the blue trace represents the activity of the indicated muscle. For backward panels, the gray trace represents the mean
calcium activity of all muscles during a backwards crawl, while the red trace represents the mean calcium activity of the indicated muscle. Error bars
represent standard deviation. Dotted red line marks t = 25 (normalized time). Arrows represent the normalized DF/F of the two traces at t = 25. (I)
Heatmap illustrating differential activity of muscles during forward versus backward crawling. Blue, or positive values indicate a given muscle is active
earlier during forward crawling, while red or negative values indicate a given muscle was active earlier during backward crawling.
The online version of this article includes the following figure supplement(s) for figure 3:
Figure supplement 1. PCA-based alignment of crawl cycles.
Figure 3 continued on next page
Zarin et al. eLife 2019;8:e51781. DOI: https://doi.org/10.7554/eLife.51781 9 of 34
Research article Neuroscience

(Figure 5H), showing that differential recruitment can occur despite the intermingling of postsynap-
ses with other MNs in the same co-active group. We conclude that differential MN postsynaptic
localization is not required for generating differential muscle recruitment; and that MN postsynapse
localization alone is insufficient to explain differential muscle recruitment. A full understanding
requires characterization of PMN-MN connectivity.
TEM reconstruction of 118 premotor neurons reveals premotor neuronpools targeting each group of co-active motor neuronsThere are two hypotheses for how co-active MNs are recruited. Each pool of co-active MNs may be
innervated by a distinct pool of PMNs (labeled line), or alternatively each pool of co-active MNs may
be innervated by different combinations of PMNs (combinatorial code). To distinguish between
these models, we identified and reconstructed all PMNs in the TEM volume with dense monosynap-
tic contacts to A1 MNs. The names of each premotor neuron along with previously published syno-
nyms is given in Supplementary file 2. This included local premotor neurons with somata in A1 as
well as neurons from adjacent segments with dense connectivity to A1 MNs. PMNs were identified
by contributing greater than 1% (and >4 synapses) of the total input onto a given MN (Figure 6—
figure supplement 1; see Materials and methods for additional PMN selection criteria). We identi-
fied 118 bilateral PMNs (236 total) with connectivity to A1 MNs (Table 3; see Materials and methods
for selection criteria).
As this is the first comprehensive characterization of larval PMNs, we first quantified key features
of this population. The morphology of each of the 118 pair of PMNs is shown in Figure 6—figure
supplement 2. We found that PMN presynapses were enriched in the dorsal neuropil, as expected,
and PMN postsynapses were distributed throughout the neuropil (Figure 6A,B). Each PMN syn-
apsed with an average of 8.0 MNs (Figure 6C), while each MN received input from an average of
32.5 PMNs (Figure 6D). PMNs made 7495 synapses on A1 MNs, which accounted for 12.7% of PMN
output and 76% of the total A1 MN input (excluding A2 MN-25) (Figure 6E,F). The fraction of total
PMN to A1 MNs was highly variable, with some PMNs having as little of 0.6% of their output onto
A1 MNs while others had as much as 99.6% (Figure 6E). Conversely, MNs received 59.6% to 97.9%
of their total inputs from these 118 PMN pairs (excluding RP3 which has most of its postsynapses
anterior to A1) (Figure 6F). In addition, most PMNs projected contralaterally, had local arbors, and
had postsynaptic inputs on their more proximal processes (Figure 6G–I). Neurotransmitter
Figure 3 continued
Figure supplement 2. Muscles recruited at similar and different phases of the forward and backward crawl cycle.
Table 2. Co-activated muscle groups during forward or backward locomotion.
There are four co-activated muscle groups during backward and forward locomotion, but the muscles
in each group differ in forward versus backward locomotion. Note that backward locomotion is not
simple a reverse of the pattern seen in forward locomotion. This represents the most common activa-
tion sequences, although there is some variation, particularly during the fastest locomotor velocities.
Forward Co-activated muscles
F1 2,6,10,11,14,30
F2 3,4,5,9,12,13,18,19,25,26,29
F3 1,8,15,16,17,20,28
F4 21,22,23
Backward Co-activated muscles
B1 10,15,16,17
B2 1,3,4,6,9,12,13,28
B3 2,5,8,19,20,26,29
B4 11,18,21,22,23,24
Zarin et al. eLife 2019;8:e51781. DOI: https://doi.org/10.7554/eLife.51781 10 of 34
Research article Neuroscience

MN9 (U1) MN10 (U2) MN11 MN19
MN20 MN1 (aCC) MN2 (U3) MN3 (U4)
MN4 (U5) MN13 (MN-VL2) MN6/7 (RP3) MN30 (RP4)
MN14 (RP1) MN28 MN15/16 (MNVO4/5) MN15/16/17 (MNVO4-6)
D
A CB posterior viewdorsal view
Figure 4. Identification of all motor neurons in segment A1 in the TEM volume. (A) Dorsal view of the TEM reconstruction of the L1 CNS (gray shading)
showing all bilateral MNs in A1 reconstructed at single synapse level. The one intersegmental dendrite is from RP3 in A1; it is not observed in other
abdominal segments. (B) Dorsal view of centered on the A1 segment; midline, arrowhead. MNs are color-coded as in Figure 1A: DL MNs (red), DO
MNs (light red), VL MNs (light blue), VO MNs (dark blue), LT MNs (black), VA MNs (gray). (C) Posterior (cross-section) view of the neuropil (outlined) and
Figure 4 continued on next page
Zarin et al. eLife 2019;8:e51781. DOI: https://doi.org/10.7554/eLife.51781 11 of 34
Research article Neuroscience

expression is known only for a subset of PMNs (Supplementary file 3), so we screened for Gal4 lines
with sparse expression patterns, performed MultiColorFlpOut (Nern et al., 2015) to match their
morphology to individual PMNs, and mapped neurotransmitter expression (Figure 6J,
Supplementary file 3). A file that can be opened in CATMAID showing all 118 bilateral PMNs is pro-
vided as Supplementary file 4. In conclusion, we have identified a large majority of the PMN inputs
to the MN population in segment A1, and mapped neurotransmitter expression for the majority of
these PMNs.
Following our characterization of the PMN population, we next asked whether there are PMNs
dedicated to innervating individual spatial or co-active MNs, or MNs differentially recruited during
forward and backward locomotion. We identified PMNs innervating MNs of a single spatial muscle
group (Figure 7A), as well as PMNs specifically innervating MNs in a single forward or backward co-
active muscle group (Figure 7B,C, Figure 7—figure supplement 1). We found that 30 of the 118
PMNs innervated MNs in a single spatial muscle group (Figure 7D). Interestingly, a similar numbers
of PMNs innervated MNs in a single co-active muscle group (Figure 7E,F). Thus, we have identified
groups of PMNs that specifically innervate co-active MNs, consistent with a ‘labeled line’ model for
generating motor output, yet we note that the majority of PMNs innervate MNs in multiple spatial
or co-active muscle groups. Our data are consistent with both labeled line and combinatorial codes
for driving co-active motor neuron output; functional studies will be necessary to determine their rel-
ative importance.
Next we examined the five MNs that showed differential recruitment during forward versus back-
ward locomotion (MNs 2, 11, 18, and two VOs), to see if they were selectively innervated by ‘labeled
lines’ of PMNs. We found that all PMNs innervate multiple MNs, and there is no evidence for specific
PMNs innervating specific MNs, whether they are differentially recruited or not (Figure 7G). We con-
clude that PMN combinatorial coding is likely to generate the observed MN differential recruitment
during forward and backward locomotion.
Lastly, we tested whether our connectomic data could be used to predict the timing of MN
recruitment. We found that the PMN A27h (Figure 7H) is strongly connected to MNs in co-active
group F3 (Figure 7H’), so we asked whether A27h was recruited after the U1-U5 MNs in co-active
groups F1/F2. Indeed, dual color calcium imaging showed that the F1/F2 MNs were active prior to
the F3 PMN A27h (Figure 7H’’). These results support the use of connectivity to predict MN recruit-
ment times.
Neuronal asymmetry may generate different muscle recruitment timesduring forward and backward locomotionAsymmetric dendrite morphology can be an important determinant of neuronal function, such as in
the direction-selective T4/T5 neurons in the adult visual system (Fisher et al., 2015). Similarly, den-
dritic asymmetry along the anteroposterior axis may help generate temporally distinct recruitment
that we observe during forward and backward locomotion. We examined the morphology of differ-
entially recruited MNs and found that MN18, but not the others, is highly asymmetric (Figure 8A–E).
The asymmetric distribution of postsynaptic sites on MN18 should lead to its earlier activation during
forward than backward locomotion. This is consistent with its activity pattern deciphered using mus-
cle calcium imaging during these behaviors (Figure 3). We also observed anterior/posterior asymme-
try in multiple PMNs. For example, A02i and A03a4 have axons extending 1–2 segments anterior of
the dendrites; A03a5 has axons projecting 1–2 segments posterior of the dendrites; whereas A03g
Figure 4 continued
cortex in A1. Note the MN dendrites target the dorsal neuropil. Dorsal, up; midline, arrowhead; neuropil border, dashed outline. (D) Representative
images showing the morphological similarity between MNs identified in vivo by backfills (Mauss et al., 2009) versus the most similar MN reconstruction
from the TEM volume. The top section in each panel shows the morphology of the MN dendrites based on in vivo backfills; used with permission); six
distinct Fas2 fascicles (three per hemisegment) are shown in white; midline, arrowhead. The bottom section shows MN dendrite morphology
reconstructed from the TEM volume in A1. MNs highlighted in red boxes show differential recruitment timing during forward versus backward
locomotion.
The online version of this article includes the following figure supplement(s) for figure 4:
Figure supplement 1. Reconstruction and identification of A1 MNs in the TEM volume.
Zarin et al. eLife 2019;8:e51781. DOI: https://doi.org/10.7554/eLife.51781 12 of 34
Research article Neuroscience
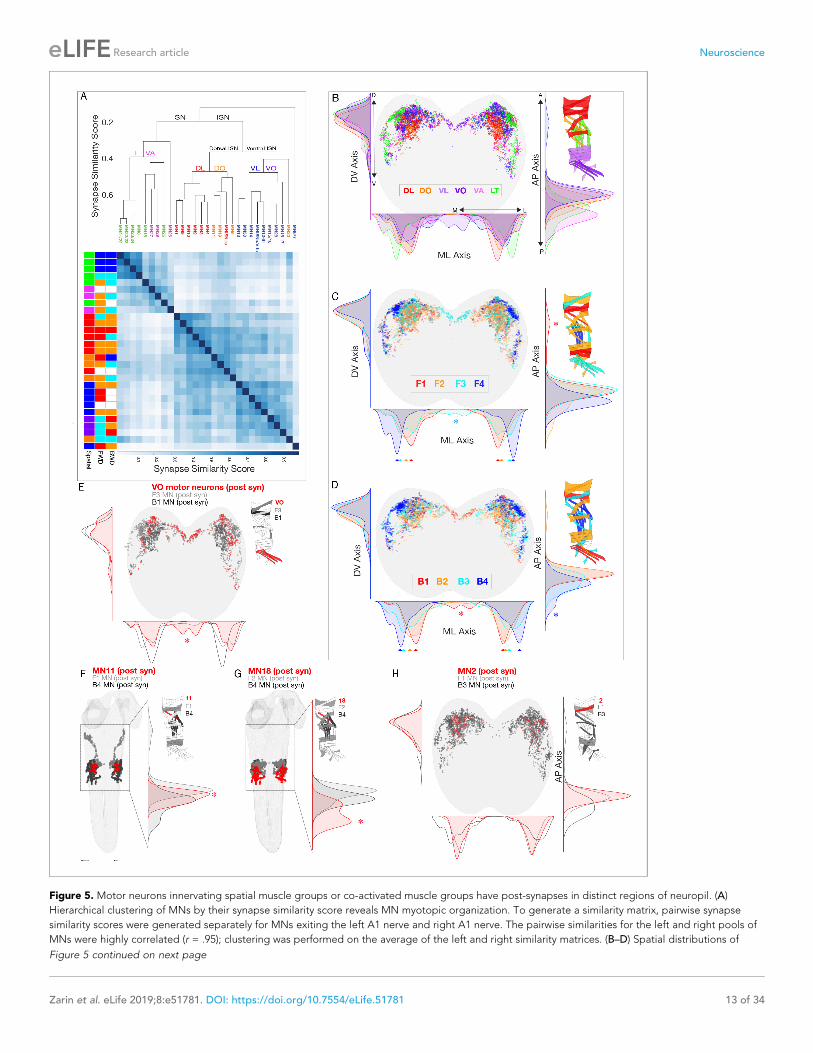
Figure 5. Motor neurons innervating spatial muscle groups or co-activated muscle groups have post-synapses in distinct regions of neuropil. (A)
Hierarchical clustering of MNs by their synapse similarity score reveals MN myotopic organization. To generate a similarity matrix, pairwise synapse
similarity scores were generated separately for MNs exiting the left A1 nerve and right A1 nerve. The pairwise similarities for the left and right pools of
MNs were highly correlated (r = .95); clustering was performed on the average of the left and right similarity matrices. (B–D) Spatial distributions of
Figure 5 continued on next page
Zarin et al. eLife 2019;8:e51781. DOI: https://doi.org/10.7554/eLife.51781 13 of 34
Research article Neuroscience

is a symmetric PMN (Figure 8F–H). Due to the opposite direction of wave propagation in backward
and forward locomotion, the asymmetric PMNs are likely to contribute to the differential MN/muscle
recruitment in forward and backward locomotion.
A recurrent network model that generates the observed forward andbackward pattern of muscle activityRecurrent interactions among PMNs have been shown to control the timing of the muscle outputs of
central pattern generator circuits in a variety of organisms (Marder and Bucher, 2001; Grill-
ner, 2003). We hypothesized that these types of interactions are responsible for the timing of mus-
cle activation during Drosophila larval forward and backward crawling. To assess whether the
reconstructed PMN connectome is capable of producing the observed timing of MN/muscle activa-
tion, we developed a recurrent network model of two adjacent segments. Previous models have
focused on wave propagation during forward and backward crawling by modeling the average activ-
ity of excitatory and inhibitory subpopulations in each segment (Gjorgjieva et al., 2013;
Pehlevan et al., 2016). Access to the detailed connectivity of PMNs and MNs (Supplementary file
5 and Supplementary file 6), as well as knowledge of the activation patterns of different co-acti-
vated muscle groups, allowed us to develop a substantially more detailed model whose circuitry was
constrained to match the TEM reconstruction. For PMNs whose neurotransmitter identity we could
determine, we also constrained the signs (excitatory or inhibitory) of connection strengths in the
model. The firing rates of PMNs and MNs were modeled as simple threshold-linear functions of their
synaptic inputs, and model parameters were adjusted to produce target MN patterns of activity that
matched the sequences identified during forward and backward crawling. These patterns were
assumed to be evoked by external command signals, representing descending input to the PMNs,
that differed for forward and backward crawling but did not themselves contain information about
the timing of individual muscle groups. We also constrained the activity of two PMNs, A18b and
A27h, that are known to be specifically active during backward and forward locomotion, respectively
(Fushiki et al., 2016; Carreira-Rosario et al., 2018). We found that, although the connectivity
among PMNs within a segment is sparse (roughly 7% of all possible pairwise connections), the
observed connections are nonetheless sufficient to generate appropriately timed MN activity for the
two distinct behaviors (Figure 9A,B; Figure 9—figure supplement 1). As has been described previ-
ously in other pattern-generating systems (Prinz et al., 2004), there is a space of models that is
capable of producing the observed activity. We therefore analyzed the activity of neurons in an
ensemble of models. In the models, distinct sequences of PMN activity for forward and backward
locomotion tile the period of time over which MNs are active (Figure 9C; Figure 9—figure supple-
ment 1). These sequences give rise to the distinct timing of MN activation during each behavior.
We used knowledge about the differential recruitment of two PMNs, A27h and A18b, to con-
strain our model. It is interesting to ask whether this constraint is required, or whether connectivity
alone reveals this selectivity. When we constructed models lacking a penalty that enforces selective
activation of these two neurons, we found that only A27h retained its selectivity (Figure 9—figure
supplement 2). This suggests that the PMN-MN connectome is insufficient to capture the selectivity
of A18b to backward locomotion, which is consistent with a recent study that showed that it could
be activated by a descending neuron (not part of our analysis) specifically during backward locomo-
tion (Carreira-Rosario et al., 2018). Characterizing and incorporating this descending circuitry will
be important to refine future models.
Next we asked if the sequences of PMN activity predicted by the model are consistent with prior
experimentally determined activity patterns. In our model, the PMN A14a is active at F1 and is inac-
tive at F4 (Figure 9C). Similarly, experimental data show that A14a is inhibitory and is active during
co-activated muscle group F1; and blocking A14a activity removes the contraction delay between
muscles in co-activated muscle group F1 and F4 (Zwart et al., 2016), thereby validating our model.
In our model, the PMNs A18b3 and A18a are both active during forward locomotion, but only A18a
Figure 5 continued
postsynaptic sites for the indicated spatial or co-active MNs. Plots are 1D kernel density estimates for the mediolateral (ML), dorsoventral (DV) and
anteroposterior (AP) axes. Asterisks, postsynapses from a single group that are enriched in a specific region of the neuropil. (E–H) Spatial distribution of
postsynapses for the differentially recruited MNs (red) compared to the MNs in their forward or backward co-active group (gray or black, respectively).
Zarin et al. eLife 2019;8:e51781. DOI: https://doi.org/10.7554/eLife.51781 14 of 34
Research article Neuroscience

Table 3. Premotor neurons innervating type Ib MNs Left column, spatial muscle groups named as in Figure 1.
Middle column, type Ib MNs innervating 1–3 muscles in each muscle group (synonym, parentheses); the immature neuromodulatory
VUMs are not shown. Right column, premotor interneurons innervating the indicated MNs. Premotor connectivity uncertain,
parentheses.
Muscleposition Motor Neurons Pre-Motor Neurons
DL MN1-Ib (aCC) A27h, A18a, A18b, A03g, A31k, A31b, A06e, A23a, A02h, A10e, A03a1, A03a3, A05k, A07f2, DLN2, TJPMNThoracic descending pre-longitudinals, T27Y, dsnPMN2, DLN1, A18neo.
DL MN2-Ib (U3) A01x2, A18a, A03a5, A31k, A31b, A23a, A02h, A03a3, A03a1, A10e, A10a , T27Y, dsnPMN2.
DL MN3-Ib (U4) A18a, A03a5 A03g, A31k, A31b, A06e, A02h, A02e, A02f, A03a3, A03a6, A03d/e, A03x-eghb, A07f2, A10a, A18neo.
DL MN4-Ib (U5) A03a5, A03g, A31k, A27l, A06l, A06m, A06g2, A02e, A02f, A03a6, A03a1, A03x-eghb, SePN02b, DLN2, Descending, preRP3, A18neo.
DL MN9-Ib (U1) A01x2, A18a, A31k, A31b, A06x1, A27l, A23a, A02m, A02n, A02h, A03a1, A03a3, A03x-eghb, A03xyz, A05k, DLN2,
DLN2, TJPMN, Tipsi, T27Y, dsnPMN2, DLN1, A18neo.
DL MN10-Ib (U2) A01x2, A18b, A08e1, A31k, A27j, A23a, A06a, A06x1, A02h, A02e, A02g, A10e, A03a1, A03a3, A03x, A03a4,
A03d/e, A03x-eghb, VLELX4, Tipsi, dsnPMN2, DLN2, DLN1, A18neo, A18c.
DO MN11-Ib A31k, A06x1, A23a, A06a, A27l, T03g2, A03a1, A03a3, A03x-eghb.
DO MN19-Ib A27k, A18j, A18b, A18b3, T01d2, A31k, A27j, A23a, A06a, A06l, A06x1, A02f, A03a1, A03a3, T27Y, dsnPMN2, A27neo.
DO MN20-Ib A27h, A18j, A01c1, T01d2, T01d4, A19l, A06e, A03d/e, A27neo, a14neo, A03xyz, A26f.
DO MN5-Ib (LO1) A18b3, A18b2, A23a, A03a1, A03a3, A03a4, VLELX4, T27Y.
VL MN6/7-Ib (RP3) A18b3, A03a5, A27l, A06l, A06e, A02g, A02e, A03a4, T06WW, T06PP, Descending pre RP3.
VL MN12-III (V-MN) A27h, A03a5, A03g, A02g, A02e A27l, A06l,, A06e A03a6, A03a4, A03d/e, DLN1, Descending pre RP3.
VL MN13-Ib (MN-VL2)
A27k, A03a5, A03g, A01d3, T01d4, A06l, A06a, A06e, A02g, A02e, A27l, A03a6, A03a4, A03x-eghb, A03d/e.
VL MN14-Ib (RP1) A27h, A18b2, A18b3, A27l, A06l, A02i, A03a4, A03a1, DLN1.
VL MN30-Ib (RP4) A18b3, A03a5, A01x2, A01d3,A01d4, A06e , A27l, A06l, A02g, A02e, A03a4, A03a6, A03x-eghb, A03d/e, A03SNC, A10a,A27Uniq, DLN1, A03xyz, SePN02b
VA MN26-Ib A27h, A01x3, A18f, A02j, A06e, A06l, A27l, T03g2, A03x-eghb, Descending neuron_SEZ, A03SNC, A03xKT, A03d/e, T11v,T27Y.
VA MN27-Ib A27h, A27k, A03g, A18j, A18f, A01x3, A01c1, A01c2, T01d2, T01d4, A06e, A06f, A19l, A14a, A31b, T03g2, A27n, A27neo,A03xKT, T11v, A26f.
VA MN29-Ib A01x3, A01x2, A01x3, T01d2, T01d4, A27l, A02g, A06e, T03g2, A27e2, A03a6, A03d/e, A10a, A27neo, T11v, A03SNC.
VO MN15/16-Ib A27h, A27k, A18b2, A06c, A06l, A06e, A02g, A02i, A03a6, DLN1.
VO MN15/16/17-Ib A27h, A03g, A06c, A06e, A27l, A02g, A02i, A01j, A27Uniq.
VO MN28-Ib A01x2, A27h, A18b2, A06c, A06l, A06e, A02g, A02i, A03a6.
T MN8-1b (SBM) A01c1, A01c2, A01d3, A27k, A03g, T01d1, A18j, A19l, A14a, A27n, A27e2, A27neo, A26f.
T MN18-Ib A01c1, A01c2, A01d3, A03g, A03o, A18j, A06a, A23a, A19l, A14a, A06x1, A02i, A01j, A27n, A10a, A10b, A27neo, T27Y,A26f.
T MN21/22-Ib (LT1/LT2)
A01c1, A01c2, A27k, A03g, A18j, A18b2, T01d1, T01d2, A19l, A14a, A02i,A02f, A03xKT, T27Y, TGun, A27n, A27neo, A26f.
T MN22/23-1b (LT2/LT3)
A01x, A01c1, A01c2, A27k, A03g, A09l, A18j, T01d1, T01d2, A01d3, A19l, A14a, A02f, A27n, A27neo, A27e2, T27Y, A26f.
T MN23/24-1b (LT3/LT4)
A27k, A18j, A03g, A01c1, A01c2, T01d1, T01d2, A01d3, A19l, A27n, A27neo, A26f.
T MN25-Ib (MN-VT1)
A01c1, A18a, A18b2, A18j, A18f, A27l, A14a, A19l, A02i, A31d, A03xKT, A05a.
DL/DO MNISN (RP2) A01x2, A18b, A03g, A31k, A27j, A27l, A02m, A02n, A02b, A06a, A23a, A03a1, A03a3, A03d/e, A03x-eghb, A05k, A10a,DLN2, DLN1, A18neo, dsnPMN2, SePN02b, T27Y, TJPMN, Projection neuron, A18c.
VL/VO MSNISNb/d(RP5)
A27h, A03a5, A06l, A06c, A06f, A02g, A02e, A02b, A03a4, A03a6, A03x-eghb, A03d/e, A19d, A27Uniq, DLN1, SePN02b.
Zarin et al. eLife 2019;8:e51781. DOI: https://doi.org/10.7554/eLife.51781 15 of 34
Research article Neuroscience

posterior
IG
A B
J
F F’E E’
D D’C’
Cholinergic Corazonin
GABAergic Unknown
Glutamatergic
Contralateral
Ipsilateral
Local
Intersegmental
H
Proximal post-syn
Distal post-syn
C
Presynapses
Postsynapses
A1
MN
PMN
mean: 8
MN
PMNmean: 32
average = 77%average = 18.9%
dorsal
ventral
anterior
PMN output to A1 MNs (% total)
0 100%80604020
MN input from PMN pool (% total)
0 100%80604020
Num
ber
of
PM
Ns
Num
ber
of
MN
sN
um
ber
of
MN
s
Num
ber
of
PM
Ns
Number of MNs Number of PMNs
5
0
10
15
20
25
5
0
10
15
20
25
50 10 15 20 25
20
0
40
60
80
100
20
0
40
60
80
100
10 50403020 60
10
0
20
30
40
50
70
60
erior
A1
Figure 6. Identification of 118 premotor neurons at synapse-level in the TEM volume. (A) Posterior (cross-section) view of the PMN pre-synapse location
(red) and postsynapse location (cyan) within the A1 neuropil. Density plots shown for the dorsoventral axis (left) and mediolateral axis (bottom). Dorsal,
up. (B) Dorsal view of entire larval neuropil to show anteroposterior distribution of presynapses (red) and postsynapses (cyan). Density plots shown for
the anteroposterior axis. (C–F) Quantification of PMN-MN connectivity. All A1 MNs, A2 MN-25, and 118 pair of PMNs were used to generate these
histograms. (C) PMNs innervate an average of 8 MNs. X-axis shows binned number of MNs receiving inputs from PMNs. Y-axis shows number of PMNs
in each bin (C’) Swarm-violin plot representation of the same dataset used in C. (D) MNs receive inputs from an average of 32.5 PMNs from this
population of PMNs. X-axis shows binned number of PMNs providing output to MNs. Y-axis shows number of MNs in each bin. (D’) Swarm-violin plot
representation of the same dataset used in D. (E) Histogram showing binned fraction of PMN output to MNs. Y-axis shows number of PMNs in each
bin. (E’) Swarm-violin plot representation of the same dataset used in E. (F) Histogram showing binned fraction of MN inputs from PMNs. Y-axis shows
number of MNs in each bin. (F’) Swarm-violin plot representation of the same dataset used in F. (G–J) Quantification of PMN morphology and
neurotransmitter expression. We did not assay Corazonin+ neurons for fast neurotransmitter expression, but a recent RNAseq study shows promiscuous
expression of fast neurotransmitters in Corazonin+ neurons (Brunet Avalos et al., 2019).
The online version of this article includes the following figure supplement(s) for figure 6:
Figure supplement 1. Pre-motor neuron/motor neuron synapse identification in the TEM volume.
Figure supplement 2. All premotor neurons traced in the TEM volume.
Zarin et al. eLife 2019;8:e51781. DOI: https://doi.org/10.7554/eLife.51781 16 of 34
Research article Neuroscience

BA CPMN- spatial muscle group PMN - FWD co-active group PMN - BWD co-active group
D
VAT DL DOVL VO F4 F3F1F2 B4B3 B1 B2
G
F1/F2 MNs are active before F3 PMN A27h
F1/F2 MNs
F3 PMN A27h
Figure 7
E F
1 2 3 4 5
A27h(posterior view)
A27h(dorsal view)
H
A27h
1633114
H’ H’’
F4 F3 F1F2
1 2 3 41 2 3 4
Figure 7. PMN pools preferentially connected to individual spatial muscle groups and co-activated muscle groups. (A–C) Hierarchical clustering of
PMNs based on their connectivity to type Ib MNs of the same spatial muscle group (A), forward co-activated muscle group (B), or backward co-
activated muscle group (C). Heat maps represent the sum of normalized weighted-synaptic output of a given left/right pair of PMNs onto left/right pair
of MNs grouped in each panel. Values in each row were normalized to sum to 1. (D–F) Quantification of connectivity between PMNs and type Ib MNs
Figure 7 continued on next page
Zarin et al. eLife 2019;8:e51781. DOI: https://doi.org/10.7554/eLife.51781 17 of 34
Research article Neuroscience

is active during backward locomotion (Figure 9C). Experimental data show that A18a and A18b3
Figure 7 continued
innervating spatial muscles (D), forward co-active (E), and backward co-active groups. PMN-MN connections with total weighted synapses of less than
1% were excluded from these analyses. (D) X-axis shows binned number of spatial muscle groups which receive inputs from PMNs. Y-axis shows
number of PMNs in each bin. While 30 PMNs connect to only one spatial muscle group, the rest of the PMNs connect to more than one groups. (E)
X-axis shows binned number of forward co-active groups which receive inputs from PMNs. Y-axis shows number of PMNs in each bin. While 32 PMNs
connect to only one forward co-active group, the rest of the PMNs connect to more than one groups. (F) X-axis shows binned number of backward co-
active groups which receive inputs from PMNs. Y-axis shows number of PMNs in each bin. While 32 PMNs connect to only one backward co-active
group, the rest of the PMNs connect to more than one groups. (G) Connectivity pattern of PMNs to differentially recruited MNs (11, 2, 18, and VOs)
versus other type Ib MNs (Other MNs). Heat maps represent the sum of normalized weighted-synaptic output of a given left/right pair of PMNs onto
left/right pair of MNs in each group. Values in each column were normalized to sum to 1. (H–H’’) A27h is active following MNs in forward co-active
groups F1/F2. (H) Morphology of the reconstructed A27h in segment A1 left and right, showing presynapses (red) and postsynapses (cyan). (H’) Pattern
of A27h connectivity showing preferential output to MNs active in co-active group F3. Hexagons represent MNs preferentially active in the F1-F4 co-
active groups. Muscles innervated by MNs targeted by A27h are shown. (H’’) Dual color calcium imaging of jRCaMP1b in A27h (green) and GCaMP6m
in U1-U5 MNs (black: MN2, MN3, MN4, MN9, MN10). Consistent with predictions from the connectome, U1-U5 MNs (co-activated muscle group F1/2)
are activated before A27h (co-activated muscle group F3). Green and dark error bars (ribbons) represent the standard deviation of the average
neuronal activity. Genotype: CQ-lexA/+; lexAop-GCaMP6m/R36G02-Gal4 UAS-jRCaMP1b.
The online version of this article includes the following figure supplement(s) for figure 7:
Figure supplement 1. Morphology and connectivity of premotor neurons innervating one or more co-active motor neurons (F1–F4).
MN18
A02i
BA
Asymmetric MN
F
MN2 MN11C MN15/16D MN15/16/17E
Asymmetric PMN morphology
A03a4G A03a5H A03gI
Symmetric MN morphology
Symmetric PMN
anterior posterior anterior posterioranterior posterioranterior posterioranterior posterior
anterior posterior anterior posterioranterior posterioranterior posterior
presynapses postsynapses
Figure 8. Neuronal asymmetry along the anterior-posterior axis. (A–E) MN18 has asymmetric dendrites extending to the next posterior segment, but
the dendritic arbors of other differentially recruited MNs (2, 11, 15/16, 15/16/17) were not asymmetric along this axis. (F–I) The PMNs A02i, A03a4 and
A03a5 have asymmetric dendrite projections to the anterior (F,G) or posterior (H) of their cell body and presynaptic domain, whereas A03g is an
example of a PMN that is symmetric along the anteroposterior axis.
Zarin et al. eLife 2019;8:e51781. DOI: https://doi.org/10.7554/eLife.51781 18 of 34
Research article Neuroscience

0 1 0 1 0 1
FWDcommandinput
BWDcommandinput
PMNs MNs
A2 segment
A1 segment
F1 F2 F3 F4
FWD
BWD
FWD
BWD
A B
Time (norm.)0 1
Time (norm.)
C
PM
N a
ctivity (
norm
.)
FWD
BWDA27h A18b3 A31k
A01c A14a A18j
A06l A23a A18a
B1B2 B3 B4
(exc.) (exc.)
(exc.)(exc.)
(exc.)
(inh.)
(inh.)
(inh.)(inh.)
Figure 9. Recurrent network model generating sequential MN activity. (A) The PMN and MN network of the A1
and A2 segments was modeled using connectivity taken from the TEM reconstruction. Connections within each
segment (light gray circles) are identical. The network was optimized using gradient descent to produce a
sequential pattern of activity in the MNs when a tonic external command input for forward (FWD, black) or
backward (BWD, red) locomotion was applied. (B) The network in A was optimized to produce an appropriate
sequential activity pattern of co-activated muscle groups during forward and backward crawling. The direction of
propagation from the posterior (A2) to anterior (A1) segment or vice versa differs for forward and backward
crawling. To compare PMN activity relative to MN activation, time is measured in units normalized to the onset
and offset of MN activity in a segment (bottom right). (C) Y-Axis is the normalized activity of a subset of PMNs in
the model during forward and backward crawling. Thick lines denote averages over the ensemble of models
generated. X-axis (time) is measured relative to A1 MN onset and offset as in B. Arrowheads denote the peak
activation onset time for the MNs innervating different co-activated muscle groups (color key as in panel B); exc,
excitatory; inh, inhibitory.
The online version of this article includes the following figure supplement(s) for figure 9:
Figure 9 continued on next page
Zarin et al. eLife 2019;8:e51781. DOI: https://doi.org/10.7554/eLife.51781 19 of 34
Research article Neuroscience

are active precisely as proposed in our model (Hasegawa et al., 2016). Furthermore, our model pre-
dicts the cholinergic A18j and A01c PMNs are active at F4, which is supported by experimental data
on these neurons (where they were called eIN1,2; Zwart et al., 2016).
To provide new, additional experimental tests of our model, we performed dual color calcium
imaging on previously uncharacterized GABAergic PMNs A31k and A06l. Our model predicted that
both A31k and A06l neurons show peak activity later than the early-activated MNs during both for-
ward and backward locomotion (Figure 9C; Figure 9—figure supplement 1). To determine experi-
mentally the phase-relationship between A31k and MNs, we expressed GCaMP6m in a subset of
MNs and jRCaMP1b in A31k. Dual color calcium imaging data revealed that the A31k activity peak
coincides with a decline of activity in MNs innervating early co-activated muscle groups during both
forward and backward locomotion (Figure 10A,B), further validating our model. Second, our model
predicts that both A31k and A06l PMNs show concurrent, rhythmic activity during forward and back-
ward locomotion (Figure 9—figure supplement 1). We expressed GCaMP6m in both neurons,
which we could distinguish based on their different axon projections, and found that they showed
concurrent, rhythmic activity (Figure 10C,D), and thus both neurons show a delayed activation rela-
tive to MNs. Our third experimental test focused on the GABAergic A23a PMN (Schneider-
Mizell et al., 2016). Our model predicts that A23a was active earlier during backward locomotion
than forward locomotion (Figure 9C). We expressed GCaMP6m in a subset of MNs and jRCaMP1b
in A23a, and validated the prediction of our model (Figure 10E,F).
We conclude that our model accurately predicts many, but not all, of the experimentally deter-
mined PMN-MN phase relationships (see Discussion). With the exception of C. elegans models
(Karbowski et al., 2008; Macosko et al., 2009; Wen et al., 2012; Izquierdo and Beer, 2013;
Izquierdo et al., 2015; Kunert et al., 2017; Rakowski and Karbowski, 2017), the networks con-
structed here represent the first models of the neural circuitry underlying a motor behavior whose
connectivity has been constrained by a synaptic wiring diagram. Prior studies of C. elegans have
highlighted the importance of proprioception in order to drive locomotion (Kunert et al., 2017),
while our model does not require proprioceptive input to generate the observed motor pattern,
consistent with data showing that an isolated CNS without sensory input (including no propriocep-
tion) can maintain forward and backward waves of motor neuron activity (Pulver et al., 2015). Our
study also includes stronger constraints on excitatory and inhibitory signaling, which are difficult to
infer in C. elegans (Rakowski and Karbowski, 2017).
Circuit motifs specific for forward or backward locomotionPMNs, in addition to connecting to MNs, make presynapses onto other neurons
(Supplementary file 6), generating circuit motifs that may play important roles during larval locomo-
tion. Interestingly, some of these PMNs are active only during forward or backward locomotion
(Fushiki et al., 2016; Carreira-Rosario et al., 2018; Kohsaka et al., 2019), indicating they may
change the dynamics of motor circuits during forward versus backward locomotion, resulting in dif-
ferent muscle activity patterns during forward or backward crawling. Here we used connectome and
neurotransmitter data to examine circuit motifs that include these direction-specific PMNs and asked
how they can contribute to the generation of different coactive muscle groups during forward and
backward locomotion.
The previously described forward-specific excitatory PMN A27h (Fushiki et al., 2016; Carreira-
Rosario et al., 2018), with F3 onset, connects to another forward-specific excitatory PMN A18b3
(Hasegawa et al., 2016) innervating F1-F2 MNs. Thus, when A27h activates F3, it also maintains
activity of A18b3 to ensure continued excitation of F1/F2 MNs (Figure 11A). These motifs provide
testable hypotheses for how specific phase relationships between co-activated muscle groups are
generated by PMNs. A27h also excites PMN A18b3 in the next anterior segment, which could
advance the intersegmental forward contraction wave; similarly, A18b3 excites two inhibitory PMNs
Figure 9 continued
Figure supplement 1. Recurrent network model of PMNs activity aligned to onset and offset of A1 MNs during
locomotion.
Figure supplement 2. Models constructed without constraints on the activity of A27h/A18b.
Zarin et al. eLife 2019;8:e51781. DOI: https://doi.org/10.7554/eLife.51781 20 of 34
Research article Neuroscience

A31k fires after F1/F2 MNs during FWD A31k fires after B1/B2 MNs during BWDA B
MNs
A31k
MNs
A31k
A31k and A06l fire in sync during BWDA31k and A06l fire in sync during FWDC D
A06l
A31k
A06l
A31k
A23a fires later during FWD than during BWD locomotion
E FWD MNs
A23a
BWDFMNs
A23a
Figure 10. Calcium imaging of A31k/A06l/A23a PMNs and their target MNs validates the activity pattern predicted by recurrent modeling. (A–B) Dual
color calcium imaging of jRCaMP1b in A31k (red) and GCaMP6m in MNs (black). Consistent with the recurrent model predictions, A31k fires with a
delay after its postsynaptic MNs in both forward (A) and backward (B) waves. Red and dark error bars (ribbons) represent the standard deviation of the
average neuronal activity. Genotype: CQ-lexA/+; lexAop-GCaMP6m/R87H09-Gal4 UAS-jRCaMP1b. (C–D) Single color calcium imaging of jRCaMP1b in
Figure 10 continued on next page
Zarin et al. eLife 2019;8:e51781. DOI: https://doi.org/10.7554/eLife.51781 21 of 34
Research article Neuroscience

Figure 10 continued
A31k (red) and A06l (black). Consistent with the recurrent model predictions, A31k and A06l show synchronous activity patterns during forward (C) and
backward waves (D). Red and dark error bars (ribbons) represent the standard deviation of the average neuronal activity. Genotype: R87H09-Gal4 UAS-
jRCaMP1b. (E,F) A23a fires later during forward locomotion than during backward locomotion. Dual color calcium imaging of jRCaMP1b in A23a (red)
and GCaMP6m in MNs (black). Red and dark error bars (ribbons) represent the standard deviation of the average neuronal activity. Genotype: CQ-lexA/
+; lexAop-GCaMP6m/R78F07-Gal4 UAS-jRCaMP1b.
B
Forward PMN-MN motifs
A
A18b3
F1/F2
A27h
F1-F3*
A18b2
F1-F4*
F3 F3/F4
A14a
A06cA18b3
F1/F2
A27h
F1-F3* B4
A18jA18j
A27kA01c1A01c2
B1/B2
A02e
Backward PMN-MN motifs
F4
A18j
F1-F3
A02e
A02g
A01d3 A01c1 A01c2
A18j A31k
C
B4
A27k
B1/B2
A02e A02g
D
E
excitatory PMN
inhibitory PMN
MN groups
A1
A1
A1
A1
A1A2
A2
A2
A2
A2
A3
T3
A02e
F1/F2MN groups
MN groups
MN groups
MN groups
PMNs
PMNs
PMNs
PMNs
PMNs
Figure 11. Neural circuit motifs specific for forward or backward locomotion. Circuit motifs composed of forward-specific PMNs (A–C) and backward
specific PMNs (D–E). See text for details. Arrow/green, excitatory connection; T-bar/red, inhibitory connection; F1-F4, forward co-active group; B1-B4,
backward co-active group. Thick outlines indicate forward-specific or backward-specific PMNs.
Zarin et al. eLife 2019;8:e51781. DOI: https://doi.org/10.7554/eLife.51781 22 of 34
Research article Neuroscience

(A06c, A14a) in the next anterior segment which may prevent premature activation of F3/4 MNs
(Figure 11B). Moreover, consistent with F1/F2 vs F3/F4 temporal segregation, A14a disinhibits F1/
F2 MNs via silencing A02e PMN (Figure 11B). Another forward-specific PMN (A01d3; also known as
ifb-FWD, Kohsaka et al., 2019), is also a component of feedforward excitation and feedforward inhi-
bition motifs that may temporally segregate F1-F3 from F4 coactive-muscle groups (Figure 11C).
Next, we examined circuit motifs composed of a backward-specific PMN, A27k (also known as
ifb-BWD) (Kohsaka et al., 2019). A27k excites B4 MNs as well as the inhibitory PMNs A02e and
A02g innervating B1/B2. This motif could coordinate excitation of B3/B4 MNs and termination of
B1/B2 MN activity as the contraction wave moves posteriorly (Figure 11D). A27k also synapses in
the next anterior segment with the excitatory neurons A01c1, A01c2, and A18j (innervating B4), as
well as with the inhibitory PMN A02e innervating B1/B2. This could coordinately terminate B1/B2
MN activity and activate B4 MN activity (Figure 11E). Thus, we identified both feedforward excita-
tion and feedforward inhibition motifs that could explain the sequential activation of a specific co-
activated muscle group in adjacent segments during backward motor waves. We conclude that cir-
cuit motifs composed of forward or backward specific PMNs are likely to be an additional mecha-
nism for generating distinct forward or backward coactivated muscle groups. Functional examination
of these motifs is beyond the scope of the current study.
DiscussionIt is a major goal of neuroscience to comprehensively reconstruct neuronal circuits that generate
specific behaviors, but to date this has been done only in C. elegans (Karbowski et al., 2008;
Macosko et al., 2009; Izquierdo and Beer, 2013; Izquierdo et al., 2015; Kunert et al., 2017;
Rakowski and Karbowski, 2017). Recent studies in mice and zebrafish have shed light on the over-
all distribution of PMNs and their connections to several well-defined MN pools (Eklof-
Ljunggren et al., 2012; Kimura et al., 2013; Bagnall and McLean, 2014; Ljunggren et al., 2014).
However, in mouse and zebrafish it remains unknown if there are PMNs that have yet to be charac-
terized, and the connectivity between PMNs is not well described, which would be important for
understanding the network properties that produce coordinated motor output. In the locomotor
central pattern generator circuitry of leech, lamprey, and crayfish, the synaptic connectivity between
PMNs or between PMNs and other interneurons is known to play critical roles in regulating the
swimming behavior (Brodfuehrer and Thorogood, 2001; Grillner, 2003; Kristan et al., 2005;
Mullins et al., 2011; Mulloney and Smarandache-Wellmann, 2012; Mulloney et al., 2014). How-
ever, it is difficult to be certain that all the neural components and connections of these circuits have
been identified. The comprehensive anatomical circuitry reconstructed in our study provides an ana-
tomical constraint on the functional connectivity used to drive larval locomotion; all synaptically-con-
nected neurons may not be relevant, but at least no highly connected local PMNs are absent from
our analysis.
Our results extend previous studies of Drosophila larval locomotion. Previous work has suggested
that several muscles recruited at different times during the crawl cycle receive input from distinct
populations of premotor neurons. For example, a recent study (Zwart et al., 2016) has shown that
the GABAergic A14a inhibitory PMN (also called iIN1) selectively inhibits MNs innervating muscle
22/LT2 (co-activated muscle group F4), thereby delaying muscle contraction relative to muscle 5/
LO1 (co-activated muscle group F2). While this model suggests a labeled-line mechanism, we also
find that A14a disinhibits MNs in early co-activated muscle groups F1/2 via the inhibitory PMN
A02e. Thus, A14a both inhibits late co-activated muscle groups and disinhibits early co-activated
muscle groups. In addition to A14a, we find that the majority of PMNs target populations of MNs
that span more than one co-active muscle group suggesting that sequential recruitment may primar-
ily arise from a combinatorial network of PMNs. In addition, previous work has suggested that all
MNs receive simultaneous excitatory inputs from different cholinergic PMNs (Zwart et al., 2016).
However, our dual calcium imaging data show that the excitatory A27h PMN is active during the F3
co-activated muscle group and not earlier. Therefore, MNs may receive temporally distinct excitatory
inputs, in addition to the previously reported temporally distinct inhibitory inputs. We have identified
dozens of new PMNs that are candidates for regulating motor rhythms; functional analysis of all of
these PMNs is beyond the scope of this paper, particularly due to the additional work required to
Zarin et al. eLife 2019;8:e51781. DOI: https://doi.org/10.7554/eLife.51781 23 of 34
Research article Neuroscience

screen and identify Gal4/LexA lines selectively targeting these PMNs, but our predictions are clear
and testable when reagents become available.
We show that MNs innervating a single spatial muscle group can belong to more than one co-
activated muscle group, therefore spatial muscle groups do not invariably match co-activated muscle
groups. This could be due to several reasons: (i) MNs in each spatial muscle groups receive inputs
from overlapping but not identical array of PMNs. (ii) Different MNs in the same spatial muscle
group receive a different number of synapses from the same PMN. (iii) MNs in the same spatial mus-
cle group vary in overall dendritic size and total number of postsynapses, thereby resulting in MNs
of the same spatial muscle group falling into different co-activated muscle groups.
We demonstrate that during both forward and backward locomotion, most of longitudinal and
transverse muscles of a given segment contract as early and late groups, respectively. In contrast,
muscles with oblique or acute orientation often show different phase relationships during forward
and backward crawling. Future studies will be needed to provide a biomechanical explanation for
why oblique muscles – but not longitudinal or transverse muscles – need to be recruited differentially
during forward or backward crawling. Also, it will be interesting to determine whether the VO or VL
MNs are responsible for elevating the ventral cuticular denticles during propagation of the peristaltic
wave; if the VOs, it would mean that lifting the denticles occurs at different phases of the crawl cycle
in forward and backward locomotion.
Our recurrent network model accurately predicts the order of activation of specific PMNs, yet
many of its parameters remain unconstrained, and some PMNs may have biological activity inconsis-
tent with activity predicted by our model. Sources of uncertainty in the model include incomplete
reconstruction of inter-segmental connectivity and descending command inputs, the potential role
of gap junctions (which are not resolved in the TEM reconstruction), as well as incomplete characteri-
zation of PMN and MN biophysical properties. Recent studies have suggested that models con-
strained by TEM reconstructions of neuronal connectivity are capable of predicting features of
neuronal activity and function in the Drosophila olfactory (Eichler et al., 2017) and visual
(Takemura et al., 2013; Tschopp et al., 2018) systems, despite the unavoidable uncertainty in some
model parameters and the likely presence of multiple distinct models that produce activity consis-
tent with recordings (Prinz et al., 2004; Brenner, 2010; Bargmann and Marder, 2013). For the
locomotor circuit described here, we anticipate that the addition of model constraints from future
experiments will lead to progressively more accurate models of PMN and MN dynamics. Despite its
limitations, the ability of the PMN network to generate appropriate muscle timing for two distinct
behaviors in the absence of third-layer or command-like interneurons suggests that a single layer of
recurrent circuitry is sufficient to generate multiple behavioral outputs. It is also notable that a model
lacking complex single-neuron dynamics such as post-inhibitory rebound or spike-frequency adapta-
tion, which are critical for modeling other central pattern generator circuits (Marder and Bucher,
2001), is sufficient to produce the observed motor pattern. Thus, although there are likely complex
intrinsic neuronal dynamics that our model fails to capture, recurrent excitatory and inhibitory inter-
actions may play a large role in establishing appropriate motor timing in the larva.
Previous work in other animal models have identified multifunctional muscles involved in more
than one motor behavior: swimming and crawling in C. elegans (Pierce-Shimomura et al., 2008;
Vidal-Gadea et al., 2011; Butler et al., 2015) and leech (Briggman and Kristan, 2006); walking
and flight in locust (Ramirez and Pearson, 1988); respiratory and non-respiratory functions of mam-
malian diaphragm muscle (Lieske et al., 2000; Fogarty et al., 2018) unifunctional muscles which are
only active in one specific behavior in the lobster Homarus americanus (Mulloney et al., 2014);
swimming in the marine mollusk Tritonia diomedea (Popescu and Frost, 2002); and muscles in dif-
ferent regions of crab and lobster stomach (Bucher et al., 2006; Briggman and Kristan, 2008). Our
single-muscle calcium imaging data indicate that all imaged larval body wall muscles are bifunctional
and are activated during both forward and backward locomotion. It will be interesting to determine
if all bodywall muscles are also involved in other larval behaviors, such as escape rolling, self-righting,
turning, or digging. It is likely that there are different co-activated muscle groups for each behavior,
as we have seen for forward and backward locomotion, raising the question of how different co-acti-
vated muscle groups are generated for each distinct behavior.
Zarin et al. eLife 2019;8:e51781. DOI: https://doi.org/10.7554/eLife.51781 24 of 34
Research article Neuroscience

Materials and methods
Key resources table
Reagent type (species) or resource Designation Source or reference Identifiers Additional information
Genetic reagent(Drosophila melanogaster)
R36G02-Gal4 BDSC # 49939 A27h line
Genetic reagent(Drosophila melanogaster)
R87H09-Gal4 BDSC #40507 A31k and A06l line
Genetic reagent(Drosophila melanogaster)
R78F07-Gal4 BDSC #47409 A23a line
Genetic reagent(Drosophila melanogaster)
R44H10-LexA BDSC # 61543 Muscle line
Genetic reagent(Drosophila melanogaster)
CQ2-lexA this paper U1-U5 motor neurons
Genetic reagent(Drosophila melanogaster)
UAS-jRCaMP1b BDSC # 63793 calcium indicator
Genetic reagent(Drosophila melanogaster)
lexAop-GCaMP6m BDSC #44275 calcium indicator
Genetic reagent(Drosophila melanogaster)
13XLexAop2-6XmCherry-HA BDSC #52271 Used for ratiometricmuscle calcium imaging
Electron microscopy and CATMAID reconstructionsThe TEM volume is for an L1 newly hatched larva (Ohyama et al., 2015), and is available by request
from Albert Cardona (Cambridge University). Neurons were reconstructed in CATMAID
(Saalfeld et al., 2009) using a Google Chrome browser as previously described (Ohyama et al.,
2015). Figures were generated using CATMAID graph or 3D widgets combined with Adobe Illustra-
tor (Adobe, San Jose, CA).
Criteria for selecting PMNsThe 118 PMNs were selected if they had presynapses to greater than 1% of a MN postsynapse pop-
ulation and greater than four total synapses (left+right combined). Candidate PMNs that met these
criteria could be excluded however if left/right orthologs could not be identified, or if gaps pre-
vented reliable reconstruction of the PMN in the neuropil regions of T3, A1, and A2 segments.
Synapse spatial distributions and clusteringSynapse spatial distributions were generated using custom MATLAB scripts, which are deposited at
GitHub (Mark and Litwin-Kumar, 2019). Spatial distributions were determined using kernel density
estimates with a 1 mm bandwidth. For cross-sectional spatial distributions, points were rotated �12
degrees around the Z-axis (A/P axis) in order to account for the slight offset of the EM-volume. For
pre-synaptic sites, polyadic synapses were weighted by their number of postsynaptic targets. Syn-
apse similarity was calculated as described previously (Schlegel et al., 2016):
f is; jkð Þ ¼ e�d2
sk
2s2 e
jnis�njk j
nisþnjk
where f(is,jk) is the mean synapse similarity between all synapses of neuron i and neuron j. dsk is the
Euclidean distance between synapses s and k such that synapse k is the closest synapse of neuron j
to synapse s of neuron i. s is a bandwidth term that determines what is considered close. nis and njkare the fraction of synapses for neuron i and neuron j that are within w of synapse s and synapse k
respectively. For MN inputs, s = w = 2 mm. Clustering was performed by using the average synapse
similarity scores for the left and right hemisegments as a distance metric, and linkage was calculated
using the average synapse similarity. For comparing the distributions across individual axes, a two
sample Kolmogorov-Smirnov test was used to determine significance.
Zarin et al. eLife 2019;8:e51781. DOI: https://doi.org/10.7554/eLife.51781 25 of 34
Research article Neuroscience

Clustering analysis of PMN-MN connectivityWeighted PMNs to MNs connectivity matrix was acquired from CATMAID TEM volume as percent-
age of total number of postsynaptic links to these target MNs. We then calculated the average of
left and right pairs of PMNs and MNs. Next, we summed the mean connections from PMNs to all
MNs innervating muscle groups defined in Figure 7A–C and G, and normalized the values for each
row (PMNs). Hierarchical clustering was performed on these normalized connectivity matrixes using
Python’s seaborn.clustermap (metric = Euclidean, method = single, https://seaborn.pydata.org/gen-
erated/seaborn.clustermap.html). For Figure 7D–F, the PMN-MN connectivity matrix was acquired
from CATMAID as the absolute number of presynapses from PMNs to their target MNs. We first
summed the weighted synapses from left and right counterparts of individual PMNs to individual
MNs. Then we calculated the average of these values for MN pairs (left and right) and summed the
connections from PMNs to all MNs innervating the spatial or co-active muscle groups. To generate
7D-F, we discarded PMN-MN connections where total weighted synapses between a given PMN
pair and MN pair were less than 1%. Histograms were produced in Python sns.distplot (https://sea-
born.pydata.org/generated/seaborn.distplot.html).
Muscle GCaMP6f imaging, length measurement, and quantification2% melted agarose was used to make pads with similar size: 25 mm (W) X 50 mm (L) X 2 mm (H).
Using tungsten wire, a shallow ditch was made on agarose pads to accommodate the larva. To do
muscle ratiometric calcium imaging in intact animals, a first or second instar larvae expressing
GCaMP6f and mCherry in body wall muscles were washed with distilled water, then moved into a
2% agarose pad on the slide. A 22 mm �40 mm cover glass was put on the larva and pressed gently
to gently constrain larval locomotion. The larva was mounted dorsolaterally or ventrolaterally to
image a different set of muscles (dorsolateral mount excludes the most ventral muscles (15,16,17)
whereas the ventrolateral mount excludes the dorsal-most muscles (1,2,9,10); imaging was done
with a 10x objective on an upright Zeiss LSM800 microscope. We recorded a total of 38 waves (24
forward and 14 backward) from four different animals, and examined muscle calcium activity in two
subsequent hemi-segments for each wave. Muscle length measurement was done using custom
MATLAB scripts where muscle length was measured on a frame by frame basis. Calcium imaging
data were also analyzed using custom MATLAB scripts. Due to movement artifacts, ROIs were
updated on a frame by frame basis to track the muscle movement. ROIs that crossed other muscles
during contraction were discarded. In no single preparation was it possible to obtain calcium traces
for all 30 muscles. Instead, we used only preparations in which at least 40% of the muscles could be
recorded. In order to align crawl cycles that were of variable time and muscle composition, we first
produced a two dimensional representation of each crawl cycle using PCA. Crawl cycles were repre-
sented as circular trajectories away from, and back towards the origin (Figure 3—figure supplement
1E,F) similar to what has been shown previously (Lemon et al., 2015). The amplitude, or linear dis-
tance from the origin, to a point on this trajectory correlated well with both the coherence of the cal-
cium signals as well as the amplitude of the population. Thus, peaks in this 2D amplitude correspond
with the time in which most muscles are maximally active, which we defined as the midpoint of a
crawl cycle. It should be noted that the muscles used to generate two dimensional representations
of crawl cycles were different for each crawl. While this means that each PCA trajectory is slightly dif-
ferent for each crawl cycle, we reasoned that because each experiment contained muscles from
every co-activated muscle group, the peak amplitude in PCA space should still correspond to a
good approximation of the midpoint of the crawl cycle. We defined the width of a crawl cycle as the
width of this 2D peak at half-height (Figure 3—figure supplement 1G). We aligned all crawl cycles
to the crawl onset and offset (which we call 25% and 75% of the crawl cycle respectively) as defined
by this width at half-height (Figure 3—figure supplement 1H,I).
Calcium imaging in neuronsFor dual-color and single-color calcium imaging in fictive preps, freshly dissected brains were
mounted on 12 mm round Poly-D-Lysine Coverslips (Corning BioCoat) in HL3.1 saline (de Castro
et al., 2014), which were then were placed on 25 mm �75 mm glass slides to be imaged with a
40 � objective on an upright Zeiss LSM-800 confocal microscopy. To simultaneously image two dif-
ferent neurons expressing GCaMP6m we imaged neuron-specific regions of interest (ROI). In
Zarin et al. eLife 2019;8:e51781. DOI: https://doi.org/10.7554/eLife.51781 26 of 34
Research article Neuroscience

addition, we imaged two neurons differentially expressing GCaMP6m and jRCaMP1b. Image data
were imported into Fiji (https://imagej.net/fiji) and GCaMP6m and jRCaMP1b channels were sepa-
rated. The DF/F0 of each ROI was calculated as (F-F0)/F0, where F0 was averaged over ~1 s immedi-
ately before the start of the forward or backward waves in each ROI.
Neurotransmitter expressionFor PMNs that we could identify using Gal4 lines, we crossed the Gal4 line to UAS-Cherry and used
Chat:GFP to detect cholinergic neurons (Diao et al., 2015), anti-GABA to detect GABAergic neu-
rons (Wilson and Laurent, 2005), anti-vesicular glutamate transporter (vGlut) to detect glutamater-
gic neurons (Daniels et al., 2004), or anti-Corazonin to detect corazonergic neurons (Veenstra and
Davis, 1993).
Antibody staining and imagingStandard confocal microscopy, immunocytochemistry and MCFO methods were performed as previ-
ously described for larvae (Carreira-Rosario et al., 2018). Primary antibodies used: GFP or Venus
(rabbit, 1:500, ThermoFisher, Waltham, MA; chicken 1:1000, Abcam13970, Eugene, OR), GFP or Cit-
rine (Camelid sdAB direct labeled with AbberiorStar635P, 1:1000, NanoTab Biotech., Gottingen,
Germany), GABA (rabbit, 1:200, Sigma, St. Louis, MO), vGlut (rabbit, 1:10000, gift from Aaron DiA-
ntonio), Corazonin (rabbit, 1:1000), mCherry (rabbit, 1:1000, Novus, Littleton, CO), HA (mouse,
1:200, Cell Signaling, Danvers, MA), V5 (rabbit, 1:400, Rockland, Atlanta, GA), Flag (rabbit, 1:200,
Rockland, Atlanta, GA). Secondary antibodies were from Jackson Immunoresearch (West Grove, PA)
and used according to manufacturer’s instructions. Confocal image stacks were acquired on Zeiss
710 or 800 microscopes. Images were processed in Fiji (https://imagej.net/Fiji), Photoshop, and Illus-
trator (Adobe, San Jose, CA). Brightness and contrast adjustments were applied to the entire image
uniformly; mosaic images were assembled in Photoshop (Adobe, San Jose, CA).
Recurrent network modelModel dynamicsWe constructed a recurrent network representing the activity of PMNs, which we denote by the vec-
tor p, and of MNs, which we denote by the vector m. The firing rate of PMN or MN i is a rectified-lin-
ear function of its input: pi tð Þ ¼ upi tð Þ½ �þ or mi tð Þ ¼ umi tð Þ
� �
þ, where �½ �þ denotes rectification. The PMN
input up follows the differential equation:
t
p � dup
dt¼�up tð Þþ gp � Jpp tð Þþbpþ I tð Þð Þ;
where t
pi is the time constant of PMN i, bpi its baseline excitability, Ii tð Þ its descending input from
other regions, � denotes element-wise multiplication, and Jp is the connectivity matrix among
PMNs. We also include a neuron-specific gain term gpi which determines how sensitive a PMN is to
its inputs (this is required because we fix the scale of J based on the TEM reconstruction). The
descending input to the PMNs I tð Þ is represented as a pulse of activity: I tð Þ ¼ IFWD during FWD crawl-
ing, I tð Þ ¼ IBWD during BWD crawling, and I tð Þ ¼ 0 otherwise.
MNs follow similar dynamics:
t
m� dum
dt¼�um tð Þþ gm� Jmp tð Þþbmð Þ;
where Jm is the connectivity matrix from PMNs to MNs.
To generate PMNs and MNs corresponding to the A2 segment, we duplicated the A1 MNs and
the PMNs we reconstructed for which no corresponding neuron in the next anterior segment was
reconstructed. This produces a connectivity matrix with an approximate block structure:
Jp ¼Jp11
Jp12
Jp21
Jp22
� �
; Jm ¼Jm11
Jm12
Jm21
Jm22
� �
;
where Jp=mrs represents connections from segment r to segment s.
Zarin et al. eLife 2019;8:e51781. DOI: https://doi.org/10.7554/eLife.51781 27 of 34
Research article Neuroscience

Target activityThe model parameters (J, g, b, t, I) are adjusted using gradient descent so that the MN activity m
reproduces target patterns of activity during FWD and BWD crawling. These targets are defined for
6 s trials that contain one sequence of CMUG activation in each of the two segments. Time is discre-
tized into 50 ms bins. At the beginning of each trial, up is initialized with random values from a trun-
cated Gaussian distribution with standard deviation 0.1, and um is initialized to 0. A trial consists of
sequential activity in each segment with a 1 s inter-segmental delay (Figure 9). Trials begin and end
with 1 and 1.5 s of quiescence, respectively. Each MN’s target activity is given by a rectified cosine
pulse of activity whose start and end times depend on the CMUG to which it belongs. The first
CMUG is active for 2 s, and subsequent CMUGs activate with a delay of 0.25 s between each group
and end with a delay of 0.125 s between groups. The participation of MNs in CMUGs and the order
in which the segments are active during FWD and BWD crawling are inferred from the data (Figure
3).
Parameter constraints and optimizationConstraints are placed on the model parameters based on knowledge of the circuit. The nonzero
elements of Jp and Jm are determined from the TEM reconstruction (normalized based on the per-
cent input received by the postsynaptic target), and signs are constrained using neurotransmitter
identity when available. If the neurotransmitter identity of a neuron is not known, we initialize the
connection to be inhibitory but do not constrain its sign during optimization. Time constants t are
constrained to be between 50 ms and 1 s (these represent combined membrane and synaptic time
constants), and gains g are constrained to be positive.
At the beginning of optimization, the biases bp and bm are initialized equal to 0.1 and 0, respec-
tively. Time constants t are initialized to 200 ms and gains g to 1. IFWD and IBWD are initialized uni-
formly between 0.05 and 0.15 for each neuron. To initialize Jp and Jm, initial connection strengths
are taken in proportion to synapse counts from the TEM reconstruction with a scaling factor of
±0.005 for excitatory/inhibitory connections. Connections within a model segment are taken from
the TEM reconstruction of A1, while connections from A1 to A2 or A2 to A1 are taken from the cor-
responding cross-segmental reconstructions (and are thus likely less complete than the within-seg-
mental connectivity).
The cost function that is optimized consists of a term Ctarg that penalizes deviations of the MN
activities from their targets and three regularization terms to promote realistic solutions. The target
term is given by Ctarg ¼t;i
X
wijjmi tð Þ � m�i tð Þjj2, where m�
i tð Þ is the target activity for MN i and wi is a
weighting term, proportional to 1=ffiffiffiffiffiffiffiffiffiffiffiffiffiffiffiffi
NCMUG;i
p
where NCMUG;i is the number of neurons in the CMUG of
neuron i (this scaling ensures the target patterns of CMUGs with few MNs are still reproduced accu-
rately). The first regularization term is given
by CA18b;A27h ¼ 0:05 �t2FWD
X
jpA18 tð Þj þt2BWD
X
jpA27 tð Þj
� �
, which suppresses the activity of the A18b and
A27h neurons for behaviors during which they are known to be quiescent. The second regularization
term Cseg constrains PMN activity to reflect the timing of segmental activation. It is given by
Cseg ¼ ant2active1
X
jjp1 tð Þ�p2 t� tdelay� �
jj2;
where active1 represents the times when segment 1 is active, p1 and p2 represent vectors of PMN
activities corresponding to pairs of homologous neurons in adjacent segments, and tdelay is the time
delay between segment 1 and 2 activations (equal to -1 s for forward and +1 s for backward crawl-
ing). This term ensures that PMN activity in the A1 and the A2 segments is similar but offset in time.
The scaling term an increases quadratically from 0 to 0.1 over the 1000 training epochs. The final
term CJ ¼ an jjJp � Jp0jj2 þjjJm� Jm
0jj2
� �
penalizes deviations of model weights from the initial weights
given by the TEM reconstruction. The correlation coefficient between the magnitudes of the nonzero
entries of Jm and Jm0was on average 0.87±0.01 after optimization, and 0.43±0.02 for Jp and J
p0, indi-
cating that the optimization procedure found patterns of weights similar, though not identical, to
those in reconstruction.
Zarin et al. eLife 2019;8:e51781. DOI: https://doi.org/10.7554/eLife.51781 28 of 34
Research article Neuroscience

The total cost, equal to Ctarg þ CA18b;A27h þ Cseg+CJ , is optimized using the RMSProp optimizer for
1000 epochs. During each epoch, the costs corresponding to one FWD and one BWD trial are aver-
aged. The learning rate decreases from 10�2 to 10
�3 logarithmically over the course of optimization.
Code is available at GitHub (Mark and Litwin-Kumar, 2019; copy archived at https://github.com/eli-
fesciences-publications/larval_locomotion).
AcknowledgementsWe thank Luis Sullivan, Emily Sales, and Hiroshi Kohsaka for comments on early versions of the man-
uscript. BM was supported by an NIH training grant T32HD007348. AC was supported by HHMI.
AL-K was supported by the Burroughs Wellcome Foundation, the Gatsby Charitable Foundation, the
Simons Collaboration on the Global Brain, and NSF award DBI-1707398. CQD and AAZ were sup-
ported by HHMI and NIH HD27056.
Additional information
Funding
Funder Grant reference number Author
Howard Hughes Medical Insti-tute
Aref Arzan ZarinAlbert CardonaChris Q Doe
National Institutes of Health HD27056 Brandon MarkChris Q Doe
Burroughs Wellcome Founda-tion
Ashok Litwin-Kumar
Gatsby Charitable Foundation Ashok Litwin-Kumar
Simons Collaboration on theGlobal Brain
Ashok Litwin-Kumar
NSF DBI-1707398 Ashok Litwin-Kumar
NIH HD27056 Chris Q Doe
The funders had no role in study design, data collection and interpretation, or the
decision to submit the work for publication.
Author contributions
Aref Arzan Zarin, Data curation, Formal analysis, Validation, Investigation, Methodology; Brandon
Mark, Conceptualization, Resources, Data curation, Software, Formal analysis, Validation, Investiga-
tion, Visualization, Methodology; Albert Cardona, Resources, Software, Funding acquisition, Meth-
odology; Ashok Litwin-Kumar, Conceptualization, Resources, Software, Funding acquisition,
Validation, Methodology; Chris Q Doe, Conceptualization, Data curation, Supervision, Funding
acquisition, Investigation, Methodology, Project administration
Author ORCIDs
Aref Arzan Zarin https://orcid.org/0000-0003-0484-3622
Ashok Litwin-Kumar http://orcid.org/0000-0003-2422-6576
Chris Q Doe https://orcid.org/0000-0001-5980-8029
Decision letter and Author response
Decision letter https://doi.org/10.7554/eLife.51781.sa1
Author response https://doi.org/10.7554/eLife.51781.sa2
Zarin et al. eLife 2019;8:e51781. DOI: https://doi.org/10.7554/eLife.51781 29 of 34
Research article Neuroscience

Additional filesSupplementary files. Supplementary file 1. CATMAID. json file of all reconstructed MNs in segment A1 as of 17 Febru-
ary 2019.
. Supplementary file 2. List of all PMN names and published synonyms.
. Supplementary file 3. Excel file of PMN neurotransmitter identity as of 31 August 2019. Data from
our own work plus previous studies (Kohsaka et al., 2014; Heckscher et al., 2015; Fushiki et al.,
2016; Hasegawa et al., 2016; MacNamee et al., 2016; Zwart et al., 2016; Takagi et al., 2017;
Yoshino et al., 2017; Burgos et al., 2018; Carreira-Rosario et al., 2018; Kohsaka et al., 2019).
. Supplementary file 4. CATMAID. json file of all reconstructed PMNs in segment A1 as of 21 August
2019.
. Supplementary file 5. Excel file of PMN to MN connectivity as of 31 August 2019.
. Supplementary file 6. Excel file of PMN to PMN connectivity as of 31 August 2019.
. Transparent reporting form
Data availability
All data generated or analyzed during this study are included in the manuscript and supporting files.
Source code is available at https://github.com/alitwinkumar/larval_locomotion (copy archived at
https://github.com/elifesciences-publications/larval_locomotion).
ReferencesArber S. 2017. Organization and function of neuronal circuits controlling movement. EMBO Molecular Medicine9:281–284. DOI: https://doi.org/10.15252/emmm.201607226
Arber S, Costa RM. 2018. Connecting neuronal circuits for movement. Science 360:1403–1404. DOI: https://doi.org/10.1126/science.aat5994, PMID: 29954969
Arzan Zarin A, Labrador J-P. 2019. Motor axon guidance in Drosophila. Seminars in Cell & DevelopmentalBiology 85:36–47. DOI: https://doi.org/10.1016/j.semcdb.2017.11.013
Bagnall MW, McLean DL. 2014. Modular organization of axial microcircuits in zebrafish. Science 343:197–200.DOI: https://doi.org/10.1126/science.1245629, PMID: 24408436
Bargmann CI, Marder E. 2013. From the connectome to brain function. Nature Methods 10:483–490.DOI: https://doi.org/10.1038/nmeth.2451, PMID: 23866325
Bate M. 1990. The embryonic development of larval muscles in Drosophila. Development 110:791–804.PMID: 2100994
Berni J, Pulver SR, Griffith LC, Bate M. 2012. Autonomous circuitry for substrate exploration in freely movingDrosophila larvae. Current Biology 22:1861–1870. DOI: https://doi.org/10.1016/j.cub.2012.07.048, PMID: 22940472
Bikoff JB, Gabitto MI, Rivard AF, Drobac E, Machado TA, Miri A, Brenner-Morton S, Famojure E, Diaz C, AlvarezFJ, Mentis GZ, Jessell TM. 2016. Spinal inhibitory interneuron diversity delineates variant motor microcircuits.Cell 165:207–219. DOI: https://doi.org/10.1016/j.cell.2016.01.027, PMID: 26949184
Brenner S. 2010. Sequences and consequences. Philosophical Transactions of the Royal Society B: BiologicalSciences 365:207–212. DOI: https://doi.org/10.1098/rstb.2009.0221, PMID: 20008397
Briggman KL, Kristan WB. 2006. Imaging dedicated and multifunctional neural circuits generating distinctbehaviors. Journal of Neuroscience 26:10925–10933. DOI: https://doi.org/10.1523/JNEUROSCI.3265-06.2006,PMID: 17050731
Briggman KL, Kristan WB. 2008. Multifunctional pattern-generating circuits. Annual Review of Neuroscience 31:271–294. DOI: https://doi.org/10.1146/annurev.neuro.31.060407.125552, PMID: 18558856
Brodfuehrer PD, Thorogood MS. 2001. Identified neurons and leech swimming behavior. Progress inNeurobiology 63:371–381. DOI: https://doi.org/10.1016/S0301-0082(00)00048-4, PMID: 11163683
Brunet Avalos C, Maier GL, Bruggmann R, Sprecher SG. 2019. Single cell transcriptome atlas of the Drosophilalarval brain. eLife 8:e50354. DOI: https://doi.org/10.7554/eLife.50354, PMID: 31746739
Bucher D, Taylor AL, Marder E. 2006. Central pattern generating neurons simultaneously express fast and slowrhythmic activities in the stomatogastric ganglion. Journal of Neurophysiology 95:3617–3632. DOI: https://doi.org/10.1152/jn.00004.2006, PMID: 16495367
Buford JA, Smith JL. 1990. Adaptive control for backward quadrupedal walking. II. hindlimb muscle synergies.Journal of Neurophysiology 64:756–766. DOI: https://doi.org/10.1152/jn.1990.64.3.756, PMID: 2230922
Burgos A, Honjo K, Ohyama T, Qian CS, Shin GJ, Gohl DM, Silies M, Tracey WD, Zlatic M, Cardona A, GrueberWB. 2018. Nociceptive interneurons control modular motor pathways to promote escape behavior inDrosophila. eLife 7:e26016. DOI: https://doi.org/10.7554/eLife.26016, PMID: 29528286
Zarin et al. eLife 2019;8:e51781. DOI: https://doi.org/10.7554/eLife.51781 30 of 34
Research article Neuroscience

Butler VJ, Branicky R, Yemini E, Liewald JF, Gottschalk A, Kerr RA, Chklovskii DB, Schafer WR. 2015. Aconsistent muscle activation strategy underlies crawling and swimming in Caenorhabditis elegans . Journal ofthe Royal Society Interface 12:20140963. DOI: https://doi.org/10.1098/rsif.2014.0963
Carreira-Rosario A, Zarin AA, Clark MQ, Manning L, Fetter RD, Cardona A, Doe CQ. 2018. MDN braindescending neurons coordinately activate backward and inhibit forward locomotion. eLife 7:e38554.DOI: https://doi.org/10.7554/eLife.38554, PMID: 30070205
Choi JC, Park D, Griffith LC. 2004. Electrophysiological and morphological characterization of identified motorneurons in the Drosophila third instar larva central nervous system. Journal of Neurophysiology 91:2353–2365.DOI: https://doi.org/10.1152/jn.01115.2003, PMID: 14695352
Clark MQ, Zarin AA, Carreira-Rosario A, Doe CQ. 2018. Neural circuits driving larval locomotion in Drosophila.Neural Development 13:6. DOI: https://doi.org/10.1186/s13064-018-0103-z, PMID: 29673388
Crisp S, Evers JF, Fiala A, Bate M. 2008. The development of motor coordination in Drosophila embryos.Development 135:3707–3717. DOI: https://doi.org/10.1242/dev.026773, PMID: 18927150
Crone SA, Quinlan KA, Zagoraiou L, Droho S, Restrepo CE, Lundfald L, Endo T, Setlak J, Jessell TM, Kiehn O,Sharma K. 2008. Genetic ablation of V2a ipsilateral interneurons disrupts left-right locomotor coordination inmammalian spinal cord. Neuron 60:70–83. DOI: https://doi.org/10.1016/j.neuron.2008.08.009, PMID: 18940589
Crossley A. 1978. The Morphology and Development of the Drosophila Muscular System. in the Genetics andBiology of Drosophila. Academic Press.
Daniels RW, Collins CA, Gelfand MV, Dant J, Brooks ES, Krantz DE, DiAntonio A. 2004. Increased expression ofthe Drosophila vesicular glutamate transporter leads to excess glutamate release and a compensatory decreasein quantal content. Journal of Neuroscience 24:10466–10474. DOI: https://doi.org/10.1523/JNEUROSCI.3001-04.2004, PMID: 15548661
de Castro C, Titlow J, Majeed ZR, Cooper RL. 2014. Analysis of various physiological salines for heart rate, CNSfunction, and synaptic transmission at neuromuscular junctions in Drosophila Melanogaster larvae. Journal ofComparative Physiology A 200:83–92. DOI: https://doi.org/10.1007/s00359-013-0864-0
Diao F, Ironfield H, Luan H, Diao F, Shropshire WC, Ewer J, Marr E, Potter CJ, Landgraf M, White BH. 2015.Plug-and-play genetic access to Drosophila cell types using exchangeable exon cassettes. Cell Reports 10:1410–1421. DOI: https://doi.org/10.1016/j.celrep.2015.01.059, PMID: 25732830
Dixit R, Vijayraghavan K, Bate M. 2008. Hox genes and the regulation of movement in Drosophila.Developmental Neurobiology 68:309–316. DOI: https://doi.org/10.1002/dneu.20589, PMID: 18044732
Dougherty KJ, Zagoraiou L, Satoh D, Rozani I, Doobar S, Arber S, Jessell TM, Kiehn O. 2013. Locomotor rhythmgeneration linked to the output of spinal shox2 excitatory interneurons. Neuron 80:920–933. DOI: https://doi.org/10.1016/j.neuron.2013.08.015, PMID: 24267650
Eichler K, Li F, Litwin-Kumar A, Park Y, Andrade I, Schneider-Mizell CM, Saumweber T, Huser A, Eschbach C,Gerber B, Fetter RD, Truman JW, Priebe CE, Abbott LF, Thum AS, Zlatic M, Cardona A. 2017. The completeconnectome of a learning and memory centre in an insect brain. Nature 548:175–182. DOI: https://doi.org/10.1038/nature23455, PMID: 28796202
Eklof-Ljunggren E, Haupt S, Ausborn J, Dehnisch I, Uhlen P, Higashijima S, El Manira A. 2012. Origin ofexcitation underlying locomotion in the spinal circuit of zebrafish. PNAS 109:5511–5516. DOI: https://doi.org/10.1073/pnas.1115377109, PMID: 22431619
Fisher YE, Silies M, Clandinin TR. 2015. Orientation selectivity sharpens motion detection in Drosophila. Neuron88:390–402. DOI: https://doi.org/10.1016/j.neuron.2015.09.033, PMID: 26456048
Fogarty MJ, Mantilla CB, Sieck GC. 2018. Breathing: motor control of diaphragm muscle. Physiology 33:113–126. DOI: https://doi.org/10.1152/physiol.00002.2018, PMID: 29412056
Friesen WO, Kristan WB. 2007. Leech locomotion: swimming, crawling, and decisions. Current Opinion inNeurobiology 17:704–711. DOI: https://doi.org/10.1016/j.conb.2008.01.006
Fushiki A, Zwart MF, Kohsaka H, Fetter RD, Cardona A, Nose A. 2016. A circuit mechanism for the propagationof waves of muscle contraction in Drosophila. eLife 5:e13253. DOI: https://doi.org/10.7554/eLife.13253,PMID: 26880545
Gjorgjieva J, Berni J, Evers JF, Eglen SJ. 2013. Neural circuits for peristaltic wave propagation in crawlingDrosophila larvae: analysis and modeling. Frontiers in Computational Neuroscience 7:24. DOI: https://doi.org/10.3389/fncom.2013.00024, PMID: 23576980
Goetz C, Pivetta C, Arber S. 2015. Distinct limb and trunk premotor circuits establish laterality in the spinal cord.Neuron 85:131–144. DOI: https://doi.org/10.1016/j.neuron.2014.11.024
Gorczyca M, Augart C, Budnik V. 1993. Insulin-like receptor and insulin-like peptide are localized atneuromuscular junctions in Drosophila. The Journal of Neuroscience 13:3692–3704. DOI: https://doi.org/10.1523/JNEUROSCI.13-09-03692.1993, PMID: 8366341
Grasso R, Bianchi L, Lacquaniti F. 1998. Motor patterns for human gait: backward versus forward locomotion.Journal of Neurophysiology 80:1868–1885. DOI: https://doi.org/10.1152/jn.1998.80.4.1868, PMID: 9772246
Grillner S. 2003. The motor infrastructure: from ion channels to neuronal networks. Nature Reviews Neuroscience4:573–586. DOI: https://doi.org/10.1038/nrn1137, PMID: 12838332
Grillner S, Jessell TM. 2009. Measured motion: searching for simplicity in spinal locomotor networks. CurrentOpinion in Neurobiology 19:572–586. DOI: https://doi.org/10.1016/j.conb.2009.10.011
Gruhn M, Hoffmann O, Dubbert M, Scharstein H, Buschges A. 2006. Tethered stick insect walking: a modifiedslippery surface setup with optomotor stimulation and electrical monitoring of tarsal contact. Journal ofNeuroscience Methods 158:195–206. DOI: https://doi.org/10.1016/j.jneumeth.2006.05.029, PMID: 16824615
Zarin et al. eLife 2019;8:e51781. DOI: https://doi.org/10.7554/eLife.51781 31 of 34
Research article Neuroscience
Hasegawa E, Truman JW, Nose A. 2016. Identification of excitatory premotor interneurons which regulate localmuscle contraction during Drosophila larval locomotion. Scientific Reports 6:30806. DOI: https://doi.org/10.1038/srep30806, PMID: 27470675
Haspel G, O’Donovan MJ, Hart AC. 2010. Motoneurons dedicated to either forward or backward locomotion inthe nematode Caenorhabditis elegans. Journal of Neuroscience 30:11151–11156. DOI: https://doi.org/10.1523/JNEUROSCI.2244-10.2010, PMID: 20720122
Heckscher ES, Lockery SR, Doe CQ. 2012. Characterization of Drosophila larval crawling at the level of organism,segment, and somatic body wall musculature. Journal of Neuroscience 32:12460–12471. DOI: https://doi.org/10.1523/JNEUROSCI.0222-12.2012, PMID: 22956837
Heckscher ES, Zarin AA, Faumont S, Clark MQ, Manning L, Fushiki A, Schneider-Mizell CM, Fetter RD, TrumanJW, Zwart MF, Landgraf M, Cardona A, Lockery SR, Doe CQ. 2015. Even-Skipped(+) Interneurons are corecomponents of a sensorimotor circuit that maintains Left-Right symmetric muscle contraction amplitude.Neuron 88:314–329. DOI: https://doi.org/10.1016/j.neuron.2015.09.009, PMID: 26439528
Hessinger C, Technau GM, Rogulja-Ortmann A. 2017. The Drosophila hox gene ultrabithorax acts in bothmuscles and motoneurons to orchestrate formation of specific neuromuscular connections. Development 144:139–150. DOI: https://doi.org/10.1242/dev.143875, PMID: 27913640
Hoang B, Chiba A. 2001. Single-cell analysis of Drosophila larval neuromuscular synapses. DevelopmentalBiology 229:55–70. DOI: https://doi.org/10.1006/dbio.2000.9983, PMID: 11133154
Hooper JE. 1986. Homeotic gene function in the muscles of Drosophila larvae. The EMBO Journal 5:2321–2329.PMID: 16453704
Izquierdo EJ, Williams PL, Beer RD. 2015. Information flow through a model of the C. elegans klinotaxis circuit.PLOS ONE 10:e0140397. DOI: https://doi.org/10.1371/journal.pone.0140397, PMID: 26465883
Izquierdo EJ, Beer RD. 2013. Connecting a connectome to behavior: an ensemble of neuroanatomical models ofC. elegans klinotaxis. PLOS Computational Biology 9:e1002890. DOI: https://doi.org/10.1371/journal.pcbi.1002890
Karbowski J, Schindelman G, Cronin CJ, Seah A, Sternberg PW. 2008. Systems level circuit model of C. elegansundulatory locomotion: mathematical modeling and molecular genetics. Journal of ComputationalNeuroscience 24:253–276. DOI: https://doi.org/10.1007/s10827-007-0054-6, PMID: 17768672
Kawano T, Po MD, Gao S, Leung G, Ryu WS, Zhen M. 2011. An imbalancing act: gap junctions reduce thebackward motor circuit activity to Bias C. elegans for forward locomotion. Neuron 72:572–586. DOI: https://doi.org/10.1016/j.neuron.2011.09.005, PMID: 22099460
Kiehn O. 2006. Locomotor circuits in the mammalian spinal cord. Annual Review of Neuroscience 29:279–306.DOI: https://doi.org/10.1146/annurev.neuro.29.051605.112910, PMID: 16776587
Kimura Y, Satou C, Fujioka S, Shoji W, Umeda K, Ishizuka T, Yawo H, Higashijima S. 2013. Hindbrain V2a neuronsin the excitation of spinal locomotor circuits during zebrafish swimming. Current Biology 23:843–849.DOI: https://doi.org/10.1016/j.cub.2013.03.066, PMID: 23623549
Kohsaka H, Takasu E, Morimoto T, Nose A. 2014. A group of segmental premotor interneurons regulates thespeed of axial locomotion in Drosophila larvae. Current Biology 24:2632–2642. DOI: https://doi.org/10.1016/j.cub.2014.09.026, PMID: 25438948
Kohsaka H, Guertin PA, Nose A. 2017. Neural circuits underlying fly larval locomotion. Current PharmaceuticalDesign 23:1722–1733. DOI: https://doi.org/10.2174/1381612822666161208120835, PMID: 27928962
Kohsaka H, Zwart MF, Fushiki A, Fetter RD, Truman JW, Cardona A, Nose A. 2019. Regulation of forward andbackward locomotion through intersegmental feedback circuits in Drosophila larvae. Nature Communications10:2654. DOI: https://doi.org/10.1038/s41467-019-10695-y, PMID: 31201326
Koon AC, Ashley J, Barria R, DasGupta S, Brain R, Waddell S, Alkema MJ, Budnik V. 2011. Autoregulatory andparacrine control of synaptic and behavioral plasticity by octopaminergic signaling. Nature Neuroscience 14:190–199. DOI: https://doi.org/10.1038/nn.2716, PMID: 21186359
Koon AC, Budnik V. 2012. Inhibitory control of synaptic and behavioral plasticity by octopaminergic signaling.Journal of Neuroscience 32:6312–6322. DOI: https://doi.org/10.1523/JNEUROSCI.6517-11.2012,PMID: 22553037
Kristan WB, Calabrese RL, Friesen WO. 2005. Neuronal control of leech behavior. Progress in Neurobiology 76:279–327. DOI: https://doi.org/10.1016/j.pneurobio.2005.09.004, PMID: 16260077
Kunert JM, Maia PD, Kutz JN. 2017. Functionality and robustness of injured connectomic dynamics in C.Elegans: linking behavioral deficits to neural circuit damage. PLOS Computational Biology 13:e1005261.DOI: https://doi.org/10.1371/journal.pcbi.1005261
Landgraf M, Bossing T, Technau GM, Bate M. 1997. The origin, location, and projections of the embryonicabdominal motorneurons of Drosophila. The Journal of Neuroscience 17:9642–9655. DOI: https://doi.org/10.1523/JNEUROSCI.17-24-09642.1997, PMID: 9391019
Landgraf M, Jeffrey V, Fujioka M, Jaynes JB, Bate M. 2003. Embryonic origins of a motor system: motordendrites form a myotopic map in Drosophila. PLOS Biology 1:e41. DOI: https://doi.org/10.1371/journal.pbio.0000041, PMID: 14624243
Lemon WC, Pulver SR, Hockendorf B, McDole K, Branson K, Freeman J, Keller PJ. 2015. Whole-central nervoussystem functional imaging in larval Drosophila. Nature Communications 6:7924. DOI: https://doi.org/10.1038/ncomms8924, PMID: 26263051
Lieske SP, Thoby-Brisson M, Telgkamp P, Ramirez JM. 2000. Reconfiguration of the neural network controllingmultiple breathing patterns: eupnea, sighs and gasps. Nature Neuroscience 3:600–607. DOI: https://doi.org/10.1038/75776
Zarin et al. eLife 2019;8:e51781. DOI: https://doi.org/10.7554/eLife.51781 32 of 34
Research article Neuroscience

Ljunggren EE, Haupt S, Ausborn J, Ampatzis K, El Manira A. 2014. Optogenetic activation of excitatorypremotor interneurons is sufficient to generate coordinated locomotor activity in larval zebrafish. Journal ofNeuroscience 34:134–139. DOI: https://doi.org/10.1523/JNEUROSCI.4087-13.2014, PMID: 24381274
Loveless J, Lagogiannis K, Webb B. 2018. Mechanics of exploration in Drosophila Melanogaster. bioRxiv.DOI: https://doi.org/10.1101/354795
MacNamee SE, Liu KE, Gerhard S, Tran CT, Fetter RD, Cardona A, Tolbert LP, Oland LA. 2016. Astrocyticglutamate transport regulates a Drosophila CNS synapse that lacks astrocyte ensheathment. Journal ofComparative Neurology 524:1979–1998. DOI: https://doi.org/10.1002/cne.24016, PMID: 27073064
Macosko EZ, Pokala N, Feinberg EH, Chalasani SH, Butcher RA, Clardy J, Bargmann CI. 2009. A hub-and-spokecircuit drives pheromone attraction and social behaviour in C. elegans. Nature 458:1171–1175. DOI: https://doi.org/10.1038/nature07886
Marder E, Bucher D. 2001. Central pattern generators and the control of rhythmic movements. Current Biology11:R986–R996. DOI: https://doi.org/10.1016/S0960-9822(01)00581-4, PMID: 11728329
Marin-Burgin A, Kristan WB, French KA. 2008. From synapses to behavior: development of a sensory-motorcircuit in the leech. Developmental Neurobiology 68:779–787. DOI: https://doi.org/10.1002/dneu.20551,PMID: 18383550
Mark B, Litwin-Kumar A. 2019. Code for Matlab and Modeling Tools. GitHub. https://github.com/alitwinkumar/larval_locomotion
Mauss A, Tripodi M, Evers JF, Landgraf M. 2009. Midline signalling systems direct the formation of a neural mapby dendritic targeting in the Drosophila motor system. PLOS Biology 7:e1000200. DOI: https://doi.org/10.1371/journal.pbio.1000200, PMID: 19771146
Mullins OJ, Hackett JT, Buchanan JT, Friesen WO. 2011. Neuronal control of swimming behavior: comparison ofvertebrate and invertebrate model systems. Progress in Neurobiology 93:244–269. DOI: https://doi.org/10.1016/j.pneurobio.2010.11.001, PMID: 21093529
Mulloney B, Smarandache-Wellmann C, Weller C, Hall WM, DiCaprio RA. 2014. Proprioceptive feedbackmodulates coordinating information in a system of segmentally distributed microcircuits. Journal ofNeurophysiology 112:2799–2809. DOI: https://doi.org/10.1152/jn.00321.2014, PMID: 25185816
Mulloney B, Smarandache-Wellmann C. 2012. Neurobiology of the crustacean swimmeret system. Progress inNeurobiology 96:242–267. DOI: https://doi.org/10.1016/j.pneurobio.2012.01.002
Neptune RR, Kautz SA, Zajac FE. 2000. Muscle contributions to specific biomechanical functions do not changein forward versus backward pedaling. Journal of Biomechanics 33:155–164. DOI: https://doi.org/10.1016/S0021-9290(99)00150-5, PMID: 10653028
Nern A, Pfeiffer BD, Rubin GM. 2015. Optimized tools for multicolor stochastic labeling reveal diverse stereotypedcell arrangements in the fly visual system. PNAS 112:E2967–E2976. DOI: https://doi.org/10.1073/pnas.1506763112, PMID: 25964354
Nishimaru H, Kakizaki M. 2009. The role of inhibitory neurotransmission in locomotor circuits of the developingmammalian spinal cord. Acta Physiologica 197:83–97. DOI: https://doi.org/10.1111/j.1748-1716.2009.02020.x,PMID: 19673737
Ohyama T, Schneider-Mizell CM, Fetter RD, Aleman JV, Franconville R, Rivera-Alba M, Mensh BD, Branson KM,Simpson JH, Truman JW, Cardona A, Zlatic M. 2015. A multilevel multimodal circuit enhances action selectionin Drosophila. Nature 520:633–639. DOI: https://doi.org/10.1038/nature14297, PMID: 25896325
Pehlevan C, Paoletti P, Mahadevan L. 2016. Integrative neuromechanics of crawling in D. melanogaster larvae.eLife 5:e11031. DOI: https://doi.org/10.7554/eLife.11031
Pierce-Shimomura JT, Chen BL, Mun JJ, Ho R, Sarkis R, McIntire SL. 2008. Genetic analysis of crawling andswimming locomotory patterns in C. elegans. PNAS 105:20982–20987. DOI: https://doi.org/10.1073/pnas.0810359105, PMID: 19074276
Piggott BJ, Liu J, Feng Z, Wescott SA, Xu XZ. 2011. The neural circuits and synaptic mechanisms underlyingmotor initiation in C. elegans. Cell 147:922–933. DOI: https://doi.org/10.1016/j.cell.2011.08.053, PMID: 22078887
Popescu IR, Frost WN. 2002. Highly dissimilar behaviors mediated by a multifunctional network in the marinemollusk tritonia Diomedea. The Journal of Neuroscience 22:1985–1993. DOI: https://doi.org/10.1523/JNEUROSCI.22-05-01985.2002, PMID: 11880529
Prinz AA, Bucher D, Marder E. 2004. Similar network activity from disparate circuit parameters. NatureNeuroscience 7:1345–1352. DOI: https://doi.org/10.1038/nn1352, PMID: 15558066
Pulver SR, Bayley TG, Taylor AL, Berni J, Bate M, Hedwig B. 2015. Imaging fictive locomotor patterns in larvalDrosophila. Journal of Neurophysiology 114:2564–2577. DOI: https://doi.org/10.1152/jn.00731.2015,PMID: 26311188
Rakowski F, Karbowski J. 2017. Optimal synaptic signaling connectome for locomotory behavior inCaenorhabditis elegans: design minimizing energy cost. PLOS Computational Biology 13:e1005834.DOI: https://doi.org/10.1371/journal.pcbi.1005834, PMID: 29155814
Ramirez JM, Pearson KG. 1988. Generation of motor patterns for walking and flight in motoneurons supplyingbifunctional muscles in the locust. Journal of Neurobiology 19:257–282. DOI: https://doi.org/10.1002/neu.480190307, PMID: 3373206
Roberts A, Li WC, Soffe SR, Wolf E. 2008. Origin of excitatory drive to a spinal locomotor network. BrainResearch Reviews 57:22–28. DOI: https://doi.org/10.1016/j.brainresrev.2007.06.015, PMID: 17825424
Roberts A, Li WC, Soffe SR. 2010. How neurons generate behavior in a hatchling amphibian tadpole: an outline.Frontiers in Behavioral Neuroscience 4:16. DOI: https://doi.org/10.3389/fnbeh.2010.00016, PMID: 20631854
Zarin et al. eLife 2019;8:e51781. DOI: https://doi.org/10.7554/eLife.51781 33 of 34
Research article Neuroscience

Roberts WM, Augustine SB, Lawton KJ, Lindsay TH, Thiele TR, Izquierdo EJ, Faumont S, Lindsay RA, Britton MC,Pokala N, Bargmann CI, Lockery SR. 2016. A stochastic neuronal model predicts random search behaviors atmultiple spatial scales inC. elegans. eLife 5:e12572. DOI: https://doi.org/10.7554/eLife.12572, PMID: 26824391
Saalfeld S, Cardona A, Hartenstein V, Tomancak P. 2009. CATMAID: collaborative annotation toolkit for massiveamounts of image data. Bioinformatics 25:1984–1986. DOI: https://doi.org/10.1093/bioinformatics/btp266,PMID: 19376822
Schlegel P, Texada MJ, Miroschnikow A, Schoofs A, Huckesfeld S, Peters M, Schneider-Mizell CM, Lacin H, Li F,Fetter RD, Truman JW, Cardona A, Pankratz MJ. 2016. Synaptic transmission parallels neuromodulation in acentral food-intake circuit. eLife 5:e16799. DOI: https://doi.org/10.7554/eLife.16799
Schneider-Mizell CM, Gerhard S, Longair M, Kazimiers T, Li F, Zwart MF, Champion A, Midgley FM, Fetter RD,Saalfeld S, Cardona A. 2016. Quantitative neuroanatomy for connectomics in Drosophila. eLife 5:e12059.DOI: https://doi.org/10.7554/eLife.12059, PMID: 26990779
Song J, Ampatzis K, Bjornfors ER, El Manira A. 2016. Motor neurons control locomotor circuit functionretrogradely via gap junctions. Nature 529:399–402. DOI: https://doi.org/10.1038/nature16497,PMID: 26760208
Takagi S, Cocanougher BT, Niki S, Miyamoto D, Kohsaka H, Kazama H, Fetter RD, Truman JW, Zlatic M, CardonaA, Nose A. 2017. Divergent connectivity of homologous Command-like neurons mediates Segment-Specifictouch responses in Drosophila. Neuron 96:1373–1387. DOI: https://doi.org/10.1016/j.neuron.2017.10.030,PMID: 29198754
Takemura SY, Bharioke A, Lu Z, Nern A, Vitaladevuni S, Rivlin PK, Katz WT, Olbris DJ, Plaza SM, Winston P, ZhaoT, Horne JA, Fetter RD, Takemura S, Blazek K, Chang LA, Ogundeyi O, Saunders MA, Shapiro V, Sigmund C,et al. 2013. A visual motion detection circuit suggested by Drosophila connectomics. Nature 500:175–181.DOI: https://doi.org/10.1038/nature12450, PMID: 23925240
Toth TI, Knops S, Daun-Gruhn S. 2012. A neuromechanical model explaining forward and backward stepping inthe stick insect. Journal of Neurophysiology 107:3267–3280. DOI: https://doi.org/10.1152/jn.01124.2011,PMID: 22402652
Tsalik EL, Hobert O. 2003. Functional mapping of neurons that control locomotory behavior in Caenorhabditiselegans. Journal of Neurobiology 56:178–197. DOI: https://doi.org/10.1002/neu.10245, PMID: 12838583
Tschopp F, Reiser M, Turaga S. 2018. A connectome based hexagonal lattice convolutional network model of theDrosophila visual system. arXiv. https://arxiv.org/abs/1806.04793.
van Deursen RW, Flynn TW, McCrory JL, Morag E. 1998. Does a single control mechanism exist for both forwardand backward walking? Gait & Posture 7:214–224. DOI: https://doi.org/10.1016/S0966-6362(98)00007-1,PMID: 10200387
Veenstra JA, Davis NT. 1993. Localization of corazonin in the nervous system of the cockroach Periplanetaamericana. Cell & Tissue Research 274:57–64. DOI: https://doi.org/10.1007/BF00327985, PMID: 8242711
Vidal-Gadea A, Topper S, Young L, Crisp A, Kressin L, Elbel E, Maples T, Brauner M, Erbguth K, Axelrod A,Gottschalk A, Siegel D, Pierce-Shimomura JT. 2011. Caenorhabditis elegans selects distinct crawling andswimming gaits via dopamine and serotonin. PNAS 108:17504–17509. DOI: https://doi.org/10.1073/pnas.1108673108, PMID: 21969584
Wakabayashi T, Kitagawa I, Shingai R. 2004. Neurons regulating the duration of forward locomotion inCaenorhabditis elegans. Neuroscience Research 50:103–111. DOI: https://doi.org/10.1016/j.neures.2004.06.005, PMID: 15288503
Wen Q, Po MD, Hulme E, Chen S, Liu X, Kwok SW, Gershow M, Leifer AM, Butler V, Fang-Yen C, Kawano T,Schafer WR, Whitesides G, Wyart M, Chklovskii DB, Zhen M, Samuel AD. 2012. Proprioceptive coupling withinmotor neurons drives C. elegans forward locomotion. Neuron 76:750–761. DOI: https://doi.org/10.1016/j.neuron.2012.08.039, PMID: 23177960
White JG, Southgate E, Thomson JN, Brenner S. 1986. The structure of the nervous system of the nematodeCaenorhabditis elegans. Philosophical Transactions of the Royal Society B: Biological Sciences 314:1–340.DOI: https://doi.org/10.1098/rstb.1986.0056
Wilson RI, Laurent G. 2005. Role of GABAergic inhibition in shaping odor-evoked spatiotemporal patterns in theDrosophila antennal lobe. Journal of Neuroscience 25:9069–9079. DOI: https://doi.org/10.1523/JNEUROSCI.2070-05.2005, PMID: 16207866
Yoshino J, Morikawa RK, Hasegawa E, Emoto K. 2017. Neural circuitry that evokes escape behavior uponactivation of nociceptive sensory neurons in Drosophila larvae. Current Biology 27:2499–2504. DOI: https://doi.org/10.1016/j.cub.2017.06.068, PMID: 28803873
Zagoraiou L, Akay T, Martin JF, Brownstone RM, Jessell TM, Miles GB. 2009. A cluster of cholinergic premotorinterneurons modulates mouse locomotor activity. Neuron 64:645–662. DOI: https://doi.org/10.1016/j.neuron.2009.10.017, PMID: 20005822
Zhen M, Samuel AD. 2015. C. Elegans locomotion: small circuits, complex functions. Current Opinion inNeurobiology 33:117–126. DOI: https://doi.org/10.1016/j.conb.2015.03.009, PMID: 25845627
Zwart MF, Pulver SR, Truman JW, Fushiki A, Fetter RD, Cardona A, Landgraf M. 2016. Selective inhibitionmediates the sequential recruitment of motor pools. Neuron 91:615–628. DOI: https://doi.org/10.1016/j.neuron.2016.06.031, PMID: 27427461
Zarin et al. eLife 2019;8:e51781. DOI: https://doi.org/10.7554/eLife.51781 34 of 34
Research article Neuroscience