a linear programming approach for aircraft boarding strategy
TRANSCRIPT

European Journal of Operational Research 183 (2007) 394–411
www.elsevier.com/locate/ejor
O.R. Applications
A linear programming approach for aircraft boarding strategy
Massoud Bazargan *
College of Business, Embry-Riddle Aeronautical University, 600 S. Clyde-Morris Blvd., Daytona Beach, FL 32114, United States
Received 19 May 2006; accepted 25 September 2006Available online 14 December 2006
Abstract
Airlines are going through very difficult times financially which has been triggered by fierce competition and currenthigh fuel prices. To stay competitive, it is absolutely essential that they achieve high efficiency in the areas that have controlover. Airlines start generating revenues while their aircraft are flying. Reducing aircraft turn-around times is an importantgoal with passenger boarding being a major metric.
This paper examines the interferences among the passengers that cause delays in boarding times for a single aisle air-craft. It offers a new mixed integer linear program to minimize these interferences. We then apply this mathematicalmodel to an Airbus-320 aircraft. Alternative efficient solutions are generated based on the rate of passenger boarding.A simulation model is adopted to identify appropriate boarding patterns. The recommended boarding patterns providea lower number of interferences than other strategies as well as accommodating neighboring passengers to boardtogether.� 2006 Elsevier B.V. All rights reserved.
Keywords: OR in airlines; Integer programming; Transportation; Boarding strategy
1. Introduction
The airlines are currently undergoing difficult times financially. The increase in fuel prices, competitionfrom low cost carriers and operations inefficiency has resulted in bankruptcies or major losses for airlinesall over the world. The second, third and fourth largest carriers in the US have all filed for bankruptcy. Itis therefore extremely important for airlines to be efficient in the areas that they have control over. Bazargan(2004) provides descriptions and mathematical models commonly adopted by the airlines for scheduling andimproved efficiency.
Airlines start generating revenue by utilizing and flying their aircraft; they do not generate any revenuewhile their aircraft are on the ground. As a result, the turn-around time is a major metric for an airline’s oper-ations (Van de Briel et al., 2005). The time from the arrival of the aircraft until its next departure constitutes
0377-2217/$ - see front matter � 2006 Elsevier B.V. All rights reserved.
doi:10.1016/j.ejor.2006.09.071
* Tel.: +1 386 226 6705.E-mail address: [email protected]

M. Bazargan / European Journal of Operational Research 183 (2007) 394–411 395
turn-around time. To have a higher utilization of their aircraft, airlines attempt to minimize the turn-aroundtimes (Ferrari and Nagel, 2004; Van Landeghem and Beuselinck, 2002; Lewis and Lieber, 2005). The compo-nents in turn-around times include taxi-times, passenger/baggage deplaning, maintenance checks, fueling andpassenger/baggage boarding. Taxi-times are influenced by air/ground congestions at the airports. Therefore,airlines flying short-haul flights typically select airports (within the same region) with low air/ground conges-tions (Bazargan and Vasigh, 2003).
Van Landeghem and Beuselinck (2002) identify that the typical aircraft turn-around (coming to and leavingthe gate) is approximately 30–60 minutes. They do note, however, that this time is almost always in excess of30 minutes. A major component in this metric is the passenger boarding time. Airlines seem to adopt differentaircraft boarding strategies based on airline culture and service level (Van de Briel et al., 2005). Some airlinesdo not impose any strategy and let the passengers board randomly. Others arrange the passengers into groups,zones or call-offs based on specific boarding strategy adopted by the airline. Each of these groups is then calledto board the aircraft in sequence.
The most common traditional boarding aircraft strategies are back-to-front (BF) and window-to-aisle(out–in or OI). In both strategies, passengers are typically assigned to groups. First-class and special need pas-sengers are boarded first. In the back-to-front strategy, as the name implies, passengers start filling up the air-craft from back to the front. The passengers are divided into groups based on the row of their seats from theback of the aircraft to the front. Each group is then called in sequence to board the aircraft (see Figs. 2–4 whena = 1). In the out–in (OI) strategy, the emphasis is based on the locations of the seat, whether it is a window,middle or aisle seat (see Fig. 2 when a = 0). Different airlines either adopt one of these two strategies or ahybrid of the two.
Surprisingly, the aircraft boarding strategy has received little attention from both academia and theindustry. The few reported research and published works on this topic focus on modeling the problem usingcomputer-based simulation (see for example Ferrari and Nagel, 2004; Ferrari, 2005; Van Landeghem andBeuselinck, 2002). While these methods provide a good understanding of existing boarding strategies andenable us to evaluate various known strategies and conduct what-if scenarios, they do not help us findthe best and possibly unknown alternatives (Van de Briel et al., 2005). Analytical approaches can helpachieve these alternatives. Unfortunately, the number of analytical approaches to boarding strategy is evenscarcer.
A recent and very interesting analytical approach to aircraft boarding strategy is by Van de Briel et al.(2005). They model the aircraft boarding strategy using a non-linear assignment model with quadratic andcubic terms. The model attempts to minimize the total interferences among the passengers (discussed laterin Section 3). The non-linear problem belonging to NP-hard complexity class is solved and verified using sim-ulation modeling. The final recommended ‘reverse pyramid’ boarding strategy was implemented at AmericaWest Airline.
This paper presents a new mixed integer linear program approach to generate efficient boarding strategies.As indicated earlier, analytical approaches on this topic are very limited. To the best of our knowledge, nolinear programming approach has been adopted to study the boarding strategies. The mathematical modelattempts to minimize the total interferences among the passengers which are major causes for boarding delays,subject to operational and side constraints. The model provides the flexibility to optimize the boarding timesfor various aircraft with different seat capacities. The model also allows us to examine the impact of number ofboarding groups and the speed that these groups are called on the overall adopted boarding strategy. Thispaper then adopts the mathematical model to a single aisle Airbus-320 aircraft. This specific type of aircraftwas selected because it is one of the most common types of aircraft adopted by many airlines. Another reasonwas that it enables us to provide a comparison between the performance of our model and those reported bythe non-linear model developed by Van de Briel et al. (2005), who adopted a similar aircraft in their analysis.A simulation model is included to provide some guidelines on the speed of boarding the passengers and how itaffects the efficient patterns for boarding the aircraft.
Sections 2 and 3 define interferences and how they are formulated in our model. Section 4 presents themixed linear integer model. Sections 5 and 6 examine the parameters and solutions generated by the mathe-matical model. Sections 7 and 8 present the simulation model and recommendations finally Section 9concludes this paper.
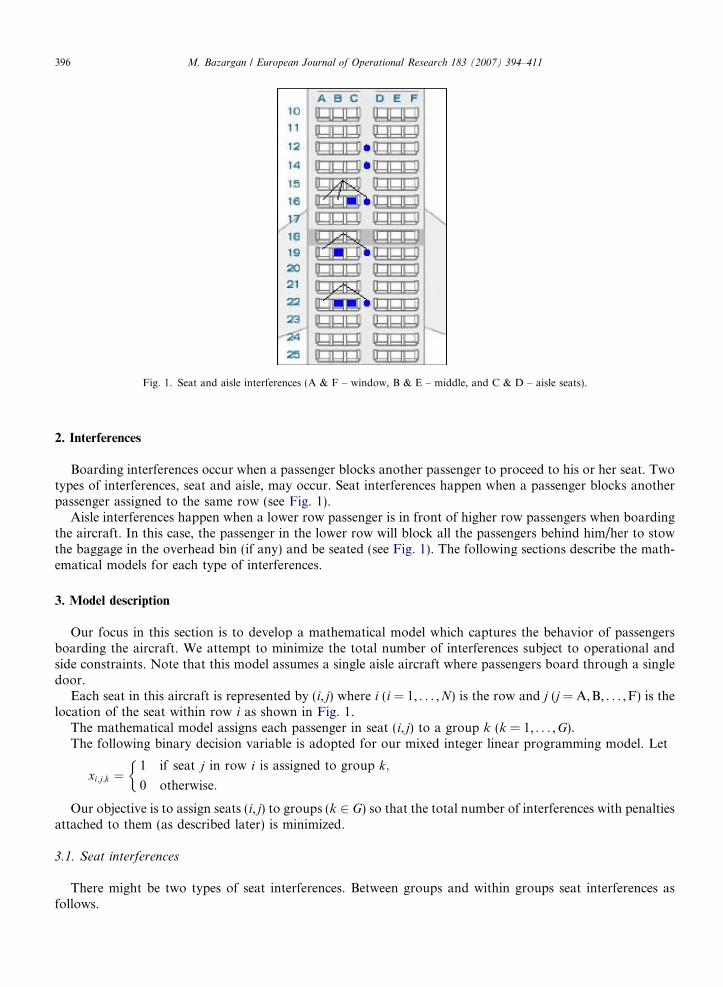
Fig. 1. Seat and aisle interferences (A & F – window, B & E – middle, and C & D – aisle seats).
396 M. Bazargan / European Journal of Operational Research 183 (2007) 394–411
2. Interferences
Boarding interferences occur when a passenger blocks another passenger to proceed to his or her seat. Twotypes of interferences, seat and aisle, may occur. Seat interferences happen when a passenger blocks anotherpassenger assigned to the same row (see Fig. 1).
Aisle interferences happen when a lower row passenger is in front of higher row passengers when boardingthe aircraft. In this case, the passenger in the lower row will block all the passengers behind him/her to stowthe baggage in the overhead bin (if any) and be seated (see Fig. 1). The following sections describe the math-ematical models for each type of interferences.
3. Model description
Our focus in this section is to develop a mathematical model which captures the behavior of passengersboarding the aircraft. We attempt to minimize the total number of interferences subject to operational andside constraints. Note that this model assumes a single aisle aircraft where passengers board through a singledoor.
Each seat in this aircraft is represented by (i, j) where i (i = 1, . . . ,N) is the row and j (j = A,B, . . . ,F) is thelocation of the seat within row i as shown in Fig. 1.
The mathematical model assigns each passenger in seat (i, j) to a group k (k = 1, . . . ,G).The following binary decision variable is adopted for our mixed integer linear programming model. Let
xi;j;k ¼1 if seat j in row i is assigned to group k;
0 otherwise:
�
Our objective is to assign seats (i, j) to groups (k 2 G) so that the total number of interferences with penaltiesattached to them (as described later) is minimized.
3.1. Seat interferences
There might be two types of seat interferences. Between groups and within groups seat interferences asfollows.

M. Bazargan / European Journal of Operational Research 183 (2007) 394–411 397
3.1.1. Between groups seat interferences
This type of seat interference occurs when a passenger from a previous group blocks another passenger in alater group. For example, in Fig. 1 if the passenger in seat 16C (aisle seat) boarded in group 2 and passenger16B (middle seat) boarded in a later group, then the passenger in 16C is blocking passenger in seat 16B. In thiscase, the passenger in seat 16C needs to exit and let the passenger in 16B first, thus blocking the flow of otherpassengers in the aisle. More seat interferences occur if the passenger in seat 16A (window seat) boards afterthese two passengers.
Considering all the possible combinations, four types of seat interferences between different groups can occur.The first is when the aisle seat blocks middle seat. The second is when the aisle seat blocks the passenger in windowseat. The third type is when the middle seat block window seat, and finally, the fourth is when both aisle and middleseats block the passenger in the window seat. We examine the mathematical model for each case separately.
3.1.1a. Aisle and middle seat interferences
First we develop the seat interferences on the left hand side of the aircraft according to Fig. 1 for seats Band C. We define SBi,BC,k as a binary variable representing number of seat interference between the aisle (seatC) and middle seat (seat B) in row i who boarded in group k. SBi,BC,k takes a value of 1 if an interferenceoccurs and 0 otherwise.
Mathematically, SBi,BC,k can be expressed as the following constraint in our mathematical model:
TableExami
xi,B,k
1010
SBi;BC;k P xi;B;k þXk�1
l¼1
xi;C;l � 1 8i; and k > 1: ð3:1Þ
On the right hand side of this constraint, we have xi,B,k which represents if the passenger in the middle seat (B)boards in group k and
Pk�1l¼1 xi;C;l indicates that if the passenger sitting in the aisle seat C has boarded in all
previous groups (before k). The term (�1) in the above constraint is added to set the value of SBi,BC,k equalto 1 if there is an interference and 0 otherwise. Table 1 clarifies this further and examine the values of SBi,BC,k
for a given row i.Note that in the constraint (3.1) we use greater or equal sign (P). This is to insure that SBi,BC,k takes a value
of 0 for the last case in Table 1 if both terms on the right hand side are 0.Similarly we write the constraint for aisle and middle seat interferences (seats E and D) on the right hand
side of the aircraft
SBi;ED;k P xi;E;k þXk�1
l¼1
xi;D;l � 1 8i; and k > 1 ð3:2Þ
3.1.1b. Aisle and window seat interferencesWe adopt a similar approach as 3.1.1a to express the number of seat interferences and its corresponding
constraints between aisle and window seats among different groups for both sides of the aircraft.
SBi;AC;k P xi;A;k þXk�1
l¼1
xi;C;l � 1 8i; and k > 1; ð3:3Þ
SBi;FD;k P xi;F;k þXk�1
l¼1
xi;D;l � 1 8i; and k > 1: ð3:4Þ
1ning aisle and middle seat interferencePk�1
l¼1 xi;C;l SBi,BC,k P Comments
1 1 Interference occurs1 0 No interference0 0 No interference0 �1 No interference

398 M. Bazargan / European Journal of Operational Research 183 (2007) 394–411
3.1.1c. Window and middle seat interferences
Similarly the number of seat interference and constraint between window and middle seats among differentgroups for both sides of the aircraft are as follows:
SBi;AB;k P xi;A;k þXk�1
l¼1
xi;B;l � 1 8i; and k > 1; ð3:5Þ
SBi;FE;k P xi;F;k þXk�1
l¼1
xi;E;l � 1 8i; and k > 1: ð3:6Þ
3.1.1d. Window with both aisle and middle seats interferences
Having established the above seat interferences, we do not need to express a specific set of constraints for awindow seat when both middle and aisle seats have already boarded. This type of interference has alreadybeen addressed in the form of two separate constraints (interferences) in this section. These two interferencesare window with middle and window with aisle seats. For example, consider a case when a passenger in seat Aboards just after both passengers in seats B and C. In this case, according to constraints (3.3) and (3.5) aboveboth SBi,AC,k and SBi,AB,k will take a value of 1 implying that the passenger sitting in seat A (window) willhave a total of 2 seat interferences with aisle and middle seats.
3.1.1e. Total seat interferences among different groups
We can now express the total number of seat interferences between different groups by adding all the seatinterferences discussed above. Let TSB represent the total seat interferences between groups, then
TSB ¼XN
i¼1
XG
k¼2
ðSBi;BC;k þ SBi;ED;k þ SBi;AC;k þ SBi;FD;k þ SBi;AB;k þ SBi;FE;kÞ: ð3:7Þ
3.1.1f. Within groups seat interferences
This type of interference occurs among the passengers boarding in the same group. We assume that thesequence that the passengers within a group board the aircraft is random. For example, suppose that passen-gers in seats 16A and 16B are boarding in the same group. When their group is called then passenger 16A mayboard first and will be in front of 16B in their respected group or vice versa. In the former case when the pas-senger in seat 16A boards before 16B, no interference will occur. However, in the latter case when the passen-ger in 16B boards before 16A, we have one seat interference.
Adopting the same argument as Section 3.1.1, we denote the binary variable SWi,BC,k to represent the seatinterference between the aisle seat C and middle seat B who board in the same group. We can write the fol-lowing constraint for this variable:
SW i;BC;k P xi;B;k þ xi;C;k � 1 8i; k: ð3:8Þ
Similar to Section 3.1.1a, SWi,BC,k can take a value of 1 or 0 depending on values of xi,B,k and xi,C,k. If bothpassengers in seats B and C in row i are boarding in the same group k, then the constraint (3.8) returns a valueof 1 for SWi,BC,k otherwise it will be 0. However, as indicated before the order of these two passengers is ran-dom. Therefore the expected number of seat interferences between passengers in seats B and C within the samegroup is
1
2SW i;BC;k: ð3:9Þ
Similarly, we can express constraints for other seat interferences within the same group as follows:
SW i;AC;k P xi;A;k þ xi;C;k � 1 8i; k; ð3:10ÞSW i;AB;k P xi;A;k þ xi;B;k � 1 8i; k; ð3:11Þ

TableSeat in
Order
..A..B.
..A..C.
..B..C.
..B..A.
..C..B.
..C..A.
Total
M. Bazargan / European Journal of Operational Research 183 (2007) 394–411 399
SW i;ED;k P xi;E;k þ xi;D;k � 1 8i; k; ð3:12ÞSW i;FD;k P xi;F;k þ xi;D;k � 1 8i; k; ð3:13ÞSW i;FE;k P xi;F;k þ xi;E;k � 1 8i; k: ð3:14Þ
Similar to expression (3.9), the expected number of seat interferences within each group is 1/2 each of theabove SW. Again we do not need to add a new constraint for the case when all three neighboring passengersare in the same group. This is because the variables (SW) in the constraints relating to every pair of these threepassengers returns a value of 1.
To clarify this, let us examine this using our constraints described in this section. If neighboring passengersin seats A, B and C are all in the same group, then all three corresponding SW in constraints (3.8), (3.10) and(3.11) take a value of 1. The expected number of seat interferences is 1/2 for each of the corresponding SW.Therefore the expected number of interferences is 1.5 which is obtained by adding 1
2þ 1
2þ 1
2.
Now let us consider all possible combinations for boarding these 3 passengers. Table 2 shows the sequenceand the number of interferences for each combination. As we can see, there are 6 combinations with a total of9 interferences. Therefore, on average we have 9/6 or 1.5 interferences, which is the same as was implied by theconstraints discussed above.
The total seat interferences within the same groups (TSW) is therefore obtained by
TSW ¼ 1
2
XN
i¼1
XG
k¼1
SW i;BC;k þ SW i;ED;k þ SW i;AC;k þ SW i;FD;k þ SW i;AB;k þ SW i;FE;kð Þ: ð3:15Þ
3.2. Aisle interferences
In this section, we formulate the aisle interferences. Similar to seat interferences, there are two types of aisleinterferences, within groups and between groups.
3.2.1. Within groups aisle interferencesThis common type of aisle interference relates to cases where passengers assigned to a group block each
other. This occurs when a passenger in a lower row blocks other passengers behind him/her in order to beseated. The problem becomes compounded when the passenger has multiple bags to store in the overhead bins(Van Landeghem and Beuselinck, 2002). We further break down these within group aisle interferences intointerferences with lower rows and interferences with same rows.
3.2.1a. Within groups aisle interferences with lower rows
Let the integer variable AW1i,j,k represent the (maximum) number of aisle interference for passenger in seat(i, j) assigned to group k with lower row passengers in the same group. Similar to the previous section, we canwrite the constraint for AW1i,j,k as follows:
AW 1i;j;k P 6ði� 1Þxi;j;k þXi�1
u¼1
X6
v¼1
xu;v;k � 6ði� 1Þ 8i > 1; j; k: ð3:16Þ
2terferences for neighboring passengers boarding in the same group
Number of interferences
.C.. 3
.B.. 2.A.. 1.C.. 2.A.. 0.B.. 1
9
400 M. Bazargan / European Journal of Operational Research 183 (2007) 394–411
On the right hand side of this constraint, the first term takes a value of 6(i � 1) if the passenger in seat (i, j) isassigned to group k and zero otherwise. The second term, adds up all the passengers in the same group k, whohave a lower row seat assignment than i. The third term on the right hand side is adopted to provide the cor-rect count on aisle interferences for AW1i,j,k.
Note that to determine AW1i,j,k we added-up all the passengers in lower rows than row i. This implies theworst case where the passenger in seat (i, j) boards after all passengers in lower rows in the same group. There-fore, AW1i,j,k represents the maximum number of aisle interference for passenger in seat (i, j) assigned to groupk.
The lowest number of aisle interferences for the passenger in seat (i, j) assigned to group k, occurs if thispassenger boards before all the passengers in lower rows in that group. In this case since this passenger movesall the way down the aisle to his/her designated row without being blocked by anyone within this group, thenthere are no within group aisle interferences. Therefore, the expected number of aisle interferences for passen-ger in seat (i, j) assigned to group k is
expected number of aisle inteferences ¼ minþmax
2¼ 0þ AW 1i;j;k
2¼ 1
2AW 1i;j;k: ð3:17Þ
The total expected number of aisle interferences for all passengers with their lower row passengers presentedby AWL, is therefore determined by
AWL ¼ 1
2
XN
i¼2
X6
j¼1
XG
k¼1
AW 1i;j;k: ð3:18Þ
3.2.1b. Within groups aisle interferences in the same rowIn Section 3.2.1a above, we did not consider possible aisle interferences among the passengers in the same
row and same group. This section addresses the expected number of aisle interferences for these passengers.We define integer variable AW2i,j,k to represent the (maximum) number of aisle interferences between the pas-senger in seat (i, j) and all other passengers in the same row i, all boarding in group k. We write the followingconstraint for AW2i,j,k:
AW 2i;j;k P 5xi;j;k þX6
u¼1;u6¼j
xi;u;k � 5 8i; j; k: ð3:19Þ
The first term on the right hand side takes a value of 5 or zero depending on if the passenger in seat (i, j) is ingroup k or not. The second term on the RHS adds up the number of all the passengers in row i and group k,except the passenger seating in (i, j). The third term is again used to provide the right number of counts foraisle interferences. Similar to the previous section, the minimum number of interferences for passenger in seat(i, j) boarding in group k is 0 and the maximum is AW2i,j,k. Therefore the expected number of aisle interfer-ences in the same row within the same group for this passenger is 1/2AW2i,j,k.
We define AWS, to represent the total expected number of same row aisle interferences for all passengerswhich is given by
AWS ¼ 1
2
XN
i¼1
X6
j¼1
XG
k¼1
AW 2i;j;k: ð3:20Þ
3.2.2. Between groups aisle interferences
This type of aisle interference, as many of us have experienced, occurs when a group of passengers are calledto board the aircraft while some or all of the passengers in the previous group are still in the jet-way (staircase)or aircraft door trying to be seated. These interferences occur and get worse as the time between boarding thepassengers and groups decrease. We define the integer variable ABi,j,k to represent the maximum number ofaisle interferences for passenger in seat (i, j) who boards in group k (k > 1) with all the passengers in the pre-vious group (k � 1). We write the following constraint for ABi,j,k:

M. Bazargan / European Journal of Operational Research 183 (2007) 394–411 401
ABi;j;k P 6ðiÞxi;j;k þXi
i¼1
X6
u¼1
xi;u;k�1 � 6ðiÞ 8i; j; k > 1: ð3:21Þ
The first term on the right hand side of this constraint takes a value of 6i if passenger in seat (i, j) is assigned togroup k and 0 otherwise. The second term adds up all the passengers who boarded in group (k � 1). Again thethird term is used to provide the correct count.
This constraint for ABi,j,k assumes that none of the passengers in the previous group is seated when the pas-senger in seat (i, j) assigned to group k boards the aircraft. Of course, the expected number of aisle interfer-ences for this passenger depends on how quickly each group of passengers is called to board the aircraft.We will assume that for any passenger in group k(k > 1) boarding the aircraft, there is a fraction of passengersfrom the previous group (k � 1) still in the jet-way trying to reach to their rows and seats. We call this fractiona (0 6 a 6 1). Therefore, the expected number of aisle interferences between the passenger in seat (i, j) assignedto group k with passengers in group (k � 1) is aABi,j,k.
When a is 0, no aisle interferences occur between groups. This occurs when a new group of passengers iscalled to board the aircraft and all passengers in the previous group are fully seated. On the other extreme,when a is equal to 1, the time between calling groups to board is so short that the passengers in each groupline up behind the previous group in the aisle or jet-way. In our later analyses, we examine various values for aand its impact on boarding pattern and strategy.
Let ABG represent the total aisle interferences between groups for all passengers boarding in group k
(k > 1). ABG is therefore determined by
ABG ¼ aXN
i¼1
X6
j¼1
XG
k¼2
ABi;j;k: ð3:22Þ
To keep the model simple at this stage and without loss of generality, we only included aisle interferences be-tween passengers in group k (k > 1) with passengers in group (k � 1). It is of course possible to mathematicallyinclude the aisle interferences between passengers in group k and groups (k � 2, for k > 2) or (k � 3 for k > 3),etc. Our simulation study, discussed later, also confirmed that for realistic times between passengers to boardthe aircraft, these second or third level interferences are relatively very low compared to the first level that isconsidered in the model.
4. Mathematical model
We can now summarize our mixed integer linear program as follows:
Minimize p1TSBþ p2TSW þ p3AWLþ p4AWS þ p5ABG ð4:1Þ
Subject to : SBi;BC;k P xi;B;k þXk�1
l¼1
xi;C;l � 1 8i; and k > 1; ð4:2Þ
SBi;ED;k P xi;E;k þXk�1
l¼1
xi;D;l � 1 8i; and k > 1; ð4:3Þ
SBi;AC;k P xi;A;k þXk�1
l¼1
xi;C;l � 1 8i; and k > 1; ð4:4Þ
SBi;FD;k P xi;F;k þXk�1
l¼1
xi;D;l � 1 8i; and k > 1; ð4:5Þ
SBi;AB;k P xi;A;k þXk�1
l¼1
xi;B;l � 1 8i; and k > 1; ð4:6Þ
SBi;FE;k P xi;F;k þXk�1
l¼1
xi;E;l � 1 8i; and k > 1; ð4:7Þ

402 M. Bazargan / European Journal of Operational Research 183 (2007) 394–411
SW i;BC;k P xi;B;k þ xi;C;k � 1 8i; k; ð4:8ÞSW i;AC;k P xi;A;k þ xi;C;k � 1 8i; k; ð4:9ÞSW i;AB;k P xi;A;k þ xi;B;k � 1 8i; k; ð4:10ÞSW i;ED;k P xi;E;k þ xi;D;k � 1 8i; k; ð4:11ÞSW i;FD;k P xi;F;k þ xi;D;k � 1 8i; k; ð4:12ÞSW i;FE;k P xi;F;k þ xi;E;k � 1 8i; k; ð4:13Þ
AW 1i;j;k P 6ði� 1Þxi;j;k þXi�1
u¼1
X6
v¼1
xu;v;k � 6ði� 1Þ 8i > 1; j; k; ð4:14Þ
AW 2i;j;k P 5xi;j;k þX6
u¼1;u 6¼j
xi;u;k � 5 8i; j; k; ð4:15Þ
ABi;j;k P 6ðiÞxi;j;k þXi
i¼1
X6
u¼1
xi;u;k�1 � 6ðiÞ 8i; j; k > 1; ð4:16Þ
TSB ¼XN
i¼1
XG
k¼2
ðSBi;BC;k þ SBi;ED;k þ SBi;AC;k þ SBi;FD;k þ SBi;AB;k þ SBi;FE;kÞ; ð4:17Þ
TSW ¼ 1
2
XN
i¼1
XG
k¼1
ðSW i;BC;k þ SW i;ED;k þ SW i;AC;k þ SW i;FD;k þ SW i;AB;k þ SW i;FE;kÞ; ð4:18Þ
AWS ¼ 1
2
XN
i¼1
X6
j¼1
XG
k¼1
AW 2i;j;k; ð4:19Þ
AWL ¼ 1
2
XN
i¼2
X6
j¼1
XG
k¼1
AW 1i;j;k; ð4:20Þ
ABG ¼ aXN
i¼1
X6
j¼1
XG
k¼2
ABi;j;k; ð4:21Þ
XG
k¼1
xi;j;k ¼ 1 8i; j; ð4:22Þ
XN
i¼1
X6
j¼1
xi;j;k P min pax 8k; ð4:23Þ
XN
i¼1
X6
j¼1
xi;j;k 6 max pax 8k; ð4:24Þ
xi;j;k 2 f0; 1g 8i; j; k: ð4:25Þ
The objective function (4.1) attempts to minimize the total expected number of seat and aisle interferences.p1,p2, . . . ,p5 represent the penalties assigned to different types of interferences. The values of these penaltieswill be discussed later. The set of constraints (4.2) to (4.21) were explained extensively in Section 3. Constraint(4.22) ensures that each seat is assigned to only one group. The constraints (4.23) and (4.24) assign a minimum(min_pax) and maximum (max_pax) number of passengers to each group and finally (4.25) indicates that thedecision variables are binary.
5. Model parameters
As indicated before, p1,p2, . . . ,p5 are adopted to assign different weights to different seat and aisle interfer-ences. The literature adopting simulation for boarding strategy mainly use triangular distributions (Keltonet al., 2002) to model the times for seat and aisle interferences. Van Landeghem and Beuselinck (2002) use

M. Bazargan / European Journal of Operational Research 183 (2007) 394–411 403
triangular distributions (3, 3.6,4.2) and (1.8,2.4, 3) seconds in their models for seat and aisle interferencesrespectively. Similar time parameters are used in the simulation study by Ferrari and Nagel (2004). Weadopted the mean of these distributions to represent the penalties. These distributions have a mean of 3.6and 2.4 for seat and aisle interferences respectively. Without loss of generality, we assign the same weightto seat (TSB and TSW) and same weight to aisle (AWL, AWS, ABG) interferences as follows:
p1 ¼ p2 ¼ 3:6;
p3 ¼ p4 ¼ p5 ¼ 2:4:
In Section 3, we assumed that for passengers in group k (k > 1) boarding the aircraft, there is a fraction ofpassengers from the previous group (k � 1) still in the jet-way trying to reach their seats. We called this frac-tion a (0 6 a 6 1). The two extreme cases when a is 0 or 1, representing situations when there is 0% or 100%between group interferences, were discussed earlier. To identify the impact of a on boarding strategy, however,we considered various values for this parameter. We solved the above mathematical model for the followingvalues of a:
a 2 f0; :1; :3; :5; :7; :9; 1g:
The airlines typically adopt 4, 5 or 6 groups to board the passengers (Van de Briel et al., 2005). To provide abetter understanding of boarding strategy as the number of groups change and to make a comparison withresults reported in the literature, we also solved our mixed integer model with 4, 5 and 6 groups, i.e.
G 2 f4; 5; 6g:
Typically the airlines favor a balanced number of passengers among different groups. In our model, we setmin_pax and max_pax, to allow a maximum of 20% fluctuations around the mean as follows:
min pax ¼ NG� :8
� �;
max pax ¼ NG� 1:2
� �;
where d•e denotes the integer value of ‘•’. N represents the number of rows.Similar to Van de Briel et al. (2005), we consider an Airbus-320 airplane with 26 rows. The first three rows
(with 4 seats in each row) are assigned to first/business class (group 1) and always board first. In our model westudy all other passengers who are assigned to the other 23 rows (N = 23), with six seats in each row, who mustbe allocated to different groups.
6. Computation and implementation
Considering the possible values for parameters, we have 21 (3 groups (G) and 7 values of a for each group)mixed integer linear models. The 4, 5 and 6 group linear integer models have 414, 552 and 690 binary decisionvariables and 2131, 2886 and 3641 constraints respectively. These models were solved using CPLEX (www.i-log.com) solver.
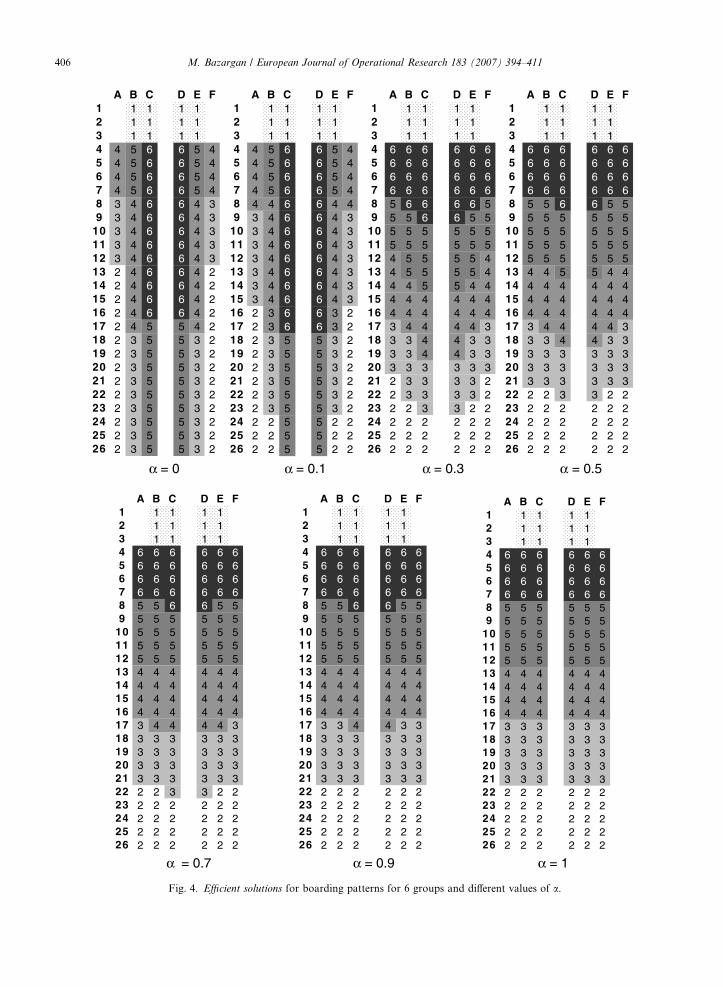
Figs. 2–4 present the different boarding patterns based on the solutions generated for 4, 5 and 6 groupsand each values of a respectively. In this paper, we refer to these solutions as ‘efficient solutions’. It is of inter-est to see how various values of a impact the boarding pattern. As these figures imply, the patterns shift fromreverse pyramid (RP) to back-to-front (BF) as a increases. Specifically, we see that for a P .5 the pattern rap-idly starts to converge to back-to-front strategy. This occurs when the time between boarding the passengersinto the aircraft is so short that each group lines-up behind at least 50% of passengers from the previousgroup.
Tables 3–5 present the number of seat, aisle, total interferences and the values of objective functions forefficient solutions for each group and each value of a. Column ‘eff sol’ represents each of the interferences

A B C D E F1 1 1 1 12 1 1 1 13 1 1 1 14 2 3 4 4 3 25 2 3 4 4 3 26 2 3 4 4 3 27 2 3 4 4 3 28 2 3 4 4 3 29 2 3 4 4 3 2
10 2 3 4 4 3 211 2 3 4 4 3 212 2 3 4 4 3 213 2 3 4 4 3 214 2 3 4 4 3 215 2 3 4 4 3 216 2 3 4 4 3 217 2 3 4 4 3 218 2 3 4 4 3 219 2 3 4 4 3 220 2 3 4 4 3 221 2 3 4 4 3 222 2 3 4 4 3 223 2 3 4 4 3 224 2 3 4 4 3 225 2 3 4 4 3 226 2 3 4 4 3 2
A B C D E F1 1 1 1 12 1 1 1 13 1 1 1 14 4 4 4 4 4 45 4 4 4 4 4 46 4 4 4 4 4 47 3 4 4 4 4 38 3 4 4 4 4 39 3 4 4 4 4 3
10 3 4 4 4 4 311 3 4 4 4 4 312 3 3 4 4 3 313 3 3 4 4 3 314 3 3 4 4 3 315 2 3 4 4 3 216 2 3 3 3 3 217 2 3 3 3 3 218 2 2 3 3 2 219 2 2 3 3 2 220 2 2 3 3 2 221 2 2 3 3 2 222 2 2 3 3 2 223 2 2 3 3 2 224 2 2 3 3 2 225 2 2 2 2 2 226 2 2 2 2 2 2
A B C D E F1 1 1 1 12 1 1 1 13 1 1 1 14 4 4 4 4 4 45 4 4 4 4 4 46 4 4 4 4 4 47 4 4 4 4 4 48 4 4 4 4 4 49 4 4 4 4 4 4
10 3 4 4 4 4 311 3 4 4 4 4 312 3 3 4 4 3 313 3 3 3 3 3 314 3 3 3 3 3 315 3 3 3 3 3 316 3 3 3 3 3 317 3 3 3 3 3 318 2 3 3 3 3 219 2 2 3 3 2 220 2 2 3 3 2 221 2 2 2 2 2 222 2 2 2 2 2 223 2 2 2 2 2 224 2 2 2 2 2 225 2 2 2 2 2 226 2 2 2 2 2 2
A B C D E F1 1 1 1 12 1 1 1 13 1 1 1 14 4 4 4 4 4 45 4 4 4 4 4 46 4 4 4 4 4 47 4 4 4 4 4 48 4 4 4 4 4 49 4 4 4 4 4 4
10 4 4 4 4 4 411 3 4 4 4 4 312 3 3 3 3 3 313 3 3 3 3 3 314 3 3 3 3 3 315 3 3 3 3 3 316 3 3 3 3 3 317 3 3 3 3 3 318 3 3 3 3 3 319 2 2 3 3 2 220 2 2 2 2 2 221 2 2 2 2 2 222 2 2 2 2 2 223 2 2 2 2 2 224 2 2 2 2 2 225 2 2 2 2 2 226 2 2 2 2 2 2
α = 0 α = 0.1 α = 0.3 α = 0.5
A B C D E F1 1 1 1 12 1 1 1 13 1 1 1 14 4 4 4 4 4 45 4 4 4 4 4 46 4 4 4 4 4 47 4 4 4 4 4 48 4 4 4 4 4 49 4 4 4 4 4 4
10 4 4 4 4 4 411 3 4 4 4 4 312 3 3 3 3 3 313 3 3 3 3 3 314 3 3 3 3 3 315 3 3 3 3 3 316 3 3 3 3 3 317 3 3 3 3 3 318 3 3 3 3 3 319 2 2 3 3 2 220 2 2 2 2 2 221 2 2 2 2 2 222 2 2 2 2 2 223 2 2 2 2 2 224 2 2 2 2 2 225 2 2 2 2 2 226 2 2 2 2 2 2
A B C D E F1 1 1 1 12 1 1 1 13 1 1 1 14 4 4 4 4 4 45 4 4 4 4 4 46 4 4 4 4 4 47 4 4 4 4 4 48 4 4 4 4 4 49 4 4 4 4 4 4
10 4 4 4 4 4 411 3 3 4 4 3 312 3 3 3 3 3 313 3 3 3 3 3 314 3 3 3 3 3 315 3 3 3 3 3 316 3 3 3 3 3 317 3 3 3 3 3 318 3 3 3 3 3 319 2 2 2 2 2 220 2 2 2 2 2 221 2 2 2 2 2 222 2 2 2 2 2 223 2 2 2 2 2 224 2 2 2 2 2 225 2 2 2 2 2 226 2 2 2 2 2 2
A B C D E F1 1 1 1 12 1 1 1 13 1 1 1 14 4 4 4 4 4 45 4 4 4 4 4 46 4 4 4 4 4 47 4 4 4 4 4 48 4 4 4 4 4 49 4 4 4 4 4 4
10 4 4 4 4 4 411 3 3 3 3 3 312 3 3 3 3 3 313 3 3 3 3 3 314 3 3 3 3 3 315 3 3 3 3 3 316 3 3 3 3 3 317 3 3 3 3 3 318 3 3 3 3 3 319 2 2 2 2 2 220 2 2 2 2 2 221 2 2 2 2 2 222 2 2 2 2 2 223 2 2 2 2 2 224 2 2 2 2 2 225 2 2 2 2 2 226 2 2 2 2 2 2
α = 0.7 α = 0.9 α = 1
Fig. 2. Efficient solutions for boarding patterns for 4 groups and different values of a.
404 M. Bazargan / European Journal of Operational Research 183 (2007) 394–411

A B C D E F1 1 1 1 12 1 1 1 13 1 1 1 14 3 4 5 5 4 35 3 4 5 5 4 36 3 4 5 5 4 37 3 4 5 5 4 38 3 4 5 5 4 39 2 4 5 5 4 2
10 2 4 5 5 4 211 2 4 5 5 4 212 2 4 5 5 4 213 2 4 5 5 4 214 2 4 5 5 4 215 2 3 5 5 3 216 2 3 5 5 3 217 2 3 5 5 3 218 2 3 5 5 3 219 2 3 5 5 3 220 2 3 5 5 3 221 2 3 4 4 3 222 2 3 4 4 3 223 2 3 4 4 3 224 2 3 4 4 3 225 2 3 4 4 3 226 2 3 4 4 3 2
A B C D E F1 1 1 1 12 1 1 1 13 1 1 1 14 5 5 5 5 5 55 4 5 5 5 5 46 4 5 5 5 5 47 4 5 5 5 5 48 4 5 5 5 5 49 4 5 5 5 5 4
10 4 4 5 5 4 411 4 4 5 5 4 412 3 4 5 5 4 313 3 4 5 5 4 314 3 4 5 5 4 315 3 3 4 4 3 316 2 3 4 4 3 217 2 3 4 4 3 218 2 3 4 4 3 219 2 3 4 4 3 220 2 3 4 4 3 221 2 3 3 3 3 222 2 2 3 3 2 223 2 2 3 3 2 224 2 2 3 3 2 225 2 2 3 3 2 226 2 2 3 3 2 2
A B C D E F1 1 1 1 12 1 1 1 13 1 1 1 14 5 5 5 5 5 55 5 5 5 5 5 56 5 5 5 5 5 57 5 5 5 5 5 58 4 5 5 5 5 49 4 5 5 5 5 4
10 4 4 5 5 4 411 4 4 4 4 4 412 4 4 4 4 4 413 4 4 4 4 4 414 3 4 4 4 4 315 3 4 4 4 4 316 3 3 4 4 3 317 3 3 3 3 3 318 3 3 3 3 3 319 3 3 3 3 3 320 2 3 3 3 3 221 2 2 3 3 2 222 2 2 3 3 2 223 2 2 3 3 2 224 2 2 3 3 2 225 2 2 3 3 2 226 2 2 3 3 2 2
A B C D E F1 1 1 1 12 1 1 1 13 1 1 1 14 5 5 5 5 5 55 5 5 5 5 5 56 5 5 5 5 5 57 5 5 5 5 5 58 5 5 5 5 5 59 4 5 5 5 5 4
10 4 4 4 4 4 411 4 4 4 4 4 412 4 4 4 4 4 413 4 4 4 4 4 414 4 4 4 4 4 415 3 3 4 4 3 316 3 3 3 3 3 317 3 3 3 3 3 318 3 3 3 3 3 319 3 3 3 3 3 320 3 3 3 3 3 321 2 2 3 3 2 222 2 2 2 2 2 223 2 2 2 2 2 224 2 2 2 2 2 225 2 2 2 2 2 226 2 2 2 2 2 2
α = 0 α = 0.1 α = 0.3 α = 0.5
A B C D E F1 1 1 1 12 1 1 1 13 1 1 1 14 5 5 5 5 5 55 5 5 5 5 5 56 5 5 5 5 5 57 5 5 5 5 5 58 5 5 5 5 5 59 4 5 5 5 5 4
10 4 4 4 4 4 411 4 4 4 4 4 412 4 4 4 4 4 413 4 4 4 4 4 414 4 4 4 4 4 415 3 3 4 4 3 316 3 3 3 3 3 317 3 3 3 3 3 318 3 3 3 3 3 319 3 3 3 3 3 320 3 3 3 3 3 321 2 2 3 3 2 222 2 2 2 2 2 223 2 2 2 2 2 224 2 2 2 2 2 225 2 2 2 2 2 226 2 2 2 2 2 2
A B C D E F1 1 1 1 12 1 1 1 13 1 1 1 14 5 5 5 5 5 55 5 5 5 5 5 56 5 5 5 5 5 57 5 5 5 5 5 58 5 5 5 5 5 59 5 5 5 5 5 5
10 4 4 4 4 4 411 4 4 4 4 4 412 4 4 4 4 4 413 4 4 4 4 4 414 4 4 4 4 4 415 3 3 3 3 3 316 3 3 3 3 3 317 3 3 3 3 3 318 3 3 3 3 3 319 3 3 3 3 3 320 3 3 3 3 3 321 2 2 2 2 2 222 2 2 2 2 2 223 2 2 2 2 2 224 2 2 2 2 2 225 2 2 2 2 2 226 2 2 2 2 2 2
A B C D E F1 1 1 1 12 1 1 1 13 1 1 1 14 5 5 5 5 5 55 5 5 5 5 5 56 5 5 5 5 5 57 5 5 5 5 5 58 5 5 5 5 5 59 4 4 4 4 4 4
10 4 4 4 4 4 411 4 4 4 4 4 412 4 4 4 4 4 413 4 4 4 4 4 414 4 4 4 4 4 415 3 3 3 3 3 316 3 3 3 3 3 317 3 3 3 3 3 318 3 3 3 3 3 319 3 3 3 3 3 320 3 3 3 3 3 321 2 2 2 2 2 222 2 2 2 2 2 223 2 2 2 2 2 224 2 2 2 2 2 225 2 2 2 2 2 226 2 2 2 2 2 2
α = 0.7 α = 0.9 α = 1
Fig. 3. Efficient solutions for boarding patterns for 5 groups and different values of a.
M. Bazargan / European Journal of Operational Research 183 (2007) 394–411 405
A B C D E F1 1 1 1 12 1 1 1 13 1 1 1 14 4 5 6 6 5 45 4 5 6 6 5 46 4 5 6 6 5 47 4 5 6 6 5 48 3 4 6 6 4 39 3 4 6 6 4 3
10 3 4 6 6 4 311 3 4 6 6 4 312 3 4 6 6 4 313 2 4 6 6 4 214 2 4 6 6 4 215 2 4 6 6 4 216 2 4 6 6 4 217 2 4 5 5 4 218 2 3 5 5 3 219 2 3 5 5 3 220 2 3 5 5 3 221 2 3 5 5 3 222 2 3 5 5 3 223 2 3 5 5 3 224 2 3 5 5 3 225 2 3 5 5 3 226 2 3 5 5 3 2
A B C D E F1 1 1 1 12 1 1 1 13 1 1 1 14 4 5 6 6 5 45 4 5 6 6 5 46 4 5 6 6 5 47 4 5 6 6 5 48 4 4 6 6 4 49 3 4 6 6 4 3
10 3 4 6 6 4 311 3 4 6 6 4 312 3 4 6 6 4 313 3 4 6 6 4 314 3 4 6 6 4 315 3 4 6 6 4 316 2 3 6 6 3 217 2 3 6 6 3 218 2 3 5 5 3 219 2 3 5 5 3 220 2 3 5 5 3 221 2 3 5 5 3 222 2 3 5 5 3 223 2 3 5 5 3 224 2 2 5 5 2 225 2 2 5 5 2 226 2 2 5 5 2 2
A B C D E F1 1 1 1 12 1 1 1 13 1 1 1 14 6 6 6 6 6 65 6 6 6 6 6 66 6 6 6 6 6 67 6 6 6 6 6 68 5 6 6 6 6 59 5 5 6 6 5 5
10 5 5 5 5 5 511 5 5 5 5 5 512 4 5 5 5 5 413 4 5 5 5 5 414 4 4 5 5 4 415 4 4 4 4 4 416 4 4 4 4 4 417 3 4 4 4 4 318 3 3 4 4 3 319 3 3 4 4 3 320 3 3 3 3 3 321 2 3 3 3 3 222 2 3 3 3 3 223 2 2 3 3 2 224 2 2 2 2 2 225 2 2 2 2 2 226 2 2 2 2 2 2
A B C D E F1 1 1 1 12 1 1 1 13 1 1 1 14 6 6 6 6 6 65 6 6 6 6 6 66 6 6 6 6 6 67 6 6 6 6 6 68 5 5 6 6 5 59 5 5 5 5 5 5
10 5 5 5 5 5 511 5 5 5 5 5 512 5 5 5 5 5 513 4 4 5 5 4 414 4 4 4 4 4 415 4 4 4 4 4 416 4 4 4 4 4 417 3 4 4 4 4 318 3 3 4 4 3 319 3 3 3 3 3 320 3 3 3 3 3 321 3 3 3 3 3 322 2 2 3 3 2 223 2 2 2 2 2 224 2 2 2 2 2 225 2 2 2 2 2 226 2 2 2 2 2 2
α = 0 α = 0.1 α = 0.3 α = 0.5
A B C D E F1 1 1 1 12 1 1 1 13 1 1 1 14 6 6 6 6 6 65 6 6 6 6 6 66 6 6 6 6 6 67 6 6 6 6 6 68 5 5 6 6 5 59 5 5 5 5 5 5
10 5 5 5 5 5 511 5 5 5 5 5 512 5 5 5 5 5 513 4 4 4 4 4 414 4 4 4 4 4 415 4 4 4 4 4 416 4 4 4 4 4 417 3 4 4 4 4 318 3 3 3 3 3 319 3 3 3 3 3 320 3 3 3 3 3 321 3 3 3 3 3 322 2 2 3 3 2 223 2 2 2 2 2 224 2 2 2 2 2 225 2 2 2 2 2 226 2 2 2 2 2 2
A B C D E F1 1 1 1 12 1 1 1 13 1 1 1 14 6 6 6 6 6 65 6 6 6 6 6 66 6 6 6 6 6 67 6 6 6 6 6 68 5 5 6 6 5 59 5 5 5 5 5 5
10 5 5 5 5 5 511 5 5 5 5 5 512 5 5 5 5 5 513 4 4 4 4 4 414 4 4 4 4 4 415 4 4 4 4 4 416 4 4 4 4 4 417 3 3 4 4 3 318 3 3 3 3 3 319 3 3 3 3 3 320 3 3 3 3 3 321 3 3 3 3 3 322 2 2 2 2 2 223 2 2 2 2 2 224 2 2 2 2 2 225 2 2 2 2 2 226 2 2 2 2 2 2
A B C D E F1 1 1 1 12 1 1 1 13 1 1 1 14 6 6 6 6 6 65 6 6 6 6 6 66 6 6 6 6 6 67 6 6 6 6 6 68 5 5 5 5 5 59 5 5 5 5 5 5
10 5 5 5 5 5 511 5 5 5 5 5 512 5 5 5 5 5 513 4 4 4 4 4 414 4 4 4 4 4 415 4 4 4 4 4 416 4 4 4 4 4 417 3 3 3 3 3 318 3 3 3 3 3 319 3 3 3 3 3 320 3 3 3 3 3 321 3 3 3 3 3 322 2 2 2 2 2 223 2 2 2 2 2 224 2 2 2 2 2 225 2 2 2 2 2 226 2 2 2 2 2 2
α = 0.7 α = 0.9 α = 1
Fig. 4. Efficient solutions for boarding patterns for 6 groups and different values of a.
406 M. Bazargan / European Journal of Operational Research 183 (2007) 394–411

Table 3Seat, aisle and total interferences for 4 groups for efficient and reverse pyramid solutions
a Interference Eff sol Rev Pyr Sum Eff sol Rev Pyr
0 TSB 0 0 Total seat interferences 0 0TSW 0 0AWL 1518 1518 Total aisle interferences 1587 1587AWS 69 69ABG 0 0Obj. Func. 3808.8 3808.8 Total Int. 1587 1587
0.1 TSB 0 0 Total seat interferences 32 0TSW 32 0AWL 1454 1518 Total aisle interferences 1713.8 1807.8AWS 197 69ABG 62.8 220.8Obj. Func. 4228.3 4338.7 Total Int. 1745.8 1807.8
0.3 TSB 0 0 Total seat interferences 57 0TSW 57 0AWL 1404 1518 Total aisle interferences 1725 2249.4AWS 297 69ABG 24 662.4Obj. Func. 4345.2 5398.6 Total Int. 1782 2249.4
0.5 TSB 0 0 Total seat interferences 65 0TSW 65 0AWL 1388 1518 Total aisle interferences 1725 2691AWS 329 69ABG 8 1104Obj. Func. 4374 6458.4 Total Int. 1790 2691
0.7 TSB 0 0 Total seat interferences 65 0TSW 65 0AWL 1388 1518 Total aisle interferences 1728.2 3132.6AWS 329 69ABG 11.2 1545.6Obj. Func. 4381.7 7518.2 Total Int. 1793.2 3132.6
0.9 TSB 0 0 Total seat interferences 67 0TSW 67 0AWL 1386 1518 Total aisle interferences 1730.2 3574.2AWS 337 69ABG 7.2 1987.2Obj. Func. 4393.7 8578.1 Total Int. 1797.2 3574.2
1 TSB 0 0 Total seat interferences 67 0TSW 67 0AWL 1723 1518 Total aisle interferences 2068 3795AWS 337 69ABG 8 2208Obj. Func. 4395.6 9108 Total Int. 2135 3795
M. Bazargan / European Journal of Operational Research 183 (2007) 394–411 407
and their totals discussed in Section 3. Note that the value of objective functions are based on penaltiesp1,p2, . . . ,p5 discussed earlier.
The only comparable mathematical model and solution which we are aware of is a paper by Van de Brielet al. (2005). Their solutions (referred to as reverse pyramid) for 4, 5 and 6 groups are similar to ours whena = 0. Despite the fact that they included between groups interferences, they report only very minimal (about2 or 3) such interferences in their paper for six group boarding strategy. To provide a comparison between the
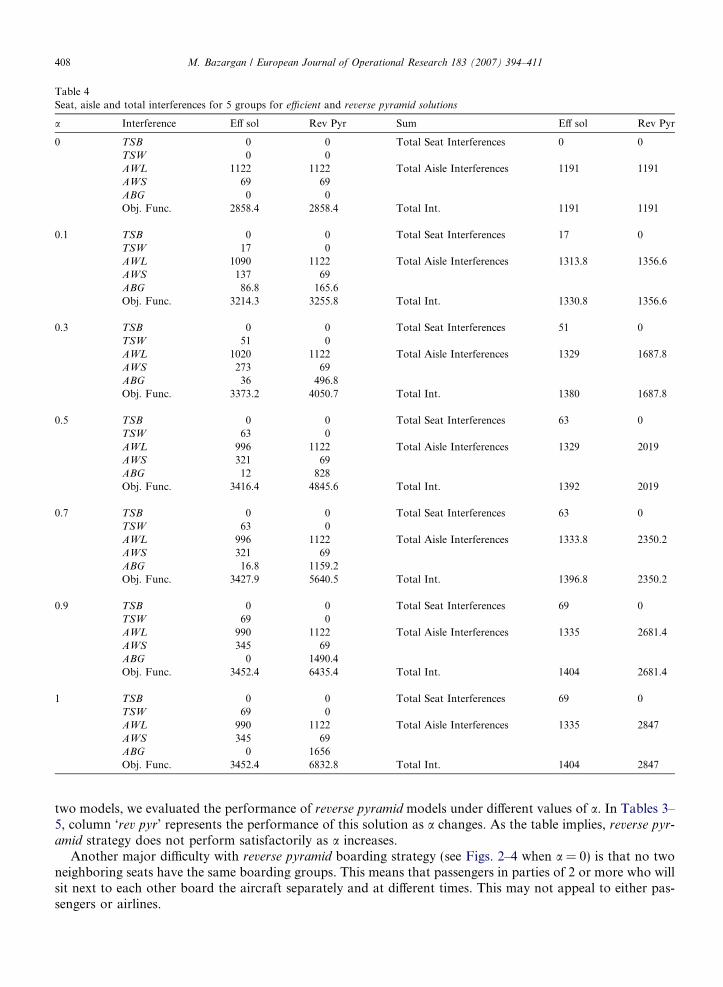
Table 4Seat, aisle and total interferences for 5 groups for efficient and reverse pyramid solutions
a Interference Eff sol Rev Pyr Sum Eff sol Rev Pyr
0 TSB 0 0 Total Seat Interferences 0 0TSW 0 0AWL 1122 1122 Total Aisle Interferences 1191 1191AWS 69 69ABG 0 0Obj. Func. 2858.4 2858.4 Total Int. 1191 1191
0.1 TSB 0 0 Total Seat Interferences 17 0TSW 17 0AWL 1090 1122 Total Aisle Interferences 1313.8 1356.6AWS 137 69ABG 86.8 165.6Obj. Func. 3214.3 3255.8 Total Int. 1330.8 1356.6
0.3 TSB 0 0 Total Seat Interferences 51 0TSW 51 0AWL 1020 1122 Total Aisle Interferences 1329 1687.8AWS 273 69ABG 36 496.8Obj. Func. 3373.2 4050.7 Total Int. 1380 1687.8
0.5 TSB 0 0 Total Seat Interferences 63 0TSW 63 0AWL 996 1122 Total Aisle Interferences 1329 2019AWS 321 69ABG 12 828Obj. Func. 3416.4 4845.6 Total Int. 1392 2019
0.7 TSB 0 0 Total Seat Interferences 63 0TSW 63 0AWL 996 1122 Total Aisle Interferences 1333.8 2350.2AWS 321 69ABG 16.8 1159.2Obj. Func. 3427.9 5640.5 Total Int. 1396.8 2350.2
0.9 TSB 0 0 Total Seat Interferences 69 0TSW 69 0AWL 990 1122 Total Aisle Interferences 1335 2681.4AWS 345 69ABG 0 1490.4Obj. Func. 3452.4 6435.4 Total Int. 1404 2681.4
1 TSB 0 0 Total Seat Interferences 69 0TSW 69 0AWL 990 1122 Total Aisle Interferences 1335 2847AWS 345 69ABG 0 1656Obj. Func. 3452.4 6832.8 Total Int. 1404 2847
408 M. Bazargan / European Journal of Operational Research 183 (2007) 394–411
two models, we evaluated the performance of reverse pyramid models under different values of a. In Tables 3–5, column ‘rev pyr’ represents the performance of this solution as a changes. As the table implies, reverse pyr-
amid strategy does not perform satisfactorily as a increases.Another major difficulty with reverse pyramid boarding strategy (see Figs. 2–4 when a = 0) is that no two
neighboring seats have the same boarding groups. This means that passengers in parties of 2 or more who willsit next to each other board the aircraft separately and at different times. This may not appeal to either pas-sengers or airlines.

Table 5Seat, aisle and total interferences for 6 groups for efficient and reverse pyramid solutions
a Interference Eff sol Rev Pyr Sum Eff sol Rev Pyr
0 TSB 0 0 Total Seat Interferences 0 0TSW 0 0AWL 884 884 Total Aisle Interferences 953 953AWS 69 69ABG 0 0Obj. Func. 2287.2 2287.2 Total Int. 953 953
0.1 TSB 0 0 Total Seat Interferences 4 0TSW 4 0AWL 878 884 Total Aisle Interferences 1059.4 1344.2AWS 85 69ABG 96.4 391.2Obj. Func. 2556.96 2600.2 Total Int. 1063.4 1344.2
0.3 TSB 0 0 Total Seat Interferences 47 0TSW 47 0AWL 792 884 Total Aisle Interferences 1091 1344.2AWS 257 69ABG 42 391.2Obj. Func. 2787.6 3226.1 Total Int. 1138 1344.2
0.5 TSB 0 0 Total Seat Interferences 59 0TSW 59 0AWL 788 884 Total Aisle Interferences 1115 1605AWS 305 69ABG 22 652Obj. Func. 2835.6 3852 Total Int. 1174 1605
0.7 TSB 0 0 Total Seat Interferences 63 0TSW 63 0AWL 758 884 Total Aisle Interferences 1095.8 1865.8AWS 321 69ABG 16.8 912.8Obj. Func. 2856.7 4477.9 Total Int. 1158.8 1865.8
0.9 TSB 0 0 Total seat interferences 65 0TSW 65 0AWL 756 884 Total aisle interferences 1099.4 2126.6AWS 329 69ABG 14.4 1173.6Obj. Func. 2872.6 5103.8 Total Int. 1164.4 2126.6
1 TSB 0 0 Total seat interferences 69 0TSW 69 0AWL 756 884 Total aisle interferences 1101 2257AWS 345 69ABG 0 1304Obj. Func. 2890.8 5416.8 Total Int. 1170 2257
M. Bazargan / European Journal of Operational Research 183 (2007) 394–411 409
7. Simulation model
In the previous sections we provided extensive analyses on boarding strategy and boarding patterns as avaries. In this section, we attempt to identity and evaluate realistic values for a and examine how the rateof boarding the passengers affects a and in turn the total interferences.
In order to study and determine the values of a for different boarding times, we developed a simulationmodel in Arena Simulation Modeling Software (Kelton et al., 2002). The main focus of this simulation study

Table 6Expected number of passengers and values of a for different groups and inter-arrival times
Time between arrivals (seconds)
3 4 5 6 7 8 9 10
4 groups Avg pax per econ class group: 46 # Pax 43.6 24.8 14.1 8.8 4.67 0.67 0 0a 0.95 0.54 0.31 0.19 0.10 0.01 0.00 0.00
5 groups Avg pax per econ class group: 34.5 # Pax 32.6 18.9 10.9 6.63 3.88 0 0 0a 0.95 0.55 0.32 0.19 0.11 0.00 0.00 0.00
6 groups Avg pax per econ class group: 27.6 # Pax 25.9 15.8 9 5.76 3.24 0 0 0a 0.94 0.57 0.33 0.21 0.12 0.00 0.00 0.00
Average a 0.94 0.55 0.32 0.20 0.11 0.00 0.00 0.00
410 M. Bazargan / European Journal of Operational Research 183 (2007) 394–411
is to identify how many passengers from a previous group will be in front of the new group thus providingsome guideline for values of a.
The simulation model is similar to those reported by Van Landeghem and Beuselinck (2002) and Ferrariand Nagel (2004). We used similar aircraft load factor and time distributions for aisle and seat interferences.We do not duplicate the details of the simulation model here and refer the interested readers to these papers.
We ran the simulation models for the inter-arrival times of passengers for boarding to change from 3 sec-onds to 10 seconds or 20 to 6 passengers per minute. Our main task of measuring performance in this studywas to identify the number of passengers at the door, where new passengers will line-up behind them for dif-ferent times between passengers boarding. Enough replications for each scenario were run to reduce the 95%confidence interval half-width for number of waiting passengers in the previous group to less than .5. We ranour simulation model for different boarding strategies including back-to-front, out–in, reverse pyramid and effi-
cient solutions for 4, 5 and 6 groups.Table 6 provides the average number of passengers (# pax), waiting at the door when the new groups are
called in to board for different boarding times and different groups. Note that these numbers only apply toeconomy class passengers (groups 2 or higher). As an example for 4 groups, according to Table 6, on averagewe have more than 32 passengers waiting at the door when the boarding time between passengers is 3 seconds.This number falls to 0 for inter-arrival times of 9 seconds and more.
In a 4 group boarding strategy, we have one group for business/first-class passengers and three groupsassigned to economy class passengers (see Fig. 2). There are 138 (23 rows · 6 seats per row) economy seats.Therefore on average we have 46 passengers (138 economy seats divided by 3 economy groups) assigned toeach economy group. To get a, the proportion of passengers from the previous group who block the newgroup, we divide the number of waiting passengers (# pax in Table 6) by the average number of economy pas-sengers per group (46 passengers for 4 groups). Therefore as we see in Table 6, for 3 seconds inter-arrival time,we get .95 for a. As inter-arrival times increase, a starts to decrease where it reaches to 0 for inter-arrival timesof 9 seconds or higher. Similarly, Table 6, presents values of a for different groups and inter-arrival times. Thelast row, titled average a, presents the average values of a for different groups and inter-arrival times.
8. Recommendation
For average passenger arrival times, Van de Briel et al. (2005) considered 7 seconds with 1 gate agent and 5seconds with 2 gate agents (rounded to nearest seconds) and Van Landeghem and Beuslinck (2002) considered6–7 seconds in their simulation models. These times are based on actual observations of passenger boardingtimes at different airlines and different airports. Using these inter-arrival times as realistic passenger boardingtimes and referring back to Table 6, we see that the realistic values for a range from 0.32 for 5 seconds to 0.11for 7 seconds inter-arrival times. Therefore, those efficient solutions reported, for a taking values 0.1 and 0.3 inSection 6 of this paper with their patterns presented in Figs. 2–4, seem to be appropriate for boarding strat-egies. These solutions not only provide a lower number of interferences and objective functions than reverse

M. Bazargan / European Journal of Operational Research 183 (2007) 394–411 411
pyramid but also they are more appealing to both the airlines and the passengers as they can accommodateneighboring passengers traveling in groups to board together.
Since 6 group boarding strategy results in the lowest number of total interferences, we recommend theboarding patterns in Fig. 4 with a = 0.3 for two gate agents and a = 0.1 with one gate agent as efficient board-ing strategies for an Airbus-320 aircraft.
9. Conclusion
This paper introduced a new mixed integer linear program to minimize the total number of passenger inter-ferences which cause delays in aircraft boarding. The operational and side constraints for this mathematicalmodel were examined. The model was then applied to an Airbus-320 aircraft which is commonly used by manyairlines. Alternative efficient solutions were generated based on the speed of boarding the passengers. Weexamined and compared the performance of other boarding strategies with these efficient solutions. A simu-lation model was adopted to identify appropriate boarding patterns as the speed of boarding the passengerschange. The recommended solutions not only provide a lower number of interferences among passengers, theyare more appealing to both the airlines and the passengers as they can accommodate neighboring passengersto board together.
References
Bazargan, M., 2004. Airline Operations & Scheduling. Ashgate Publishing Co.Bazargan, M., Vasigh, S., 2003. Size versus efficiency – a case study on US commercial airports. Journal of Air Transport Management 9,
187–193.Ferrari, P., 2005. Improving passenger boarding in airplanes using computer simulations. International Airport Review.Ferrari, P., Nagel, K., 2004. Robustness of Efficient Passenger Boarding in Airplanes, Transportation Research Board Annual
Meeting’05, Preprint Number 05-0405.Kelton, W.D., Sadowski, R.P., Sadowski, D.A., 2002. Simulation with Arena, second ed. McGraw-Hill Higher Education.Lewis, C., Lieber, R., 2005. Testing the latest boarding procedures; Airlines try new strategies to load passengers faster; The new meaning
of groups. Wall Street Journal, New York, NY, 2 November 2005.Van de Briel, M.H.L., Villalobos, J.R., Hogg, G.L., Lindemann, T., Mule, A.V., 2005. America west airlines develops efficient boarding
strategies. Interfaces 35, 191–201.Van Landeghem, H., Beuselinck, A., 2002. Reducing passenger boarding times in airplanes: A simulation based approach. European
Journal of Operational Research 142, 294–308.