a geometric interpretation of gene co-expression network
TRANSCRIPT

A Geometric Interpretation of Gene Co-Expression Network
Analysis Steve Horvath, Jun Dong

Outline• Network and network concepts• Approximately factorizable networks• Gene Co-expression Network
– Eigengene Factorizability, Eigengene Conformity
– Eigengene-based network concepts• What can we learn from the geometric
interpretation?

Network=Adjacency Matrix
• A network can be represented by an adjacency matrix, A=[aij ], that encodes whether/how a pair of nodes is connected.– A is a symmetric matrix with entries in [0,1] – For unweighted network, entries are 1 or 0
depending on whether or not 2 nodes are adjacent (connected)
– For weighted networks, the adjacency matrix reports the connection strength between node pairs
– Our convention: diagonal elements of A are all 1.

Motivational example I: Pair-wise relationships between genes across different
mouse tissues and genders
Challenge:Develop simple descriptive measures that describe the patterns.
Solution: The following network concepts are useful: density, centralization,clustering coefficient, heterogeneity

Motivational example (continued)
Challenge: Find a simple measure for describing the relationship between gene significance and connectivity
Solution: network concept called hub gene significance

Backgrounds
• Network concepts are also known as network statistics or network indices– Examples: connectivity (degree), clustering
coefficient, topological overlap, etc• Network concepts underlie network
language and systems biological modeling.
• Dozens of potentially useful network concepts are known from graph theory.

Review of some fundamental network concepts
which are defined for all networks (not just co-expression networks)

Connectivity
• Node connectivity = row sum of the adjacency matrix– For unweighted networks=number of direct neighbors– For weighted networks= sum of connection strengths
to other nodes
iScaled connectivity=Kmax( )
i i ijj i
i
Connectivity k a
kk
≠
= =
=
∑

Density• Density= mean adjacency• Highly related to mean connectivity
( )( 1) 1
where is the number of network nodes.
iji j ia mean kDensity
n n nn
≠= =− −
∑ ∑

Centralization
Centralization = 1
because it has a star topology
Centralization = 0
because all nodes have the same connectivity of 2
max( ) max( )2 1 1
n k kCentralization Density Densityn n n
⎛ ⎞= − ≈ −⎜ ⎟− − −⎝ ⎠
= 1 if the network has a star topology
= 0 if all nodes have the same connectivity

Heterogeneity
• Heterogeneity: coefficient of variation of the connectivity
• Highly heterogeneous networks exhibit hubs
( )( )
variance kHeterogeneity
mean k=

Clustering CoefficientMeasures the cliquishness of a particular node« A node is cliquish if its neighbors know each other »
Clustering Coef of the black node = 0
Clustering Coef = 1
( ),
2 2
il lm mil i m i li
il ill i l i
a a aClusterCoef
a a≠ ≠
≠ ≠
=−
∑ ∑∑ ∑
This generalizes directly to weightednetworks (Zhang and Horvath 2005)

The topological overlap dissimilarity is used as input of hierarchical clustering
• Generalized in Zhang and Horvath (2005) to the case of weighted networks• Generalized in Li and Horvath (2006) to multiple nodes• Generalized in Yip and Horvath (2007) to higher order interactions
,
min( , ) 1
iu uj iju i j
iji j ij
a a a
TOMk k a
≠
+
=+ −
∑
1ij ijDistTOM TOM= −

Network Significance
• Defined as average gene significance• We often refer to the network significance of a
module network as module significance.
iGSNetworkSignif
n= ∑

Hub Gene Significance= slope of the regression line (intercept=0)
2( )i i
i
GS KHubGeneSignif
K= ∑∑

Q: What do all of these fundamental network concepts have in common?
They are functions of the adjacency matrix A and/or a gene significance measure GS.

CHALLENGEFind relationships between these and other
seemingly disparate network concepts.• For general networks, this is a difficult problem.• But a solution exists for a special subclass of
networks: approximately factorizable networks

Definition of an approximately factorizable network
Definitions:The adjacency matrix A is if there exists a vector CF with non-negative elements such that
for all
is referred to as the of the
approximately factorizable
conformityij i j
i
a CFCF i j
CF
≈ ≠
i-th node
Why is this relevant?Answer: Because modules are often approximately factorizable

Algorithmic definition of the conformity and a measure of factorizability
We use an iterative algorithm to approximate the conformity vector CF.A measure of factorizability F(A) is defined as ( ).
Conceptually related to a factor analysis of A.
AF CF
2
2
We define the conformity as a maximizer of the factorizability function( )
( ) 1( )
ij i ji j iA
iji j i
a v vF v
a≠
≠
−= −
∑ ∑∑ ∑

Empirical Observation 1• Sub-networks comprised of module genes tend
to be approximately factorizable, i.e.
for all ij i ja CFCF i j≈ ≠
This observation implies the following observation 2…
Empirical evidence is provided in the following article:Dong J, Horvath S (2007) Understanding Network Concepts in Modules BMC Systems Biology 2007, 1:24

Observation 2: Approximate relationships among network concepts in approximately
factorizable networks
( ) ( )
( )( ) ( )
22
2
2[1]
1
max( , )1
1
where [1] denotes the index of the most highly connected hub
i jij
j
mean ClusterCoef Heterogeneity Density
k kTopOverlap Heterogeneity
nTopOverlap Centralization Density Heterogeneity
≈ + ×
≈ × +
≈ + × +

Drosophila PPI module networks: the relationship between fundamental network concepts.

What if we focus on gene co- expression network?

Weighted Gene Co-expression Network
[ ] [| ( , ) | ]
where is the expression profile for gene ,and mathematically a vector of expression valuesacross multiple samples.
ij i j
i
A a cor x x
x i
β= =
Note: Unweighted Network is[ ] [ (| ( , ) | )]
where (.) is an indicator function.ij i jA a I cor x x
I
τ= = ≥

b r o w n
123456789
1 01 11 21 31 41 51 61 71 81 92 02 12 22 32 42 52 62 72 82 93 03 13 23 33 43 53 63 73 83 94 04 14 24 34 44 54 64 74 84 95 05 15 25 35 45 55 65 75 85 96 06 16 26 36 46 56 66 76 86 97 07 17 27 37 47 57 67 77 87 98 08 18 28 38 48 58 68 78 88 99 09 19 29 39 49 59 69 79 89 91 0 01 0 11 0 21 0 31 0 41 0 51 0 61 0 71 0 81 0 91 1 01 1 11 1 21 1 31 1 41 1 51 1 61 1 71 1 81 1 91 2 01 2 11 2 21 2 31 2 41 2 51 2 61 2 71 2 81 2 91 3 01 3 11 3 21 3 31 3 41 3 51 3 61 3 71 3 81 3 91 4 01 4 11 4 21 4 31 4 41 4 51 4 61 4 71 4 81 4 91 5 01 5 11 5 21 5 31 5 41 5 51 5 61 5 71 5 81 5 91 6 01 6 11 6 21 6 31 6 41 6 51 6 61 6 71 6 81 6 91 7 01 7 11 7 21 7 31 7 41 7 51 7 61 7 71 7 81 7 91 8 01 8 11 8 21 8 31 8 41 8 5
b r o w n
-0.1
0.0
0.1
0.2
0.3
0.4
Module Eigengene= measure of over- expression=average redness
Rows,=genes, Columns=microarray
The brown module eigengenes across samples

Recall that the module eigengene is defined by the singular value decomposition of X
• X=gene expression data of a module• Aside: gene expressions (rows) have been
standardized across samples (columns)
1 2
1 2
1 2
1
( )
( )(| |,| |, ,| |)
Message: is the module eigengene E
T
m
m
m
X UDVU u u u
V v v vD diag d d d
v
==
== …

Question: When are co-expression modules factorizable?

Question: Characterize gene expression data X that lead to an approximately factorizable
correlation matrix
4 21
4 2
Solution: Define the eigengene based factorizability as follows
| | || ( ) ( ) ||EF( ) 1| | || ( ) ||
where ( , ).Thus, cor(X) is approximately factorizable if EF(X) 1.
F
j Fj
i i
d cor X C CXd cor X
C cor x E
τ−= = −
=≈
∑

Note that a factorizable correlation matrix implies a factorizable weighted co-expression network
,
, ,
| ( , ) |
| ( , ) | | ( , ) |i j i j
i j e i e j
a cor x x
cor x E cor x E a a
β
β β
=
≈ =
, | ( , ) |e i ia cor x E β=
We refer to the following as weighted eigengene conformity

If ( ) 1EF X ≈

Theoretical relationships in co- expression modules with high
eigengene factorizability

i
e,i
Result "Group conform behavior leads to a lot of friends."
More precisely, the scaled intramodular connectivity K
approximates the eigengene conformity, i.e. a | ( , ) | .Message: the small
i iK cor x E β≈ =
er the angle between and , the more connected is the i-th gene.
ix E

T
Result about hub gene significance:Given a trait based gene significance measure GS ( ) | ( , ) | ,the hub gene significance approximates the eigengene significance,HGS | ( , ) | .Message: the smal
ii cor x T
cor E T
β
β
=
≈ler the angle between and ,
the higher is the trait-significance of intramodular hubs and the higher is the module significance (average GS).
E T

What can network theorists learn from the geometric interpretation?
Some examples…
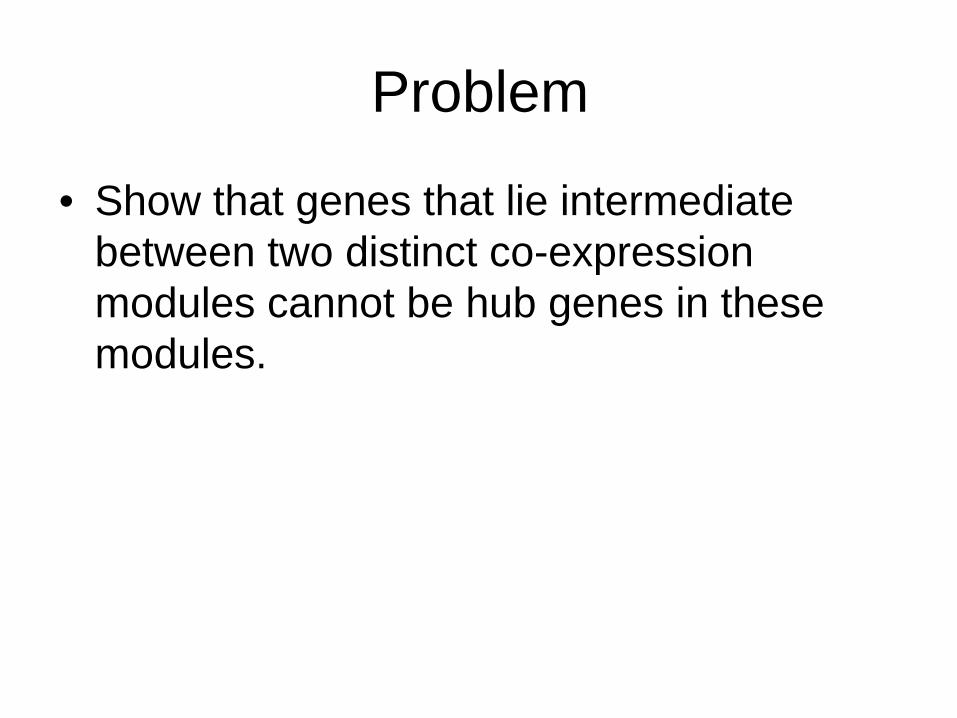
Problem
• Show that genes that lie intermediate between two distinct co-expression modules cannot be hub genes in these modules.

gene 2
gene 1
k(2)
intermediate
hub in module 1eigen
gene
E2
eigengene E1
Geometric Solution

Problem
• Setting: a co-expression network and a trait based gene significance measure GS(i)=|cor(x(i),T)|
• Describe a situation when the sample trait (T1) leads to a trait-based gene significance measure with low hub gene significance
• Describe a situation when the sample trait (T2) leads to a trait-based gene significance measure with high hub gene significance
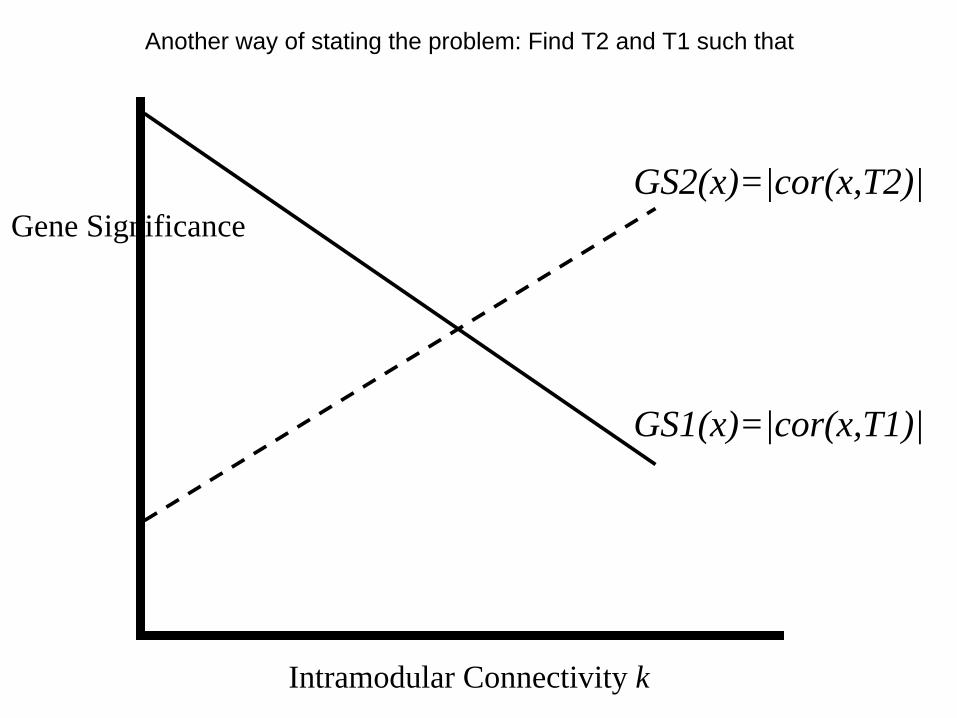
Intramodular Connectivity k
Gene SignificanceGS2(x)=|cor(x,T2)|
GS1(x)=|cor(x,T1)|
Another way of stating the problem: Find T2 and T1 such that

gene 2gene 1
Sample Trait T2cor(E,T2)
k(2)
k(1)
Sam
ple T
rait T
1
GS1(1)
eigengene E
Solution

What can a microarray data analyst learn from the
geometric interpretation?

Some insights• Intramodular hub gene= a genes that is highly
correlated with the module eigengene, i.e. it is a good representative of a module
• Gene screening strategies that use intramodular connectivity amount to path-way based gene screening methods
• Intramodular connectivity is a highly reproducible “fuzzy” measure of module membership.
• Network concepts are useful for describing pairwise interaction patterns.

The module eigengene is highly correlated with the most highly connected hub gene.

Dictionary for translating between general network terms and the eigengene-basedcounterparts.

If also ,max ( ) 1j e ja ≈

Summary• The unification of co-expression network methods with
traditional data mining methods can inform the application and development of systems biologic methods.
• We study network concepts in special types of networks, which we refer to as approximately factorizable networks.
• We find that modules often are approximately factorizable• We characterize co-expression modules that are
approximately factorizable• We provide a dictionary for relating fundamental network
concepts to eigengene based concepts• We characterize coexpression networks where hub genes
are significant with respect to a microarray sample trait• We show that intramodular connectivity can be interpreted
as a fuzzy measure of module membership.

Summary Cont’d
• We provide a geometric interpretation of important network concepts (e.g. hub gene significance, module significance)
• These theoretical results have important applications for describing pathways of interacting genes
• They also inform novel module detection procedures and gene selection procedures.

AcknowledgementBiostatistics/Bioinformatics• Tova Fuller• Peter Langfelder• Ai Li• Wen Lin• Mike Mason• Angela Presson• Lin Wang• Andy Yip• Wei ZhaoBrain Cancer/Yeast• Paul Mischel• Stan Nelson• Marc Carlson
Comparison Human- ChimpDan GeschwindMike OldhamGiovanni
Mouse DataJake LusisTom DrakeAnatole GhazalpourAtila Van Nas

APPENDIX (back up slides)

Steps for constructing a co-expression network
• Hi A) Microarray gene expression data B) Measure concordance of gene
expression with a Pearson correlation
C) The Pearson correlation matrix is either dichotomized to arrive at an adjacency matrix unweightednetwork
Or transformed continuously with the power adjacency function weighted network

Definition of module (cluster)• Module=cluster of highly connected nodes
– Any clustering method that results in such sets is suitable
• We define modules as branches of a hierarchical clustering tree using the topological overlap matrix

Relationship between Module significance and hub gene significance

Application: Brain Cancer Data
