10/5/2015 1 geometric approach geometric interpretation: geometric interpretation: each node holds a...
TRANSCRIPT
04/19/23 1
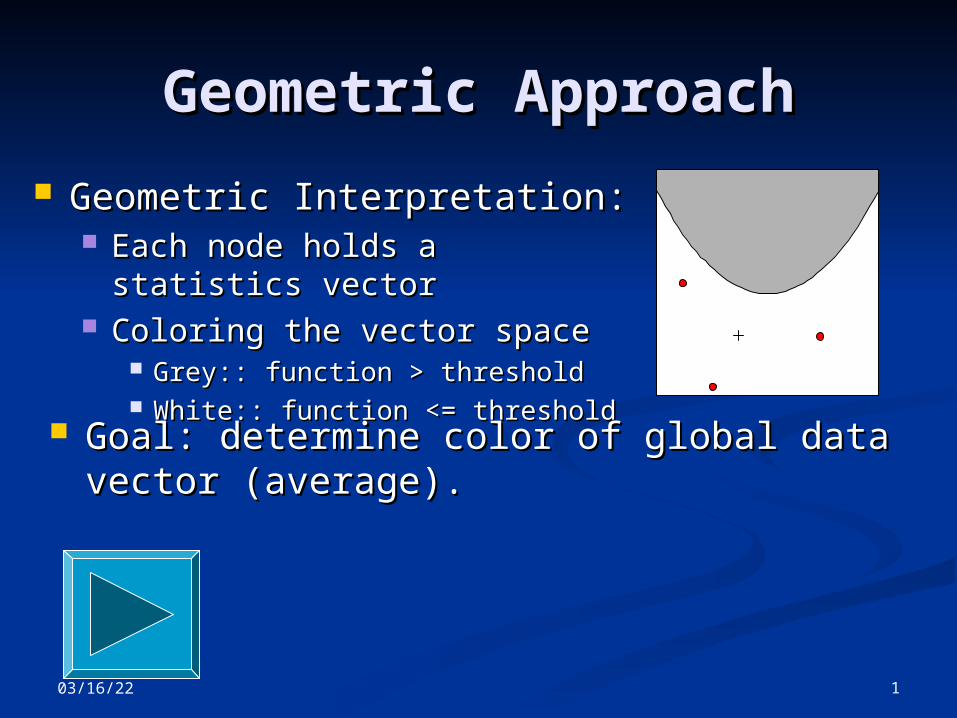
Geometric ApproachGeometric Approach
Geometric Interpretation:Geometric Interpretation: Each node holds a statistics Each node holds a statistics
vectorvector Coloring the vector space Coloring the vector space
Grey:: function > thresholdGrey:: function > threshold White:: function <= thresholdWhite:: function <= threshold
Goal: determine color of global data vector Goal: determine color of global data vector (average).(average).
04/19/23 2
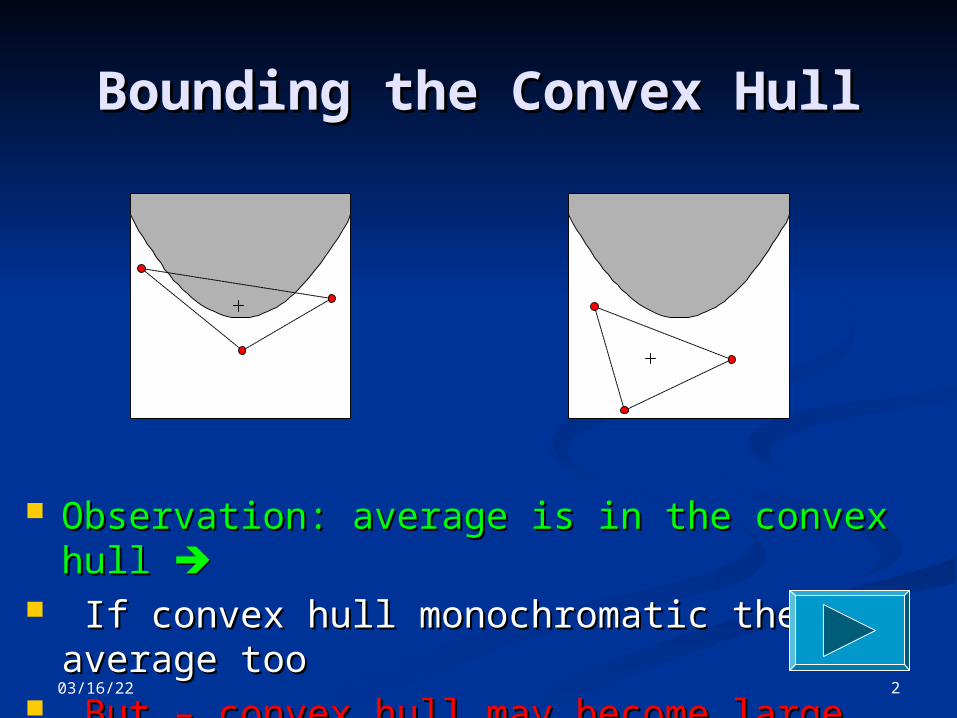
Bounding the Convex HullBounding the Convex Hull
Observation: average is in the convex hull Observation: average is in the convex hull If convex hull monochromatic then average If convex hull monochromatic then average
tootoo But – convex hull may become largeBut – convex hull may become large
04/19/23 3
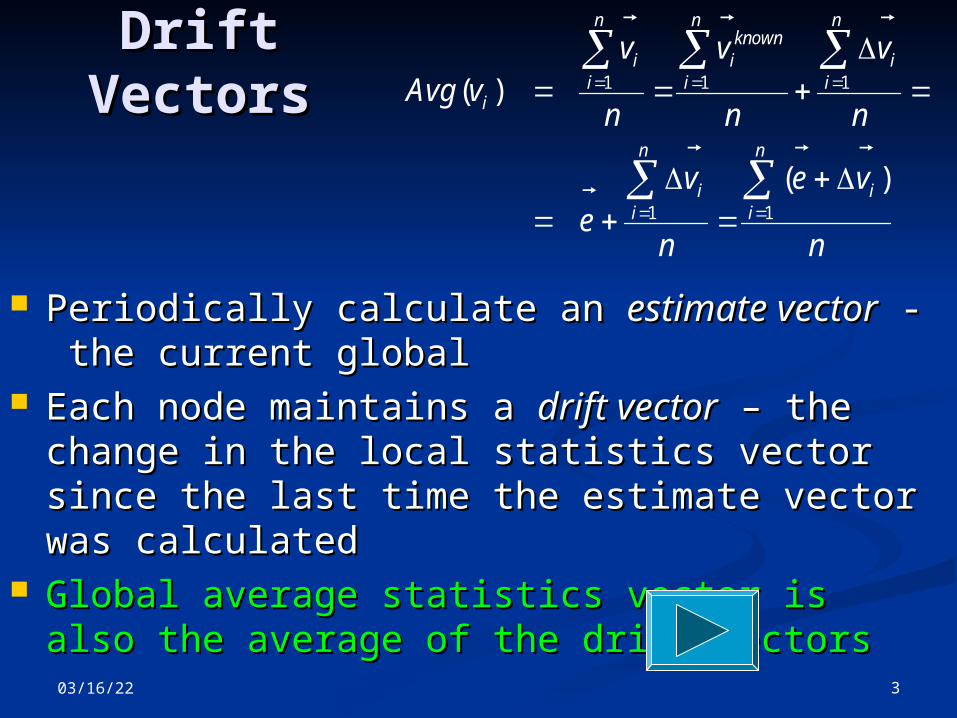
Drift Drift VectorsVectors
Periodically calculate an Periodically calculate an estimate vectorestimate vector - the - the current global current global
Each node maintains a Each node maintains a drift vectordrift vector – the – the change in the local statistics vector since the change in the local statistics vector since the last time the estimate vector was calculatedlast time the estimate vector was calculated
Global average statistics vector is also the Global average statistics vector is also the average of the drift vectorsaverage of the drift vectors
1 1 1
1 1
( )
( )
n n nknown
i i ii i i
i
n n
i ii i
v v vAvg v
n n n
v e ve
n n
04/19/23 4
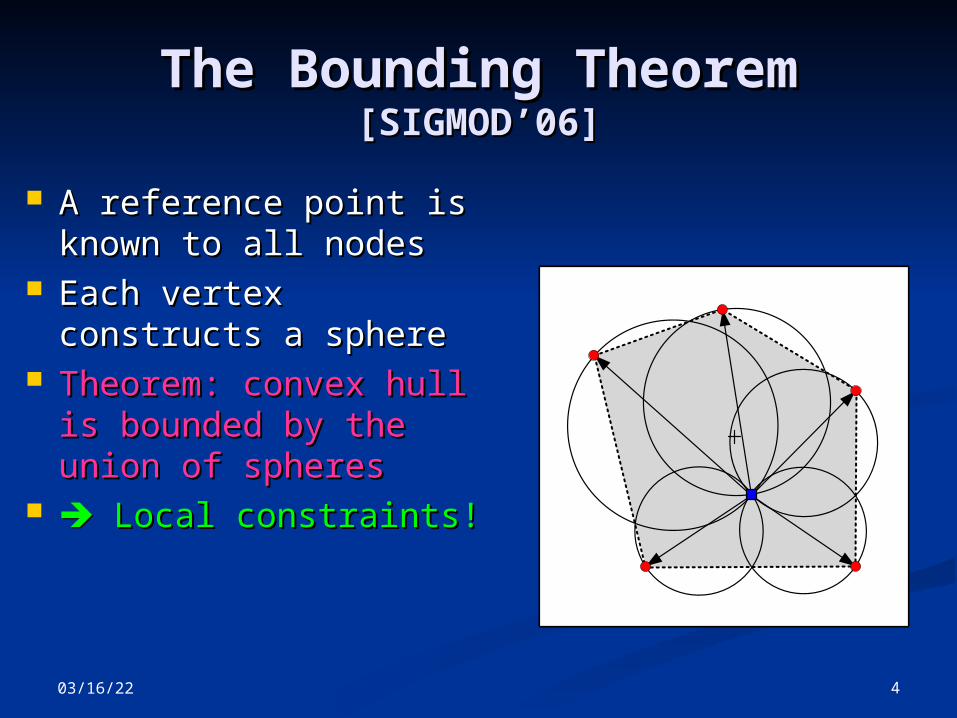
The Bounding Theorem The Bounding Theorem [SIGMOD’06][SIGMOD’06]
A reference point is A reference point is known to all nodesknown to all nodes
Each vertex constructs Each vertex constructs a spherea sphere
Theorem: convex hull Theorem: convex hull is bounded by the is bounded by the union of spheresunion of spheres
Local constraints!Local constraints!

04/19/23 5
Basic AlgorithmBasic Algorithm An initial estimate An initial estimate
vector is calculatedvector is calculated Nodes check color of Nodes check color of
drift spheresdrift spheres Drift vector is the Drift vector is the
diameter of the drift diameter of the drift spheresphere
If any sphere non If any sphere non monochromatic: node monochromatic: node triggers re-calculation of triggers re-calculation of estimate vectorestimate vector
04/19/23 6
Reuters Corpus (RCV1-Reuters Corpus (RCV1-v2)v2)
Information Gain vs. Document Index
0
0.001
0.002
0.003
0.004
0.005
0.006
0.007
0.008
0 200000 400000 600000 800000Document Index
Info
rma
tio
n G
ain
bosnia
ipo
febru
Broadcast Messages vs. Threshold
0
100
200
300
400
500
600
700
800
0 0.001 0.002 0.003 0.004 0.005 0.006Threshold
Bro
ad
ca
st
Me
ss
ag
es
(x
10
00
)
bosnia
ipo
febru
Naive Alg.
800,000+ news stories 800,000+ news stories Aug 20 1996 -- Aug 19 1997Aug 20 1996 -- Aug 19 1997 Corporate/Industrial taggingCorporate/Industrial tagging
n=10
10 nodes, random data distribution
04/19/23 7
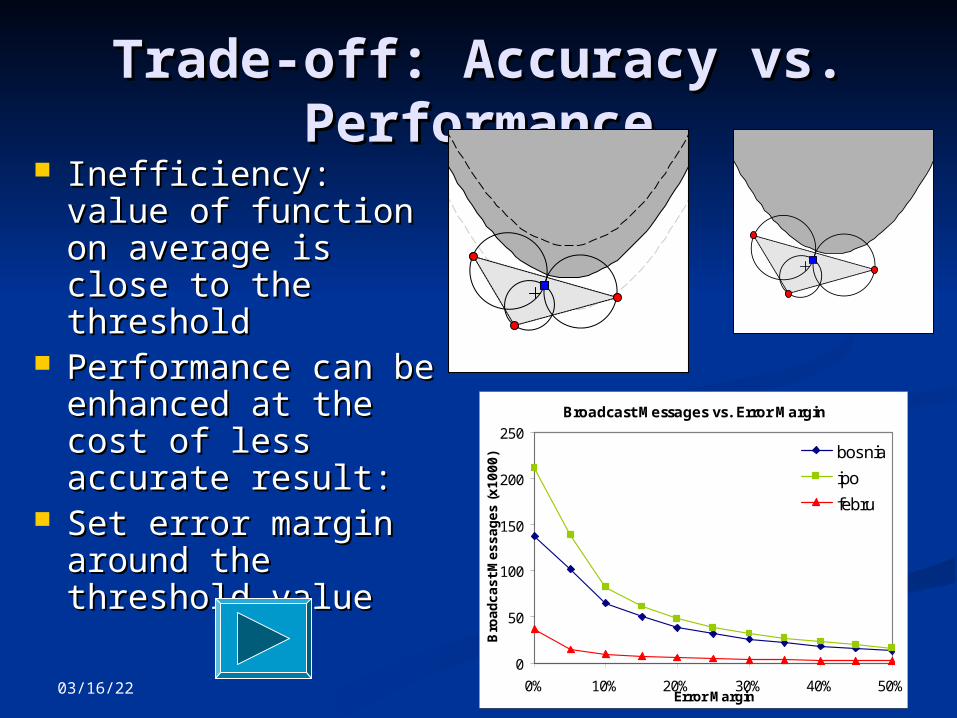
Trade-off: Accuracy vs. Trade-off: Accuracy vs. PerformancePerformance
Inefficiency: value Inefficiency: value of function on of function on average is close to average is close to the thresholdthe threshold
Performance can be Performance can be enhanced at the enhanced at the cost of less cost of less accurate result: accurate result:
Set error margin Set error margin around the around the threshold valuethreshold value
Broadcast Messages vs. Error Margin
0
50
100
150
200
250
0% 10% 20% 30% 40% 50%Error Margin
Bro
ad
ca
st
Me
ss
ag
es
(x
10
00
) bosnia
ipo
febru
04/19/23 8
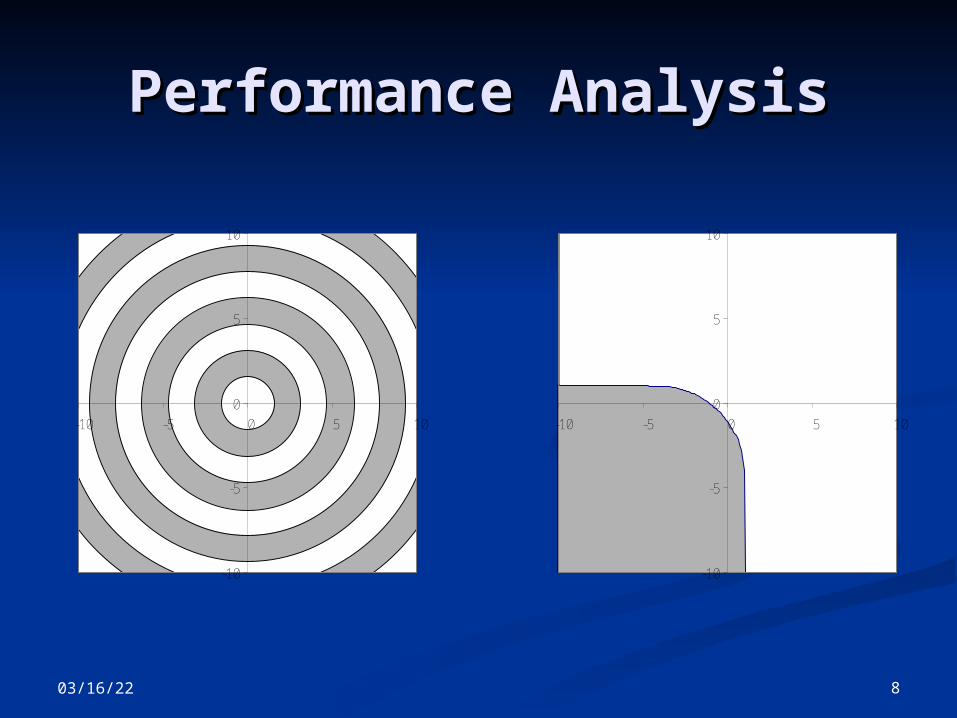
Performance AnalysisPerformance Analysis
-10
-5
0
5
10
-10 -5 0 5 10
-10
-5
0
5
10
-10 -5 0 5 10
04/19/23 9
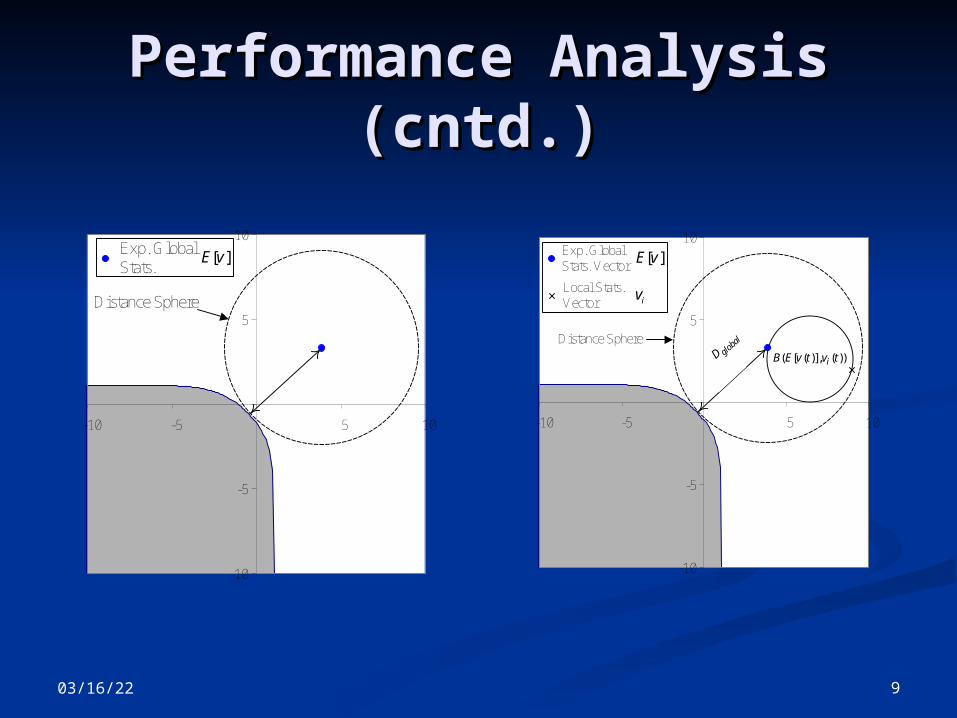
Performance Analysis Performance Analysis (cntd.)(cntd.)
-10
-5
5
10
-10 -5 5 10
Exp. Global Stats.
[ ]E v
Distance Sphere
-10
-5
5
10
-10 -5 5 10
global
DDistance Sphere
Local Stats. Vector iv
Exp. Global Stats. Vector
[ ]E v
( [ ( )], ( ))iB E v t v t

04/19/23 10
BalancingBalancing Globally calculating Globally calculating
average is costly average is costly Often possible to Often possible to
average only average only somesome of the data vectors.of the data vectors.
SRDC 201304/19/23 11
Shape Sensitivity Shape Sensitivity [PODS’08][PODS’08]
Fitting cover to DataFitting cover to Data Fitting cover to threshold surfaceFitting cover to threshold surface Specific function classes Specific function classes
SRDC 201304/19/23 12
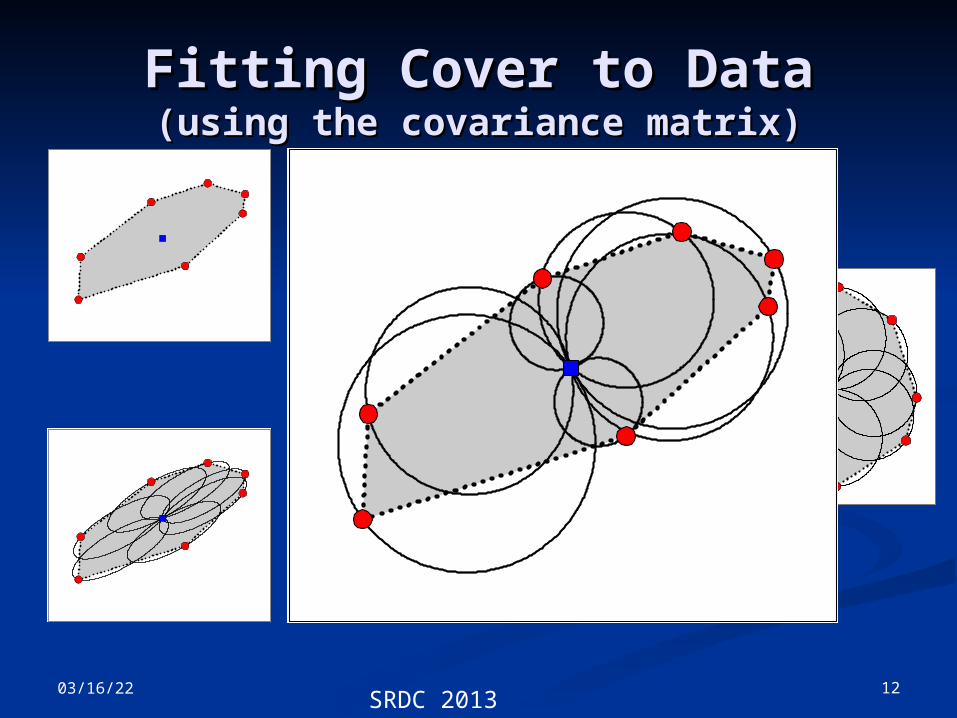
Fitting Cover to DataFitting Cover to Data(using the covariance matrix)(using the covariance matrix)
04/19/23 13
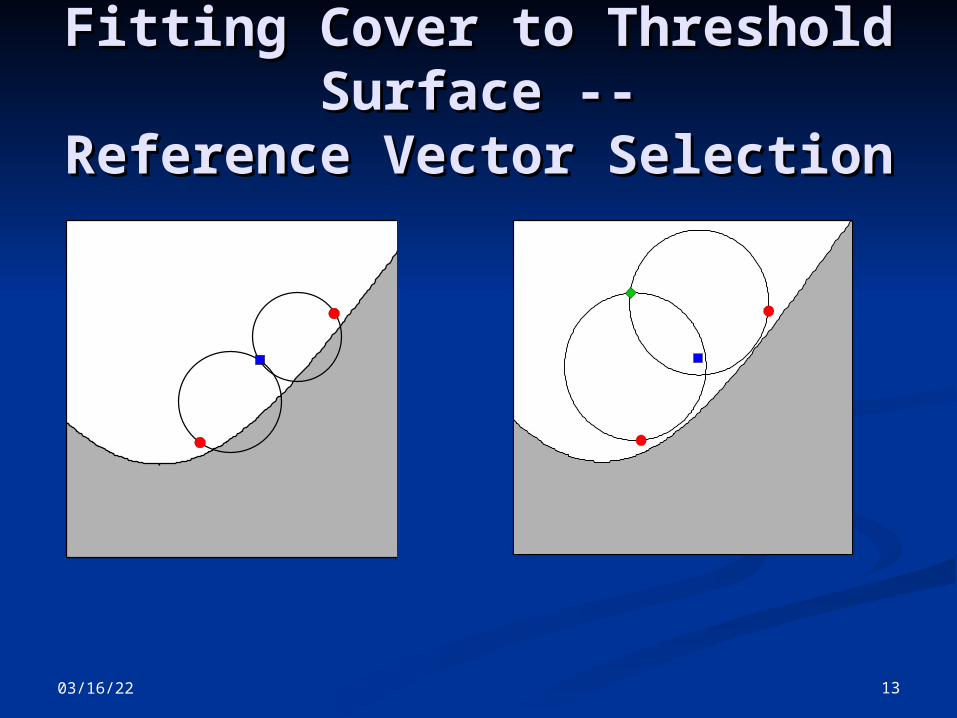
Fitting Cover to Threshold Fitting Cover to Threshold Surface --Surface --
Reference Vector SelectionReference Vector Selection
04/19/23 14
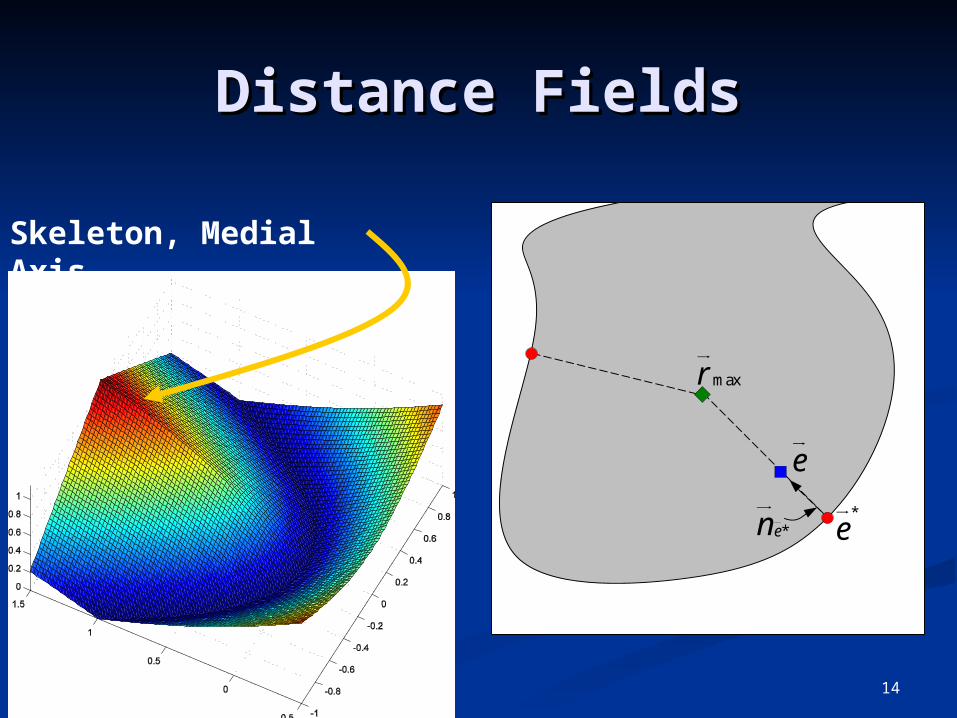
Distance FieldsDistance Fields
Skeleton, Medial Axis
maxr
*e*en
e
04/19/23 15
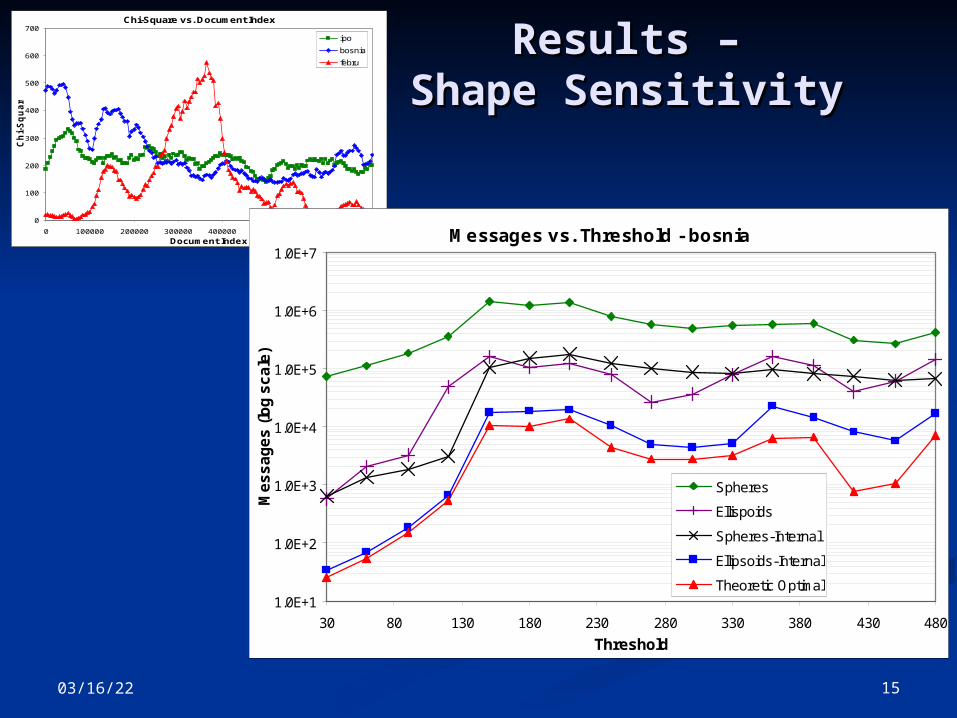
Results –Results –Shape SensitivityShape Sensitivity
Chi-Square vs. Document Index
0
100
200
300
400
500
600
700
0 100000 200000 300000 400000 500000 600000 700000
Document Index
Ch
i-S
qu
are
ipo
bosnia
febru
Messages vs. Threshold - bosnia
1.0E+1
1.0E+2
1.0E+3
1.0E+4
1.0E+5
1.0E+6
1.0E+7
30 80 130 180 230 280 330 380 430 480
Threshold
Me
ss
ag
es
(lo
g s
ca
le)
Spheres
Ellispoids
Spheres-Internal
Ellipsoids-Internal
Theoretic Optimal

e
ΔV1
ΔV2
ΔV3
ΔV4ΔV5
f(v(t)) T
ep
ΔVp1
ΔVp2
ΔVp3
ΔVp4
ΔVp5
v(t)
Stricter local constraints if local predictions remain accurate
Keeping up with v(t) movement
Prediction-Based Geometric Monitoring [SIGMOD’12]

SRDC 2013
Local ConstraintsLocal Constraints
17
Let the nodes communicate only when “something happens”
Tell me only if your
measurement is larger than 50!
Tell me only if your
measurement is larger than 50!
Send me your current
measurements!
Send me your current
measurements!
Safe Zones!
SRDC 2013
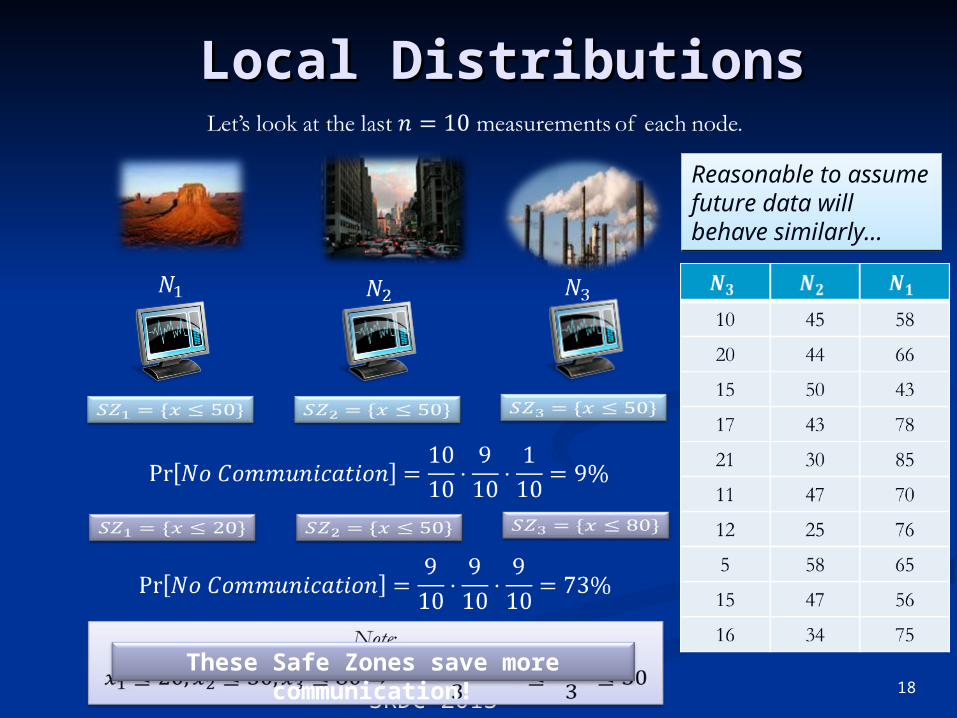
Local DistributionsLocal Distributions
18
Reasonable to assume future data will behave similarly…
Reasonable to assume future data will behave similarly…
These Safe Zones save more communication!
SRDC 2013
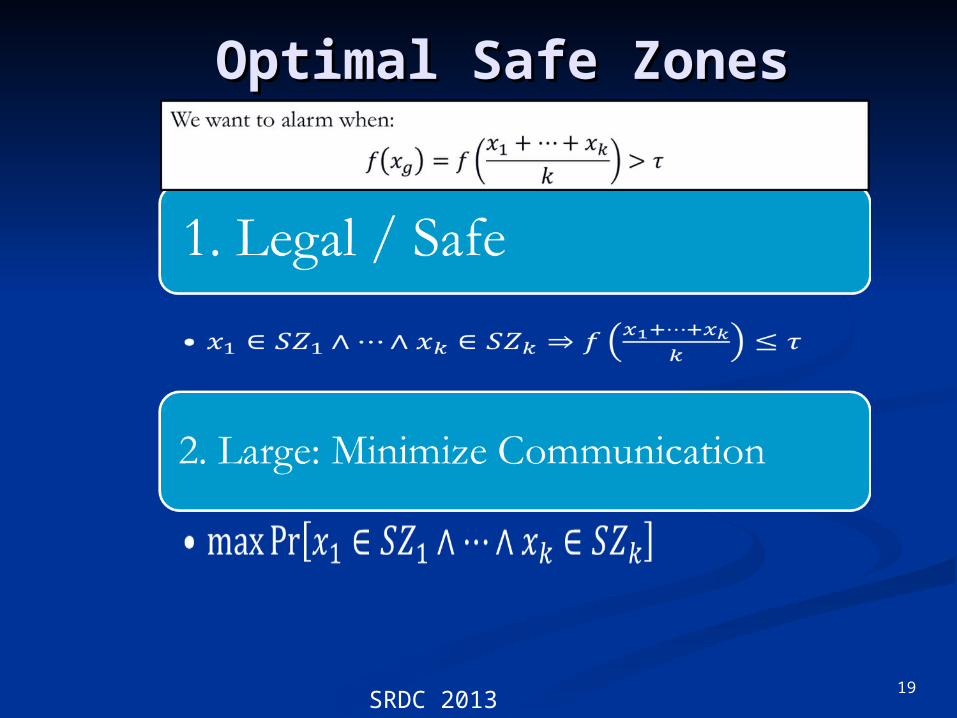
Optimal Safe ZonesOptimal Safe Zones
19

SRDC 2013
Example: Air quality Example: Air quality monitoringmonitoring
20
What are the optimal Safe Zones…?

SRDC 2013
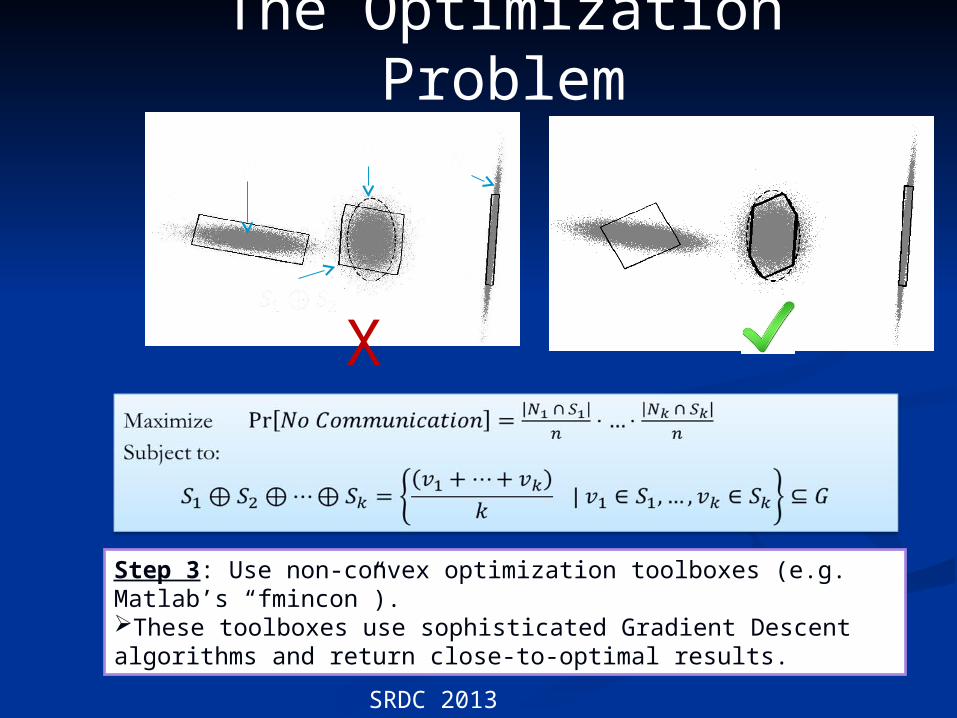
The Optimization The Optimization ProblemProblem
21
Is this Convex?
Is this Linear?
How many constraints are
these?
BAD NEWS: This problem is NP-hard.
SRDC 2013
The Optimization Problem
Step 3: Use non-convex optimization toolboxes (e.g. Matlab’s “fmincon”).These toolboxes use sophisticated Gradient Descent algorithms and return close-to-optimal results.
X

SRDC 2013 23
Data SetData Set
How the data looks
like

SRDC 2013
Ratio QueriesRatio Queries
24
Example of triangular Safe ZonesExample of triangular Safe Zones
SRDC 2013
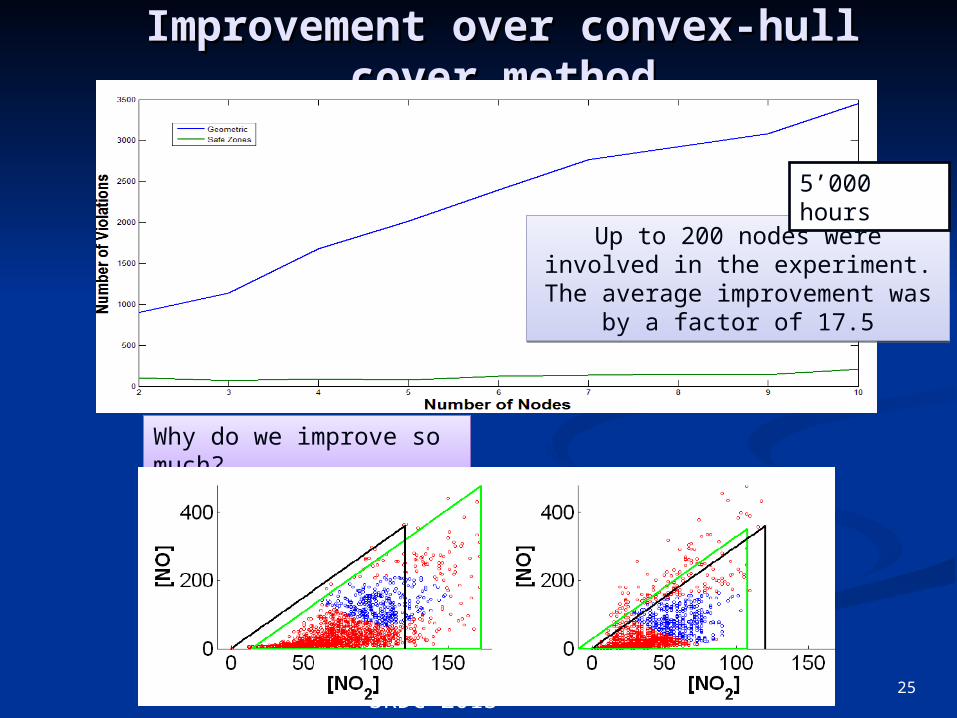
Improvement over convex-hull Improvement over convex-hull cover methodcover method
25
Why do we improve so much?Why do we improve so much?
Up to 200 nodes were involved in the experiment.
The average improvement was by a factor of 17.5
Up to 200 nodes were involved in the experiment.
The average improvement was by a factor of 17.5
5’000 hours

26
Higher DimensionsHigher Dimensions
SRDC 2013
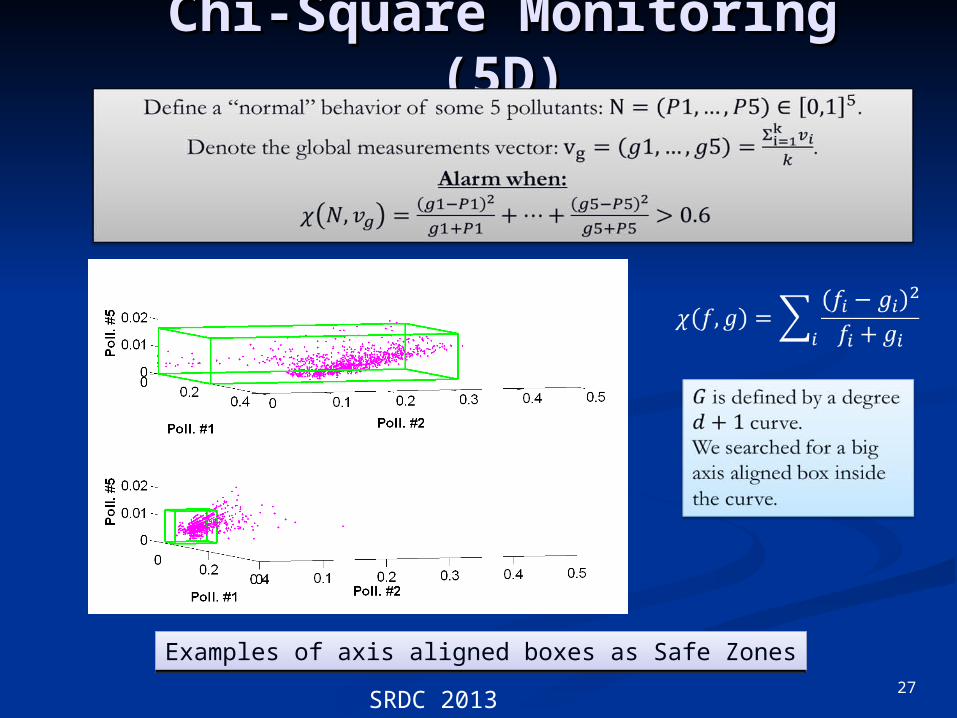
Chi-Square Monitoring Chi-Square Monitoring (5D)(5D)
27
Examples of axis aligned boxes as Safe ZonesExamples of axis aligned boxes as Safe Zones

SRDC 2013
Improvement over GMImprovement over GM
The improvement over the Geometric Method The improvement over the Geometric Method gets more substantial in higher dimensions.gets more substantial in higher dimensions.
The improvement over the Geometric Method The improvement over the Geometric Method gets more substantial in higher dimensions.gets more substantial in higher dimensions.
28
1’000 hours90 nodes
SRDC 2013 29
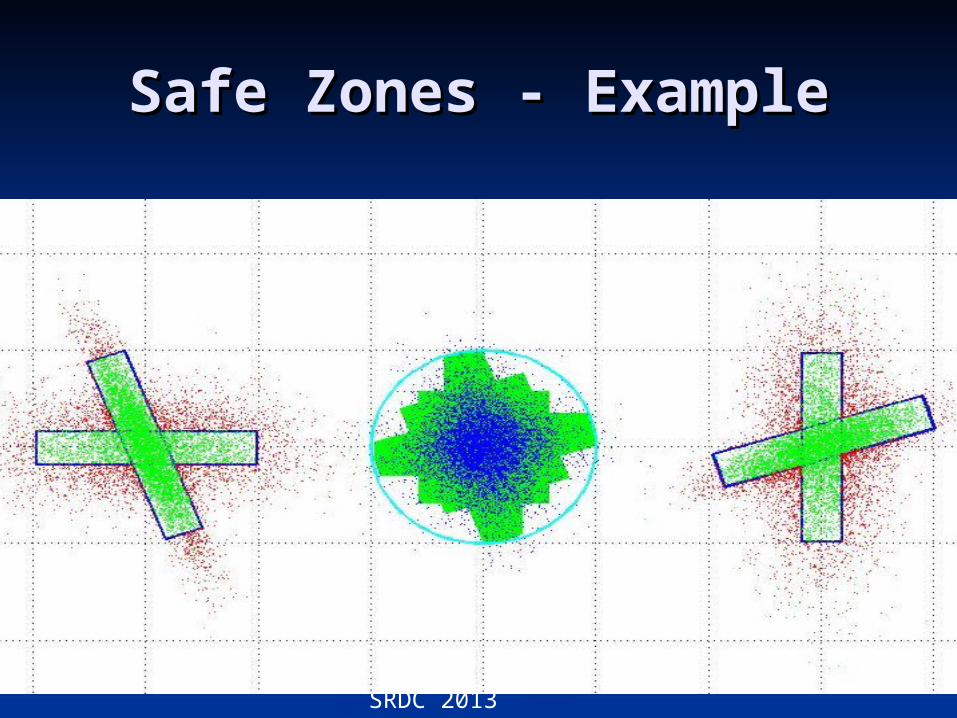
Safe Zones - ExampleSafe Zones - Example
SRDC 2013
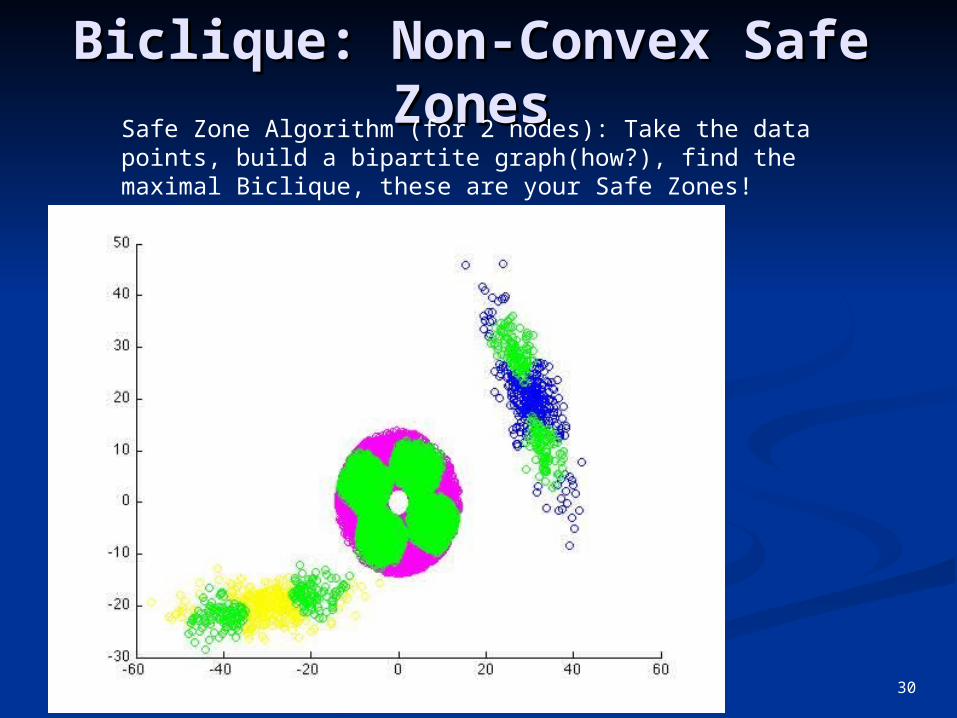
Biclique: Non-Convex Safe Biclique: Non-Convex Safe ZonesZones
30
Safe Zone Algorithm (for 2 nodes): Take the data points, build a bipartite graph(how?), find the maximal Biclique, these are your Safe Zones!
SRDC 2013
ConclusionsConclusions
Local filtering for large-scale Local filtering for large-scale distributed data systemsdistributed data systems
Saving in communication is unlimitedSaving in communication is unlimited Bounded only by the aggregate over system Bounded only by the aggregate over system
lifetimelifetime Saving bandwidth, central resources, power.Saving bandwidth, central resources, power.
Not necessary to sacrifice precision Not necessary to sacrifice precision and latencyand latency
Less communication Less communication more Privacy more Privacy
04/19/23 31

SRDC 2013