a general-purpose technology at work: the corliss steam...
TRANSCRIPT

The Journal of Economic History, Vol. 64, No. 1 (March 2004). © The Economic HistoryAssociation. All rights reserved. ISSN 0022-0507.
Nathan Rosenberg is Professor Emeritus, Department of Economics, Stanford University, EconomicsBldg 228, Stanford, CA 94305-6072; and Fellow, Canadian Institute of Advanced Research. E-mail:[email protected]. Manuel Trajtenberg is Chairman, School of Economics, Tel Aviv University,Tel-Aviv 69978, Israel; Research Associate, National Bureau of Economic Research; and Fellow,Canadian Institute of Advanced Research. E-mail: [email protected].
Brent Goldfarb has been immensely helpful throughout the preparation of this article, most espe-cially in gathering and organizing the material connected with waterpower. Stanley Engerman,Catherine de Fontenay, Kenneth Sokoloff, Peter Temin, Sidney Winter, Thomas Zeller, two referees,and the editor of this JOURNAL provided astute comments. Yael Elad and Barak Orbach provided ableand dedicated research assistantship. We are also grateful to participants in the Economic Growth andPolicy Program of the Canadian Institute for Advanced Research (CIAR), and to participants in theScience and Technology Workshop of the Stanford Economics Department, for constructive sugges-tions. We acknowledge with gratitude the financial support provided by CIAR, and by the Israel-USBinational Science Foundation.
1
A General-Purpose Technology at Work:The Corliss Steam Engine in the Late-
Nineteenth-Century United StatesNATHAN ROSENBERG AND MANUEL TRAJTENBERG
The contribution to growth from the steam engine—Industrial Revolution icon andprime example of a “General Purpose Technology”—has remained unclear. Thisarticle examines the role that a particular design improvement in steam power, em-bodied in the Corliss engine, played in the growth of the U.S. economy in the latenineteenth century. Using detailed data on the location of Corliss engines and water-wheels and a two-stage estimation strategy, we show that the deployment of Corlissengines served as a catalyst for the industry’s massive relocation into large urbancenters, thus fueling agglomeration economies and further population growth.
The steam engine has long been regarded as the icon of the IndustrialRevolution, even though the extent of its singular contribution to growth
has been the subject of much debate. A casual excursion into the history ofthis prime mover and of its vast array of uses suggests that the steam enginefits well the notion of “General-Purpose Technologies” (GPTs), and mayconstitute a prime example of such epochal innovations. From pumpingwater out of mines and driving the mechanized factories in Britain, to pow-ering virtually the entire industrial sector in the United States by the earlytwentieth century, the steam engine found its way to the major economicactivities of the industrial nations over a span of a century. Moreover, steambecame in the course of the nineteenth century the main power source forwater and land transportation, breaking the barriers of geographic isolationand bringing about a huge expansion of markets.
We focus in this article on the Corliss steam engine, a highly innovativeembodiment of stationary, high-pressure steam engines, which became thedominant design in the United States for large stationary engines in the latenineteenth century. Indeed, we shall argue that the Corliss engine played a

2 Rosenberg and Trajtenberg
1 See Bresnahan and Trajtenberg, “General Purpose Technologies”; David, Computer; Helpman andTrajtenberg, Time to Sow; Helpman, General Purpose; and Rosenberg, Technological Change andTechnological Interdependence.
2 Elsewhere the scarcity of appropriate water sites naturally favored steam as the leading primemover.
key role in the fierce contest between waterpower and steam power, particu-larly in the Northeast. In so doing it helped propel the steam engine to adominant position in the intertwined processes of industrialization and ur-banization that characterized the growth of the U.S. economy in the secondhalf of the nineteenth century.
The notion of GPTs rests on the historical observation that whole eras oftechnical progress and economic growth appear to be driven by a few keytechnologies: closely following upon the steam engine, electricity quitelikely played such a role in the early decades of the twentieth century, andinformation technologies may be doing as much in our era.1 GPTs unfoldover the long haul through a sequence of innovations that take many shapesas distinct embodiments of the basic technology: the engines that poweredlocomotives were radically different from those that pumped water out ofmines early on, much as a Pentium processor differs from the integratedcircuits of pocket calculators. By focusing on the Corliss engine, a particu-lar embodiment of the steam engine GPT, we hope to shed light on the dy-namics of GPTs, and in particular on the mechanisms by which GPTs playtheir presumed role as “engines of growth,” in the context of a narrowlycircumscribed technological and historical setting.
Waterpower, by far the main American power source until the mid nine-teenth century, offered abundant and cheap energy for a wide range of in-dustrial uses. However, waterpower suffered from a crucial limitation: man-ufacturing plants had to locate wherever topography and climate permitted,and not where key economic considerations such as access to markets forinputs and outputs would have directed. Steam engines offered the possibil-ity of relaxing this severe locational constraint. However, in order for indus-try to actually relocate on a large scale, the operation of the steam enginehad to be sufficiently advantageous compared to watermills. The Corlissengine, with its vast improvements both in fuel efficiency and in key perfor-mance characteristics (primarily regularity of motion and the ability to sus-tain sudden dramatic changes in load), greatly contributed to tipping thebalance in favor of steam, particularly in and around New England.2 In sodoing, then, it helped set off the twin processes of substitution of steam forwater, and of relocation of industry from rural to urban environments.These, we hypothesize, turned out to be some of the key pathways by whichthe steam engine played its role as a GPT in the second half of the nine-teenth century.
We document these processes with highly detailed quantitative data andeconometric analysis, as well as with supporting qualitative historical

Corliss Steam Engine 3
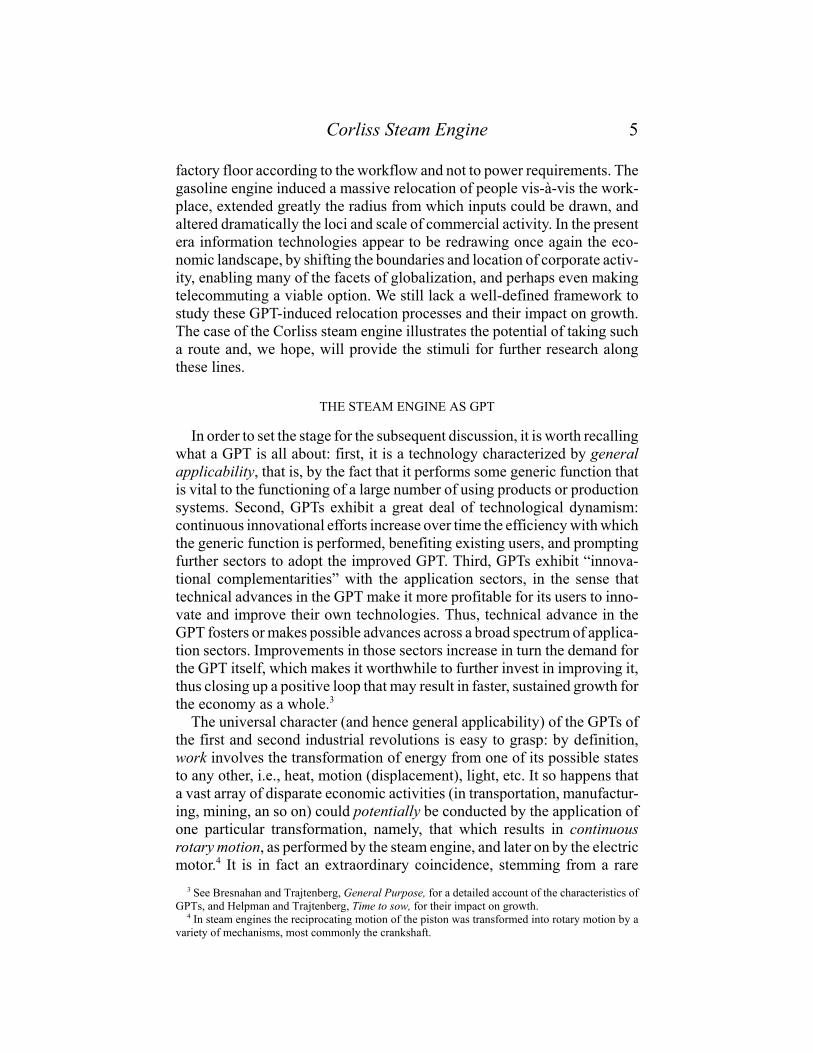
evidence. The original data come from the petition that George Corlisssubmitted to Congress in 1869, requesting a second extension to his highlysuccessful patents (see Figure 1). The petition contains a detailed list ofbuyers of Corliss engines, with their names, precise location, and horse-power, which we supplemented with information about the industrial com-position of these users. Our analysis is based on these data, in conjunctionwith comprehensive data on waterpower (i.e., over 4,000 water sites in thenorth Atlantic states, with their horsepower and industrial classification),and an array of census data by counties.
We attempt to ascertain with the aid of these data the stringency of thelocational constraint imposed by the reliance on waterpower, and the extentto which each of the competing power modes fostered or hindered urbaniza-tion. We do that by pivoting on the deployment of Corliss engines and ofwatermills in the Northeast as of 1870, by county, and looking forward andbackwards in time: first, we estimate “adoption” equations for Corliss en-gines and for watermills as a function of population, physical and humancapital, and other variables from the 1850 census. Second, we estimate amodel of population growth from 1870 to 1900, as a function of the stockof Corliss engines, watermills, and controls. The findings indicate thatCorliss engines did indeed agglomerate in large urban centers whereaswaterwheels proliferated mostly in rural areas. Moreover, subsequent popu-lation growth was positively related to the adoption of Corliss engines, andnot to the presence of waterpower-based industry.
These results support the hypothesized role of the Corliss in the dynamicinteraction between industrialization and urbanization. Freed of the loca-tional constraints of waterpower, manufacturing enterprises driven by steamchose to locate mostly in urban areas, where they could take advantage ofagglomeration economies. The presence of Corliss-driven manufacturerscontributed to these agglomeration effects, and probably also signaled thatmore were coming, as Corliss engines were “trend setters,” both in that theywere deployed in advanced sectors, and in that they were of a larger scale.In time, locations with relatively many Corliss-driven establishments at-tracted further manufacturers and hence also fostered population growth. Bycontrast, watermills were not part of such a positive loop: they located insparsely populated areas to begin with, and failed to attract further economicactivity and hence further population to those areas.
The role of the Corliss in precipitating these growth-enhancing relocationprocesses is, we suspect, far from unique: indeed, it would seem that one ofthe key channels by which each successive GPT affects the economy isthrough the massive relocation and reorganization of economic activity thatit induces, with concomitant gains in efficiency. Thus, and following thesteam engine, electricity brought about the fractionalization of power withinfactories, enabling the much more efficient (re)location of machines on the

4 Rosenberg and Trajtenberg
FIGURE 1USERS OF CORLISS ENGINES LISTED IN CORLISS’S PETITION
Source: Page 5 of the petition: motives for signing in and beginning of list.
Corliss Steam Engine 5
3 See Bresnahan and Trajtenberg, General Purpose, for a detailed account of the characteristics ofGPTs, and Helpman and Trajtenberg, Time to sow, for their impact on growth.
4 In steam engines the reciprocating motion of the piston was transformed into rotary motion by avariety of mechanisms, most commonly the crankshaft.
factory floor according to the workflow and not to power requirements. Thegasoline engine induced a massive relocation of people vis-à-vis the work-place, extended greatly the radius from which inputs could be drawn, andaltered dramatically the loci and scale of commercial activity. In the presentera information technologies appear to be redrawing once again the eco-nomic landscape, by shifting the boundaries and location of corporate activ-ity, enabling many of the facets of globalization, and perhaps even makingtelecommuting a viable option. We still lack a well-defined framework tostudy these GPT-induced relocation processes and their impact on growth.The case of the Corliss steam engine illustrates the potential of taking sucha route and, we hope, will provide the stimuli for further research alongthese lines.
THE STEAM ENGINE AS GPT
In order to set the stage for the subsequent discussion, it is worth recallingwhat a GPT is all about: first, it is a technology characterized by generalapplicability, that is, by the fact that it performs some generic function thatis vital to the functioning of a large number of using products or productionsystems. Second, GPTs exhibit a great deal of technological dynamism:continuous innovational efforts increase over time the efficiency with whichthe generic function is performed, benefiting existing users, and promptingfurther sectors to adopt the improved GPT. Third, GPTs exhibit “innova-tional complementarities” with the application sectors, in the sense thattechnical advances in the GPT make it more profitable for its users to inno-vate and improve their own technologies. Thus, technical advance in theGPT fosters or makes possible advances across a broad spectrum of applica-tion sectors. Improvements in those sectors increase in turn the demand forthe GPT itself, which makes it worthwhile to further invest in improving it,thus closing up a positive loop that may result in faster, sustained growth forthe economy as a whole.3
The universal character (and hence general applicability) of the GPTs ofthe first and second industrial revolutions is easy to grasp: by definition,work involves the transformation of energy from one of its possible statesto any other, i.e., heat, motion (displacement), light, etc. It so happens thata vast array of disparate economic activities (in transportation, manufactur-ing, mining, an so on) could potentially be conducted by the application ofone particular transformation, namely, that which results in continuousrotary motion, as performed by the steam engine, and later on by the electricmotor.4 It is in fact an extraordinary coincidence, stemming from a rare
6 Rosenberg and Trajtenberg
5 Note that many manual jobs (e.g., sewing, polishing, cutting) could hardly be seen ex ante asnatural candidates for replacement by mechanical actions originating in rotary motion, and thus it musthave been far from obvious that rotary motion would become such a universal functionality. Even bythe mid-nineteenth century there were still very many activities that few would have dreamt to mecha-nize, let alone automate, with the “prime mover” being the steam engine. Indeed, in many cases thesubstitution did not make economic sense until ever-improving steam engines, and the Corliss amongthem, delivered such functionality at favorable price/performance ratios.
6 See, for example, Hunter, History (Vol. 2), and the many sources quoted there, primarily of atechnical nature.
7 The case of electric power provides a clear illustration. See Du Boff, Introduction; Rosenberg,Technological Interdependence; and David, Computer. Electricity and electric motors diffused rapidlyduring the first three decades of the twentieth century, and it is widely believed that the large productiv-ity gains registered during that period owe a great deal to this process of electrification: the new energysource fostered a more efficient (re)design of factories and a wholesale reorganization of work arrange-ments, taking advantage of the newfound flexibility of electric power. Indeed, as mentioned earlier,fractionalization of power brought about by electricity meant that machines could be placed on thefactory floor much more efficiently according to the natural workflow, and not according to their powerrequirements, as was the case with the steam engine.
combination of physical laws, economic processes, and ingenuity (which wedo not pretend to grasp fully), that power delivered as rotary motion turnedout to be capable of sewing cloth, lifting us in space, cooling the indoors,and a myriad of other uses.5 And indeed, the steam engine proved to be ofvirtually universal usefulness, quite likely setting a historic high mark for“general applicability”: from pumping water out of mines, to water and landtransportation, to the powering of virtually the entire industrial sector in theUnited States, the steam engine found its way to the major economic activi-ties of the industrial nations over a span of almost two centuries. No wonderthe symbol of the centennial exhibition in Philadelphia (1876) was a hugeCorliss engine, the largest steam engine ever built.
The technological dynamism of the steam engine has been documentedextensively elsewhere, and hence we shall not dwell on it here, except forsuccinct descriptions of the advances that the Corliss design brought about.6Identifying and quantifying the unfolding of innovational complementaritiesis clearly the most important but also the most difficult task in clarifying therole of a technology as GPT: what one would need is evidence to the effectthat advances in the GPT foster or enable (complementary) advances acrossa broad spectrum of application sectors.7 We attempt to tackle innovationalcomplementarities in the context of the Corliss steam engine in variousways. First and foremost, we argue that the improvements embodied in theCorliss engine helped tilt the equilibrium away from water and towardssteam as the main source of power in manufacturing, and in so doing fos-tered a massive process of relocation of industry, away from remote, isolatedlocations and into urban centers. The dual processes of industrialization andurbanization that ensued brought about the benefits of agglomeration, andthese externalities in turn further encouraged both the growth of cities andthe concentration of manufacturing there. Another mechanism was that theCorliss engine allowed for a much larger scale in manufacturing, and with

Corliss Steam Engine 7
8 We also devoted significant efforts toward searching for evidence of innovational complementar-ities in the more straightforward sense of the Corliss engine “prompting” improvements in specific usersectors. However, we could not find compelling, first-hand evidence to that effect, and hence, whilebelieving that the Corliss engine may have played a role along those lines, we base our analysis exclu-sively upon the other mechanisms. It is likely that the inducement to develop, say, better textile ma-chinery was provided by the advent of the factory system as much as by improvements in primemovers, and hence it is inherently very difficult to identify the separate effect of these factors.
9 Fogel, Railroads.10 See also Fishlow, Productivity.11 This is as simple as the difference between a once-and-for-all change in levels, and a change in
trend.
it the realization of scale economies. Lastly, we discuss in some detail theimportance of the Corliss engine for rolling mills, a sector that played a keyrole in metallurgy during the closing decades of the nineteenth century,particularly in the building of railroads.8
Examining the Corliss engine as a particular episode in the evolution ofa GPT touches also on the fundamental methodological issues of how toassess, more generally, the economic impact of presumed “major” innova-tions. Robert Fogel’s seminal study of railroads put forward an approachthat centered on the painstaking comparison of costs between the new tech-nology and existing best practice, in that case between railroads and watercanals.9 His findings seemed to indicate that the overall economic impact ofthe advent of railroads, as measured by cost savings expressed as a percent-age of GDP, was small, and hence professed to demystify the economicimportance of any specific innovation.10
In our view a methodology that focuses exclusively on cost comparisons,and the concomitant cost-savings calculations, by and large misses thedeeper point. As previously mentioned, the impact of a general-purposetechnology on growth operates primarily through innovational complemen-tarities and the positive loop that these set in motion, and not just throughcost advantages. These complementarities, in turn, are typically the result ofthe interplay between a bundle of improved technological attributes thatcharacterize the GPT, and the wider environment in which the GPT operates(e.g., downstream application sectors, geographical locations, etc.). Thisbundle of attributes can be subsumed in a hedonic-type cost-saving calcula-tion, but more often than not such single-figure computation obscures theunfolding of the dynamic processes that lie at the heart of GPTs. Regardlessof the size of the cost savings that a new technology might bring about, if itdoes not prompt down-the-line innovations and related complementaryinvestments across a wide range of user sectors, it will not propel long-termgrowth, and hence it will not qualify as a GPT.11 Conversely, a technologythat does exhibit pervasive innovational complementarities may not resultin significant cost savings vis-à-vis its closest substitute, but this latter factwould not necessarily hinder its role as a GPT.
G. N. von Tunzelmann’s detailed study of steam power and British indus-trialization starts off from a Fogel-type calculation, and also finds that the

8 Rosenberg and Trajtenberg
12 von Tunzelmann, Steam. Actually, von Tunzelmann studied the impact of Boulton & Watt steamengines, vis-à-vis all other prime movers, including Newcomen’s atmospheric engines.
measurable impact of the steam engine in terms of costs savings was verysmall as a fraction of GDP in the United Kingdom, as of 1800.12 However,he goes further and dwells extensively on “backward and forward linkages,”the latter notion closely related to innovational complementarities. Afterexamining the use of the steam engine in the cotton industry, in other seg-ments of textiles, and in mining, von Tunzelmann concludes that these for-ward linkages were of relatively minor importance, at least through the firsthalf of the nineteenth century. That may well be the case, and vonTunzelmann certainly buttresses his arguments with impressive scholarship.However, his emphasis is still on the impact of changes in power costs onthe adoption of mechanical innovations (such as the self-acting mule and thepower loom), rather than on other important aspects of prime movers, suchas reliability of supply, regularity of motion, or locational flexibility. As weargue below, the bundle of attributes embodied in the Corliss engine playeda major role in the expansion of applications of steam power during the timeperiod under consideration; furthermore, the economic impacts of theseattributes are by no means exhausted by cost comparisons alone.
Lastly, the question arises as to whether the Corliss steam engine oughtto be regarded as a GPT in itself, or rather as a particular episode along theevolutionary path of the steam engine GPT. It is inherently very difficult todelimit what exactly constitutes a GPT in its own terms, and one cannotexpect decisive answers. Yet in our view a GPT should be associated withlong-term growth, therefore it must affect the economy at large throughmyriad user sectors, and it has to do so over the long run. The steam engineas it evolved and spread from the late eighteenth century onwards almostcertainly fits the bill, even if its full story from the GPT perspective stillremains to be told. The Corliss engine was just one particular manifestationof the long march of steam: it was a mid-to-late-nineteenth-century station-ary, high-pressure, large-scale engine, used primarily in manufac-turing—each of these descriptive characteristics narrows down significantlythe extent of “GPT-ness” that can be claimed for it. Thus our stand shouldbe clear: the Corliss engine ought not to be regarded as a GPT by itself, yeta lot can be learned about how GPTs operate by studying the way by whichthe Corliss played out its role as a prominent embodiment of the steamengine GPT, during the rather crucial phase of industrialization and urban-ization of the late nineteenth century.
STEAM, WATER, AND GEOGRAPHY: A HISTORICAL PERSPECTIVE
In 1829, a full 60 years after James Watt took out his critical patent on theimproved steam engine, Zachariah Allen, of Providence, Rhode Island, was

Corliss Steam Engine 9
13 Allen, Science, p. 352.14 Chandler, Visible Hand, pp. 61–62.15 U.S. Congress, Report.16 Temin, Steam, p. 190.
still able to paint a bucolic image of American manufacturing, an image thatinvolved no mention of the steam engine. American manufacturing activi-ties, he pointed out, “are all carried on in little hamlets, which often appearto spring up in the bosom of some forest, gathering around the water fallwhich serves to turn the mill wheel.”13 The McLane Report of 1833, withextensive quantitative data (although still incomplete in its coverage), de-scribed a manufacturing scene that was powered almost entirely by water.If one excludes the area around Pittsburgh, where there was an abundanceof readily accessible coal, no more than four of the 249 firms in Americathat had a capitalization of over $50,000 were dependent for their power onsteam engines. In fact, outside of the Pittsburgh area, as Chandler haspointed out, “. . . more firms reported the use of wind and mule power thansteam.”14
The limited intrusion of the steam engine into the American manufactur-ing scene during the following decade may be readily calibrated by an ex-amination of the 1838 Treasury survey of steam engines.15 According to thisreport, nearly 60 percent of all power generated by steam was accounted forby steamboat engines, and a further 5 percent or so by railroad locomotives.Thus, only about one-third of all power generated by steam engines in 1838was accounted for by manufacturing; this amounted to just 36,100 horse-power, which constituted a trifling 5 percent of total power used in manufac-turing (see Figures 2 and 3). Drawing upon the data of the 1838 Report,Peter Temin concludes that “. . . steam-engine construction in 1838 was asmall-scale business carried on for a predominantly local market,” a conclu-sion that would appear to be reinforced by the fact that the largest singlecategory of users of stationary steam engines in 1838 was sawmills.16 Thedata show also, surprisingly at first glance, that Louisiana was a heavy userof stationary steam engines in 1838. This prominence was due to the ab-sence of waterpower sites in southern Louisiana, and the urgency of crush-ing the sugar cane immediately after it had been cut.
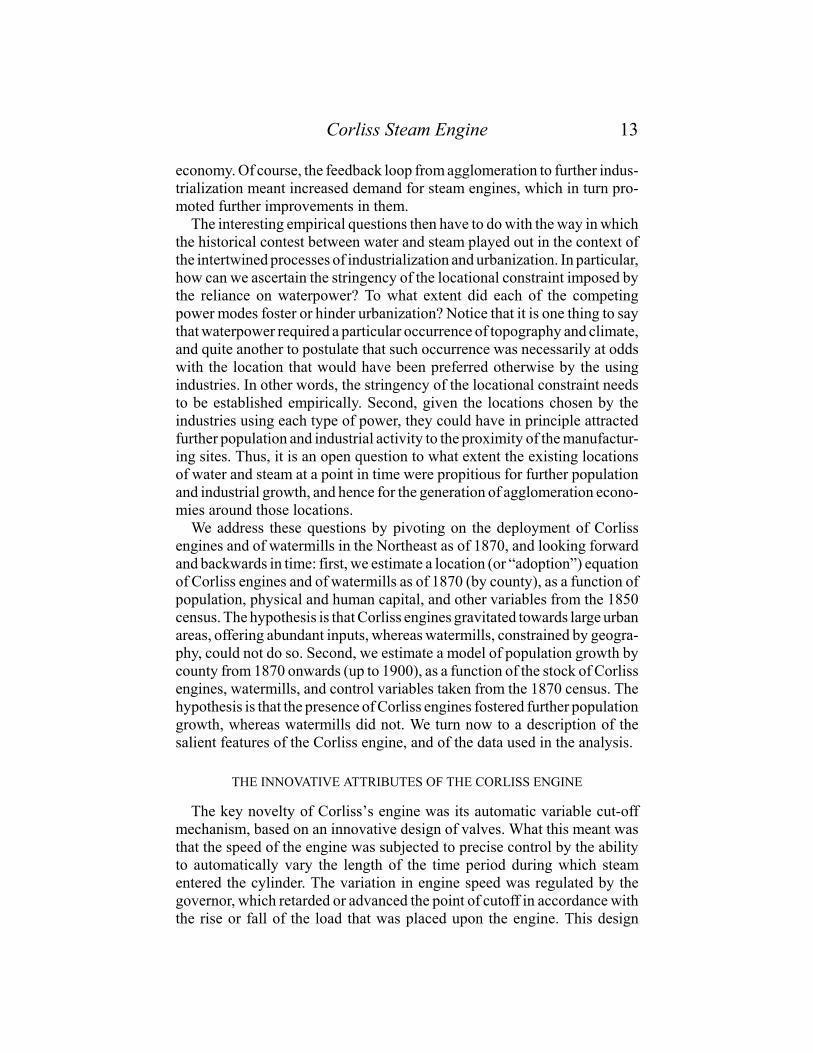
Figure 2 shows the tremendous growth of power deployed in manufactur-ing for the United States as a whole during the second half of the nineteenthcentury; in fact, power use increased at a staggering average annual rate of4.7 percent throughout those 50 years. This of course mirrors the rapidgrowth that took place in manufacturing itself, and in fact constitutes a lowerbound for it, because the efficiency in the use of power also increased duringthat period. The figure also makes it clear that it was indeed steam powerthat led the growth spurt throughout that period: starting from a bare 5 per-cent of total power in 1838, it overtook water by the late 1860s, and reacheda peak of over 80 percent by the turn of the century, when electricity started

10 Rosenberg and Trajtenberg
to diffuse rapidly. Less noticeable in the figure (because of the scale) but notless important, water power kept increasing in absolute terms up to 1910,and in fact total water horsepower deployed in manufacturing was twice asmuch in 1900 as in 1850.
The picture that emerges is thus of a rapidly advancing power technology,the steam engine, that made possible the growth of manufacturing (andhence of the economy as a whole) during the second half of the nineteenthcentury, by providing it with an increasing fraction of its power needs. TheCorliss engine entered the scene by mid century, and our data cover roughlythe two decades 1850–1870, which, as Figure 2 reveals, was the period ofintense competition between the two power sources. In the course of thatperiod the Corliss became the dominant design for large, stationary steamengines in manufacturing, certainly after the expiration of his patents in1870. This then is the backdrop of our study: the takeoff of industrializationin the United States, which is inextricably linked with urbanization, as steamand water fiercely competed for primacy in the process.
The first thing that needs to be said about the limitations of waterpoweris that its location and kinetic potential were largely (but not entirely) fixedby geology and hydrology. It is a familiar part of the story of nineteenth-century American industrial development, that the westward movement ofa growing population found itself in terrain where waterpower locationswere far less abundant than they were east of the Appalachians. To thisextent the westward movement after the Civil War rendered an increasingreliance on steam, at the time the only available alternative, quite unavoid-able. That was not quite the case in the north Atlantic states: the total horse-power generated from water in New England continued to increase right intothe early twentieth century through a combination of measures, including the
0
2,000
4,000
6,000
8,000
10,000
12,000
1838 1850 1860 1870 1880 1890 1900
thou
sand
HP
FIGURE 2POWER USE IN U.S. MANUFACTURING
Source: Appendix 1.
Total
Steam
Water

Corliss Steam Engine 11
17 On water rights, see Horwitz, Transformation, pp. 34–40.18 As has been aptly done in Atack, Fact in Fiction; and Atack et al., Regional Diffusion.19 As Sokoloff, Inventive Activity, has convincingly demonstrated through the use of patent records,
inventive activity in the first half of the nineteenth century was closely related to urbanization and theassociated growth of markets. See also Krugman, Geography.
Urbanization was already proceeding rapidly in the years preceding the Civil War. In 1820 therewere only 12 cities in the United States with a population in excess of 10,000, and only two whosenumbers exceeded 100,000. In 1860 there were already eight cities with over 100,000, and the popula-tion of New York City exceeded one million.
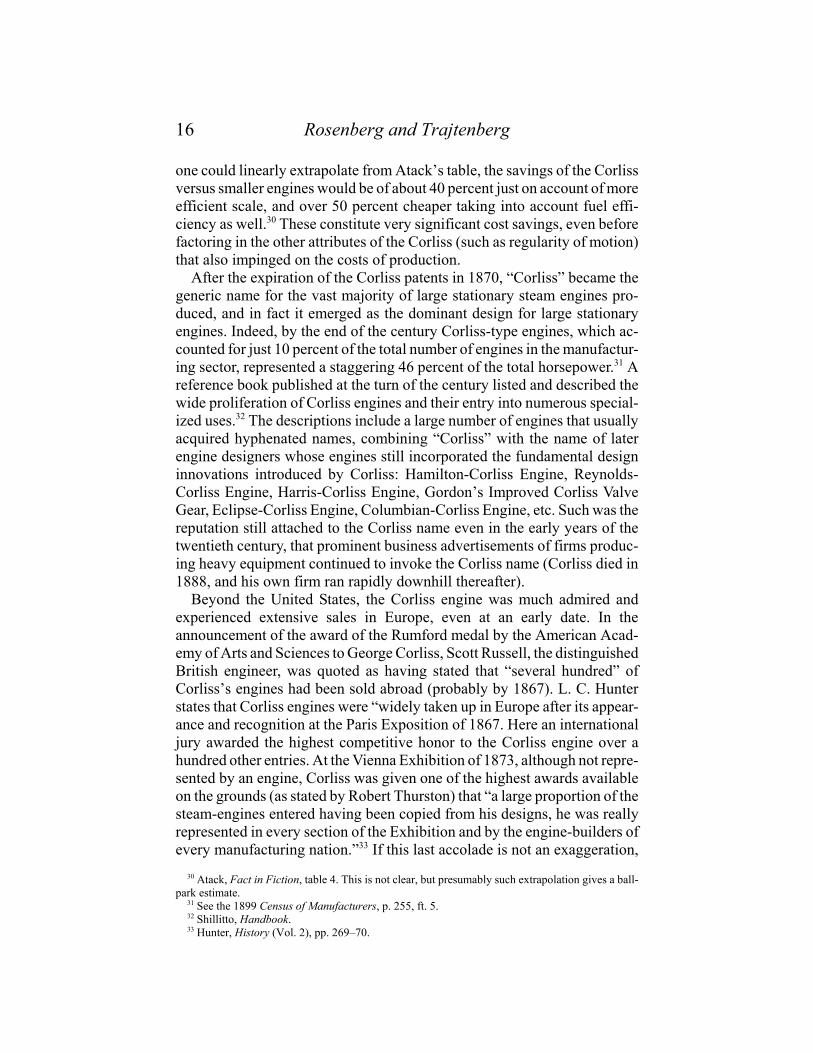
introduction of new and improved turbines, but also through exploitation ofmarginal power sites and through improvements in dam engineering. Thus,in New England steam overtook water as the dominant power source onlyin the mid 1880s, whereas in the rest of the United States that happenedmore than two decades earlier (see Figure 3).
Several factors played a role in the century-old contest between steam andwater power: exogenous movements (and growth) of population, the avail-ability of water sites and the rather complex issue of water rights, advancesboth in the technology of water power and of steam engines, transportationand fuel costs, wages and capital requirements, an so on.17 These can besubsumed in comparative costs computations, which can then be used totrace the diffusion of each prime mover by region.18 But the more subtle partof the story of the shift to steam is associated with the growth of cities andwith the advantages of the urban concentration of manufacturing indus-tries.19 As the economic benefits of urban agglomeration increased duringthe second half of the nineteenth century, and as the transportation network(primarily the railroads) widely expanded in scope and density, static costcomparisons between steam and waterpower became progressively less
0.00
0.20
0.40
0.60
0.80
1.00
1838 1850 1860 1870 1880 1890 1900 1910 1920
Steam NE
Water NE Steam rest US
Water rest US
FIGURE 3STEAM VS. WATER POWER: NEW ENGLAND AND THE REST OF THE UNITED STATES
(percentage of total power sources)
Note: Total power sources include gas and electric from 1890 on.Source: Appendix 1.

12 Rosenberg and Trajtenberg
20 Even if focusing on measurable cost comparisons, Atack et al. amply recognized the importanceof location: “We would argue, therefore, that our cost results are biased against steam. Indeed, loca-tional freedom was an unparalleled advantage of steam.” (in Atack et al., Regional Diffusion, p. 293).
21 Once again, west of the Appalachians water sources were much less abundant, and hence the directcost advantages of steam were an overriding consideration. Thus, the closest contest between water andsteam took place in the North and Mid-Atlantic states.
germane to decision making with respect to choice of prime mover. Rather,location became increasingly compelling: waterpower was typically notavailable in urban locations and, for the most part, it was not available onthe scale that was required.20 Moreover, the Corliss engine eventually madesteam power available on terms that compared favorably not only withsteam engines of other designs, but also with waterpower even in locationswhere such power was plentiful.
The Main Hypothesis: Removing the Locational Constraint
As already suggested, one of the key differences between water and steampower was of course the degree of flexibility in the choice of location. Theuse of water required that factories be located next to sufficiently copiousstreams having the “right” surrounding topography so that water wheelscould be placed and provide the power requirements. However, it is clearthat the optimal choice of location involves a variety of considerations otherthan the availability of appropriate streams, such as proximity to markets,transportation facilities (such as rail or ports), availability of labor, skills,and capital. The use of waterpower implied then a constraint on the effectivegeographic choice set, its stringency depending on the degree of coincidencebetween the availability of water and of the other factors. It follows that thereplacement of water by steam meant at first the removal of such constraint,but in order to realize the benefits from the newly expanded choice set, firmshad to engage in complementary activities. First and foremost was theiractual relocation, but also involved were changes in the mix of inputs andtransportation modes associated with the new locations and the (re)designof factories so as to take advantage of the specific characteristics of thesteam engine as prime mover (as opposed to waterwheels).
We contend that the innovations that George Corliss introduced contrib-uted greatly to tilting the balance away from waterpower and in favor ofsteam, particularly in the north Atlantic states.21 The adoption of steammeant the release of the geographical constraint, which allowed the optimal(re)location of factories, and the implementation of concomitant changesthat were called for by the new locations and type of prime mover. In sodoing the Corliss engine fostered the growth of the big industrial urbancenters, which characterized the closing decades of the nineteenth century,thus contributing to and enabling the reaping of benefits from agglomerationeconomies, which were in turn an important contributor to the growth of the
Corliss Steam Engine 13
economy. Of course, the feedback loop from agglomeration to further indus-trialization meant increased demand for steam engines, which in turn pro-moted further improvements in them.
The interesting empirical questions then have to do with the way in whichthe historical contest between water and steam played out in the context ofthe intertwined processes of industrialization and urbanization. In particular,how can we ascertain the stringency of the locational constraint imposed bythe reliance on waterpower? To what extent did each of the competingpower modes foster or hinder urbanization? Notice that it is one thing to saythat waterpower required a particular occurrence of topography and climate,and quite another to postulate that such occurrence was necessarily at oddswith the location that would have been preferred otherwise by the usingindustries. In other words, the stringency of the locational constraint needsto be established empirically. Second, given the locations chosen by theindustries using each type of power, they could have in principle attractedfurther population and industrial activity to the proximity of the manufactur-ing sites. Thus, it is an open question to what extent the existing locationsof water and steam at a point in time were propitious for further populationand industrial growth, and hence for the generation of agglomeration econo-mies around those locations.
We address these questions by pivoting on the deployment of Corlissengines and of watermills in the Northeast as of 1870, and looking forwardand backwards in time: first, we estimate a location (or “adoption”) equationof Corliss engines and of watermills as of 1870 (by county), as a function ofpopulation, physical and human capital, and other variables from the 1850census. The hypothesis is that Corliss engines gravitated towards large urbanareas, offering abundant inputs, whereas watermills, constrained by geogra-phy, could not do so. Second, we estimate a model of population growth bycounty from 1870 onwards (up to 1900), as a function of the stock of Corlissengines, watermills, and control variables taken from the 1870 census. Thehypothesis is that the presence of Corliss engines fostered further populationgrowth, whereas watermills did not. We turn now to a description of thesalient features of the Corliss engine, and of the data used in the analysis.
THE INNOVATIVE ATTRIBUTES OF THE CORLISS ENGINE
The key novelty of Corliss’s engine was its automatic variable cut-offmechanism, based on an innovative design of valves. What this meant wasthat the speed of the engine was subjected to precise control by the abilityto automatically vary the length of the time period during which steamentered the cylinder. The variation in engine speed was regulated by thegovernor, which retarded or advanced the point of cutoff in accordance withthe rise or fall of the load that was placed upon the engine. This design

14 Rosenberg and Trajtenberg
22 For a detailed description of the Corliss engine see Hunter, History (Vol. 2) chapter 5, and inparticular pp. 256–57.
23 “Increase of speed of spindles is by far the most effectual factor in obtaining this result [reductionin costs]; and hence it is that any increase of speed that can be obtained without other disadvantagesis in the line of economy, regardless of the increased cost of power it may involve.” Sheldon, Power.
feature, which made possible a more efficient exploitation of the expansivepower of steam, resulted in the best-known feature of the engine: a substan-tial improvement in energy efficiency. But perhaps even more important wasthe fact that the engine was also far more “user-friendly” than its predeces-sors. In particular, it was capable of delivering a continuous, uniform flowof rotary power in spite of sudden changes in the load that might be imposedon the engine. The smoothness of power delivery was very important, albeitin quite different ways, to the largest manufacturing industries of the time:textiles and metallurgy. Crucially, it permitted higher speeds, while at thesame time it reduced the frequency of breakage in threads that was so dis-ruptive in the textile industry. The uniformity of power delivery becameincreasingly valuable as the industry moved up the quality ladder to moreexpensive goods. In metallurgy, where huge, abrupt and punishing varia-tions in load were imposed on the engines that were driving the rolling mills,the engine proved capable of adjusting to these variations far better thanother engines of the period.
The automatic variable cutoff capability of the Corliss engine brought ahuge improvement in the efficiency with which the engine exploited theexpansive power of steam. This improvement was achieved by the ingeniousdesign and location of the valves and valve gears, a great advance over theearlier, widely used slide-valve gear that failed to make any use of steam’sexpansive power.22 According to a widespread practice of the time, fuelefficiency was measured in terms of pounds of coal consumed per horse-power per hour. By this criterion, Corliss’s engine was said, in sworn testi-mony of numerous users in the petition, to reduce the cost of fuel by a thirdor more.
But there was much more to the great commercial success and subsequenteconomic impact of the Corliss engine than the reduction in fuel costs. Theability to provide a smooth and responsive delivery of power was, as alreadysuggested, of special importance in cotton textiles, where achievement ofhigher speeds was central to productivity improvement and, moreover,where irregularities in speed were very costly, due to the ease with whichcotton thread was subject to breakage.23 This consideration became veryimportant in allowing American cotton textile firms to move up the qualityladder from low-grade, coarse cotton fabrics to finer grades of cotton yarnsin response to the demands of an increasingly affluent consuming public. Atthe same time, the availability of steam power was a major factor in makingpossible the migration of large cotton textile mills to the South in the 1880sand 1890s. Production costs of coarse goods were lower in the South, and

Corliss Steam Engine 15
24 See Wright, Cheap Labor.25 Corliss, Petition, p.27.26 Corliss, Petition, p.32.27 From “Award of the Rumford Medal” in Corliss, Petition, pp. 46–47.28 Ibid.29 Atack, Fact in Fiction. His table 4 shows the simulated percentage change in total operating costs
per horsepower of each prime mover, in response to a 25-percent change in various cost variables (thebaseline is 1870s data for 100 HP prime movers).
therefore the New England cotton textile industry found itself increasinglyunable to withstand competition from the South in the national markets forthis category of goods, accelerating its move up the quality ladder in the latenineteenth century.24
The petition exults in detailed descriptions of the operation of Corlissengines in cotton textiles, given in sworn testimonies by users of the en-gines, such as “the most perfect regulation of speed,”25 “a more perfectregulation of the speed of the engine, which has given us a larger productionof cloth,”26 “its other crowning excellence, uniformity of velocity,” and “anexacter nicety in its governance, than any of [its] predecessors.”27 A textilemanufacturer in Pittsburgh reported that “. . . with the avoidance of threadbreakage attending the irregular motion of his old engine brought a savingsprobably equal to that from reduced fuel consumption, estimated at $200monthly.”28 The extent to which Corliss came to dominate the market in theNew England cotton textile industry owed a great deal to this specific fea-ture of his engine. The ability to deliver power, not only at a high velocity,but also with a “uniformity of velocity,” was a critical competitive factorthroughout the textiles sector.
We can translate some of the said advantages of the Corliss into costsaving figures by relying on the painstaking work of Jeremy Atack, in par-ticular on his table that contains sensitivity computations of the annualizedcosts of operating steam and waterpower.29 For our purposes we take fromit the following estimates: a rise of 25 percent in fuel costs increases thecosts of steam by 11.4 percent at the mean (10.5 percent at the mode of thedistribution); an increase of 25 percent in horsepower (henceforth HP) de-creases the costs by 4.4 percent at the mean (5.1 percent at the mode). Asjust mentioned, the Corliss engine was about 30 percent more fuel efficientthan other steam engines, and therefore on that account alone the costs ofoperating a Corliss engine were (30/25) x 11.4 = 13.4 percent lower thanexisting alternatives (12.6 percent at the mode). Likewise, Corliss engineswere of significantly larger scale than other engines, with an average of 183HP in our sample. Thus, Corliss engines were on average (83/25) x 4.4 =14.7 percent cheaper to operate (17.1 percent at the mode) relative to a 100HP engine. On these two counts then the Corliss engine was almost 30percent cheaper to operate than other steam engines. Moreover, in the ad-vanced sectors where the Corliss was widely adopted, textiles and primarymetals, the Corliss engines were much larger, averaging 300 HP. Thus, if
16 Rosenberg and Trajtenberg
30 Atack, Fact in Fiction, table 4. This is not clear, but presumably such extrapolation gives a ball-park estimate.
31 See the 1899 Census of Manufacturers, p. 255, ft. 5. 32 Shillitto, Handbook.33 Hunter, History (Vol. 2), pp. 269–70.
one could linearly extrapolate from Atack’s table, the savings of the Corlissversus smaller engines would be of about 40 percent just on account of moreefficient scale, and over 50 percent cheaper taking into account fuel effi-ciency as well.30 These constitute very significant cost savings, even beforefactoring in the other attributes of the Corliss (such as regularity of motion)that also impinged on the costs of production.
After the expiration of the Corliss patents in 1870, “Corliss” became thegeneric name for the vast majority of large stationary steam engines pro-duced, and in fact it emerged as the dominant design for large stationaryengines. Indeed, by the end of the century Corliss-type engines, which ac-counted for just 10 percent of the total number of engines in the manufactur-ing sector, represented a staggering 46 percent of the total horsepower.31 Areference book published at the turn of the century listed and described thewide proliferation of Corliss engines and their entry into numerous special-ized uses.32 The descriptions include a large number of engines that usuallyacquired hyphenated names, combining “Corliss” with the name of laterengine designers whose engines still incorporated the fundamental designinnovations introduced by Corliss: Hamilton-Corliss Engine, Reynolds-Corliss Engine, Harris-Corliss Engine, Gordon’s Improved Corliss ValveGear, Eclipse-Corliss Engine, Columbian-Corliss Engine, etc. Such was thereputation still attached to the Corliss name even in the early years of thetwentieth century, that prominent business advertisements of firms produc-ing heavy equipment continued to invoke the Corliss name (Corliss died in1888, and his own firm ran rapidly downhill thereafter).
Beyond the United States, the Corliss engine was much admired andexperienced extensive sales in Europe, even at an early date. In theannouncement of the award of the Rumford medal by the American Acad-emy of Arts and Sciences to George Corliss, Scott Russell, the distinguishedBritish engineer, was quoted as having stated that “several hundred” ofCorliss’s engines had been sold abroad (probably by 1867). L. C. Hunterstates that Corliss engines were “widely taken up in Europe after its appear-ance and recognition at the Paris Exposition of 1867. Here an internationaljury awarded the highest competitive honor to the Corliss engine over ahundred other entries. At the Vienna Exhibition of 1873, although not repre-sented by an engine, Corliss was given one of the highest awards availableon the grounds (as stated by Robert Thurston) that “a large proportion of thesteam-engines entered having been copied from his designs, he was reallyrepresented in every section of the Exhibition and by the engine-builders ofevery manufacturing nation.”33 If this last accolade is not an exaggeration,

Corliss Steam Engine 17
34 Hunter, History (Vol. 2). One of the main sources is the collection of Corliss Papers at BrownUniversity. Corliss became a very prominent figure in his time, and had a long-time association withBrown University (located in his home town, Providence, Rhode Island). As a consequence, theRichard Hay Library at Brown University put together and maintains a special collection of the CorlissPapers, which includes about 900 original items, ranging from business contracts, to letters, to newspa-per clippings.
35 The petition was published in 1870 as a short booklet, in Providence, Rhode Island (see Corliss,Petition).
36 The list consists of buyers, not of single engines, and we know that many of them owned morethan one engine. According to the figures in Hunter, History (Vol. 2), Corliss engines averaged 100HP each; the list in the petition totals 46,934 HP, and hence we infer that the list comprises about 470engines.
it would suggest that the Corliss engine had by 1873 achieved the status ofa dominant design in large parts of industrial Europe.
DATA SOURCES
Data on the Corliss Engine
Starting from Hunter’s monumental work and the leads that he providesthere, we have mapped a wide array of bibliographical and data sources,both primary and secondary, on the steam engine in general and the Corlissengine in particular.34 As it turned out though, the American patent systemwas to play an especially important role in this project. George Corliss wasa prolific inventor who obtained many patents and, moreover, was involvedin protracted litigation and other legal matters related to these patents, a factthat generated a large number of documents, of which many have survived.Corliss’s main patents on the improvements to the steam engine expired in1863, but he managed to secure a seven-year renewal. In 1869 he petitionedfor yet another renewal, which was turned down by Congress.
One of the happy consequences of Corliss’s unsuccessful request is thatthe formal petition that he submitted to Congress contains detailed informa-tion concerning his extensive business activities up to that date.35 In particu-lar, the petition contains a list of 257 buyers of Corliss engines, including thenames of the firms, their location (city and state) and the horsepower of theirengines. It also contains testimonies of several of these buyers, spelling outthe advantages of the Corliss engine in their mills (some with precise calcu-lations of cost savings), an extensive argumentation of why the extension iswarranted, a detailed account of litigation expenses, etc. The petition is afascinating historical document that provided the initial impetus for thisproject, and the list of buyers in it is what made our quantitative analysispossible.
Although extensive and detailed, the list of 257 buyers in the petition,having a stock of about 470 engines, is not comprehensive: it includes onlythose who were prepared to support Corliss’s petition for patent extension.36
According to Hunter, about 1,200 Corliss engines with 118,500 HP were

18 Rosenberg and Trajtenberg
37 Hunter, History (Vol. 2), p. 282.38 Corliss states in the Petition that his receipts for royalties involved payments from 11 engine
builders, “. . . seven of whom, having manufactories in Rhode Island, Pennsylvania, Massachusetts,Delaware, New York and California, have been at liberty to build as many engines as they pleased, ofany size they pleased, to be located wherever they pleased, and to get any price for the same they could. . .” (Corliss, Petition, p. 21).
39 For infringement of Corliss’s patent rights, see Hunter, History (Vol. 2). Nationwide, Corliss-typeengines accounted then for 15 percent of total steam power: according to the 1880 census, there were40,191 steam engines in the United States by 1870, with a total capacity of 1.2 million HP. However,Corliss engines were much more powerful than the run-of-the-mill engines, averaging 100 HP asopposed to a mean HP of 30 for all steam engines.
sold up to 1869, of which 25,000 HP were sold by licensees.37 In fact, thereis some detailed information in the petition about licensees, but we could notincorporate it in the econometric analysis, because we do not know whowere the buyers of the engines sold by these licensees.38 In addition, Corliss-type engines representing some 60,000 HP were produced and marketed byother manufacturers infringing Corliss’s patent rights, bringing the total HPof Corliss-type engines to 180,000.39 Thus, in terms of HP, the listing in thepetition (our “sample”) totaling 46,934 HP, constitutes 50 percent of theengines built by Corliss himself up to 1869, 40 percent of the engines builtby Corliss and the official licensees, and 26 percent of the total stock ofCorliss engines including those sold by infringers.
The coverage of the petition list is thus quite wide, but the question iswhether we can presume it to be a representative sample of the populationof Corliss-type engines built by 1870. There are two issues regarding what“representative” means: first, do the buyers who signed the petition consti-tute a random sample of those who purchased engines from Corliss himself?Secondly, is the petition’s list representative of all Corliss-type engines sold,including licensees and infringers? As already mentioned, the analysis thatwe perform here relies primarily on the location of Corliss engines and ofwater-powered sites. Thus, the issue of whether the sample of Corliss en-gines is “representative” or not is taken to mean whether or not the samplemay suffer from noticeable biases with respect to location.
Regarding the first question, we know that the buyers of Corliss engineswere engaged in a long-term relationship with Corliss, in that the latter pro-vided maintenance, parts, upgrades, and perhaps also future additional en-gines. By signing the petition these buyers presumably improved the chancesof getting better “service” from Corliss in the future. Thus, we expect thatbuyers having a larger number of engines, those more likely to acquire furtherengines in the future, or those for whom “uptime” was more important, wouldhave been more prone to sign. However, and as far as we have been able toascertain, these attributes were not correlated with location. The workingassumption is thus that the willingness of buyers of Corliss engines to join insigning the petition (and hence the probability of appearing in our sample) hadlittle to do with their specific county location. The one possible exception isProvidence, Rhode Island, Corliss’s hometown, and the city with the largest

Corliss Steam Engine 19
40 U.S. Bureau of the Census, Statistics.41 To be precise, these include: Maine, Vermont, New Hampshire, Massachusetts, Rhode Island,
Connecticut, New York, New Jersey, Pennsylvania, Delaware, and Maryland. 42 The data entry and editing process were lengthy and arduous, both because the data had to be
transcribed from a small-print, low-quality copy, and because the way the information is displayed inthe original listing is by no means uniform.
43 We relied for that purpose on “net H.P.” and “utilized H.P.” In some 20 entries (for Merrimack,Massachusetts and New Hampshire), the figure reported is “Gross H.P.,” which we converted to “netH.P.” using the conversion ratio of 0.73 as suggested on page 37 of the section “Waterpower in EasternNew England,” U.S. Bureau of the Census, Statistics.
44 There were over 400 different textual forms for “type of manufacturer” (e.g., from “bleachery”and “bleaching and dyeing,” to “wheelbarrows” and “wheelwrighting”), which we consolidated intothe then-standard 21 industrial sectors.
number of listed buyers in the petition: the close proximity to Corliss mayhave induced a larger number of them to sign, and hence we shall regard thisobservation as a potential influential outlier.
Engines built by Corliss himself accounted as said for just about 26 percentof all Corliss-type engines deployed by 1870, and hence the second questionis to what extent our list of buyers is representative (once again, in the geo-graphic sense) not just of those who purchased engines from Corliss, but ofall Corliss-type engines built, including licensees and infringers. We discussthis issue extensively in Appendix 2, which contains a description of thegeographic spread of Corliss engines and of watermills. We conclude that thedata may indeed suffer from some specific selectivity biases, but either we cantake care of it point wise (as in the case of Providence), or the biases are likelyto work against our hypothesis (as in the case of eastern Pennsylvania), andhence would not impair the validity of the econometric analysis.
Data on Water Power
In order to be able to contrast the spread and impact of the Corliss steamengine to waterpower, we needed data on water wheels at a level of “resolu-tion” similar to that of the Corliss data. We found that in the Census’ “Re-ports on Water-Power” for 1880, containing a comprehensive listing of sitesin the United States that operated water wheels, with highly detailed data foreach: river or stream, location (county), kind of manufacturer, number ofmills, and HP.40 Except for a handful, all Corliss engines listed in the peti-tion were sold in the North and Mid-Atlantic states, and hence we took fromthe census’s water-power report data on the sites located in those states.41
The data on these 4,716 sites were entered into spreadsheets, followed byextensive editing, filtering, and consolidation.42 The next stage consisted ofaggregating the data by county, which essentially meant summing up thenumber of mills per county and the HP of those mills.43 We also consoli-dated the textual forms describing the type of manufacturer, and matched theunified fields so created to the industrial classification used in the Censusesof Manufacturers of the late 1800s.44

20 Rosenberg and Trajtenberg
45 The census data were taken from the internet site of the Inter-university Consortium for Politicaland Social Research (ICPSR), in Ann Arbor, Michigan, as viewed for browsing at the site of theUniversity of Virginia Library. See http://www.icpsr.umich.edu/index.html, and http://fisher.lib.virginia.edu/census/.
46 For details of the census data used see Rosenberg and Trajtenberg, “General Purpose Technology,”appendix 4.
We have also compiled data on the population of each of the 87 towns and cities where Corlissengines were located, from 1860 through 1910, and used them for descriptive purposes, and for apreliminary analysis confined to these locations (not reported here); however, we could not use thesedata for the full-scale analysis because we did not have data for waterpower by localities, only bycounties.
47 The data on buyers of Corliss steam engines are actually from 1869, but we refer to them as 1870,so as to make them fit the decennial pattern of the other data.
Census Data
We complemented the data on steam engines and waterpower with demo-graphic data and data on manufacturing by county, from the censuses of1850–1870, as well as population counts by county for 1880–1900.45 Asidefrom population counts, these data comprise variables on human capital,wealth, taxes, and manufacturing that we deem relevant for the location ofpower sources (steam and water).46
Summing up, our data comprise: the stock of (a large sample of) buyersof Corliss steam engines as of 1870, and in particular the geographical loca-tion of these buyers and the installed HP, as well as their industrial composi-tion; the location of all water-powered sites and their HP as of 1880, andtheir sectoral composition; demographic, human capital and wealth indica-tors and manufacturing data for 1850, 1860, and 1870, and populationcounts for every decade 1850–1900 (all these variables are by county, forthe 11 North and Mid-Atlantic states); and population data for the towns andcities with Corliss engines.47
THE ECONOMETRIC ANALYSIS: LOCATION AND SUBSEQUENT GROWTH
The Location of Corliss Engines and of Watermills
We now turn to the analysis of what determined the location of Corlissengines on the one hand, and of watermills on the other, in order to assessthe stringency of the locational constraint imposed by the geographic re-quirements of waterpower. The leading hypothesis is that, freed of suchconstraints, the Corliss engine gravitated towards locations that already hadclear advantages for industry, particularly for advanced, large-scale manu-facturing, in terms of availability of inputs and skills, proximity to markets,and so on. On the other hand, if indeed those constraints were binding,water-powered mills could not. We regard population size as the leadingindicator for the existence of locational characteristics propitious for thedevelopment of advanced, large-scale industry: larger urban centers presum-ably offered a wider range of inputs and skills, constituted in and of them-

Corliss Steam Engine 21
48 Obviously, we were constrained in the choice of regressors by the set of variables available fromthe 1850 census (see Rosenberg and Trajtenberg, “General Purpose Technology,” appendix 4).
49 As already mentioned, the data for watermills come from the 1880 census (there are no detaileddata for 1870), whereas that for Corliss engines come from the 1869 petition, and hence the two setsof equations are not exactly aligned time wise. We proceed on the assumption that in the interveningdecade (1870–1880) the distribution of watermills across counties within the North and Mid-Atlanticstates change little. We know (from Fenichel, Growth) that the total HP of watermills in New Englandgrew just by 17 percent during that decade (from 362 thousand in 1870 to 423 in 1880), and in theMiddle Atlantic states it declined slightly (from 376 to 357); this in contrast with the rapid growth ofsteam, which more than doubled in those regions.
50 The other consistent finding is the very large negative coefficient for Maine in the Corliss equa-tions, for which we do not have a convincing rationale.
selves larger markets and had better access to wider markets due to theavailability of transportation facilities. Beyond population, we also use asregressors other indicators that may capture the availability of inputs andskills: capital invested in manufacturing, employment in manufacturing, thenumber of books in public libraries, and the number of public libraries, allof these in per capita terms.48
We ran two sets of regressions: one having as the dependent variable thenumber of Corliss buyers by county as of 1870, the other the number ofwatermills, each as a function of population, capital or employment in man-ufacturing per capita, books in public libraries per capita (all of these fromthe 1850 census), and state dummies.49 The distribution of Corliss buyersacross counties is very skewed, with a large mass at zero (82.6 percent of the242 counties had none), and only 7 counties having at least ten establish-ments with Corliss engines. The distribution of watermills is also skewed,with 25 percent of the counties having none. Both constitute typical countdata, and hence OLS is not appropriate; thus, we use the Poisson and theNegative Binomial models to estimate both set of equations.
Table 1 shows the results for the various specifications (for completenesswe also report the OLS). The key finding, highly significant and robustacross all specifications, is that population strongly impacts the location ofthe Corliss, but not at all the geographic distribution of waterpower. That is,counties with larger populations attracted Corliss-driven plants, whereaspopulation size had no impact whatsoever on the location of watermills.Similarly, counties that had by 1850 relatively more capital or more employ-ment in manufacturing (per capita) also drew larger numbers of Corlissengines, as did counties with more books or more libraries. These effects areeither not significant for watermills, or much smaller than for the Corliss.The contrast between Corliss engines and watermills in terms of the signifi-cance of these variables is sharper for the Negative Binomial than for thePoisson, quite likely because the latter suffers from overdispersion.
For the sake of brevity we have suppressed in Table 1 the estimates forthe state dummies; there is however one that is of interest, and that is thecoefficient for Rhode Island, the hometown of Corliss.50 Although positive,this coefficient is barely significant in most specifications for the Corliss

22 Rosenberg and Trajtenberg
51 It is large and significant for the Corliss engine only in the OLS equations, but these are the leastplausible specifications; the base state is New York.
equation; on the other hand, in quite a few of the watermills equations theRhode Island dummy comes out negative, large, and significant.51 Thus, thefact that Rhode Island attracted a relatively large number of Corliss enginesand few watermills had to do more with that state apparently not beingsuitable for waterpower rather than to the fact that George Corliss was build-ing engines there.
For the Corliss equation the right-hand variables from the 1850 census areclearly exogenous: Corliss began to build his steam engines in the late1840s, and most of them were sold in the 1860s. For watermills that is notquite the case: presumably a large proportion of the watermills (unfortu-
TABLE 1“ADOPTION” OF CORLISS ENGINES AND WATERMILLS, BY COUNTY
A: Negative Binomial Count: QML
Corliss Water Corliss Water Corliss Water
Constant –4.4(–7.8)
3.7(13.2)
–4.2(–7.4)
3.8(13.4)
–3.4(–6.9)
3.9(17.4)
Population 0.09(4.8)
0.05(0.9)
0.07(3.0)
0.06(1.0)
0.10(3.5)
0.05(0.9)
Capital invested in manu-facturing per capita
0.04(4.3)
0.005(1.5)
0.04(5.2)
0.006(1.5)
Employment in manufacturingper capita
22.8(4.2)
0.86(0.4)
Books in public libraries percapita
1.82(2.7)
0.31(0.8)
1.77(2.6)
0.31(0.84)
Number of public libraries percapita
0.37(2.5)
0.11(2.0)
LR index (Pseudo R 2) 0.52 0.02 0.51 0.02 0.52 0.02
B: Poisson Count (QML) and OLS
Poisson OLS
Corliss Water Corliss Water
Constant –3.2(–6.8)
3.9(20.)
–4.9(–6.1)
38.3(2.4)
Population 0.075(3.1)
0.01(0.78)
0.41(8.9)
0.90(1.0)
Capital invested in manu-facturing per capita
0.03(2.0)
0.004(1.8)
0.03(2.7)
0.39(1.9)
Books in public libraries percapita
1.6(2.2)
0.38(1.45)
4.1(3.8)
3.1(1.4)
LR index (Pseudo R 2) 0.65 0.18R 2 0.51 0.23Notes: Panel A: z-statistics are in parentheses, based on QML (Huber/White) standard errors. Panel B:for the Poisson: z-statistics are in parentheses, based on QML (Huber/White) standard errors; for theOLS: regular t-statistics are in parentheses. All regressions include state dummy variables. The datafor Corliss are as of 1869, for watermills as of 1880; each comprises 225 counties or observations.

Corliss Steam Engine 23
52 The only qualification is that the inclusion of the 1870 population size as a regressor (to test forconvergence) weakens the significance of the Corliss coefficient, but that is hardly surprising, giventhe high collinearity between the two.
nately unknown to us) in operation at the time of the 1880 survey werealready in place by 1850. Thus, the waterpower equations may suffer fromsimultaneity bias, in that counties that for reasons unaccounted for in themodel had attracted more watermills may have also drawn in a larger popu-lation, and perhaps also more physical and human capital. However, noticethat endogeneity would in this case bias the estimates upwards, blunting thedifference of the effect of the regressors on the Corliss versus watermills,that is, simultaneity biases would militate against our hypothesis. Thus, thereal differences may be even more pronounced than what our results indi-cate, and hence the presence of endogeneity in the watermills equations canonly strengthen the conclusions.
Population Growth from 1870 Onwards
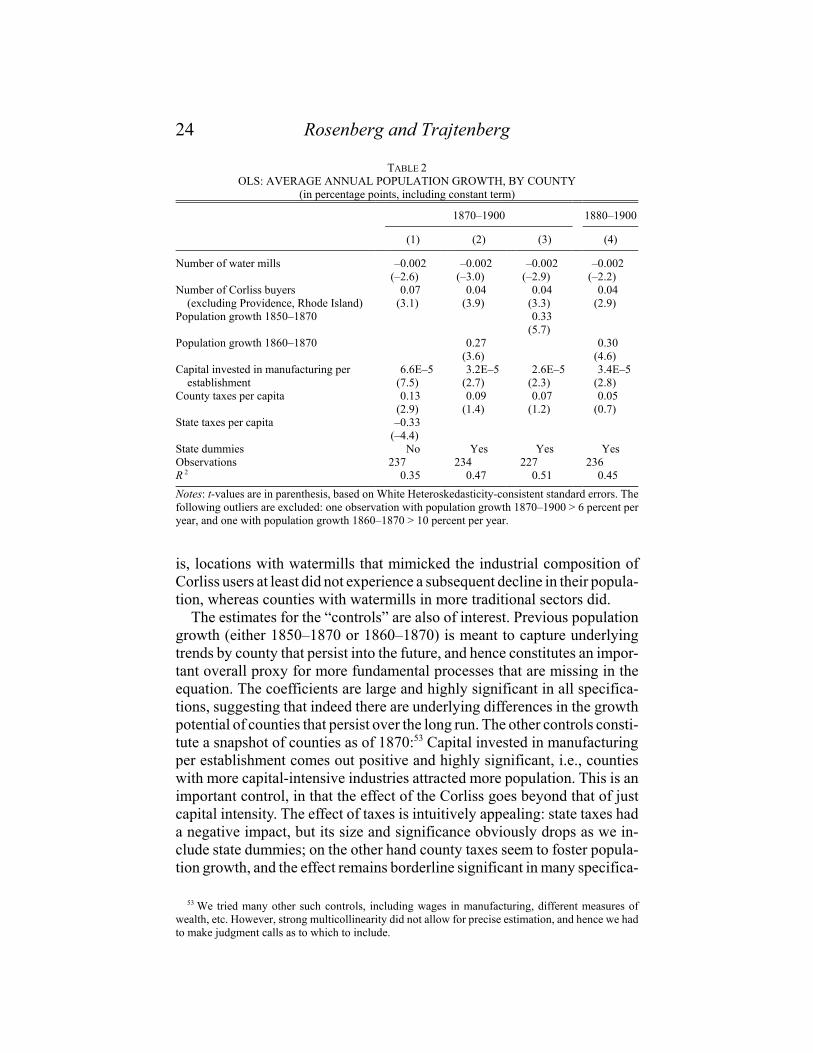
The second part of the interplay between power modes and populationlooks forward in time, the question being: to what extent did the presenceof Corliss engines on the one hand, and of watermills on the other, fosterpopulation growth across different locations? At first we estimate for thatpurpose simple OLS equations with the rate of post-1870 population growthby county as the dependent variable, the number of Corliss buyers and ofwatermills as regressors, as well as a series of control variables from the1870 census, and state dummies. The results are shown in Table 2. Thepopulation of counties with relatively many Corliss-driven establishmentsas of 1870 grew indeed faster in the following two to three decades, whereascounties with relatively many watermills grew at a slower pace. This keyfinding is both significant and very robust.52 The size of these effects is notvery large, and yet it makes a difference over the long haul: the populationof counties with one standard deviation more watermills than the average(133 versus 66) grew at an annual rate of 0.13 percent slower than the aver-age county. At the upper tail the effect is substantial: counties with tenCorliss-driven establishments (only seven counties had ten or more Corlissengines) grew at an annual rate 0.4 percent higher than counties with none.
The industrial composition of watermills versus that of Corliss users mayhave had something to do with the differential impact on population growth:if we split the number of watermills per county into two groups, one con-sisting of the top four sectors where the Corliss was deployed (textiles,primary metals, nonmanufacturing, and machinery, which accounted for 81percent of the HP of Corliss engines), and another group with all the rest, theresults are as follows: for watermills in those four sectors the coefficient isinsignificant, whereas for the others it remains negative, significant, and ofsimilar size as in the original regressions with all watermills in there. That
24 Rosenberg and Trajtenberg
53 We tried many other such controls, including wages in manufacturing, different measures ofwealth, etc. However, strong multicollinearity did not allow for precise estimation, and hence we hadto make judgment calls as to which to include.
TABLE 2OLS: AVERAGE ANNUAL POPULATION GROWTH, BY COUNTY
(in percentage points, including constant term)
1870–1900 1880–1900
(1) (2) (3) (4)
Number of water mills –0.002(–2.6)
–0.002(–3.0)
–0.002(–2.9)
–0.002(–2.2)
Number of Corliss buyers(excluding Providence, Rhode Island)
0.07(3.1)
0.04(3.9)
0.04(3.3)
0.04(2.9)
Population growth 1850–1870 0.33(5.7)
Population growth 1860–1870 0.27(3.6)
0.30(4.6)
Capital invested in manufacturing perestablishment
6.6E–5(7.5)
3.2E–5(2.7)
2.6E–5(2.3)
3.4E–5(2.8)
County taxes per capita 0.13(2.9)
0.09(1.4)
0.07(1.2)
0.05(0.7)
State taxes per capita –0.33(–4.4)
State dummies No Yes Yes YesObservations 237 234 227 236R 2 0.35 0.47 0.51 0.45Notes: t-values are in parenthesis, based on White Heteroskedasticity-consistent standard errors. Thefollowing outliers are excluded: one observation with population growth 1870–1900 > 6 percent peryear, and one with population growth 1860–1870 > 10 percent per year.
is, locations with watermills that mimicked the industrial composition ofCorliss users at least did not experience a subsequent decline in their popula-tion, whereas counties with watermills in more traditional sectors did.
The estimates for the “controls” are also of interest. Previous populationgrowth (either 1850–1870 or 1860–1870) is meant to capture underlyingtrends by county that persist into the future, and hence constitutes an impor-tant overall proxy for more fundamental processes that are missing in theequation. The coefficients are large and highly significant in all specifica-tions, suggesting that indeed there are underlying differences in the growthpotential of counties that persist over the long run. The other controls consti-tute a snapshot of counties as of 1870:53 Capital invested in manufacturingper establishment comes out positive and highly significant, i.e., countieswith more capital-intensive industries attracted more population. This is animportant control, in that the effect of the Corliss goes beyond that of justcapital intensity. The effect of taxes is intuitively appealing: state taxes hada negative impact, but its size and significance obviously drops as we in-clude state dummies; on the other hand county taxes seem to foster popula-tion growth, and the effect remains borderline significant in many specifica-

Corliss Steam Engine 25
54 State taxes do vary across counties within states (because these are computed as per capita taxrevenues), but nevertheless the variation within states is too small to allow for precise estimation, andhence we excluded this variable in all specifications where state dummies appear.
55 In particular, the t-values are lower when using as control 1850–1870 (rather than 1860–1870)population growth; it is not clear why that it so.
tions.54 We interpret county taxes as indicative of the provision of localpublic goods and hence having the potential to attract population, whereashigher state taxes represent, from the point of view of individual counties,just a higher burden that does not necessarily translate into more or betterpublic goods. Last but not least, the R2s are reassuringly large, implying thatthe effects captured in the model are first order in accounting for differentialpopulation growth over the long run.
There remains though the concern that the number of Corliss buyers percounty may still suffer from endogeneity, in that some underlying long-termphenomena not properly accounted for by the controls (not even by pre-1870 population growth) brought about both more adopters of Corliss steamengines prior to 1870, and faster population growth afterwards. We thusresort to instrumental variable estimation, using as instrument for the num-ber of Corliss the predicted values from the “adoption” equations (seeTable 1), i.e., from the count regressions of number of Corliss buyers percounty on county variables as of 1850. The time gap between these 1850level variables and population growth post-1870 makes it more likely thatthe predicted values thus computed would be truly exogenous, and henceconstitute a legitimate instrument. Table 3 presents the results, for differentspecifications (i.e., taking the predicted values from the negative binomial,the Poisson, and the LS equations, and using in some population growth for1860–1870 and in others that for 1850–1870). Reassuringly, the coefficientof Corliss buyers remains basically unchanged (vis-à-vis the OLS results inTable 2), but its significance declines.55 Thus, even though we obtain a lessprecise estimate, it is quite clear that the effect is there and the result isrobust: counties that adopted a larger number of Corliss engines exhibitedfaster growth in the following decades.
These results support then the hypothesized role of the Corliss in thedynamic interaction between industrialization and urbanization. Freed of thelocational constraints of waterpower, manufacturing enterprises driven bysteam engines could choose to locate “optimally,” and hence were attractedto areas where, inter alia, they could take advantage of agglomeration econ-omies. The presence of Corliss-driven manufacturers both contributed tothese agglomeration effects, and probably also signaled that more was com-ing: Corliss engines were after all “trend setters” for industry, both in thatthey were deployed in advanced sectors, and in that they were typically ofa larger scale. In time, locations with relatively many Corliss-driven estab-lishments attracted further manufacturers and hence also fostered populationgrowth. By contrast, watermills were no part of such positive loop: they

26 Rosenberg and Trajtenberg
56 We have not made use so far of these data because the coverage, as indicated, is not comprehen-sive, and we do not know what determined the reporting for some but not for other locations.
TABLE 3TSLS – AVERAGE ANNUAL POPULATION GROWTH, BY COUNTY, USING PREDICTED
CORLISS AS INSTRUMENTAL VARIABLE(in percentage points; including constant term and state dummies)
IV (predicted Corliss) from Adoption Equations
NegativeBinomial Poisson LS
NegativeBinomial Poisson
Number of water mills –0.002(–2.9)
–0.002(–2.9)
–0.002(–2.9)
–0.002(–2.8)
–0.002(–2.8)
Number of Corliss buyers(excluding Providence, RhodeIsland)
0.05(1.9)
0.04(2.2)
0.06(2.2)
0.05(1.7)
0.034(1.8)
Population growth 1850–1870 0.35(5.7)
0.35(5.7)
Population growth 1860–1870 0.30(3.7)
0.30(3.7)
0.30(3.7)
Capital invested in manufacturingper establishment
2.7E–05(2.1)
3.0E–05(2.4)
2.6E–05(2.1)
2.5E–05(2.2)
2.7E–05(2.4)
County taxes per capita 0.10(1.6)
0.11(1.7)
0.10(1.4)
0.08(1.2)
0.08(1.3)
Observations 223 223 223 223 223R 2 0.48 0.48 0.48 0.52 0.52Notes: t-values are in parenthesis, based on White Heteroskedasticity-consistent standard errors. Thefollowing outliers are excluded: one observation with population growth 1870–1900 > 6 percent peryear, and one with population growth 1860–1870 > 10 percent per year.
located in sparsely populated areas to begin with, and failed to attract furthereconomic activity and hence further population to those areas. In fact, the popu-lation in locations that had relatively many watermills actually declined (recallthe negative sign of the coefficients for watermills in Tables 2 and 3), gravitat-ing instead towards the urban centers where steam took hold. To insist, thislatter result is far from obvious: it was not a priori clear that the topographicalrequisites (and hence geographical constraints) of waterpower would also im-pair the clustering of industry and hence of urban centers in those sites.
It is interesting to note that many watermills had “auxiliary steam power,”which was used both to add to capacity and to run the mills at times whenwaterpower was unavailable due to weather conditions. The 1880 censushad data on auxiliary steam power just for 62 out of the 244 counties of theNorth and Mid-Atlantic States; still, the total steam power reported thereamounted to 64,965 HP, significantly more than the 46,339 HP of theCorliss engines listed in the petition.56 Auxiliary steam power in the NewEngland states alone amounted to 43,086 HP, which constituted 28 percentof the total steam power in the region, versus 27,797 HP of Corliss engines.Thus, waterpower did attract steam power, in what could have been thebeginning of a positive loop (involving the further growth of population in

Corliss Steam Engine 27
57 The use of IVs hopefully mitigates the implied endogeneity, but we cannot be sure to what extentthat is so.
58 We would have liked to include “other steam engines” as an additional regressor, but unfortunatelywe could not obtain county-level data for steam. It could be done by state, but then the number ofobservations is very small, and the level of resolution of the data seems to be too coarse for the purposeat hand.
those locations). However, this auxiliary steam power was just that, “auxil-iary,” and did not offset the decisive advantage that steam held by compari-son with water, namely the freedom to locate optimally.
Even though we have mentioned in passing various qualifications, wewould like to emphasize that the results presented here should be interpretedwith great caution, primarily because the Corliss variable in the growthregressions probably proxies for wider phenomena than just the number ofCorliss users.57 First, not only the Corliss engine but all steam engines didaway with the locational constraint imposed by waterpower. Thus, and in sofar as there might have been a positive correlation between the locationaldistribution of Corliss engines and that of other steam engines, the estimatedcoefficient on the Corliss may be capturing “steam” and not only“Corliss.”58 Second, the estimated effects of both the Corliss and of water-mills probably confound the impact of type of prime mover with the indus-trial composition of their users. As shown below, more Corliss users in anarea meant more textiles and metallurgy establishments, which presumablyattracted further growth by virtue of being advanced, dynamic sectors. Bycontrast, more watermills signaled the prevalence of backward sectors, suchas food and lumber, which were gradually receding. Third, we lack theappropriate empirical framework for estimating agglomeration effects,which is an important aspect of the story. Hopefully these qualifications willinspire further research along these lines.
FURTHER GPT-LIKE ATTRIBUTES AND PATHWAYS
We have shown then one key pathway by which the Corliss engine mayhave played its dynamic role as a particular embodiment of the steam-engine-GPT. A second pathway was the fact that the Corliss engine allowedfor larger scale in manufacturing, thus contributing to the realization of scaleeconomies and the concomitant efficiency gains that impinge on growth.Furthermore, Corliss engines were pivotal for rolling mills, which in turn fedinto the rapid expansion of railroads. We begin, though, by showing that theCorliss engine had a wide range of applications, so that the dynamic interac-tion between it and the user sectors could indeed have economy-wide reper-cussions. Moreover, the data indicate that the main adopters of the Corlissengine were the advanced sectors of the time (textiles and metallurgy), insharp contrast to the “low-tech” character of the main users of waterpowerand of other steam engines.
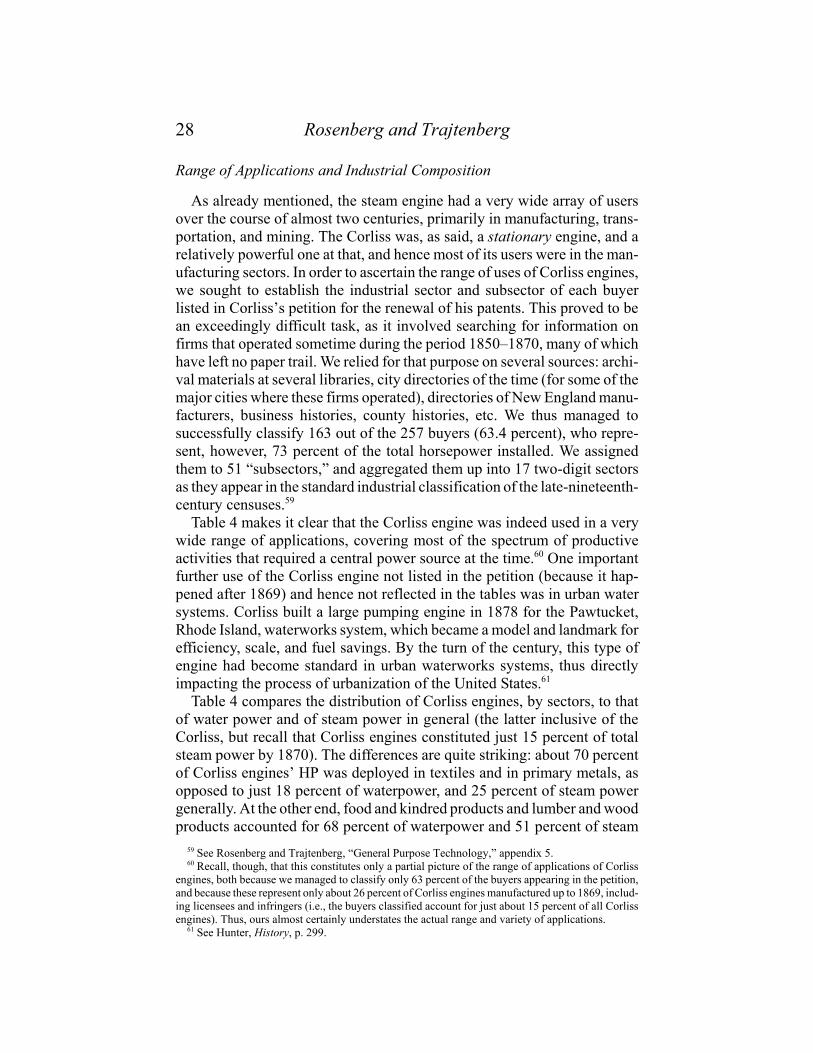
28 Rosenberg and Trajtenberg
59 See Rosenberg and Trajtenberg, “General Purpose Technology,” appendix 5.60 Recall, though, that this constitutes only a partial picture of the range of applications of Corliss
engines, both because we managed to classify only 63 percent of the buyers appearing in the petition,and because these represent only about 26 percent of Corliss engines manufactured up to 1869, includ-ing licensees and infringers (i.e., the buyers classified account for just about 15 percent of all Corlissengines). Thus, ours almost certainly understates the actual range and variety of applications.
61 See Hunter, History, p. 299.
Range of Applications and Industrial Composition
As already mentioned, the steam engine had a very wide array of usersover the course of almost two centuries, primarily in manufacturing, trans-portation, and mining. The Corliss was, as said, a stationary engine, and arelatively powerful one at that, and hence most of its users were in the man-ufacturing sectors. In order to ascertain the range of uses of Corliss engines,we sought to establish the industrial sector and subsector of each buyerlisted in Corliss’s petition for the renewal of his patents. This proved to bean exceedingly difficult task, as it involved searching for information onfirms that operated sometime during the period 1850–1870, many of whichhave left no paper trail. We relied for that purpose on several sources: archi-val materials at several libraries, city directories of the time (for some of themajor cities where these firms operated), directories of New England manu-facturers, business histories, county histories, etc. We thus managed tosuccessfully classify 163 out of the 257 buyers (63.4 percent), who repre-sent, however, 73 percent of the total horsepower installed. We assignedthem to 51 “subsectors,” and aggregated them up into 17 two-digit sectorsas they appear in the standard industrial classification of the late-nineteenth-century censuses.59
Table 4 makes it clear that the Corliss engine was indeed used in a verywide range of applications, covering most of the spectrum of productiveactivities that required a central power source at the time.60 One importantfurther use of the Corliss engine not listed in the petition (because it hap-pened after 1869) and hence not reflected in the tables was in urban watersystems. Corliss built a large pumping engine in 1878 for the Pawtucket,Rhode Island, waterworks system, which became a model and landmark forefficiency, scale, and fuel savings. By the turn of the century, this type ofengine had become standard in urban waterworks systems, thus directlyimpacting the process of urbanization of the United States.61
Table 4 compares the distribution of Corliss engines, by sectors, to thatof water power and of steam power in general (the latter inclusive of theCorliss, but recall that Corliss engines constituted just 15 percent of totalsteam power by 1870). The differences are quite striking: about 70 percentof Corliss engines’ HP was deployed in textiles and in primary metals, asopposed to just 18 percent of waterpower, and 25 percent of steam powergenerally. At the other end, food and kindred products and lumber and woodproducts accounted for 68 percent of waterpower and 51 percent of steam
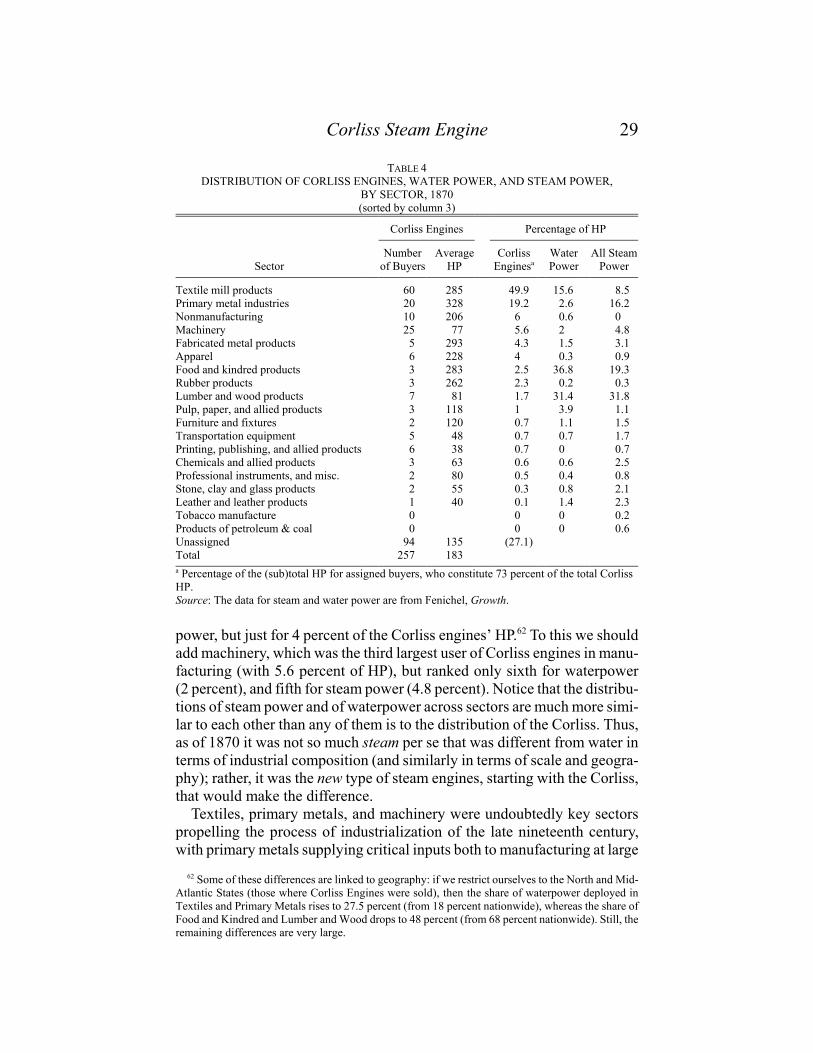
Corliss Steam Engine 29
62 Some of these differences are linked to geography: if we restrict ourselves to the North and Mid-Atlantic States (those where Corliss Engines were sold), then the share of waterpower deployed inTextiles and Primary Metals rises to 27.5 percent (from 18 percent nationwide), whereas the share ofFood and Kindred and Lumber and Wood drops to 48 percent (from 68 percent nationwide). Still, theremaining differences are very large.
power, but just for 4 percent of the Corliss engines’ HP.62 To this we shouldadd machinery, which was the third largest user of Corliss engines in manu-facturing (with 5.6 percent of HP), but ranked only sixth for waterpower(2 percent), and fifth for steam power (4.8 percent). Notice that the distribu-tions of steam power and of waterpower across sectors are much more simi-lar to each other than any of them is to the distribution of the Corliss. Thus,as of 1870 it was not so much steam per se that was different from water interms of industrial composition (and similarly in terms of scale and geogra-phy); rather, it was the new type of steam engines, starting with the Corliss,that would make the difference.
Textiles, primary metals, and machinery were undoubtedly key sectorspropelling the process of industrialization of the late nineteenth century,with primary metals supplying critical inputs both to manufacturing at large
TABLE 4DISTRIBUTION OF CORLISS ENGINES, WATER POWER, AND STEAM POWER,
BY SECTOR, 1870(sorted by column 3)
Sector
Corliss Engines Percentage of HP
Numberof Buyers
AverageHP
CorlissEnginesa
WaterPower
All SteamPower
Textile mill products 60 285 49.9 15.6 8.5Primary metal industries 20 328 19.2 2.6 16.2Nonmanufacturing 10 206 6 0.6 0Machinery 25 77 5.6 2 4.8Fabricated metal products 5 293 4.3 1.5 3.1Apparel 6 228 4 0.3 0.9Food and kindred products 3 283 2.5 36.8 19.3Rubber products 3 262 2.3 0.2 0.3Lumber and wood products 7 81 1.7 31.4 31.8Pulp, paper, and allied products 3 118 1 3.9 1.1Furniture and fixtures 2 120 0.7 1.1 1.5Transportation equipment 5 48 0.7 0.7 1.7Printing, publishing, and allied products 6 38 0.7 0 0.7Chemicals and allied products 3 63 0.6 0.6 2.5Professional instruments, and misc. 2 80 0.5 0.4 0.8Stone, clay and glass products 2 55 0.3 0.8 2.1Leather and leather products 1 40 0.1 1.4 2.3Tobacco manufacture 0 0 0 0.2Products of petroleum & coal 0 0 0 0.6Unassigned 94 135 (27.1)Total 257 183a Percentage of the (sub)total HP for assigned buyers, who constitute 73 percent of the total CorlissHP.Source: The data for steam and water power are from Fenichel, Growth.

30 Rosenberg and Trajtenberg
63 Some of the mills operating water wheels had also auxiliary steam power and hence their averageHP may be slightly understated, and likewise, some of the buyers of Corliss engines had also othertypes of engines in the same establishment.
and to the rapidly expanding railroad system. By contrast, food and kindredproducts and lumber and wood were two of the more traditional, technologi-cally laggard industries, and consisted mostly of innumerable small millsthat served primarily local needs. The Corliss was thus squarely positionedat the forefront of the incipient process of industrialization as of 1870, andin fact it anticipated later shifts in the locus of power deployment (seeTable 5). Thus, whereas textile products and primary metals accounted forjust 25 percent of total steam power in 1870, their share grew to 34 percentby the turn of the century, and conversely, the share of the “traditional”sectors declined steeply from over a half to about one-third.
Enabling Scale and Rolling On . . .
As already mentioned, Corliss engines were much more powerful than thevast majority of steam engines at the time, and similarly in comparison towater wheels. In fact, the average HP of users of Corliss engines was overfour times larger on average than that of establishments relying on water-power. Only in one sector, pulp and paper, were water-powered millsslightly larger than their counterpart Corliss users (see Table 4).63 Noticealso that the average HP of Corliss users displays a large variance acrosssectors (at the extreme, the scale in primary metals is almost nine times aslarge as in printing). However, there were very few Corliss users in thesmall-scale sectors (except for machinery): each of the sectors with an aver-age scale of less than 120 HP accounts for no more than 1.7 percent of thetotal HP of Corliss engines, and then there is a big jump between the top ofthese small sectors (furniture, with an average HP of 120), and the next one,apparel with 228. In other words, 88 percent of the total HP of Corliss en-gines were deployed in sectors that averaged anywhere between 200 and300 HP per establishment, which presumably meant at least 100 HP perengine, some five times larger than the typical watermill or non-Corlisssteam engine.
TABLE 5CORLISS ENGINE USAGE: SECTORAL COMPARISON
Sectors Percentage of
Corliss HP, 1870
Percentage of Steam Power
1870 1890 1900 1910
Textile Products and Primary Metals 69.1 24.7 30.2 34.1 34.0Food & Kindred and Lumber & Wood 4.1 51.1 36.9 35.3 32.6Source: Corliss’s Petition; and Fenichel, “Growth.”

Corliss Steam Engine 31
64 On metallurgy, see the discussion below on rolling mills; on textiles, we obtained information onthe number of employees of 12 textile firms (out of the 60 that purchased Corliss engines): ten of themhad 1,000 employees or more, one had 630, and one had between 250 and 500 employees.
65 See Chandler, Visible Hand.
The large scale of establishments using Corliss engines in metallurgy andin textiles is consistent with other supporting evidence.64 Furthermore, itrelates to one of the hypothesized mechanisms by which innovationcomplementarities played out in the case of the Corliss engine, further en-hancing the GPT nature of steam engines. We conjecture that the introduc-tion of the Corliss engine was an important factor enabling the setting up oflarge-scale factories, and hence the realization of scale economies in produc-tion and the advent of mass production, one of the distinctive features ofindustrialization in the closing decades of the nineteenth century.65
The fact that the Corliss may have played such an enabling role does notimply that waterpower suffered from inherent technological or topographicallimitations that prevented it from running large-scale plants. True, water-mills were on average of a much more modest scale than plants running onCorliss engines, and moreover, there were very few of truly large size: outof almost 16,000 mills that ran on water in 1880, only 90 deployed morethan 500 HP on average (just over one-half of 1 percent), and an additional859 mills had between 100 and 500 HP. Still, the fact that we do find somewatermills even with 1,000 HP and more clearly means that there were novisible absolute constraints on scale for this power source. Moreover, whatwe see in the data is an equilibrium distribution of scale, both between waterand steam, and within waterpower—obviously we do not know what wouldhave been the scale of watermills had steam not taken its predominant placein the upper tail of HP.
As with many other instances whereby two technologies compete, we donot need to resort to the (clearly untenable) argument that waterpower hadinherent scale limitations in order to assert the enabling role of Corliss en-gines: it is the conjunction of purely technological advantages and of othercomplementary economic factors that makes one technology play that roleand not the other. We conjecture that freedom of location was, once again,the critical supporting factor: large-scale production required not just thetechnical ability to operate large plants, but also easy access to markets, bothfor inputs and for outputs. There were sites that could deliver large amountsof waterpower, but the fact is that too few were located near transportationhubs and population centers. Large-scale production may have been techno-logically and topographically feasible with waterpower, but not economi-cally viable.
The booming textile industry of Fall River, Massachusetts, from the1860s through the end of the nineteenth century exemplifies the twin pro-cesses of relocation and realization of scale economies. The Corliss enginewas hardly the only factor responsible for the development of Fall River, but

32 Rosenberg and Trajtenberg
66 See Smith, Cotton Textile, pp. 45 and 47. Steam provided just 25 percent of the power of textilemills in the United States in 1870 and 44 percent in 1880; however, by 1875 steam had already ac-counted for 93 percent of the power for textile mills in Fall River. Moreover, Smith notes that in 1875there were 81 steam engines in operation in Fall River, generating 27,992 HP, which makes for anaverage of 345 HP per engine, certainly a large figure for the time (Smith, Cotton Textile Industry).
67 Yonekawa, Flotation Booms.68 Union Mills were located in Fall River.69 Temin, Iron, p. 101. Chapter 5 of Temin’s book provides a useful overview of the economics of
the rolling mill in the nineteenth century.
it undoubtedly contributed to it a great deal.66 S. Yonekawa discusses thefactors underlying the burst in the formation of cotton spinning factoriesduring the decades of 1870-1890, in vastly different locations: Oldham(England), Fall River (Massachusetts), and Bombay (India), and then alsoin Japan. Regarding Fall River, he writes:67
The invention by George Corliss in 1848 of a regulator allowing more accuratecontrol of the power, and hence the speed, of the machinery was important in allow-ing the establishment of bigger and more powerful steam engines. This in turn led tolarger mills, with 30,000 spindles not being uncommon. . . . The installation of largesteam engines made it possible to build higher capacity mills, with some 37,000spindles and 900 looms, such as Union Mills; organized in 1859, Union Mills wasone of the earliest mills to utilize steam power on this scale.68
However, it is the case of rolling mills, to which we now turn, that bestcaptures the pivotal role of the Corliss, both in enabling scale per se, and inplaying out the other technological advantages of the engine, particularly theability to manage drastic fluctuations in power requirements.
Iron, Steel, and Rails: The Role of the Corliss
The operation of rolling mills, a key technology in the iron and steel indus-try as well as in other metallurgical industries, acquired by mid-century acritical place in the industrialization of America, particularly with the rapidexpansion of the railroads. The Corliss engine came to play a pivotal role inthe growth of rolling mills, both in that it allowed for a much larger scale ofoperations, and in that the engine’s unique facility in responding to the spe-cific requirements of the industrial user proved to be a decisive advantage.The enabling role of the Corliss for rolling mills, and through them its role inthe building of railroads, constituted an important pathway along whichinnovational complementarities stemming from it played themselves out.
The making of wrought iron in the first half of the nineteenth century hadbeen reshaped by the technologies of puddling furnaces and rolling mills.Puddling allowed the introduction of mineral fuels in converting pig ironinto wrought iron, and the introduction of rolling offered a mechanical sub-stitute for hugely labor-intensive hammering at the forge in converting thewrought iron into certain desired shapes. By 1856 fully 95 percent of allwrought iron was made in rolling mills.69 As early as 1849 there were no

Corliss Steam Engine 33
70 Temin, Iron, p.108.71 Fishlow, Productivity, p. 639.72 An important improvement in rail mill practice that came to distinguish American practice from
that in Britain, was the invention of the three-high mill by John Fritz, at the Cambria Works, in 1857.“Within a few years these mills were common throughout the country. They saved time and labor,particularly in the manufacture of railway iron, by enabling the rails to be passed through the rolls inboth directions, instead of passing in only one direction as in the two-high mills still used in England. . . . The first American Bessemer rails produced commercially were rolled in 1867 by the CambriaWorks. As steel rail manufacturing developed, special mills of a heavier type were designed to dealwith the new metal.” (Clark, History of Manufactures, p. 79).
73 See Lesley, Iron; and Crump, Edwin Reynolds.
less than 56 rolling mills in eastern Pennsylvania exploiting the rich anthra-cite deposits of the region, as well as 23 in western Pennsylvania. All butone of the western Pennsylvania rolling mills employed steam power by1849, whereas less than half in the eastern part of the state did so.70
The new metallurgical technologies enabled a huge expansion of the indus-try’s raw material base and the attainment of higher productivity levels, butthey usually led also to an expansion in the optimal scale of plant (the de-pendence of the earlier technology upon the use of charcoal had effectivelyimposed rigid upper limits to the size of plants). The overall trend towardlarger scale was persistent and was vastly intensified with the introductionof the Bessemer process, with its huge fixed-cost requirements, shortly afterthe end of the Civil War. Indeed the shift from iron to steel after the CivilWar (by use of the Bessemer converter), and the construction of the nation’srailway system, constituted one of the great transforming economic eventsof nineteenth-century America. To cite only one narrow measure of theimpact of this transition on the operation of the railroad system itself, steelrails had an expected life more than ten times as great as rails made of iron,which they replaced.71 There is no doubt that the dramatic reduction in over-land transportation costs associated with railroads was one of the criticalfactors that made the twin processes of industrialization and urbanizationfeasible, and the railroad rolling mills (rail mills) were a central part of thistransformation.72
A key difficulty in rolling mills was that these huge engines were beingcalled upon to make drastic and rapid alterations in the delivery of power.Speed in dealing with increasingly heavy loads was particularly urgentbecause red-hot ingots rapidly lose their malleability as they cool. TheCorliss engine was especially well suited for these difficulties. It managedthe fluctuations in power requirements far more successfully than otherengines of the time. It is difficult to visualize how waterpower could havebeen used to accommodate the concentration of mechanical power at thespecific points of use, as was required, in the post-1870 iron and steel indus-try. The huge expansion in blast furnaces and rolling mills in the Bessemerage had simply reached a point where they exceeded the capacities of flow-ing water.73 At rail mills in particular, horsepower requirements were fargreater than in the rest of the iron and steel industry, and steam engine per-

34 Rosenberg and Trajtenberg
74 Edwin Reynolds served as superintendent of the Corliss Works, and later on became chief engineerof the Allis-Chalmers Company.
formance requirements were, as a consequence, far larger than elsewhere.Likewise, pre-Corliss steam engines could not cope with the sudden alter-ations in the delivery of power imposed by rolling mills. On both accountsthen, scope, and smoothness of operation under drastic fluctuations in powerrequirements, the Corliss engine played a critical enabling role for rollingmills, and hence for railroads. A later embodiment of the Corliss design, theReynolds-Corliss engine, and its descendant, the Allis-Chalmers engine,became the universal standard in driving blowing machines for use in blastfurnaces and Bessemer converters, thus serving again as a key technologyin the thriving steel sector of the late nineteenth century.74
CONCLUDING REMARKS
Even though the steam engine is widely regarded as the icon of the Indus-trial Revolution and a prime example of a “General-Purpose Technology,”its role in driving long-term growth is far from transparent. We have arguedthat the Corliss engine, embodying key innovations in performance as wellas fuel efficiency, helped tip the balance in the fierce contest between steamand waterpower. In so doing, it helped propel the steam engine to a domi-nant position in the intertwined processes of industrialization and urbaniza-tion that characterized the growth of the U.S. economy in the second half ofthe nineteenth century. Indeed, the deployment of Corliss engines served asa catalyst for the relocation of industry away from rural areas and into largeurban centers, thus fueling agglomeration economies, attracting furtherpopulation, and fostering economic growth. This illustrates what we believeis an important aspect of the dynamics of GPTs, whether it is electricity inthe early twentieth century or information technologies in the present era:the fact that they induce the massive relocation (and concomitant reorgani-zation) of economic activity, which brings about widespread productivitygains and hence long-term growth.
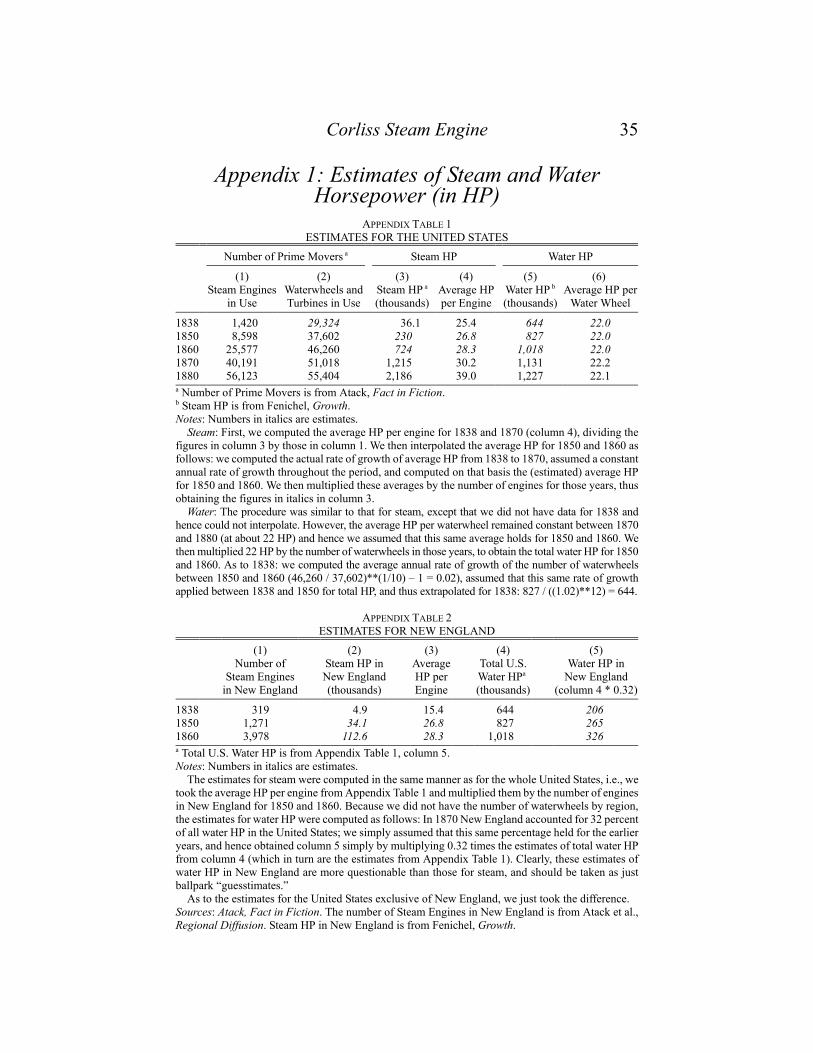
Corliss Steam Engine 35
Appendix 1: Estimates of Steam and WaterHorsepower (in HP)
APPENDIX TABLE 1ESTIMATES FOR THE UNITED STATES
Number of Prime Movers a Steam HP Water HP
(1)Steam Engines
in Use
(2)Waterwheels andTurbines in Use
(3)Steam HP a
(thousands)
(4)Average HPper Engine
(5)Water HP b
(thousands)
(6)Average HP per
Water Wheel
1838 1,420 29,324 36.1 25.4 644 22.01850 8,598 37,602 230 26.8 827 22.01860 25,577 46,260 724 28.3 1,018 22.01870 40,191 51,018 1,215 30.2 1,131 22.21880 56,123 55,404 2,186 39.0 1,227 22.1a Number of Prime Movers is from Atack, Fact in Fiction.b Steam HP is from Fenichel, Growth.Notes: Numbers in italics are estimates.
Steam: First, we computed the average HP per engine for 1838 and 1870 (column 4), dividing thefigures in column 3 by those in column 1. We then interpolated the average HP for 1850 and 1860 asfollows: we computed the actual rate of growth of average HP from 1838 to 1870, assumed a constantannual rate of growth throughout the period, and computed on that basis the (estimated) average HPfor 1850 and 1860. We then multiplied these averages by the number of engines for those years, thusobtaining the figures in italics in column 3.
Water: The procedure was similar to that for steam, except that we did not have data for 1838 andhence could not interpolate. However, the average HP per waterwheel remained constant between 1870and 1880 (at about 22 HP) and hence we assumed that this same average holds for 1850 and 1860. Wethen multiplied 22 HP by the number of waterwheels in those years, to obtain the total water HP for 1850and 1860. As to 1838: we computed the average annual rate of growth of the number of waterwheelsbetween 1850 and 1860 (46,260 / 37,602)**(1/10) – 1 = 0.02), assumed that this same rate of growthapplied between 1838 and 1850 for total HP, and thus extrapolated for 1838: 827 / ((1.02)**12) = 644.
APPENDIX TABLE 2ESTIMATES FOR NEW ENGLAND
(1)Number of
Steam Enginesin New England
(2)Steam HP inNew England(thousands)
(3)AverageHP perEngine
(4)Total U.S.Water HPa (thousands)
(5)Water HP in
New England(column 4 * 0.32)
1838 319 4.9 15.4 644 2061850 1,271 34.1 26.8 827 2651860 3,978 112.6 28.3 1,018 326a Total U.S. Water HP is from Appendix Table 1, column 5.Notes: Numbers in italics are estimates.
The estimates for steam were computed in the same manner as for the whole United States, i.e., wetook the average HP per engine from Appendix Table 1 and multiplied them by the number of enginesin New England for 1850 and 1860. Because we did not have the number of waterwheels by region,the estimates for water HP were computed as follows: In 1870 New England accounted for 32 percentof all water HP in the United States; we simply assumed that this same percentage held for the earlieryears, and hence obtained column 5 simply by multiplying 0.32 times the estimates of total water HPfrom column 4 (which in turn are the estimates from Appendix Table 1). Clearly, these estimates ofwater HP in New England are more questionable than those for steam, and should be taken as justballpark “guesstimates.”
As to the estimates for the United States exclusive of New England, we just took the difference.Sources: Atack, Fact in Fiction. The number of Steam Engines in New England is from Atack et al.,Regional Diffusion. Steam HP in New England is from Fenichel, Growth.

36 Rosenberg and Trajtenberg
75 These figures are for 1860, which is a more natural reference point, given that we are talking aboutCorliss engines that were sold over the period 1850–1869.
76 See Clark, History of Manufactures, pp. 146–47.77 The information about Wood draws upon archival records of the Hagley Library, Wilmington,
Delaware and Lesley, Iron.
Appendix 2: The Geographic Distribution ofCorliss Engines: Is the Petition List a
Representative Sample?The 257 Corliss buyers listed in the petition were spread across 87 different locations
(towns, cities), belonging to 48 counties, in 14 states; 95 percent of these localities wereurban (i.e., had populations of at least 2,500 people), whereas for the United States as awhole only 26 percent of towns qualified as such. Moreover, Corliss engines were concen-trated in very large urban centers: the average population of the five cities with the largestshare of Corliss HP (Providence, Philadelphia, Boston, Pittsburgh, and New York) was of334,797, compared to an average population of 42,156 for all of the 87 adopting localities.75
Appendix Table 3 reveals that Corliss engines were more geographically concentratedthan watermills: the three top states accounted for 78 percent of Corliss HP, whereas thethree top states in terms of waterpower accounted for 56 percent of the region’s water HP.The location with the most significant difference between the two power sources wasRhode Island, with 23.3 percent of Corliss’ HP, but just a trifle—1.4 percent—of water-power. Both are in a sense outliers: On the one hand, it is quite likely that the fact thatGeorge Corliss resided in Providence, Rhode Island, contributed to the widespread adoptionof Corliss engines there, and that this close proximity made it easier to persuade users tosign the petition. On the other hand, and as revealed in the regressions, waterpower clearlyfailed to take hold in Rhode Island, relative to other states in the region. Thus, and mindfulof the possibility that it might be an influential outlier, we conduct the econometric analysiswith and without the observation for Providence.
If Providence may overstate the deployment of Corliss engines in that region, we havesome fragmentary but highly suggestive evidence indicating that our data may understatethe adoption of Corliss-type engines in Pennsylvania, and more specifically in locationswhere iron and steel were thriving at the time. Thus, we know from the petition that one ofCorliss’s principal licensees, Miller & Allen, was located in Chester, Pennsylvania, andbuilt 103 Corliss-type engines in the course of the 1860s (these are not included in our data,because we do not know who purchased these engines). Chester was expanding rapidly inthe decades of the 1860s and 1870s, when its population more than tripled. Its location,immediately adjacent to Philadelphia, the largest manufacturing center in the country, andon navigable waterways that connected it to the iron works of eastern Pennsylvania, wasideal for shipbuilding. By 1870 Chester had the largest shipyards in the United States aswell as a diversity of manufacturing firms, including 25 textile mills, the large EddystonePrint Works, and a large number of iron-using firms.76
Some further evidence from Conshohocken, Pennsylvania, strengthens the presumptionthat our data may fall far short in the count of Corliss engines in Pennsylvania. The Woodenterprises, which had moved to Conshohocken in 1832, included in the 1850s theSchuylkill Iron Works and the Conshohocken Rolling Mill, and came to include also, andintriguingly, the Corliss Iron Works, which was built in 1864 and was eventually incorpo-rated as the J. Wood & Brothers Company in 1886.77 It is, at the least, reasonable to sup-pose that Corliss had some sort of close business connections of a metallurgical nature withthe Wood family, who may have manufactured Corliss-type engines.
Thus, it is quite likely that a large portion of the iron and steel industry in eastern Penn-sylvania, which had previously drawn their power from the water flow off the eastern

Corliss Steam Engine 37
slopes of the Allegheny mountains, acquired their first steam engines, if not from Corlisshimself, then from Corliss licensees or perhaps from infringers in southeastern Pennsylva-nia. This happened at a crucial time, when the region made its transition from waterpowerto steam engines, rolling mills, and blast furnaces fed by anthracite coal.78 Our data, con-fined to the buyers listed in the petition, may therefore substantially understate the adoptionof Corliss-type engines in that region. However, the region experienced at the time veryrapid population growth, and therefore the fact that our sample may undercount the numberof Corliss engines deployed there would militate against our hypothesis and hence wouldnot affect the validity of our findings. Still, we should be mindful all along of the datalimitations (and possible biases) imposed by the exclusive reliance on the Corliss engineslisted in the petition.
78 See Chandler, Anthracite Coal, for the critical role played by rolling mills powered by steam inPennsylvania, during the thrust towards industrialization in the second half of the nineteenth century.
REFERENCES
Allen, Zachariah. The Science of Mechanics. Providence, RI: Miller and Hammond, 1829.The American Machinist, various contemporary issues.Atack, Jeremy. “Fact in Fiction? Relative Costs of Steam and Water Power: A Simulation
Approach.” Explorations in Economic History 16, no. 10 (1979): 409–37. Atack, Jeremy, Fred Bateman, and Thomas Weiss. “The Regional Diffusion and Adoption
of the Steam Engine in American Manufacturing.” This JOURNAL 40, no. 2 (1980):281–308.
Bresnahan, T., and M. Trajtenberg. “General Purpose Technologies: Engines of Growth?”Journal of Econometrics 65, no. 1 (1995): 83–108.
Burn, D. L. “The Genesis of American Engineering Competition, 1850–1870.” EconomicHistory Review 2, no. 6 (January 1931): 292–311.
Chandler, A. D. “Anthracite Coal and the Beginnings of the Industrial Revolution in theUnited States.” The Business History Review 46 (Summer, 1972): 141–81.
______. The Visible Hand: The Managerial Revolution in American Business. Cambridge,
APPENDIX TABLE 3GEOGRAPHIC DISTRIBUTION OF CORLISS ENGINES (1870) AND WATER MILLS (1880)
(sorted by Corliss’s HP)
Corliss Engines Water Mills
Numberof Buyers HP
Percentageof HP
Numberof Mills HP
Percentageof HP
Massachusetts 75 14,162 30.6 1,799 123,432 18.2Pennsylvania 62 11,160 24.1 3,825 87,591 12.9Rhode Island 50 10,795 23.3 121 9,203 1.4New York 34 5,747 12.4 4,205 172,591 25.4Connecticut 12 1,560 3.4 1,265 64,422 9.5New Jersey 9 1,260 2.7 869 28,235 4.2New Hampshire 5 980 2.1 1,275 73,480 10.8Maine 2 250 0.5 883 65,416 9.6Maryland 1 200 0.4 749 17,065 2.5Delaware 1 175 0.4 132 4,819 0.7Vermont 1 50 0.1 698 32,048 4.7Sources: For Corliss engines, Corliss’s Petition; for water mills, U.S. Census Office, Statistics.

38 Rosenberg and Trajtenberg
MA: Belknap Press, 1977.Clark, V. S. History of Manufactures in the United States: 1607–1860, Vol. 2. New York:
McGraw-Hill, 1929.Corliss, George H. In the Matter of the Petition of George H. Corliss for an Extension of
His letters Patent for Improvements in Steam Engines. Providence, RI: ProvidencePress Company, Printers, 1870.
The Corliss Papers collection at the John Hay Library, Brown University, Providence, RI.Crump, John M., Jr. “Edwin Reynolds.” Northeast Florida Section, American Society of
Mechanical Engineers (no date, no pagination). David, P. A. “Computer and Dynamo: The Modern Productivity Paradox in a Not-Too-
Distant Mirror.” In Technology and Productivity: The Challenge for Economic Policy,315–47. Paris: OECD, 1991.
Du Boff, R. B. “The Introduction of Electrical Power in American Manufacturing.” Eco-nomic History Review 20 (December, 1967): 509–18.
Fenichel, A. H. “Growth and Diffusion of Power in Manufacturing 1839–1919.” In Output,Employment and Productivity in the United States after 1800. National Bureau ofEconomic Research, Studies in Income and Wealth Vol. 30, 443–78. New York,Columbia University Press, 1966.
Fishlow A., “Productivity and Technological Change in the Railroad Sector, 1840–1910,”In Output, Employment and Productivity in the United States after 1800. NationalBureau of Economic Research, Studies in Income and Wealth, Vol. 30. New York,Columbia University Press, 1966.
Fogel, Robert W. Railroads and American Economic Growth: Essays in EconometricHistory. Baltimore: The John Hopkins Press, 1964.
Helpman, E., and Manuel Trajtenberg. “A Time to Sow and a Time to Reap: Growth Basedon General Purpose Technologies.” In General Purpose Technologies and EconomicGrowth, edited by E. Helpman, 55–83. Cambridge, MA: MIT Press, 1998.
Helpman, E., Ed. General Purpose Technologies and Economic Growth. Cambridge, MA:MIT Press, 1998.
Horwitz, M., The Transformation of American Law, 1780–1860. Cambridge, MA: HarvardUniversity Press, 1977.
Hunter, L. C. A History of Industrial Power in the US, 1780–1930, Vol 1. Charlottesville:The University Press of Virginia, 1979.
______. A History of Industrial Power in the United States, 1780–1930, Vol. 2: SteamPower. Charlottesville: The University Press of Virginia, 1985.
Krugman, P. Geography and Trade. Cambridge, MA and London: MIT Press, 1991.Lesley J. P. The Iron Manufacturer’s Guide to the Furnaces, Forges and Rolling Mills of
the US. New York: J. Wiley, 1859. Manuscript Collection on the Textile Industry at the Baker Library, Harvard Business
School. Mechanical Engineering, various contemporary issues.Power, various contemporary issues. Rosenberg, Nathan. “Technological Change in the Machine Tool Industry: 1840–1910.”
In Perspectives on Technology, 9–31. Cambridge: Cambridge University Press, 1976.______. “Technological Interdependence in the American Economy.” In Inside the Black
Box: Technology and Economics, 55–80. Cambridge: Cambridge University Press,1982.
______. “Uncertainty and Technological Change.” In The Mosaic of Economic Growth,edited by Ralph Landau, Timothy Taylor, and Gavin Wright, Part 5. Stanford, CA:Stanford University Press, 1996.

Corliss Steam Engine 39
Rosenberg, Nathan, and Manuel Trajtenberg. “A General Purpose Technology at Work:The Corliss Steam Engine in the Late Nineteenth Century US.” National Bureau ofEconomic Research, WP 8485, September 2001.
Sheldon, F. F. “Power and Speed in Cotton Mills.” Proceedings of the 27th Annual Meetingof the Northeast Cotton Manufacturers’ Association. Boston, 1892.
Shillitto, F. W. HandBook of Corliss Steam Engines, 2d ed. Bridgeport, CT: The AmericanIndustrial Publication Company, 1899.
Smith, Thomas Russell. The Cotton Textile Industry of Fall River, Massachusetts: A Studyof Industrial Localization. New York: King’s Crown Press, 1944.
Sokoloff, K. “Inventive Activity in Early Industrial America: Evidence from Patent Re-cords, 1790–1846.”This JOURNAL 48, no. 4 (1988): 813–50.
Taylor, Frank H. History of the Alan Wood Iron and Steel Company, 1790–1820. Publishedfor private circulation, no date.
Temin, Peter. Iron and Steel in Nineteenth Century America, an Economic Inquiry. Cam-bridge, MA: MIT Press, 1964.
______. “Steam and Waterpower in the Early Nineteenth Century.” This JOURNAL 26, no. 2(1966): 187–205.
Thurston, R. H. Stationary Steam Engines: Especially as Adapted to Electric LightingPurposes. New York, 1884.
______. A History of the Growth of the Steam Engine. Ithaca, NY: Cornell UniversityPress, 1939.
Transactions of the ASME, various contemporary issues.Tribe, J. Compound Corliss Engines. Milwaukee, WI: 1903.Trowbridge, W. P. Reports on the Water-Power of the United States: Statistics of Power
and Machinery Employed in Manufactures. Thomas Zeller 10th U.S. Census, 1880.U.S. Census Office, Department of Interior. Statistics of Power and Machinery Employed
in Manufactures, Reports on the Water-Power of the United States, Part 1. Washing-ton, DC: GPO, 1885.
U.S. Congress, House. Documents Relative to the Manufactures in the United States,collected by the Secretary of the Treasury, Louis McLane; Exec.Doc. No. 308, 22ndCong., 1st sess., 1833.
______. Report on the Steam Engines in the United States, H. Doc. No. 21, 25th Cong., 3dsess., 1838.
von Tunzelmann, G. N. Steam Power and British Industrialization to 1860. Oxford: OxfordUniversity Press, 1978.
Wright, Gavin. “Cheap Labor and Southern Textiles, 1880–1930.” Quarterly Journal ofEconomics 96 (1981): 605–29.
Yonekawa, S. “Flotation Booms in the Cotton Industry, 1870–1890: A ComparativeStudy.” Business History Review 61 (Winter 1987): 551–81.