managing water use in scarce environments a catalogue of ...€¦ · in scarce environments - a...
TRANSCRIPT

Managing Water Use in Scarce Environments A Catalogue of Case Studies
© D
ream
stim
e.co
m

2
13 Fitzroy Street, London, W1T 4BQ. UKwww.arup.com/[email protected]
This catalogue has been prepared by Ove Arup and Partners International Ltd with support from WRP (Pty) Ltd and Waterwise. The report takes into account the particular instructions and requirements of our client. It is not intended for and should not be relied upon by any third party and no responsibility is undertaken to any third party.
© 2013, 2030 Water Resources Group (2030 WRG)
2121 Pennsylvania Avenue
Washington, D.C. 20433 USA
www.2030wrg.org
All rights reserved.
August, 2013
Available online at www.waterscarcitysolutions.com
This Catalogue is a product of the 2030 Water Resources Group and was made possible by funding from Nestlé S.A.
Publisher: 2030 Water Resources Group
For publisher: Carmen del Rio Paracolls
Lead authors: Mark Tindale and Thomas Sagris of Ove Arup and Partners International Ltd.
Design: Liz Dunford of Ove Arup and Partners International Ltd.
Credits
Acknowledgements
The 2030 Water Resources Group wishes to thank all of the companies, organisations, institutions and individuals that have shared their knowledge on water use in scarce environments to produce this catalogue. We would also like to thank 2030 WRG's Steering Board whose remarks and reviews have helped enrich this publication, in particular Herbert Oberhaensli, Julia Bucknall and Stuart Orr. We wish to thank Nestlé S.A. whose generous contribution has made this publication possible.

3
Disclaimer
The information included in this work, while based on sources that the 2030 WRG considers to be reliable, is not guaranteed as to accuracy and does not purport to be complete. The 2030 WRG accepts no responsibility for any consequences of the use of such data. The information in this work is not intended to serve as legal advice.
The findings and views published are those of the authors and should not be attributed to 2030 WRG. Nor do any of the conclusions represent official policy of the 2030 WRG or of its Executive Director.
The denominations and geographic names in this publication are used solely for the convenience of the reader and do not imply the expression of any opinion whatsoever on the part of 2030 WRG or other affiliates concerning the legal status of any country, territory, city, area, or its authorities, or concerning the delimitation of its boundaries or national affiliation.
Rights and Permissions
The material in this work is subject to copyright. Because the 2030 WRG encourages dissemination of its knowledge, this work may be reproduced, in whole or in part, for noncommercial purposes as long as full attribution of this work is given.
ANY queries on rights and licenses, including subsidiary rights, should be addressed to the Carmen del Rio, the 2030 WRG, 2121 Pennsylvania Avenue, NW, Washington, DC 20433, USA; telephone: 202-473-8509; email: [email protected].
About 2030 Water Resources Group
2030 WRG is a unique public-private-civil society partnership that helps governments to accelerate reforms that will ensure sustainable water resource management for the long term development and economic growth of their country. It does so by helping to change the “political economy” for water reform in the country through convening a wide range of actors and providing water resource analysis in ways that are digestible for politicians and business leaders.

4
Foreword
Edna Molewa Minister of Water and Environmental Affairs of South Africa
5
I am very pleased to see Managing Water Use in Scarce Environments - A Catalogue of Case Studies (the Catalogue) as one contribution to solving the water security issues. The growing gap between supply and the demand for water is forcing the world to find new ways to generate higher growth while using much less water. It requires collaboration between the government to provide sound policies and regulation, private sector to provide innovation and technology, and civil society to provide inputs from the users.
Water is a very local issue, and there are no global solutions. Nevertheless for successful implementation of programmes, all stakeholders need to learn from existing good practices, obtain advice from practitioners or identify providers of specific solutions. The Catalogue covers a wide array of experiences in various environments, which all of us can draw lessons from.
I am also pleased that some cases are drawn from South Africa. In South Africa, we face an increasingly likely decline in water supply, given the current trends of poor usage habits, physical and commercial water losses, which are driven largely by population and economic growth, substantially increased water requirements for agricultural and industrial uses, and the increasing demand by our growing middle class.
Water conservation, demand management and the diversification of the water supply mix are critical, if we are to overcome the challenge that is before us.
The 2030 Water Resources Group (2030 WRG) who commissioned the Catalogue fits squarely in this picture by highlighting water issues, building consensus among multiple stakeholders, and helping them make difficult choices. Strategic Water Partners Network - South Africa (SWPN) which the Department of Water Affairs (DWA) of South Africa is leading with partners such as 2030 WRG, private sector and civil society in an initiative to close the water gap by 2030. Analysis, best practices, and partnerships created by 2030 WRG can inspire real change.
We thank the people and institutions who contributed cases in the Catalogue and share their experience with the wider world. We hope that this catalogue will lead to an open source instrument, open to those who have effective practical solutions and experiences. As we are all facing significant water challenges, we need all the advice and knowledge that is available today to develop sustainable solutions for water scarcity.
Foreword to Managing Water Use in Scarce Environments.
There is not a single day now when we do not hear about water issues in the world whether it is shortage of drinking water in Accra in Ghana, melting of glaciers in the Andes and the Himalayas, or water contamination in some countries. Water supply crises and food security are identified as two of the top five global risks with the greatest impact if they were to manifest over the next 10 years. In other words economic growth and social well-being depend on a safe and secure water supply.
6
Contents
Introduction 08
Agricultural 22
Managing evapotranspiration using quotas 24Hai Basin, China
Irrigation management 28Orange-Senqu Basin, South Africa
Integrated watershed management 30Adarsha, Kothapally, India
Irrigation scheduling in grape farming 32Shelanu Farm, South Africa
Ground water conservation 34Republic of Yemen
Pilot low cost irrigation scheduling 36Punjab, India
Improved water distribution management 38Lower Vaal River Catchment, South Africa
Water reclamation for reuse and groundwater recharge 40Orange County, Florida, USA
Improving water availability through wastewater treatment 42Segura River, Spain
Irrigation network renewal 44North Victoria, Australia
Irrigation optimisation 46Soetmelkvlei Farm, South Africa
Improved water management for sugarcane production 48Godavari Basin, India
Industrial 50
Managing water towards zero discharge 52Lerma Chapala Basin, Mexico
Metering of non-revenue water 54Ekurhuleni, South Africa
Water efficiency audits of steam systems 56Melbourne, Australia
Water reuse in textile sector 58Tiruppur, India
Water use reduction strategy in the food sector 60Mossel Bay, South Africa
Water optimisation in mining sector 62Lomas Bayas Copper Mine, Chile
Wastewater reclamation and reuse network 64Singapore
Water recycling in the food sector 68Durban, South Africa
Water recycling in paper production 70City of Jeddah, Saudi Arabia
Groundwater recharge 72Omdel Dam, Namibia
Mine water recycling 74East Kimberley, Western Australia
Water reuse in the power and steel production sector 76Gujarat, India
Direct dry cooling in the power sector 78Matimba, South Africa

7
Municipal 80
Regional water conservation programme 82Seattle Water Partnership, USA
Reducing business risk through municipal leakage reduction 84Emfuleni, South Africa
Water loss management programme 86New South Wales Regional Water Utilities, Australia
Advanced pressure management 88City of Cape Town, South Africa
Leakage reduction in a city 90City of Jeddah, Saudi Arabia
Aquifer recharge with stormwater 92City of Salisbury, Adelaide, Australia
Water demand management scheme 94Drakenstein, South Africa
Water Authority conservation programme 96Nevada, USA
Pressure management in municipalities 100Sebokeng and Evaton, South Africa
Use of seawater in dual municipal water supply 102Hong Kong, China
Leakage reduction in primary schools 104Upington, South Africa
Water demand management strategy 106Singapore
Reducing water losses in a large distribution network 108City of Johannesburg, South Africa
Behavioural change initiative 110Zaragoza, Spain
Wastewater reclamation to meet potable water demand 112Windhoek, Namibia
Domestic and business retrofit project 114Sydney, Australia
Emergency water demand management 116Beaufort West, South Africa
References 118
Index 126

8
01Introduction
The purpose of the publication is:
“to report and catalogue examples, expertise, advice and innovations in water demand and supply management improvement across key sectors and technologies.”
© T
acna
| D
ream
stim
e.co
m

9
Setting the sceneThere is an emerging gap between safe freshwater availability and water demand in many developing and fast-growing economies around the world.
Recent analysis by the 2030 Water Resources Group (WRG) suggests that the gap between safe freshwater demand and supply will be about 40% globally by 2030 if business as usual water management approaches continue (Exhibit 1). The economic, environmental, social and political challenges that this water gap presents governments are very real.
With finite limits to local water availability (including for environmental sustainability) facing many countries the critical challenge is how we can manage water resources to safely deliver the water needed to fuel growth as well as for meeting the needs of humans and the environment.
Yet, as reported in previous 2030 WRG publications, there is no single water crisis, different countries and different basins even in the same region face very different problems. Decisions on water management, must consider the individual characteristics of each basin and location within the basin. They must also be guided by national priorities including economic development and the sustainable allocation of resources between competing economic, societal and environmental demands.Business-as-usual approaches will not meet demand for raw water
SOURCE: 2030 Water Resources Group – Global Water Supply and Demand model; IFPRI; FAOSTAT
1 Based on historical agricultural yield growth rates from 1990-2004 from FAOSTAT, agricultural and industrial efficiency improvements from IFPRI
2 Total increased capture of raw water through infrastructure buildout, excluding unsustainable extraction
3 Supply shown at 90% reliability and includes infrastructure investments scheduled and funded through 2010. Current 90%-reliable supply does not meet average demand
Billion m3
Historical improvementsin water productivity1
Demand with no productivity improvements
Remaining gap
Increase in supply2 underbusiness-as-usual
Existing accessible, reliable supply3
Today2
6,000
5,000
3,000
8,000
7,000
2030
Portion of gapPercent
20%
60%
20%
Exhibit 1: Business as usual approaches will not meet demand for raw water
Water resource planning has to consider the whole basin and the inter-relationship between the different components of flow, demands and users. Terms such as “water efficiency” or “water savings” may be readily understood when considering, for example, an isolated unit, but when considered in the context of basin water scarcity the concepts are complex and can rarely be accounted for in a simplified fashion.
As an example, municipal waste water re-use may reduce or stabilise the total freshwater withdrawal required by a municipality but may, in turn, reduce the volume of resource available to downstream water users if the reclaimed water is used for consumptive purposes. Similarly, greater efficiency in agricultural water use through advanced irrigation techniques typically increases the consumptive use and crop yield whilst reducing the volume of water that infiltrates the ground and recharges aquifers or flows via drains back into the main water course. Consequently, the implementation of technical solutions to reduce water use can have complex and unintended results; every basin is different and there is no “one size fits all” approach.
Therefore, to define best practice in reducing water demand is a complicated subject and one which this catalogue does not claim to answer; what may be best practice in one basin or location can be very different to that in another. However, individual examples of where measures have been introduced both inform and inspire, and are a valuable contribution to the challenge of addressing water scarcity. The purpose of this catalogue is therefore:
“to report and catalogue examples, expertise, advice and innovations in water demand and supply management improvement across key sectors and technologies.”
To this end, the publication presents a framework within which the impact of case studied interventions have been assessed.

10
01Introduction
If however either of the above interventions were made downstream of location 2, there would be a direct benefit to basin water scarcity as the location 2 return flows are not returned to the basin but are discharged to the ocean.
Agriculture accounts for 90% of global consumptive use and is thus critical to approaches for managing water scarcity. In assessing the impact of interventions in this sector it is important that changes in the different components of water use are considered, these are shown in Exhibit 2.
What is a water saving?The logical approach to water scarcity is to save water in a relevant and cost effective manner; if one does not have enough water available then one must reduce the amount of water used. This is a very simple yet logical argument; as a result numerous examples exist of publicity citing “water savings”, yet is everything quoted as a “water saving” really a “water saving”?
To determine how a potential water saving impacts water scarcity one must first understand the basin specific context, this is described in Exhibit 3.
A system that is suffering from water scarcity is one in which there is insufficient water available to meet demand at any specific time. This challenge can be addressed through supply side measures such as new dams, water transfers, desalination and water re-use, or by demand side measures that make better utilisation of the water resource that is already available.
Demand side measures include those that reduce consumptive use, for example reducing the volume of water consumed for evapotranspiration, and those which reduce non consumptive use, for example low flush volume plumbing fittings. Measures that reduce consumptive use have the greatest potential to positively impact basin water scarcity.
The net basin impact of interventions that reduce non-consumptive use depends on where they are located in the basin for example:
- Consider the implementation of low water use plumbing fixtures in Exhibit 3, Location 1. The volume of water withdrawn from the dam will be reduced however, the volume of water returned to the river will also be reduced. Consequently, there will be minimal net basin impact as a proportion of overall flow, although there will be benefit brought ras a result of a greater volume of water being maintained in the upstream dam.
- Consider the implementation of a water recycling plant in Exhibit 3, Location 2; again this would benefit location 1 as less water would be required to be withdrawn from the dam to meet the location 1 demands, however the impact on the overall basin water scarcity would be neutral because the plant would be recycling water that would have otherwise been stored in dam 2.
B Beneficial consumption
C Non-beneficial consumption
D Non-recoverable flows
Consumed
Not Consumed
A Gross withdrawals
E Return flows
Exhibit 2: Illustrative overview of the components of water withdrawals in irrigation (Source : Adapted from 2030 Water Resources Group).
It is clear from the discussion above that the impact of a water saving associated with an intervention must be defined in terms of its impact on the different components of water management in a basin.
To this end this publication proposes a series of metrics and indicators to bring clarity to the question of “what is a water saving?”
For example, consider an agricultural intervention that reduces withdrawals but maintains or increases crop yield. The increase in crop yield (productive output per unit of water withdrawn) may principally be achieved through more careful and timely application of water to the root zone of the crop, consequently consumptive use through evapotranspiration increases whilst the return flow to the basin (as well as non-recoverable losses) is reduced. Thus whilst there are positive impacts on withdrawals and productivity, the net impact on basin water scarcity may be negative.

11
Exhibit 3: A Typical Water Basin
The non consumptive demand component is water that is withdrawn from the basin but is then returned back to the basin, for example water used for toilet flushing and showers, water that is applied to fields and drains away back to the river or water that infiltrates to aquifers.
The water that returns to the basin is called the return flow. These flows are of varying quality depending on its source and the level of treatment that has been applied.
In some locations return flow is unusable and so requires further freshwater to dilute; this water for dilution is a further demand on the freshwater resource.
Water falls on the basin as precipitation and either runs off into the rivers, infiltrates to the ground or is returned to the atmosphere through evapotranspiration. It is commonly captured and stored for later use either on the surface in dams or underground in aquifers.
Water is subsequently withdrawn from either the river or the storage to meet demands which comprise of two parts, consumptive demand and non-consumptive demand.
Wastewater then returns to the basin and ultimately most of the flows discharge to the sea.
Consumptive demand is the component of demand that permanently removes water from the basin; examples include evaporation from open water or cooling systems, evapotranspiration for plant growth such as in food crops or in weeds or embodiment in industrial products.
Non Consumptive Use
Non Consumptive Use
Consumptive UseLocation 01
Location 01
Location 02
Location 02Consumptive Use
Groundwater
Return Flow
Return Flow
Saline Ocean
Human Use
Industrial Use
Agriculture
LEGEND
Groundwater
Withdrawal
Withdrawal
Withdrawal
Withdrawal
Water Quality
Precipitation
Surface runoff
Infiltration
Surface runoff
Infiltration
12
01Introduction
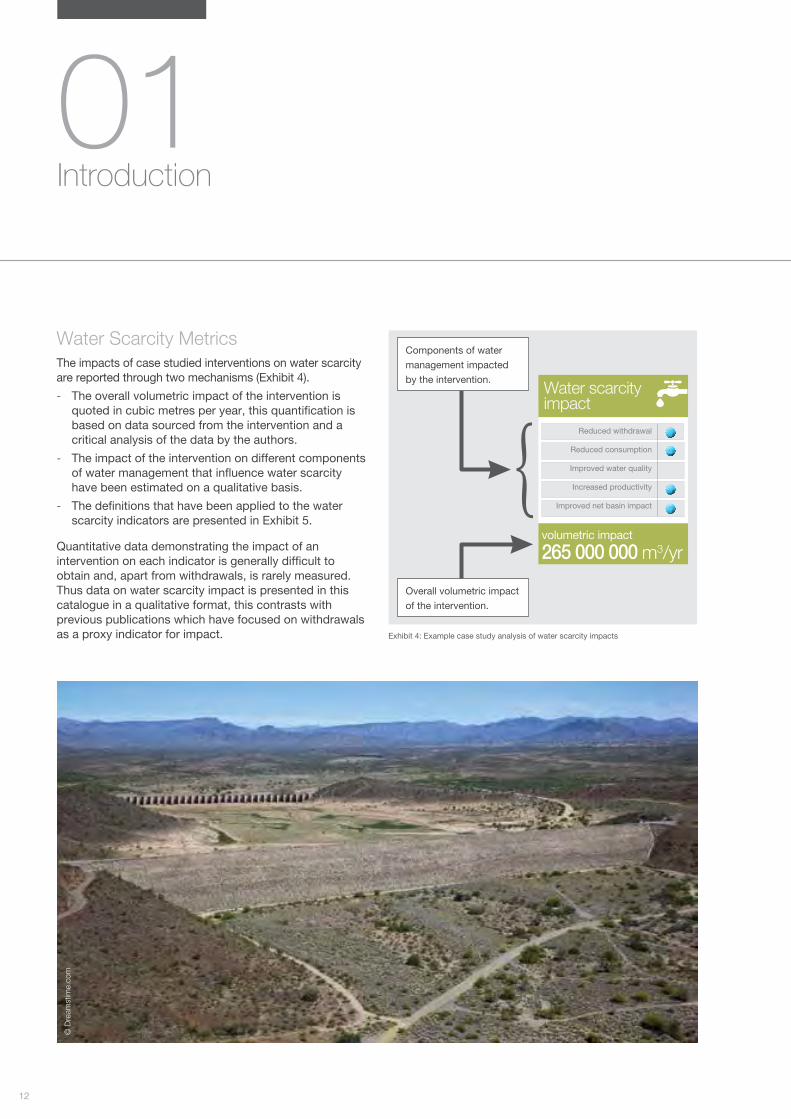
Water Scarcity Metrics The impacts of case studied interventions on water scarcity are reported through two mechanisms (Exhibit 4).
- The overall volumetric impact of the intervention is quoted in cubic metres per year, this quantification is based on data sourced from the intervention and a critical analysis of the data by the authors.
- The impact of the intervention on different components of water management that influence water scarcity have been estimated on a qualitative basis.
- The definitions that have been applied to the water scarcity indicators are presented in Exhibit 5.
Quantitative data demonstrating the impact of an intervention on each indicator is generally difficult to obtain and, apart from withdrawals, is rarely measured. Thus data on water scarcity impact is presented in this catalogue in a qualitative format, this contrasts with previous publications which have focused on withdrawals as a proxy indicator for impact.
Water scarcity impact
265 000 000 m3/yrvolumetric impact
Reduced withdrawal
Reduced consumption
Improved water quality
Increased productivity
Improved net basin impact
Exhibit 4: Example case study analysis of water scarcity impacts
Components of water
management impacted
by the intervention.
Overall volumetric impact
of the intervention.
© D
ream
stim
e.co
m

13
Indicator Definition
Withdrawal » How does the intervention impact the volume of freshwater that is withdrawn from the system be it from the river, aquifer or dam? A positive impact is reported when the intervention results in a reduction in the volume of water withdrawn from a source.
» If the intervention involves artificial recharge of an aquifer the effect is to maintain a greater volume of water in storage and thus the impact of these types of interventions have also been classified as a reduction in withdrawal.
Consumptive Use » In the agricultural sector it has been assumed that increases in crop production result in increased consumption (evapotranspiration) unless details provided in the case study indicate a specific reason to the contrary.
» Change in consumptive use arising from small reductions in evaporative losses, relative to the overall change in withdrawal, have been considered to be minor.
» Where the intervention involves groundwater recharge and storage this has been reported as a reduction in consumptive use because the equivalent storage on the surface would result in significant evaporative losses.
» Municipal leakage reduction has been classified as a reduction in consumptive use except for where specific evidence is available to the contrary. This is based on the assumption that a large proportion of municipal leakage is commonly lost to evaporation, evapotranspiration or contaminated groundwater and only a small proportion is likely to return to the main hydrological system in a recoverable form. It is recognised that this is a broad assumption but the availability of data has prevented a more detailed analysis on a location specific basis.
Water Quality » Interventions that have been implemented to specifically address downstream water quality issues are classified under this indicator. Notional increases in downstream water quality as a secondary benefit of an intervention are not reported in this category, for example reduced run off from a field which reduces nutrient loading of downstream water.
Production per unit of water abstracted
» Increases in product per m3 of water abstracted are reported as a positive impact however the corresponding impact on consumptive use is, in most instances, reported as having increased.
Net Basin Impact » This indicator assesses the overall net effect on the basin water deficit. If comsumptive use is reduced then it is assumed that there is a positive impact on the overall basin deficit. If the intervention is transferring use, reducing withdrawal or changing return flow the overall impact on the deficit is reported as either neutral (no change) or negative (for example when consumptive use has increased).
» Improved water quality has been assumed to provide a positive net basin impact.
Exhibit 5: Definition of indicators used to assess the impact of interventions on water scarcity

14
Financial MetricsCapital Cost
In most case studies capital cost data has been provided by the implementer of the intervention; in some instances the data is confidential and so has not been published. All capital cost data has been escalated to 2013 US dollar prices using inflation rates that are broadly appropriate to the geographical location of the intervention. A number of the case studies are programme interventions where there has been no specific capital investment but instead a programme of measures has been funded over a sustained period of time. In these case studies the capital cost indicator has been referred to as a programme cost.
Exhibit 6 provides an example of how the capital cost metric has been presented in the catalogue.
Due to varying degrees of data availability there is an inherent uncertainty in the capital cost data that are quoted. Based on the source of the presented data a confidence level has been assigned to the indicator (Exhibit 7).
01Introduction
Exhibit 6: Presentation of the Capital Cost Metric
Exhibit 7: Definition of Capital Cost Confidence Levels
High confidence
Capital cost data has been provided by parties who have direct invovlement in the intervention and the authors have a reasonable level of confidence in the accuracy of the data provided.
Moderateconfidence
Capital cost data has been provided by 3rd parties rather than the implementer of the intervention, or the authors have a limited confidence in the accuracy of the data provided by 3rd parties.
Low confidence
Capital cost has been estimated by the authors using a number of sources, or the authors have a low level of confidence in the accuracy of the data provided by 3rd parties.
Capital cost of
the intervention or
programme, 2013 USD
Confidence level
associated with the data.
capital cost
$14 800 000
© D
ream
stim
e.co
m

15
Estimated Unit Cost of Water
A myriad of options exist for managing water scarcity, yet each of these come at a cost with varying degrees of benefit at a local level and at a basin level. To enable comparison between options an order of magnitude cost of intervention per unit of volumetric impact has been estimated for each case study. The volumetric impact is the total impact across all water scarcity indicators, the output must therefore be understood in the context of the qualitative assessment of the impact of the intervention.
The financial cost used to calculate this indicator represents the project or programme cost and includes;
- the capital cost to implement the intervention
- the estimated operational cost required to maintain the water scarcity benefit.
The process used to calculate the unit cost is shown in Exhibit 8, this is similar to that used by 2030 WRG in previous publications.
All costs are based on current costs1 and estimated projections, historical data has been broadly inflated to 2013 US dollars. A discount rate of 8% has been assumed for all studies, this represents a rate that falls between a government bond rate of 6% and a private sector interest rate of between 12-14%2.
Assessment periods have been chosen for the interventions based on assumptions as to the likely asset life and period over which the impact on water scarcity may be maintained. In the agricultural sector this has been taken as 10 years whilst for interventions that involve major treatment plants this has been set at 20 years. For a number of interventions that are programmes the assessment period has been set to the duration of the programme.
For many of the case studies there are significant data availability constraints. Where data are not available estimates of operating costs and replacement cycles have been made as a percentage of the capital cost.
Exhibit 9 provides an example of how the unit cost metric has been presented in the catalogue.
An estimation uncertainty is inherent in the approach therefore, the unit costs should be used for overall comparisons rather than for predictions of the unit costs associated with the development of a specific intervention. For each case study unit cost a level of confidence has been indicated (Exhibit 10).
Exhibit 8: Process used for Unit Cost Calculation
Unit cost (USD/m3)
Intervention Cost over assessment
period (USD)
Water impact over assessment period
(m3)
Discount rate (percentage)
Water scarcity impact per year
(m3/year)
Investment Opex (USD/year)
Estimated useful asset life (years)
Investment Capex (USD)
Exhibit 10: Definition of Unit Cost Confidence levels
High confidence
Unit costs are based on operating data provided by original sources.
Moderateconfidence
Unit costs are based on a limited set of data and a number of assumptions estimated by the authors.
Low confidence
Unit costs that have been estimated by the authors.
1 The estimated unit cost does not include transaction costs, communication/information costs, subsidies, taxes, or the consequential impact on the economy and capital availability is not considered a constraint. Net operating expenditure such as personnel, material, energy and maintenance costs, and savings is assessed as a real amount to be expended each year. Possible cost savings generated through the intervention (e.g. cost savings for water pumping, treatment and distribution or bulk water purchase) have not been included.2 Discount rates referenced to previous WRG publication "Charting Our Water Future"
Exhibit 9: Presentation of the Unit Cost Metric
estimated unit cost of water
<5¢/m3
NPV cost per unit of
volumetric impact.
Confidence level
associated with the data.
01Introduction
16
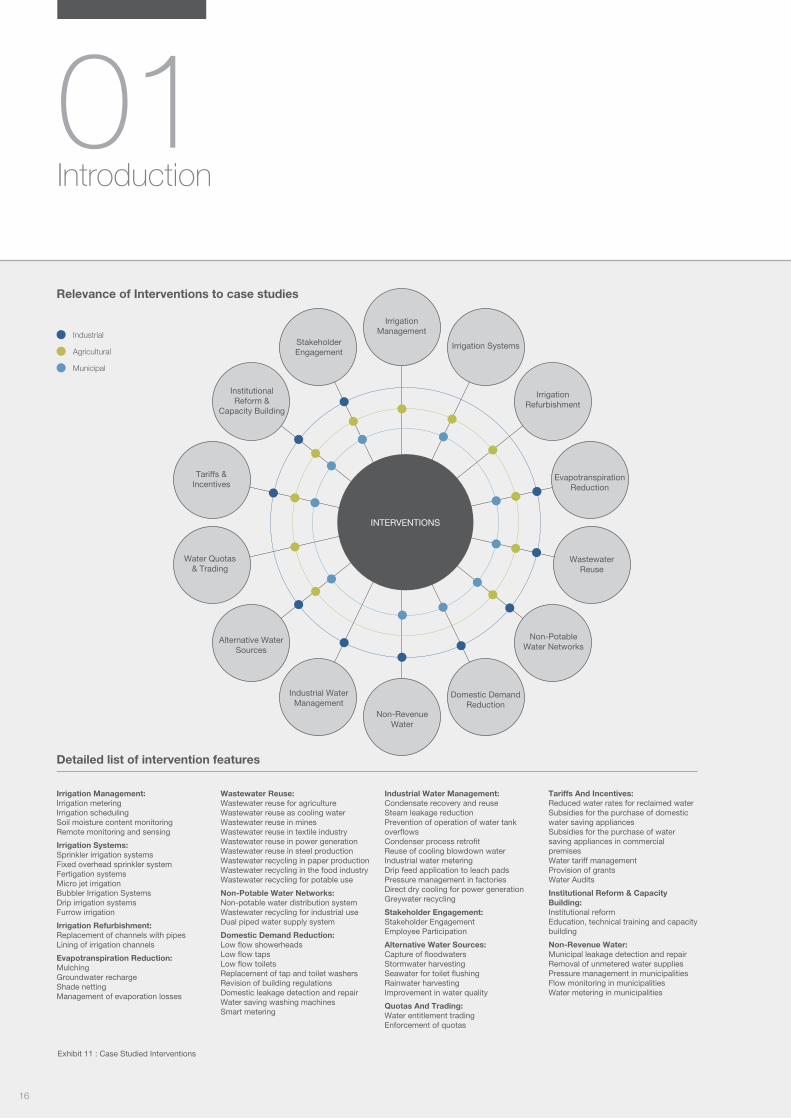
Irrigation Management:Irrigation meteringIrrigation schedulingSoil moisture content monitoringRemote monitoring and sensing
Irrigation Systems:Sprinkler irrigation systemsFixed overhead sprinkler systemFertigation systemsMicro jet irrigationBubbler Irrigation SystemsDrip irrigation systemsFurrow irrigation
Irrigation Refurbishment:Replacement of channels with pipesLining of irrigation channels
Evapotranspiration Reduction:MulchingGroundwater rechargeShade nettingManagement of evaporation losses
Detailed list of intervention features
INTERVENTIONS
Wastewater Reuse:Wastewater reuse for agricultureWastewater reuse as cooling waterWastewater reuse in minesWastewater reuse in textile industryWastewater reuse in power generation Wastewater reuse in steel productionWastewater recycling in paper productionWastewater recycling in the food industryWastewater recycling for potable use
Non-Potable Water Networks:Non-potable water distribution systemWastewater recycling for industrial useDual piped water supply system
Domestic Demand Reduction:Low flow showerheadsLow flow taps Low flow toilets Replacement of tap and toilet washersRevision of building regulationsDomestic leakage detection and repairWater saving washing machinesSmart metering
Industrial Water Management:Condensate recovery and reuseSteam leakage reductionPrevention of operation of water tank overflowsCondenser process retrofitReuse of cooling blowdown waterIndustrial water meteringDrip feed application to leach padsPressure management in factoriesDirect dry cooling for power generationGreywater recycling
Stakeholder Engagement:Stakeholder Engagement Employee Participation
Alternative Water Sources:Capture of floodwatersStormwater harvestingSeawater for toilet flushingRainwater harvesting Improvement in water quality
Quotas And Trading:Water entitlement tradingEnforcement of quotas
Tariffs And Incentives:Reduced water rates for reclaimed waterSubsidies for the purchase of domestic water saving appliancesSubsidies for the purchase of water saving appliances in commercial premisesWater tariff managementProvision of grantsWater Audits
Institutional Reform & Capacity Building:Institutional reformEducation, technical training and capacity building
Non-Revenue Water:Municipal leakage detection and repairRemoval of unmetered water suppliesPressure management in municipalitiesFlow monitoring in municipalitiesWater metering in municipalities
Industrial
Relevance of Interventions to case studies
Agricultural
Municipal
Exhibit 11 : Case Studied Interventions
Irrigation Management
Irrigation Systems
Irrigation Refurbishment
Evapotranspiration Reduction
Wastewater Reuse
Non-Potable Water Networks
Domestic Demand Reduction
Non-Revenue Water
Industrial Water Management
Alternative Water Sources
Water Quotas & Trading
Tariffs & Incentives
Institutional Reform &
Capacity Building
Stakeholder Engagement

17
The Case StudiesGeographical Spread
The publication is a compendium of opportunities that may be considered for integration into water resource plans to manage demand or enhance supply. The identification of the included case studies involved an initial consultation with a number of national governments to identify project levers, or interventions, that would be of interest to them, and to establish known examples of good practice that they would like to share with others. This exercise was complemented by a literature review and a collation of additional projects. In selecting the case studies, it has been important to ensure that there is sufficiently robust information to describe the project and understand its impacts. This has inevitably led to a greater focus on some regions where the data has been more readily available. It is acknowledged that there are other good examples across other regions not represented in this catalogue.
Sectors and Interventions
The catalogue includes a wide geographical and technological spread of interventions in water stressed areas across Municipal, Industrial and Agricultural sectors (Exhibits 11 and 12). These have been organised and indexed to enable particular interventions common to a number of case studies to be cross-referenced. Each case study is accompanied by contextual information that will assist users in understanding the drivers and key features of the intervention and to guide analysis for application elsewhere.
Agricultural
Industrial
Municipal
12
13
16
Exhibit 12: Sectoral Spread of Case Studies included in the catalogue
© D
ream
stim
e.co
m

18
Net basin effect and consumptive use
- 57% of the interventions reviewed result in a net basin benefit. (Exhibit 13).
Withdrawals and productive use
- The majority of interventions provide an increase in the productive use per m3 of withdrawn water (Exhibit 13).
- The majority of interventions result in reduced withdrawals (Exhibit 13).
Reducing withdrawals and increasing the productive use of water bring water management benefits. In the conceptual basin (Exhibit 3), this is equivalent to maintaining water in upstream dams and aquifers that can subsequently be released for other uses at different times. This also provides benefits such as reduced water treatment and pumping costs, reduced energy consumption, reduced carbon, and the ability to delay significant future investments in large scale supply side infrastructure.
Whilst these benefits are significant and their value to water management must not be understated, it is important to recognise that, depending on the location in the basin and the presence of downstream users, the net impact at a basin level of reduced withdrawals maybe negligible.
01Introduction
Emerging Themes The publication of this catalogue represents another step in the journey of the 2030 Water Resources Group. This commenced with the publication of Charting our Water Future in 2009 and was followed by the publication of a Pilot Catalogue of Water Use Efficiency Measures in 2012.
Along this latest stage of the journey a number of themes and observations have emerged. They do not represent a conclusion but are instead a contribution to the debate around the management of water scarcity. It is the ambition of the 2030 Water Resources Group that this will help catalyse well informed actions and debate to achieve improvements in the management of water particularly in water stressed areas. The themes described in this section are relevant to both the public sector, tasked with the overall management and planning of water resources, and the private sector tasked with implementing a sustainable business model that minimises both the impact of water risk to the business and the impact of the business on scarce water resource.
The availability of water at the right time, at the right volume and at the right price is an essential underpinning of economic growth and development. Fundamental to this is water resource planning, demand management and an understanding of how interventions impact the basin. In the section below the overall impact of case studies on the different indicators are discussed.
In order to a achieve a net basin benefit an intervention must either reduce the consumptive use of water or reduce the volume of water that is being lost to an unrecoverable source, for example the ocean or through poor water quality. It is notable that a substantial proportion of the interventions to do not result in a postive net basin impact.
© D
ream
stim
e.co
m

19
0% 20% 40% 60% 80% 100%
Reduced withdrawal
Reduced consumptive use
Improved Water Quality
Increased product/m3 abstraction
Net basin benefit
Agriculture
Exhibit 14: Agricultural case studies - Summary of Impact on Water Scarcity Indicators
Exhibit 15: Hai Basin, an example of reduced consumptive use in agriculture
Exhibit 16: Shelanu Farm, an example of reduced consumptive use in agriculture
0% 20% 40% 60% 80% 100%
Reduced withdrawal
Reduced consumptive use
Improved Water Quality
Increased product/m3 abstraction
Net basin benefit
All Case Studies
Exhibit 13: All case studies - Summary of Impact on Water Scarcity Indicators
Consumptive use in agriculture
- 25% of agricultural interventions result in reduced consumptive use (Exhibit 14).
The agricultural sector accounts for over 90% of global water demand. Therefore, if water scarcity issues are to be addressed agricultural interventions that deliver a net basin water benefit must be a key focus of water planners. In undertaking the analysis for this catalogue it is evident that many agricultural interventions deliver reduced withdrawals, whilst maintaining or increasing crop production, by reducing return flows. Subsequently these interventions generally increase consumptive use and deliver a relatively minor net basin benefit.
Three agricultural case studies are identified as delivering a net basin benefit. One of these, the Orange County Aquifer Recharge programme, is a supply side measure for the purposes of agriculture. The other two case studies, the Hai Basin in China and Shelanu farm in South Africa, are interventions that achieve a reduction in agricultural consumptive use (Exhibits 15 and 16).
Managing evapotranspiration using quotas Hai Basin, ChinaThe Hai Basin project involves an eight year programme to manage water use through quotas for evapotranspiration which are monitored by remote sensing. This programme offers an innovative approach that replaces the conventional process of allocating water withdrawal rights to farmers with evapotranspiration rights. The success of the programme is dependent upon the specific local context however it offers an indication of the type of intervention that may need to become more prevalent in the sector.
Irrigation scheduling in grape farming Shelanu Farm, South AfricaThe intervention at Shelanu Farm is successful in reducing consumptive use for two main reasons. Firstly, the type of crop being grown is grapes which, unlike many other crops, presents an opportunity to reduce high evaporative losses and secondly, reductions in water withdrawals were not permitted to be used to expand irrigated areas. The accrued benefits are highly crop and location specific however it is of note that the intervention was driven by the water footprinting demands of international supermarkets.

20
0
20
40
60
80
100
120
140
160
>500
Agriculture
Municipal
Industrial
Estim
ated
Uni
t Cos
t (ce
nts/
m3 )
Key
Estimated unit cost of interventions
- Estimated unit costs range from less than ¢5 to greater than ¢500 per cubic metre of impact.
01Introduction
The estimated unit cost of interventions included in this publication vary significantly (Exhibit 17); interventions involving water treatment, water recycling or large scale infrastructure generally lie at the high end whilst municipal leakage and some agricultural programmes can be found at the low end.
In preparing this document it was evident that there is a high prevalence of water recycling and reuse projects driven by a need for businesses and industry to mitigate risk arising from water scarcity. Whilst in many locations these may be the most relevant and cost effective type of intervention, it is possible that in some instances (when considered from a basin water scarcity perspective) alternative options for mitigating water risk may be available at a lower unit cost.
For example, one of the lowest unit costs included in this publication is for an intervention at Emfuleni in South Africa. In this location a major integrated chemical and energy company has mitigated the risk of water scarcity to its business through interventions in upstream municipalities.
The high level of variance in unit costs illustrates the significant difference that exists between types of interventions thus emphasising the importance of identifying the most relevant and cost effective interventions in a specific location. The unit cost ranking of different interventions could vary significantly depending on the basin context in which they are located. In order to determine the most relevant intervention a detailed basin level analysis is required that identifies the options available, relevant unit costs and the impact on overall basin water scarcity. This could include an approach similar to the Water Availability Cost Curves presented in previous 2030 WRG publications.
By utilising such analysis, water managers and business leaders can take decisions to address water scarcity with confidence that the most relevant and cost effective options for a particular location have been identified.
Exhibit 17: Range of costs per m3 of impact

21
- Prioritisation should be given to interventions that focus on reducing consumptive use.
- The development of mechanisms and models that incentivise and control reductions in consumptive use.
- Intervention decision making that is based upon detailed water resource planning and understanding of the specific local context.
- Standardised data collection and reporting that enables accurate monitoring of impacts on consumptive use, return flows and withdrawals.
- Prioritisation of interventions that deliver the greatest basin level benefit at the lowest unit cost.
- Partnerships between the public and private sector that enable water risk to be reduced whilst maximising basin level water scarcity benefits.
Drawing it all togetherPolicy makers, water resource planners, businesses and industries affected by water scarcity are faced by a myriad of options. This publication seeks to inspire action by documenting a wide range of implemented interventions with an assessment of their impact and cost effectiveness.
It illustrates the great variety of drivers, interventions and implementation paths that are available and demonstrates the need to examine each situation on a case by case basis. Forty two case studies have been documented and, most crucially, a framework has been presented that can be utilised by decision makers to assess the potential impact of future interventions. It is recognised that the framework and the analysis of case studies depends upon certain assumptions and these have been documented in order to facilitate appropriate debate.
Reflecting on our journey to produce this publication, a number of key strategic considerations are given below which would aid the identification and uptake of relevant cost effective interventions.
It is the 2030 Water Resources Group’s ambition that this publication will provide a tool for decision makers and form a focal point for action around the challenge of water scarcity. It is designed to stimulate and support action for meaningful interventions which help manage scarce water resources more effectively for the benefit of all.
The publication is available in both a paper and an online format. Opportunities exist for feedback of comments and the submission of case studies for inclusion in the online version in order to stimulate and facilitate ongoing informed action.

22
02Agricultural
© S
amra
t35
| Dre
amst
ime.
com

23

24
Agricultural
Managing evapotranspiration using quotas Hai Basin, China
Project Overview
The Hai Basin is home to over 120 million people and is spread over four provinces and the municipalities of Beijing and Tianjin and accounts for some 15% of China’s GDP. Water has played a pivotal role in the development of the Basin which is now facing serious water-related problems, including water pollution, water scarcity, diminishing water supplies and flooding. Water availability per capita in the Hai Basin is only 14% of the national average and about 4% of the global average. Over-exploitation of groundwater across the basin is estimated to be 9 billion cubic meters annually. The programme was developed to address the supply demand balance within the river basin, recognising the impacts downstream of the basin in the Bohai Sea ecosystem. The programme commenced in July 2004 and was completed in June 2011 and it involved the implementation of an integrated water and environmental management strategy in 16 counties. The pilot has proved successful in implementing reduced water quotas against improved water management practices, whilst supporting growth in farm incomes.
Key Elements
- Targeted reduction of consumptive water use, using water quotas supported by remote sensing (evapotranspiration).
- Institutional reform to improve co-operation across local administrations.
- Introduction of basin wide data management to improve data on water resources and to share data more effectively.
- Engagement of local communities including the use of incentives and support to farmers.
- Metering of irrigation systems to influence behaviour and to support more reliable collection of water charges.
- Legislative process to enforce irrigation quotas.
Key Outcomes
- At one location (village) water quotas reduced usage by approximately 40% (from 570 000m3/year to 350 000m3/year), whilst continuing to meet farmers’ requirements for irrigation water.
- Reductions in water use were achieved alongside increased crop productivity within the pilot areas, with associated increases in income. This was achieved by diversification and adjustment of cropping patterns.
- Falling levels of groundwater over the last 30 years have been mostly reversed, ceased or in a few cases much reduced.
- Increased understanding of water issues within local decision making.
Water StressHai Basin, China
Low (<10%)Low to med (10-20%) Med to high (20-40%)High (40-80%) Extremely high (>80%)
Arid & low water use
No data available
estimated unit cost of water
<5 ¢/m3
programme cost
$ 14 800 000
water scarcity impact
265 000 000 m3/yrvolumetric impact
Reduced withdrawal
Reduced consumption
Improved water quality
Increased productivity
Net basin benefit
Water Stress Map:Gassert, F., M. Landis, M. Luck, P. Reig, and T. Shiao. 2013. “Aqueduct Global Maps 2.0.”
Low Medium High
Confidence level
CreditsWe wish to acknowledge the input of The World Bank in the preparation of this case study.
Water Scarcity Impact Key
Main Minor

25
Intervention Features
¬ Irrigation metering ¬ Remote monitoring and sensing ¬ Replacement of channels with pipes ¬ Enforcement of quotas ¬ Institutional reform ¬ Stakeholder engagement
Project Levers
(1) Consumptive Use Quotas:
Introduction of a new concept of real water savings which targeted a reduction in consumptive use or evapotranspiration (ET). This was targeted on the basis that experience in China has shown that improvements to physical infrastructure alone can increase irrigation efficiency but can also reduce groundwater recharge by increasing the proportion of rainfall or irrigation water consumed by crops through ET.
The project introduced ET quotas or targets, which were based on the actual ET measured with remote sensing technology and models of surface water and groundwater systems. As well as setting quotas this also acted to raise understanding of real water savings and sustainable water use.
(2) Institutional measures:
Institutional mechanisms were introduced to increase cooperation among government departments. This integrated institutional management proposed horizontal (cross-sectoral) cooperation between national, provincial and county equivalent agencies. The approach also included vertical cooperation between administrative levels, within the participating organisations.
Hai Basin, China
Above: Nightscape of CCTV tower, Beijing (© Lizu Zhao | Dreamstime.com)
(3) Water Data Capture:
A basin-wide Knowledge Management (KM) System (including application of remote sensing ET measuring technology) was installed at the Hai Basin Commission and local governments. This included decentralised knowledge hubs that made it possible to share and allocate data at both basin and county levels by local governments and water use sectors within the basin.
(4) Integrated Water Management Plans:
Development and implementation of sub-basin and county-level Integrated Water and Environmental Plans (IWEMPs) to return surface and groundwater use to sustainable levels consistent with the project’s goals. This was achieved through ET quotas and targets for Water Function Zones (WFZ).
(5) Public Engagement:
Public participation was encouraged by establishing Water Users Associations (WUAs) and promoting Community Driven Development (CDD). The core value of the CDD/WUA approach was to mobilise farmers’ incentives to participate in the project design, implementation, operation and management. The communities made their own decisions on cropping pattern adjustments to ensure that water was used for higher value crops to increase farmer incomes and the water saved was allocated to restoration of ecosystems.

26
Agricultural
Outcomes and Challenges
One of the key indicators for the success of the project was the reduction of groundwater overdraft used for irrigation. Falling levels of groundwater of the last 30 years have been mostly reversed, ceased or in a few cases much reduced.
The project has also had a profound impact on the understanding of sustainable water resources management and the need to control water consumption (evapotranspiration) rather than supply.
Other impacts of the project on WUAs and farmer water users in Beijing and Tianjin include:
- Water use quotas have been much reduced, for example, in Beiguo village from 570 000m3 in 1999 to 350 000m3 in 2010. However, crop adjustments and water savings have more than compensated for this reduction. Farmers’ requirements for irrigation water have been met and time and labour inputs have been reduced.
- As a result of improved infrastructure and management, the area of irrigated crops and proportion of cash crops, use of water saving crops and varieties, yields, water productivity and incomes have all increased. For example, farmers’ income has increased from around 110 yuan/day to 220 yuan/day. In addition, labour hours for irrigation have also been reduced by around 35%.
- Water usage in Zhanglan village was reduced by 20-30% per annum after water supply was piped and power costs reduced by 25% by replacing worn out pumps. The replacement of irrigation channels with pipes has reduced the time for 1 irrigation cycle from 20-30 days to 7 days.
- The problem and difficulty of collecting water charges has been resolved through metering. Accessing funds for large scale infrastructure repairs or replacement became feasible through negotiation and making financing arrangements with village collectives.
- Women have been engaged in irrigation management. WUAs now require that women occupy more irrigation-related jobs.
- Elimination of the conflicts and disputes between users and between village leaders and villagers. As a result, the relationships have improved and, in particular, the rights and demand of the marginalised groups for water use has been satisfied.
- The skills and development of the people involved in WUAs is having wider and beneficial society impacts. It is also resulting in decision makers with water management backgrounds who appreciate the importance of water and its good management. Recent village level elections have resulted in many (about 600 of 10 000) water management agents being elected to Village Committees.
Some WUAs are still facing difficulties in implementing elements of the project. There is a need to:
- Continue to strengthen the WUA approach to water allocation, water planning, metering, water fee collection, cropping pattern adjustment, and water saving measures.
- Allow local flexibility and decision making in deciding cropping patterns within the overall water allocation so that higher water efficiency varieties of wheat and maize, which have low labour requirements, can be used.
- Involve water bureaus and township governments in ratifying the selection of water agents to reduce the negative impacts and loss of continuity that can result when village committees are changed.
Managing evapotranspiration using quotas Hai Basin, China

27
Above: Better water use and pollution controls in the Hai Basin has restored the environment and improved residents’ health and living conditions. (© World Bank)
"The project has also had a profound impact on the understanding of sustainable water resources management and the need to control water consumption rather than supply."

28
Agricultural
Irrigation management Orange-Senqu Basin, South Africa
Project Overview
Most of the Orange-Senqu Basin, shared by Lesotho, South Africa, Botswana and Namibia is arid to semi-arid. It is one of the largest basins in southern Africa and also one of the most developed. Irrigation is a major consumer of water using approximately 2.5 bilion m3/year, corresponding to 20% of the virgin mean annual runoff and 54% of total consumptive demand excluding environmental requirements. The sector is often accused of being both wasteful and relatively unproductive.
The Orange-Riet Water User Association (WUA) is situated in the Upper Orange River catchment in South Africa with the main user being the 17 050ha Orange-Riet irrigation scheme. The main crops grown are wheat and lucerne (63%), potato, groundnut, maize, oats and barley; these are difficult to grow profitably. At formation, the WUA had a major challenge to ensure the financial survival of the farmers. Difficult institutional reform combined with the application of a combination of technological and managerial best practices have left the irrigation scheme much stronger and more efficient than before. Compared to the prior situation, annual abstraction has been reduced by 7% without major capital investment by the WUA (estimated at $250 000). Limited on-farm interventions were carried out by individual farmers following the implementation of institutional and managerial reforms of the WUA.
Key Elements
- Legal and institutional reform driving the establishment of a self-sufficient Water User Association.
- High level of stakeholder consultation and participation.
- Establishment of clear rules and regulations and strict enforcement of water allocations, and scheduling.
- Advanced metering and establishment of a virtual water bank to incentivise farmers to sell unused water allocations.
- Farm led modernisation of irrigation infrastructure (centre pivot and overhead) and management systems.
- Weather forecast led scheduling and monitoring of soil moisture content.
Key Outcomes
- Improved productivity in terms of crop per drop with average yield across the scheme increasing by approximately 25% since implementation of the WUA.
- Long-term financial sustainability of the irrigation scheme is more assured and is reflected by lower rate of turnover in farm ownership and/or farmer occupancy.
- Total annual irrigation water demand reduced by 7%, down from 187 600 000m3 to 174 400 000m3.
- Development of skills and influence of those involved in the WUAs, with increased understanding of water issues within local decision making.
Water StressOrange-Senqu Basin, South Africa
Low (<10%)Low to med (10-20%) Med to high (20-40%)High (40-80%) Extremely high (>80%)
Arid & low water use
No data available
estimated unit cost of water
<5 ¢/m3
programme cost
$ 250 000
water scarcity impact
13 200 000 m3/yrvolumetric impact
Reduced withdrawal
Reduced consumption
Improved water quality
Increased productivity
Net basin benefit
Water Stress Map:Gassert, F., M. Landis, M. Luck, P. Reig, and T. Shiao. 2013. “Aqueduct Global Maps 2.0.”
Low Medium High
Confidence level
CreditsWe wish to acknowledge the input of Nic Knoetze of Orange-Reit Water User Association in the preparation of this case study.
Water Scarcity Impact Key
Main Minor

29
Intervention Features
¬ Irrigation metering ¬ Irrigation scheduling ¬ Sprinkler irrigation systems ¬ Fertigation systems ¬ Water entitlement trading ¬ Enforcement of quotas ¬ Institutional reform
Project Levers
(1) Institutional Reform:
As a result of the 1998 National Water Act, once state-owned and managed, irrigation schemes are gradually being privatised and run by WUAs. These are cooperative associations of water users that must be financially sustainable and cover the full costs of providing access to water. This can only be achieved through increasing farm productivity and improving irrigation efficiency at both the scheme and farm level.
(2) Water Management Plan:
WUAs are required to prepare annual business plans. Most significantly, these must include a Water Management Plan (WMP), which is central to implementing water conservation and water demand management. The Orange-Riet WUA’s WMP sets out benchmarks, best management practices and a manageable and affordable programme of implementation by both the water user association and irrigators.
(3) Stakeholder participation and enforcement of regulations:
A key factor behind the success of the Orange-Riet has been the high level of stakeholder participation combined with the enforcement of clear rules and regulations, accepted by all members of the WUA. Key regulations include i) making irrigators responsible for setting, opening, closing and locking of sluices and taking only their allocation; failure leading to imposition of heavy on-the-spot fines; ii) obligation of irrigators to submit annual plans; iii) recording of all crops and yields.
(4) Metering, Quotas, Water Banks:
On many schemes in South Africa farmers pay for an allocation of water according to their irrigated land. There is little incentive to save water. At the Orange-Riet all off-takes are metered. While the farmer’s allocation of water is based on his licensed irrigable land at 11 000m3/ha/year, he pays according to the water used and thanks to a virtual water bank managed by the WUA can sell his unused allocation back to the WUA.
The WUA sells a portion of this on at a premium of 30% to farmers requiring more water. Accurate metering is one of the keys to improving efficiency irrigation and reducing wastage. This is essential if water banks are to function.
(5) Irrigation Scheduling:
Transfer of the irrigation scheme to a self sufficient WUA has forced farmers to become much more efficient. The single biggest development is the widespread use of irrigation scheduling. Since most irrigators have little on-farm storage, this is only possible because the WUA operates a computerised daily water ordering system. Flows in the canal systems including the amount taken off at source are all monitored and controlled through a state-of-art telemetric system. In order to facilitate accurate scheduling there has been a move away from flood irrigation, with 90% of land now under centre pivot or fixed overhead systems. Many irrigators operate fertigation systems, have installed lysimeters and make use of customised on-line weather reports and forecasts in an effort to perfect their scheduling. The private sector plays a major role in providing technical support and credit facilities. Improved scheduling has resulted in major increases in productivity and since irrigators can sell their unused allocation back to the WUA, there is an added incentive to be water efficient. Records kept by the WUA of yields since its inception, together with detailed figures available from some farms indicate that irrigation scheduling, improved application of fertiliser and a widespread use of overhead irrigation systems have led to an overall increase in productivity of around 25%.
Outcomes and Challenges
Other impacts of the project included:
- A reduction in water consumption largely due to the presence of a virtual water bank.
- Greater accountability resulting from volumetric metered payment system.
- Increased level of awareness and expertise amongst irrigators.
- Demonstration of best practices which can be taken up by other water user associations.
Orange-Senqu Basin, South Africa
"...the farmer pays according to the water used and thanks to a virtual water bank... can sell his unused allocation back to the WUA."

30
Agricultural
Integrated watershed management Adarsha, Kothapally, India
Project Overview
Land degradation is a serious problem in many parts of the world, impacting particularly on rain-fed subsistence or semi-subsistence farming areas where the availability and quality of land and water resources is critical to survival. In India there is an urgent need to address natural resource degradation in rainfed areas. The Adarsha Watershed Management Project at Kothapally in Andrha Pradesh, implemented by a consortium of interested parties, is an example of how sustainable watershed programmes can be successfully carried out.
Kothapally village comprises 465ha of mainly cultivated undulating farmland with a population of 1 492 supported by semi-subsistence agriculture in the area. The level of resource degradation before project implementation was serious, characterised by low rainwater use efficiency, high soil erosion and a lack of soil stabilisation or infiltration enhancement mechanisms. The project has placed an emphasis on community-based integrated watershed management, engaging all tiers of the community. Interventions have resulted in improved infiltration, reduced soil loss, increased groundwater levels, improved land cover and vegetation, increased productivity, and positive changes in cropping patterns.
Key Elements
- Innovative institutional model, comprising a consortium of technical specialists, national and state government and the farmers.
- Effective farmer participation through a co-operation model, supported by wide stakeholder engagement via an active Watershed Committee.
- Delivery of community-scale infrastructure interventions, including check dams and groundwater recharge pits.
- Expert support provided to farmers on planting and cropping.
- Continuous monitoring and evaluation of the impact of the interventions, including use of GIS and remote sensing.
Key Outcomes
- Increased groundwater storage. Over the three years since project implementation, the groundwater table has risen by over four metres equivalent to nearly 1 000 000m3 of water, or 330 000m3/year.
- Reduction in soil loss, with reduced sediment load in surface runoff exiting the study area, positively impacting on downstream water quality.
- Changed cropping patterns and increased yields.
- Average 21% increase in average farming incomes; increase is higher in areas not using irrigation.
Water StressKothapally, India
Low (<10%)Low to med (10-20%) Med to high (20-40%)High (40-80%) Extremely high (>80%)
Arid & low water use
No data available
estimated unit cost of water
<5 ¢/m3
programme cost
$ 90 000
water scarcity impact
330 000 m3/yrvolumetric impact
Reduced withdrawal
Reduced consumption
Improved water quality
Increased productivity
Net basin benefit
Water Stress Map:Gassert, F., M. Landis, M. Luck, P. Reig, and T. Shiao. 2013. “Aqueduct Global Maps 2.0.”
Low Medium High
Confidence level
CreditsWe wish to acknowledge the input of International Crops Research Institute for the Semi-Arid Tropics (ICRISAT) in the preparation of this case study.
Water Scarcity Impact Key
Main Minor

31
Intervention Features
¬ Remote monitoring and sensing ¬ Furrow irrigation ¬ Groundwater recharge ¬ Institutional reform ¬ Education, technical training and capacity building ¬ Stakeholder engagement
Project Levers
(1) Institutional and financing model:
This project made use of an innovative model comprising a consortium of appropriate organisations providing technical support. The consortia included private organisations, NGOs and national/state government organisations to provide the technical input, working alongside the local community and farmers who were part of the consortium. Financing principally came from the Asian Development Bank. Low-cost labour intensive methods were used for the required soil and conservations structures. Fourteen check dams were built at a cost of $45 370, gully control structures at a cost of $3 525, mini percolation tanks at a cost of $2 090 and a 500m diversion drain and runoff diversion pipe system at a cost of $1 400.
(2) Improved integrated implementation model:
The integrated watershed management model is built on lessons learnt from the consortium’s experience. Important components included:
- the use of tools for management and evidence monitoring (GIS and remote sensing);
- an holistic approach integrating people’s livelihoods with soil and water conservation measures; a cycle was established of improved crop yields and income resulting from the soil and conservation measures which were then reinvested in additional sustained soil and conservation measures;
- the use of cost-effective, low-cost soil and water conservation measures;
- use of traditional knowledge, with an emphasis on individual farmer-based conservation measures to increase productivity.
(3) Community scale infrastructure:
Community-scale infrastructure measures included the construction or implementation of eleven check dams, ninety five gully control structures and five sunken pits to support groundwater recharge. Wasteland area (10% of total) was partially reclaimed through the planting of custard apple and other trees on field bunds to promote soil stabilisation. Further structures were planned following the end of project support.
Kothapally, India
(4) Education:
Farmer-focussed activities included education and technical support on alternative cultivation approaches including broad-bed and furrow landforms for soil and water conservation, contour planting and field bunding. Advice was also provided on improved varieties and cropping systems.
(5) Stakeholder participation:
The livelihood-based watershed management project was set up as a result of villagers proposing their involvement. There was a high level of community involvement in the project, for example the Watershed Committee included all 270 farmers and other groups were established which included women self-help groups and user groups for water harvesting structures.
(6) Continuous monitoring and evaluation:
An initial baseline survey was conducted on the socio-economic status of farmers and landless people, crop productivities, livelihood opportunities, soil, water and nutrient management practices. Continuous monitoring has been carried out jointly by researchers and community individuals to ensure that stakeholders are kept aware of progress and can relate it to the interventions made.
Outcomes and Challenges
The main outcome of the project was the increase in water resources through increased groundwater levels and a reduction in silt-laden flood runoff.
Over the three years of monitoring, groundwater levels in the area increased on average by more than 4 metres.
Other project outcomes included:
- Increased productivity and net incomes with yields (kg/ha) for maize more than doubled, for sorghum tripled and increases for intercropped pigeon pea were even higher.
- Increase in vegetation cover from 129ha pre project to 200ha near the end of the project.
- The area for cotton decreased from 200 to 100ha with a simultaneous increase in the more lucrative maize and pigeon pea. This was possible because of improved soil moisture and the availability of water for supplementary irrigation.
- Average net incomes in the project area are 21% higher than those in the adjacent area.

32
Agricultural
Irrigation scheduling in grape farming Shelanu Farm, South Africa
Project Overview
Shelanu farm is situated on the southern bank of the Orange River from which it abstracts its water supply. The rainfall precipitation in the area is 125mm per year. All of the 28.7ha are used for the growing of table grapes that can be exported mainly to the United Kingdom in November, earlier than other producers, enabling them to command a good selling price. It is a small but highly intensive farm focussing on the production of a high yielding high quality crop using modern technology. In addition, the UK supermarkets require an audited water footprint for each kg of grapes exported, so there is real pressure to minimise the volume of water abstracted per kg of grapes. This is achieved largely through optimised scheduling of irrigation water based on data automatically received from soil moisture (capacitance) probes and analysed using a sophisticated computerised monitoring and management system. Soils around the farm vary considerably and the automated system allows variable irrigation cycle time depending on soil type and soil moisture status. A combination of scheduling and other measures has permitted a reduction in irrigation water per hectare of 20%.
Key Elements
- Irrigation scheduling based on real-time soil moisture measurements and local weather forecasts and reports.
- Reduced evaporative losses through mulching and half-shade netting.
- Increased profit per unit volume of water used through a combination of technology and careful management.
- Agreement that water savings would not be used to expand irrigated areas.
- Reduced consumptive use as a result of reduced evaporative losses.
Key Outcomes
- A 20% reduction in annual water application rate from an average of 15 000m3/ha to 12 000m3/ha, a saving of 20%.
- A 20% increase in crop yields and a 21% reduction in pumping costs.
- Reduced costs resulting from minimal wastage of fertiliser into the groundwater and/or return flows.
- The net return per m3 of water has increased from an estimated $0.82/m3 to $1.31/m3.
- A 35% reduction in the water footprint of a kilogram of grape.
Water StressShelanu Farm, South Africa
Low (<10%)Low to med (10-20%) Med to high (20-40%)High (40-80%) Extremely high (>80%)
Arid & low water use
No data available
estimated unit cost of water
50 ¢/m3
capital cost
$ 215 000
water scarcity impact
86 000 m3/yrvolumetric impact
Reduced withdrawal
Reduced consumption
Improved water quality
Increased productivity
Net basin benefit
Water Stress Map:Gassert, F., M. Landis, M. Luck, P. Reig, and T. Shiao. 2013. “Aqueduct Global Maps 2.0.”
Low Medium High
Confidence level
Water Scarcity Impact Key
Main Minor

33
Intervention Features
¬ Irrigation metering ¬ Irrigation scheduling ¬ Remote monitoring and sensing ¬ Fertigation systems ¬ Micro jet irrigation ¬ Mulching ¬ Shade netting
Project Levers
(1) Irrigation scheduling:
Central to the success of operations is the irrigation scheduling designed to get appropriately fertilised water to the roots of the crops and no further, ensuring that neither water nor fertiliser is wasted. Irrigation scheduling is based on a computerised monitoring network of soil moisture (capacitance) probes and associated management system. The fully automated telemetry logging system provides continuous data and graphs on the status of soil moisture, climatic conditions and irrigation requirements. Each probe serves an area of 2.5ha and provides readings at 10cm intervals down to a 120cm depth.
(2) Reduced evaporative losses:
The efficiency of the system is enhanced by inter-row mulching with wheat, reducing direct evaporation from the inter-row and soil temperature. The erection of a shade-cloth canopy modifies the micro-environment around the crop by reducing ambient temperature, increasing humidity and reducing air movement. These micro-environment modifications result in improved growing conditions for the crop as well as protection from bird damage.
(3) Micro-jet irrigation:
An automated micro-jet irrigation system has been installed and arguably provides the most efficient system for grape vines especially since temperatures are high. The efficiency of the system is illustrated by irrigation application rates as low as 35mm/week compared with 50-55mm at other similar schemes. All irrigation water is supplied through a central pumping and fertigation station.
(4) Accurate measurement:
Accurate measurement of irrigation water, including fertiliser application concentrations is facilitated by the use of a central pumping and fertigation station. Measurement and monitoring and evaluation of water use and associated yields are characteristics of the high level of management at the farm.
Outcomes and Challenges
Upgrading operations at the farm have resulted in both a significant reduction in the water used and a significant increase in productivity. Prior to upgrading, the full licensed quota of 430 500m3/yr was abstracted, corresponding to an application rate of 15 000m3/ha. Now only 12 000m3/ha is used, or 344 400m3/yr, a saving of 20%. The end result is that the water footprint for each unit of grapes produced has been reduced by 35%. The net return per unit of water used has been increased by nearly 38%. Irrigated areas have not been extended.
The use of agronomic practices of a high standard, such as the “fertigation” system using soluble fertilisers applied through the carefully scheduled irrigation system and mulching, have all contributed to a high level of overall efficiency. The precise irrigation requirement applied together with a precise nutrient requirement has minimised losses through leaching of both irrigation water and expensive fertilisers which otherwise would contribute to nutrification and salinisation of ground water and downstream surface water.
Shelanu Farm is a small and compact operation that makes use of the latest technology, the expert support of the commercial sector and a high level of management to achieve major savings and high productivity.
Orange River, South Africa
Above: Panoramic view of Shelanu Farm (© Steve Crerar)
34
Agricultural
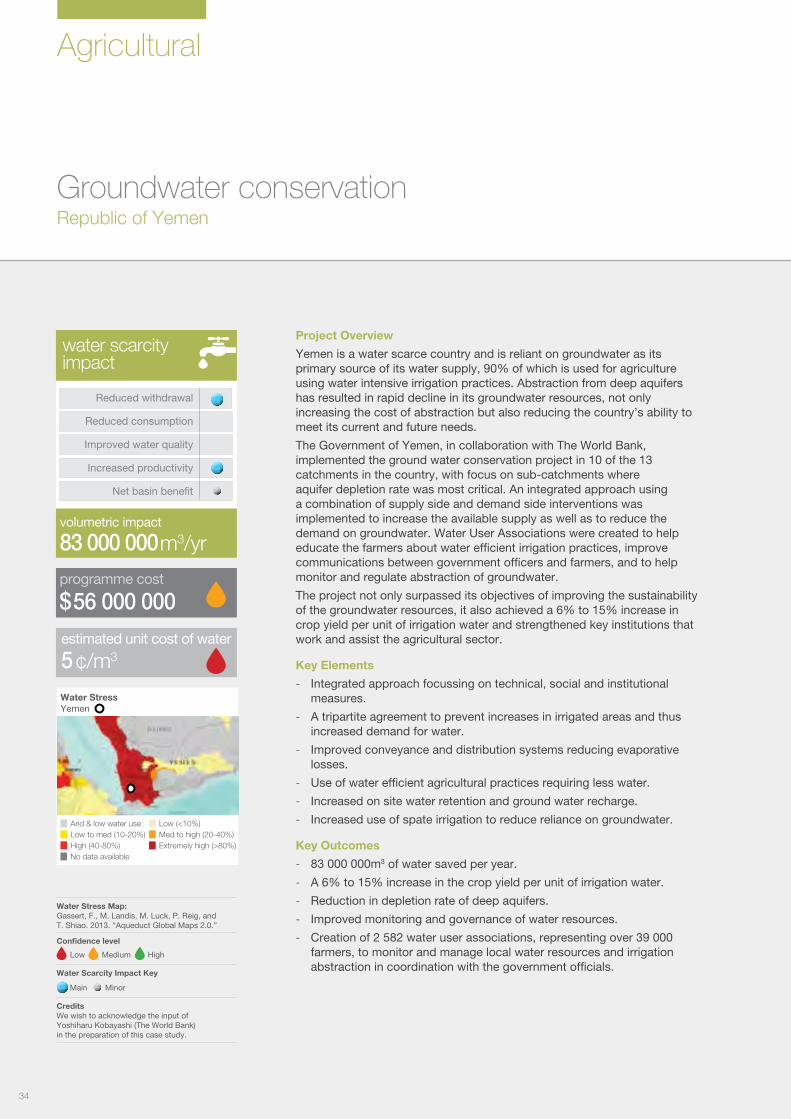
Groundwater conservation Republic of Yemen
Project Overview
Yemen is a water scarce country and is reliant on groundwater as its primary source of its water supply, 90% of which is used for agriculture using water intensive irrigation practices. Abstraction from deep aquifers has resulted in rapid decline in its groundwater resources, not only increasing the cost of abstraction but also reducing the country’s ability to meet its current and future needs.
The Government of Yemen, in collaboration with The World Bank, implemented the ground water conservation project in 10 of the 13 catchments in the country, with focus on sub-catchments where aquifer depletion rate was most critical. An integrated approach using a combination of supply side and demand side interventions was implemented to increase the available supply as well as to reduce the demand on groundwater. Water User Associations were created to help educate the farmers about water efficient irrigation practices, improve communications between government officers and farmers, and to help monitor and regulate abstraction of groundwater.
The project not only surpassed its objectives of improving the sustainability of the groundwater resources, it also achieved a 6% to 15% increase in crop yield per unit of irrigation water and strengthened key institutions that work and assist the agricultural sector.
Key Elements
- Integrated approach focussing on technical, social and institutional measures.
- A tripartite agreement to prevent increases in irrigated areas and thus increased demand for water.
- Improved conveyance and distribution systems reducing evaporative losses.
- Use of water efficient agricultural practices requiring less water.
- Increased on site water retention and ground water recharge.
- Increased use of spate irrigation to reduce reliance on groundwater.
Key Outcomes
- 83 000 000m3 of water saved per year.
- A 6% to 15% increase in the crop yield per unit of irrigation water.
- Reduction in depletion rate of deep aquifers.
- Improved monitoring and governance of water resources.
- Creation of 2 582 water user associations, representing over 39 000 farmers, to monitor and manage local water resources and irrigation abstraction in coordination with the government officials.
Water StressYemen
Low (<10%)Low to med (10-20%) Med to high (20-40%)High (40-80%) Extremely high (>80%)
Arid & low water use
No data available
estimated unit cost of water
5 ¢/m3
programme cost
$ 56 000 000
water scarcity impact
83 000 000 m3/yrvolumetric impact
Reduced withdrawal
Reduced consumption
Improved water quality
Increased productivity
Net basin benefit
Water Stress Map:Gassert, F., M. Landis, M. Luck, P. Reig, and T. Shiao. 2013. “Aqueduct Global Maps 2.0.”
Low Medium High
Confidence level
CreditsWe wish to acknowledge the input of Yoshiharu Kobayashi (The World Bank) in the preparation of this case study.
Water Scarcity Impact Key
Main Minor

35
Intervention Features
¬ Sprinkler irrigation systems ¬ Bubbler irrigation systems ¬ Drip irrigation systems ¬ Replacement of channels with pipes ¬ Groundwater recharge ¬ Rainwater harvesting ¬ Institutional reform ¬ Education, technical training and capacity building ¬ Stakeholder engagement
Project Levers
The project was financed with a mixture of loans ($40m), grants ($15m) and from a trust fund ($1m) and focussed on a combination of supply side and demand side interventions.
(1) Improvements to water distribution system:
Above ground galvanised iron pipes and below ground PVC pipes replaced open channels to reduce losses due to evaporation and leakage, and improved the water distribution in 27 000 ha of irrigated land.
(2) Installation of water efficient irrigation system:
Drip, bubbler and sprinkler irrigation systems were installed in some of the fields to reduce the volume of water that was previously lost through water intensive irrigation practices.
(3) Improvement of spate irrigation schemes:
A large area is irrigated through seasonal floodwaters (spate irrigation). New embankments were constructed and existing embankments structurally improved to help retain the water on the fields.
(4) Rainwater harvesting schemes:
The provision of water supplies for use by people and animals was improved by construction of on-farm storage ponds and underground cisterns for rainwater harvesting.
(5) Groundwater recharge schemes:
Existing upland terrace walls and water harvesting dams and ponds were rehabilitated and new ones constructed to improve ground water recharge through increased retention and infiltration of overland flows.
(6) Monitoring of groundwater levels and abstractions:
Ground water monitoring levels and borehole flow meters were installed to monitor and regulate abstraction of groundwater. This helped farmers understand the relationship between abstraction and ground water levels and improved enforcement capabilities.
7) Institutional strengthening of water institutions:
Training of the field officers helped to strengthen the irrigation policy formulation units in the Ministry of Agriculture and Irrigation and the Central Water Monitoring Unit. An Irrigation Advisory Service was created within the Ministry to assist field officers with the on-farm monitoring and liaison with Water User Associations.
Republic of Yemen
Above: Agricultural terraces near At Tawilah, Yemen (© Bernard Gagnon, Wikipedia - creative commons)
(8) Creation of Water User Associations:
Water User Associations were created to educate farmers and to provide a forum for open communication about local water issues. They were also provided withdata from the local groundwater monitors and borehole flowmeters to assist the field officers to monitor and regulate the abstraction.
(9) Tripartite agreement to prevent extension of irrigated area:
To ensure the farmers did not increase the extent of their irrigated area with the saved water, a tripartite agreement was made between beneficiary farmers, project field offices and the local Water User Association.
Outcomes and Challenges
The project achieved between 6% to 15% increase in crop yields with reduced water use. It also achieved annual savings of 83 000 000m3 surpassing its initial objective of 47 000 000m3. These savings were achieved through a combination of supply side and demand side measures.
The improvements in groundwater levels and lack of increase in irrigated land, as validated by satellite imagery, have confirmed the effectiveness of the Water Use Association in helping to regulate local water abstraction and expansion of irrigated land.

36
Agricultural
Pilot low cost irrigation schedulingPunjab, India
Project overview
Punjab, a state located in the northwest of India, produces 20% of the nation’s wheat, 11% of its rice and 11% of its cotton from only 1.5% of its geographical area. Since 1970, Punjab has seen growth in its agricultural production, however, this growth has been dependent on increasing exploitation of groundwater for irrigation. The over exploitation of groundwater has resulted in a drop in the water table by almost 80%. The abstraction is perceived to be threatening national food security.
Punjab is a major source of rice and wheat for the national food and procurement distribution system. A flat rate per unit of power for irrigation was offered by the state government leading to excessive volumes of water being used in rice irrigation. The Columbia Water Centre and Punjab Agricultural University have researched how to save water in rice cultivation. The investigation was undertaken with the intention to find a solution that farmers could implement into their farming methods in order to reduce water consumption and then, in the future, to seek a scaling up of that strategy. Tensiometers were trialled and made attractive to farmers through a structured field test. 5 306 farmers have participated in the trial from 2010 to 2013 tensiometer over the last three years. The results of the trials could then be used to predict water savings on a much larger scale.
Key Elements
- Use of tensiometers to measure soil moisture content and guide irrigation scheduling.
- The project was funded by the PepsiCo Foundation as part of a multi-country initiative.
Key Outcomes
- 5 306 farmers have participated in the trials from 2010 to 2013.
- 2 795 farmers (53%) carried through to the end of the trials.
- Water usage by participated farmers was reduced from 3 448 000m3 to 2 800 000m3 over 3 years.
- 19% reduction in withdrawals which also led to a 24% mean reduction in energy use per acre.
Water StressPunjab, India
Low (<10%)Low to med (10-20%) Med to high (20-40%)High (40-80%) Extremely high (>80%)
Arid & low water use
No data available
estimated unit cost of water
30 ¢/m3
programme cost
$ 660 835
water scarcity impact
216 000 m3/yrvolumetric impact
Reduced withdrawal
Reduced consumption
Improved water quality
Increased productivity
Net basin benefit
Water Stress Map:Gassert, F., M. Landis, M. Luck, P. Reig, and T. Shiao. 2013. “Aqueduct Global Maps 2.0.”
Low Medium High
Confidence level
CreditsWe would like to acknowledge the input of Shama Perveen, Director at Columbia Water Centre for her contribution to this case study.
Water Scarcity Impact Key
Main Minor

37
Punjab, India
Intervention Features
¬ Irrigation scheduling ¬ Soil moisture content monitoring
Project Levers
(1) Installation of technology:
Tensiometers are designed to give estimates of soil moisture content and indicate when irrigation is required to maintain crop growth. The aim is to eliminate any ‘guess work’ for when the crop needs to be watered and therefore reducing the volume of irrigation water that is used and promoting better crop health.
Tensiometers consist of a sealed, water-filled tube with a ceramic porous cup and vacuum gauge at the top. The water level in the tube goes down as the moisture content of the soil decreases. Irrigation is required when the moisture level reaches a specific point depending upon the crop that is being grown.
One acre of land per farmer was used for the test where half the land was devoted to the test and the other half used existing practices. Flood irrigation was the most common practice in the region which takes place when the electricity is on. The results were determined from the comparison of crop yield. One tensiometer was required per acre of land at a cost of 300 rupees ($6). These tensiometers were developed by the Punjab Agricultural University whereby the gauge had three bands, red, yellow and green to indicate the moisture content. They were calibrated for specific crops, in this case rice. Standard tensiometers ranged in cost from $40-$200. Frequency and duration of irrigation was recorded by each farmer as well as the rice yield from their trial plots.
Outcomes and Challenges
Due to energy costs for irrigation being subsidised there is little incentive for farmers to save water. This is however changing due to increasing cost of groundwater abstraction as a result of the falling water table. Farmers are aware of the impacts of climate change and the decrease in the water table and saw the need to use water more efficiently. 34% of the trialing farmers followed through to the end of the trials. Initially, this was mainly due to technical difficulties with the tensiometers, however, these problems were soon rectified. There was also a spell of excess rainfall which meant some farmers did not see the need to trial the tensiometers and in a few cases, tensiometers were stolen from the farms meaning the trial could not be completed. Adopted irrigation scheduling guided by these simple and affordable tensiometers would reduce the application of irrigation water of 1 050m3 of water per hectare per year.
The opportunities for up scaling this study and demonstrably addressing the falling groundwater table need to be investigated further and the impact of reduced return flows considered. The project demonstrated that the provision of a simple affordable tool can aid irrigation scheduling. However its full effectiveness will depend upon parallel development of options that create either a legislative environment that prevents overexploitation of water resources through enforced allocations or opportunities to increase the attractiveness of other less water intensive crops. Some of the options identified by the study are shown below.
Above: Tensiometer use in Punjab (© Columbia Water Center, NY)
Above: Pepsico Foundation & Columbia Water Centre proposals for future development (© Columbia Water Center, NY)
Phase 1:Engaged >5000 farmers in dis-
tricts + corpora-tions
Offer price guarantee & Procurement for low
water use crops
Promote direct seeding of rice
Tensiometer-based irrigation application
Maintain or increase farmer
income
Reduce water use by >30%
Reduce energy use for pumping
Develop modern agricultural
supply chain
Reverse groundwater decline
Improve state & farm economy & energy
reliability

38
Agricultural
Improved water distribution managementLower Vaal River Catchment, South Africa
Project Overview
The 29 181ha VaalHarts irrigation scheme is the largest in South Africa and is situated on the confluence of the Harts and Vaal Rivers in the Lower Vaal River catchment. It draws water from the VaalHarts weir which is fed by water released from Bloemhof Dam. Any savings that can be made on demand from the Vaal River are critical. Implementation of further inter-basin transfers from the Senqu River in Lesotho in order to augment the stretched resources of the Vaal River are planned, but this will take at least ten years. In the meantime, there is major drive to reduce pressure on this important water source which supplies water to much of South Africa’s industrial and commercial heartland.
The Water Use Association (WUA) manages the distribution of irrigation water to hundreds of farmers via over 1 120km of ageing canals and 1 873 abstraction points. As one of the first irrigation schemes to be handed over by the Government to the private sector, the WUA faced the challenge of self-sufficiency in a testing environment. Difficult institutional reform combined with critical self examination of operation and management practices have led to improved efficiency and significant water savings when faced with a lack of adequate funding for more expensive infrastructure improvements.
Farmers are allocated 9 140m3/ha with an abstraction permit based on their hectare entitlement and in order to meet this demand the WUA had to release 12 065m3/ha into the irrigation system. The WUA implemented a Water Administration System (WAS) tailored for the management of irrigation scheme water distribution systems to reduce losses and this enabled the water released into the system to be reduced to 11 580m3/ha, a saving of 14 150 000 m3/year.
Key Elements
- Legal and institutional reform driving self-sufficiency and on-farm sustainability.
- Implementation of WAS, an integrated water management system for irrigation schemes.
- Improved accuracy of monitoring.
- Introduction of improved water scheduling by farmers.
Key Outcomes
- Improved competitiveness of overall irrigation scheme and sustainability of WUA.
- Reduction in water used by existing irrigation scheme.
- Improved crop yields and productive use per unit of water abstracted.
- WUA personnel freed up for more critical day to day tasks.
Water StressVaalharts irrigation scheme, South Africa
Low (<10%)Low to med (10-20%) Med to high (20-40%)High (40-80%) Extremely high (>80%)
Arid & low water use
No data available
estimated unit cost of water
<5 ¢/m3
capital cost
$ 148 000
water scarcity impact
14 150 000 m3/yrvolumetric impact
Reduced withdrawal
Reduced consumption
Improved water quality
Increased productivity
Net basin benefit
Water Stress Map:Gassert, F., M. Landis, M. Luck, P. Reig, and T. Shiao. 2013. “Aqueduct Global Maps 2.0.”
Low Medium High
Confidence level
Water Scarcity Impact Key
Main Minor

39
Intervention Features
¬ Irrigation metering ¬ Irrigation scheduling ¬ Remote monitoring and sensing ¬ Sprinkler irrigation systems ¬ Fertigation systems ¬ Micro jet irrigation ¬ Drip irrigation systems ¬ Institutional reform ¬ Stakeholder engagement
Project Levers
(1) Water Use Associations:
WUAs are effectively cooperative associations of water users wishing to undertake water-related activities for mutual benefit. The WUA must cover the full financial costs of providing access to water and thus there is an onus on the WUA to be sustainable. This can only be achieved through increasing productivity and improving efficiency at both the scheme and farm level.
(2) Improved water distribution management:
The WAS was developed for irrigation schemes in South Africa such as the Vaalharts scheme. It assists WUAs to manage their water accounts and their water supply to farmers. Prior to its implementation all water orders and balances were captured and calculated manually. The WAS provides seven modules: administration, water order, measured data, water release, crop water use, accounts and reporting modules. For the system to work properly the monitoring system had to be improved and automated with the installation of continuous water level recorders installed at canal tail ends and in most feeder canals. This enables water to be released at the right time for the chosen crops and its use to be monitored and enforced.
(3) Irrigation scheduling and systems:
Transfer of the irrigation scheme to a WUA and the concomitant need to be self-sufficient has forced farmers to become much more efficient. Implementation of the WAS has made it possible for farmers to greatly improve their water scheduling practices since they can place their water orders more precisely and more frequently. 60% of the farmers have moved away from flood irrigation with 40% remaining under this system. 40% now use centre-pivot and 20% use other systems such as micro and drip irrigation. This has allowed irrigators to introduce fertigation systems, and while water savings may not be significant, crop yields have increased substantially. Due to salinity problems in some areas it is likely that flood irrigation will remain the only viable system for many farmers since it is only this method that can leach out the salts. Where flood irrigation is still practised, the careful laser levelling of fields has increasingly become the norm ensuring that irrigation water is evenly distributed around the fields.
Outcomes and Challenges
The main outcome of introduction of the WAS and associated measures has been more accurate and efficient irrigation scheduling and this has led to a reduction of between 4% and 5% in the overall water abstracted from the Bloemhof Dam, estimated at 14 150 000m3/year. Other benefits include:
- increased productivity as a result of improved scheduling;
- improved practices including increased use of fertigation systems and the replacement of flood irrigation by overhead, microjet and drip irrigation systems where possible;
- greater accountability of the WUA resulting from a much improved monitoring system;
- increased level of awareness and expertise amongst irrigators;
- demonstration of best practices which can be taken up by other water user associations.
The challenges encountered include:
- keeping infrastructure maintenance up with technological improvements. Most of the scheme’s infrastructure is more than sixty years old and leaking canals are a huge issue. Finding the required capital injection is a major challenge but the WUA has a prioritised schedule to implement when the required financing can be sourced;
- maintaining the required levels of technical expertise within the WUA management team.
Lower Vaal Catchment, South Africa
Above: Start of a 113km canal in the Lower Vaal River Catchment (© VaalHarts Water User Association)

40
Agricultural
Water reclamation for reuse and groundwater rechargeOrange County, Florida, USA
Project Overview
The Conserv II project was developed in partnership by City of Orlando and Orange County to upgrade the wastewater treatment systems in order to comply with a court decision and cease discharge of treated municipal wastewater into watercourses draining into Lake Tohopekaliga. The objective of the court decision was to improve water quality of Shingle Creek, Lake Tohopekaliga and its adjacent nature reserves that were being affected by municipal wastewater discharges.
The $344m project was designed in collaboration with the US Environmental Protection Agency (EPA). It included upgrades to the municipal wastewater treatment plant, construction of a new reclaimed water distribution network and construction of Rapid Infiltration Basins for groundwater recharge.
Almost 60% of the reclaimed water is used for irrigating landscapes in golf courses and local parks, and for irrigating 1 300ha of citrus orchards that previously used groundwater sources. Around 40% of the reclaimed water is used to recharge the surficial aquifers via 81ha of Rapid Infiltration Basins (RIBs).
To encourage use by citrus farmers, an agreement was forged with early entrants to the project to provide the reclaimed water free of charge for a 20year period. This reduced the groundwater demand of citrus orchards and increased recharge of the Floridian Aquifer System which is the sole source of potable water in central Florida.
Key Elements
- Wastewater reclamation for irrigation and ground water recharge.
- $344 000 000 project cost financed through municipal bonds and a grant from the US EPA.
- The capital and operating expense is serviced by charges for treating municipal wastewater and from sale of reclaimed water.
- Construction of Rapid Infiltration Basins to enhance the recharge of the Floridian Aquifer System.
- Treatment and re-use of waste water flows that would have otherwise discharged to Shingle Creek, and hence Tohopekaliga.
- Principal source of water supply is groundwater.
Key Outcomes
- Eliminated discharges to Lake Tohopekaliga improving its water quality.
- Total volume of reclaimed water 58 million m3 per year utilised as follows:
- 23 million m3 of aquifer recharge through rapid infiltration basins.
- 25 million m3 of reclaimed water used by citrus farmers instead of abstracted groundwater.
- 10 million m3 of water used to supply golf courses, amusement parks, and residential and commercial users.
- Storage in the aquifer reduces the evaporative losses (consumptive use) from water that would have otherwise remained as surface water.
- For each unit of water abstracted from the original source a greater productive output is achieved.
Water StressOrange County, Florida
Low (<10%)Low to med (10-20%) Med to high (20-40%)High (40-80%) Extremely high (>80%)
Arid & low water use
No data available
estimated unit cost of water
45 ¢/m3
capital cost
$ 344 000 000
water scarcity impact
58 000 000 m3/yrvolumetric impact
Reduced withdrawal
Reduced consumption
Improved water quality
Increased productivity
Net basin benefit
Water Stress Map:Gassert, F., M. Landis, M. Luck, P. Reig, and T. Shiao. 2013. “Aqueduct Global Maps 2.0.”
Low Medium High
Confidence level
CreditsWe wish to acknowledge the input of Mike Infurmar of the Water Reuse Association in the preparation of this case study.
Water Scarcity Impact Key
Main Minor

41
Florida, USA
Intervention Features
¬ Groundwater recharge ¬ Wastewater reuse for agriculture ¬ Non-potable water distribution system ¬ Reduced water rates for reclaimed water
Project Levers
The project was primarily funded by the City of Orlando and Orange County administrations, with 36% of the project cost covered by a US EPA grant.
(1) Advanced wastewater treatment:
The treatment measures employed at the plant include equalisation basins, biological nutrient removal, clarification, filtration and ultraviolet disinfection. The reclaimed water is consistently within drinking water standards for all chemical constituents, including heavy metals.
(2) Reclaimed water supply network:
An extensive pipe network was constructed to convey the reclaimed water from the Conserv II Distribution Center to various users. Although the system has a peak conveyance capacity of 284 000m3/day to cater for future growth in demand, the incoming wastewater flows limit the current reclaimed water supply to 159 000m3/day.
(3) Multiple users for reclaimed water:
The reclaimed water is supplied to residential and commercial users for landscape irrigation, evaporative cooling, and to citrus farmers for irrigating the orchards. The volume not consumed by these users is discharged to rapid infiltration basins for aquifer recharge.
(4) Free supply to citrus farmers:
Reclaimed water was supplied for free to citrus farmers for a period of 20 years, provided they became early participants and applied reclaimed water to the orchards in large volumes to aid groundwater recharge. This incentive helped to save the initial capital expense of additional rapid infiltration basins and provided a productive use for the treated wastewater. The agreement was extended in 2010 for a further five years, following which reclaimed water will be charged at ¢5/m3 to all the citrus farmers.
(5) Monetary incentives for users:
Reclaimed water rates for residential and commercial users are lower than the charges for municipal potable water supply. The primary incentive for citrus farmers was in the reduced cost of maintaining and operating their own groundwater abstraction systems. The rates are set lower for the citrus farmers than other commercial users, as the orchards help with infiltration of reclaimed water. The comparison of water rates in 2012 is shown in the adjacent table.
Outcomes and Challenges
The direct discharges of treated municipal wastewater into Lake Tohopekaliga stopped following completion of the project, thereby complying with the court decision. Studies comparing the environmental conditions have also shown improved water quality in Lake Tohopekaliga.
Reclaimed water provides a reliable and secure supply to the local citrus farmers and has helped them avoid crop failure due to recent droughts. Its use in citrus orchards has helped to reduce direct agricultural groundwater abstraction in the Orange County from 59 412 000m3 in 1985 to 33 057 000m3 in 2005.
Significant outreach was necessary to convince citrus farmers to accept reclaimed water for crop irrigation. They only accepted on the basis of research supporting the efficiancy of the nutrient rich reclaimed water and having been offered reclaimed water at no cost for a twenty year period.
The use of reclaimed water helped increase tree growth and deliver higher fruit crop. The application of large amounts of reclaimed water has helped to increase fruit weight and juice content by 5% in comparison to orchards irrigated with groundwater.
The use of reclaimed water by orchard farmers and discharge into infiltration basins has helped increase groundwater levels by up to 1 200mm in parts of the aquifer. However, overall groundwater levels continue to fall as a result of increased abstraction to meet the water demand of a growing population.
Water Use(in m3)
Potable Water ($ per m3)
Reclaimed Water
($ per m3)
Residential
Up to 11.3 0.28
0.20
11.3 to 37.8 0.38
37.8 to 75.7 0.75
75.7 to 113.5 1.50
Above 113.5 3.00
Commercial
Up to 37.8 0.38
0.1237.8 to 75.7 0.75
75.7 to 113.5 1.50
Above 113.5 3.00
Citrus Farmers - - 0.05

42
Improving water availability through wastewater treatmentSegura River, Spain
Project Overview
The Segura River is about 350km long and flows from west to east discharging in to the Mediterranean on Spain’s east coast. The river passes through the entire region of Murcia which has the lowest annual rainfall in the European regions yet a population of over two million. The basin experiences an acute supply-demand imbalance as illustrated by the water scarcity index with demand exceeding the natural stream flow by 2.5 times; consequently water that is available in the river is of extremely poor quality thus further reducing resource availability. The basin is supplemented by an inter-catchment transfer from the Tajo river and desalination. Of a total demand of 1 900 million m3/yr, 87% is for agricultural use and 10% for municipal use.
This project, implemented over a 10-year period, improves available resource through the capture and treatment of urban and industrial waste water flows and returning them for direct or indirect re-use in irrigation. A key element to the project’s success was the enaction of policy and legislation that enforces the “Polluter Pays” principle; this enabled waste water treatment and recovery to be operated on a cost recovery basis.
Key Elements
- Transfer of the mandate for wastewater collection and treatment from municipalities to a region wide General Directorate of Water.
- Establishment of Esamur, an independent agency for operation and maintenance of treatment facilities and collection of waste water levies.
- Construction of 97 advanced waste water treatment plants.
- Construction of 350km of sewer.
- Introduction of a robust system for the monitoring of industrial discharges to sewers.
- Implementation of industrial wastewater treatment at source.
- 75-80% co-funding from European Funds.
Key Outcomes
- 100 000 000m3/year of wastewater return flows that were previously unusable now treated and made available.
- Ability to meet 6% of irrigation demand.
- Connection of 99% of urban areas to sewers.
- Substantial increase in river water quality; reduction in Biological Oxygen Demand (BOD) by 95%.
- Cost recovery achieved for long term operation of treatment works.
- Negligible discharge of untreated industrial waste to public sewers.
- Compliance with the European Union Urban Wastewater Treatment Directive.
- An improvement in the river and near-river environment for the people of Murcia.
Agricultural
Water StressSegura River, Spain
Low (<10%)Low to med (10-20%) Med to high (20-40%)High (40-80%) Extremely high (>80%)
Arid & low water use
No data available
estimated unit cost of water
65 ¢/m3
capital cost
$ 917 000 000
water scarcity impact
100 000 000 m3/yrvolumetric impact
Reduced withdrawal
Reduced consumption
Improved water quality
Increased productivity
Net basin benefit
Water Stress Map:Gassert, F., M. Landis, M. Luck, P. Reig, and T. Shiao. 2013. “Aqueduct Global Maps 2.0.”
Low Medium High
Confidence level
CreditsWe wish to acknowledge the input and support of the Confederación Hidrográfica del Segura Press Office, Ministerio de Agricultura, Alimentación y Medio Ambiente in the preparation of this case study.
Water Scarcity Impact Key
Main Minor

43
Intervention Features
¬ Remote monitoring and sensing ¬ Wastewater reuse for agriculture ¬ Improvement in water quality ¬ Institutional reform
Project Levers
(1) Construction of a region-wide wastewater collection and treatment system:
All 97 advanced wastewater treatment plants were designed to allow nutrient removal and, where necessary, tertiary processing to minimise concentrations of suspended solids and disinfect the reclaimed output. This was done to improve environmental quality and safety for direct and indirect reuse.
By 2010, the wastewater collecting system connected 99% of the urban population of Murcia region to the corresponding treatment plants. Approximately 350km of sewers have been built.
(2) Establishment of institutional structures:
A regional authority has been established to implement the project and is responsible for the ongoing operation and maintenance of the works. The authority is funded through a Wastewater Reclamation Levy. This is a change from the previous structure where municipalities were responsible for waste water treatment and collection.
The Segura River Basin Authority is responsible for the monitoring of the Segura River's water quality and enforcement of regulations on parties discharging to the river.
(3) Discharge monitoring:
Each waste water treatment plant has been established with continuous monitoring of inputs and outputs. This helps monitor discharge to sewers by industries as well as effluent discharge to the river. The monitoring as well as the operation and maintenance of the plants are funded by the Waste Water Reclamation Levy.
(4) Facilitation of industrial wastewater treatment at source:
The application of a ‘Waste Water Reclamation Levy’ on discharges to the public sewer system has encouraged industries to increasingly treat waste water at source thus reducing load on the public sewers and avoiding discharge of untreated waste to the river system.
Outcomes and Challenges
- Wastewater reusehigh recovery rates In 2010 the actual treated volume was 110 million m3, of which 100 million m3 was reused in irrigation, either directly or after discharge and subsequent downstream abstraction from river.
- Reduction in pollution The water quality in the Segura River has dramatically improved as a result of higher compliance by industry to discharge regulations.
- Wetlands recovery Over the years wetlands which were adversely affected have been restored by the implementation of the project. Some of the wastewater treatment plants are built on sites of old lagoon treatment systems. Some of the renewed lagoons are used for storage of treated water prior to use for irrigation. These have now become resting places for thousands of migrating birds.
Segura River, Spain
Above: Advanced wastewater treatment plant in the Murcia region (© Confederación Hidrográfica del Segura Press Office)

44
Irrigation network renewal North Victoria, Australia
Project Overview
The Golburn-Murray Irrigation District (GMID) covers 68 000km2 in the upper Murray Catchment and is Australia’s most extensive irrigation network with water drawn from the Murray and Goulburn Rivers. Parts of the irrigation system were antiquated with inefficiencies in the water supply system due to leakage, and inefficient farming practices, resulting in high water use. The North Victoria Irrigation Renewal Project (NVIRP) covers 85% of GMID area, and was established to reduce leakage in the irrigation water supply system and improve the efficiency of on-farm irrigation systems. The $1 229m project was funded by Government of Victoria ($737 000 000), Melbourne Water ($369 000 000), and Golburn-Murray Water ($123 000 000).
The project involved lining of channels, automation of flow control structures, metering of supply points and installation of remote sensing and control systems on the flow control structures and farm supply points. The water entitlement trading helped transition from inefficient practices and low value crops to efficient practices and higher value crops, improving the economic productivity of the district.
These improvements reduced the agricultural water withdrawal within the GMID without affecting crop production, reduced evaporative loss by 1 690 000m3/year and made available 204 387 000m3 of water for environmental flows, municipal water use and additional agricultural use.
Key Elements
- Improvements to water supply system with real-time monitoring and control of flows.
- Lining of main channel, improvement of on-farm channels or replacement with piped systems.
- Installation of sprinkler and drip irrigation system to improve application of water to crops.
- Central data repository of irrigation system flows and abstractions.
- Real-time trading of water entitlements by farmers.
Key Outcomes
- Improved channel water supply efficiency from 79% to 92%, based on volumes of water delivered.
- Enabled real-time monitoring of water supplies in the system and abstraction by users.
- Decoupled water allocation from land and creation of Water Entitlement Entities (WEE).
- Enabled real-time trading of the water entitlements by the WEEs.
- 204 387 000 m3 reduction in agricultural water withdrawal due to reduced evaporative losses and reduced return flow.
- Small reduction in consumptive use through reduced evaporative losses (1 690 000m3/year)
Agricultural
Water StressNorth Victoria, Australia
Low (<10%)Low to med (10-20%) Med to high (20-40%)High (40-80%) Extremely high (>80%)
Arid & low water use
No data available
estimated unit cost of water
40 ¢/m3
capital cost
$ 1 229 000 000
water scarcity impact
204 387 000 m3/yrvolumetric impact
Reduced withdrawal
Reduced consumption
Improved water quality
Increased productivity
Net basin benefit
Water Stress Map:Gassert, F., M. Landis, M. Luck, P. Reig, and T. Shiao. 2013. “Aqueduct Global Maps 2.0.”
Low Medium High
Confidence level
Water Scarcity Impact Key
Main Minor

45
Intervention Features
¬ Irrigation metering ¬ Remote monitoring and sensing ¬ Sprinkler irrigation systems ¬ Drip irrigation systems ¬ Replacement of channels with pipes ¬ Lining of irrigation channels ¬ Water entitlement trading
Project Levers
(1) Irrigation control systems:
Open channel irrigation control systems with automated control gates with real-time monitoring were installed. These upgrades enable remote operation of control structures to divert flows. The remote sensing equipment enables accurate measurements of flows and demand in real-time.
(2) Channel remediation and bed lining:
Almost 130km of earth bed channels were lined with High Density Polyethylene (HDPE) liners to reduce the amount of water leaking out of the irrigation water supply.
(3) On-farm distribution system improvement:
On-farm channels were improved or replaced with piped systems to reduce the leakage. The piped system also enables installation of meters and improvement to the on-farm irrigation systems with sprinklers and drip irrigation.
(4) Irrigator supply point improvement and metering:
Improvements were made to flume gates and automated controls were installed. Outfalls were refurbished or replaced and new meters incorporating automatic controls were installed. Both these measures enable real-time monitoring and control of water supply into the farms. Central monitoring of flows also provides the ability to validate the abstracted volumes.
(5) Sprinkler and drip irrigation systems:
Sprinkler and drip irrigation systems were installed to reduce on-farm water use. Altering the flow rates of sprinkler and drip irrigation system allows the farmer to ensure that water application does not exceed the soil infiltration rate and is sufficient to meet peak water requirements of the target crops.
(6) Water entitlements trading:
The water trading market has been in operation for 50 years, but the upgrades to the irrigation system enabled real-time trading of water entitlements. Farmers can transfer their entitlement permanently or trade a portion of the entitlement as a timed allocation. The timed allocation frees up the resources, helps set the price for water and enables farmers to purchase additional entitlements when necessary.
Outcomes and Challenges
The improvements to the irrigation system have increased distribution efficiency by reducing leakages, better monitoring and control of abstractions, more accurate metering of consumption by the users and enabling real-time trading of water entitlements. The monitoring of flows and abstraction data is stored on a central server, which allows monitoring of the farm abstraction volumes and the performance of the irrigation system. It also allows the audit of reductions in withdrawals achieved as a result of the project.
The installation of automated gates and new meters enable monitoring and control of water supply from the system to the farmers. The reduced withdrawals achieved by each measure are presented in the table below.
The improved monitoring of flows and the water trading system has enabled the transfer of entitlements from inefficient farming practices and low value crops to more efficient farming practices and higher value crops. It has enabled individual farmers to consider their own circumstances and water needs and adjust their allocations via real-time trading. In 2010-11, the Water Entitlement Entities in the GMID traded a total 24 610 000m3 of entitlements. It has also encouraged inefficient farmers to improve efficiency or leave the industry.
The improvements to the irrigation system have reduced evaporative losses by 1 690 000m3/yr and increased channel water supply efficiency from 79 to 92%. The improvements in channel and water trading has made available 204 387 000m3 of water for other uses, primarily from reduced infiltration and return flow.
Most of the savings have been allocated for the environmental flows within rivers, with some of the savings allocated to meet water demand from Melbourne and for additional agricultural use.
Victoria, Australia
Measure Reduced withdrawal(in m3/year)
Irrigation control systems 83 748 000
Meter replacement and rationalisation 85 224 000
Channel remediation and bed lining 22 854 000
On-farm channel improvements 12 561 000
Total savings 204 387 000

46
Agricultural
Irrigation optimisationSoetmelkvlei Farm, South Africa
Project Overview
Soetmelkvlei Farm is an owner-managed irrigation operation of 183ha on the Orange-Riet Irrigation Scheme using water from the Vanderkloof Dam on the Orange River. State-of-the-art technology combined with excellent management achieved increased yields and a reduced level of water use per hectare of crop. Precise scheduling is possible because the Orange-Riet Water User Association, which operates the irrigation scheme, manages a distribution system that allows farmers to place water orders daily. While the thinking of many farmers on the scheme is focussed on minimising costs, at Soetmelkvlei the philosophy is to maximise yield from their allocation of water and to invest accordingly. Since there are no realistic opportunities for the introduction of lucrative cash crops, efforts have been directed towards getting the best results out of the crops traditionally grown such as maize, wheat, dry bean and lucerne through a combination of approaches. These include both the implementation of the latest equipment and effective irrigation systems and the use of various management and decision support systems. The reduced use of water has allowed the farm to increase the area under productive irrigation with no increase in allocation.
Key Elements
- Irrigation scheduling based on real-time soil moisture measurements and local weather forecasts and reports.
- Support from commercial service providers on both soil moisture and fertiliser application.
- Selection of most efficient but affordable irrigation system.
- Increased profit per unit volume of water used through a combination technology and careful management.
- Member of an excellent water user association providing water on order as required.
Key Outcomes
- Crop yield per unit of water withdrawn has increased; with no increase in withdrawal irrigated areas have expanded from 126ha to 183ha and Biomass production has increased by more than 50%.
- Accurate scheduling of water to optimise soil moisture requirements of crops.
- Very high yields compared to other farms in the country and internationally.
- Reduced fertiliser bill resulting from targeted application of fertiliser to the crops.
- Crop growth has increased the consumptive use on the farm and thus return flows to the basin have been reduced.
Water StressSoetmelkvlei Farm, South Africa
Low (<10%)Low to med (10-20%) Med to high (20-40%)High (40-80%) Extremely high (>80%)
Arid & low water use
No data available
estimated unit cost of water
10 ¢/m3
capital cost
$ 400 000
water scarcity impact
627 000 m3/yrvolumetric impact
Reduced withdrawal
Reduced consumption
Improved water quality
Increased productivity
Net basin benefit
Water Stress Map:Gassert, F., M. Landis, M. Luck, P. Reig, and T. Shiao. 2013. “Aqueduct Global Maps 2.0.”
Low Medium High
Confidence level
CreditsWe wish to acknowledge the input of Nicky du Plooy of Soetmelkvlei farm, Willie du Plooy Trust, in the preparation of this case study.
Water Scarcity Impact Key
Main Minor

47
Orange River, South Africa
Intervention Features
¬ Irrigation metering ¬ Irrigation scheduling ¬ Remote monitoring and sensing ¬ Fixed overhead sprinkler system ¬ Fertigation systems
Project Levers
(1) Irrigation scheduling:
A system provides daily data and graphs on the status of soil moisture and irrigation requirements and the farmer is able to order water and irrigate accordingly. Each probe serves an area of 10ha and provides readings at 10cm intervals up to a depth of 120cm. This accurate irrigation scheduling system has allowed the farmer to make major water savings and use this for the expansion of his land under irrigation.
(2) Efficient irrigation systems:
The irrigable land between the centre pivots which irrigated the original area of 126ha are now irrigated using fixed overhead systems which are suitable for filling awkward spaces. While more expensive than centre-pivot systems they are generally more water efficient and allow the farmer to further utilise his saved water. All irrigation water is supplied through a central pumping and fertigation station.
(3) Involvement of commercial suppliers:
Soil moisture probes and the associated real-time communication and scheduling software package are supplied by commercial service providers on a one off payment plus annual maintenance contract basis. Specialist services include installation and calibration of soil moisture probes and associated software, detailed up-to-date weather forecasts and technical support. Commercial fertiliser providers carry out soil tests before making recommendations on fertiliser mixtures and concentrations. Working with commercial suppliers facilitates access to competitive financing options.
(4) Industry-oriented approach:
Management of farm operations acknowledge that farming is now an agribusiness that requires dedicated management, appropriate technology and financing arrangements like any other business. The natural risks associated with farming only add to the need for exceptional management standards for a sustainable operation. Operating like a business has facilitated the farmer’s access to finance for capital and operating costs.
Outcomes and Challenges
Since taking over the farm the area under irrigation has been increased from 126 ha to 183 ha without an increase in water allocation. The allocation of 11 000m3/ha/yr for the original area is now used to irrigate the expanded area with an average application rate of around 7 500m3/ha/yr. Average water use at Soetmelkvlei has been reduced to 5 000m3/ha compared to the scheme average of 7 700m3/ha for maize and to 11 000m3/ha for lucerne compared to 12 750m3/ha. Crop per drop has been further increased by an increase in crop yields resulting from more accurate water scheduling and fertiliser application. Overall increase in yield per drop of water is approximately 65% when both the increased area and per hectare yields are taken into account. Investment in irrigation infrastructure has been offset by much higher levels of both per hectare and farm-wide productivity as well as through savings in fertiliser and per hectare pumping costs.
The payback period is estimated to be between six and eight years. Efficiency, as measured in dollars earned per cubic metre of water is much higher at Soetmelkvlei than the irrigation scheme average. Earnings for maize are approximately $0.21/m3 compared with the scheme average of $0.07/m3. For wheat they are approximately $0.08/m3 compared with $0.04/m3, and for lucerne they are $0.09/m3 compared with $0.06/m3.
The operation at Soetmelkvlei demonstrates the effectiveness of state-of-the-art water and fertiliser management systems on increasing production per unit of applied water, with an overall increase in net income.
Above: DACOM soil moisture probe in maize field (© WRP (Pty) Ltd)
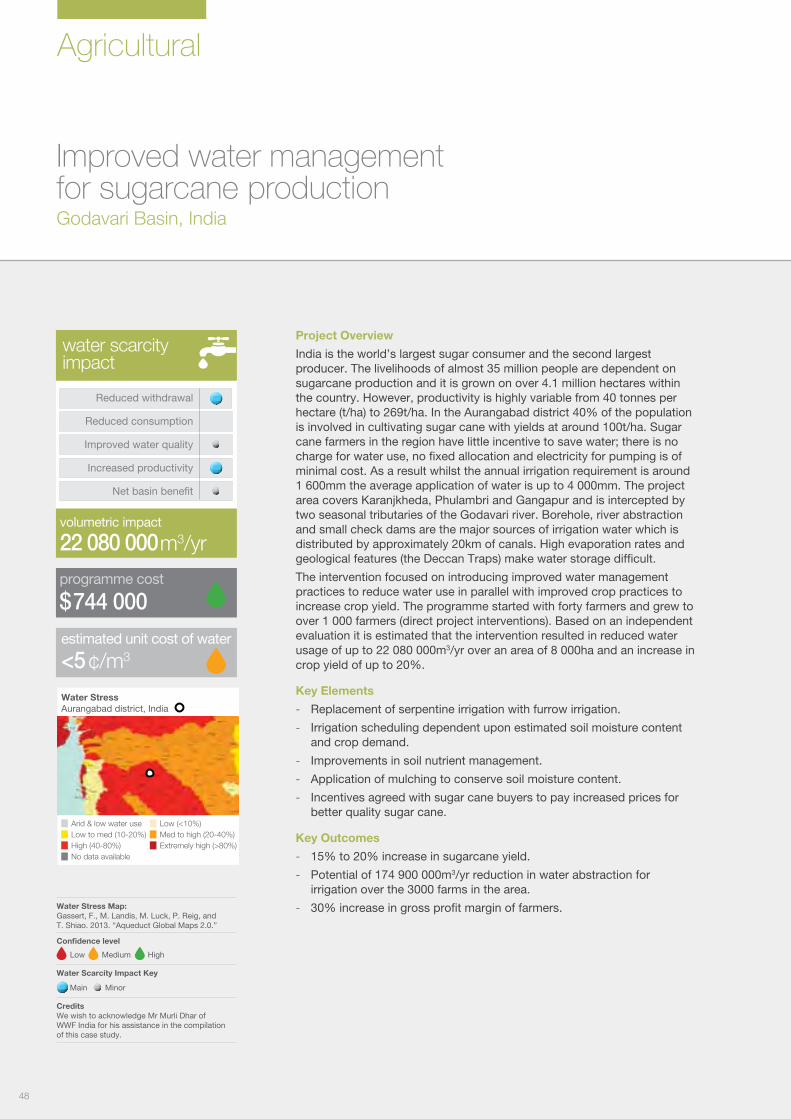
48
Agricultural
Improved water management for sugarcane productionGodavari Basin, India
Project Overview
India is the world’s largest sugar consumer and the second largest producer. The livelihoods of almost 35 million people are dependent on sugarcane production and it is grown on over 4.1 million hectares within the country. However, productivity is highly variable from 40 tonnes per hectare (t/ha) to 269t/ha. In the Aurangabad district 40% of the population is involved in cultivating sugar cane with yields at around 100t/ha. Sugar cane farmers in the region have little incentive to save water; there is no charge for water use, no fixed allocation and electricity for pumping is of minimal cost. As a result whilst the annual irrigation requirement is around 1 600mm the average application of water is up to 4 000mm. The project area covers Karanjkheda, Phulambri and Gangapur and is intercepted by two seasonal tributaries of the Godavari river. Borehole, river abstraction and small check dams are the major sources of irrigation water which is distributed by approximately 20km of canals. High evaporation rates and geological features (the Deccan Traps) make water storage difficult.
The intervention focused on introducing improved water management practices to reduce water use in parallel with improved crop practices to increase crop yield. The programme started with forty farmers and grew to over 1 000 farmers (direct project interventions). Based on an independent evaluation it is estimated that the intervention resulted in reduced water usage of up to 22 080 000m3/yr over an area of 8 000ha and an increase in crop yield of up to 20%.
Key Elements
- Replacement of serpentine irrigation with furrow irrigation.
- Irrigation scheduling dependent upon estimated soil moisture content and crop demand.
- Improvements in soil nutrient management.
- Application of mulching to conserve soil moisture content.
- Incentives agreed with sugar cane buyers to pay increased prices for better quality sugar cane.
Key Outcomes
- 15% to 20% increase in sugarcane yield.
- Potential of 174 900 000m3/yr reduction in water abstraction for irrigation over the 3000 farms in the area.
- 30% increase in gross profit margin of farmers.
Water StressAurangabad district, India
Low (<10%)Low to med (10-20%) Med to high (20-40%)High (40-80%) Extremely high (>80%)
Arid & low water use
No data available
estimated unit cost of water
<5 ¢/m3
programme cost
$ 744 000
water scarcity impact
22 080 000 m3/yrvolumetric impact
Reduced withdrawal
Reduced consumption
Improved water quality
Increased productivity
Net basin benefit
Water Stress Map:Gassert, F., M. Landis, M. Luck, P. Reig, and T. Shiao. 2013. “Aqueduct Global Maps 2.0.”
Low Medium High
Confidence level
CreditsWe wish to acknowledge Mr Murli Dhar of WWF India for his assistance in the compilation of this case study.
Water Scarcity Impact Key
Main Minor
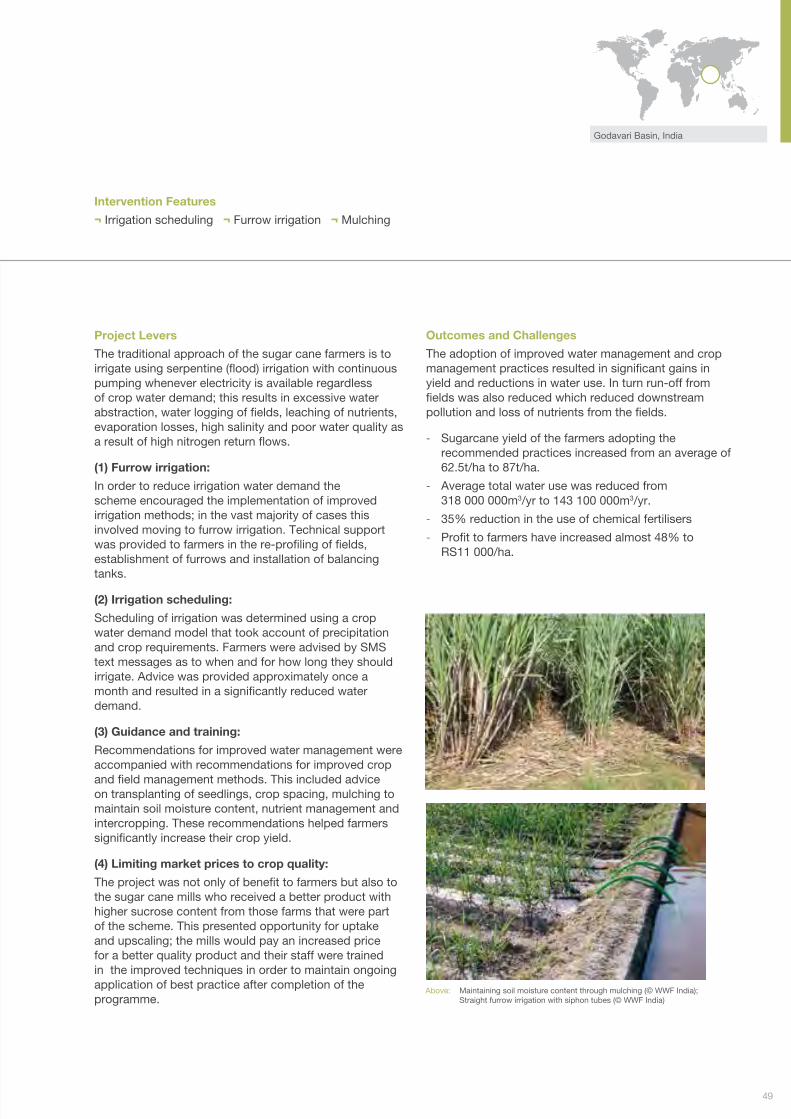
49
Godavari Basin, India
Intervention Features
¬ Irrigation scheduling ¬ Furrow irrigation ¬ Mulching
Project Levers
The traditional approach of the sugar cane farmers is to irrigate using serpentine (flood) irrigation with continuous pumping whenever electricity is available regardless of crop water demand; this results in excessive water abstraction, water logging of fields, leaching of nutrients, evaporation losses, high salinity and poor water quality as a result of high nitrogen return flows.
(1) Furrow irrigation:
In order to reduce irrigation water demand the scheme encouraged the implementation of improved irrigation methods; in the vast majority of cases this involved moving to furrow irrigation. Technical support was provided to farmers in the re-profiling of fields, establishment of furrows and installation of balancing tanks.
(2) Irrigation scheduling:
Scheduling of irrigation was determined using a crop water demand model that took account of precipitation and crop requirements. Farmers were advised by SMS text messages as to when and for how long they should irrigate. Advice was provided approximately once a month and resulted in a significantly reduced water demand.
(3) Guidance and training:
Recommendations for improved water management were accompanied with recommendations for improved crop and field management methods. This included advice on transplanting of seedlings, crop spacing, mulching to maintain soil moisture content, nutrient management and intercropping. These recommendations helped farmers significantly increase their crop yield.
(4) Limiting market prices to crop quality:
The project was not only of benefit to farmers but also to the sugar cane mills who received a better product with higher sucrose content from those farms that were part of the scheme. This presented opportunity for uptake and upscaling; the mills would pay an increased price for a better quality product and their staff were trained in the improved techniques in order to maintain ongoing application of best practice after completion of the programme.
Outcomes and Challenges
The adoption of improved water management and crop management practices resulted in significant gains in yield and reductions in water use. In turn run-off from fields was also reduced which reduced downstream pollution and loss of nutrients from the fields.
- Sugarcane yield of the farmers adopting the recommended practices increased from an average of 62.5t/ha to 87t/ha.
- Average total water use was reduced from 318 000 000m3/yr to 143 100 000m3/yr.
- 35% reduction in the use of chemical fertilisers
- Profit to farmers have increased almost 48% to RS11 000/ha.
Above: Maintaining soil moisture content through mulching (© WWF India); Straight furrow irrigation with siphon tubes (© WWF India)

50
03 Industrial
© D
irim
a | D
ream
stim
e.co
m

51

52
Industrial
Managing water towards zero dischargeLerma Chapala Basin, Mexico
Project Overview
The Lerma Chapala Basin in Mexico is responsible for over 50% of Mexico’s exports and is home to over 10 million people yet the basin is under extreme pressure from water scarcity with an aggregated annual deficit of up to 1.8 billion m3/yr. The main water resource in the basin is groundwater which is heavily overexploited.
In 2010 Procter and Gamble (P&G) established the Planta Milenio manufacturing facility in the basin. In order to minimise business risk and environmental impact the plant has been designed to minimise the volume of water that must be abstracted from the basin. The total groundwater abstraction of the site had the potential to be in order of 480 000m3/yr, however through the use of extensive on site recycling, low water use fittings and rain water harvesting the total abstraction has been reduced to 254 000m3/yr. While the volume of water used by the plant remains largely unchanged, the volume of abstracted groundwater has been reduced by nearly 50%.
Key Elements
- Wastewater recycling for use as cooling water.
- Reverse osmosis process to recycle waste streams from the water treatment plant.
- Installation of low flow plumbing fittings to reduce domestic water use for 3 000 staff.
- Pollution prevention measures to protect freshwater sources.
- Rainwater harvesting to reduce water run-off and groundwater abstraction.
- The project was 100% financed by P&G as part of a factory relocation work package.
Key Outcomes
- 47% reduction in ground water abstraction.
- 50% reduction in volume of water used by staff through low plumbing fixtures.
- Evaporation of the final wastewater discharge avoids groundwater pollution.
- Consumptive use by the plant is unchanged.
Water StressPlanta Milenio, Mexico
Low (<10%)Low to med (10-20%) Med to high (20-40%)High (40-80%) Extremely high (>80%)
Arid & low water use
No data available
estimated unit cost of water
80 ¢/m3
capital cost
$ 1 900 000
water scarcity impact
226 000 m3/yrvolumetric impact
Reduced withdrawal
Reduced consumption
Improved water quality
Increased productivity
Net basin benefit
Water Stress Map:Gassert, F., M. Landis, M. Luck, P. Reig, and T. Shiao. 2013. “Aqueduct Global Maps 2.0.”
Low Medium High
Confidence level
CreditsWe wish to acknowledge the input ofGordon Wrin of Procter and Gamble in the preparation of this case study.
Water Scarcity Impact Key
Main Minor

53
Project Levers
The main components of the water re-use cycle are described below.
1) Water treatment for use in cooling water:
The raw water supply contains high levels of phosphate and silica which must be reduced to levels acceptable for use in the plant. The water is treated by Reverse Osmosis (RO) which supplies the process and domestic water. The waste stream from this treatment is then passed through second RO stage before being used for cooling. This minimises waste to an appropriate degree, as the water is evaporated.
2) Recycling of domestic and process water for use as cooling water:
Over 73% of the direct demand on the abstracted water is for domestic and process use. Waste domestic water is treated by a wastewater treatment plant before it is used in the cooling towers. The recycling of domestic and process water provides 77% (570m3/day) of the total water demand of the cooling towers.
3) Domestic demand reduction:
Low flow plumbing fittings including low flow shower heads, low flow faucet aerators and low flow toilets were installed for use by 3 000 staff. The low flow shower heads have reduced water consumption from 10 litres per minute to 4 litres per minute. Low flow faucet aerators have resulted in a reduction from 8.3 litres per minute to 4 litres per minute and low flush toilets have saved over 8 litres per flush (from 13 litres per flush to 4.8 litres per flush).
4) Pollution control measures:
The plant produces 140m3/day of highly saline reject water, this is discharged to the solar evaporator. This minimises the risk of pollution of water resources.
5) Rainwater harvesting to reduce runoff and abstracted groundwater:
The Milenio facility installed measures to harvest rainwater. The harvesting system is active in the three-month rainy season permitting reduced ground water abstraction during this period. Roof rainwater is collected, screened and filtered prior to being discharged in a detention basin. Minor treatment takes place before the water is used in the cooling towers.
Outcomes and Challenges
The water savings can be summarised as follows:
- 100% of the cooling water demand is met through a combination of recycling of domestic and process water (77%) and a second stage RO process on water treatment plant waste streams.
- Low flow plumbing throughout the manufacturing facility has reduced the on-site water use by 18 400m3/yr.
The interventions have also removed potential environmental impacts from effluent discharges and have increased the security of water supply for the long term operation of the site. The $1.9m cost included the cost of the water treatment system equipment including the RO treatment systems, filters solar evaporator, and pumps.
Intervention Features
¬ Wastewater reuse as cooling water ¬ Low flow showerheads ¬ Low flow taps ¬ Low flow toilets ¬ Industrial water metering ¬ Rainwater harvesting
Lerma Chapal Basin, Mexico
Above: Planta Milenio Water Cycle (© Arup)
Filtration
Rainwater Storage
Cooling towers
Pre-treatment filtration
16 000m3 over a 3 month period - reducing borehole abstraction by 180m3/day over 90 days
Borehole abstraction
14m3/d losses through the system
180m 3/d
120m3 /d
110m3 /d 190m 3/d
20m 3/d
580m3/d
REVERSE OSMOSIS STAGE 2
570m3/d
Process & domestic Use
Wastewater treatment
Reverse Osmosis Stage 1
Solar evaporation zero liquid discharge
Cooling water storage
Storage tank
740m 3/d

54
Industrial
Metering of non-revenue waterEkurhuleni, South Africa
Project Overview
Ekurhuleni Metropolitan Municipality (EMM) is the industrial heartland of South Africa and supplies approximately 314 000 000m3/year to 800 000 households. Metering of the top consumers in EMM had not been a high priority for many years with the result that many of the supply meters to existing consumers were either broken or unreliable with non revenue water estimated to be around 50% of the water being used.
In 2010 EMM launched a campaign to consolidate multiple connections into single metered supplies. The main catalyst for the project was an increasing awareness that large quantities of water were being supplied to industry without being billed. While the replacement of meters, including the consolidation of multiple connections, was the main feature of the project, other important components included the identification of illegal connections and the identification and repair of leaks. The project was the overall winner of the South African Government’s 2012 Water Conservation Awards and is now being extended to include almost 25 000 additional bulk consumer meters. Extensive work was done with consumers to explain the whole process, as a result, despite the fact that around 75% would be faced with increased water bills, there was no resistance to the project.
Key Elements
- Targeting of top 500 consumers by volume of water.
- Comprehensive water audit allowing the identification of all existing connections to each consumer.
- Zero pressure testing to check for additional supply connections not identified during the water audit.
- Drawdown testing at fire hydrants to determine hydraulic capacity within the municipality system and to support sizing of consolidated meters.
- Design and implementation of consolidated supply including metering of the top 500 consumers.
- Project cost was $2.5m.
Key Outcomes
- Decrease of non-revenue water estimated at 5 800 000m3/year for the first 213 consumers.
- Increased revenue for Ekurhuleni Metropolitan Municipality estimated at $5.4m/year.
- Reduced wastage of water through leakage repairs especially on internal reticulation networks.
- Creation of 20 full-time jobs and 4 660 man-days of employment over two years.
Water StressEkurhuleni, South Africa
Low (<10%)Low to med (10-20%) Med to high (20-40%)High (40-80%) Extremely high (>80%)
Arid & low water use
No data available
estimated unit cost of water
<5 ¢/m3
capital cost
$ 2 500 000
water scarcity impact
5 800 000 m3/yrvolumetric impact
Reduced withdrawal
Reduced consumption
Improved water quality
Increased productivity
Net basin benefit
Water Stress Map:Gassert, F., M. Landis, M. Luck, P. Reig, and T. Shiao. 2013. “Aqueduct Global Maps 2.0.”
Low Medium High
Confidence level
CreditsWe wish to acknowledge the input of Johan Vorster and Dries Kruger of Ekurhukleni Metropolitan Municipality and Brad Astrup, Willem Wegelin, Tshilidzi Godzwana and Mthokozisi Mlotshwa of WRP (Pty) Ltd in the preparartion of this case study.
Water Scarcity Impact Key
Main Minor

55
Ekurhuleni, South Africa
Intervention Features
¬ Removal of unmetered water supplies ¬ Industrial water metering ¬ Water audits ¬ Stakeholder engagement
Project Levers.
(1) Comprehensive water audit:
In order to maximise the potential return on the cost of investigations and remedial actions, it was decided to focus on the largest consumers; this is where the largest savings could be made rapidly and cost-effectively. The target area was one in which metering was known to be old and in poor condition.
The Field Audit involved locating and capturing all information relating to the consumer’s water supply and water infrastructure on the property. An assessment was also made of the consumers water demand in terms of fire fighting, industrial and domestic demand. This audit was supported by extensive analysis of the system including:
- Zero pressure testing; Since many of the existing connections and associated meters were hidden underground and often under years of accumulated debris and rubbish it was necessary to carry out zero pressure tests at all consumer sites in order to check for the presence of any other additional connections to the reticulation system.
- Drawdown testing; Drawdown tests were conducted at fire hydrants on the municipal network to determine the hydraulic capacity within the municipal system. These tests provided an indication of the potential within the municipal supply system to provide water for fire fighting purposes and were also used to support the consolidated meter sizing.
(2) Consumer engagement:
The comprehensive evidence base gathered was critical in engaging with consumers and local politicians. In parallel with the technical audit this enabled close and frank communication between the project team/Municipality and the consumers who were highly cooperative as a result.
(3) Industrial water metering:
Some consumers had as many as 20 separate connections some with meters and some without. A meter sizing model was developed to assist in the calculation of maximum realistic demand and the consolidated single meter for each consumer size accordingly. By the end of the three year project designs had been completed for 213 consumers with one or two new meters installed at each.
Outcomes and Challenges
The increased revenue calculations undertaken for the first 250 large industries which have been audited and provided with a consolidated water supply connection indicate that the annual revenue to EMM has increased by up to $5.4m. The resulting payback for this project is therefore less than 12 months which is highly cost effective. It is too early to state whether there has been an impact on demand since the industries started paying for all their water, but this is likely to be the case.
A key element in the success of this project has been the careful auditing of the water use and water billing prior to the project implementation compared to the post implementation results. Through proper and reliable auditing of the results, it was possible to highlight the real benefits from the project in such a manner that the Municipality officials and high ranking politicians could clearly see the benefits of extending the process to cover another 25 000 bulk water connections. The additional project will be undertaken over a ten-year period and is scheduled to commence in 2014.
A key challenge throughout the project was to ensure that records are kept that can provide a robust evidence base for what has been achieved. The data must be presented in a clear and concise manner so that the local politicians and municipal managers can see the benefits from the project.
Above: Unmetered and metered supplies exposed. (© WRP (pty) Ltd)

56
Industrial
Water efficiency audits of steam systems Melbourne, Australia
Project Overview
Australia is the driest inhabited continent in the world with its supply of freshwater becoming increasingly susceptible to drought and climate variability. City West Water (CWW) is one of Melbourne’s three retail water businesses and over 100 of CWW’s large business customers use steam within their processes. CWW launched a programme focused on assisting business customers to understand how they can make steam systems more efficient. Steam systems were targeted because energy efficiency improvements are typically effective with a high likelihood of implementation. For example, the energy use per 1 000m3 of water used in a steam system in Melbourne is over 300 times higher than the energy used to supply water and treat wastewater combined. As such, initiatives to improve the efficiency of steam systems simultaneously reduces water and energy use. The programme involves conducting site audits and the provision of training courses as well as investigating and implementing technical improvements. CWW also offers grants for cost effective water efficiency actions to leverage business sector investment. The programme commenced in June 2010 and to date it has achieved water savings of 11 000m3/yr and greenhouse gas reduction of 893 tonnes CO2 equivalent (CO2e).
Key Elements
- Audits of customers business to identify water and energy losses
- Provision of detailed information to customers on best engineering practices to improve steam system performance.
- Delivery of training courses to facility managers and maintenance personnel on how to optimise energy and water use.
- The two-part programme was funded by CWW as a research programme with a contribution of $50 000 from Environment Protection Authority Victoria. The cost to businesses for implementing the interventions was $48 000.
- Availability of grants to co-fund water and water related energy efficiency actions.
Key Outcomes
- Across the programme, 30 audits were conducted and 150 actions were identified.
- To date, 25 actions have been implemented, achieving reductions in withdrawal of 11 000m3/year of water, 17 400GJ/yr of gas, and greenhouse gas reductions of 893 tonnes CO2e/yr.
- Other actions being implemented or planned will achieve reductions in withdrawal of 100 000m3/yr of water, 53 400GJ/yr of gas, 68 000kWh/year of electricity and greenhouse gas reductions of 2 823 tonnes CO2e/yr.
- Consumptive use decreased through recovery of vented steam, condensate and reduction in steam leaks.
Water StressMelbourne, Australia
Low (<10%)Low to med (10-20%) Med to high (20-40%)High (40-80%) Extremely high (>80%)
Arid & low water use
No data available
estimated unit cost of water
155 ¢/m3
capital cost
$ 278 000
water scarcity impact
11 000 m3/yrvolumetric impact
Reduced withdrawal
Reduced consumption
Improved water quality
Increased productivity
Net basin benefit
Water Stress Map:Gassert, F., M. Landis, M. Luck, P. Reig, and T. Shiao. 2013. “Aqueduct Global Maps 2.0.”
Low Medium High
Confidence level
CreditsWe wish to acknowledge the input of John Fawcett and Audra Liubinas of City West Water in the preparation of this case study.
Water Scarcity Impact Key
Main Minor

57
Intervention Features
¬ Condensate recovery and reuse ¬ Steam leakage reduction ¬ Prevention of operation of water tank overflows ¬ Provision of grants ¬ Water audits ¬ Education, technical training and capacity building
Project Levers
(1) Provision of Training Courses:
The courses provide an introduction to a steam system and its components with information on how to identify problems and optimise energy and water use.
(2) Audit Programme:
The audit programme identified 150 actions which could improve water and energy efficiency. These included:
- Steam trap maintenance to reduce steam leaks.
- Monitoring of make up water to identify leaks.
- Interventions to prevent operation of water tank overflows.
- Capture and reuse of condensate in the steam process.
- Recovery of vented steam and subsequent. condensation using an air-cooled condenser.
(3) Provision of resources:
Once the audits and training were completed, CWW worked with the customers to implement the action items by providing resources such as co-funding or assistance to help them overcome the barriers to implementation including lack of data and cost benefits.
(4) Co-funding of actions:
The amount of co-funding grant was decided using criteria that include:
- Cost per megalitre of water saved. The net present cost must be less than $1/m3 on the grant amount over the lifetime of the infrastructure or measure installed for projects that save more than 20 000/m3/yr. Smaller water savings projects must generally deliver savings to CWW at less than ¢50/m3 for those delivering less than 5 000/m3/yr and in a sliding scale up to $1/m3 for those delivering between 5 000/m3/yr and 20 000/m3/yr.
- The payback to the customer is not less than three years.
- Grants are limited to 50% of the project cost.
- A net energy and greenhouse gas saving must be achieved.
- Other criteria such as transferability of the solution to others, waste water and salt load savings on sewage treatment plants are also considered.
Outcomes and Challenges
Across the two phases of the programme, thirty audits were conducted and 150 actions were identified. To date, 25 actions have been implemented, achieving savings of over 11 000m3/year of water and 893 tonnes CO2e/year of greenhouse gas. 21 actions are being implemented presently or are planned to be implemented. If all the actions identified across the programme are implemented, the savings are estimated to be 295 000m3/year of water 186 000GJ/yr of energy, and greenhouse gas reductions of 9 960 tonnes CO2e/yr; this would represent more than half of CWW’s greenhouse emissions. Customer energy and water bills will also be reduced by $1.5m/yr.
Implementation has been slower than anticipated. Common barriers to implementation include:
- Further investigation by the customer may be required to determine savings are accurate and opportunities are practical to adopt.
- Customers not being able to justify the initial capital expenditure when the project payback period is too long as environmental benefits alone are not sufficient to warrant implementation.
- Opportunities with shorter paybacks such as steam leaks can be seen as a low priority to business, when they are working on other environmental initiatives that achieve greater efficiencies.
- Customers may not have the in-house capabilities or resources to develop, implement and then manage changes. Actions could also add complexity to maintenance of their system.
Melbourne, Australia
Above: Pressure valve © City West Water
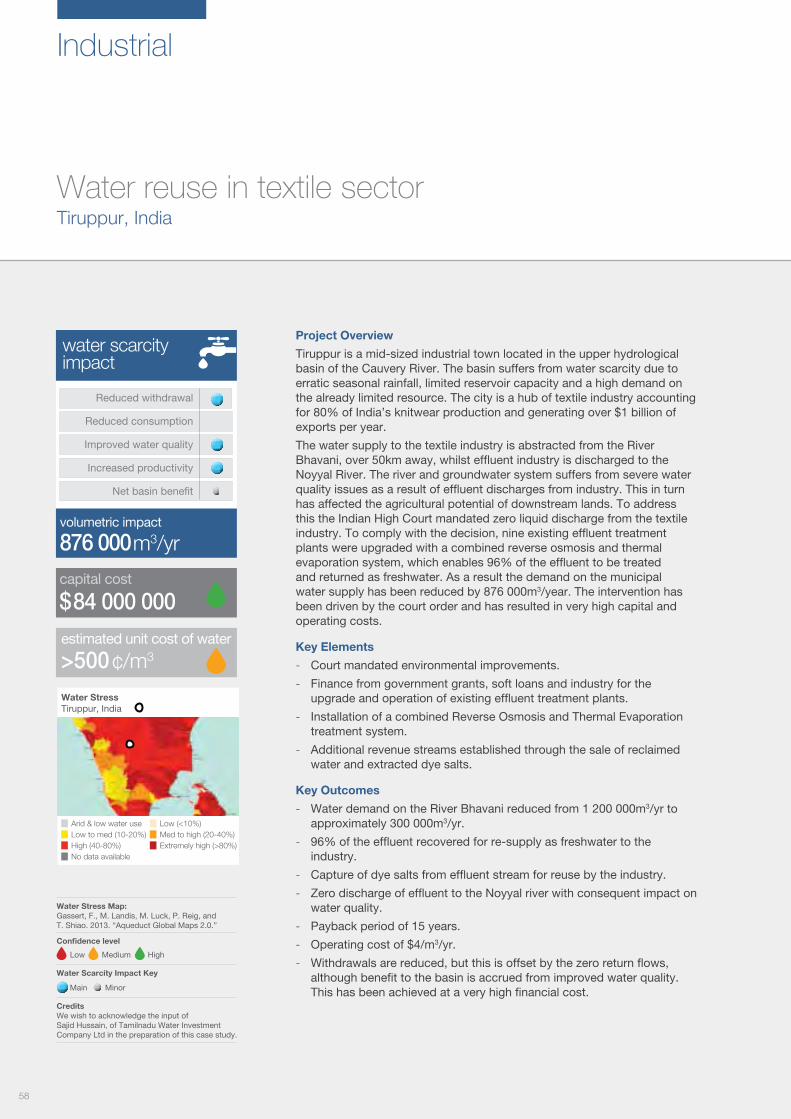
58
Industrial
Water reuse in textile sector Tiruppur, India
Project Overview
Tiruppur is a mid-sized industrial town located in the upper hydrological basin of the Cauvery River. The basin suffers from water scarcity due to erratic seasonal rainfall, limited reservoir capacity and a high demand on the already limited resource. The city is a hub of textile industry accounting for 80% of India’s knitwear production and generating over $1 billion of exports per year.
The water supply to the textile industry is abstracted from the River Bhavani, over 50km away, whilst effluent industry is discharged to the Noyyal River. The river and groundwater system suffers from severe water quality issues as a result of effluent discharges from industry. This in turn has affected the agricultural potential of downstream lands. To address this the Indian High Court mandated zero liquid discharge from the textile industry. To comply with the decision, nine existing effluent treatment plants were upgraded with a combined reverse osmosis and thermal evaporation system, which enables 96% of the effluent to be treated and returned as freshwater. As a result the demand on the municipal water supply has been reduced by 876 000m3/year. The intervention has been driven by the court order and has resulted in very high capital and operating costs.
Key Elements
- Court mandated environmental improvements.
- Finance from government grants, soft loans and industry for the upgrade and operation of existing effluent treatment plants.
- Installation of a combined Reverse Osmosis and Thermal Evaporation treatment system.
- Additional revenue streams established through the sale of reclaimed water and extracted dye salts.
Key Outcomes
- Water demand on the River Bhavani reduced from 1 200 000m3/yr to approximately 300 000m3/yr.
- 96% of the effluent recovered for re-supply as freshwater to the industry.
- Capture of dye salts from effluent stream for reuse by the industry.
- Zero discharge of effluent to the Noyyal river with consequent impact on water quality.
- Payback period of 15 years.
- Operating cost of $4/m3/yr.
- Withdrawals are reduced, but this is offset by the zero return flows, although benefit to the basin is accrued from improved water quality. This has been achieved at a very high financial cost.
Water StressTiruppur, India
Low (<10%)Low to med (10-20%) Med to high (20-40%)High (40-80%) Extremely high (>80%)
Arid & low water use
No data available
estimated unit cost of water
>500 ¢/m3
capital cost
$ 84 000 000
water scarcity impact
876 000 m3/yrvolumetric impact
Reduced withdrawal
Reduced consumption
Improved water quality
Increased productivity
Net basin benefit
Water Stress Map:Gassert, F., M. Landis, M. Luck, P. Reig, and T. Shiao. 2013. “Aqueduct Global Maps 2.0.”
Low Medium High
Confidence level
CreditsWe wish to acknowledge the input of Sajid Hussain, of Tamilnadu Water Investment Company Ltd in the preparation of this case study.
Water Scarcity Impact Key
Main Minor

59
Intervention Features
¬ Wastewater reuse in textile industry ¬ Condensate recovery and reuse ¬ Improvement in water quality
Project Levers
Nine effluent treatment plants operated by Tamil Nadu Water Investment Company (TWIC) treat 922 000m3/yr of effluent from 200 textile industry units. These plants were upgraded with Reverse Osmosis and Thermal Evaporation processes enabling re-use of 96% of the effluent. The upgrades were financed with a combination of public and private finance.
(1) Reverse osmosis:
Conventional physicochemical or biological treatments do not remove salts or salinity, the primary source of pollutants in the industrial effluents. In addition the Noyyal River is perennial with limited dilution capacity. Reverse osmosis (RO) technology is used to remove the pollutant load from the effluent. This enables 75% of the incoming effluent to be reclaimed with the concentrated waste diverted for further processing.
(2) Evaporator-condensate recovery:
The concentrate waste from the RO is processed in Mechanical Vapour Recompression (MVR) and Multi-Effect Evaporators. This enables a further 19% of the incoming effluent to be reclaimed. This process is energy intensive but is necessary to meet the zero liquid discharge requirements.
(3) Recovered salt reuse:
The textile industry utilises significant amount of salts within the dyeing process. The water reclamation process regenerates these salts as a byproduct allowing their reuse by industry, previously these were used only once and discharged in the effluent. The sale of these byproducts provides an additional revenue stream to the water reclamation process.
(4) Solar evaporation of concentrated liquor:
A small percentage of the incoming effluent is left as concentrated salt laden liquor from the Multi-Effect Evaporator. This is processed in solar pan evaporators to dispose of the water to achieve the zero liquid discharge. The crystallised salt deposits are further recovered for reuse.
(5) Sale of the reclaimed water and recovered salts:
The water treatment plants operate as independent commercial entities and charge the textile plants for the treatment of the industrial effluent as well as supply of reclaimed water and dye salts.
Outcomes and Challenges
Washing, bleaching and dyeing processes are very water intensive; this project enabled the industry to substantially reduce its demand on scarce water resource with 75% of the total water demand now met by reclaimed water, although at a significant financial and energy cost. The reduction in abstraction by 876 000m3/yr has improved the availability of water for other users and has been specifically welcomed by the local farmers. The cessation of discharges of industrial effluent has reduced the return flow to the Noyyal River. However, as this flow was highly polluted this has the effect of increasing the availability of the remaining flow for other users.
The court ordered cessation of industrial effluent discharges into the Noyyal River was a challenge as it required a solution that maximised the recovery of water for reuse within the industry. The implemented solution is energy intensive with significant financial costs to the industry which has affected their profitability and competitiveness.
Tiruppur, India
Above: Process flow diagram (© Siraj Tahir, Arup)

60
Water use reduction strategy in the food sector Mossel Bay, South Africa
Project overview
Towards the end of 2010, the Western Cape region experienced its worst drought in more than 130 years. In the Mossel Bay area, the level of the Wolvedans Dam dropped to less than 20% full at the height of the drought threatening the operation of the Nestlé factory. The plant in Mossel Bay takes in approximately 320m3 of milk per day and processes it to condensed milk and powdered milk. In 2009, the average monthly water consumption at the factory was approximately 23 700m3 equivalent to 14.8m3 of water consumed per tonne of product produced. The project involved the implementation of a water use reduction strategy, actions included active monitoring of water use, engineering interventions to enable condensate reuse, retrofitting of low flow plumbing fixtures and active employee participation. The strategy was successful in reducing the plant’s water consumption by approximately 50%.
Key Elements
- The project cost of $145 000 was fully financed by Nestle to reduce business risk.
- Installation of a water measurement system to map and monitor water usage.
- Recovery and use of condensate from the milk evaporation process.
- Implementation of low flow plumbing fixtures.
- Active engagement of staff to reinforce water saving culture.
Key Outcomes
- The factory reduced its water use by approximately 50% from 284 000m3/yr to 163 000m3/yr.
- Water withdrawn per tonne of product produced was reduced from 14.8m3 to 7.5m3.
- Reduced water withdrawal from the Wolvedans Dam resulted in greater water availability for the Mossel Bay area.
Industrial
Water StressMossel Bay, South Africa
Low (<10%)Low to med (10-20%) Med to high (20-40%)High (40-80%) Extremely high (>80%)
Arid & low water use
No data available
estimated unit cost of water
10 ¢/m3
capital cost
$ 145 000
water scarcity impact
120 000 m3/yrvolumetric impact
Reduced withdrawal
Reduced consumption
Improved water quality
Increased productivity
Net basin benefit
Water Stress Map:Gassert, F., M. Landis, M. Luck, P. Reig, and T. Shiao. 2013. “Aqueduct Global Maps 2.0.”
Low Medium High
Confidence level
CreditsWe wish to acknowledge the input of Sanjeev Raghubir of Nestlé South Africa in the preparation of this case study.
Water Scarcity Impact Key
Main Minor

61
Intervention Features
¬ Low flow showerheads ¬ Condensate recovery and reuse ¬ Industrial water metering ¬ Pressure management in factories ¬ Education, technical training and capacity building ¬ Stakeholder engagement ¬ Employee participation
Project Levers
(1) Water mapping and metering:
A complete water map was established for the plant, and thereafter a water usage measurement system was used to monitor water usage in the various sections of the plant. This provided invaluable information for the water volumes and water quantity and quality requirements for different parts of the plant.
(2) Water recovery and reuse:
The condensate from the milk evaporation processes was recovered and reused. The engineering work included insulation of existing tanks, construction of new water storage tanks and provision of recirculation pumps. The water is also treated prior to being used for non-potable purposes such as washing tanks, in boilers and cooling towers.
(3) Implementation of water saving measures:
Variuos water saving measures were implemented, such as shortening automated wash times, modifying hosepipe nozzles to reduce water flow, reducing shower head water flow and reducing the pressure in ablution blocks.
(4) Staff engagement:
Information was shared through notice boards and e-mails to reinforce the water saving messages to staff. Competitions were run and water saving suggestions by staff were implemented and rewarded. The staff engagement campaign took place during a period of imposed water restrictions on domestic households. Staff also utilised the provided information to save water at home.
Outcomes and Challenges
The project was approved and financed through Nestlé’s annual capital investment programme. In this case the monetary benefit from the water savings was not significant; the main driver for the investment was to reduce the risk of any impact on the operation of the plant due to poor water availability.
The interventions produced the following outcomes:
- The factory reduced its water withdrawal per tonne of product produced by approximately 50% in 2010 compared to 2009 values.
- Water used per tonne of product produced dropped from 14.8m3 to 7.5m3.
- By the end of 2010, the average monthly water use at the factory had dropped from 23 700m3 to approximately 13 600m3.
- The reduced water usage at the factory has resulted in reduced water withdrawal from the Wolvedans Dam and more water availability for the Mossel Bay area.
The increasing variation in the rainfall in the Western Cape region, and subsequent water restrictions still poses concerns for the factory. Phases 2 and 3 of the water saving strategy are currently being implemented to further reduce water consumption and make the factory a zero-municipal water intake factory by 2015.
Nestlé are currently engaging with their supply chain and in particular farmers in the catchment to promote water efficiency measures. A handbook of sustainable farming practices is currently being produced and will be issued to local farmers. This will include tips on how farmers could save water and significantly reduce their increasing electricity bills.
Nestlé Mossel Bay, South Africa
Above: Wolwedans Dam in Mossel Bay, South Africa (© Michael De Nysschen | Dreamstime.com )

62
Industrial
Water optimisation in mining sector Lomas Bayas Copper Mine, Chile
Project Overview
Xstrata’s Lomas Bayas copper mine is located 120km northeast of the port of Antofagasta, Chile. The mine is located on a desert with an annual rainfall of approximately 1mm and produces approximately 75 000 tonnes of copper each year. Xstrata’s copper operations use a process called heap leaching where a mildly acidic solution is sprayed over crushed copper ore to leach out the mineral – the process uses a significant proportion of the mine’s total water demand. The desert conditions of blue sky, high solar radiation, strong winds and very low air humidity give rise to very high evaporation rates in the order of 15mm/day. Water supply for the leach pads is withdrawn from the Loa River in the municipality of Calama and pumped 100km to the mine site. The site's water withdrawal is restricted to 5 794 000m3. In order to continue expanding its operations without relying on additional water resources, Lomas Bayas investigated opportunities to improve its water efficiency including replacing the original leach pad sprinkler system with a drip system that significantly reduced the water lost to evaporation.
Key Elements
- The main driver of this project was to reduce water loss due to evaporation.
- Targets were set to optimise water consumption.
- New technology was put in place to reduce water loss on the leach pads.
- The implementation of the project was part financed by Xstrata Copper, with support from local academic centres and funding from the Chilean Corfo Innova Mining Programme to identify methods to reduce evaporation rates.
Key Outcomes
- The evaporative loss in the leaching process has been reduced by 54% from 9.8 to 4.5 litres of water per square metre per day between 2008-2013.
- The area of leach pad at the mine has increased from 540 000m2 in 2008 to 1 000 000m2 in 2012 without increasing the water demand.
- The drip feed system optimised the use of water of the Lomas Bayas site by 19% when comparing to the use of the previous sprinkler system.
- Savings in evaporative loss have been utilised for mine expansion.
Water StressLomas Bayas mine, Chile
Low (<10%)Low to med (10-20%) Med to high (20-40%)High (40-80%) Extremely high (>80%)
Arid & low water use
No data available
estimated unit cost of water
not available
capital cost
$ 1 100 000
water scarcity impact
0 m3/yrvolumetric impact
Reduced withdrawal
Reduced consumption
Improved water quality
Increased productivity
Net basin benefit
Water Stress Map:Gassert, F., M. Landis, M. Luck, P. Reig, and T. Shiao. 2013. “Aqueduct Global Maps 2.0.”
Low Medium High
Confidence level
CreditsWe wish to acknowledge the input of Laila Ellis, Yuri Zepeda, Miguel Monroy and Gina Caprioglio of Xstrata Copper for their assistance in the preparation of this case study.
Water Scarcity Impact Key
Main Minor

63
Lomas Bayas, Chile
Intervention Features
¬ Drip feed application to leach pads
Project Levers.
(1) Water optimisation:
Lomas Bayas Mine identified water evaporation from the mine’s solution ponds and leach pads as a key area to trial water use efficiency measures as it contributes more than 40% of the total water consumed on site.
The existing sprinkler system on the heap leach pads was replaced with a more advanced drip feed system. Impermeable plastic covers were initially tested to determine if their installation would reduce evaporative losses further. However, this option was not pursued as the covers limited access to the pads for maintenance and repairs. The introduction of the drip feed system reduced the evaporation rate in the leaching process by approximately 54%, from 9.8 to 4.5 litres of water per square metre per day.
Outcomes and Challenges
The recent expansion of the copper mine includes the construction of an additional pit and heap leach pads. Without further improvements in water efficiency, the leaching process would have required a further 24 litres per second of freshwater. Following the successful trial of the drip feed system there has been an increase in the productive use of the water utilised for irrigating the leach pads. The area of the leach pads at the mine has increased from 540 000m2 in 2008 to 1 000 000m2 in 2012 whilst maintaining the same total water consumption for the leaching process.
A key challenge for this study was the introduction of technology that had not previously been proven for use in the mining industry. As such, the study included an extended pilot testing phase during which the technology was adapted for the current operations.
The $1.1m investment in the project included research into methods to reduce evaporation as well as the testing and installation of technologies to achieve these reductions. The alternative to this project would have been to invest in a desalination plant to provide water for the leach pads.
Above: Leach Pad irrigation system (© Xstrata Copper)

64
Industrial
Wastewater reclamation and reuse network Singapore
Project Overview
Singapore has a population of over five million people with a demand of 1 700 000m3/day, this is forecast to double within 50 years with 70% of demand being from the non-domestic sector. Although rainfall averages 254mm/yr, Singapore has limited natural water resources due to its small land area of 700km2; as a result it has historically relied on imported water. In the late 1990s Singapore initiated a programme to become increasingly self-sufficient in water supply. One component of the programme, called NEWater, involves the collection of treated wastewater flows that would have otherwise been discharged to the ocean, followed by treatment using dual membrane and ultraviolet technologies to produce potable standard water. This is currently used to supply 350 000m3/day mainly for non-potable industrial use and cooling. This is equivalent to 30% of Singapore’s daily water demand and forecast to rise to 50% of demand by 2030.
Key Elements
- Collection and advanced treatment of treated wastewater flows that would have been discharged into the ocean.
- Four NEWater plants established between 2002 and 2010 with a capacity of over 500 000m3/day. Two early plants were funded by the Public Utilities Board (PUB) and the other two were on Design Build Own Operate contracts.
- An extensive water sampling and testing programme to demonstrate the safety of reclaimed water.
- Distribution of bottled reclaimed water to publicly demonstrate its safety.
Key Outcomes
- Growing public acceptance of NEWater as a source of supply.
- Growth in use of NEWater from 27 000m3/day in 2003 to 350 000m3/day in 2012 offsetting the withdrawals required from existing freshwater resources
- NEWater is mainly used for non-potable industrial and commercial uses, in cooling systems and supplementing Singapore’s potable water supply via indirect potable use.
- NEWater currently meets 30% of Singapore’s total water demand and is projected to meet up to 55% of Singapore’s water demand by 2060.
Water StressSingapore
Low (<10%)Low to med (10-20%) Med to high (20-40%)High (40-80%) Extremely high (>80%)
Arid & low water use
No data available
estimated unit cost of water
not available
capital cost
confidential
water scarcity impact
127 750 000 m3/yrvolumetric impact
Reduced withdrawal
Reduced consumption
Improved water quality
Increased productivity
Net basin benefit
Water Stress Map:Gassert, F., M. Landis, M. Luck, P. Reig, and T. Shiao. 2013. “Aqueduct Global Maps 2.0.”
Low Medium High
Confidence level
CreditsWe wish to acknowledge the input of PUB, Singapore’s national water agency, in the preparation of this case study.
Water Scarcity Impact Key
Main Minor

65
Intervention Features
¬ Wastewater recycling for potable use ¬ Wastewater recycling for industrial use ¬ Stakeholder engagement
Singapore
Project Levers
(1) Treated Wastewater collection:
The sewerage network collects used water from domestic and non-domestic sources.
The used water is channelled through a combination of gravity sewers and pumping stations, to wastewater treatment plants where it is treated to acceptable international standards. The treated effluent is either reclaimed via NEWater plants or disposed to the sea.
(2) Water Recycling and purification:
NEWater is made by purifying treated used water through a rigorous three-stage process. Initially, unwanted substances such as suspended solids, minute particles, disease-causing bacteria and viruses are filtered out by membranes.
Following this, the water passes through a reverse osmosis stage. This ensures that contaminants such as bacteria, viruses, heavy metals, disinfection by-products are removed. The end result is high-grade water that is free from viruses and bacteria and contains very low levels of salts and organic matters.
As an added safety measure, the water undergoes ultraviolet disinfection. Alkaline chemicals are then added to restore the pH balance of the water.
(3) Public Engagement:
To gain public confidence in NEWater, the water utility has been distributing NEWater bottles to the public, institutions and community organisations for public sampling. To date, more than 23 million bottles of NEWater have been given out. A visitor centre has also been established which serves as a focal point to educate the public and demonstrate the benefits of the programme.
Above: Singapore water demand and supply (© Singapore Public Utilities Board)

66
Industrial
Wastewater reclamation and reuse network Singapore
Outcomes and Challenges
The implementation of the NEWater plants is part of a wider programme called the Four National Taps strategy to deliver a diversified and robust water supply for Singapore.
Currently, Singapore has four operational NEWater plants at Bedok (82 000m3/d), Kranji (77 000m3/d), Ulu Pandan (148 000m3/d) and Changi (228 000m3/d). The plants at Ulu Pandan and Changi were built under Design Build Own Operate agreements for 20 and 25 years respectively. A fifth plant at Seletar (2004) was decommissioned in 2011 in order to centralise used water treatment at Changi and produce cost efficiencies.
NEWater is supplied and used for:
- Non-potable industrial and commercial uses in wafer fabrication plants, electronics factories and power generation plants.
- Air-conditioning cooling systems of commercial and institutional complexes.
- Supplementing Singapore’s potable water supply via indirect potable use (blending with reservoir water). In 2011, this was estimated to be 2.5% of total potable water consumption.
The demand for NEWater has grown from 13-fold from 27 000m3/d in 2003 to 350 000m3/d today. NEWater now meets 30% of Singapore’s total water demand and is expected to meet 50% by 2030. Looking further forward, by 2060, NEWater is projected to meet up to 55% of Singapore’s future water demand.
Capital costs of the scheme are not readily available; however for the purpose of this catalogue the capital cost for the latest 228 000m3/d plant at Changi has been estimated at $165m. The production of NEWater is funded through the NEWater tariff. It currently stands at approximately $0.8/m3 before Goods and Service Tax (GST) and is cheaper than the normal water tariff of $0.94/m3 before GST.
In addition, NEWater does not attract the Water Conservation Tax (WCT). WCT was introduced in 1991 to reinforce the message of conserving water and is imposed as a percentage of the total water consumption. The WCT rate starts at 30% for a domestic water consumption of up to 40m3 per month, rising to 45% for higher water consumption.
As a comparison, the first year price for the production of NEWater at Changi under the Design Build Own Operate agreement was $0.24/m3 (2010), inflated thereafter. The price excludes the cost of pumping into distribution and the cost of providing and maintaining the NEWater distribution network.
A comprehensive water sampling and analysis programme was conducted from 2000 to 2002 and the quality of NEWater was benchmarked against international standards. An independent expert panel was formed to provide advice on the study and to evaluate and make recommendations on the results of the study. The panel concluded that NEWater was safe for potable use but recommended indirect potable use instead of directly supplying NEWater for potable use.

67
Left to right clockwise: NEWater Visitor centre (© Singapore Public Utilities Board); Reverse osmosis (© Singapore Public Utilities Board); Singapore skyline (© Kelvintt | Dreamstime.com)

68
Industrial
Water recycling in the food sector Durban, South Africa
Project Overview
Durban, located on the eastern coast of South Africa, is one of the country’s fastest-growing cities and its second-largest industrial centre. It is an area with high water stress and is expected to become dependent on desalination in future years. The demand for water by the industrial sector presents an additional challenge to the city authorities in meeting the water supply needs of the city and effective management of water resources.
Unilever, a global consumer goods firm, opened their $72m Indonsa factory in 2012. It is their second largest dry food goods factory. To reduce the use of municipal water supply, the factory makes use of alternate sources of water, such as rainwater harvesting and condensate recovery. In addition, it recycles most of the process water and greywater produced in the factory. These measures have resulted in the factory being one of the most water efficient dry food producing factories. Under normal circumstances, the need to use water from municipal supply has been almost eliminated, making available up to 12 000m3 of water for the local community per year.
Unilever was not required to implement these water efficiency measures, but they were implemented as part of Unilever’s sustainability policies and do not provide a direct financial payback to the firm.
Key Elements
- Harvesting rainwater from 22 000m2 of factory roof.
- Air conditioner condensate captured and treated for use in toilet flushing.
- Process water from the factory and the greywater from showers captured for re-use.
- Central water treatment plant which includes biological treatment and reverse osmosis.
Key Outcomes
- 80% of water demand met by on site water recycling of water that would have otherwise discharged to the ocean.
- 20% of the water demand met by harvested rainwater and condensate capture.
- Reduction in rainfall runoff from the site reducing the risk of surface water flooding in nearby communities.
- Up to 65 000 tonnes of dry goods produced per year with minimal dependence on municipal water supply.
Water StressSouth Africa
Low (<10%)Low to med (10-20%) Med to high (20-40%)High (40-80%) Extremely high (>80%)
Arid & low water use
No data available
estimated unit cost of water
>500 ¢/m3
capital cost
$ 2 900 000
water scarcity impact
12 000 m3/yrvolumetric impact
Reduced withdrawal
Reduced consumption
Improved water quality
Increased productivity
Net basin benefit
Water Stress Map:Gassert, F., M. Landis, M. Luck, P. Reig, and T. Shiao. 2013. “Aqueduct Global Maps 2.0.”
Low Medium High
Confidence level
CreditsWe wish to acknowledge the input of Geoff Sysum, Unilever in the preparation of this case study.
Water Scarcity Impact Key
Main Minor
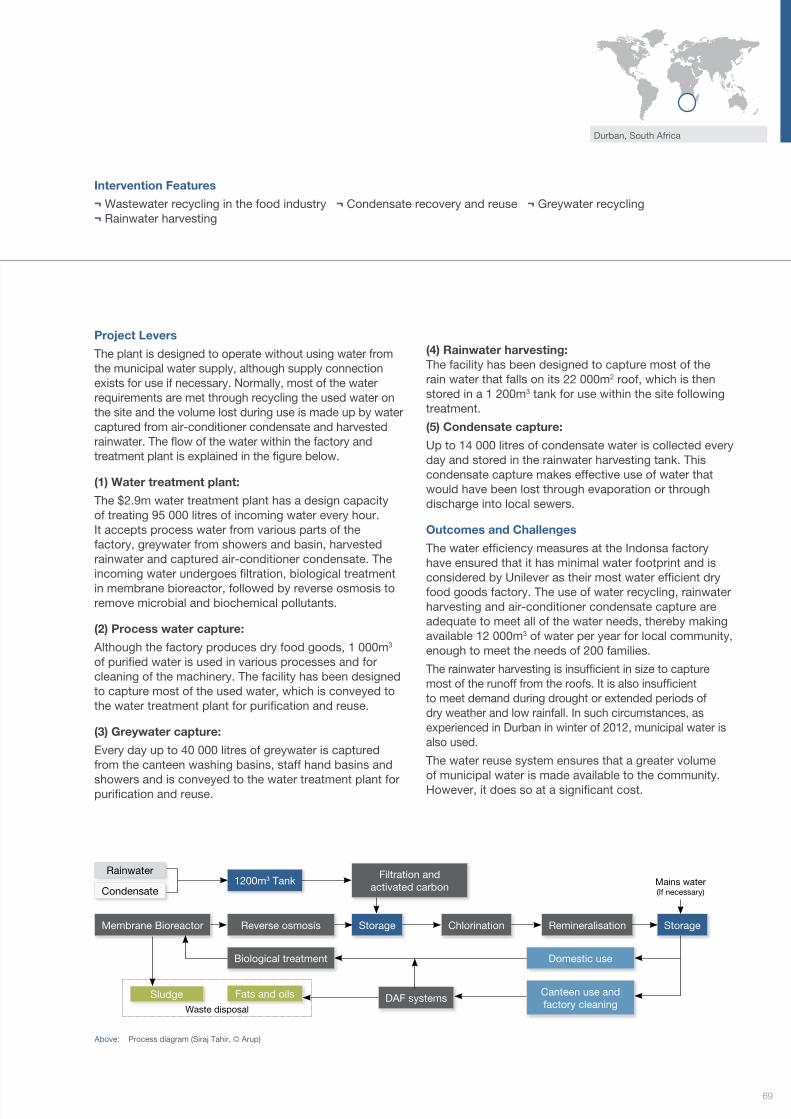
69
Durban, South Africa
Intervention Features
¬ Wastewater recycling in the food industry ¬ Condensate recovery and reuse ¬ Greywater recycling ¬ Rainwater harvesting
Project Levers
The plant is designed to operate without using water from the municipal water supply, although supply connection exists for use if necessary. Normally, most of the water requirements are met through recycling the used water on the site and the volume lost during use is made up by water captured from air-conditioner condensate and harvested rainwater. The flow of the water within the factory and treatment plant is explained in the figure below.
(1) Water treatment plant:
The $2.9m water treatment plant has a design capacity of treating 95 000 litres of incoming water every hour. It accepts process water from various parts of the factory, greywater from showers and basin, harvested rainwater and captured air-conditioner condensate. The incoming water undergoes filtration, biological treatment in membrane bioreactor, followed by reverse osmosis to remove microbial and biochemical pollutants.
(2) Process water capture:
Although the factory produces dry food goods, 1 000m3 of purified water is used in various processes and for cleaning of the machinery. The facility has been designed to capture most of the used water, which is conveyed to the water treatment plant for purification and reuse.
(3) Greywater capture:
Every day up to 40 000 litres of greywater is captured from the canteen washing basins, staff hand basins and showers and is conveyed to the water treatment plant for purification and reuse.
(4) Rainwater harvesting: The facility has been designed to capture most of the rain water that falls on its 22 000m2 roof, which is then stored in a 1 200m3 tank for use within the site following treatment.
(5) Condensate capture:
Up to 14 000 litres of condensate water is collected every day and stored in the rainwater harvesting tank. This condensate capture makes effective use of water that would have been lost through evaporation or through discharge into local sewers.
Outcomes and Challenges
The water efficiency measures at the Indonsa factory have ensured that it has minimal water footprint and is considered by Unilever as their most water efficient dry food goods factory. The use of water recycling, rainwater harvesting and air-conditioner condensate capture are adequate to meet all of the water needs, thereby making available 12 000m3 of water per year for local community, enough to meet the needs of 200 families.
The rainwater harvesting is insufficient in size to capture most of the runoff from the roofs. It is also insufficient to meet demand during drought or extended periods of dry weather and low rainfall. In such circumstances, as experienced in Durban in winter of 2012, municipal water is also used.
The water reuse system ensures that a greater volume of municipal water is made available to the community. However, it does so at a significant cost.
Membrane Bioreactor Reverse osmosis
Biological treatment
Filtration and activated carbon
DAF systems
Chlorination RemineralisationStorage Storage
1200m3 Tank
Domestic use
Canteen use and factory cleaning
Sludge Fats and oils
Rainwater
Condensate
Waste disposal
Mains water(If necessary)
Above: Process diagram (Siraj Tahir, © Arup)

70
Water recycling in paper productionCity of Jeddah, Saudi Arabia
Industrial
Project Overview
The Middle East Paper Company (MEPCO) is a paper producing company based in the City of Jeddah, Saudi Arabia, a city with extremely limited access to natural water resources. The paper producing plant is classed as a water intensive operation and is governed by an operating licence granted by the local environment authority.
The plant purchases treated wastewater from the nearby Khumarh wastewater treatment works and pays to return its process effluent back to the waste water treatment works. In 2006 the company increased its production capacity from 100 000 tonnes per year to 250 000 tonnes per year and in 2010 this was further expanded to 400 000 tonnes per year. This substantially increased the demand for raw water; in order to minimise business costs and water demand the company developed an on site water recycling process. In 2002 the company required an intake of approximately 20 000 litres of water per tonne of product produced. By 2010 this was reduced to 5 000 litres per tonne of product.
Key Elements
- Installation of screens, drum filters, two dissolved air flotation units and gravity filters to recycle a large share of the water internally.
- Installation of an effluent treatment plant, comprising of a biological treatment unit to reduce organic loading in effluent and an anaerobic treatment unit for treatment of effluent with high organic content.
- The project cost of $5.7m was funded by the Middle East Paper Company.
Key Outcomes
- Plant water demand reduced from 20 000 litres to 5 000 litres per tonne of product.
- Total reduction in demand of 6 000 000m3/yr.
- Payback time of two years for the installation of screens, drum filters, two dissolved air flotation units and gravity filters for internal recycling.
- Payback time of approximately two years for the installation of the effluent treatment plant.
- Recycling of 2 500kg of paper per day.
Water StressJeddah, Saudi Arabia
Low (<10%)Low to med (10-20%) Med to high (20-40%)High (40-80%) Extremely high (>80%)
Arid & low water use
No data available
estimated unit cost of water
10 ¢/m3
capital cost
$ 5 700 000
water scarcity impact
6 000 000 m3/yrvolumetric impact
Reduced withdrawal
Reduced consumption
Improved water quality
Increased productivity
Net basin benefit
Water Stress Map:Gassert, F., M. Landis, M. Luck, P. Reig, and T. Shiao. 2013. “Aqueduct Global Maps 2.0.”
Low Medium High
Confidence level
CreditsWe wish to acknowledge the input of Sami Safran, Osama Ibrahim, Manoj Mall, and Abbas Mohamed of Middle East Paper Company in the preparation of this case study.
Water Scarcity Impact Key
Main Minor

71
City of Jeddah, Saudi Arabia
Intervention Features
¬ Wastewater recycling in paper production
Project Levers
(1) Internal recycling of water:
Previously treated wastewater from the nearby Khumrah wastewater treatment plant was transferred to MEPCO for use in the plant process. The wastewater is pre-treated by chemical precipitation and reverse osmosis membranes before use in the paper process. Effluent from the paper process was then treated before being discharged back to Khumarh wastewater treatment plant.
In 2006, after the paper plant was expanded, MEPCO modified their on site effluent treatment plant in order to improve water quality by installing screens, drum filters, two dissolved air flotation units and gravity filters to recycle a large share of the water internally. This reduced the water consumption per tonne of product from 20 000 litres to 8 000 litres. The static screen installed enabled the separation of fibre from wastewater. This allowed recovery of fibres and increased the plants fibre conversion efficiency from 80% to 90%. Approximately 2 500kg of fibre is recovered and recycled daily. The intervention cost MEPCO $1.2m with a payback period of two years.
In 2010, MEPCO expanded its plant capacity from 250 000 tonnes/year to 400 000 tonnes/year. To provide available water for this expansion, MEPCO installed an Effluent Treatment Plant (ETP). The ETP consists of a biological treatment unit which reduces the organic loading in the effluents and an anaerobic treatment unit for treatment of effluent with high organic content. This has resulted in a reduction in water consumption per tonne of product produced from 8 000 litres to 5 000 litres. The investment for the effluent treatment plant was $4.5m with annual savings of $2.3m, resulting in a payback time of approximately two years.
Outcomes and Challenges
- Reduction in effluent discharge to Khumrah wastewater treatment plant.
- Approximately 2 500kg of fibre is recovered and recycled daily.
- Providing an available source of water for new plant capacity.
- Decrease in operating cost for the discharge of effluent.
Above: Water Use at MEPCO with and without Internal Recycle (© Middle East Paper Company)
Earlier stages of production used 20 000 litres of water per tonne of production at 400 000 tonnes/year capacity.
After the introduction of the internal recycling system specific water consumption is reduced to 5 000 litres of water per tonne of production at 400 000 tonnes/year capacity.
Pre-Intervention
Post-Intervention

72
Groundwater recharge Omdel Dam, Namibia
Industrial
Project Overview
Many of Namibia’s settlements are situated in very arid areas and depend entirely on groundwater for their water supply. Perhaps the most extreme examples are the coastal settlements of Walvis Bay, Swakopmund and Henties Bay which depend on groundwater stored in the coastal aquifers of the Kuiseb, Swakop and Omaruru Rivers. The sources of these ephemeral rivers originate more than 300km inland at altitudes of around 2 000m and rarely flow to the ocean. In the 1990’s, the rapidly growing water demand associated with these coastal settlements and a large uranium mine increased to 8 460 000m3/yr, 15 to 20% in excess of the mean annual exploitable recharge of the three aquifers combined. The situation had been further exacerbated by a series of very dry years and rapidly declining water levels in the Omdel aquifer.
In order to find a remedy, attention was focussed on the Omdel aquifer near the mouth of the Omaruru River which had the largest storage capacity at 150 000 000m3. Previous research had also identified that natural recharge in the system was reducing as a result of heavily silt-laden flood waters clogging normal recharge pathways. The scheme involved the construction of a large dam just upstream of the aquifer to catch the occasional floodwaters for subsequent controlled release to the aquifer through enhanced infiltration. The result of the project was that extractable recharge of the Omdel aquifer was more than doubled from 3 500 000m3/yr to around 7 130 000m3/yr. This, combined with the sustainable yields of the Kuiseb and Swakop Aquifers, raised the total extractable volume to 10 930 000m3/yr.
Key Elements
- Dam and associated storage in which the silt from silt-laden flood waters could be allowed to settle.
- Dam construction without foundations cutting off to bedrock, permitting natural recharge.
- A multi-level off-take to reduce silt-load transfer to the infiltration beds.
- Construction of two large infiltration areas situated downstream of the dam.
Key Outcomes
- The mean annual runoff into the Atlantic Ocean was reduced by approximately 35%.
- 100% increase in annual average recharge to the Omdel aquifer.
- The seawater desalination project was delayed until 2010.
- Increased awareness of critical need for improved watershed management practices.
- Reduced evaporation losses through maximum use of Omdel aquifer.
Water StressNamibia
Low (<10%)Low to med (10-20%) Med to high (20-40%)High (40-80%) Extremely high (>80%)
Arid & low water use
No data available
estimated unit cost of water
25 ¢/m3
capital cost
$ 16 800 000
water scarcity impact
3 630 000 m3/yrvolumetric impact
Reduced withdrawal
Reduced consumption
Improved water quality
Increased productivity
Net basin benefit
Water Stress Map:Gassert, F., M. Landis, M. Luck, P. Reig, and T. Shiao. 2013. “Aqueduct Global Maps 2.0.”
Low Medium High
Confidence level
Water Scarcity Impact Key
Main Minor

73
Above: Schematic of the recharge process
Bedrock
Abstraction Works
Dam Wall
Clear Water
In�ltration BasinSettled Silt
Abstraction Borehole
Namibia
Intervention Features
¬ Groundwater recharge ¬ Management of evaporation losses ¬ Capture of floodwaters
Project Levers
(1) Floodwater capture:
The central feature of the project was the Omdel Dam, constructed to capture flood waters and facilitate the infiltration of silt-free flood water to enhance recharge into the Omdel aquifer just downstream. Since construction was completed in 1994, on average 52% of the water stored in the reservoir has been successfully infiltrated each year, water which would have been otherwise lost to evaporation, or in the absence of the dam, to the Atlantic Ocean.
One of the challenges in the design of the embankment dam was that it should not stop the existing groundwater throughflow since this was part of the natural recharge process. Allowing for this complex natural alluvial foundation required the incorporation of several seepage control measures and the inclusion of a complex monitoring system.
(2) Reduced evaporation:
A key aim of the project was to reduce the impact of evaporation. By moving the stored surface water from the reservoir to the aquifer quickly, as much as 9 000 000m3 in around 4-6 weeks meant that exposure to evaporation rates of nearly 3 000mm/yr could be minimised.
Enhanced infiltration and recharge requires the careful application of operational rules:
- Water is released when suspended solids are less than 20mg/l.
- Rate of abstraction to be controlled by sleeve valve.
- Maximum hydrostatic head to be maintained at all infiltration beds.
- Infiltration beds to be 'cleaned' twice yearly.
- Water levels and temperature at infiltration basin observation boreholes to be continuously monitored.
Outcomes and Challenges
The main outcome of the project has been a doubling of the natural recharge to the Omdel aquifer estimated at 7 130 000m3/year instead of 3 500 000m3/year.
Other impacts of the project included:
- Increased awareness of the negative impacts of poor watershed management practices. The high profile nature of the project highlighted the fact that huge quantities of soil are lost every year through poor farming practices.
- Delaying the implementation of seawater desalination has permitted the use of newer and more cost-effective desalination technology than would have been possible in 1990.
Challenges include:
- The rate of reservoir sedimentation is a major concern and an inevitable outcome of the project. Removal of sediment from the reservoir during the dry season is not economically viable so the importance of reducing the rate of sedimentation thorough improved watershed management practices is underlined.
- Accurate flood warning is difficult given the nature of storms in the upland areas. Improved monitoring of floods as they progress downstream would facilitate better operation of the scheme.

74
Industrial
Mine water recyclingEast Kimberley, Western Australia
Project Overview
Rio Tinto’s Argyle Mine is located in the East Kimberley region of Western Australia. The mine consists of an open pit and underground development project, processing plant, two accommodation villages, an airport and ancillary facilities. The Argyle Mine is located upstream of Lake Argyle which is a RAMSAR listed site; a wetland of international importance.
In 2006, during a proposal to expand the facility, the Argyle Mine identified significant water losses in their Tailings Storage Facility (TSF). The expansion provided the opportunity to change how water is managed on site and initiated a series of site interventions to reduce the amount of freshwater abstracted from Lake Argyle and replace it with lower quality water mainly abstracted from mine dewatering activities.
The total water withdrawn from Lake Argyle has been reduced from 3 645 000m3 in 2005 to 153 000m3 in 2011. This has created an increased margin between water supply and demand in the basin and additional water availability for other users. Argyle Mine’s long term target is zero draw from Lake Argyle.
Key Elements
- Construction of two dams to collect lower grade water from mine dewatering activities and rainwater harvesting.
- Water recycling in the washing process through the use of a retention pond.
- Consultation with traditional owners on water management issues.
- The Project was financed by Rio Tinto as part of a programme to transform operations from surface to underground mining.
Key Outcomes
- 96% reduction in water abstraction from Lake Argyle from 3 645 000m3 in 2005 to 153 000m3 in 2011.
- Recycling of 40% of Argyle Mine water.
- Reduction in costs of pumping water through 35km of pipeline from Lake Argyle to the mine site and the associated reduction in energy consumption and the corresponding greenhouse gas production.
- More sustainable water supply for the community including the Ord Dam Hydropower plant, the Ord River irrigation area and the Kununurra town site and surrounding communities.
Water StressArgyle Mine, Australia
Low (<10%)Low to med (10-20%) Med to high (20-40%)High (40-80%) Extremely high (>80%)
Arid & low water use
No data available
estimated unit cost of water
10 ¢/m3
capital cost
$ 4 500 000
water scarcity impact
3 492 000 m3/yrvolumetric impact
Reduced withdrawal
Reduced consumption
Improved water quality
Increased productivity
Net basin benefit
Water Stress Map:Gassert, F., M. Landis, M. Luck, P. Reig, and T. Shiao. 2013. “Aqueduct Global Maps 2.0.”
Low Medium High
Confidence level
CreditsWe wish to acknowledge the input of Mr Peter Firth of Argyle Mine in the preparation of this case study.
Water Scarcity Impact Key
Main Minor

75
Intervention Features
¬ Wastewater reuse in mines ¬ Rainwater harvesting
Project Levers
(1) Mine dewatering and rainwater harvesting:
The Argyle Mine expansion of a 400m deep underground pit has allowed for the abstraction of water from the pit into two dams constructed by Rio Tinto (Gap dam and Jacko’s dam). The water is turbid with elevated levels of sulphate, iron, magnesium and calcium. The dams also allow for the collection of rainwater to be used throughout the mining process. Rainwater collection accounted for over 3 000 000m3 of water required on site in 2012 whilst dewatering of the underground pit accounted for more than 4 000 000m3.
(2) Water recycling at processing plant:
The biggest user on site is the processing plant where the ore is washed and separated from the tailings. A retention pond has been installed to receive the process water and feed recycled water back through the processing plant. This process pond has resulted in the recycling of 40% of Argyle mine’s water. Construction of a sump in Upper Gap Creek was implemented in order to catch any water lost from the process plant or the drainage system.
(3) Consultation with traditional owners:
The Argyle mining lease area is located in the traditional country of the Miriwung, Gidja, Malgnin and Woolah peoples. A Traditional Owner relationship committee comprising 26 Traditional Owner representatives and four Argyle Mine representatives has been set up and meets quarterly. The committee jointly monitors key activities including water management issues that may have an impact on the nearby springs that are sites of particular cultural significance to Traditional Owners. An annual inspection also takes place to provide assurance that water efficiency and water quality at the site are being maintained.
Outcomes and Challenges
The Argyle Mine has contributed to an increased sustainability of water supply to the community by reducing its consumption of Lake Argyle water from 3 645 000m3 in 2005 to 153 000m3 in 2011. This has allowed additional water availability for the Pacific Hydropower plant, the Ord River irrigation area and the Kununurra town site and surrounding communities. This benefit was highlighted in 2010 as the prior wet season did not produce enough runoff to fill dams to capacity.
As a result the Shire of Wyndham East Kimberley was on the verge of having to implement water use restrictions. If the Argyle Mine was still consuming water from Lake Argyle to similar quantities it was using in 2005, it was likely that this would have impacted on the amount of water available in Kununurra town and surrounding communities and therefore it is likely that the water restrictions would have been enforced. Pressures on the Lake Argyle water supply will increase further when the Ord Stage 2 irrigation project is completed in 2013 emphasising the importance of the Argyle Mine intervention.
The Argyle mine continues to use water from the basin through its groundwater abstraction and thus the value of the intervention arises from the transfer of the mine demand from a stressed surface water resource to a lower quality groundwater resource. Ongoing monitoring is taking place to ensure that other groundwater sources are not negatively impacted by the mine.
The $4.5m investment included the cost to construct the process retention pond as well as the 7km pipe and pumps required to return the water to the process plant. This has resulted in the recycling of 40% of the water used at the mine. Costs of pumping water have also been reduced by $150 000/yr.
East Kimberley, Australia
Above: Lake Argyle Western Australia (© Veronica Wools | Dreamstime.com)

76
Industrial
Water reuse in the power and steel production sector Gujarat, India
Project Overview
The Essar steel and power plants are located in Gujarat, India. The power plant is a multi-fuel combined-cycle plant using 3 900 000m3 of water per annum and generating 515MW of power. The Essar steel facility is located adjacent to the power plant and with a steel-making capacity of ten million tonnes per year is the fourth largest steel factory in the world. Both plants abstract water from the river Tapti and wastewater effluent is discharged into the sea.
In order to reduce the combined water footprint of the sites the power plant cooling system has been improved to reduce the freshwater demand. Blow down water that was previously discharged to the ocean is now transferred to the steel plant. In addition, wastewater from the steel plant is being treated for reuse in the power plant and for localised irrigation of landscaping. These interventions have reduced the demand on freshwater in the power plant by 835 000m3/yr and in the steel factory by 644 000m3/yr.
Key Elements
- Changes in the material specification of the powerplant condenser in order to increase the acceptable chloride concentration in the cooling towers.
- Transfer of cooling system blowdown water from the power plant to the steel plant for use as make up water.
- Recovery of backwash and clarifier sludge water in the water treatment works.
- Installation of a natural swale system for filtration of surface runoff and subsequent use for irrigation.
- The project cost of $380 000 was funded by Essar Gujarat.
Key Outcomes
- 86% of power plant waste water reused which would have otherwise been discharged to the ocean.
- 45% of recycled wastewater used in the steel plant.
- Total fresh water savings of nearly 1479 000m3/yr - 381 000m3/yr fresh water savings from increasing the chloride concentration of water used in the cooling towers. - 644 000m3/yr fresh water saving from reuse of Essar power plant blow down water in Essar steel plant process . - Fresh water savings of 105 000m3/yr by use of water extracted from clarifier sludge. - 349 000m3/year fresh water saving from reuse of recovered backwash water.
- Payback periods: - Reducing blow down water in cooling tower: 1.1 years. - Reuse of power plant blow down water in steel plant: 4.8 months. - Recovering backwash water: 4.6 months. - Recovering water from sludge: 2.2 years.
Water StressGujarat India
Low (<10%)Low to med (10-20%) Med to high (20-40%)High (40-80%) Extremely high (>80%)
Arid & low water use
No data available
estimated unit cost of water
<5 ¢/m3
capital cost
$ 380 000
water scarcity impact
1 479 000 m3/yrvolumetric impact
Reduced withdrawal
Reduced consumption
Improved water quality
Increased productivity
Net basin benefit
Water Stress Map:Gassert, F., M. Landis, M. Luck, P. Reig, and T. Shiao. 2013. “Aqueduct Global Maps 2.0.”
Low Medium High
Confidence level
CreditsWe wish to acknowledge the input of Desai Ashit of Essar Power Plant and Bharatendu Dave of Essar Steel Plant in the preparation of this case study.
Water Scarcity Impact Key
Main Minor
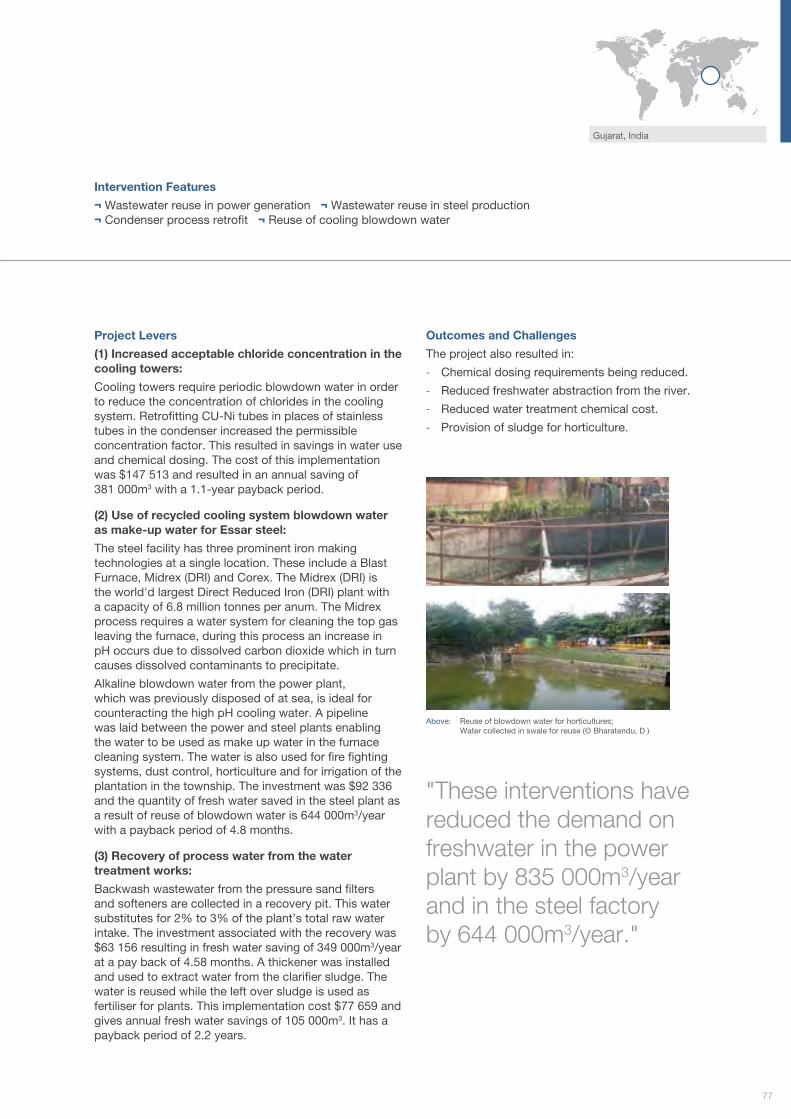
77
Intervention Features
¬ Wastewater reuse in power generation ¬ Wastewater reuse in steel production ¬ Condenser process retrofit ¬ Reuse of cooling blowdown water
Project Levers
(1) Increased acceptable chloride concentration in the cooling towers:
Cooling towers require periodic blowdown water in order to reduce the concentration of chlorides in the cooling system. Retrofitting CU-Ni tubes in places of stainless tubes in the condenser increased the permissible concentration factor. This resulted in savings in water use and chemical dosing. The cost of this implementation was $147 513 and resulted in an annual saving of 381 000m3 with a 1.1-year payback period.
(2) Use of recycled cooling system blowdown water as make-up water for Essar steel:
The steel facility has three prominent iron making technologies at a single location. These include a Blast Furnace, Midrex (DRI) and Corex. The Midrex (DRI) is the world'd largest Direct Reduced Iron (DRI) plant with a capacity of 6.8 million tonnes per anum. The Midrex process requires a water system for cleaning the top gas leaving the furnace, during this process an increase in pH occurs due to dissolved carbon dioxide which in turn causes dissolved contaminants to precipitate.
Alkaline blowdown water from the power plant, which was previously disposed of at sea, is ideal for counteracting the high pH cooling water. A pipeline was laid between the power and steel plants enabling the water to be used as make up water in the furnace cleaning system. The water is also used for fire fighting systems, dust control, horticulture and for irrigation of the plantation in the township. The investment was $92 336 and the quantity of fresh water saved in the steel plant as a result of reuse of blowdown water is 644 000m3/year with a payback period of 4.8 months.
(3) Recovery of process water from the water treatment works:
Backwash wastewater from the pressure sand filters and softeners are collected in a recovery pit. This water substitutes for 2% to 3% of the plant’s total raw water intake. The investment associated with the recovery was $63 156 resulting in fresh water saving of 349 000m3/year at a pay back of 4.58 months. A thickener was installed and used to extract water from the clarifier sludge. The water is reused while the left over sludge is used as fertiliser for plants. This implementation cost $77 659 and gives annual fresh water savings of 105 000m3. It has a payback period of 2.2 years.
Outcomes and Challenges
The project also resulted in:
- Chemical dosing requirements being reduced.
- Reduced freshwater abstraction from the river.
- Reduced water treatment chemical cost.
- Provision of sludge for horticulture.
Gujarat, India
Above: Reuse of blowdown water for horticultures; Water collected in swale for reuse (© Bharatendu, D )
"These interventions have reduced the demand on freshwater in the power plant by 835 000m3/year and in the steel factory by 644 000m3/year."

78
Industrial
Direct dry cooling in the power sectorMatimba, South Africa
Project Overview
Water resources are under considerable pressure in South Africa however they are critical for the production of electricity. Eskom, South Africa’s and the African continents leading electricity supplier is a government owned utility that provides electricity to almost 95% of all end users in South Africa, and close on 60% of the entire electricity consumption on the African continent. Eskom’s coal fired power stations are steam driven using highly purified water and there is an effort to recover and re-use water due to the high costs in production and water scarcity. Eskom have a zero discharge policy and water is only lost from the plants during the condensation of the spent steam and as ash slurry. In the financial year of 2010/11, the Eskom fleet consumed a total of 327 000 000m3 of water during the power generation process. If innovative technologies for more efficient cooling using less water had not been implemented, this consumption would have been at 530 000 000m3.
Matimba Power Station in the Limpopo Province is an example where direct dry cooling has been implemented to reduce water consumption. Limpopo Province is one of South Africa's richest agricultural areas but also particularly dry and unable to meet its water needs from its local supplies. Matimba Power Station is the largest direct-dry-cooled station in the world, with an installed capacity of greater than 4 000MW. It makes use of closed-circuit cooling technology reducing water consumption to around 0.1 litre per kWh of electricity distributed.
Key Elements
- The main driver for this intervention was the medium to long-term water resource security. This is under threat due to conflicting demands for the right to use water, depleted environmental flows, population and economic growth and the implications of climate change.
- Installation of a direct dry cooling system to reduce water losses during the condensation of the spent steam.
Key Outcomes
- Water use in Matimba power station is in the order of 0.1 litres per kWh of electricity produced.
- In comparison wet cooling system power stations use 1.9 litres per kWh of electricity produced.
- Water savings of 62 500 000m3/yr.
- Reduction in average unit power output of 1% compared to a comparable wet cooling system.
Water StressMatimba, South Africa
Low (<10%)Low to med (10-20%) Med to high (20-40%)High (40-80%) Extremely high (>80%)
Arid & low water use
No data available
estimated unit cost of water
not available
capital cost
confidential
water scarcity impact
62 500 000 m3/yrvolumetric impact
Reduced withdrawal
Reduced consumption
Improved water quality
Increased productivity
Net basin benefit
Water Stress Map:Gassert, F., M. Landis, M. Luck, P. Reig, and T. Shiao. 2013. “Aqueduct Global Maps 2.0.”
Low Medium High
Confidence level
CreditsWe wish to acknowledge the assistance of Eskom staff in the preparation of this case study.
Water Scarcity Impact Key
Main Minor

79
Intervention Features
¬ Direct dry cooling for power generation
Project Levers
(1) Installation of a direct dry cooling system:
In a steam turbine, ultra-pure water in the form of superheated steam is the main component in driving the turbine and generator to create electricity. Like any significant input to a process, maximising the efficiency of usage of the primary inputs is key to driving down not only the operational cost of the process but also reducing the environmental footprint of the process. This is particularly applicable in the case of water as it is a scarce commodity.
To achieve condensation by reducing the steam temperature in a traditional wet cooling system, a cooling water system is employed that pumps colder water from outside, through a condenser via a nest of tubes, with the steam on the outside. As a result of the temperature difference between the water and steam, condensation is achieved. The warmed cooling water then flows out to a cooling tower where an upward draft of air removes the heat from the water and after cooling, this water returns to the condenser. It is during this cycle with the upward movement of air that a substantial amount of water is lost. Typically, wet cooling uses 1.9 litres of water per kWh of electricity produced.
In the direct cooling system, steam from the final stage turbine blades is channelled directly into radiator-type heat exchangers. The direct cooling system has no cooling towers. The heat is conducted from the steam to the metal of the heat exchanger. Air passing through the exchanger is supplied by a number of electrically driven fans. The air removes the heat, thus condensing the steam back into water which will be used once again to produce steam in the boiler.
Outcomes and Challenges
Matimba Power Station is the largest operational directdry- cooled station in the world with an installed capacity of approximately 4 000MW. Water use is in the order of 0.1litres per kWh of electricity produced. This is 19 times less than the average water consumption of power stations that function with wet cooling systems and use 1.9 litres per kWh of electricity produced. Matimba uses approximately 3 500 000m3 of water per annum whilst an equivalent wet cooled power station would use an average of 66 000 000m3 per annum.
The dry cooling system requires 48 fans of 10m diameter for each of the six units. This corresponds to an auxiliary power of 72MW, approximately 2% of the station’s total generating capacity.
Whilst financial data is not available for Matimba power station, a previous Eskom estimate indicates that the capital cost of the dry cooled system is 170% of an equivalent wet cooled system.
In line with its drive to reduce overall water consumption all Eskom new build power stations are dry cooled. The water saving achieved by this is significant. However, other factors that are associated with a move to dry cooling are listed below. These are a cost incurred when generating power with a much reduced water demand.
- Increased auxiliary power demand for cooling fans.
- Generation performance is sensitive to meteorological conditions, in particular ambient temperature and high winds, this can result in a less reliable generating capacity of between 10-15%.
- The annualised capital cost of a 500MW air cooled coal fire power plant is approximately $15.5m compared to a wet cooled station figure of $3.6m.
Matimba, South Africa
Above: GEA Aircooled Systems

80
04 Municipal
© K
isfa
ri | D
ream
stim
e.co
m

81

82
Municipal
Project Overview
The Saving Water Partnership (SWP) is a group of utilities within Seattle & King County formed with the objective of reducing water demands while the economy and population of the region continue to increase. In the year 2000 The Saving Water Partnership implemented a programme called the ‘Regional 1% Water Conservation Programme’. The programme promoted a per capita reduction in water use by 1% per year for ten years and covered a service area of 1.3 million people. The first two years of the programme were ‘ramp-up years’ for programme measures, staffing and funding.
The programme was motivated by the recognition that the cheapest way to ensure future supply requirements are met is to manage demand. The programme achieved its targets and water consumption in the region is at its lowest level for fifty years.
Key Elements
- The main drivers of the programme were to reduce the risk to water supply arising from climate change and the predicted high future cost of water supply.
- The programme was financed by the utilities through water tariff revenue.
- Measures to reduce water use such as low flush toilets and washing machines with lower water consumption.
- Rebates were offered to utility company customers who purchased low water use technology.
- Household water rates were increased for the top 15% of water consumers to encourage the reduction of water use.
Key Outcomes
- Installation of 345 678 low water use fittings by customers between 2000 and 2010.
- Water savings of 3 700m3/day through use of low water use washing machines.
- Cumulative total of 363 000m3/day water saving between 2000 and 2010. These savings were calculated using the water savings made from the hardware sold as well as pre and post water bill readings.
Regional water conservation programme Seattle Water Partnership, USA
Water StressSeattle, USA
Low (<10%)Low to med (10-20%) Med to high (20-40%)High (40-80%) Extremely high (>80%)
Arid & low water use
No data available
estimated unit cost of water
40 ¢/m3
programme cost
$ 33 000 000
water scarcity impact
13 250 000 m3/yrvolumetric impact
Reduced withdrawal
Reduced consumption
Improved water quality
Increased productivity
Net basin benefit
Water Stress Map:Gassert, F., M. Landis, M. Luck, P. Reig, and T. Shiao. 2013. “Aqueduct Global Maps 2.0.”
Low Medium High
Confidence level
CreditsWe wish to acknowledge the input of Al Dietemann of the Seattle Water Saving Partnership Team in the preparation of this case study.
Water Scarcity Impact Key
Main Minor

83
Intervention Features
¬ Sprinkler irrigation systems ¬ Low flow showerheads ¬ Low flow taps ¬ Low flow toilets ¬ Water saving washing machines ¬ Subsidies for the purchase of domestic water saving appliances ¬ Water tariff management ¬ Education, technical training and capacity building ¬ Stakeholder engagement
Project Levers
(1) Market transformation:
The SWP transformed the local market in terms of water efficient technology. Incentives to purchase were promoted and low water use equipment became widely available throughout Seattle. Individual vendors were appointed and marketed the following:
- high efficiency residential and commercial washing machines;
- low water use residential and commercial toilets and urinals;
- low water use residential shower heads;
- soaker hoses for watering of gardens;
- low water use pre-rinse spray heads used in commercial kitchens.
(2) Residential indoor water use:
A number of small scale programmes were implemented into the 1% Regional Conservation Programme. These included:
- WashWise Programme – Washing machines were sold that offered 60% less energy use and 40% less water than conventional machines. Rebates from the utility company ranged from $50-$100;
- WaterSense Programme – a national labelling programme which certifies products for both water efficiency and performance tests. Customers could claim a $30 rebate if they replaced their conventional toilets with WaterSense toilets. The water savings of between $50-$200 per year on utility bills was used to promote the product.
Customers of the utility company receive newsletters which were used to publicise the new water saving devises and financial savings that can be delivered. Other water savings came from the sale and use of low water use shower heads and aerators as well as multifamily coin operated washing machines.
(3) Commercial and residential landscape water use:
This included a series of lectures to promote good practices in gardening including the application of mulch the addition of compost to soil and the selection of plants based on the sun, shade and soil in individuals’ gardens. A water saving ‘Garden Hotline’ was established as well as training for irrigation professionals, and an online weather data, watering index and irrigation scheduling tool.
(4) Commercial processes:
The SWP encouraged improvements in cooling performance and upgrades of specific water consuming equipment. Financial incentives were offered by the utility company who would cover up to 50% of the costs of the water saving technology. End-use measuring was used for monitoring and to build cost effective conservation recommendations.
(5) Youth education:
Workshops, classroom presentations, curriculum development and watershed tours were given in local schools and youth groups. The SWP developed a computer game, ‘Water Busters’. The aim of the game is to discover all the areas in the house where water is being wasted and provide solutions to reduce this waste.
(6) Tiered water rates:
Water rates were raised to encourage the efficient use of water. An adopted tiered tariff that makes excessive water use very expensive was introduced – however the base rate for frugal customers remained the same. Approximately 7% of Seattle’s high consuming residential customers pay the highest tier water rate consuming approximately 51 000 litres/month/household.
Outcomes and Challenges
Through the interventions of the Saving Water Partnership, the total water consumption in Seattle since 1990 has decreased by 40% despite an increase in population of 16%. The SWP regional water service area’s population grew by 9% throughout the 10-year programme yet total water consumption was reduced by 12% (from 507 000m3/day in 2000 to 448 000m3/day in 2010) These savings were calculated using the savings from the hardware equipment sold and the savings from pre and post programme water bills.
A major challenge was the implementation of suitable rebates that would be given to customers who invested in water efficient technology. Providing water efficient measures for free meant the customer felt no ownership over the technology, yet enough rebate had to be offered to ensure people would actively buy the equipment.
The programme was funded through water rates. No outside subsidies from taxes, grants or other sources were received. For the average residential customer, the saving water partnership budget was a small component of their overall water bill - approximately 2%.
Seattle, USA

84
Municipal
Project Overview
The integrated Orange-Senqu River System supplies water to 60% of South Africa’s economy and to neighbouring Lesotho, Botswana and Namibia; it is under extreme water stress and severe water shortages could be experienced in the near future. Emfuleni Local Municipality (ELM), is located in the catchment and experiences annual mean water losses of 44% (36 000 000m3), and in some areas in excess of 80%. Like many other South African municipalities, it does not have the necessary capacity, instruments or resources to reduce its water demand.
The intervention involves a public-private partnership between the ELM, Sasol New Energy and GIZ, with additional participation from ORASECOM (the Orange-Senqu River Commission). The project reduces Sasol’s water risks whilst simultaneously reducing the municipality’s costs and its increasing water supply security. Meanwhile it supports the wider ORASECOM’s objectives which are to reduce stress on the water resources of the Orange-Senqu River.
The project involves pressure management, network leakage reduction and domestic leakage reduction in over 80 000 properties.
Key Elements
- Innovative performance based public private partnership involving industry, local government and funding agencies.
- Reinvestment of audited ring-fenced savings to ensure continuity of the intervention for two to three years.
- Education, capacity and awareness building to gain community support.
- High degree of buy-in from stakeholders.
- Installation of an advanced pressure management system.
- Mains and domestic leakage repairs.
Key Outcomes
- 10 000 000m3/yr of water saved in phase 1. It is forecasted this will increase to 12 000 000m3 by 2014.
- Financial savings of almost $10m are expected which will be reinvested in the project and will in turn create further savings.
- Capacity is being created within both the municipality and the local community in various forms including: - over 20 Community Liaison Officers. - 50 basic plumbing teams capable of repairing most of the common internal plumbing leaks. - education and awareness at schools and within the municipal managers.
Reducing business risk through municipal leakage reduction Emfuleni, South Africa
Water StressEmfuleni, South Africa
Low (<10%)Low to med (10-20%) Med to high (20-40%)High (40-80%) Extremely high (>80%)
Arid & low water use
No data available
estimated unit cost of water
<5 ¢/m3
capital cost
$ 2 500 000
water scarcity impact
10 000 000 m3/yrvolumetric impact
Reduced withdrawal
Reduced consumption
Improved water quality
Increased productivity
Net basin benefit
Water Stress Map:Gassert, F., M. Landis, M. Luck, P. Reig, and T. Shiao. 2013. “Aqueduct Global Maps 2.0.”
Low Medium High
Confidence level
CreditsWe wish to acknowledge the input of Emfuleni Local Municipality in the preparation of this case study.
Water Scarcity Impact Key
Main Minor

85
Intervention Features
¬ Replacement of tap and toilet washers ¬ Municipal leakage detection and repair ¬ Pressure management in municipalities ¬ Flow monitoring in municipalities ¬ Education, technical training and capacity building ¬ Stakeholder engagement
Project Levers
(1) Innovative public-private collaboration:
Seed funding for the current phase (2011-2014) was provided by GIZ ($0.56m) and Sasol New Energy ($0.56m), with further funding from ELM (about $2.22m) based on the savings achieved in the first year. These savings are expected to exceed $7.2m by the end of the project based on the purchase price of more than $0.5/m3 paid by the ELM. GIZ and Sasol also provide technical support and facilitation.
It was necessary to ring fence the water savings for use on future water demand and loss management interventions. The reinvestment of the savings is an essential element of the project. Managing the water savings and accessing future funds required the establishment of robust and transparent auditing mechanisms.
(2) Education, awareness and capacity building:
A key element of the project was education and awareness in the community and schools on various water conservation issues and on the development of new or the support of existing community plumbing entities.
Fifteen “Water Warriors” were appointed to carry out house house visits to raise awareness of the leakage problems and the need to save water.
(3) Leakage repairs:
Around 30 local plumbers were appointed to follow up the 'Water Warrior' house visits. By February 2013 more than 30 000 tap and 50 000 toilet washers had been replaced on 23 000 properties. 25 schools have been audited and leakages repaired. Internal repairs have been complemented by ongoing repairs to the distribution network.
(4) Monitoring and evaluation:
More than 20 GSM flow and pressure loggers were installed which provide real-time information. This data acquisition and display system has helped to improve the understanding of the water supply and demand balance, the identification of priority areas for leak repairs, and the monitoring of savings.
Outcomes and Challenges
The main outcome of the pilot project has been the successful establishment of an innovative public private partnership to provide funding for water demand management activities within the Emfuleni Local Municipality. Other impacts of the project include:
- Significant water savings estimated to reach 12 000m3/year by June 2014 and a concomitant reduction in water risks for all users on the catchment; allowing more water to stay in the shared river basin and thereby increasing availability to other users and even neighbouring riparian countries.
- Reinvestment of $7.22m from savings in various interventions that will themselves result in further savings.
- Allowing Sasol to offset its own water use and help secure its own future water supply.
- ELM water purchases have reduced due to the lower water losses which in turn resulted in significant energy savings since all water supplied to the area is pumped 45m in elevation.
- The project increased security of supply for residents. Without the interventions, the area would be operating on intermittent supply which also has serious water quality implications.
- Development of a model that can be replicated by many other municipalities operating under similar circumstances.
- Increased level of community awareness of the value of water and the necessity to reduce wastage.
Emfuleni, South Africa
Above: Burst pipe in Evaton (© Morena Mokubung)

86
Municipal
Project Overview
Between 2000 and 2010 Australia experienced extended periods of drought that increased the strain on water resources. In response to this, the Water Loss Management Programme (WLMP) was jointly initiated between the Local Government Association of New South Wales (NSW) and the Shires Association of NSW,the Water Directorate and the Australian Government through the Water Smart Australia programme. The aim of the WLMP was to support smaller Local Water Utilities (LWUs) in their efforts to reduce leakage from their drinking water distribution systems. The batching of projects under WLMP also allowed eligibility with federal government funding criteria. Specialist knowledge and equipment were provided to LWUs in order to help identify, develop and implement leakage reduction projects. The original programme design and budget was based upon a four year term from 2006-2010 and planned to engage with 33 LWUs across NSW. Eventually, the programme was extended to a five year term (2006-2011) and engaged with 75 LWUs. The WLMP achieved ongoing water savings of 5 518 000m3/year.
Key Elements
- Production of training material and provision of expertise in leakage reduction to guide small water utilities without in-house technical expertise.
- Leakage detection and repair.
- Installation of flow meters, establishment of distribution zones and installation of Pressure Reducing Valves.
- Batching of projects to access Australian Federal Government funding.
- The $9.2m cost (2013 prices) was funded through the Government, LWUs and in-kind contributions from other partners.
Key Outcomes
- 80 investigation projects were undertaken with 75 LWUs.
- 61 projects received a funding agreement to undertake a water loss management project.
- The programme achieved on-going water savings of 5 518 000m3/year.
- 1 million kWh in energy savings and 1.2 million Kg CO2e reduction in emmisions were achieved due to reduced abstraction, pumping and treatment requirements.
- Technical capability in water loss management techniques was established within LWUs.
- Infrastructure enhancements were instigated to enable sustainability of water savings.
Water loss management programme New South Wales Regional Water Utilities, Australia
Water StressNew South Wales, Australia
Low (<10%)Low to med (10-20%) Med to high (20-40%)High (40-80%) Extremely high (>80%)
Arid & low water use
No data available
estimated unit cost of water
10 ¢/m3
capital cost
$ 9 200 000
water scarcity impact
5 518 000 m3/yrvolumetric impact
Reduced withdrawal
Reduced consumption
Improved water quality
Increased productivity
Net basin benefit
Water Stress Map:Gassert, F., M. Landis, M. Luck, P. Reig, and T. Shiao. 2013. “Aqueduct Global Maps 2.0.”
Low Medium High
Confidence level
CreditsWe wish to acknowledge the input of Gary Mitchell of the Water Directorate in the preparation of this case study.
Water Scarcity Impact Key
Main Minor

87
Intervention Features
¬ Municipal leakage detection and repair ¬ Pressure management in municipalities ¬ Flow monitoring in municipalities ¬ Education, technical training and capacity building ¬ Stakeholder engagement
Project Levers
The WLMP was a $8.7m programme (2011 prices) that comprised $4.21m in funding from the Australian Government through the Water for the Future initiative, $4.16m from the participating LWUs and $350 090 of in-kind contributions from other partners. The funding covered investigations, construction, initial operational and equipment costs. Components of the scheme are listed below:
(1) Local Water Utilities engagement plan:
Technical workshops were held around New South Wales to encourage LWUs to seek a free consultation service and apply for funds to assist with their water loss management programmes.
(2) Metering and water loss calculations:
Water balance calculations and analysis of minimum night flows were the two main methods used to measure water losses within the water supply network. The WLMP investigated over 180 metered zones with funded projects reducing water loss in almost 100 zones.
(3) Investment in technology:
Historically, water leaks have been fixed when they appeared at the surface, however with the installation of bulk flow metering, insidious leakage was identified. If significant, it was located and pinpointed using active leak detection technology. In areas of substantial water loss, physical network improvements were carried out to enable improved pressure management such as the installation of pressure reducing valves.
(4) Capacity building:
LWUs were provided with specialist expertise and offered guidance in methodologies to detect and prevent leaks. The publication of the Water Loss Management Awareness and Education Guidelines by the Water Directorate also offered support and knowledge to LWUs that would not have otherwise had the expertise to manage water loss through leakage.
Outcomes and Challenges
By the end of WLMP, 75 LWUs had participated and a total of 61 projects were funded. Two of the projects did not proceed due to timing and resource issues. Prior to the programme, the use of analysis software identified a potential saving of 5 200 000m3/yr, however the programme surpassed this achieving a saving of 5 518 000m3 per annum. The energy savings from reduced abstraction, pumping and treatment have been estimated to be in the region of 1 million KWh and 1.2 million kg C02e.
The WLMP’s aim of achieving sustainable water savings has led to the investment in permanent water flow metering and monitoring technology. The majority of LWUs that completed a funded project installed permanent metering and monitoring to ensure that leakage can continue to be monitored.
The majority of participating LWUs have also significantly improved their ability to undertake water loss management work within their water distribution network. The provision of the Water Loss Management Awareness and Education Guidelines, along with the ‘hands on’ engineering consultancy provided by programme staff, has led to a major improvement in the capacity of LWU staff to measure and mitigate against future water loss.
New South Wales, Australia
Above: Upgrades to domestic water supply pipe work (© Pupunkkop | Dreamstime.com)

88
Municipal
Advanced pressure management City of Cape Town, South Africa
Project Overview
Khayelitsha is one of the largest townships in South Africa with a popultaion of 450 000. It is located approximately 20km from Cape Town Central Business District on the Cape Flats, a large flat sandy area at or near sea level. In the early 2000s, an investigation into leakage levels established that the water lost could almost fill an Olympic sized swimming pool every hour. The main source was identified as household leakage and in particular poor quality plumbing fittings which have been badly damaged through constant exposure to high pressure. Such leakage resulted in very high water use in most properties and high levels of non-payment since the customers could not afford to pay for new taps and toilet fittings, let alone their high water bills. The Khayelitsha Pressure Management Project was commissioned in 2001 to improve the level of service to the Khayelitsha community by reducing the excessive water pressure and pressure fluctuations in the reticulation system, particularly during the off-peak periods of low demand. Resultant water savings were immediate, sustainable and exceeded the most optimistic projections, amounting to almost 40% of the original supply.
Key Elements
- Measurement of night flows to estimate leakage levels.
- Extensive community consultation and participation at all stages of the project created favourable conditions for project implementation.
- Labour-based construction using locally available labour was an important part of the project and a prerequisite for community support.
- Advanced pressure management techniques were employed to reduce the excessive water pressure and pressure fluctuations in the reticulation system.
- Financing of $700 000 was provided by the municipality.
Key Outcomes
- Major savings on water purchases from the bulk water supplier: four month payback.
- Reduced wastage of water through leakage repairs especially on internal reticulation networks.
- Water savings of approximately 9 000 000m3/yr achieved representing $5m per annum of bulk water purchases.
- Awareness and education efforts have helped to create consumer support for water use efficiency in the area.
- In this local context the reduction of leakage reduces consumptive use as in this location leakage is generally lost to saline sources.
Water StressCape Town, South Africa
Low (<10%)Low to med (10-20%) Med to high (20-40%)High (40-80%) Extremely high (>80%)
Arid & low water use
No data available
estimated unit cost of water
<5 ¢/m3
capital cost
$ 700 000
water scarcity impact
9 000 000 m3/yrvolumetric impact
Reduced withdrawal
Reduced consumption
Improved water quality
Increased productivity
Net basin benefit
Water Stress Map:Gassert, F., M. Landis, M. Luck, P. Reig, and T. Shiao. 2013. “Aqueduct Global Maps 2.0.”
Low Medium High
Confidence level
CreditsWe wish to acknowledge the input of the City of Cape Town and the township of Khayelitsha in the preparation of this case study.
Water Scarcity Impact Key
Main Minor
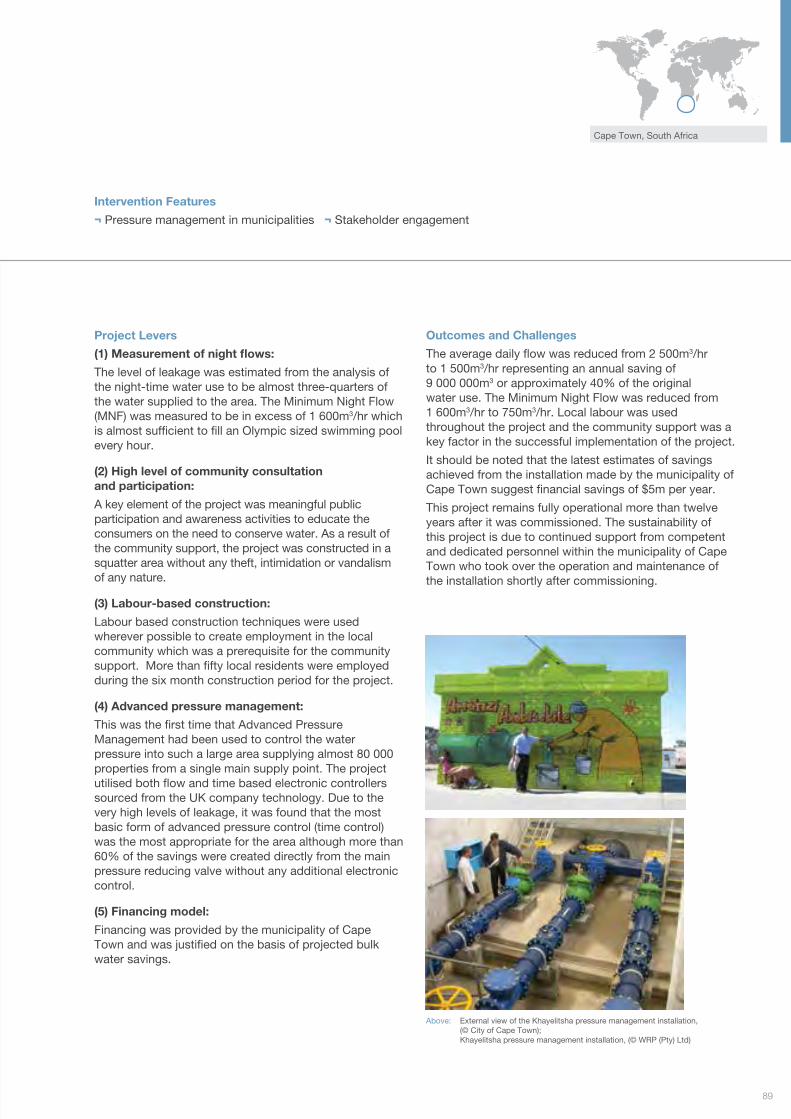
89
Intervention Features
¬ Pressure management in municipalities ¬ Stakeholder engagement
Cape Town, South Africa
Project Levers
(1) Measurement of night flows:
The level of leakage was estimated from the analysis of the night-time water use to be almost three-quarters of the water supplied to the area. The Minimum Night Flow (MNF) was measured to be in excess of 1 600m3/hr which is almost sufficient to fill an Olympic sized swimming pool every hour.
(2) High level of community consultation and participation:
A key element of the project was meaningful public participation and awareness activities to educate the consumers on the need to conserve water. As a result of the community support, the project was constructed in a squatter area without any theft, intimidation or vandalism of any nature.
(3) Labour-based construction:
Labour based construction techniques were used wherever possible to create employment in the local community which was a prerequisite for the community support. More than fifty local residents were employed during the six month construction period for the project.
(4) Advanced pressure management:
This was the first time that Advanced Pressure Management had been used to control the water pressure into such a large area supplying almost 80 000 properties from a single main supply point. The project utilised both flow and time based electronic controllers sourced from the UK company technology. Due to the very high levels of leakage, it was found that the most basic form of advanced pressure control (time control) was the most appropriate for the area although more than 60% of the savings were created directly from the main pressure reducing valve without any additional electronic control.
(5) Financing model:
Financing was provided by the municipality of Cape Town and was justified on the basis of projected bulk water savings.
Outcomes and Challenges
The average daily flow was reduced from 2 500m3/hr to 1 500m3/hr representing an annual saving of 9 000 000m3 or approximately 40% of the original water use. The Minimum Night Flow was reduced from 1 600m3/hr to 750m3/hr. Local labour was used throughout the project and the community support was a key factor in the successful implementation of the project.
It should be noted that the latest estimates of savings achieved from the installation made by the municipality of Cape Town suggest financial savings of $5m per year.
This project remains fully operational more than twelve years after it was commissioned. The sustainability of this project is due to continued support from competent and dedicated personnel within the municipality of Cape Town who took over the operation and maintenance of the installation shortly after commissioning.
Above: External view of the Khayelitsha pressure management installation, (© City of Cape Town); Khayelitsha pressure management installation, (© WRP (Pty) Ltd)

90
Municipal
Leakage reduction in a city City of Jeddah, Saudi Arabia
Project Overview
The City of Jeddah is Saudi Arabia’s largest city and has a population of 3.5 million. It has an annual rainfall of just 84mm. It is highly water stressed and depends upon desalination for the majority of its water supply. The production cost is estimated to be $1.86/m3. Current demand is 1 200 000m3/day and this is forecast to increase to 20 000 000m3/day by 2029. The water supply system to the city is intermittent with extreme variations in pressure; on average there are 1 600 pipe repairs per month and levels of unaccounted for water are in the region of 40%, equivalent to $892 000 worth of desalinated water per day. A ministerial target for unaccounted for water has been set at 10%.
In 2008 a joint venture of Acwa Power and Suez Environment were awarded a seven-year water services management contract under which a number of measures have been implemented to reduce unaccounted for water. This case study reports on successes achieved in the pilot phase of the implementation of pressure management and network management systems in a number of district zones.
Key Elements
- A management contract for the City of Jeddah was established in 2008 including service continuity key performance indicators.
- Network modifications were made to establish fifty one independent supply zones.
- Pilot stage 1: Implementation of Pressure Regulating Valves (PRVs) in sixteen district zones.
- Pilot stage 2: Installation of advanced automatic network pressure management and control systems for two of the sixteen district zones in which PRVs had been installed.
Key Outcomes
The Pilot stage resulted in:
- Water savings of 12% equivalent to a saving of 4 300m3/day.
- The number of leaks was reduced by 50%.
- Average zone pressure reduction of 1.5 bar.
- Rationing reduced enabling supply once a week.
- Expanded continuous service to 20% of customers.
The Pilot stage 2 resulted in:
- A further 10% decrease in leakage achieved, equivalent to 3 200m3/day of water loss savings.
- Additional average pressure decrease of 20%.
- The majority of water supply comes from desalination, thus it is assumed that leakage is a consumptive demand and lost to saline sources. A reduction in leakage therefore results in a reduction in consumptive demand.
Water StressCity of Jeddah, Saudi Arabia
Low (<10%)Low to med (10-20%) Med to high (20-40%)High (40-80%) Extremely high (>80%)
Arid & low water use
No data available
estimated unit cost of water
not available
capital cost
confidential
water scarcity impact
2 737 000 m3/yrvolumetric impact
Reduced withdrawal
Reduced consumption
Improved water quality
Increased productivity
Net basin benefit
Water Stress Map:Gassert, F., M. Landis, M. Luck, P. Reig, and T. Shiao. 2013. “Aqueduct Global Maps 2.0.”
Low Medium High
Confidence level
CreditsWe wish to acknowledge the input of Jawad Bhatti of i2O water and Dieago Lucente and Philippe Charpentier of Suez Environment in the preparation of this case study.
Water Scarcity Impact Key
Main Minor

91
Project Levers
(1) Establishment of pressure management zones:
In order to enable management of supply across the network 51 independent supply zones were established.
(2) Pilot Stage 1 - Pressure Regulating Valves and flow measurement:
Pressure Regulating Valves (PRVs) and flow meters were installed in 16 district zones. This allowed for a greater degree of network control by sustaining upstream pressure, reducing pressure inside the zones, and matching the flow into the zones with demand.
After the intervention the outcome in district zone HH was measured. The demand of the zone prior to installation of the PRVs was 36 400m3/day. After the PRVs were installed, this demand was reduced to 32 100m3/day, equating to a 12% water saving. The number of leaks was halved and the average pressure reduced by 1.5 bars. Furthermore, the implementation of PRVs to a non-continuous supply improved the supply of water from once in 24 days to once every 8 days, with 20% of customers receiving continuous service.
(3) Pilot Stage 2 - advanced pressure management:
An i2O water advanced pressure management system was installed in two zones, managed from the central network control, with the zones operating under continuous supply.
The outcomes were almost immediate; in one zone water savings were achieved of approximately 3 200m3/day, this was accompanied with a 20% reduction in pressure and an estimated 40% reduction in pipe bursts.
Outcomes and Challenges
The interventions provided additional benefits beyond water savings, these include:
- Reduced operational staff requirements and operational costs through remote monitoring.
- Greater control and the ability to proactively manage supply zones.
- Reduced damage to infrastructure and greater asset life as a result of reduced pressures.
- Increased continuity of supply to customers.
Intervention Features
¬ Municipal leakage detection and repair ¬ Pressure management in municipalities
City of Jeddah, Saudi Arabia
Above: Network of 51 independent supply zones (© Suez Environment)
Above: Commercial centre Jeddah (© Aljadani | Dreamstime.com)

92
Municipal
Aquifer recharge with stormwater City of Salisbury, Adelaide, Australia
Project Overview
Overall water demand of the Adelaide metropolitan area is around 200 000 000m3/yr. In a dry year up to 90% of this must be met from the highly stressed River Murray which is suffering from increased salinity, over extraction, increasing pollution and dying ecosystems. In 2003 Adelaide experienced extensive water restrictions for the first time since a major transfer pipeline was built in 1954. As a result a number of strategies have been developed to address the supply demand imbalance and to secure sustainable water supplies into the future.
Recognising that up to 90% of demand for potable water supply could be replaced with non-potable supply the City of Salisbury implemented the collection, storage and distribution of stormwater run-off that would have otherwise discharged to the Gulf of St Vincent. By 2009 the city had established 20 wetlands for treatment of stormwater and twenty two aquifer storage boreholes. 5 000 000m3 of stormwater was collected in the wet months, stored and then distributed in the dry months. It is anticipated that this figure could rise to 14 000 000m3 by 2014. The capital investment up to 2009 cost approximately US$52m.
Key Elements
- Urban stormwater harvesting from the engineered drainage network.
- Constructed wetlands and small footprint bio filtration technology for treatment prior to storage.
- Storage of treated water in a confined aquifer.
- Non-potable distribution system (“Purple” pipe system).
- Funded by grants and money borrowed by the City of Salisbury against future income from sales to customers.
Key Outcomes
- The treatment and reuse of 5 000 000m3/yr of non-potable water.
- 20% of all injected water maintained within the aquifer (260 000m3).
- Avoidance of pollution to the sensitive estuary environment (Barker’s Inlet).
- Reduced energy cost for industry due to reduced salinity.
- Establishment of a non-potable water revenue stream.
- Payback period of five years.
- Consumptive use from evaporation is minimised through storage in the aquifer.
Water StressCity Of Salisbury, Australia
Low (<10%)Low to med (10-20%) Med to high (20-40%)High (40-80%) Extremely high (>80%)
Arid & low water use
No data available
estimated unit cost of water
100 ¢/m3
capital cost
$ 57 000 000
water scarcity impact
5 000 000 m3/yrvolumetric impact
Reduced withdrawal
Reduced consumption
Improved water quality
Increased productivity
Net basin benefit
Water Stress Map:Gassert, F., M. Landis, M. Luck, P. Reig, and T. Shiao. 2013. “Aqueduct Global Maps 2.0.”
Low Medium High
Confidence level
CreditsWe wish to acknowledge the input and support of Bruce Naumann of Salisbury Water in the preparation of this case study.
Water Scarcity Impact Key
Main Minor

93
Intervention Features
¬ Groundwater recharge ¬ Non-potable water distribution system ¬ Stormwater harvesting
Project Levers
1) Collection, Treatment and Storage:
A harvesting weir diverts stormwater from the Dry Creek catchment (130km2) to a gravity supply main which fills a sedimentation basin. Prior to injection in the aquifer stormwater must be treated to an acceptable standard, this is done through a system of two wetlands and six biofilters. The filtered water is then pumped to nine boreholes that are used to transport the water into the storage aquifer.
2) Water Distribution:
Stored water is recovered from the aquifer and distributed through a dedicated non-potable network serving over 500 customers; this is an all year round process.
Within a 1-2km radius of the proposed scheme there is a demand for 400 000m3 of water from industries who are interested in receiving harvested stormwater. Further network expansion has allowed for 650 000m3 to be distributed throughout the rest of the city.
Over 5 500m of water pipe (280-355mm diameter) as well as 4 000m of electrical and communication infrastructure was constructed as part of the project.
Outcomes and Challenges
Treatment and reuse of urban stormwater has resulted in a reduction of vast amounts of sediment and nutrients being discharged to the marine environment reducing pollutants.
The target aquifer system has undergone stress in the past due to industrial extractions. This scheme will help provide additional fresh water to offset the impacts of this.
The scheme uses passive treatment technologies which minimises pumping, whilst the proximity to customers minimises distribution energy costs. As a result the embodied energy of the recycled water is up to 20% less than the drinking water supply.
The stormwater is of a lower salinity (200mg/l TDS than mains potable water (up to 500mg/l TDS), for some industrial customers this reduces the energy they expend to desalinate mains water.
Adelaide, Australia
Wetland
Injection Bore
Soils and Sediments
Clay Con�ning Beds
Aquifer
Above: The collection, treatment and aquifer storage process
Stormwaterdrain
Aquifer
O�-streamstorage
Holdingstorage
Wetlandbio-�lter
Injection and recovery well
Abstraction
Diversion Settlement of grosspollutants and �nes
- Filtration- Aerobic degradation- Phyto remediation
- Anaerobic degradation- Pathogen attenuation
1-10 days 10 days20 days
Above: Aquifer storage and recovery

94
Municipal
Water demand management schemeDrakenstein, South Africa
Project Overview
The Drakenstein Municipality has a total population of 224 240. In 1999 faced with an annual growth in water demand of 3.5% and non revenue water standing at 33%, it decided to take action. This took the form of a comprehensive water demand management programme which had six goals; i) reducing the high percentage of non-revenue water, ii) reducing the high static water pressures iii) reducing the high average daily demand, iv) increasing the total revenue collected by the Municipality, v) providing a more constant and efficient service to consumers and vi) conserving water which was becoming increasingly scarce. Approximately 10% of its water was derived from its own sources with the remaining 90% purchased from the City of Cape Town. The high level of non revenue water provided a major opportunity to decrease the municipality’s water bill and at the same time reduce wastage. Interventions were wide-ranging although the introduction of advanced pressure management throughout the system provided the backbone to the overall water demand management programme. Over a period of approximately 12 years, Drakenstein Municipality lowered the non revenue water from over 33% to just under 11% and currently ranks amongst the best municipalities in South Africa with regards to water use efficiency.
Key Elements
- Hydraulic modelling of master plan for the reticulation network to optimise design and performance.
- Metering of all abstraction points.
- Introduction of a tiered block tariff structure supplying essential water at a low cost while at the same time penalising heavy users.
- Increased public awareness including promotion of water saving devices.
- Refurbishment of network infrastructure, leak detection and repair.
- Construction and implementation of pressure management system.
Key Outcomes
- Water demand was reduced from 17 800 000m3/year in 2000 down to 11 900 000m3/yr in 2011 representing major savings on water purchases from the bulk water supplier.
- Non revenue water was reduced from 35% to 11% in twelve years resulting in increased revenue for the municipality.
- The performance indicator for physical leakage (ILI) was reduced to below two by 2012 which is one of the lowest (best) in South Africa.
- Value of water savings over the twelve-year period was approximately $85m based on current bulk water tariff of approximately $0.6/m3.
Water StressDrakenstein, South Africa
Low (<10%)Low to med (10-20%) Med to high (20-40%)High (40-80%) Extremely high (>80%)
Arid & low water use
No data available
estimated unit cost of water
<5 ¢/m3
capital cost
$ 2 000 000
water scarcity impact
5 900 000 m3/yrvolumetric impact
Reduced withdrawal
Reduced consumption
Improved water quality
Increased productivity
Net basin benefit
Water Stress Map:Gassert, F., M. Landis, M. Luck, P. Reig, and T. Shiao. 2013. “Aqueduct Global Maps 2.0.”
Low Medium High
Confidence level
CreditsWe wish to acknowledge the input of Mr Andre Kowaleski of the Drakenstein Municipality in the preparation of this case study.
Water Scarcity Impact Key
Main Minor

95
Intervention Features
¬ Municipal leakage detection and repair ¬ Pressure management in municipalities ¬ Water metering in municipalities ¬ Water tariff management ¬ Stakeholder engagement
Drakenstein, South Africa
Project Levers
(1) Hydraulic modelling:
A network hydraulic model was used to identify areas of high pressure and to assist in sectorising the network into discrete pressure management zones. Real time data logging was used to monitor the zones and pick up any unauthorised zone valve operations which in turn compromise the pressure management activities.
(2) Metering and block tariff structure:
By the end of the project all properties had been metered and rising block tariff structure was used to charge consumers for all water used. The tariff structure was designed to provide the initial consumption at a heavily subsidised rate, with high volume users paying significantly more in order to discourage water use and at the same time subsidise low volume users.
(3) Public awareness and water savings devices:
Significant efforts were undertaken to educate the consumers on using water efficiently and at the same time create general awareness on the scarcity of water in the region. Various interventions were implemented inside the consumer properties to reduce wastage and water use including basic plumbing repairs as well as the introduction of certain water saving devices. The project enjoyed a high level of support within the community due in part to the job creation through the use of labour-based construction methods using only local labour in conjunction with extensive stakeholder consultation.
(4) Refurbishment and leakage repair:
One of the key interventions of the water loss reduction programme was the identification of water leaks on the reticulation system and a policy to repair all known leaks within an hour where possible. This rather ambitious target for repairing known and reported leaks has helped to reduce physical leakage in the system to one of the lowest levels in South Africa. In cases where pipes had to be replaced, only high quality pipes were used and in many cases, stainless steel fittings were used which greatly reduce future pipe bursts.
(5) Advanced Pressure Management:
Advanced Pressure Reduction was achieved through the introduction of seven pressure reduction valves ranging from 100mm diameter to 300mm, each fitted with flow modulated electronic controllers. The cost of the pressure management installations (i.e. valves, pipe work, chambers, and controllers) was approximately $0.5m, which was paid back through the savings within five months.
Outcomes and Challenges
The goals of the water demand management scheme were met in full. The unacceptably high level of non-revenue water was reduced from 33% to just 11% over a period of 12 years. Despite selling less water to its consumers, a combination of the new block tariff structure and the fact that the municipality was buying significantly less water from the City of Cape Town, resulted in a significant gain in net revenue which greatly outweighed the costs of the various interventions. The value of water savings over the twelve-year period amounted to approximately $85m. Most significantly, the water demand was reduced from 17 800 000m3/yr to 11 900 000m3/yr ensuring that the final goal of water conservation was fulfilled.
Above: Typical GSM Pressure Logger used in the Web Based data acquisition and display systems (© WRP (pty) Ltd)

96
Municipal
Water Authority conservation programmeNevada, USA
Project Overview
The Las Vegas Valley is extremely arid and is classed as having a subtropical desert climate, with extremely high summer temperatures and high evapotranspiration. Since 2000 the valley has been suffering from a severe and ongoing drought. Most of the water used in the valley is withdrawn from the Colorado River via Lake Mead and then returned as treated effluent back to the Colorado River. The security of supply is dependent upon reducing per capita demand, in particular those arising from landscape irrigation and evaporative cooling which make up 60% of the total demand.
The Southern Nevada Water Authority (SNWA) subsequently instituted a raft of aggressive water conservation programmes from 2000 onwards that included monetary incentives, education and regulatory policies. Specifically, policy measures included new building codes, tiered water rates and restrictions on landscape irrigation.
Cumulatively, these measures have helped to reduce per capita daily use by 30% by 2011 and reduced water demand by 51 926 000m3/yr.
Key Elements
- $218m in rebates for replacing grass turf with low water demand desert landscape, installation of pool covers and use of water efficient technologies.
- Restrictive Covenants preventing participating property owners from reinstalling grass.
- Local ordinances restricting landscape irrigation at various times of the year.
- Development ordinances restricting extent of grass in new developments.
- Tiered water rates to create incentives for reducing water use.
- Introduction of a certification programme for water efficient homes.
Key Outcomes
- 15km2 of grassed landscape converted to water efficient desert landscapes, reducing landscape water use by 34 500 000m3/yr.
- 29 800 pool covers and 320 smart irrigation timers installed, reducing water use by 1 500 000m3/yr.
- 9 254 water efficient homes under WSH programme were constructed, reducing water use by 1 236 000m3/yr.
- 122 000 new homes with reduced outdoor water use, saving 14 700 000m3/yr.
- Water efficient technologies and fixtures installed in 132 projects, reducing indoor water use by 4 400 000m3/yr.
Water StressNevada, USA
Low (<10%)Low to med (10-20%) Med to high (20-40%)High (40-80%) Extremely high (>80%)
Arid & low water use
No data available
estimated unit cost of water
25 ¢/m3
programme cost
$ 218 000 000
water scarcity impact
51 926 000 m3/yrvolumetric impact
Reduced withdrawal
Reduced consumption
Improved water quality
Increased productivity
Net basin benefit
Water Stress Map:Gassert, F., M. Landis, M. Luck, P. Reig, and T. Shiao. 2013. “Aqueduct Global Maps 2.0.”
Low Medium High
Confidence level
CreditsWe wish to acknowledge the input of Doug Bennett of the Southern Nevada Water Authority in the preparation of this case study.
Water Scarcity Impact Key
Main Minor

97
Nevada, USA
Intervention Features
¬ Revision of building regulations ¬ Subsidies for the purchase of water saving appliances in commercial premises ¬ Water tariff management ¬ Stakeholder engagement
Project Levers
The conservation efforts are primarily focused on the reduction of outdoor water use, which represents approximately 60% of the community’s water use. The programme to reduce the outdoor use is based on a mix on monetary incentives and regulatory restrictions.
(1) Tiered water charges:
Tiered rates were introduced in 1992 and have been adjusted multiple times since then. These adjustments were primarily for revenue purposes, but also act as an incentive for residents and businesses to reduce their water use.
(2) Seasonal restrictions on outdoor water use:
Following droughts in 2002, ordinances were implemented which restricted outdoor water use. These seasonal water restrictions limit the number of days landscape can be irrigated. Golf courses were given water budgets with penalties of up to 9 times of upper tier water costs for compliance failure. These watering restrictions have now been made permanent.
(3) Landscape conversion rebate programme:
Residents and businesses are provided monetary incentives to replace their grassed landscape with more desert and drought adapted landscape that requires 75% less water demand than grass. Residents and businesses can claim rebate of $21.50/m2 for the first 140m2, reducing to $10.75/m2 for areas beyond 140m2, to a maximum of $300 000 per property in any financial year.
(4) Pool covers rebate:
Pool cover rebate programme commenced in 2005 to reduce the evaporation of water from the swimming pools. Currently 22% of all homes in the Valley have an outdoor swimming pool.
(5) Outdoor water savings technologies rebate:
Rebates were also given for outdoor water saving. Technologies, such as smart irrigation timers with rain sensors. These smart controllers can save up to 15% of water used outside.
(6) Indoor water efficiency measures rebate:
More than 70% of all buildings in the region were built with efficient appliances and fixtures minimising indoor water use. The regional water agency offers residential retrofit kits for owners of older homes to increase their indoor water efficiency. Due to the nature of return flow credits, the reduction in indoor water uses is not as beneficial as the reduction in outdoor uses.
(7) Building codes and water efficient homes programme:
New building codes were implemented in 2003 that restricted the grassed areas on new residential and commercial properties. New commercial buildings are not permitted to have any turfed area unless they can justify the reasons. New residential buildings are restricted from having grass on the front lawn and are only permitted to turf 50% of the area to the rear of properties.
The water efficient homes certification program (Water Smart Homes) was started in 2005 to showcase the best practice in indoor and outdoor water use. These water efficient homes use 27% less water in comparison to a house with similar plot size constructed in 1990s.
(8) Education and public outreach:
The implications of the drought were used to further the public’s understanding that long-term changes were necessary to sustain a vibrant future economy and community. Various public outreach programmes were initiated to educate the public on how to reduce their water use, and to inform them about the various rebate programmes. The Springs Preserve Education Centre provides additional opportunity to educate and inform the general public about water use efficiency and its benefits to the environment.

98
Outcomes and Challenges
Landscape irrigation accounts for the majority of the outdoor water use within the Valley. Restrictions on grassed landscape and outdoor water use were easily accepted by the public, possibly due to recognition that non-functional grassed landscapes were not consistent with the natural local desert environment.
The landscape conversion rebate programme helped to convert 15km2 of grassed landscape to water efficient desert landscape, reducing outdoor water demand by 34 500 000m3/year and saving 224 477 000m3 since 2000.
Over 29 800 rebates were issued for pool covers at a cost of $1.7m and 320 rebates given for smart irrigation timers at a cost of $449 000. The reduction in water demand has been estimated at 1 500 000m3/yr, with cumulative reduction in losses since 2006 estimated at more than 6 545 000m3.
The indoor water efficiency programme was targeted at businesses and $2.8m were given in rebates for 132 projects. These measures have reduced water use by 4 400 000m3/yr providing valuable savings in treatment and transmission, and are important measure in sustainable water management.
In comparison to homes constructed prior to the 2003 buildings codes, the 9 200 water efficient homes constructed since 2005 have helped to curb water demand by 1 226 000m3/yr, and the 122 000 homes constructed under the 2003 building codes have helped to reduce water demand by 14 700 000m3/yr.
The combination of regulatory restrictions and financial incentives has helped to reduce water demand by 51 926 000m3/year, and has helped to reduce per capita water use by 30% since the inception of these programmes.
The biggest challenge encountered in the early stages involved gaining community support for some of the symbolic water use restrictions, such as ornamental water features and car washes. Although the overall water demand of these uses was small, the restrictions were used to convey the message about severity of the drought.
Municipal
Above: The Las Vegas Valley water supply (© Arup)
Water Authority conservation programmeNevada, USA

99
"The water conservation efforts were very successful and the overall water consumption in the Valley has reduced significantly since 2000."
Above: Drought adaptive landscape (© SNWA)

100
Municipal
Pressure management in municipalitiesSebokeng and Evaton, South Africa
Project Overview
Maintenance of water supply networks in many low income urban areas in South Africa has been neglected over the last 30 years and has resulted in serious service delivery problems and wastage of water. The project area in the industrial heartland of South Africa comprised around 70 000 predominantly low income household connections supplying around 500 000 people. A combination of low income and high unemployment levels have resulted in general deterioration of internal plumbing fittings causing high levels of leakage, which were almost entirely responsible for a night flow of 2 800m3/hr. Under normal circumstances a night flow of only 900m3/hr would have been anticipated. It was estimated that before the project, approximately 80% of the water supplied to the area was wasted, representing a water bill of around $20m annually. Due to the fact that very few consumers pay their bills, this had to be paid by the utility and municipality. The pressure management system was installed to control the pressure of the incoming bulk water allowing reduction of supplied water to Sebokeng and Evaton during off-peak periods with a consequent reduction in leakage. The project was built using labour-based methods and a high level of stakeholder consultation ensured good support from the affected communities. Most significantly, the project was fully funded by a private development team with the cost being recovered out of a small percentage of the water savings over a period of five years.
Key Elements
- The need for the municipality to reduce its bulk water bill of $20m/year.
- The need to reduce wastage of water, estimated at 80%.
- The need to reduce inflow to the overextended sewerage treatment plant.
- Installation of an advanced pressure management unit at the inlet to the network to reduce pressures during off-peak periods.
- Private sector funding based on a payment mechanism linked to saved bulk water costs.
Key Outcomes
- 10 000 000m3/year of reduced withdrawals from bulk water sources.
- Operating costs of approximately $0.15m over the project’s five-year period.
- Deferment of infrastructure upgrades in the form of a ten-year reprieve on the upgrading of water supply and sanitation infrastructure.
- The improved status of the municipality enabled access to additional funding for water demand management activities.
- Catalyst for other water demand interventions; using some of the savings, the municipality was able to improve the distribution network in the area.
Water StressSouth Africa
Low (<10%)Low to med (10-20%) Med to high (20-40%)High (40-80%) Extremely high (>80%)
Arid & low water use
No data available
estimated unit cost of water
<5 ¢/m3
capital cost
$ 1 350 000
water scarcity impact
10 000 000 m3/yrvolumetric impact
Reduced withdrawal
Reduced consumption
Improved water quality
Increased productivity
Net basin benefit
Water Stress Map:Gassert, F., M. Landis, M. Luck, P. Reig, and T. Shiao. 2013. “Aqueduct Global Maps 2.0.”
Low Medium High
Confidence level
CreditsWe wish to acknowledge the input ofthe Sebokeng and Evaton local municipalities in the preparation of this case study.
Water Scarcity Impact Key
Main Minor

101
South Africa
Intervention Features
¬ Pressure management in municipalities ¬ Stakeholder engagement
Project Levers
(1) Advanced Pressure Management:
Advanced Pressure Management is much more than simply reducing the pressure of the water entering the system; pressure has to be reduced without compromising the required levels of service for consumers and firefighting during peak periods of demand. An advanced pressure management control device together with real-time monitoring systems and customised management software were installed at the inlet to the network. This enabled pressures to be reduced during off-peak periods and restored to original pressures during periods of high demand. This reduction of the pressure resulted in reduced leakage and fewer burst pipes.
(2) Institutional model:
The municipality was unable to access funding for water demand management activities and so implementation was carried out through a public-private partnership in which the developer planned, designed, constructed and managed the project and also secured financing through the commercial banking system. This was paid back from savings arising from the interventions, together with a performance related bonus by the Emfuleni Municipality and the Metsi-a-Lekoa utility. This process can and is already being applied for other municipalities around the country where pressure management is a viable solution.
(3) Community support:
The project enjoyed a high level of support within the community mainly because of job creation through the use of labour-based construction methods and extensive stakeholder consultation.
Above: Water savings in Sebokeng and Evaton (Source: WRP (Pty) Ltd)
0
500,000
Jan-
95
Jan-
96
Jan-
97
Jan-
98
Jan-
99
Jan-
00
Jan-
01
Jan-
02
Jan-
03
Jan-
04
Jan-
05
Jan-
06
Jan-
07
Jan-
08
Jan-
09
Jan-
10
1,000,000
2,000,000
3,000,000
3,500,000
4,000,000
Dem
and
(m3 /
mo
nth)
1,500,000
2,500,000
Savings
Advanced pressure management started
Actual total demand Projection
Outcomes and Challenge The intervention resulted in major savings on water purchases. Savings were so large that, based on the water charges avoided alone, the installation had a pay-back period of less than two months. The rapidly increasing historical water consumption in Sebokeng and Evaton for the ten years prior to the project intervention and during the five year project period is shown below. This equated to total savings of just over $20m achieved over the same period and these savings continue to accrue since project support ended in January 2010.
The project has resulted in a number of other benefits, some of which only became evident during the course of the project. They included:
- Deferment of infrastructure upgrades in the form of a ten year reprieve on the upgrading of water supply and sanitation infrastructure.
- Identification of bottlenecks in the system and problem infrastructure. When pressures were reduced it was found that some areas unexpectedly had supply problems. The causes of these problems included poor maintenance and operational practices as well as problem infrastructure which would not have been identified under normal circumstances.
- Identification of errors in bulk water metering (from the bulk supplier) also became evident as a result of the project’s own monitoring systems.
- Opening up of further funding opportunities and improved status of the municipality enabling the municipality to access funding for water demand management activities.
- Catalyst for other water demand interventions; using some of the savings, the municipality was able to improve the distribution network in the area.
Advanced Pressure Management projects of this type can bring major water and financial savings rapidly. They can be implemented rapidly through private-public partnerships and benefits are almost immediate. The advanced level of monitoring that is required with this type of intervention will usually result in the identification of additional water demand management opportunities.

102
Municipal
Use of seawater in dual municipal water supplyHong Kong, China
Project Overview
Hong Kong has limited freshwater resources within its administrative boundaries. Its 7 million residents currently consume 951 000 000m3 of freshwater every year, 80% of which is purchased and conveyed from Guangdong Province in China. Prior to the 1960s water purchasing agreement, shortages and rationing were very common with many instances when water was supplied for only a few hours every three or four days, which posed a significant public health risk.
The project to use seawater for flushing toilets was initiated 50 years ago to address the public health risk and to reduce demand on the limited freshwater resources. This has helped to ensure that the city is able to meet its water demands.
The system has expanded over fifty years and now comprises of forty five service reservoirs, forty pumping stations and over 1400km of pipes with corrosion protection. The fixed asset cost of the seawater infrastructure is estimated at $737m by the Water Serviced Department of Hong Kong.
The system provides 27 000 000m3 of seawater per year to a population of 5.5 million. However when the seawater is polluted due to red tides caused by algal blooms, the network has also conveyed freshwater to maintain supply.
Key Elements
- Dual reticulated water supply serving the majority of the city’s population.
- Use of seawater for toilet flushing and evaporative cooling.
- 37% lower energy consumption of seawater supply in comparison to freshwater supply.
- Seawater is supplied free of charge to all consumers.
Key Outcomes
- 22% of the total municipal water demand is met by seawater.
- 17 million kWh lower energy use by using seawater instead of freshwater due to reduced treatment and conveyance.
- Enables freshwater use restrictions to be implemented without public health concerns in event of future water shortages.
- Estimated capital and operating cost over 60 years of $4 425m for the dual supply system. This is 40% lower than the estimated $6 143m for a single freshwater supply system.
- Saving of $160m/yr in bulk water purchases from Guangdong province.
Water StressHong Kong, China
Low (<10%)Low to med (10-20%) Med to high (20-40%)High (40-80%) Extremely high (>80%)
Arid & low water use
No data available
estimated unit cost of water
20 ¢/m3
capital cost
$ 737 000 000
water scarcity impact
271 000 000 m3/yrvolumetric impact
Reduced withdrawal
Reduced consumption
Improved water quality
Increased productivity
Net basin benefit
Water Stress Map:Gassert, F., M. Landis, M. Luck, P. Reig, and T. Shiao. 2013. “Aqueduct Global Maps 2.0.”
Low Medium High
Confidence level
Water Scarcity Impact Key
Main Minor

103
Hong Kong, China
Intervention Features
¬ Dual piped water supply system ¬ Seawater for toilet flushing
Project Levers
The dual reticulated system provides security that the basic sanitation needs of the city can be met with seawater if the fresh water supply is diminished due to drought or external water demands.
(1) Dual reticulated network:
The 1 400km of dual reticulated system is currently the most extensive in the world. As with other reclaimed water systems, the separation of supplies enables supply of water at a lower quality thus reducing the energy and material cost of treatment.
(2) Treatment of seawater:
The seawater goes through minimal treatment as its end use has limited public health risks. The incoming water is screened to remove sizeable particles followed by disinfection with electrochlorination.
(3) Corrosion resistant fixtures and pumps:
The risk of corrosion of the pipes is reduced through use of cement lined iron pipes for the main distribution network and polyethylene (HDPE) pipes for in-building services. These measures have increased the average life expectancy of pipes in the network before renewal may be necessary.
(4) Certification programme for plumbers and installers:
To prevent misconnections and cross connections, a certification and training programme was created to train and certify plumbers and appliance installers.
(5) Use of other alternative sources for water:
The network can supply water from alternate water sources, such as reclaimed water and untreated raw freshwater. This is used when the quality of seawater has been below the approved threshold for supply. Following upgrades to the wastewater treatment plants in the city, there may be opportunity to increase the reuse of municipal reclaimed water reducing the rate of corrosion of the system and components.
Outcomes and Challenges
Seawater accounts for 22% of the total water consumption, saving 271 000 000m3 of freshwater for other uses. It also saves the city $160m a year in purchase of a similar quantity of water from Guangdong.
A dual pipe system helps meet basic sanitation needs irrespective of freshwater constraints, such as droughts. Based on the success of the Hong Kong system, the city of Qingdao in China opened the first part of a dual piped seawater network in 2009.
Use of corrosion resistant pipes has mitigated the increased risk of corrosion from seawater. However, system components, such as pumps and valves still suffer from corrosion and have a lower life expectancy in comparison to freshwater systems. Even with the more frequent replacement, the lifetime cost of the dual reticulated system over 60 years is estimated to be $4 425m, which is 40% lower than the estimated $6 143m it would cost to operate a single freshwater supply, when cost of the water purchase is taken into account.
The public risks from cross connections have been managed through training and certification programme of installers, with only one incident of cross connection in more than 50 years.
Although originally supplied for a charge, seawater has been supplied without charge since 1972. With free seawater and low cost of fresh water, there is limited incentive to reduce consumption resulting in one of the highest per capita consumption rates of 219 litres per day (127 litres freshwater, 92 litres seawater).
Increased salinity does increase the complexity and cost of wastewater treatment and makes it more difficult to reclaim wastewater for municipal use.
Above: Hong Kong (© PHILIP ILIFF - Wikimedia Commons)

104
Municipal
Leakage reduction in primary schoolsUpington, South Africa
Project Overview
This project was undertaken to reduce unacceptable levels of leakage at the Keidebees and Vele Langa Primary Schools in Upington. The cost of the benefits were documented so that the process could serve as a model for other schools and public buildings. The need was identified during an inspection of plumbing fittings for visual leakage in public buildings in and around the town and further underlined by an examination of consumption levels and water bills being paid by schools.
The significance of the project is in its simplicity and cost-effectiveness since it can be easily replicated at thousands of other schools and public buildings leading to huge water savings. More significantly, much of the “wasted” water that is targeted by this type of project would otherwise be lost to evaporation and evapotranspiration rather than making its way back to the resource base via return flows or groundwater recharge. The project showed how carefully planned and properly implemented interventions can lead to tangible and significant results in a short period of time. The resultant water savings paid for the investment made within six months.
Key Elements
- Situational analysis through the replacement of both of the existing water meters at the school with loggable consumer meters.
- Identification of all visible leaks around the school buildings through inspection of all fittings.
- Repair of leaking fittings.
- Analysis of outcomes through continuous monitoring and simple cost-benefit analysis.
- Financed by a grant from the Department of Water Affairs.
Key Outcomes
- Immediate water savings in the order of 50m3/day between the two schools.
- Average water bills at the schools were more than halved and the financial savings would have paid for the interventions within six months.
- Students were exposed to the importance of water conservation during an education and awareness building session that was included as part of the project.
- A carefully and accurately monitored example quantifying savings for replication by other schools and public buildings.
Water StressSouth Africa
Low (<10%)Low to med (10-20%) Med to high (20-40%)High (40-80%) Extremely high (>80%)
Arid & low water use
No data available
estimated unit cost of water
<5 ¢/m3
capital cost
$ 4 092
water scarcity impact
19 000 m3/yrvolumetric impact
Reduced withdrawal
Reduced consumption
Improved water quality
Increased productivity
Net basin benefit
Water Stress Map:Gassert, F., M. Landis, M. Luck, P. Reig, and T. Shiao. 2013. “Aqueduct Global Maps 2.0.”
Low Medium High
Confidence level
CreditsWe wish to acknowledge the input and support of Khara Hais Municipality in the preparation of this case study.
Water Scarcity Impact Key
Main Minor

105
Upington, South Africa
Intervention Features
¬ Municipal leakage detection and repair
Project Levers
(1) Logging of flows for situational analysis, before during and after:
The first step involved installing loggable meters at the Keidebees and Vela-Langa primary schools. Loggers were installed on the new meters to monitor the consumption patterns at the schools prior, during and after the leak repair exercise. Flows in m3/hr were monitored for one week before carrying out the required repairs. Most significantly, the average minimum night flows were measured at 2.1m3/hr and 1.1m3/hr at the two schools, indicating that leakage rates were excessively high. After the repairs the average minimum night flows were reduced to 0.7m3/hr and 0.4m3/hr respectively.
(2) Visual inspection:
During the first week of monitoring the visual inspection of all fittings was carried out and local plumbers were requested to provide quotations for repairs and the replacement of faulty fittings. Four outside underground leaks were identified.
(3) Repair of leaking fittings:
The repairs and replacements carried out at the two schools included the fitting of 14 new flushing mechanisms; 19 new taps and the replacement of the urinal flushing systems with timed push button systems. The four outside leaks were repaired. The repair work was all straightforward and was completed within three days.
Outcomes and Challenges
Unacceptably high water losses at both schools were cut to about a third of their original values through a number of simple and inexpensive plumbing interventions including both pipe repairs and the replacement of faulty or broken fittings. Equally important as the actual water savings was the fact that the whole process was carefully measured so that both the water and financial savings could be clearly demonstrated providing an ideal platform for replicating the project at other schools and public buildings. The fact that the schools were chosen as the vehicle for the pilot study is significant because it also provided the opportunity to create awareness at an early age and for students to take the water conservation and demand management message home.
Despite the obvious success of the project the main challenge lies in getting it replicated elsewhere in the region and ultimately country-wide.
Above: Installation of a loggable consumer meter (© WRP (pty) Ltd.)

106
Municipal
Water demand management strategySingapore
Project Overview
The Public Utilities Board (PUB), Singapore's national water agency, has recognised that projected population growth will lead to increased future water demand. The ‘Four National Taps’ Strategy developed by PUB aims to diversify the sources of water available. The ‘four taps’ are; increasing local catchment area from 50% to 67% of Singapore’s land area; importing water from Johor; NEWater – which is high quality reclaimed water; and a desalination plant at Tuas.
But securing an adequate supply is only half of the challenge for Singapore; managing demand is of equal importance. Key to managing demand has been facilitating behaviour change in water use and consumption. The campaign to manage demand is known as the 3P approach and encourages everyone (People, Public, Private) to take ownership of water resource management. This concept is embodied in PUB’s tagline - Water for All: Conserve, Value, Enjoy. Central to this new approach is the Active, Beautiful, Clean Waters (ABC Waters) Programme which is enhancing Singapore’s water infrastructure bringing people closer to water, so they better appreciate, cherish and ultimately value water. Water conservation programmes have encouraged industries and households to use water wisely, and save 10% of their water use, and 10 litres of water a day respectively. Per capita water use has fallen from 165 litres/day in 2003 to 155 litres/day in 2013 and the aim is to achieve 147 litres/day by 2020.
Key Elements
- Community engagement through; Water Efficient Homes (WEH) and development of ownership through the Active Beautiful Clean (ABC) waters programme.
- Pricing restructure, upgrading the metering system and legislative measures.
- Water Efficiency Fund to encourage companies to manage demand.
Key Outcomes
- The WEH programme reached 68 out of 84 constituencies by 2005.
- Reduction in per capita use from 165 litres/day in 2003 to 152 litres/day in 2013.
Water StressSingapore
Low (<10%)Low to med (10-20%) Med to high (20-40%)High (40-80%) Extremely high (>80%)
Arid & low water use
No data available
estimated unit cost of water
not available
capital cost
confidential
water scarcity impact
1 818 000 m3/yrvolumetric impact
Reduced withdrawal
Reduced consumption
Improved water quality
Increased productivity
Net basin benefit
Water Stress Map:Gassert, F., M. Landis, M. Luck, P. Reig, and T. Shiao. 2013. “Aqueduct Global Maps 2.0.”
Low Medium High
Confidence level
CreditsWe wish to acknowledge the input and support of Diana Cheong of the Public Utilities Board in the preparation of this case study.
Water Scarcity Impact Key
Main Minor

107
Singapore
Intervention Features
¬ Revision of building regulations ¬ Water metering in municipalities ¬ Water tariff management ¬ Stakeholder engagement
Project Levers
(1) Public Engagement:
The PUB launched the WEH programme to alter behaviours at the domestic level. Do-It-Yourself (DIY) water saving kits were distributed to grassroots organisations and then passed onto residents free of charge. The kits consisted of faucet flow regulators, cistern water saving bags, leaflets and conservation tips. In conjunction with the Singapore Environmental Council (SEC), PUB set up a website for water conservation. Users were challenged to assess their individual usage and identify areas for improvement.
Through the Active Beautiful Clean (ABC) waters programme, Singaporeans were encouraged to take ownership of their surrounding water bodies. Adoption by schools and community groups who took an active part in their management, encouraged this. This has benefits for both water quality and conservation as it engages the public in understanding the value of water. The PUB also established a 24-hour leak hotline; 99% of urgent complaints are attended to within 45 minutes. Customers are able to contact the PUB through telephone, fax, emails, SMS and web chat.
(2) Pricing and Metering:
The entire water supply system from the water treatment works to the customers' premises is 100% metered.
The tariffs and Water Conservation Tax were restructured over a four-year period to reflect the scarcity value of water. The tariff and water conservation tax increased from 30% to 45% for domestic users after the first 40m3 a month. The metering system has been upgraded and now uses a computerised billing system.
Through Information and Communication Technology (ICT) monitoring, any readings that are abnormally high or low are singled out for further investigation. These measures contribute directly to a reduction in per capital use.
In addition PUB introduced a business Water Efficiency Fund in July 2007 with the aim of encouraging companies to look into efficient ways of managing their water consumption through conservation projects.
(3) Legislation/Building Codes:
Legislative measures have been implemented to deter wastage. From 2009 it has been mandatory to install dual flush toilets and low flow taps; this included renovations and new builds. To aid compliance the PUB conducts spot checks on residential buildings to ensure that the mandatory requirements are being followed.
Outcomes and Challenges
The integrated use of public engagement, legislation and pricing has had a significant impact on per capita use which had been rising before the programme. This has played a significant role in ensuring future water security for Singapore.
Other outcomes include:
- Through the WEH programme, one in three households installed the water saving devices, reducing their monthly utility bills by 5% due to increased efficiency.
- Through the ABC programme over 20 catchments and water source sites have been adopted by local communities. The number is expected to increase to 100 by 2017.
- Per capita consumption has fallen from 165 litres/day in 2003 to 152 litres/day in 2013 and is projected to be 147 litres/day in 2020.
Above: The Singapore Marina Barrage creates a freshwater reservoir keeping out seawater (© ngotoh - Flickr)

108
Municipal
Reducing water losses in a large distribution networkCity of Johannesburg, South Africa
Project Overview
Reducing water losses is a priority for Johannesburg Water. These are made up of leakages on transmission and distribution mains, reservoir and storage overflows and leakages on service connections. With its customer base of nearly four million, 11 300km of water distribution network, 86 reservoirs, 33 water towers, 108 bulk water supply meters and an average daily demand of 1 366 000m3, this is a significant challenge.
There is real pressure on the city to reduce and stabilise demand. Johannesburg Water is the biggest user of water from the Vaal River which depends on transfers of water from the Senqu River in Lesotho via the Lesotho Highlands Development Project (LHDP) to satisfy demands on its resources. Furthermore, the Orange-Senqu is a transboundary system and the other riparians, Namibia and Botswana also have growing demands on the system.
Key Elements
- Replacement of water mains across the city’s 11 300km of water reticulation mains of highly variable condition.
- Pressure management aimed at reducing night times pressures, water losses through background leaks and consumer demand in areas experiencing high on-property leaks.
- Active and passive leakage control through improvement of repair response times.
- Continuous monitoring of reservoirs and towers aimed at reducing overflow losses to zero.
- Soweto infrastructure upgrade including rehabilitation of water network, improved levels of service, retrofitting and education and awareness activities.
- The funding source is a combination of operating and capital expenditure which is offset against the savings from the reduced bulk water purchases and additional income from metered customers.
Key Outcomes
- In the first 12 months the replacement programme led to a 77% reduction in pipe bursts. A total of 85km of mains have been replaced to date.
- Improvements to the level of service for leakage repairs resulted in water savings of around 10 000 000m3/year.
- Improved level of service and reduction of net consumer demand in key target area of Soweto through installation of nearly 160 000 new meters.
- Deferment of major water resources development infrastructure by at least ten years.
- Water saving of 102 500 000m3 over two years, over 10% of the annual demand.
- It is estimated that only a small proportion of leakage from Johannesburg is ultimately returned for use by downstream users, therefore a reduction in leakage results in a decrease in consumptive use.
Water StressJohannesburg, South Africa
Low (<10%)Low to med (10-20%) Med to high (20-40%)High (40-80%) Extremely high (>80%)
Arid & low water use
No data available
estimated unit cost of water
20 ¢/m3
capital cost
$ 98 000 000
water scarcity impact
51 250 000 m3/yrvolumetric impact
Reduced withdrawal
Reduced consumption
Improved water quality
Increased productivity
Net basin benefit
Water Stress Map:Gassert, F., M. Landis, M. Luck, P. Reig, and T. Shiao. 2013. “Aqueduct Global Maps 2.0.”
Low Medium High
Confidence level
Water Scarcity Impact Key
Main Minor

109
City of Johannesburg, South Africa
Intervention Features
¬ Municipal leakage detection and repair ¬ Pressure management in municipalities ¬ Water metering in municipalities
Project Levers
(1) Replacement of water mains:
A prioritised pipe replacement programme was drawn up according to burst frequencies, analysed and visualised on GIS. Thity three suburbs were prioritised and the work carried out in phases. More than 90% of the mains have been surveyed and 85km replaced.
(2) Pressure management:
Key target areas were reducing night time pressures, water losses through background leaks and consumer demand in areas experiencing high on-property leakages. Three different types of pressure management were used; fixed outlet, time modulated and flow modulated. More than 500 pressure reducing valves were installed throughout Johannesburg to control water pressures in more than 300 pressure zones. At the heart of the system are two major pressure management systems handling the arrival of bulk water, one in Sandton and one in Parktown. The identification of further areas where pressure management could be applied continues and areas with high static pressures are being identified through hydraulic modelling.
(3) Active and passive leakage control:
The passive leakage control system is based on a 24/7 call centre and target response times of 48 hours for burst pipes and four days for leaking meters. Response performance has been improved from 80% within target in 2006 to 89% in 2011.
Active leak control uses a pro-active approach using night flows to identify the worst areas to be targeted with intensive leakage detection surveys. 15 full-time teams survey the water reticulation mains on a daily basis guided by the analysis of night flows.
(4) Reservoir and tower monitoring:
A 24hr manned control room monitors levels at all 86 reservoirs and 33 water towers and uses an “early bird” system for the detection of potential overflows. Overflows have been brought down to almost zero over the last five years.
(5) Focus on rapid returns through Soweto actions:
A major component of the water demand management programme is the Soweto Infrastructure Project which aims to rehabilitate the water network, improve the level of service, reduce consumer demand through retrofitting and to educate consumers through the creation of awareness. The project includes the implementation of pre-paid water meters to all Soweto residents, the largest project of its kind in Africa involving the installation of almost 160 000 new meters. Unaccounted for water at the start of the project stood at 69%. This should be reduced to less than 25% by project end.
Outcomes and Challenges
Based on the various interventions carried out to date it is possible to accurately estimate the anticipated water savings over the next two years.
- $60.2m spent in Soweto to save 43 000 000m3.
- $15.65m spent on active leakage control for an anticipated saving of 20 800 000m3.
- $2.86m spent on pressure management to generate savings of 38 000 000m3.
Including the education and awareness programme the total cost is estimated to be $98m and will generate 102 500 000m3 of water savings, equivalent to $0.96/m3.
The savings on the purchase of bulk water are estimated at $113.7m over the two years.
The water savings are equivalent to 10.2% of current demand or around 3 to 4% when annual growth in demand is taken into account. This has resulted in the deferment of additional investments in infrastructure by ten years. Once the effects of the education and awareness programme fully materialise it is anticipated that the period of deferment can be extended further.

110
Municipal
Behavioural change initiativeZaragoza, Spain
Project Overview
In 1995, nearly 11 million people felt the effects of water scarcity in a wide-scale Spanish drought. This highlighted the need for a change in water useage. Zaragoza, located in Northern Spain, launched its Water Saving City project in early 1997 with the aim of changing the wasteful water behaviour and increasing efficient use. An ambitious target of saving 1 000 000m3 of domestic water consumption in one year was set and achieved. The project has shown that it is possible to deal with a shortage of water in an urban domestic setting, using a cost efficient, quick, ecological and contention free approach.
The project used a partnership approach, with funding coming through multiple sources. The European LIFE programme provided 46% of the funding. The rest was provided by the Zaragoza City Council (17%), the Aragon Regional Government (17%), Ibercaja (12%), the Four Companies (6%) and the Fundacion Ecologia y Desarollo (2%).
Key Elements
- Engagement with the general public through various media.
- Educating the public through campaigns and a practical handbook on efficient water use in the home.
- Targeted influencing of the younger generation through education schemes within schools.
- Engagement with businesses selling domestic water products.
- Development of the '50 Good Practices' guide, covering water use in gardens, parks and buildings of public and industrial use.
Key Outcomes
- Between 1997 and 2008 the population of Zaragoza increased by over 12%, yet daily water use reduced from 84 8000m3 to 61 5000m3 in the same period.
- Per capita use reduced from 150 litres/day in 1997 to 99 litres/day in 2012.
Water StressZaragoza, Spain
Low (<10%)Low to med (10-20%) Med to high (20-40%)High (40-80%) Extremely high (>80%)
Arid & low water use
No data available
estimated unit cost of water
not available
capital cost
not available
water scarcity impact
1 176 000 m3/yrvolumetric impact
Reduced withdrawal
Reduced consumption
Improved water quality
Increased productivity
Net basin benefit
Water Stress Map:Gassert, F., M. Landis, M. Luck, P. Reig, and T. Shiao. 2013. “Aqueduct Global Maps 2.0.”
Low Medium High
Confidence level
CreditsWe wish to acknowledge the input of Marisa Fernández Soler of ZINNAE-Zaragoza Innova en Agua y Energía in the preparation of this case study.
Water Scarcity Impact Key
Main Minor

111
Zaragoza, Spain
Intervention Features
¬ Subsidies for the purchase of domestic water saving appliances ¬ Stakeholder engagement
Project Levers
(1) Advertising Campaign:
A wide media campaign was run using media such as; TV, radio, press, leaflets, posters and advertising on buses. The campaign was effective in ensuring that all residents of Zaragoza were aware of the forthcoming Water Saving City project.
(2) Education:
The approach to education was two-fold. Initially the focus was on helping users to make changes in their own dwelling through adopting water efficient practices and technologies. The initiative was then extended to schools to ensure that children were actively engaged with the concept of cutting water wastage.
(3) Financial Incentive:
Discounts of 20-25% were offered by the regional goverment to those purchasing water efficient products. In 2002 the City Council of Zaragoza offered economic incentives to households that reduced their water consumption. If households reduce their consumption by at least 40% in the first year of joining the scheme, they were entitled to a 10% bill discount. In subsequent years they were expected to reduce consumption by 10% per year in order to benefit from a similar rebate.
(4) Consumer Options:
The Water Saving City campaign engaged with commercial sellers of water products, for example bathroom or kitchen suppliers. These businesses were encouraged to stock a wider range of water saving alternatives, therefore allowing the newly educated consumer to have the option to choose a more water efficient product.
(5) Business Engagement:
As part of the second stage of the Water Saving City project, a ‘50 Good Practices’ guide was developed. This evaluated the use of water technology and behaviours in gardens, parks, buildings and industry. It provided businesses with a reference model for identifying effective methods of improving water efficiency.
Outcomes and Challenges
There were multiple reasons for the success of the project, but engagement with the consumer to facilitate a behaviour change was of paramount importance.
Outcomes of the project in Zaragoza included:
- Per capita consumption in Zaragoza was reduced from around 150 litres in 1997 to 99 litres 2012.
- 168 educational establishments, 428 teachers and 70 000 students directly participated in the campaign's educational programme.
- Over 140 establishments selling products related to domestic water consumption were involved with the campaign. This helped increase the sales of water efficient fixtures; with one bathroom retailer reported a 58% rise in sales of automatic taps.
- All the garden nurseries in the city participated through the ‘50 Good Practices’ stage. As part of the project they agreed to identify and promote low water consumption.
- The water savings delivered through the project have been sustained and have created a genuine water saving culture.
Above: Zaragoza, Spain (© Anibal Trejo | Dreamstime.com)

112
Municipal
Wastewater reclamation to meet potable water demandWindhoek, Namibia
Project Overview
Flanked on both sides by deserts, Namibia is amongst the most arid countries in the world. Windhoek, its capital is situated in the central highlands with a mean annual precipitation of 370mm, evaporation of over 3 000mm and 750km from the nearest perennial river. For more than five decades Windhoek has managed to stretch its limited potable water resources through strict water management, including wastewater reclamation and direct potable reuse. After years at or near the top of the media agenda, water conservation habits are well ingrained in the minds of the city’s residents. Per capita use is 180 litres/day and unaccounted for water is only 10%. Water supply is based on a combination of limited surface water and groundwater resources and due to their highly uncertain nature, the city council put in place a comprehensive integrated water demand management programme in 1994 to ensure water security for the city. Direct potable water reuse started in 1968 and has been a feature of the city’s water supply ever since. The original scheme was replaced by a new plant in 2002. Operating at 73% of its capacity the new plant provides more than 18 000m3/day of drinking water. This is 26% of Windhoek’s water demand and is part of a total re-use system in which very little water is either wasted or returned to the river system.
Key Elements
- Multibarrier approach to ensure safe and aesthetically acceptable potable water.
- Guaranteed water quality values.
- Blending of reclaimed water with freshwater.
- 20 year operation and maintenance agreement.
- Public awareness campaigns for water saving and acceptability of direct potable water reuse.
- Project financing: by the KFW (Kreditanstalt fur Wiederaufbau) (40%), the European Investment Bank (55%) and the City of Windhoek (5%).
Key Outcomes
- Availability of additional 7 500 000m3/yr of potable water at a similar cost to other sources.
- Availability of reclaimed water from the old plant for the irrigation of parks, sports fields and pasture.
- Deferment of expensive infrastructure to transport water from alternative water sources at a greater distance.
- Continued acceptance by the public of potable water from reclaimed waste water.
- Reinforcement of high levels of water demand management and conservation practices.
- The impact of returned downstream flows on the basin is minimal as there is little downstream water demand.
Water StressWindhoek, Namibia
Low (<10%)Low to med (10-20%) Med to high (20-40%)High (40-80%) Extremely high (>80%)
Arid & low water use
No data available
estimated unit cost of water
35 ¢/m3
capital cost
$ 27 700 000
water scarcity impact
6 700 000 m3/yrvolumetric impact
Reduced withdrawal
Reduced consumption
Improved water quality
Increased productivity
Net basin benefit
Water Stress Map:Gassert, F., M. Landis, M. Luck, P. Reig, and T. Shiao. 2013. “Aqueduct Global Maps 2.0.”
Low Medium High
Confidence level
CreditsWe wish to acknowledge the input of the City of Windhoek in the preparation of this case study.
Water Scarcity Impact Key
Main Minor

113
Windhoek, Namibia
Intervention Features
¬ Wastewater recycling for potable use ¬ Stakeholder engagement
Project Levers
(1) Multibarrier approach:
In order to ensure that the drinking water was safe for human consumption at all times, a “multiple barrier” approach was taken in the design of the process technology. The treatment processes used ensure that at least two (in many cases three or more) unit processes are provided for removing each crucial contaminant. Key processes included powdered activated carbon dosing, pre-oxidation and pre-ozonation, flash mixing, enhanced coagulation and flocculation, dissolved air flotation, dual media rapid gravity sand filtration, ozonation, BAC filtration, GAC filtration, ultra-filtration (UF), disinfection and stabilisation.
(2) Guaranteed water quality values:
The water produced by the plant had to adhere to 'guarantee values'. These were based on WHO Guidelines (1993), Rand Water (South Africa) Potable Water Quality Criteria (1996) and the Namibian Guidelines for Group A water (1998). Water samples are taken every four hours at various points throughout the plant and analysed in the plant laboratory for basic quality control purposes.
(3) Blending of reclaimed and fresh water:
Although it was shown that the specified guarantee parameters could be met without it, blending the reclaimed water with treated surface water and/or groundwater provides an additional level of safety. The maximum portion of reclaimed water fed into the distribution system is 50% in times of water scarcity and low water demand.
(4) Operation and maintenance agreement:
The plant is operated and maintained under a twenty-year operation and maintenance contract between the city of Windhoek and a consortium of three major international water treatment contractors.
(5) Public awareness campaign:
Efforts to introduce waste water reclamation for potable water have failed in many cities around the world with the perception of reclaiming drinking water from municipal secondary effluent generally unacceptable to the public. Experience in Windhoek showed that with persistent, well designed and targeted marketing, this perception can be changed. The people of Windhoek generally take pride that they are the only city in the world where direct potable water reuse is practised.
Outcomes and Challenges
Construction of the new Goreangab Water Reclamation Plant in 2002 replaced the old plant and provided a cost-effective and acceptable solution to meet the city’s medium termwater requirements. The capacity of the plant (7 500 000m3/yr), together with a programme of groundwater recharge to increase the contribution of groundwater, should ensure that very expensive water supply alternatives such as a transfer of water from the Okavango River 750km away can be deferred for many years. The cost of production is virtually the same as the cost of potable water coming from the existing surface water storage. The old reclamation plant continues to operate, recycling industrial waste water for the irrigation of fodder and of domestic waste water for the irrigation of sports fields and parks. Since potable reuse started in Windhoek 45 years ago no outbreak of waterborne disease has been experienced and no negative health effects have been attributed to the use of reclaimed water. Public acceptance of the product is illustrated by the fact that less than 5% of the population uses additional point source treatment in their homes.
Above: Covered reservoirs and greenery maintained with purified effluent in Windhoek (© WRP (pty) Ltd)

114
Municipal
Domestic and business retrofit projectSydney, Australia
Project Overview
In response to long-term drought, Sydney Water launched the 'Every Drop Counts' initiative. The project is a key element of WaterPlan 21, a long-term strategy for sustainable water and wastewater management. In the past Sydney Water implemented infrastructure upgrades to dams, networks and wastewater treatment facilities. However, it was also realised that the demand for water consumption also needed to be addressed.
The 'Every Drop Counts' initiative has helped reduce the environmental impact of hard engineering whilst addressing water efficiency from the grass roots level. The initial aim of the project was to encourage residents of Sydney to consume less domestic water. Since then, Sydney Water has expanded the initiative to incorporate businesses, helping them to reduce their water consumption and to benefit from reduced costs.
The success of the programme has been widely noticed and it received the prestigious Stockholm Industry Water Award in 2006, the first time an Australian organisation received the award.
Key Elements
- Promoting the use of water efficient devices.
- Inspection of mains infrastructure.
- Reaching out to the business sector, such as; clubs, hotels, commercial premises and commercial shopping centres.
- Work with businesses to: identify technical solutions to water management problems, educate, managers and employees, and encourage citizenship.
Key Outcomes
- Projects implemented by Sydney Water since 2001 have helped to save 12 410 000m3/yr which would otherwise have been lost to the ocean.
- Water use per capita was reduced from 411 litres/day in 2001 to 297 litres/day in 2012.
- 18 080km of mains were inspected and repaired between 2006 and 2007, saving of more than 20 000m3/yr through reduced leakage.
- By July 2010, almost 420 large water using businesses were 'Every Drop Counts' partners.
Water StressSydney, Australia
Low (<10%)Low to med (10-20%) Med to high (20-40%)High (40-80%) Extremely high (>80%)
Arid & low water use
No data available
estimated unit cost of water
110 ¢/m3
programme cost
$ 240 000 000
water scarcity impact
12 410 000 m3/yrvolumetric impact
Reduced withdrawal
Reduced consumption
Improved water quality
Increased productivity
Net basin benefit
Water Stress Map:Gassert, F., M. Landis, M. Luck, P. Reig, and T. Shiao. 2013. “Aqueduct Global Maps 2.0.”
Low Medium High
Confidence level
CreditsWe wish to acknowledge the input of Andre Boerema, Fernando Ortega and Norm Ronis at Sydney Water in the preparation of this case study.
Water Scarcity Impact Key
Main Minor

115
Sydney, Australia
Intervention Features
¬ Low flow showerheads ¬ Low flow taps ¬ Low flow toilets ¬ Domestic leakage detection and repair ¬ Smart metering ¬ Water audits ¬ Stakeholder engagement
Project Levers
(1) Monitoring and Reporting:
Monitoring helps to identify opportunities to save water, as well as identifying any leakage. The installation of online monitoring equipment encouraged customers to actively monitor their own consumption and detect anomalies. A best practice approach has been developed to enable employees to report any leaks that have been detected.
(2) Employee awareness raising:
To increase awareness within the workplace, posters featuring a selection of water conservation messages are hung in areas of high water use, i.e. kitchens and bathrooms.
(3) Awards:
In 2006, the 'Every Drop Counts' Business Programme Water Conservation Awards recognised companies who showed leadership in water conservation. Awards were given for highest volume reduction, highest percentage reduction and innovation.
(4) Literature:
Sydney Water publishes a magazine called ‘The Conserver’ which showcases water conservation success stories and water efficiency projects. They have also developed fact sheets to show businesses numerous ways in which they can save water, with an emphasis on the financial benefit and payback periods. These fact sheets and back issues of ‘The Conserver’ are available from Sydney Water Business Customer Services.
(5) Council Partnership Programme:
Sydney water offered a heavily discounted Water-fix home retrofit programme and a similar water audit and retrofit programme for specific business sectors. A retrofit typically reduces household water use by an average of 20.9m3/year. The WaterFix programme is projected to save around 8 200 000m3 of drinking water each year, by 2015.
Outcomes and Challenges
From initially reaching out to houses, the 'Every Drop Counts' programme has gained momentum and diversified into businesses in order to spread the message and knowledge about water conservation.
Outcomes as a result of the 'Every Drop Counts' programme include:
- Personal water use in Sydney remains at historically low levels; in June 2012 total water use was 297 litres per person per day, well below the operating license target of 329 litres per day, down from 411 litres per day in 2001.
- In 2011/12 alone Sydney Water estimated water savings from large water using businesses were around 588 000m3/yr, at a cost of $565 000. The cost has been met directly by the utility company.
- At the end of 2011/12, around 500 small to medium businesses had been engaged through the Council Partnership Programme. The total water savings are around 789 000m3/yr.
- The 'Every Drop Counts' in schools programme finished at the end of 2011. Most schools retained the smart meter installed as part of the programme. The water savings are estimated at 218 000m3/yr.
- In 1997, as part of the 'Every Drop Counts' Business Programme, Sydney Water and Manly Council commissioned a water usage study at the council’s beach front properties. Changes were made, including implementing water saving devices in all new facilities. The initial investment of $30 000 was recovered in just one year. The council saved $48 900 in the first two years of the programme.
Current financial challenges and a temporary alleviation of drought mean that Sydney has started to scale back some of its water efficiency programme, but the scale of the work to-date has ensured a wide adoption of water conservation practices and culture.
"The success of the programme has been widely noticed and received the prestigious Stockholm Industry Water Award in 2006..."

116
Municipal
Emergency water demand management Beaufort West, South Africa
Project Overview
Beaufort West is a town with a population of 35 000 on the main road between Johannesburg and Cape Town. Average rainfall is only 265mm/yr with a high level of variability and given the town’s heavy dependence on water stored in a single dam on an ephemeral river there was always the risk of a water crisis developing. By the end of the 2008/09 rainy season water reserves were low and in November 2009 the town’s main water source, the Gamka Dam, ran dry. Causes contributing to this situation included low rainfall, uncontrolled water consumption (up by 44% in six years), insufficient planning and the high cost attached to new water resource development options. The critical situation forced action and by the time the town emerged from the crisis it had been transformed into a model of water conservation and demand management. By the end of the crisis two new pieces of water infrastructure had materialised; expansion to the existing small groundwater well field and most significantly a water reclamation plant designed to save up to 2 000m3 of water per day or 28% of the town’s overall water demand.
Key Elements
- Sudden and deep water crisis acting as a catalyst for action including the raising of funds.
- Reduced water consumption through public awareness campaign.
- Reduced consumption through pressure reduction.
- Aggressive water tariff structure.
- Severe water restrictions.
- Water scheduling.
- Construction of waste water reclamation plant.
Key Outcomes
- Addition of two new water sources to guarantee a stable water supply; groundwater and a waste water reclamation plant producing potable water.
- Change in the water conservation mentality of the townspeople including the acceptance of reclaimed waste water as a source of potable water.
- Improved management of the town's water resources.
- Country-wide awareness of the importance of water demand management and conservation in a water-stressed country.
Water StressBeaufort West, South Africa
Low (<10%)Low to med (10-20%) Med to high (20-40%)High (40-80%) Extremely high (>80%)
Arid & low water use
No data available
estimated unit cost of water
40 ¢/m3
capital cost
$ 3 500 000
water scarcity impact
730 000 m3/yrvolumetric impact
Reduced withdrawal
Reduced consumption
Improved water quality
Increased productivity
Net basin benefit
Water Stress Map:Gassert, F., M. Landis, M. Luck, P. Reig, and T. Shiao. 2013. “Aqueduct Global Maps 2.0.”
Low Medium High
Confidence level
CreditsWe wish to acknowledge the input of J. Smit of the Municipality of Beaufort West in the preparation of this case study.
Water Scarcity Impact Key
Main Minor

117
Beaufort, South Africa
Intervention Features
¬ Wastewater recycling for potable use ¬ Municipal leakage detection and repair ¬ Water tariff management ¬ Stakeholder engagement
Project Levers
(1) Sudden and deep water crisis acting as a catalyst for action:
Water consumption had been increasing steadily in Beaufort West, by around 7% per year between 2001 and 2007. In addition, irrigation in the area had increased supporting an impression that water was relatively plentiful. This was despite the fact that step tariffs were in place to punish excessive use and regular awareness campaigns. Only when the Gamka Dam ran dry and the supplies to some consumers stopped completely did action start, firstly to overcome the crisis and secondly to put in place sustainable solutions for the future.
(2) Reduced water use through public awareness campaign:
A major awareness campaign was critical. It included the widespread use of pole mounted signs, pamphlets delivered to every household and extensive coverage in the local and national press and on radio and television. There were also regular community meetings and visits to schools to improve understanding and to catalyse action. The awareness campaign underpinned the other measures aimed at reducing consumption.
(3) Reduced water use through pressure reduction:
Water savings in the water distribution network of nearly 50% were achieved through the reduction of pressure in water delivered to 4 000 households. Reduction of the pressure from 5 to 1.5 bar resulted in leakage reduction by 45.6%.
(4) Aggressive water tariff structure and severe water restrictions:
The existing progressive step tariff was replaced by a “step drought” tariff in April 2009 followed by a much tougher drought tariff in July 2010. Consumers exceeding 15m3 per month were faced with a surcharge of 200%. This was on top of a $20 fine imposed in November 2009 for using more than 12m3 in month which then rose to $140 in June 2010. Consumers who used more than 35m3 in a month were “named and shamed” in the local newspaper.
(5) Water scheduling and tanker service:
Water scheduling started in November 2010 as reservoirs ran dry and only 80% of the network could be serviced. One month later this was down to 65%. Water was cut for 48 hours for 2 000 households at a time and a tanker and bottle service was put into operation. Empty beverage and food tankers on the Johannesburg-Cape Town route were filled with water for Beaufort West. Up to 450 000m3/day, were pumped directly into the network. Despite frequent burst pipes, water demand was reduced by 59% compared to the previous December.
Outcomes and Challenges
The main outcome of the crisis was the construction of a waste water reclamation plant for potable water with a capacity of 2 000m3/day. With this in place in January 2011, 28% of the current demand of around 7 100m3/day could be met. The relatively high cost of this water could be accepted by the consumer because of the awareness of the value of water that the crisis had created. This awareness was the other main outcome of the crisis. The challenge will be to maintain this awareness now that a much less precarious water supply situation has been established. This includes the establishment of a groundwater well field able to supply more than half of the town’s demand for short periods of time as required.
Above: Water reclamation Plant; Gamka Dam on 18 November 2011 ((© JCL Smit)

118
AgriculturalManaging evapotranspiration using quotas Hai Basin, China
1. The World Bank. Implementation completion and results report (TF-53183) on a grant from the Global Environment Facility (GEF) in the amount of US$17.0 million to the People’s Republic of China for a Hai Basin integrated water and environment management project, China and Mongolia Sustainable Development Unit, Sustainable Development Department, East Asia and Pacific Region [online] 2011 [viewed 4th April 2013.
Irrigation management Orange-Senqu Basin, South Africa
2. Crerar, S., Rutherfoord, J., & de Wet, N. Promotion of Water Conservation and Water Demand Management in Irrigation Sector. Pretoria:ORASECOM, 2011 [Viewed 5th April 2013]
3. Orange-Riet Water User Association. Scheme Regulations Riet River, 2004.
Integrated watershed management Adarsha, Kothapally, India
4. Sreedevi, T. K., & Wani, S. P. Adarsha watershed in Kothapally: Understanding the drivers of higher impact. Patancheru: International Crops Research Institute for the Semi-Arid tropics, 2004.
5. Wani, S. P., Singh, H. P., Pathak, P., & Rego, T. J. Innovative Farmer Participatory Integrated Watershed Management Model: Adarsha Watershed, Kothapally, India - A Success Story! Pantancheru: International Crops Research Institute for the Semi Arid Tropics, 2002
6. Wani, S. P., Sreedevi, T. K., Pathak, P., Shiferaw, B., & Iyer, S. R. Farmer-Particpatory integrated Watershed Management: Adarsha Watershed, Kothapally India; An Innovative and Upscalable Approach. ICRISAT Open Access Journal, 2006
Irrigation scheduling in grape farming Shelanu Farm, South Africa
7. Crerar, S., Rutherfoord, J., & de Wet, N. Promotion of Water Conservation and Water Demand Management in Irrigation Sector. Pretoria: ORASECOM, 2011.
05References
Ground Water Conservation, Republic of Yemen
8. Foster S. Rationalizing Groundwater Resource Utilization in the Sana’a Basin of Yemen, Sustainable Groundwater Management: Lessons and Practice, World Bank, 2003 [viewed 8th April 2013]. Available from http://water.worldbank.org/publications/yemen-rationalizing-groundwater-resource-utilization-sanaa-basin
9. World Bank. Implementation and Completion Report, Groundwater and Soil Conservation Scheme, 2012.
10. World Bank. Republic of Yemen Country Water Resources Assistance Strategy, P-Notes, Issue 8, [online] 2008 [viewed 3rd April 2013]. Available from: http://www-wds.worldbank.org/external/default/WDSContentServer/WDSP/IB/2008/07/16/000333038_20080716042459/Rendered/PDF/447280BRI0Box31BLIC10Water0P1note08.pdf
11. Zeitoun M, Allan T, Al Aulaq N, Jabarin A, Laamrani H, Water Demand Management in Yemen and Jordan: Addressing power and interests, The Geographic Journal [online] 2011 [viewed 5th April 2013]. Available from http://onlinelibrary.wiley.com/doi/10.1111/j.1475-4959.2011.00420.x/abstract
Pilot low cost irrigation scheduling, Punjab, India
12. Perveen, S., Columbia Water Centre. Personal Communication, 2013
13. Perveen, S., Krishnamurthy, C.K., Vatta, K., Kaur, B., Modi, V., Fishman, R., Polycarpou, L., Lall, U. Restoring Groundwater in Punjab, India’s breadbasket: Finding Agricultural Solutions for Water Sustainability. Columbia Water Center, Earth Institute [online] 2012 [viewed 26th March 2013]. Available from: http://water.columbia.edu/2012/03/07/columbia-water-center-released-new-whitepaper-restoring-groundwater-in-punjab-indias-breadbasket/
Improved water distribution management Lower Vaal River Catchment, South Africa
14. Foster S, Rationalizing Groundwater Resource van Vuuren, L. Water savings: Persistence pays off at Vaalharts, The Water Wheel 2009, pp12-15
15. Crerar, S., Rutherfoord, J., & de Wet, N. Promotion of Water Conservation and Water Demand Management in Irrigation Sector. Pretoria:ORASECOM, 2011 [Viewed 5th April 2013]

119
Water reclamation for reuse and groundwater recharge, Orange County, Florida, USA
16. Crook, J. Innovative applications in water reuse and desalination: case studies 2. Alexandria VA, Water reuse Association [online] 2007 [viewed 5th April]. Available from https://www.watereuse.org/files/images/WRA-103.pdf
17. USGS. Environmental Setting and Hydrologic Conditions [online] USGS CIRC 1170 subpage, 1992 [viewed 29th March 2013]. Available from: http://pubs.usgs.gov/circ/circ1170/enviro.htm
18. Southeastagnet.com. Southeast AgNET » Archive » Citrus Growers May Get Conserv II Water for Free [online] 2012 [viewed 29th March 2013]. Available from: http:// southeastagnet.com/2012/11/08/citrus-growersmay- get-conserv-ii-water-for-free/
19. Orange County Utilitites. Water, Wastewater and Reclaimed Water Rates [online] 2012 [viewed 29thMarch 2013]. Available from: http://www.ocfl.net/Portals/0/Library/Water-Garbage-Recycle/docs/
Improving water availability through wastewater treatment, Segura River, Spain
20. Grindlay et al. Implementation of the European Water Framework Directive: Integration of hydrological and regional planning at the Segura River Basin, southeast Spain, Land Use Policy, Volume 28, 2011. pp242-256.
21. Confederación Hidrográfica del Segura Press Office, Ministerio de Agricultura, Alimentación y Medio Ambiente. Personal Communication. March 2013
22. McCann, B. Wastewater reuse brings life back to Spain’s Segura River, Water21, 2012 pp28-33
23. Rodenas, M. Integrated Urban Water Reclamation and Reuse System. PowerPoint presentation [online] 2012 [viewed 8th April 2013]. Available from: http://www.aedyr.eu/presentaciones_pdf/1_MARodenas_aedyr_nov_2012_AZUL_INGLES_FINAL.pdf
Irrigation network renewal North Victoria, Australia
24. Department of Sustainability and Environment. Audit of Water Recovery: Northern Victoria Irrigation Renewal Project 2011/12. 2012
25. Xiaokai Li, Graeme Turner, and Liping Jiang, Grow in Concert with Nature. World Bank, 2012
26. Golburn-Murray Water , Fact Sheets – Golburn Murray Water , [online], 2013 [viewed 28th march 2013] Available from: http://www.g-mwater.com.au/connections/publications/fact_sheets.
Irrigation optimisation Soetmelkvlei Farm, South Africa
27. Crerar, S., Rutherfoord, J., & de Wet, N. Promotion of Water Conservation and Water Demand Management in Irrigation Sector. Pretoria: ORASECOM, 2011 [Viewed 5th April 2013].
Improved water management for sugarcane production, Godavari Basin, India
28. WWF-India. Presentation on Thirsty Crop [online] No date [viewed 21st March 2013) Available from: http://www.wwfindia.org/about_wwf/reducing_footprint/thirsty_crops/
29. CII Water Institute. Our Cup of Joy, India’s Best Practices on Water [online] 2010 [viewed 18th March 2013]. Available from: http://www.indiawaterportal.org/post/13223
30. WWF India. Better Management Practices in Sugarcane Farming System- provided by M. Dhar, WWF India, on 11th March 2013. No date.
31. Dhar, M., WWF. Personal Communication, 2013
120
Industrial Managing water towards zero discharge Lerma Chapala Basin, Mexico
32. White, D., Chamley, R., Smith, L., Glancy, V. Arup Design Review Team for Planta Milenio. Personal Communication, March 2013
Metering of non-revenue water Ekurhuleni, South Africa
33. Regional African Water Loss Summit, 2012
Water efficiency audits of steam systems Melbourne, Australia
34. Borthwick, T., Kellogg Brown & Root Pty Ltd. City West Water’s steam system Efficiency Programme, An Award Winning Programme Making a Difference. No date, [viewed 9th April 2013] Available from: www.airah.org.au/iMIS15_Prod/.../MF_180912_TBpp.pdf
35. Fawcett, J., Liubinas, A., City West Water. Personal Communication, March 2013
Water reuse in textile sector, Tiruppur, India
36. CII Water Institute. Our Cup of Joy, India’s Best Practices on Water [online] 2010 [viewed 18th March 2013]. Available from: http://www.indiawaterportal.org/post/13223
37. Madhav R, Working Paper - Tiruppur water supply and sanitation project, An impediment to sustainable water management? International Environmental Law Research Centre [online] 2008 [viewed 8th April 2013]. Available from: ww.ielrc.org/content/w0801.pdf
38. Ranganathan K, Recycling of wastewaters of textile dyeing industries using advanced treatment
39. technology and cost analysis—Case studies, Resources, conservation and recycling, 2007. pp 306 - 318
40. Kothandaraman, P. & Kumar, K. Water for All: New Tiruppur Area Development Corporation Ltd., UNDP Case Study [online] 2007 [viewed 3rd April 2013]. Available from: http://growinginclusivemarkets.org/media/cases/India_NTADCL_2008.pdf
41. Allen Blackman (Ed.). Small Firms and the Environment in Developing Countries: Collective Impacts, Collective Action (Resources for the Future), 2006
05References
Water use reduction strategy in the food sector
Mossel Bay, South Africa
42. Water Affairs & 2030 Water Resources Group. Closing the water gap by 2030, Strategic Water Partners Network South Africa. 2012 [viewed 21st March 2013]. Available from: http://www.2030wrg.org/wp-content/uploads/2012/07/5.-South-Africa_Strategic-Water-Partners-Network-Brochure.pdf
43. Nestlé Water Resources Review – Mossel Bay, Nestlé Agriculture Department, Oct 2010
44. Nestlé. Nestlé South Africa halves water usage in Mossel Bay. 2012 [viewed 2nd April 2013]. Available from: http://www.nestle.com/csv/CreatingSharedValueCaseStudies/AllCaseStudies/Pages/Nestle-South-
45. Africa-halves-water-usage-in-Mossel-Bay.aspx
Water optimisation in mining sector Lomas Bayas Copper Mine, Chile
46. Xstrata Copper. Reducing evaporative losses at Lomas Bayas, Xstrata Case Study [online] 2010 [Viewed 12th March 2013]. Available from: http://www.xstrata.com/sustainability/casestudies/reducing-evaporative-losses-at-lomas-bayas/
47. ICMM International Council on Mining & Metals, Water Management in Mining; a selection of case studies [online] 2012 [Viewed 12th March 2013]. Available from: http://www.icmm.com/document/3660
48. Ellis, L. Sustainable Development, Risk and Environmental Manager, Xstrata Copper North Chile Division, Personal Communication, March 2013
121
Wastewater reclamation and re-use network, Singapore
49. Water Reuse Association. Innovative Applications in Water Reuse and Desalination – Case Studies 2 [online] 2007 [viewed 26th March 2013]. Available from: http://www.watereuse.org/product/innovative-applications-water-reuse-and-desalination-case-studies-2-0
50. Public Utilities Board, PUB, Singapore Government, NEWater [online] 2011 [viewed 21st March 2013]. Available from: http://www.pub.gov.sg/ABOUT/HISTORYFUTURE/Pages/NEWater.aspx
51. Public Utilities Board, PUB, Singapore Government. NEWater, The 3rd National Tap, Use Each Drop of Water More Than Once [online] 2012 [viewed 20th March 2013]. Available from: http://www.pub.gov.sg/water/newater/Pages/default.aspx
52. Water For All, PUB Annual Report. NEW Way To Slake Our Thirst [online] 2006 [viewed 23rd March 2013]. Available from: http://www.pub.gov.sg/annualreport2007/Splash_new_way_to_slake_your_thirst.htMl
53. Public Utilities Board, PUB, Singapore Government, Water Tariff [online] 2013. [Viewed 24th March 2013]. Available from: http://www.pub.gov.sg/general/Pages/WaterTariff.aspx
54. The World Bank. Dealing with Water Scarcity in Singapore: Institutions, Strategies, and Enforcement, Environment and Social Development, East Asia and Pacific Region [online] 2006 [Viewed April 4th 2013]. Available from: http://siteresources.worldbank.org/INTEAPREGTOPENVIRONMENT/Resources/WRM_Singapore_experience_EN.pdf
55. SembCorp Industries. Office of International Corporate Finance, Division of Corporation Finance, Securities and Exchange Commission, Announcement to the Singapore Exchange Securities Trading Limited, January 2008
Water recycling in the food sector Durban, South Africa
56. Unilever. Sustainable Living Plan, Africa 2011/12 [online] No Date [viewed 3rd April 2013] Available from: http://www.unilever.co.za/Images/Unilever%20Sustainable%20Living%20Plan%202011%2012%20Online_tcm84-263156.pdf
57. Unilever. Annual Reports and Accounts 2011, [online] 2011 [viewed 4th April 2013]. Available from: http://www.unilever.com/investorrelations/annual_reports/archives/#13-280688
58. Geoff Sysum, Unilever Project Delivery Engineer. Personal Communications 2013
Water recycling in paper production City of Jeddah, Saudi Arabia
59. Osama Ibrahim. Personal Communication. Process Manager, Middle East Paper Company. March 2013
Groundwater recharge, Omdel Dam, Namibia
60. Frindt M., Crerar S. OMDEL DAM - An appropriate Solution, The Namibian Engineer; The Engineering Professions Association of Namibia, Windhoek, December 1991
61. Crerar, S., & Muir, C. Analysis of Present and Future Water Demand in Namibia. Windhoek: Windhoek Consulting Engineers, 2000.
62. Crerar, S., Fry R.G., Slater P., Wheler D., Van Langenhove G. An unexpected factor affecting recharge for ephemeral river flows in Namibia, NATO ASI C series 222, 1987.
63. Wheeler D., Crerar S., Slater P., Van Langenhove G. Investigation of recharge processes to alluvium in ephemeral rivers, Hydrological Sciences Symposium, Grahamstown, 1987.
64. Department of Water Affairs. OMDEL Dam State Water Scheme. Windhoek: DWA, Namibia. 1995

122
05References
Mine water recycling, East Kimberley Western Australia
65. Rio Tinto. Sustainable development report Argyle Diamonds [online] 2011 [viewed 18th March 2013]. Available from: http://www.riotinto.com/documents/ReportsPublications/2007_Argyle_Diamonds_sustainable_development.pdf
66. McConnon, T., Brann, M., ABC News. Reports Ord Stage 2 will go to Chinese Company [online] 2012 [viewed 25th March 2013] Available from: http://www.abc.net.au/rural/news/content/201211/s3632840.htm
67. Rio Tinto. Argyle Diamond Mine - Underground Project 110km south of Kununurra, East Kimberley, Report and Recommendations of the Environmental Protection Authority, Environmental Protection Authority, Perth, Bulletin 1205 [online] 2005 [viewed 22nd March 2013] Available from: http://epa.wa.gov.au/EPADocLib/2152_B1205.pdf
68. Argyle Diamonds, Environmental Management Plan (EMP) for the Argyle Underground Project, Groundwater Management Plan [online] 2005, [viewed 24th March 2013]
Water reuse in the power and steel production sector Gujarat, India
69. Bharatendu, D. Essar Steel, General Manager India. Personal Communication, 2013.
70. Desai, A. Personal Communication. Essar Power Plant India, 2013.
71. Essar. Our Environmental Objectives [online], No Date [viewed 1st March2013]. Available from: http://www.essar.com/article.aspx?cont_id=sXGKWFi46lI=
72. Essar. Mitigating Climate Change [online] 2013 [viewed 1st March 2013] Available from: http://www.essar.com/article.aspx?cont_id=tOMIbUpJ2TY=
73. Worldsteel Association. Sustainable Steel 2010 – Company Case Study [online] 2010 [Viewed 1st March 2013] Available from: http://www.worldsteel.org/steel-by-topic/sustainable-steel/company-case-studies/waste-water-recycling-essar.html
74. Federation of Indian Chambers of Commerce and Industry. FICCI – HSBC Knowledge Initiative: Water Use and Efficiency in Thermal Power Plants [online] New Delhi, No date [viewed 1st March 2013]. Available from: www.ficci.com/spdocument/20147/ficci-Water-use.pdf
Direct dry cooling in the power sector Matimba, South Africa
75. Eskom. Water Management [online] no date [viewed 8th April 2013]. Available from: http://www.eskom.co.za/c/article/240/watermanagement/
76. M’Marrete, C.K. Study of agricultural industry in the Limpopo Province, Chapter 3 - Climate and water resources in the Limpopo Province, Department of Agricultural and Rural Engineering [online] No date [viewed 4th April 2013]. Available from: http://www.lda.gov.za/downloads/downloads_reports/CLIMATIC%20AND%20WATER%20RESOURCES%20OF%20LIMPOPO%20PROVINCE.pdf
77. Creamer, T, Engineering News Online. Medupi, Kusil overruns should be probed, NPC commissioner asserts [online] 2012 [viewed 2013]. Available from: http://www.engineeringnews.co.za/article/medupi-kusile-overruns-should-be-probed-npccommissioner-asserts-2012-08-21
78. Donnelly, L. Mail & Guardian Business. Eskom Grilled on power price [online] 2012 [viewed 5th April 2013]. Available from: http://mg.co.za/article/2012-08-24-00-eskomgrilled-on-power-price
79. Yelland, C. The Best From EE Publishers. Further cost increases on the cards for Eskom’s Medupi and Kusile power stations [online] no date. [Viewed 4th April 2013]. Available from: http://eepublishers.wordpress.com/2009/12/01/further-cost-increases-on-the-cards-for-eskoms-medupi-and-kusile-power-stations/
80. Electric Power Research Institute, EPRI. Viability and Impacts of Implementing Various Power Plant Cooling Technologies in Texas [online] 2012 [viewed 5th April 2013]. Available from: http://twri.tamu.edu/media/370735/goes%20with%20water%20value%20in%20power%20generation1_final%20report.pdf
81. Lennon, S, Eskom. Advances in Dry Cooling Deployed at South African Power Stations. EPRI 2011 Summer Seminar [online] 2011 [viewed 28th March 2013]. Available from: mydocs.epri.com/docs/SummerSeminar11/Presentations/0404_Lennon_Eskom_Dry_Coolingv3.pdf

123
MunicipalRegional water conservation programme Seattle Water Partnership, USA
82. Dietemann, Al. Personal Communication. Saving Water Partnership Team Lead, Seattle. 2013
83. Seattle Water Supply System Regional 1% Water Conservation Programme. Saving Water Partnership 2008 Annual Report [online] 2009 [viewed 5th April 2013] Available from: www.savingwater.org/docs/2008%20Annual%20Report.pdf
84. Seattle Water Supply System Regional 1% Water Conservation Programme. Saving Water Partnership 2010 Annual Report, [online] 2011 [viewed 5th April 2013]. Available from: www.savingwater.org/docs/2010_Annual_Report.pdf
Reducing business risk through municipal leakage reduction, Emfuleni, South Africa
85. Mckenzie, R., Wegelin, W. PPP to deliver advanced pressure management: Success in South Africa. International Water Association. Water Utility Management International, Volume 5 No. 3, September 2010.
86. Mckenzie, R, Siqalaba, Z & Wegelin W. Community management proves key to successful demand management. International Water Association, Water 21, August 2010, pp 61 & 62
87. Mckenzie, RS. And Wegelin, W. Pressure management in South Africa. Paper presented at the Water Institute of Southern Africa (WISA) biannual conference, Durban, 2010.
88. Mckenzie, R. Pressure management pay-back: success for the Sebokeng & Evaton public private partnership. Water 21, August 2010, pp41-42
Water loss management programme New South Wales Regional Water Utilities, Australia
89. Mitchell, G., WLMP Directorate. Personal Communication, March 2013
90. Water loss Management Program for Regional NSW Water Utilities, Final Progress & Evaluation Report 2006-2011 [online] 2011 [viewed 28th Mach 2013]. Available from: http://www.environment.gov.au/water/policy-programs/water-smart/projects/pubs/water-loss-management-program-final-report.pdf
Advanced pressure management City of Cape Town, South Africa
91. Mckenzie, R. & Wegelin W. 12 Years of Pressure Management in South Africa, WRP & miya, [online] 2012 [viewed 24th March 2013] pp 27-29. Available from: http://www.iwa-waterloss.org/2012/Water-Loss-2012-Speaker-Presentations/27%20February%202012%20Monday%20-%20Plenary%20Session/02-27-2012_01%20Plenary_Ronnie%20McKenzie.pdf
92. Mckenzie, R. & Wegelin, W. Scope for Pressure Management in South Africa. 2010
93. Mckenzie, R, Mostert,H and De Jager, T. Leakage Reduction Through Pressure Management in Khayelitsha: 2 Years Down the Line, 2004 [viewed 29th March 2013]
94. McKenzie, R., Mostert, H and Wegelin, W Leakage Reduction through Pressure Management in Khayelitsha, Western Cape: South Africa, 2003 [viewed 30th March 2013]
95. McKenzie, R. “Khayelitsha: Leakage Reduction through Advanced Pressure Control. Journal of the Institution of Municipal Engineering of South Africa, 2002, Volume 27, No 8, pp43-47. ISSN 0257 1978
96. Wegelin, W and McKenzie, R. “Leakage Reduction through Pressure Management: Concepts and Case Studies. Report TT 186/02 published by the South African Water Research Commission, 2002. ISBN No. 1 86845 832 6.k
97. McKenzie, R. Development of a pragmatic approach to evaluate the potential savings frompressure management in potable was distributions in South Africa: PRESMAC. Report TT152/01. 2001. ISBN No. 1 86845 722 2

124
05References
Leakage reduction in a city City of Jeddah, Saudi Arabia
98. Charpentier Philippe. Personal Communication. Water Operation and Maintenance Director of the Jeddah City Project. 2013
99. Dr. Alshehri, A. Transforming Water Distribution in Jeddah. PowerPoint presentation, Suez Environment. 2012 [viewed 22nd March 2013].
100. I2Owater. Project Profile: Jeddah City Business Unit [online]. No date [viewed 26th March 2013]. Available from: i2Owater.com
101. Lucente, D. Distribution Zones Implementation and Pressure Management. PowerPoint presentation, Suez Environment. 2012 [viewed 27th March 2013]
Aquifer recharge with stormwater City of Salisbury, Adelaide, Australia
102. South Australian Government. Water Proofing Adelaide, A thirst for change 2005–2025. No date, [viewed 20th March 2013]. Available from: www.waterproofingadelaide.sa.gov.au
103. Waterwise Adelaide. The Stormwater Resource, A Submission to the South Australian Water Security Council. 2008 [viewed 3rd April 2013]. Available from: www.civictrust.net.au/WaterWiseExecutiveSummary.pdf
104. Haines, S. Stormwater: Towards Water Sensitive Cities, Paper and Presentation LGMA National Congress [online] 2009 [viewed 2nd April 2013]. Available from: http://www.salisbury.sa.gov.au/Services/Salisbury_Water/Benefits_of_Using_Salisbury_Water
Water demand management scheme Drakenstein, South Africa
105. Kowalewski, A. Pressure Management as part of water demand management in Drakenstein Municipality. Drakenstein, South Africa 2013.
Water authority conservation programme Nevada, USA
106. Southern Nevada Water Authority (SNWA), Conservation Plan 2009 – 2013. 2009
107. Southern Nevada Water Authority. Five-Year Conservation Plan: 2004-2009, 2004
108. Sovocool K, Bennett D, Howey K, Private communications, 2013
109. Sovocool K. Xeriscape Conversion Study – Final Report, Southern Nevada Water Authority, 2005
110. Pacific Institute. Hidden Oasis: Water Conservation and Efficiency in Las Vegas, 2007
Pressure management in municipalities Sebokeng and Evaton, South Africa
111. Mckenzie, R. S., & Wegelin, W. The Sebokeng and Evaton Advanced Pressure Management project: A 5 Year Public Private Partnership. Pretoria: WRP (pty) Ltd, (2010)
Use of seawater in dual municipal water supply Hong Kong, China
112. Tang, S. L., YUE, D. P. T., & KU, D. C. C. Engineering and costs of dual water supply systems. London, IWA. 2007.
113. Wsd.gov.hk. Water Supplies Department Annual Report [online] 2012 [Accessed: 29 Mar 2013]. Available from: http://www.wsd.gov.hk/filemanager/common/annual_report/2011_12/index.html
114. Chinawaterrisk.org. 8 Things You Should Know About Hong Kong Water [online] 2012 [viewed: 29 Mar2013]. Available from: http://chinawaterrisk.org/resources/analysis-reviews/8-things-you-shouldknow-about-hong-kong-water/

125
Leakage reduction in primary schools Upington, South Africa
115. WRP Consulting Engineers. Pilot Project repairing leakage plumbing fittings at Keidebees & Vele-langa Primary Schools in Upington, 2008
Water demand management strategy Singapore
116. Luen, F.S. Singapore Green Plan 2012. Ministry of the Environment and Water Resources, Singapore [online] 2006 [viewed 30th March 2013]. Available from: http://http://app.mewr.gov.sg/data/ImgCont/1342/sgp2012_2006edition.pdf
117. Ministry of the Environment and Water Resources. Singapore Green Plan [online] 2012 [viewed 4th April 2013] Available from: http://app.mewr.gov.sg/data/ImgCont/1342/sgp2012.pdf
Reducing water losses in a large distribution network City of Johannesburg, South Africa
118. Hugo, E. Programmes to reduce None Revenue Water 'Real Losses’ in the City of Johannesburg. African Water Leakage Summit, 2011, Midrand p9
119. Matiwane, M. Water Conservation and Water Demand Management. Johannesburg, South Africa 2012
Behavioural change initiative Zaragoza, Spain
120. Edo, V. N. Zaragoza, A water saving city, Small steps, Big Solutions. Fundacion Ecologia y Desarrollo. 1998
121. Edo, V. N. Zaragoza, Water Saving City. Fundacion Ecologia y Desarrollo. 1998
122. Edo, V. V and Soler, M, F. Zaragosa, 50 Examples of Efficient Water Use in the City. Fundacion Ecologia y Desarrollo. 1998
123. Acemsa. “Layman” General Information Report [online] no date [viewed 3rd April 2013]. Available from http://www.wise-rtd.info/sites/default/files/d-2008-05-19-summary_layman.pdf
Wastewater reclamation to meet potable water demand, Windhoek, Namibia
124. Biggs, D., & Williams, R. A case study of integrated water resource management in Windhoek, Namibia, p9, 2006
125. Crerar, S. E. Evaporation Map for Namibia. Windhoek: Department of Water Affairs, 1998
126. Lahnsteiner, J., & Lempert, G. Water Management in Windhoek, Namibia. Water Science and Technology, pp 55 & 441-448, 2007
127. Van der Merwe, B. Integrated water resource management in Windhoek, Namibia. Water Supply, pp376-380, 2000
Domestic and business retrofit project Sydney, Australia
128. Sydney Water. Save water, money & the environment. Sydney Water. 2001
129. Sydney Water. (2011–2012) Water Efficiency Report. Sydney Water Cooperation, No date [viewed 28th March 2013]. Available from: http://www.sydneywater.com.au/web/groups/publicwebcontent/documents/document/zgrf/mdq3/~edisp/dd_047419.pdf
130. Sydney Water. Manly Council saving water, money & the environment. The Conserver, 2002
131. Sydney Water. Best Practice Guidelines for Water Conservation in commercial office buildings and shopping centres [online] 2007 [viewed 24th March 2013] Available from: http://www.gbca.org.au/docs/ BestPracticeGuidelines ForWaterConservationInCommercial OfficeBuildingsAndShoppingCentres.pdf
132. Sydney Water. Every Drop Counts [online] 2012 [viewed 28th March 2013]. Available from: http://www.sydneywater.com.au/Water4Life/InYourBusiness/EDCBusinessProgramme.cfm
Emergency water demand management Beaufort West, South Africa
133. Smit, J. C. L. Beaufort West - 2010 Water Crisis; Challenges and Solutions. Beaufort West: Municipality of Beaufort West, 2011

126
IRRIGATION MANAGEMENT
Irrigation meteringManaging evapotranspiration using quotas 24
Irrigation management 28
Irrigation scheduling in grape farming 32
Improved water distribution management 38
Irrigation network renewal 44
Irrigation optimisation 46
Irrigation schedulingIrrigation management 28
Irrigation scheduling in grape farming 32
Pilot low cost irrigation scheduling 36
Improved water distribution management 38
Irrigation optimisation 46
Improved water management 48 for sugarcane production
Low cost soil moisture content monitoring
Pilot low cost irrigation scheduling 36
Remote Monitoring and SensingManaging evapotranspiration using quotas 24
Integrated watershed management 30
Irrigation scheduling in grape farming 32
Improved water distribution management 38
Improving water availability through wastewater treatment 42
Irrigation network renewal 44
Irrigation optimisation 46
IRRIGATION SYSTEMS
Sprinkler irrigation systemsIrrigation management 28
Ground water conservation 34
Improved water distribution management 38
Irrigation network renewal 44
Regional water conservation programme 82
Fixed overhead sprinkler system
Irrigation optimisation 46
Fertigation systemsIrrigation management 28
Irrigation scheduling in grape farming 32
Improved water distribution management 38
Irrigation optimisation 46
Micro jet irrigationIrrigation scheduling in grape farming 32
Improved water distribution management 38
Bubbler irrigation systems
Ground water conservation 34
Drip irrigation systemsGround water conservation 34
Improved water distribution management 38
Irrigation network renewal 44
Furrow irrigationIntegrated watershed management 30
Improved water management for sugarcane production 48
06 Index

127
IRRIGATION REFURBISHMENT
Replacement of channels with pipesManaging evapotranspiration using quotas 24
Ground water conservation 34
Irrigation network renewal 44
Lining of irrigation channels
Irrigation network renewal 44
EVAPOTRANSPIRATION REDUCTION
MulchingIrrigation scheduling in grape farming 32
Improved water management for sugarcane production 48
Groundwater rechargeIntegrated watershed management 30
Ground water conservation 34
Water reclamation for reuse and groundwater recharge 40
Groundwater recharge 72
Aquifer recharge with stormwater 92
Shade netting
Irrigation scheduling in grape farming 32
Management of evaporation losses
Groundwater recharge 72
WASTEWATER RE-USE
Wastewater reuse for agricultureWater reclamation for reuse and groundwater recharge 40
Improving water availability through wastewater treatment 42
Wastewater reuse as cooling water
Managing water towards zero discharge 52
Wastewater reuse in mines
Mine water recycling 74
Wastewater reuse in textile industry
Water reuse in textile sector 58
Wastewater reuse in power generation
Water reuse in the power and steel production sector 76
Wastewater reuse in steel production
Water reuse in the power and steel production sector 76
Wastewater recycling in paper production
Water recycling in paper production 70
Wastewater recycling in the food industry
Water recycling in the food sector 68
Wastewater recycling for potable useWastewater reclamation and re-use network 64
Wastewater reclamation to meet potable water demands 112
Emergency water demand management 116

128
NON-POTABLE WATER NETWORKS
Non-potable water distribution systemWater reclamation for reuse and groundwater recharge 40
Aquifer recharge with stormwater 92
Wastewater recycling for industrial use
Wastewater reclamation and reuse network 64
Dual piped water supply system
Use of seawater in dual municipal water supply 102
DOMESTIC DEMAND REDUCTION
Low flow showerheadsManaging water towards zero discharge 52
Water use reduction strategy in the food sector 60
Regional water conservation programme 82
Domestic and business retrofit project 114
Low flow taps Managing water towards zero discharge 52
Regional water conservation programme 82
Domestic and business retrofit project 114
Low flow toilets Managing water towards zero discharge 52
Regional water conservation programme 82
Domestic and business retrofit project 114
Replacement of tap and toilet washers
Reducing business risk through municipal leakage reduction 84
Revision of building regulationsWater Authority conservation programme 96
Water demand management strategy 106
Domestic leakage detection and repair
Domestic and business retrofit project 114
Water saving washing machines
Regional water conservation programme 82
Smart metering
Domestic and business retrofit project 114
06 Index

129
NON-REVENUE WATER
Municipal leakage detection and repairReducing business risk through municipal leakage reduction 84
Water loss management programme 86
Leakage reduction in a city 90
Water demand management scheme 94
Leakage reduction in primary schools 104
Reducing water losses in a large distribution network 108
Emergency water demand management 116
Removal of unmetered water supplies
Metering of non-revenue water 54
Pressure management in municipalitiesReducing business risk through municipal leakage reduction 84
Water loss management programme 86
Advanced pressure management 88
Leakage reduction in a city 90
Water demand management scheme 94
Pressure management in municipalities 100
Reducing water losses in a large distribution network 108
Flow monitoring in municipalitiesReducing business risk through municipal leakage reduction 84
Water loss management programme 86
Water metering in municipalitiesWater demand management scheme 94
Water demand management strategy 106
Reducing water losses in a large distribution network 108
INDUSTRIAL WATER MANAGEMENT
Condensate recovery and reuseWater efficiency audits of steam systems 56
Water reuse in textile sector 58
Water use reduction strategy in the food sector 60
Water recycling in the food sector 68
Steam leakage reduction
Water efficiency audits of steam systems 56
Prevention of operation of water tank overflows
Water efficiency audits of steam systems 56
Condenser process retrofit
Water reuse in the power and steel production sector 76
Reuse of cooling blowdown water
Water reuse in the power and steel production sector 76
Industrial water meteringManaging water towards zero discharge 52
Metering of non-revenue water 54
Water use reduction strategy in the food sector 60
Drip feed application to leach pads
Water optimisation in mining sector 62
Pressure management in factories
Water use reduction strategy in the food sector 60
Direct dry cooling for power generation
Direct dry cooling in the power sector 78
Greywater recycling
Water recycling in the food sector 68
130
ALTERNATIVE WATER SOURCES
Capture of floodwaters
Groundwater recharge 72
Stormwater harvesting
Aquifer recharge with stormwater 92
Seawater for toilet flushing
Use of seawater in dual municipal water supply 102
Rainwater harvesting Ground water conservation 34
Managing water towards zero discharge 52
Water recycling in the food sector 68
Mine water recycling 74
Improvement in water qualityImproving water availability through wastewater treatment 42
Water reuse in textile sector 58
QUOTAS AND TRADING
Water entitlement tradingIrrigation management 28
Irrigation network renewal 44
Enforcement of quotasManaging evapotranspiration using quotas 24
Irrigation management 28
TARIFFS AND INCENTIVES
Reduced water rates for reclaimed water
Water reclamation for reuse and groundwater recharge 40
Subsidies for the purchase of domestic water saving appliancesRegional water conservation programme 82
Behavioural change initiative 110
Subsidies for the purchase of water saving appliances in commercial premises
Water Authority conservation programme 96
Water tariff managementRegional water conservation programme 82
Water demand management scheme 94
Water Authority conservation programme 96
Water demand management strategy 106
Emergency water demand management 116
Provision of grants
Water efficiency audits of steam systems 56
Water auditsMetering of non-revenue water 54
Water efficiency audits of steam systems 56
Domestic and business retrofit project 114
06 Index

131
INSTITUTIONAL REFORM & CAPACITY BUILDINGInstitutional reformManaging evapotranspiration using quotas 24
Irrigation management 28
Integrated watershed management 30
Ground water conservation 34
Improved water distribution management 38
Improving water availability through wastewater treatment 42
Education, technical training and capacity buildingIntegrated watershed management 30
Ground water conservation 34
Water efficiency audits of steam systems 56
Water use reduction strategy in the food sector 60
Regional water conservation programme 82
Reducing business risk through municipal leakage reduction 84
Water loss management programme 86
STAKEHOLDER ENGAGEMENTStakeholder engagmentManaging evapotranspiration using quotas 24
Integrated watershed management 30
Ground water conservation 34
Improved water distribution management 38
Metering of non-revenue water 54
Water use reduction strategy in the food sector 60
Wastewater reclamation and re-use network 64
Regional water conservation programme 82
Reducing business risk through municipal leakage reduction 84
Water loss management programme 86
Advanced Pressure Management 88
Water demand management scheme 94
Water Authority conservation programme 96
Pressure management in municipalities 100
Water demand management strategy 106
Behavioural change initiative 110
Wastewater reclamation to meet potable water demands 112
Domestic and business retrofit project 114
Emergency water demand management 116
Employee participation
Water use reduction strategy in the food sector 60

The Water Resources Group is housed at the IFC 2121 Pennsylvania Avenue Washington, D.C. 20433 USA
www.2030wrg.org
For further information, please contact Carmen del Rio Paracolls , Communications Officer [email protected]