a data mining approach for analyzing semiconductor mes and
TRANSCRIPT
Received 22 January 2014
Accepted 17 March 2014
A data mining approach for analyzing semiconductor MES and FDC data to enhanceoverall usage effectiveness (OUE)
Chen-Fu Chien*, Alejandra Campero Diaz, Yu-Bin LanDepartment of Industrial Engineering and Engineering Management, National Tsing Hua University, 101 Section 2
Kuang Fu Road, Hsinchu 30013, Taiwan
Abstract
Wafer fabrication is a complex and lengthy process that involves hundreds of process steps with monitoring numerous process parameters at the same time for yield enhancement. Big data is automatically collected during manufacturing processes in modern wafer fabrication facility. Thus, potential useful information can be extracted from big data to enhance decision quality and enhance operational effectiveness. This study aims to develop a datamining framework that integrates FDC and MES data to enhance the overall usage effectiveness (OUE) for cost reduction. We validated this approach with an empirical study in a semiconductor company in Taiwan. The results demonstrated the practical viability of this approach. The extracted information and knowledge is helpful to engineers for identifying the major tools factors affecting indirect material usage effectiveness and identify specific periods of time when a functional tool has abnormal usage of material.
Keywords: Overall Usage Effectiveness, Data Mining, Manufacturing Intelligence, Decision Tree, Cost Reduction, Semiconductor Manufacturing
*Corresponding author: [email protected]
1. Introduction
The competition of the semiconductor industry is increasingly intense. The wafer fabrication is a complex and lengthy process that involves hundreds of process steps. Meanwhile, to enhance yield and quality, numerous process parameters are monitored at the same time for advanced process control (APC), advanced equipment control (AEC), and fault detection and classification (FDC). During all of these automation processes, big data is collected by information systems such as manufacturing execution system (MES) and fault detection and classification (FDC) system. Such data may be analyzed and utilized for valuable manufacturing intelligence to support decision making.
The materials used in semiconductor process are expensive and enormous expenditure, thus the efficiency of material usage is critical factor for cost reduction. The wafer manufacturing costs include fix costs and variable costs. Unlike fix costs that are affected by assets utilization, variable cost is can be decreased by continuous improvement.[21] In particular,the efficiency of indirect material usage is critical factor for variable cost reduction. Within semiconductor manufacturing industry, the indirect material usage performance is influenced by many factors, such as tools, recipes, material, stages, process time, etc. The large and complex amount of data collected makes difficult the rapid and efficient indirect materials usage tracing. For improving material usage efficiency, data
International Journal of Computational Intelligence Systems, Vol. 7, Supplement 2 (July 2014), 52-65
Co-published by Atlantis Press and Taylor & FrancisCopyright: the authors
52
C.-F. Chien, A. Diaz, and Y.-B. Lan
mining techniques can be performed to improve indirect material usage tracing mechanism in order to decreasevariable costs. The measurement of material usage efficiency is a challenge for engineers. Although the overall equipment effectiveness (OEE)[20] is used to measure semiconductor equipment efficiency, little research has been done to measure material usage efficiency with similar concept.
This study aims to propose a data mining framework to analyze the data collected in FDC and MES to enhance indirect material usage efficiency by improving the material tracing mechanism for tool downtime and manufacturing cost reduction. In particular, we propose overall usage effectiveness (OUE) indices to measure indirect material usage performance and drive effective improvement directions. Data mining is employed to analyze the big data from different perspectives in the semiconductor industry such as improving a specific cleaning process,[3] yield enhancement,[10,13,15] personnel selection and human capital improvement[,5,6] and demand forecast.[7] However, little research has been done to employ data mining for material tracing mechanism and thus reducing material usage. To validate this study, real data from a semiconductor company was used for an empirical study. The results have shown practical viability of this approach.
The remainder of this study is organized as follows. Section 2 reviews related studies including semiconductor manufacturing, FDC, OEE, and data mining approach. Section 3 proposes the framework to analyze indirect material usage performance by tools. Section 4 presents an empirical study using data from a semiconductor manufacturing industry in Taiwan for validation of the approach. Section 5 concludes this study with discussion of contribution and future research directions.
2. Fundamental
This section presents brief definition of Fault Detection and Classification (FDC) system, Overall Equipment Effectiveness (OEE) concept, data mining methods and decision tree.
2.1. Fault detection and classification
Semiconductor manufacturing wafer fabrication is extremely complex of modern manufacturing process. A
major process flow in a semiconductor factory may contain over 500 processing steps. Process control and monitoring is used to ensure yield in semiconductor manufacturing plant.[12] At each step, there are various inspections and measurements performed to monitor the process and equipment.
FDC is an advanced process control (APC) method that provides a powerful infrastructure to obtain realtime data of tool behaviors.[8] At the semiconductor manufacturing facilities, all the tools had been linked with fab-wide automation system and monitored viaFDC system.[10] The FDC data including flow rate, temperature, rotational speed, pressure, should be checked by knowledge based methods. Numerous new applications have been developed utilizing this comprehensive tool data. Trouble shooting for wafer yield loss is an application that facilitates prompt yield recovery and using this comprehensive database. There were some studies which have executed fault detection and diagnosis applications in batch process monitoring. Spitzlsperger et al.[21] proposed a statistic control chart for the etching process. Moreover, the machine learning method has also been applied to deal with faults classification in semiconductor manufacturing.[19] In addition fault detection and classification was used also in chemical processes, especially batch processes.[24]
The main purpose of using FDC system for this research is to increase overall usage effectiveness via improving the indirect material productive usage or reducing tool downtime. This system collects the data of tool behavior and tool parameters that can be used to calculate the actual material usage by tool. Due to the huge amount of data collected and unclear FDC variable definition, none previous study have been done to find major factors that may influence the overall material usage. FDC has been an important part of the advanced process control (APC) framework for semiconductor manufacturing process, since it can improve overall equipment efficiency (OEE) index.[19]
2.2. Data miningData mining is the exploration and analysis of large quantities of data in order to discover meaningful patterns and rules.[1] Based on the patterns we are looking for, functions in data mining can be categorized into association, clustering, classification, and prediction.[14] The phases of a data mining project
Co-published by Atlantis Press and Taylor & FrancisCopyright: the authors
53

Data mining for OUE
consist of six including business understanding, data understanding, data preparation, modeling, evaluation and using the model.
In data mining, decision tree can be used as apredictive model for a mapping from the observations about an item to estimate its target value. A decision tree is a structure that can be used to divide up a large collection of records into successively smaller sets of records by applying a sequence of simple decision tree rules. With each successive division, the members of the resulting sets become more and more similar into another.[1]
Decision construction is divided in three basis stages: Growing the tree, pruning the tree, and extracting rules. Firstly, the procedure of growing the tree consists in repeatedly split the data into smaller and smaller groups in such way that each new generation of nodes has grater purity than its ancestors with respect to the target variable. Secondly, pruning that eliminates theunstable splits by merging smaller leaves is employed to avoid overfitting. Finally, the result of decision tree isconverted to a number of IF–THEN rules for classification. Each attribute value along a path forms a conjunction in the rule antecedent, while the leaf node determines the predicted class or value, forming the rule consequent.
CHAID (Chi-Squared Automatic Interaction Detection) is a non-binary decision tree that determines the best multi-way partition of the data.[16] To determine the best split at each step this algorithm relies on the Chi-square test (when the dependent variable is categorical in nature) and F-tests (when the dependent variable is continuous). Also, because the CHAID algorithm will often effectively yield many multi-way frequency tables (e.g., when classifying a categorical response variable with many categories, based on categorical predictors with many classes), it has been particularly popular in marketing research, in the context of market segmentation studies.
2.3. Overall Equipment Effectiveness (OEE)
In recent years, the semiconductor industry has largely adopted the overall equipment effectiveness (OEE) metric as a comprehensive measure for analyzing and reporting equipment performance and assets utilization. Fabs use the Semi E10 definition of OEE as a key floor
shop management metric. According with that definition, OEE is the product of six equipment losses grouped into three categories: availability, performance efficiency, and rate of quality. These three categories encompass all equipment states and result in an OEE percentage based on the following Equation (1).
100%QualityofRateEfficiencyePerformanctyAvailabiliOEE%
(1)
The OEE reporting system extracts and integrates the required information for determining a tool's OEE directly from the manufacturing execution system (MES). The OEE reporting system calculates OEE, OEE components, and work in process (WIP) levels, linking tool performance to its required volume of processing.[17] The OEE reporting system gives information on equipment performance and utilization metrics. OEE was extended to construct an index of OGE for promoting tool group productivity in semiconductor manufacturing.[4] Furthermore, the overall wafer effectiveness (OWE) index was proposed from output perspective to enhance wafer productivity.[9,11] In this paper, we propose Overall Usage Effectiveness (OUE) to measure material usage performance.
3. Data mining for overall usage effectiveness
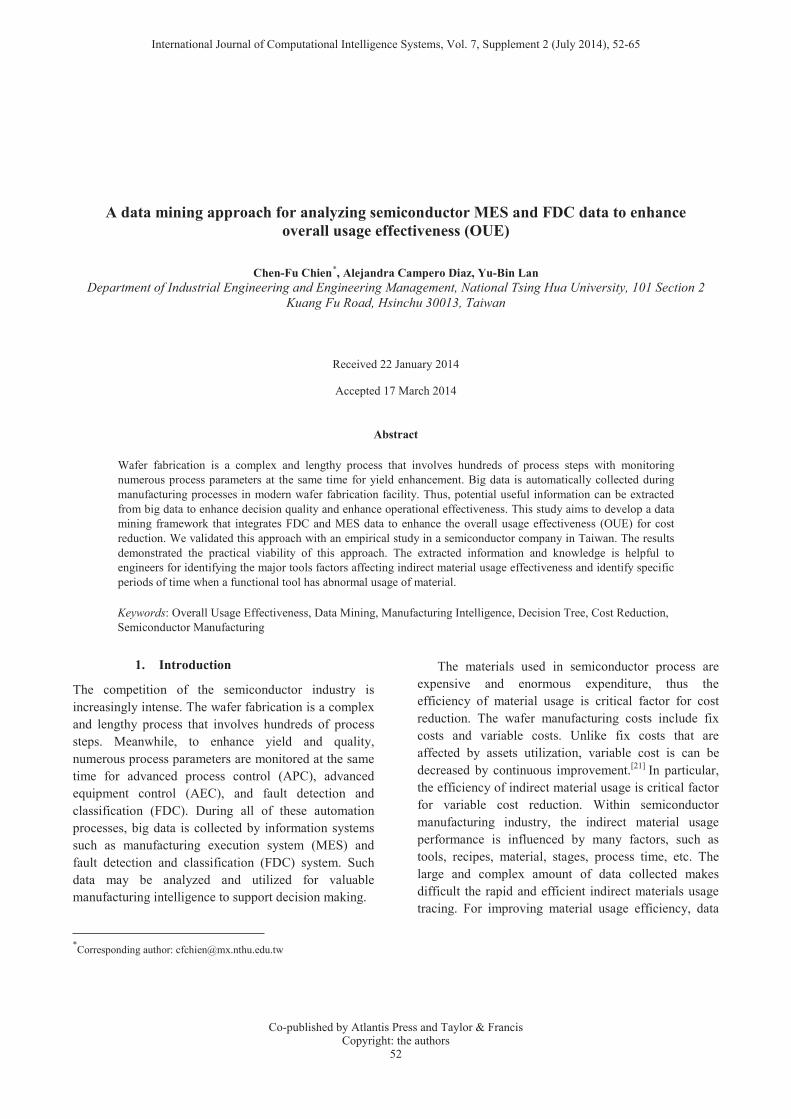
This study proposes a decision tree approach combined with clustering of time series to explore the huge engineering data for improving overall usage effectiveness. This framework includes five major steps: problem definition, data selection and calculation, data preparation, decision tree construction, and evaluation and interpretation. Fig. 1 illustrates the major conceptual framework of this approach.
3.1. Problem definition
In semiconductor industry, variable costs include: indirect materials such as Photo resist, chemical, slurry, and gas. OEE can enable predictive maintenance that can dramatically reduce repair costs to deal with R&M costs. However, little research has been done to address productivity from the perspective of material usage performance. Knowing tool parameters that lead to the productivity usage of indirect material may be used as
Co-published by Atlantis Press and Taylor & FrancisCopyright: the authors
54
C.-F. Chien, A. Diaz, and Y.-B. Lan
an opportunity to increase usage effectiveness. Therefore, our approach is designed to improve indirect material usage tracing mechanism to make an attempt to increase Overall Usage Effectiveness (OUE). In particular, the OUE (Overall usage Effectiveness) is defined as a metric of overall material usage performance, expressing the useful material volume for the good wafer divided by the total material volume.
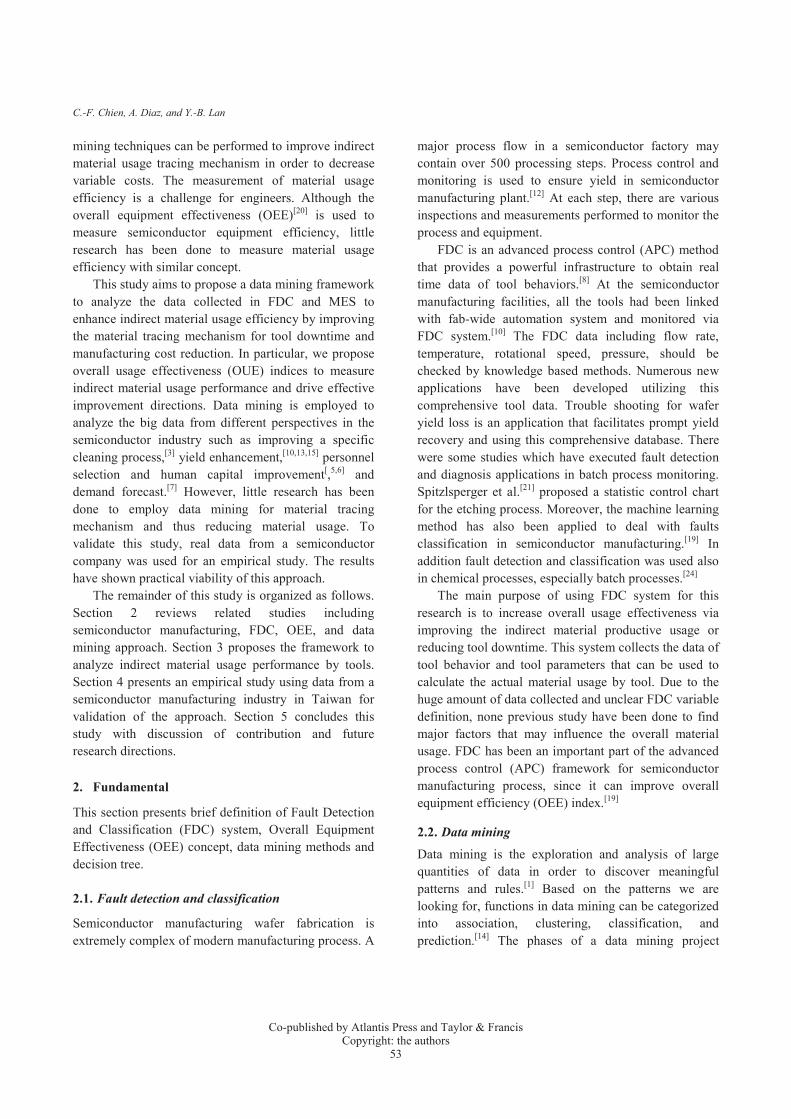
As the conceptual framework of OUE showing inFig. 2, key blocks of material usage can be particularly associated with the basic statuses and sub-statuses to achieve the material usage tracking resolution for improving material usage effectiveness. Thus, OUE indices can be defined with different operational statuses and related factors. In particular, the OUE is
referred the portion of material volume for effective wafers to total volume and is expressed as Equation (2).
Fig. 2 Conceptual decomposition of OUE indices
100% volumetotal
wafereffectivefor volumematerialOUE (2)
Available volume (AV) showed as Equation (3) is the portion of material volume that can be able used. The loss of availability usage is due to remainder on the container and off-line training.
100% volumetotal
useactualfor volumematerialAV (3)
Operation volume (OV) showed as Equation (4) isthe portion of material volume that the material actual be used in equipment up state. The loss of operation volume is due to the volume of actual use which is influenced by production test and equipment down state.
100%useactualfor volumematerialstateoperation for volumematerialOV (4)
Manufacturing volume (MV) that is the portion of material volume used in manufacture process showed as Equation (5). The loss of manufacturing volume is due to the manufacturing process requirement including the setting of tool parameter and recipe.
100%stateoperation for volumematerial
ingmanufacturfor volumematerialMV (5)
Yield volume (YV) that is the portion of material volume used in effective wafers for manufacturing showed as Equation (6). The loss of yield volume is due to the material volume of effective wafers which are influenced by rework and scrap.
Fig. 1 Research Framework
Co-published by Atlantis Press and Taylor & FrancisCopyright: the authors
55
Data mining for OUE
100%ingmanufacturfor usagematerial
waferseffectivefor volumematerialYV (6)
Thus, the material usage in each operation status can be separated by different effectiveness stage of the proposed OUE indices, which indicates the ownership of the corresponding material volume loss. Indeed, by considering different material volume loss, OUE can also be expressed by availability volume (AV), manufacturing volume (MV), wafer volume (WV), and yield volume (YV) as Equation (7).
100%YVMVOVAVOUE (7)
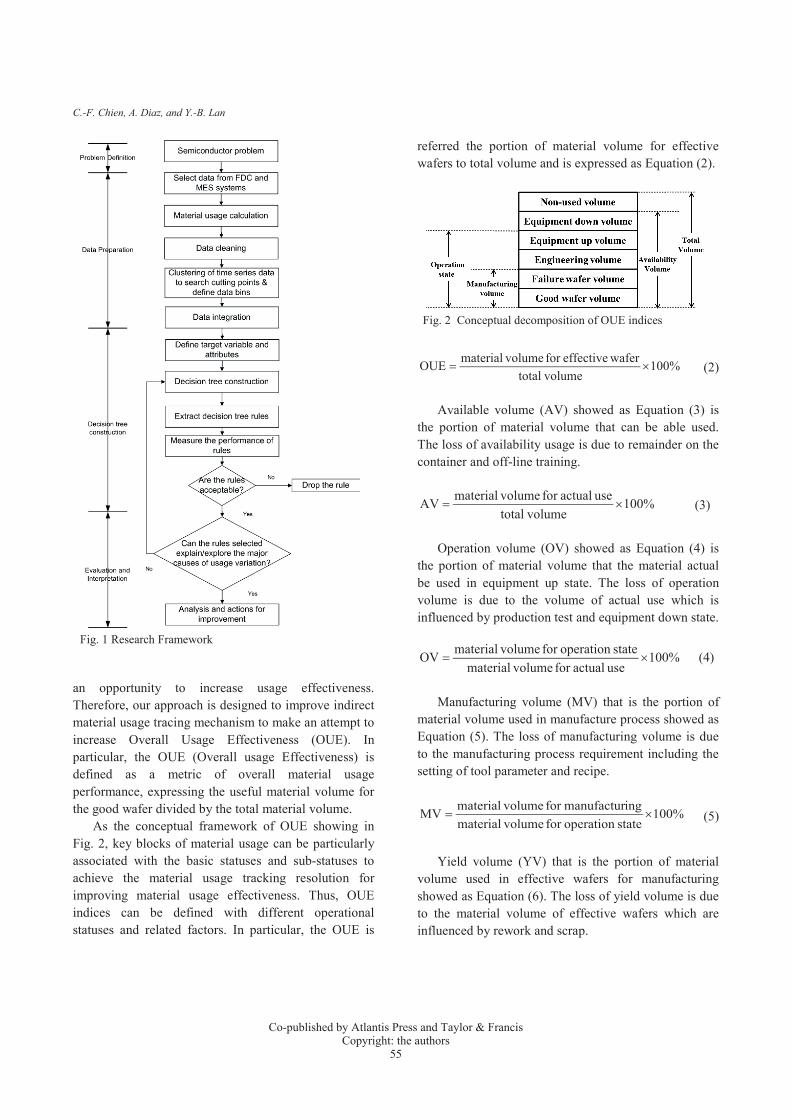
Considering material usage operation in practice, the total material volume can be breakdown as Fig. 3. Different factors will cause material wasted and thus affect the corresponding available volume, manufacturing volume, wafer volume, yield volume, and the derived OUE. The useless material usage can be classified into equipment limitation loss, operation loss, and defective die loss. As shown in Fig. 3, various directions can be employed to reduce the corresponding material volume loss to enhance the effectiveness of OUE indices, respectively.
3.2. Data preparation
During the fabrication process a large amount of data is automatically or semi automatically recorded and accumulated in the engineering databases. The real time data is utilized to monitor and control all the manufacturing process and tools behaviors by FDC system. To come out with the actual usage of material for each piece within a lot, we used FDC database which provide material flow rate as a function of time. Since the usage of material also depends on some specific manufacturing conditions, this kind of information was extracted directly from the manufacturing execution system (MES). To calculate the total usage of material, we employed an integral method to add all the materials flow rates used during a wafer polishing procedure.
Different data cleaning procedures were conducted for FDC and MES system. For MES data, if any missing values are discovered, we try to fill these values with engineers judgment first. Otherwise, we eliminate them. For FDC data, since previous knowledge of the nature of the data was not available, N-pts movement average smoothing technique was used to remove noise.[2]
Non-used volume Availability volume
Un-operation volume Operation volume
Engineering volume Manufacturing volume
Failure wafer volume Good wafer volume
Tool parameter settingRecipe settingEquipment /process experiments
Remainder on container/vesselEvaporation/ spillOff-line usage
Production testsEquipment down wasteOther states/wastes occurduring production
Total material volume
ReworkScrapMis-operationEquipment failureContamination
Fig. 3. Breakdown of OUE.
Co-published by Atlantis Press and Taylor & FrancisCopyright: the authors
56

C.-F. Chien, A. Diaz, and Y.-B. Lan
The main goal of using clustering in our approach is to identify the cutting points and divide the data into periods of time (segments) when the value of indirect material usage is either high or low. Decision Trees require sorting operations for dealing with continuous attributes, which largely increase learning times. Moreover, using categorical data as a target helps to identify the factors associated with changes in the distribution of the target value as well as enables to look at the characteristics of a group of scores and compare them across segments in the analysis.
We use K-means algorithm to measure the dissimilarity between trajectories,[18] since it works with raw data and allows using time series data to form a discrete number of segments of unequal length.
Discretization brings several benefits: it accelerates the learning scheme, because nominal attributes are generally processed faster than numeric ones; it reduces the likelihood of overfitting, by narrowing the space of possible hypotheses that the learning scheme can explore, and also the resulting classifiers are often significantly less complex and sometimes more accurate than the classifiers learned from raw numeric data.[23]
To evaluate the appropriateness of the classification, we compare the within cluster variability (small if the classification is good) to the between cluster variability (large if the classification is good). Thus, we perform a standard between group analysis of variance for each dimension (case or variable). Finally, we perform the discretization procedure, selecting the set of clusters with the best performance.
The integration of FDC and MES can improve indirect material usage effectiveness via the detection of the productive usage of material in a tool (FDC) working at certain manufacturing conditions (MES). Moreover, having both systems integrated we will try to find out the major factors influencing on material usage performance. Thus, the overall equipment effectivenesscan be improved through the reduction of tool downtime.
3.3. Decision tree construction
Decision tree analysis technique was selected because the rules extracted using this methodology are easier to understand and interpret than using another data mining methodology. To build up the decision tree, we use Chi-
Squared Automatic Interaction Detection (CHAID)based decision tree, since it allows finding statistically relevant relationships and trends within large database.
In order to evaluate and improve indirect material usage, this variable was defined as the target variable to construct the tree. The target variable transformed from numerical to categorical, considering the time factor was presented at the previous step. Thus, target variable now consists on a discrete number of states. For inputs attributes selection, we will try to take as many variables as possible to analyze how they affect the usage of material.
In addition, to analyze decision tree rules we suggest using three different methods: significance test, lift, and accuracy measure. Significance is related to measure the number of instances in the leaf node. At some point the sample size of the segment may become so small that it is of no significance to the analysis. Lift ratio is one way to measure the performance of classification models. What lift actually measure is the change in the concentration of a particular class when the model is used to select a group from the general population.
Accuracy is the correct classification percentage, provided by the rules on a test set defined as, nic/ ni,where ni is equal to the number of points in class i and nic of these points are correctly classified.
Moreover, to measure the quality of the analysis we suggest using the overall fit percentage. This overall fit provides an estimate of how well the analysis represents the relationships in our data by calculating how well the analysis explains the target’s variation. A high overall fit percentage indicates that the analysis explains most of the variability in the data.
3.4. Evaluation and Interpretation
With the results extracted from the decision tree model combined with clustering of time series data, major factors affecting indirect material usage may be identified. Therefore, knowing the parameters in which one tool, working under certain manufacturing process, is using lower quantity of material will be very useful for increasing indirect material usage effectiveness.
Each rule can be created for each pad from the root node to a leaf node in the form of if-then rule. Then, weanalyze the results by discussing with domain engineersto derive managerial implications.
Co-published by Atlantis Press and Taylor & FrancisCopyright: the authors
57

Data mining for OUE
4. An Empirical Study
An empirical study was conducted in a semiconductor fab in Hsinchu Science Park to validate the proposed approach. In particular, the Chemical Mechanical Planarization (CMP) process that is one of the most difficult and expensive wafer fabrication processes was analyzed to improve usage effectiveness for cost improvement. Two real cases were investigated. The first case study analyzed slurry usage under one specific tool, and a certain recipe, part ID and process stage. The second case study used the same tool and manufacturing process conditions, with different part ID. Part ID is a code to identify a product manufactured. The following table shows information about each data set.
4.1. Case 1
4.1.1. Problem definition
To perform this study we analyzed a specific kind of slurry called F1A, this kind of slurry is used only on the first and second platen at the planarization CMP system. In addition, four polishing head are used to perform this process on the first and second platen. According to domain experts and a review of the literature with regards this process, the usage of slurry in one tool working under same manufacturing process conditions, should be steady over the time. However, we found that the usage of this indirect material varies and those variations effect on material usage effectiveness, polishing process, and scrap increase.
4.1.2. Data preparation
From FDC database, real time data of tool behaviors was extracted from February 1st to February 29th in one year. The slurry usage depends of specific manufacturing conditions such as process stage, recipe, and part ID, this relative data was collected from MESsystem. After collecting real time flow rates data from one tool, we used an integral method to come out with the actual usage of slurry.
Therefore, the area under the curve is the slurry usage by wafer ID (context id) at a certain time period during wafer fabrication. The information extracted from both data bases correspond to a specific tool ID called “CUCPAM”. This tool was selected due to its high production ratio. In addition, since we want to
analyze the slurry usage by tool under same manufacturing process conditions, we selected from the row data the most representative recipe and part ID named UTBD26 and TMS408 within the whole data set. Therefore, the data set consisted on 936 instances. As was mentioned before, dataset was divided into the three different process stages (Stage 2, Stage 3, and Stage 5) needed to perform this particular part id.
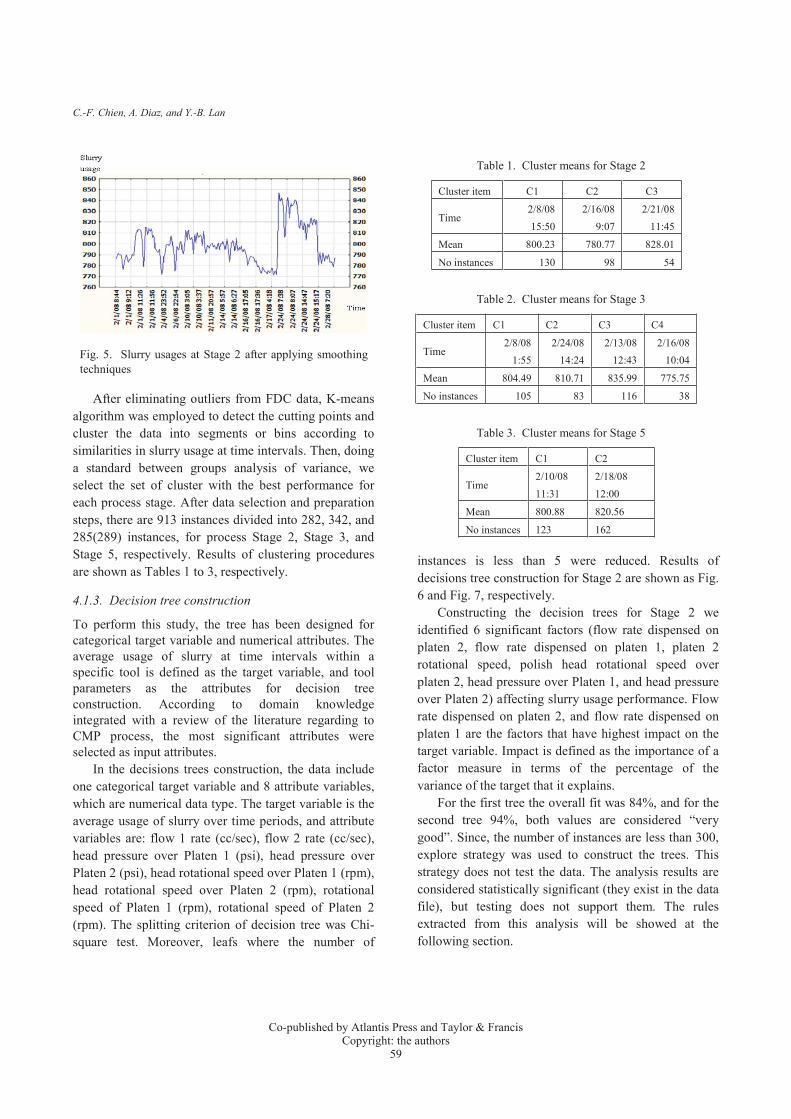
For MES, to deal with missing values, we firstly judge whether specific values can be used to fill the missing values based expert judgments or various estimation techniques. Alternatively, if the data is not critical, we may just delete the complete row withmissing values or ignore the missing data. Moreover, columns with one value such as Tool ID, part id, and recipe ID were ignored for data mining purposes. Columns with unique values such as Loot id, and context ID were also ignored because they uniquely identify each row. For FDC, the data extracted from FDC is time sensor data; therefore, usage of slurry is presented as function of time. As we mentioned before this usage was divided into three process stages. Fig. 4showed the usage of slurry for process Stage 2 over the time.
As the shape of the data obtained for the three stages are jagged lines, we employed moving average smoothing techniques to avoid errors and convert the data into a smooth curve that is relatively unbiased by outliers.[2, 22] We can obtain results of smoothing procedures as shown in Fig 5. We use the same approach to deal with each process stage.
Fig. 4. Slurry usages at Stage 2
Co-published by Atlantis Press and Taylor & FrancisCopyright: the authors
58
C.-F. Chien, A. Diaz, and Y.-B. Lan
After eliminating outliers from FDC data, K-means algorithm was employed to detect the cutting points and cluster the data into segments or bins according to similarities in slurry usage at time intervals. Then, doing a standard between groups analysis of variance, we select the set of cluster with the best performance for each process stage. After data selection and preparation steps, there are 913 instances divided into 282, 342, and 285(289) instances, for process Stage 2, Stage 3, and Stage 5, respectively. Results of clustering procedures are shown as Tables 1 to 3, respectively.
4.1.3. Decision tree construction
To perform this study, the tree has been designed for categorical target variable and numerical attributes. The average usage of slurry at time intervals within a specific tool is defined as the target variable, and tool parameters as the attributes for decision tree construction. According to domain knowledge integrated with a review of the literature regarding to CMP process, the most significant attributes were selected as input attributes.
In the decisions trees construction, the data include one categorical target variable and 8 attribute variables, which are numerical data type. The target variable is the average usage of slurry over time periods, and attribute variables are: flow 1 rate (cc/sec), flow 2 rate (cc/sec), head pressure over Platen 1 (psi), head pressure over Platen 2 (psi), head rotational speed over Platen 1 (rpm), head rotational speed over Platen 2 (rpm), rotational speed of Platen 1 (rpm), rotational speed of Platen 2 (rpm). The splitting criterion of decision tree was Chi-square test. Moreover, leafs where the number of
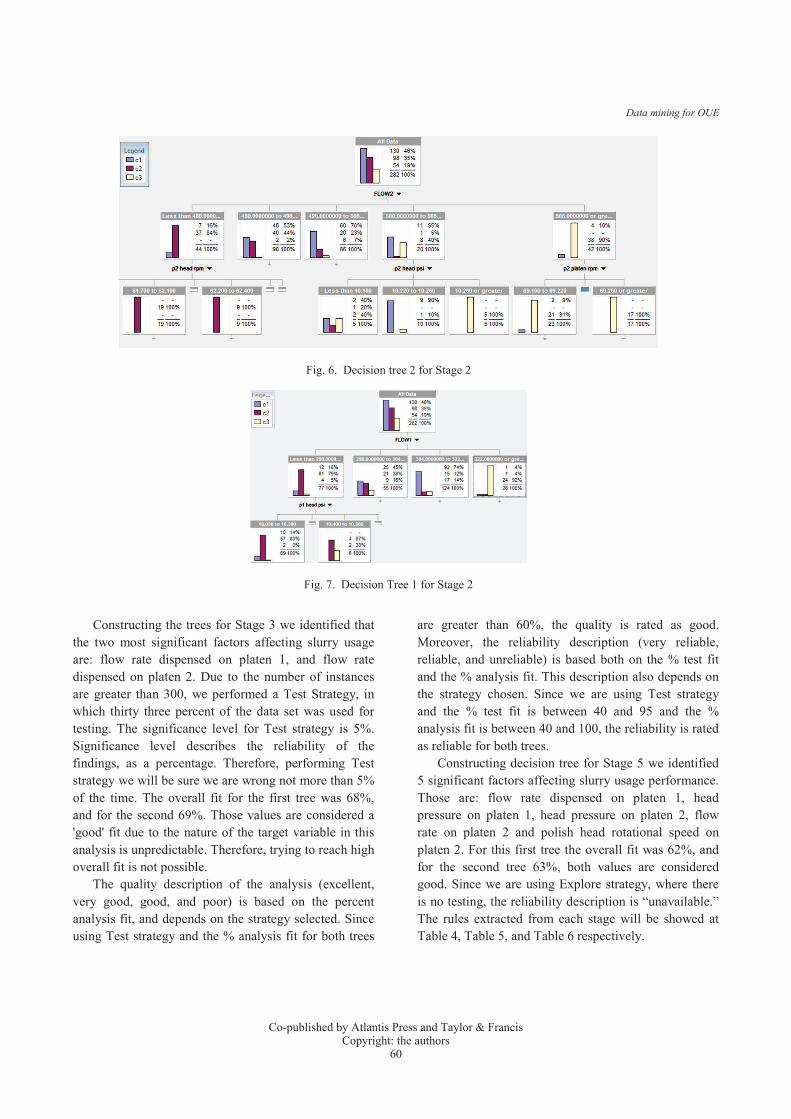
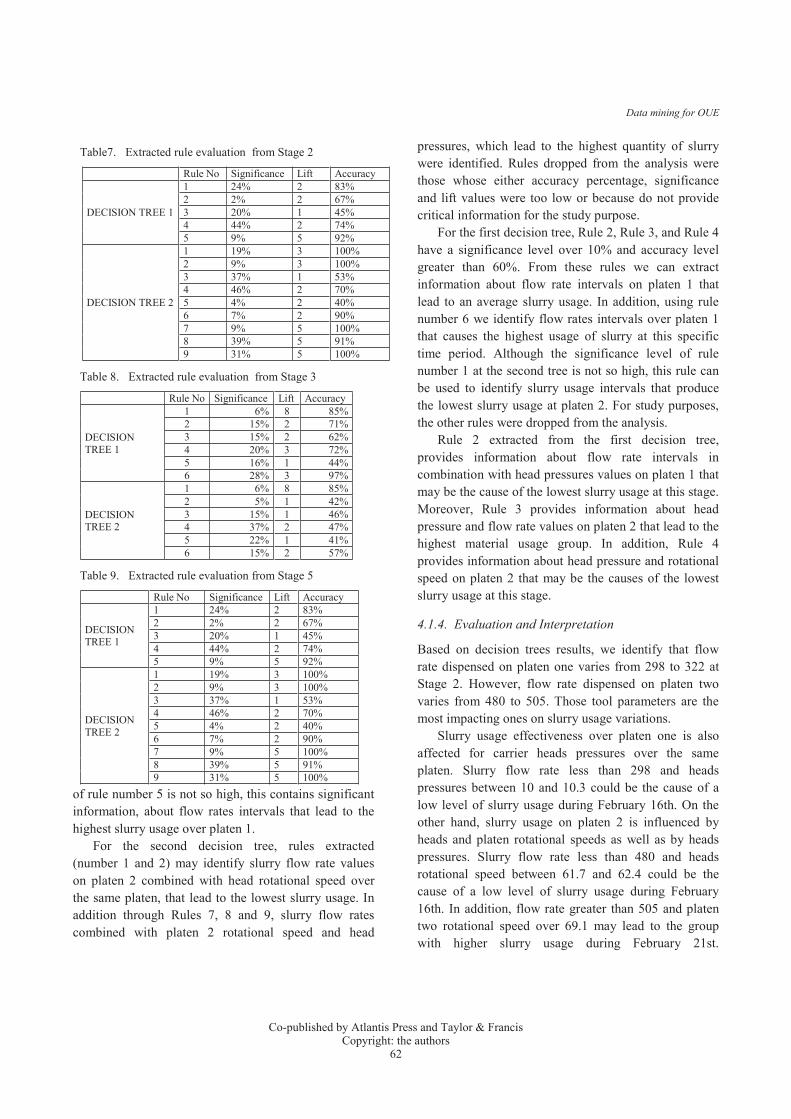
instances is less than 5 were reduced. Results of decisions tree construction for Stage 2 are shown as Fig. 6 and Fig. 7, respectively.
Constructing the decision trees for Stage 2 we identified 6 significant factors (flow rate dispensed on platen 2, flow rate dispensed on platen 1, platen 2 rotational speed, polish head rotational speed over platen 2, head pressure over Platen 1, and head pressure over Platen 2) affecting slurry usage performance. Flow rate dispensed on platen 2, and flow rate dispensed on platen 1 are the factors that have highest impact on the target variable. Impact is defined as the importance of a factor measure in terms of the percentage of the variance of the target that it explains.
For the first tree the overall fit was 84%, and for the second tree 94%, both values are considered “very good”. Since, the number of instances are less than 300, explore strategy was used to construct the trees. This strategy does not test the data. The analysis results are considered statistically significant (they exist in the data file), but testing does not support them. The rules extracted from this analysis will be showed at the following section.
Fig. 5. Slurry usages at Stage 2 after applying smoothing techniques
Table 1. Cluster means for Stage 2
Cluster item C1 C2 C3
Time2/8/08 15:50
2/16/08 9:07
2/21/0811:45
Mean 800.23 780.77 828.01
No instances 130 98 54
Table 2. Cluster means for Stage 3
Cluster item C1 C2 C3 C4
Time2/8/08
1:552/24/08
14:242/13/08
12:432/16/08
10:04
Mean 804.49 810.71 835.99 775.75
No instances 105 83 116 38
Table 3. Cluster means for Stage 5
Cluster item C1 C2
Time2/10/08 11:31
2/18/08 12:00
Mean 800.88 820.56
No instances 123 162
Co-published by Atlantis Press and Taylor & FrancisCopyright: the authors
59
Data mining for OUE
Constructing the trees for Stage 3 we identified that the two most significant factors affecting slurry usage are: flow rate dispensed on platen 1, and flow rate dispensed on platen 2. Due to the number of instances are greater than 300, we performed a Test Strategy, in which thirty three percent of the data set was used for testing. The significance level for Test strategy is 5%. Significance level describes the reliability of the findings, as a percentage. Therefore, performing Test strategy we will be sure we are wrong not more than 5% of the time. The overall fit for the first tree was 68%, and for the second 69%. Those values are considered a 'good' fit due to the nature of the target variable in this analysis is unpredictable. Therefore, trying to reach high overall fit is not possible.
The quality description of the analysis (excellent, very good, good, and poor) is based on the percent analysis fit, and depends on the strategy selected. Sinceusing Test strategy and the % analysis fit for both trees
are greater than 60%, the quality is rated as good. Moreover, the reliability description (very reliable, reliable, and unreliable) is based both on the % test fit and the % analysis fit. This description also depends on the strategy chosen. Since we are using Test strategy and the % test fit is between 40 and 95 and the % analysis fit is between 40 and 100, the reliability is rated as reliable for both trees.
Constructing decision tree for Stage 5 we identified 5 significant factors affecting slurry usage performance. Those are: flow rate dispensed on platen 1, head pressure on platen 1, head pressure on platen 2, flow rate on platen 2 and polish head rotational speed on platen 2. For this first tree the overall fit was 62%, and for the second tree 63%, both values are considered good. Since we are using Explore strategy, where there is no testing, the reliability description is “unavailable.” The rules extracted from each stage will be showed atTable 4, Table 5, and Table 6 respectively.
Fig. 6. Decision tree 2 for Stage 2
Fig. 7. Decision Tree 1 for Stage 2
Co-published by Atlantis Press and Taylor & FrancisCopyright: the authors
60

C.-F. Chien, A. Diaz, and Y.-B. Lan
After calculating those parameters and discussing with domain engineers, we used three techniques to measure decision tree rules for each stage showed asTable 7, Table 8, and Table 9 respectively. We can extract the most significant rules. At the first decision
tree, rule number one identify flow rates intervals and head pressures over platen 1 that lead to the lowest slurry usage. Based on Rule 4, the period of time and flow rate values that lead to an average quantity of slurry were identified. Although the significance level
Table 4. Decision Rules for Stage 2
RuleNo.
IF THENFlow rate 1 Head pressure
over platen 1Flow rate 2 Head rotational
speed over platen 2Head pressureover platen 2
Platen 2 rotational speed
Usage Time
TREE 1
1 < 298 10.0-10.3 780 Feb16th
2 < 298 10.4-10.5 780 Feb16th
3 298 -304 < 304 800 Feb8th
4 304-322 304-308 800 Feb8th
5 >322 308-326 828 Feb 21st
TREE2
1 <480 61.7-62.1 780 Feb16th
2 <480 62.2-62.4 780 Feb16th
3 480-490 800 Feb8th
4 490-500 800 Feb8th
5 500-505 <10.2 828 Feb21st
6 500-505 10.2-10.3 800 Feb 8th
7 500-505 >10.3 828 Feb 21st
8 >505 69.1-69.2 828 Feb 21st
9 >505 >69.3 828 Feb 21st
Table 5. Decision Rules for Stage 3
Rule No. IF THENFlow rate 1 Flow rate 2 Usage Time
TREE 1
1 < 310 775 Feb 16th
2 310-320 804 Feb 8th
3 320-325 804 Feb 8th
4 325- 340 810 Feb 24th
5 340-350 836 Feb 13th
6 >350 836 Feb 13th
TREE 2
1 <462 775 Feb 16th
2 462-466 775 Feb 16th
3 466-472 836 Feb 13th
4 462-482 810 Feb 24th
5 482-488 804 Feb 8th
6 >488 836 Feb 13th
Table 6. Decision Rules for Stage 5
Rule No.IF THEN
Flow rate 1 Head pressure over platen 1
Head pressure over platen 2 Flow rate 2 Head rotational
speed over platen 2 Usage Time
TREE 1
1 < 352 800 Feb10th
2 > 352 10.3-10.35 10.3-10.35 800 Feb10th
3 > 352 10.35-10.5 10.35-10.5 820 Feb18th
4 > 352 >10.6 >10.6 800 Feb10th
TREE 2
1 <10.1 820 Feb18th
2 10.1-10.2 820 Feb18th
3 10.2-10.26 >454 820 Feb18th
4 10.26-10.28 61.7-62.4 800 Feb18th
5 10.28-10.3 800 Feb10th
6 10.3-10.32 820 Feb18th
7 10.32-10.38 800 Feb18th
8 10.38-10.4 62.1-62.3 820 Feb18th
9 >10.4 820 Feb18th
Co-published by Atlantis Press and Taylor & FrancisCopyright: the authors
61
Data mining for OUE
of rule number 5 is not so high, this contains significant information, about flow rates intervals that lead to the highest slurry usage over platen 1.
For the second decision tree, rules extracted (number 1 and 2) may identify slurry flow rate values on platen 2 combined with head rotational speed over the same platen, that lead to the lowest slurry usage. In addition through Rules 7, 8 and 9, slurry flow rates combined with platen 2 rotational speed and head
pressures, which lead to the highest quantity of slurry were identified. Rules dropped from the analysis werethose whose either accuracy percentage, significance and lift values were too low or because do not provide critical information for the study purpose.
For the first decision tree, Rule 2, Rule 3, and Rule 4have a significance level over 10% and accuracy level greater than 60%. From these rules we can extract information about flow rate intervals on platen 1 that lead to an average slurry usage. In addition, using rule number 6 we identify flow rates intervals over platen 1 that causes the highest usage of slurry at this specific time period. Although the significance level of rule number 1 at the second tree is not so high, this rule can be used to identify slurry usage intervals that produce the lowest slurry usage at platen 2. For study purposes, the other rules were dropped from the analysis.
Rule 2 extracted from the first decision tree, provides information about flow rate intervals in combination with head pressures values on platen 1 that may be the cause of the lowest slurry usage at this stage. Moreover, Rule 3 provides information about head pressure and flow rate values on platen 2 that lead to the highest material usage group. In addition, Rule 4 provides information about head pressure and rotational speed on platen 2 that may be the causes of the lowest slurry usage at this stage.
4.1.4. Evaluation and Interpretation
Based on decision trees results, we identify that flow rate dispensed on platen one varies from 298 to 322 atStage 2. However, flow rate dispensed on platen two varies from 480 to 505. Those tool parameters are the most impacting ones on slurry usage variations.
Slurry usage effectiveness over platen one is also affected for carrier heads pressures over the same platen. Slurry flow rate less than 298 and heads pressures between 10 and 10.3 could be the cause of a low level of slurry usage during February 16th. On the other hand, slurry usage on platen 2 is influenced by heads and platen rotational speeds as well as by heads pressures. Slurry flow rate less than 480 and heads rotational speed between 61.7 and 62.4 could be the cause of a low level of slurry usage during February 16th. In addition, flow rate greater than 505 and platen two rotational speed over 69.1 may lead to the group with higher slurry usage during February 21st.
Table7. Extracted rule evaluation from Stage 2
Rule No Significance Lift Accuracy
DECISION TREE 1
1 24% 2 83%2 2% 2 67%3 20% 1 45%4 44% 2 74%5 9% 5 92%
DECISION TREE 2
1 19% 3 100%2 9% 3 100%3 37% 1 53%4 46% 2 70%5 4% 2 40%6 7% 2 90%7 9% 5 100%8 39% 5 91%9 31% 5 100%
Table 8. Extracted rule evaluation from Stage 3
Rule No Significance Lift Accuracy
DECISION TREE 1
1 6% 8 85%2 15% 2 71%3 15% 2 62%4 20% 3 72%5 16% 1 44%6 28% 3 97%
DECISION TREE 2
1 6% 8 85%2 5% 1 42%3 15% 1 46%4 37% 2 47%5 22% 1 41%6 15% 2 57%
Table 9. Extracted rule evaluation from Stage 5
Rule No Significance Lift Accuracy
DECISION TREE 1
1 24% 2 83%2 2% 2 67%3 20% 1 45%4 44% 2 74%5 9% 5 92%
DECISION TREE 2
1 19% 3 100%2 9% 3 100%3 37% 1 53%4 46% 2 70%5 4% 2 40%6 7% 2 90%7 9% 5 100%8 39% 5 91%9 31% 5 100%
Co-published by Atlantis Press and Taylor & FrancisCopyright: the authors
62

C.-F. Chien, A. Diaz, and Y.-B. Lan
Analyzing the usage of slurry by platens and heads, we have the following:
While the lowest usage of slurry occurs when head 4 is working on platen 2, the highest usage occurs when head 4 is working on platen 1 and when head 2 is working on the same platen. Since our approach is focus on increasing overall usage effectiveness, this information should be highlighted and noticed, because problems at these factors may be increasing the usage of slurry at this stage, therefore decreasing usage effectiveness.
At process Stage 3, we identified that the highest slurry usage variation, for this recipe and part, occurs at this stage. The majors’ factors affecting these variations are flow rates dispensed on platen 1 and on platen 2. Flow rate dispensed on platen 1 varies from 310 to 350 and flow rate on platen 2 from 462 to 488. The lowest slurry usage at this stage occurs on February 16th and the highest occurs during February 13th. Flow rates are regulated and controlled manually by domain engineers. Therefore, information about flow rates intervals that lead to the lowest slurry usage on both platens may be used as a reference for domain engineers to improve the control of these parameters. Moreover, decreasing the quantity of slurry used at CMP process would increase the overall usage effectiveness of this material.
At process Stage 5, we identified that the factors affecting the performance of slurry on platen one are flow rates and heads pressure. On platen one, slurry flow rate greater than 352 and heads pressures greater than 10.3 may lead to the group with the highest usage of slurry. On the other hand, factors influencing usage performance on platen 2 are: heads pressures, heads rotational speeds and flow rates. Heads pressures between 10.14 and 10.26 may be the cause of the highest slurry usage at this stage. In addition, heads pressures between 10.26 and 10.28 combined with heads rotational speeds between 61.7 and 62.4 may be the cause of the lowest slurry usage at this stage.
The lowest usage of slurry occurs at head 4 working on platen 1. However, the higher usage occurs when head 1 is working on platen 1, and when head 2 is working on platen 2. Such information should be highlighted and noticed, because problems at these factors may be increasing the usage of slurry at this stage and therefore decreasing the usage effectiveness.
4.2. Case 2
4.2.1. Problem definition
We use another data set to validate our approach. However, for this case only the part ID was changed (recipe, tool and time period are the same as the case number 1). Since we are analyzing the same process and indirect material (slurry), the problem will be the same aforementioned.
4.2.2. Data preparation
The target variable and attributes will be the same as the previous case, however the part ID under study this time correspond to TMQ735 and the process stage included in it, is process Stage 2. For material usage calculation, the same integration procedure was performed.
First, we eliminated missing values, outliers and columns without representativeness. After doing those procedures, data set includes 440 instances. The second step was performed the clustering analysis to identify the cutting points. Finally, we performed the data integration step, since the process under analysis is the same for both cases, data sources are the same. Therefore we integrated FDC and MES data for analysis. After data selection and preparation steps, results of clustering procedures are shown as Table 10.
Table 10. Cluster means for Stage 2 – Case 2
Cluster item Cluster 1
Cluster 2
Cluster 3
Cluster 4
Time 2/10/08 1:40
2/13/08 1:55
2/16/08 0:43
2/24/08 10:19
Mean 807.87 824.47 787.25 843.05No instances 98 140 38 164
4.2.3 Decision tree construction
To grow the tree we used Test Strategy due to the number of instances are greater than 300. Therefore, we divide the data into analysis and test data.
As mentioned before, quality description of the analysis is based on the percent analysis fit, and depends on the strategy selected. The % analysis fit is 68% this could be considered a “good” fit due to the nature of the target variable is unpredictable in our analysis. Therefore, trying to reach high overall fit is not possible.
Moreover, the reliability description is based both on the % test fit and the % analysis fit. This description
Co-published by Atlantis Press and Taylor & FrancisCopyright: the authors
63

Data mining for OUE
also depends on the strategy chosen. Since we are using Test strategy and the % test fit is between 40 and 95 and the % analysis fit is between 40 and 100, the reliability is rated as reliable.
Therefore, constructing the tree for this specific part ID we identified that the two most significant factors affecting slurry usage are: flow rate dispensed on platen 1, and flow rate dispensed on platen 2.
Flow rate dispensed on platen 2 was used to create the first split, due to this factor provide the highest impact on the target variable. The decision rules can be extracted as Table 11 and the rule performance be measured as Table 12.
Rule numbers 2 and 6 provide information about flow rates intervals that may lead to the highest slurry usage group. Although the significance level of rule number 1 is low, this rule could be used as a reference to extracted information about flow rates intervals that lead to the lowest slurry usage group.
Table 11. Decision tree rules for Stage 2 - Case2
Rule IF THEN
No. Flow rate 2 Flow rate 1 Usage Time
1 < 488 < 308 787 February 16th
2 < 488 318 - 336 824 February 13th
3 < 488 336 - 344 824 February 13th
4 < 488 > 344 843 February 24th
5 488- 508 843 February 24th
6 > 508 843 February 24th
Table 12. Extracted rule evaluation from Stage 2 - Case 2
Rule number Significance lift Accuracy
1 4.8% 7.9 71.4%
2 25.0% 1.4 43.8%
3 18.5% 1.2 37.0%
4 13.0% 1.6 60.5%
5 29.1% 1.4 50.6%
6 10% 2.6 96.4%
4.2.4 Evaluation and Interpretation
Although we change the part ID at the manufacturing process, the results seems to be the same, the usage of slurry mainly depends on slurry flow rates. In addition, we found that the lowest usage of slurry occur on February 16th. And the highest usage is during the end of the month.
4.3. Summary
As we investigated the previous cases, flow rates dispensed on platens are not stable over the time.Indeed, these variations are the most significant ones affecting slurry usage performance directly. Moreover, significant factors influencing slurry usage performance at this tool are identified such as heads pressures over both platens, heads rotational speeds over platen two, and rotational speed of platen two.
Slurry flow rates are critical for the chemical mechanical polishing process. Thus, it is important to select a proper flow rate of the slurry and monitoring the flow rate for control during the chemical mechanical polishing process. In semiconductor industry, flow rates are generally controlled and adjusted manually by domain engineers. Results obtained after analyzing both cases can provide helpful information for the engineers to improve slurry flow rate control using tool's conditions and time intervals features that lead to the less usage of slurry.
Since this approach focused on increase the overall usage effectiveness, we compared the usage of slurry by platens and heads at CMP tool to detect heads and platens that may cause higher material usage. This information should be highlighted and noticed, sinceexcursions in these parameters could lead to increased usage of slurry and thus reduce material usage effectiveness.
On the other hand, we found that the period of time in which this tool is using less quantity of slurry is during February 16th. During the month of February, twenty P.M (Preventive Maintenance) were scheduled, however just one of them corresponded to Monthly P.M. This Monthly P.M was performed on February 16th. Therefore, we suggest as another option to reduce cost at CPM process, decrease the number of P.M, due to as we detect only Monthly P.M has a real impact on slurry usage performance.
Finally, after integrating FDC and MES system, we identified factors and specific time periods that lead to abnormal slurry usage. In addition, we also suggested decreasing the number of P.M in order to reduce tool downtime to enhance overall usage effectiveness at CMP process.
Co-published by Atlantis Press and Taylor & FrancisCopyright: the authors
64

C.-F. Chien, A. Diaz, and Y.-B. Lan
5. Conclusions
This study proposed a data mining approach to enhance overall usage effectiveness via improving the tracing mechanism for indirect material usage and reducing tool downtime. The proposed approach integrated FDC and MES system to identify the factors and time periods with low material usage to improve its usage effectiveness. The empirical study has validated thepractical viability of the proposed approach to reduce indirect material usage, improve manufacturing process, and reduce scrap.
Since clustering technique is used to discretize continuous values from a time series, future research can be done to determine suitable number of intervals for each specific process stage to increase the effectiveness for usage tracing. Furthermore, more studies can be done for other indirect material such as photoresist, gas or chemical materials. In addition to overall usage, further studies can be done to analyze the relationships between indirect material usage and the yield rate, respectively.
Acknowledgements
This research is supported by National Science Council, Taiwan (NSC103-2622-E-007-002; NSC100-2628-E-007-017-MY3), Hsinchu Science Park (102A26), the Toward World Class University Project from Ministry of Education (102N2075E1; 103N2075E1), and Taiwan Semiconductor Manufacturing Company (96A0279J8).
References
1. M. J. Berry, and G. S. Linoff, Data mining techniques: for marketing, sales, and customer relationship management (John Wiley & Sons, 2011.
2. G. E. Box, G. M. Jenkins and G. C. Reinsel, Time series analysis: forecasting and control (John Wiley & Sons, 2013).
3. D. Braha and A. Shmilovici, On the use of Decision Tree Induction for Discovery of Interactions in a Photolithographic Process, IEEE Trans. Semicond. Manuf. 16(4) (2003) 644–652.
4. C.-F. Chien, H.-K. Chen, J.-Z. Wu and C.-H. Hu, Constructing the OGE for promoting tool group productivity in semiconductor manufacturing, Int. J. Prod. Res. 45(3) (2007) 509–524.
5. C.-F. Chien and L. Chen, Using rough set theory to recruit and retain high-potential talents for semiconductor manufacturing, IEEE Trans. Semicond. Manuf. 20(4) (2007) 528–541.
6. C.-F. Chien and L. Chen, Data mining to improve personnel selection and enhance human capital: A case study in high-technology industry, Expert Syst. Appl. 34(1) (2008) 280–290.
7. C.-F. Chien, Y.-J. Chen, and J.-T. Peng, Manufacturing Intelligence for Semiconductor Demand Forecast Based on Technology Diffusion and Product Life Cycle, Int. J. Prod. Econ. 128(2)(2010) 496-509.
8. C.-F. Chien, Y.-J. Chen, and C.-Y. Hsu, and H.-K. Wang, Overlay Error Compensation Using Advanced Process Control with Dynamically Adjusted Proportional-Integral R2R Controller, IEEE Trans. Auto. Sci. Engi. 11(2)(2013) 473-484.
9. C.-F. Chien, and C.-Y. Hsu, Data Mining for Optimizing IC Feature Designs to Enhance Overall Wafer Effectiveness, IEEE Trans. Semicond. Manuf. 27(1)(2014) 71-82.
10. C.-F. Chien, C. Hsu and P. Chen, Semiconductor Fault Detection and Classification for Yield Enhancement and Manufacturing Intelligence, Flex. Serv. Manuf. J. 25(3) (2013) 367–388.
11. C.-F. Chien, C.-Y. Hsu and K. Chang, Overall WaferEffectiveness (OWE): A novel industry standard forsemiconductor ecosystem as a whole, Comput. Ind. Eng. 65(1) (2013) 117–127.
12. C.-F. Chien, S. Hsu and Y. Chen, A system for online detection and classification of WBM defect patterns for manufacturing intelligence, Int. J. Prod. Res. 51(8) (2013) 2324–2338.
13. C.-F. Chien, W.-C. Wang and J. Cheng, Data mining for yield enhancement in semiconductor manufacturing and an empirical study, Expert Syst. Appl. 33(1) (2007) 192–198.
14. J. Han, M. Kamber and J. Pei, Data mining: concepts and techniques (Morgan kaufmann, 2006).
15. S.-C. Hsu and C.-F. Chien, Hybrid data mining approach for pattern extraction from WBM to improve yield in semiconductor manufacturing, Int. J. Prod. Econ. 107(1) (2007) 88–103.
16. G. V. Kass, an exploratory technique for investigating large quantities of categorical data, Applied Statistics. 119–127(1980).
17. A. London and D. Segev, Implementing a world-class OEE management system, Solid State Technol. 46(6) (2003) 97–98.
18. J. MacQueen, Some methods for classification and analysis of multivariate observations, in Proceedings of the fifth Berkeley symposium on mathematical statistics and probability. 1 (1967)281–297.
19. Q. P. He and J. Wang, Large-scale semiconductor process fault detection using a fast pattern recognition-based method, IEEE Transactions on Semiconductor Manufacturing. 23(2) (2010)194–200.
20. SEMI E79-0200, Standard for definition and measurement of equipment productivity. Semiconductor Equipment and Material International (Mountain View, CA, 2000).
21. G. Spitzlsperger, C. Schmidt, G. Ernst, H. Strasser and M. Speil,Fault detection for a via etch process using adaptive multivariate methods, IEEE Trans. Semicond. Manuf. 18(4) (2005) 528–533.
22. P. F. Velleman and D. C. Hoaglin, Applications, basics, and computing of exploratory data analysis, 142. (Boston: Duxbury Press, 1981).
23. Y. Yang, Discretization for Naive-Bayes Learning (Monash University, 2003).
24. Y. Zhou, J. Hahn and M. S. Mannan, Fault detection and classification in chemical processes based on neural networks with feature extraction, ISA Transactions.42(4) (2003) 651–664.
Co-published by Atlantis Press and Taylor & FrancisCopyright: the authors
65