a critical assessment of inventory management principles ...824814/fulltext01.pdf · a critical...
TRANSCRIPT
A critical assessment of
inventory management
principles and purchasing
routines
Managing packaging material in a process industry
En kritisk granskning av lagerhantering och
inköpsrutiner
Hantering av förpackningsmaterial inom en processindustri
Christer Nederman
Oscar Slogén
Faculty: Health, Science & Technology
Subject: Industrials Engineering and Management
Points: 30 ECTS
Supervisors: Dan Nordin and Leo de Vin
Examiner: Mikael Johnson
Date: 2015-06-22
Serial Number: 1

Prologue
This master thesis was conducted at Karlstad’s University as an examining part
of the master program in Industrial Engineering and Management. The master
thesis was performed at the spring semester 2015 in cooperation with Barilla
Sweden AB located in Filipstad.
Barilla Sweden has supported this master thesis by interviews, observations
and other resources. This effort from Barilla Sweden is extremely appreciated,
without their contributions this thesis never would be completed. We would
like to give an extra thanks to Alex Thiery. He spent many hours tutoring us
and learnt us about Barilla’s working strategy.
Dan Nordin and Leo De Vin have been our supervisors during this thesis, and
we own them a great thanks for their tips and ideas.
Finally we would like to thanks our families, especially our adorable girlfriends
for their great support and patience along the essay.
Christer Nederman Oscar Slogén
2015-06-09 2015-06-09
Abstract
Inventory management is today seen as more competitive oriented, process
oriented and better integrated into the companies than before. But still do
several companies run their inventories according a traditional approach.
There is therefore a need for some companies to evaluate their inventory
management and adapt the new view. There is also a need to adjust for
increased focus on sustainability, previous research calls for strategies and
tools that include sustainable parameters without lowering the profitability.
The purpose with this study is to assess inventory management principles and
purchasing routines related to the acquisition of packaging material in a
process industry. The study aims to develop a framework for decision makers
in inventory management. This framework will be the basis for a support tool
incorporating a relatively simple and easy-to-use user interface.
This master thesis is performed as a case study research and uses several data
collection methods, such as a literature review, observations, and interviews.
The findings from the data collection is used to evaluate which impact
inventory management has on a company’s profitability, and which basic
parameters that could be included in the support tool.
The empirical findings show that Barilla Sweden’s current inventory
management match the traditional approach, but also that they strive to
become more competitive and process oriented in their management of
inventories. There is however some constraints in their working strategy that
prevents them from taking the next step. Comparison between Barilla
Sweden’s current order size and an economical order quantity (EOQ) and just-
in-time (JIT) approach is made. The comparison shows that Barilla Sweden
has money to save and warehouse space to release with changed order
quantities.
Adapting a new inventory management approach require review of
uncertainties, such as delivery accuracy and forecast changes. It is also
necessary to evaluate supplier relations and internal working strategies. The
effect of these parameters on inventory management can be noticed in the
support tool. The tool compares total costs, average stock, tied capital, and
environmental and social consequences between the EOQ model and JIT.
The support tool visualizes drawbacks and benefits with different order sizes
and has an easy-to-use interface.
Sammanfattning
Lagerstyrning har blivit mer konkurrensinriktat, processorienterat och bättre
integrerat med övriga företagsfunktioner. Att gå mot detta mer moderna
synsätt är inte vedertaget utan flera företag baserar sin lagerstyrning enligt ett
traditionellt synsätt. Vissa företag har därför ett behov att utvärdera sin
lagerstyrning och applicera det nya synsättet. Det finns också ett behov att
anpassa sig till det ökade fokuset på hållbart företagande och tidigare forskning
efterfrågar strategier och metoder som inkluderar sociala och miljömässiga
parametrar utan att sänka lönsamheten.
Syftet med denna studie är att bedöma lagerstyrningsprinciper och
inköpsrutiner som uppstår vid införskaffningen av förpackningsmaterial inom
processindustrin. Studien syftar till att utveckla ett ramverk för beslutsfattning
inom lagerstyrning. Ramverket kommer ligga till grund för ett enkelt och
användarvänligt hjälpverktyg.
Studien genomfördes i form av en fallstudie och använder flera olika
datainsamlingsmetoder, t.ex. litteraturstudie, observationer och intervjuer.
Resultaten från datainsamlingen användes för att utvärdera vilken påverkan
lagerstyrning har på ett företags lönsamhet, samt vilka grundläggande
parametrar som skulle inkluderas i hjälpverktyget.
Den empiriska studien visar att Barilla Sveriges nuvarande lagerstyrning
påminner om ett traditionellt lagersynsätt. Studien visar även att Barilla strävar
efter mer konkurrenskraftig och processorienterad lagerstyrning. Det som
hindrar Barilla Sverige från att gå mot detta är deras nuvarande
arbetsstrategier. Barilla Sverige nuvarande inköpsstrategi jämförs med en
ekonomisk orderkvantitet (EOQ) och en tillämpning av just-in-time (JIT).
Jämförelsen visar att Barilla Sverige kan spara pengar och frigöra lageryta
genom att ändra sina orderkvantiteter.
För att möjliggöra en förändring lagerstyrningen till ett mer modernt synsätt så
krävs det att se över sina osäkerheter kopplade till lagerstyrningen, t.ex.
leveransnoggrannhet och prognosändringar. Det kan även vara nödvändigt att
utvärdera relationer till sina leverantörer och sina interna arbetsstrategier.
Dessa parametrars inverkan på lagerstyrningen går att spåra i hjälpverktyget
Verktyget jämför totala kostnader, medellager, bundet kapital och miljömässiga
och sociala konsekvenser mellan EOQ och JIT. Det presenterar för- och
nackdelar med olika orderstorlekar och har ett användarvänligt gränssnitt.
Table of contents
1. Introduction ................................................................................................... 9
1.1. Background ............................................................................................... 9
1.2. Problem discussion ................................................................................. 11
1.3. Problem conclusion ................................................................................. 12
1.4. Purpose .................................................................................................... 13
1.5. Research questions .................................................................................. 13
1.6. Delimitations ........................................................................................... 14
2. Method .......................................................................................................... 15
2.1. Research design ...................................................................................... 15
2.2. Research strategy .................................................................................... 15
2.3. Literature study ....................................................................................... 16
2.4. Empirical study ....................................................................................... 17
2.4.1. Primary data ..................................................................................... 18
2.4.2. Secondary data ................................................................................. 20
2.5. Reliability and validity ............................................................................ 21
3. Theoretical framework................................................................................ 24
3.1. Manager of external resources ................................................................ 24
3.2. Inventory management ........................................................................... 24
3.2.1. Costs ................................................................................................ 25
3.2.2. Performance measures ..................................................................... 28
3.3. Material requirement planning ................................................................ 28
3.3.1. Control parameters .......................................................................... 29
3.3.2. Safety mechanisms .......................................................................... 35
4. Case company .............................................................................................. 40
4.1. Barilla Group .......................................................................................... 40
4.2. Barilla Sweden, Filipstad ........................................................................ 41
4.2.1. Central planning .............................................................................. 41
4.2.2. Production planning ......................................................................... 42
4.2.3. Production ........................................................................................ 43
4.2.4. Packaging process ........................................................................... 44
5. Inventory management at Barilla .............................................................. 47
5.1. Packaging material .................................................................................. 47
5.1.1. Ordering of packaging material ....................................................... 47
5.1.2. Transportation .................................................................................. 47
5.1.3. Uncertainty in BOM ........................................................................ 47
5.1.4. Quality problems ............................................................................. 47
5.1.5. The marketing strategy’s impact ..................................................... 48
5.2. Warehouse workers ................................................................................ 49
5.2.1. Work tasks ....................................................................................... 49
5.2.2. The current ordering strategy’s impact ........................................... 49
5.2.3. Warehouse structure ........................................................................ 49
5.3. Suppliers ................................................................................................. 50
5.3.1. Supplier relation and deliveries ....................................................... 50
5.3.1. Pricing ............................................................................................. 50
5.3.2. Survey ............................................................................................. 50
6. Empirical results ......................................................................................... 52
6.1. Control parameters ................................................................................. 52
6.1.1. Item selection .................................................................................. 52
6.1.2. Comparison parameters ................................................................... 52
6.2. Order size results .................................................................................... 53
6.3. Economical comparison ......................................................................... 56
6.3.1. Total cost comparison ..................................................................... 56
6.3.2. Tied capital in average stock ........................................................... 58
6.4. The design of the support tool for decision makers ............................... 58
7. Analysis ........................................................................................................ 62
7.1. Barilla’s current working strategy .......................................................... 62
7.2. Economical comparison ......................................................................... 67
7.3. Characteristics of the support tool .......................................................... 70
7.4. Source of error ........................................................................................ 72
7.4.1. Correct data ..................................................................................... 72
7.4.2. Survey ............................................................................................. 72
7.4.3. Lot-sizing techniques ...................................................................... 73
8. Conclusion and further studies .................................................................. 74
References ............................................................................................................ 76
Appendices ........................................................................................................... 81
Appendix A – Employees involved packaging material management ............. 81
Appendix B – Interviews .................................................................................. 82
Appendix C – Survey ........................................................................................ 93
Appendix D – Derivation of SERV2 .............................................................. 101
Appendix E – Safety factor K ......................................................................... 103

Appendix F –Control Parameters .................................................................... 104
Appendix G –Economical comparison ............................................................ 106
Appendix H –Tool guide ................................................................................. 109
9
1. Introduction
The introduction aims to help the reader to fully understand the concept of this master thesis.
The chapter starts with a background that presents a general background of the research area
and then follows with problem discussion and problem conclusion, to finally end with the
purpose and research questions.
1.1. Background
In a strong competitive marketing situation the importance of reducing the
total cost is of great importance for company success (Roy et al. 2012 ; Samak-
Kulkarni & Rajhans 2013). The purchasing department has a central role in
this cost reduction since purchases usually are 50% of a company’s total costs.
The cost reduction should not only be found on price reduction. The
purchasing department should also aim to reduce tied capital in stock and
supplier relation costs. If an efficient material flow and low levels of tied
capital can be achieved, without lowering the efficiency of manufacturing
operations, opportunities for alternative investments will be opened. If the
purchase function also can reduce operation costs the impact on the
profitability will be doubled (Axelsson & Håkansson 1984).
To become competitive, companies adopt purchasing and supply management
(PSM). PSM is seen as a competitive tool in business practices (Schoenherr et
al. 2012). As the first link in a value chain, PSM affects many of the following
steps, such as inventory management, production planning and product quality
(Raut et al. 2010). Inventory management is seen as one of the most important
operational activities for industrial companies (Glock et al. 2014). The
management of inventories, in terms of inventory structure and inventory
levels, may influence the service levels in terms of delivery speed and product
availability. Running inventories effectively will not only generate a positive
influence on the service levels, it might also lead to significant cost reductions
(Glock et al. 2014 ; Iwu et al. 2014), since holding inventory entails costs
(Leseure 2010).
Inventories do not add any value on the product itself (Sânchez & Pérez
2001). Inventory can be explained as “stock of various items which is kept on
site or in a facility in anticipation of a future use” (Leseure 2010, p. 199). It can
be described as a mechanism to decouple important parts in the production
process, e.g. decouple supplier deliveries from production (Olhager 2013).
10
Decoupling is according to Olhager (2013) the essential function with each
inventory. Incentives to hold inventory can be found in:
- Treat unreliability of supply
- Lowering order costs
- Smooth production requirements
- Dealing with fluctuations in demand (Müller 2011).
Inventories are categorized based on where in the production flow they
appear. The categories are inventory for raw materials, work in progress
(WIP), and finished products (Olhager 2013).
By participate early in the product development process the purchasing
department can contribute to the increased use of standardized materials and
components. Some of the most important tasks for the purchasing department
concerns usage of standardized components, supplier selection, conclude
contracts, and acquisition of material and components (Oskarsson et al. 2006).
The supplier selection process has until the 20st century mainly focused on
cost aspects (Raut et al. 2010). The focus on product quality and long-term
relations has been low, resulting in short term contracts (Lindgreen et al.
2013). The view has changed and recent studies focus on how successful
business can be achieved by including other important aspects in the supplier
selection. Examples are Raut et al. (2010) and Sen et al. (2008) who propose
service, price on-time delivery, quantity, quality, technology and
responsiveness as essential aspects. Kermani et al. (2012) who argues for the
inclusion of delivery assurance, company policies and production facilities.
Dealing with many aspects can be very time consuming and result in an
ineffective supplier selection process (Labib 2011). Labib (2011) claims that it
is necessary to balance the different aspects mentioned above.
The material procurers have a central part in a company’s achievement of an
effective acquisition process (Oskarsson et al. 2006). The acquisition of
material is usually founded in two essential questions (Arnold 1991 ; Iwu et al.
2014 ; Silver 1981):
- How large should the order be?
- When should the order be placed?
11
To be able to answer these questions several material planning methods
managing lot sizing, safety mechanisms, and order points have been developed
(Olhager 2013).
1.2. Problem discussion
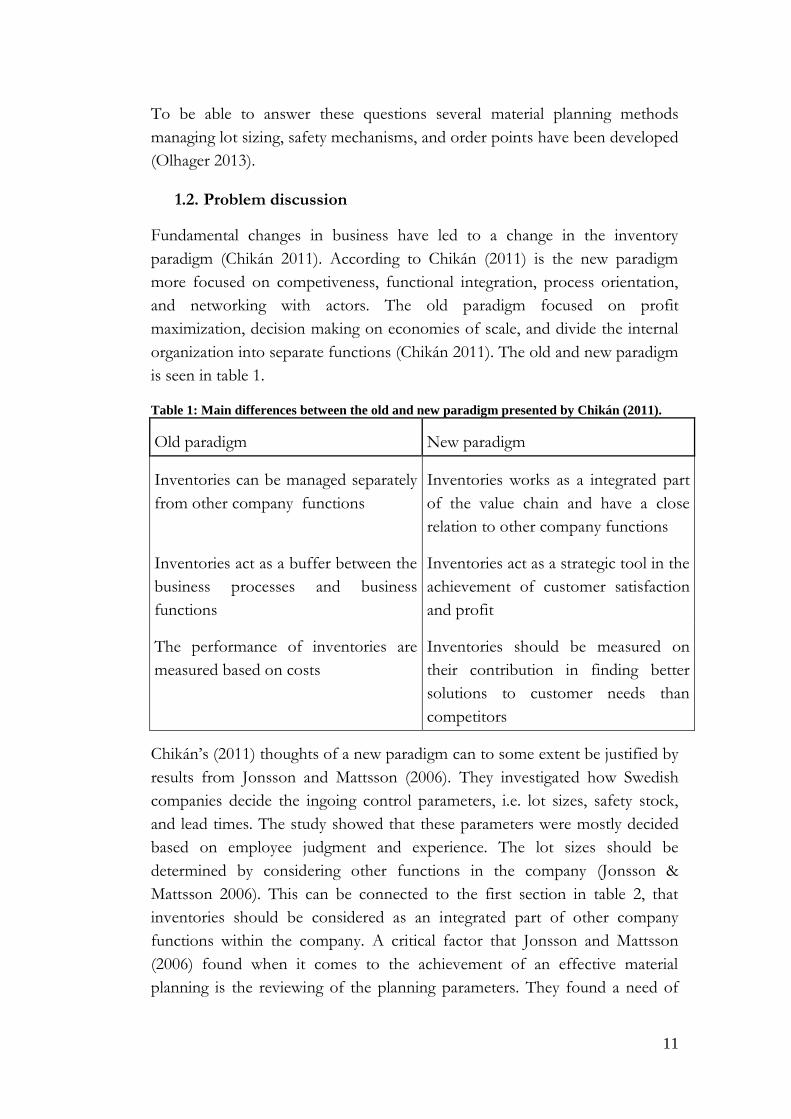
Fundamental changes in business have led to a change in the inventory
paradigm (Chikán 2011). According to Chikán (2011) is the new paradigm
more focused on competiveness, functional integration, process orientation,
and networking with actors. The old paradigm focused on profit
maximization, decision making on economies of scale, and divide the internal
organization into separate functions (Chikán 2011). The old and new paradigm
is seen in table 1.
Table 1: Main differences between the old and new paradigm presented by Chikán (2011).
Old paradigm New paradigm
Inventories can be managed separately
from other company functions
Inventories works as a integrated part
of the value chain and have a close
relation to other company functions
Inventories act as a buffer between the
business processes and business
functions
Inventories act as a strategic tool in the
achievement of customer satisfaction
and profit
The performance of inventories are
measured based on costs
Inventories should be measured on
their contribution in finding better
solutions to customer needs than
competitors
Chikán’s (2011) thoughts of a new paradigm can to some extent be justified by
results from Jonsson and Mattsson (2006). They investigated how Swedish
companies decide the ingoing control parameters, i.e. lot sizes, safety stock,
and lead times. The study showed that these parameters were mostly decided
based on employee judgment and experience. The lot sizes should be
determined by considering other functions in the company (Jonsson &
Mattsson 2006). This can be connected to the first section in table 2, that
inventories should be considered as an integrated part of other company
functions within the company. A critical factor that Jonsson and Mattsson
(2006) found when it comes to the achievement of an effective material
planning is the reviewing of the planning parameters. They found a need of
12
user-friendly and easy software that easily allow automatic revision of planning
parameters. They also find a need of improved knowledge of planning and
control methods, leading to better use and performance of planning methods
(Jonsson & Mattsson 2006).
Further indications for a paradigm shift concerns the increased JIT interest
and increased consideration of social and environmental impacts of inventory
management. JIT organizations’ should strive toward zero inventories. This
has become an established way for companies to lower their costs during the
21th century (Isaksson & Seifert 2014). The point of departure with zero
inventories is that inventory reflects waste and therefore should be eliminated
(Obermaier & Donhaiser 2012). One possible way to reduce or eliminate
inventory is to adapt JIT purchasing (Fazel et al. 1998). It focuses on gathering
the purchases into a few amount of vendors and focus on well-functioning
relationships (Müller 2011 ; White et al. 2010). JIT purchasing concerns issues
related to delivery reliability, reduced costs, product quality, and volume
flexibility. JIT purchasing recommends organizations to expand their supplier
relations to improve their businesses (White et al. 2010). Establishing good
supplier relations and reduce costs is two of the most central objectives for a
purchasing department (Axelsson & Håkansson 1984).
Working towards reduced inventories can also be found in a market change,
where the market has gone to a more dynamic, competitive and global one
(Bonney & Jaber 2011). Products must be released faster on the market to
satisfy the increasing customer demand and fast consumption. This require
short throughput time in the supply chain, which create more waste creation
affecting the environment in terms of increased CO2 emission, landfill, etc.
(ibid). The market change has also made corporate stakeholders requesting
companies to take responsibility of their impact on environmental and social
parameters. This has resulted in a need for companies to develop tools and
strategies that focus to minimize the environmental impact without reducing
the profitability (Bouchery et al. 2012 ; Jawad et al. 2013).
1.3. Problem conclusion
Following the introduction and the problem discussion can it be noticed that
inventory managers have many aspects to take in consideration regarding the
choice of inventory strategy. The problem discussion also highlights the
importance of an effective purchasing strategy focusing on aspects besides the
economical, i.e. aspects related to quality, flexibility, and an effective material
13
flow. Instead of focusing on a well-developed purchasing strategy several
companies rely on their employments experience and judgment. Therefore,
can the inventory management be improved through the establishment of a
more controlled inventory strategy? Also, recent studies within inventory
management have focused on how environmental and social aspects can be
included without lowering the profitability. In these studies there is a balancing
between these new aspects and the, obvious, economical aspect. A case
company with a working strategy that falls into Chikán’s description of the old
paradigm has therefore been chosen.
Previous research also stress after tools companies can use to minimize the
environmental impact without reducing profitability (Bouchery et al. 2012 ;
Jawad et al. 2013), but also easy and user-friendly software that allow
automatic revision of order parameters related to the acquisition of material
(Jonsson and Mattsson 2006). Combining these two demands leads to a need
of an easy and user-friendly tool that balances sustainability and economic
consequences, and that have the potential for automatically updates of the
order parameters.
1.4. Purpose
The purpose with this study is to assess inventory management principles and
purchasing routines related to the acquisition of packaging material in a
process industry. The study aims to develop a framework for decision makers
in inventory management. This framework will be the basis for a decision
support tool incorporating a relatively simple and easy-to-use user interface.
Empirical data for the development of the tool will be gathered in cooperation
with Barilla Sweden AB through a case study.
1.5. Research questions
RQ1 - How can a medium sized enterprise be more profitable by changing
their inventory management?
To be able to answer this question, following issues shall be considered:
- Describe the case company’s existing working strategy
- Based on previous research, find and apply suitable inventory
management principles and critical assess the principles based
on the case company circumstances.
14
- Include the impact that social and environmental aspects have
in the critical assessment of the inventory management.
RQ2 - Considering RQ1, can a general support tool be constructed to support
decision making in inventory management - and if so, how would that be
constructed?
1.6. Delimitations
This study will only treat a few items of packaging material, which can be
generalized and applied to the remaining products. Barilla Sweden has several
packaging material groups and the groups included in this study are inner
wrap, product banners, and cartons. The new suggested order quantities will
not be implemented or discussed with the suppliers. Rent and other costs
related to the facilities are excluded in this study.
The work will not further develop the Barilla Sweden’s existing distribution
system and the study assumes unchanged lead times. Only the two lot sizing
techniques will be investigated, due to the time limit at 20 weeks. The lack of
time has also restricted the number of companies that the case study has been
performed at, so only one company has participated in this study.
This master thesis will only develop a prototype of a support tool for decision
makers. Implementations and test runs of the tool within the case company
will not be conducted in this study.

15
2. Method
The method chapter describes the underlying methods and concepts used for this master thesis.
The chapter presents the research strategy and design, literature study, and data collection
methods. This will give the reader better understanding of how the study has been conducted.
2.1. Research design
This study is conducted at Barilla Sweden (further referred to as Barilla) in
Filipstad as a case study, and the main goal with this research is to perform a
critical assessment of inventory management principles and purchasing
routines. When a phenomenon is studied in its natural context case studies are
used as research design (Hancock & Algozzine 2011). In case studies many
different information sources are used, such as interviews, questioners and
observations. The results can be quantitative, qualitative or mixed, and they are
often characterized by being very detailed and use depth analysis (Hancock &
Algozzine 2011 ; Eisenhardt 1989).
2.2. Research strategy
There are three essential research methods and these are quantitative method,
qualitative method and mixed method (Bryman & Bell 2011). The mixed
method is characterized by its combination of quantitative and qualitative
methods of data collection and analysis (Saunders et al. 2009). Therefore, the
mixed method is like an unlimited array of combinations of selection-, data
collection- and analysis techniques. Research using mixed approach is
becoming increasingly common, and the method is often used to expand the
scope and deepen the insights from the study (Sandelowski 2000).
Research using the mixed method can be designed in various ways, e.g. it can
use an exploratory, explanatory or embedded design. Which type that is used
depends on what impact the qualitative perspective and quantitative
perspective has on the study (Borrego et al. 2009. This study uses an
embedded design. The embedded design is characterized by implementation
of a secondary part (quantitative/qualitative) as a complement to the primary
part (quantitative/qualitative) (Borrego et al. 2009). The secondary part in this
study is quantitative, and it is used to compare different lot sizing techniques.
The information from secondary part is used to support the qualitative part of
the study. By putting these two parts together a general view of the problem is
created that later can answer the purpose of the study.
16
2.3. Literature study
The essential aim behind the implementation of a literature study is to
investigate what is already known in the research area. A literature study give
the researcher the opportunity to develop and argument about the significance
of his/her study and where it leads by using existing literature (Bryman & Bell
2011).
Performing a literature study is a time consuming process and to save some
time a search strategy can be established (Saunders et al. 2009). A search
strategy can include:
- Search parameters
- Keywords and search terms intended for the search
- Databases and search engines intended for the search (Saunders et al.
2009)
In order to identify relevant data and eliminate irrelevant data Bell (2010)
suggest that the search parameters should be defined, and keywords refined
and focused. In her work Bell (2010) divides the search parameters into
subject area, business sector, language, literature type, geographical area, and
publication period. For this master thesis the following parameters have been
used:
Subject area: Inventory management
Business sector: Manufacturing
Language: English and Swedish
Literature type: Journals and books
Notable is that the parameters related to geographical area and publication
period have been left out. The main reason behind why the publication period
was left out is because a lot of the lot sizing models in inventory management
has been presented all over the 20th century. Thereby could a limitation in
publication period lead to important information being missed out. Parameters
related to a geographical area were leaved out since the authors did not want
to restrict the searchers in this parameter.
17
The keywords used in a literature study are the basic terms that address the
research objectives and research questions (Saunders et al. 2009). In this
master thesis, early database searches used very general terms related to the
research field, e.g. “Inventory management”. The purpose behind this
approach was to find bibliography providing a general view of the field.
During the progression of the study the keywords have been refined and
focused to the actual problem, and lead to a shift from bibliography to
scientific articles. Examples of keywords used during this stage were:
Lot sizing techniques, Economic order quantity, Just in time purchasing, Inventory lot
sizing, Material requirement planning, Safety stock, Safety time, Environmental inventory
management, Sustainable inventory management, Sustainable order quantity.
The databases used in the literature study were Scopus, Google Scholar, and
Business Source Premier.
2.4. Empirical study
Methods used to achieve data depend of which kind of data the researcher
needs. There are two different types of data, primary- and secondary data
(Bryman & Bell 2011). In this study booth primary and secondary data was
collected. In upcoming chapter a more detailed description is explained, see
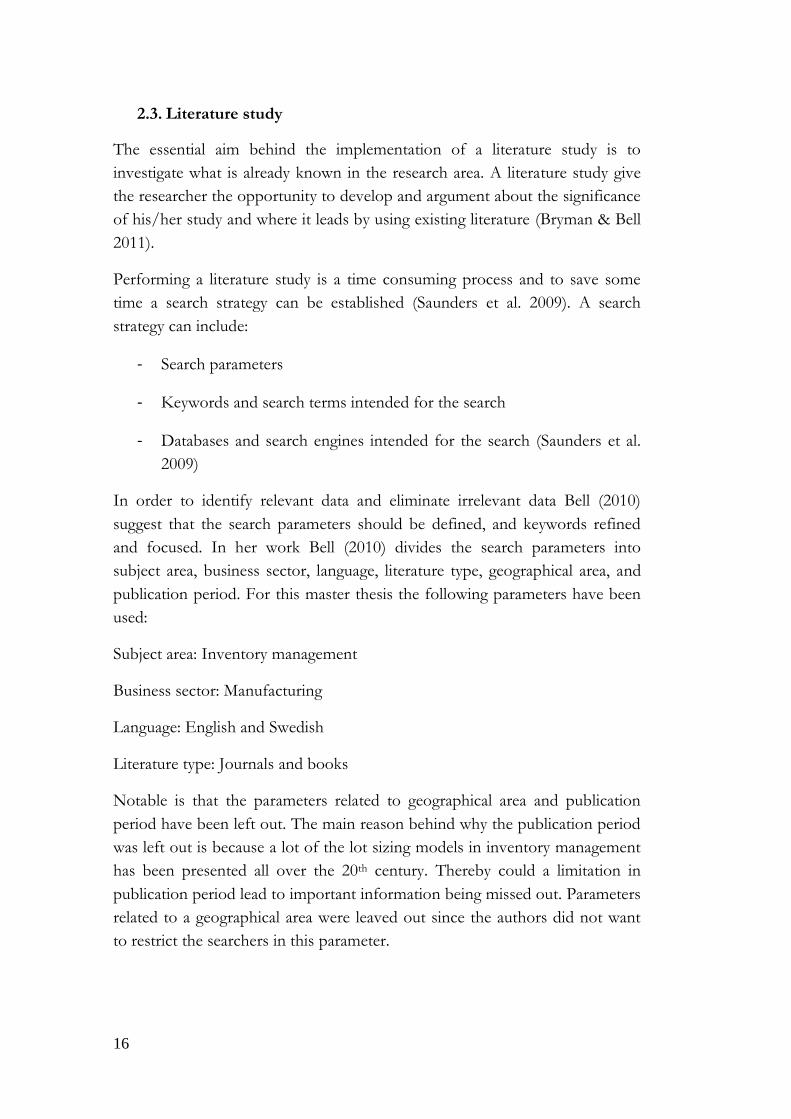
figure 1 for a holistic view of the empirical study.
18
Figure 1: The procedure of the empirical study
2.4.1. Primary data
Primary data is data collected for the first time, or compiled data unavailable
for the researcher, e.g. surveys, interviews and observations (Dahmström
2011). This study mainly used interviews as data collection method. These
interviews have been conducted with employees at Barilla involved in the
management of the packaging material (see appendix A). During the
interviews both authors participated, where one took notes and the other
asked questions. Observations and a survey have also been conducted.
Interviews
Before the interview sessions should the interviewer carefully consider which
persons that should be interviewed, the interview content, interview
environment, also ethical requirements and legal condition (Hancock &
Algozzine 2011).
In this study, both semi-structured and unstructured interviews were used.
The purpose with the interviews was to gather knowledge of how and why
Barilla works as it does. Barilla´s department managers, purchasers and
production workers will be interviewed to create an overall view. The authors
19
did not find it necessary to audio-record interviews because of accessibility of
the interviewee’s.
The interviews were primarily done with singular interview objects. At one
occasion a group interview took place where staff from different departments
was gathered to discuss how the packaging material could be managed in the
future. This group interview was conducted to get a better perspective of how
the different departments work together, but also to get departments to
interact with each other regarding packaging material. Hancock and Algozzine
(2011) argue that there is an increased risk when interviewing a group. There
can be interviewee’s who do not dare or would not like to speak in front the
group. In this way valuable information is deprived. To ensure that everyone’s
opinions were raised in the group interview did the authors follow up the
interview and ask the interviewees’ if they wanted to add something.
Unstructured interviews
The idea with the unstructured interviews was that the material procurers and
managers would be able to speak freely about the organization structure. This
method was used most in the beginning of the research to get a good overall
view. The advantage by doing this is that the interview can be controlled based
on the interviewee's knowledge and insight in the area. However, responses
from persons can differ if the questions are asked in different ways (Patton
2002; Hancock & Algozzine 2011). In this study same type of question was
asked to different persons to compare answers.
Semi-structured interviews
An advantage with semi-structured interviews is that the interview can be
relatively flexible and be based on received responses. The interview can
thereby be controlled based on the interviewee's knowledge in the area
(Hancock & Algozzine 2011).
In this study, semi-structured interviews were mainly directed towards
employees at Barilla involved in the management of the packaging material
(appendix A). The semi-structured interviews usually took place after
unstructured interviews. This approach was used since the knowledge about
their working area was limited in the beginning. When basic knowledge was
gathered more specific questions came up and new semi-structured interviews
were conducted to get answers to these. In this way an overall view of how the
20
employees’ perceived their working conditions in relation to social, economic
and environmental aspects was obtained. The prepared interview questions for
the semi-structured interviews can be seen in appendix B.
Observations
To understand certain situations it may be easier to see or experience the
reality yourself. By going out into the real situation, you can get a better overall
perspective, see details and get in touch with people other than those you have
already spoken to (Tyagi et al. 2015). This study started the observation part
with a guided tour and followed with several observations by the authors
themselves.
Survey
A survey was made to get a first insight of how Barillas suppliers would get
affected if Barilla changed their inventory strategy and thereby their
purchasing routines. The survey consisted of six questions targeted to three of
Barillas main suppliers and made by software in Google Docs. The first part in
the survey consisted fact based questions and the second part focused on the
suppliers’ attitude to changed order sizes. Their attitude were measured by a
scale from one to five, where;
1: Very negative attitude
2: Negative attitude
3: Neutral attitude
4: Positive attitude
5: Very positive attitude
The complete survey can be found in appendix C. Based on Saunders et al.
(2009) is the survey classified as an opinioned based survey. These bring
knowledge of what the respondent feel or thinks about the given statements.
2.4.2. Secondary data
Secondary data is data that already exist, such as organizational documents.
Since the data already is collected and compiled by someone else, it is a
cheaper way of gathering data (Dahmström 2011), and usually more resource
21
effective (Saunders et al. 2009). Secondary data gives more time to analyze the
results and to get the right data instead of collecting it (Saunders et al. 2009).
Organizational documents
Organizational documents can be notes from meetings, recorded
conversations within the organization, email, blogs or annual reports. In case
study research analyzing organization documents is a common method
(Hancock & Algozzine 2011). Organizational documents can also be
documents that the author creates using secondary data from the company
(Saunders et al. 2009). Organizational documents used in this study were
production and purchase-related information. This information was gathered
from Barilla’s business system SAP. This system includes information about
Barilla’s forecasts and their products. The organizational documents have been
collected with help of employees at Barilla.
2.5. Reliability and validity
Reliability refers to “the extent to which your data collection techniques or
analysis procedures will yield consistent findings” (Saunders et al. 2009, p.
156). If the reliability is high same results from the study should be obtained if
it is repeated (Bryman & Bell 2011).
Saunders et al. (2009) presents four different threats to the reliability. One of
these is participant error, and this is when the participant acts in a way that
deviates from its natural behavior, e.g. if the participant has bad mood.
Participant bias is another threat to reliability and occurs when a participant
deviates from their genuineness and behave in a way they perceive as correct,
e.g. if an interview subjects answer questions based on how they believe the
“correct” answer is. The third and fourth threat, observer error and observer
bias, relates to the behavior of the observer and how the study is performed.
The way questions are asked in an interview (observer error) or how the
answer is interpreted (observer bias) are examples of these threats.
Validity is describes “whether the findings are really about what they appear to
be about” (Saunders et al. 2009, p. 156). Validity is usually divided into internal
validity and external validity. The internal validity refers to how believable the
findings are, and concerns the ability of a chosen method or approach to
measure what it is intended to (Bryman & Bell 2011 ; Saunders et al. 2009).
The external validity concerns the question of whether the findings from the
22
study can be generalized to situations beyond the specific research context
(Bryman & Bell 2011).
To prevent participant bias in this study did the authors start each interview
with a new participant by letting them describe their work and in that way lead
them into issues related to the thesis. The authors were also careful to point
out that the participant’s view of the issue that were of interest. All interviews
have taken place in the interviewee’s natural environment, i.e. at their
workplace. This approach was used so the participant would feel comfortable
and not pressured to answer in certain ways. To reduce the risk of participant
error was guidance by the supervisor at Barilla considered. He gave
recommendations of days and times that usually were less hectic at Barilla, for
example that Mondays hectic leading to stressed workers.
Being two observers were advantageous to prevent observer error and bias.
The authors did for instance discuss the interview in advance to agree on a
good set-up of the interview. Having the interviews led by one of the authors
while the taking notes opened up the opportunity to be critical of how
questions were told and answers were given. The author taking notes could for
instance fill in with follow-up questions if the answers were unclear, or clarify
the questions to the participant if they were inadequately formulated. The
authors did review the interviews after they took place to see if they
interpreted the answers in the same way.
Achieving a high internal validity was primarily done by participant validation.
If answers were perceived differently from interviews were the participant
contacted again for clarification. It also occurred that questions were told to
more than one employee so the answers could be confirmed.
To be able to gain high external validity diaries were kept so important aspects
of the context could be captured. These notes were used for the thick
descriptions and were later also the foundation to the construction of chapter
“Inventory management at Barilla”.
Reliability and validity related to the quantitative method concerns primarily
the data collection and formulas used for calculations. All data were gathered
from Barilla’s business system SAP with help of the material procurers. The
results from the quantitative method should therefore be obtained if the study
was repeated and same data were used, leading to high reliability. To gain high
external validity, well known and general formulas related to inventory
23
management were used. The formulas are accepted within the research area
and should thereby measure what they are intended to do, i.e. if correct data is
used. Using correct data should imply for high internal validity for the
quantitative result.
24
3. Theoretical framework
This chapter starts with a short presentation of the purchasing department’s impact on the
acquisition of material, and then follows with a presentation of previous research in the area
of inventory management. It is used to build a foundation on which the research questions
and purpose of the master thesis can be answered with.
3.1. Manager of external resources
How the manager of external resources handles purchasing and ordering is
crucial in the company’s ability to reduce costs and items in stock. It has
shown that the purchase cost of a company usually correspond with 50-60%
of sales. Each Swedish crown saved from purchases results in one Swedish
crown in profit, while the corresponding outcomes give significantly less
impact on the profit. This relation applies since increased sales bring material
and processing costs (Axelsson & Håkansson 1984).
A large part of the company's costs is dependent on how to utilize and
connect with suppliers. Essentially, there are three ways to cost rationalize
with respect to suppliers. The first way is seen as a traditional working strategy
and focuses on suppliers’ unit price. The second issue is related to making
suppliers adapt certain adjustments, this include the transferring some of the
company activities to the supplier. The last issue is related to efficient supplier
relations. The value of using one supplier over another is a question of
following:
- Supplier performance
- The supplier’s price
- The cost of maintaining the supplier relation
An important issue for companies to handle is how high the requirements on
the suppliers should be, this can include e.g. delivery assurance. This subject
can affect the supplier relation and thereby the price from the supplier
(Axelsson & Håkansson 1984).
3.2. Inventory management
Harris’ classic economic order quantity (EOQ) model from 1913 is often seen
as the starting point of the comprehensive area of inventory management
(Bushuev et al. 2015 ; Glock et al. 2014). Inventories are materials and supplies
25
in stock for either sale or for the productions process. They act as a buffer
against differences in demand and supply and are a part of the planning
process (Arnold 1991).
Inventories can be kept with various purposes. A common objective for
inventory management programs is providing a desired customer service at the
lowest possible cost (Bushuev et al. 2015). Achieving good profitability is
usually an overall target for the organization. To accomplish this companies
have to achieve the underlying target components, i.e. good delivery
performance, by having high customer service or high delivery reliability; low
operation costs, by having high and steady utilization of resources; and low
capital tied in WIP, by having low throughput time. Finding a satisfying result
require balancing between the target components. If the focus lies on only
component will the profitability decrease and result in a sub optimization
(Olhager 2013).
Customer service
One measure of inventory management performance is customer service.
Inventories can be seen as a tool dealing with uncertainties to achieve high
customer service. Customer refers to both internal and external customers,
such as that next production operation, or purchaser and distributor (Arnold
1991). The performance measure describes the availability of an item when a
customer needs it (Axsäter 1991).
Customer service can be measured in several different ways. The most
commonly used customer service method is order-fill rate. It is defined as the
fraction of the demand that immediately can be met by inventory without
shortages (Larsen & Thorstenson 2014).
3.2.1. Costs
According to Olhager (2013), there are three essential costs for inventory
management:
- carrying costs
- ordering costs
- stock out costs
26
Carrying costs
Carrying costs depends of three parts: capital costs, storage costs and risk
costs (Arnold 1991). The capital cost arises when items are stocked in
inventory, i.e. they correspond to alternative investments or repayment of
company debts. To determine the capital costs companies use their discount
rate or their loan rates. The capital cost usually end up round 20% of the total
stock value (Axsäter 1991). Storage costs refer to the costs related to
manpower, warehouse space, and equipment. Risk costs are related to the risks
with carrying items in inventory, such as obsolescence, damage, deterioration,
and spoilage (Arnold 1991).
The carrying costs can be calculated by using eq. 1.
][[%]][cos SEKinventoryaverageratecarryingSEKtsCarrying (1)
How to calculate the carrying rate is divided into two different approaches and
depends on whether the storage costs are included or not. Oskarsson et al.
(2006) advocate for storage costs being excluded from the carrying rate since:
- Storage costs can lead to acquisition or abolishing of storage facilities
just to find a satisfactory carrying rate, which will result in long term
costs.
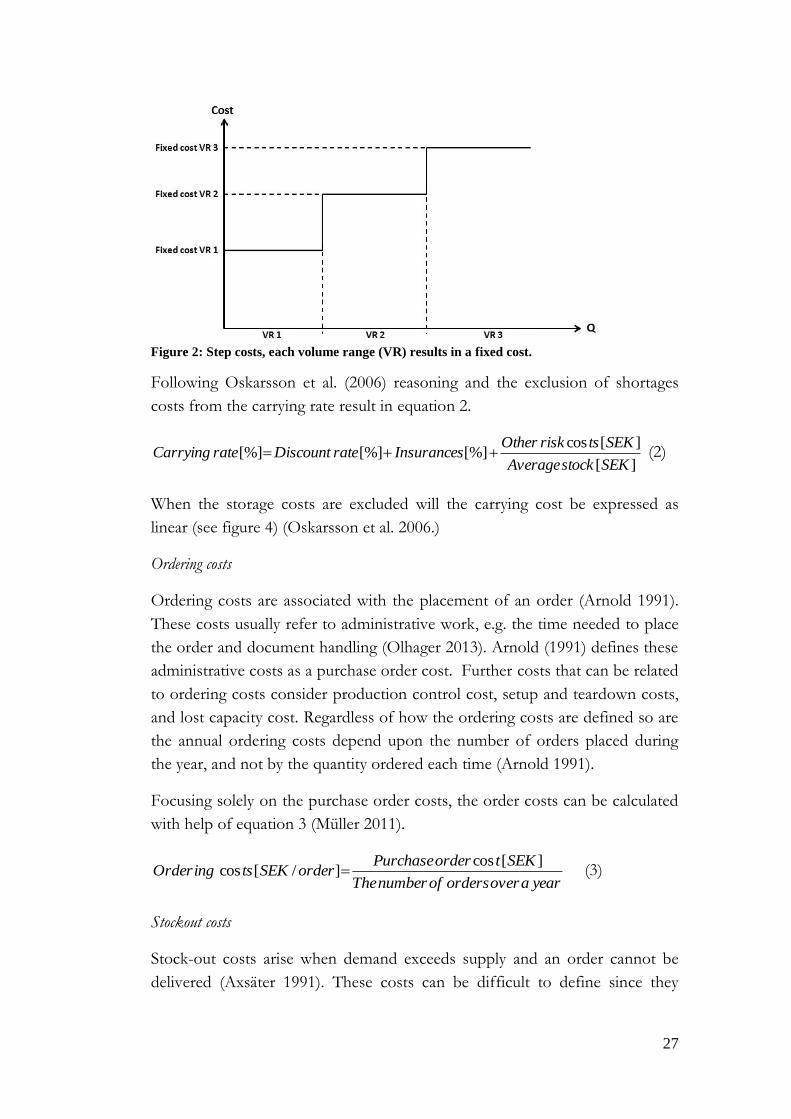
- Storage costs are often non-linear with stock volume, for instance:
Storages costs will not decrease when inventory levels decrease.
Applying storages costs in a carrying rate can therefore be
misleading.
Storage costs are a step cost, resulting in costs can be constant
to a certain point and thereafter require further investments (See
figure 2). Including step costs in the carrying rate are therefore
not suitable.
27
Figure 2: Step costs, each volume range (VR) results in a fixed cost.
Following Oskarsson et al. (2006) reasoning and the exclusion of shortages
costs from the carrying rate result in equation 2.
][
][cos[%][%][%]
SEKstockAverage
SEKtsriskOtherInsurancesrateDiscountrateCarrying (2)
When the storage costs are excluded will the carrying cost be expressed as
linear (see figure 4) (Oskarsson et al. 2006.)
Ordering costs
Ordering costs are associated with the placement of an order (Arnold 1991).
These costs usually refer to administrative work, e.g. the time needed to place
the order and document handling (Olhager 2013). Arnold (1991) defines these
administrative costs as a purchase order cost. Further costs that can be related
to ordering costs consider production control cost, setup and teardown costs,
and lost capacity cost. Regardless of how the ordering costs are defined so are
the annual ordering costs depend upon the number of orders placed during
the year, and not by the quantity ordered each time (Arnold 1991).
Focusing solely on the purchase order costs, the order costs can be calculated
with help of equation 3 (Müller 2011).
yearaoverordersofnumberThe
SEKtorderPurchaseorderSEKtsingOrder
][cos]/[cos (3)
Stockout costs
Stock-out costs arise when demand exceeds supply and an order cannot be
delivered (Axsäter 1991). These costs can be difficult to define since they
28
depend on whether the order is backordered or lost. If the order is
backordered the stock-out cost becomes negligible and will probably just bring
administrative costs. In the case of lost sales will the contribution margin of
the order will be lost. This may also lead to lost goodwill. To prevent stock-
out costs extra inventory can be kept and used to the achievement of a
predetermined customer service level (Olhager 2013).
3.2.2. Performance measures
As mentioned earlier in this chapter, customer service is a performance
measure focusing on measuring the availability of an item when a customer
needs it (Axsäter 1991). Another frequently used performance measure related
to inventory management is inventory turnover ratio (eq. 4) (Arnold 1991).
][
][cos
SEKinventoryAverage
SEKsoldgoodsoftAnnualturnoverInventory (4)
The average inventory can be determined using equation 5 (Oskarsson et al.
2006).
2][
QSSpSEKinventoryAverage (5)
Where
p = delivery price
SS = safety stock
Q = order quantity
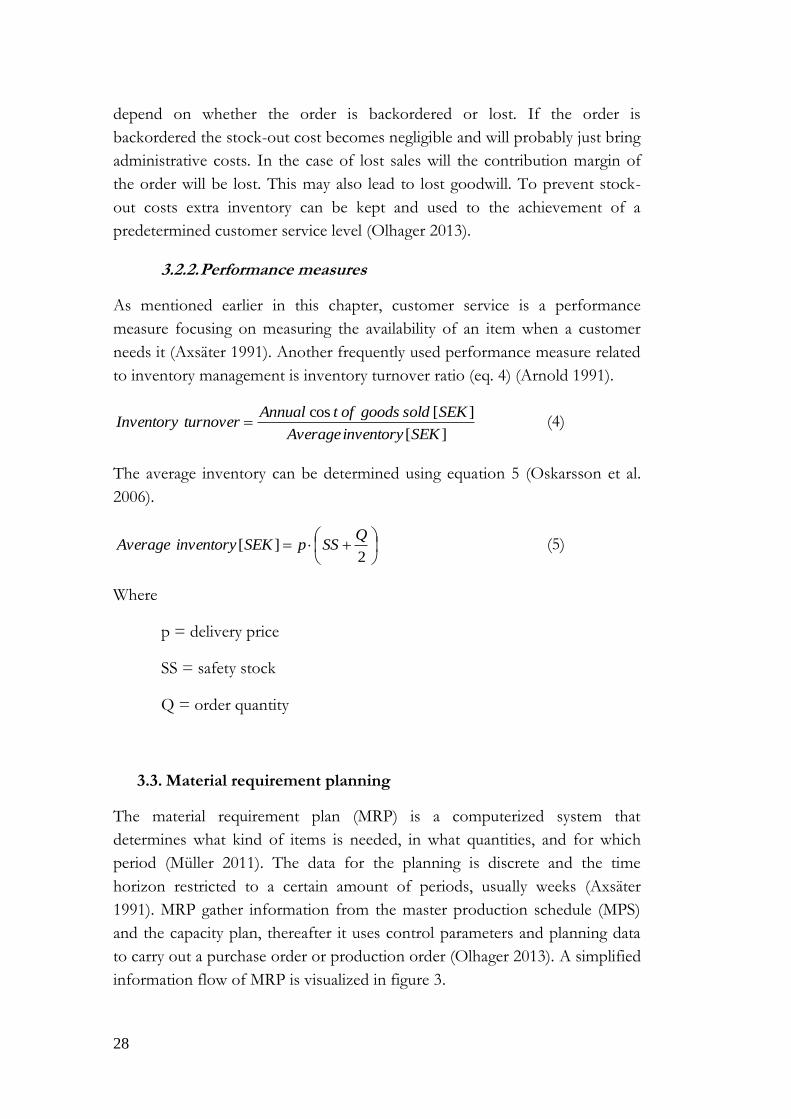
3.3. Material requirement planning
The material requirement plan (MRP) is a computerized system that
determines what kind of items is needed, in what quantities, and for which
period (Müller 2011). The data for the planning is discrete and the time
horizon restricted to a certain amount of periods, usually weeks (Axsäter
1991). MRP gather information from the master production schedule (MPS)
and the capacity plan, thereafter it uses control parameters and planning data
to carry out a purchase order or production order (Olhager 2013). A simplified
information flow of MRP is visualized in figure 3.
29
Figure 3: A schematic overview of a simplified MRP
A reoccurring problem when determining the material requirement is that the
set plan for the individual items is frequently changed. Small changes at high
product structure level can result in a series of changes at lower product
structure level (Axsäter 1991). Uncertainties at top level might therefore be
amplified at each structure level leading to the so called bullwhip-effect
(Davino et al. 2014). These adjustments in MRP can therefore lead to an
augmented effect called system nervousness. This can complicate the
implementation of the MRP and in worse case collapse the whole system
(Tang & Grubbström 2002). One way to prevent system nervousness is to
freeze orders. In this way set quantity and set starting period stand firm. It may
be advisable to freeze all orders within a given planning horizon (Axsäter
1991).
3.3.1. Control parameters
A previous study focusing on material planning is presented by Jonsson and
Mattsson (2006). They performed a longitudinal study they follow between
1993 and 2005 in which the investigated how the material planning has
changed for Swedish manufacturing companies. For the frequently used
planning methods they also investigated how the companies decided the
ingoing control parameters, i.e. lot sizes, safety stock, and lead times. Some of
the findings are presented in table 1.
30
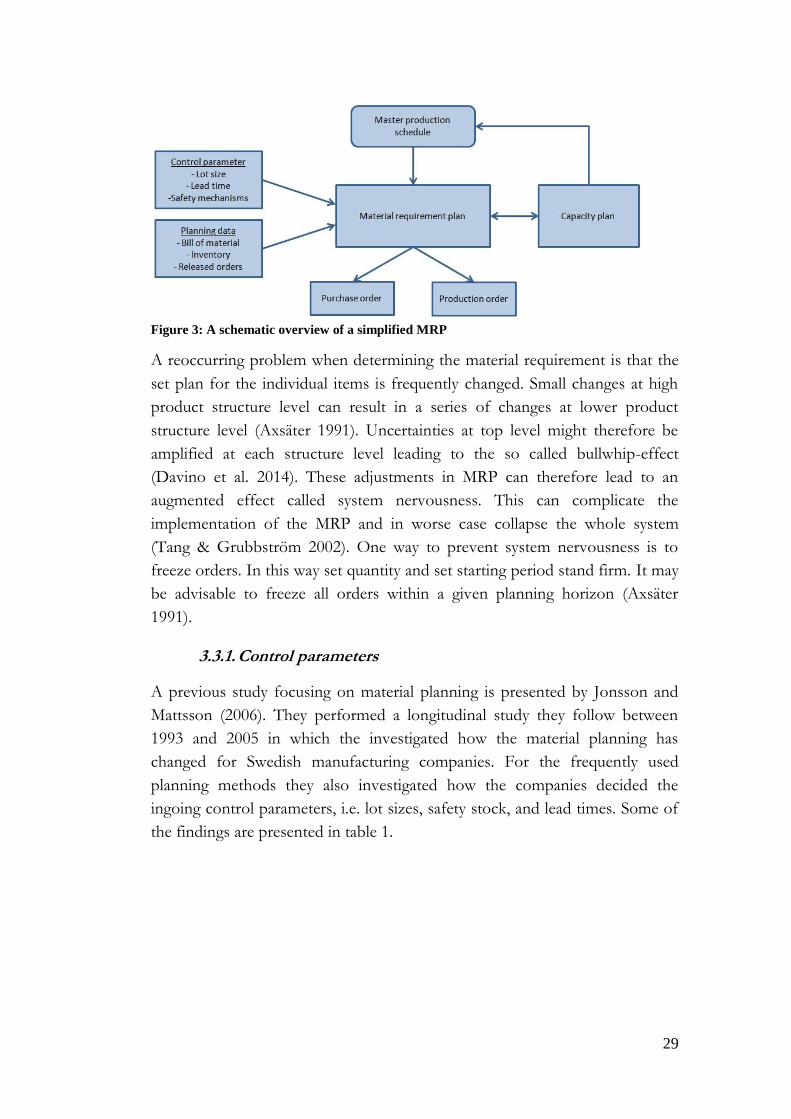
Table 2: Results from Jonsson and Mattsson (2006) for MRP systems.
Having safety stocks determined based on experience and judgment was a
result Jonsson and Mattson (2006) found as surprising, since the best way to
determine safety stocks is by balancing inventory costs with shortage costs or
service levels (Jonsson & Matsson (2006). The following sections of this
chapter will present alternative methods to determine lot sizes and safety
stocks.
Lot sizing
Orders can be based on three different methods. These are methods are
experience and general judgment, methods that applies some kind of cost
estimation, and using order quantities equal to the direct requirement (Jonsson
& Mattsson 2006).
Regardless of which type of model that is used reviewing the current
requirements should be review periodically so that accurate order quantities
can be gained. High performing MRP practitioners have shown to review their
parameters more frequently and more analytically than the low performing
users (Jonsson & Mattsson 2006).
Two of the most common models are just-in-time (JIT) purchasing and the
Wilson formula (Fazel et al. 1998). The Wilson formula calculates the
economic order quantity and is referred to as the EOQ model (Oskarsson et
al. 2006). The EOQ model is seen as a simple but effective tool used by
companies to avoid excessive inventory (Glock et al. 2014). It determines an
economic order quantity by balancing ordering costs with inventory carrying
cost (Olhager 2013). To deal with the increasing global competition companies
have been forced to come up with approaches to reduce their costs without
decreasing customer satisfaction. This has resulted in a renewed attention
towards lean manufacturing, and especially just-in-time (JIT) practices. These
practices are considered as effective tools to deal with waste and inefficiency,
Control parameter Determination Review frequency
Lot sizing Judgment and experience Annually or less
Safety stock Judgment and experience At least a couple
of times per year
Purchasing lead times - Roughly once a year
31
speed up production processes, and improve delivery performance (Danese et
al. 2012).
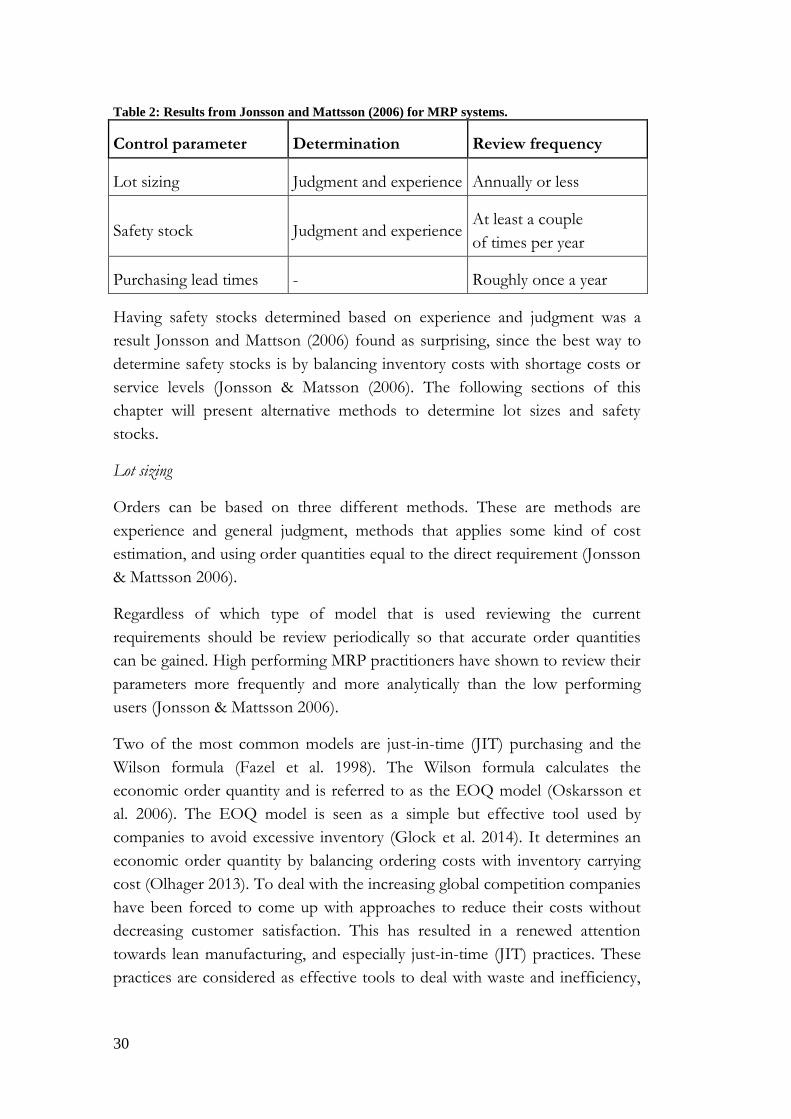
Wilson formula
The Wilson formula determines an EOQ by balancing inventory carrying costs
with order costs (Oskarsson et al. 2006). This is visualized in figure 4.
Figure 4: The total cost (TC) varies with quantity Q.
The Wilson formula uses the following assumptions:
- Ordering cost and carrying costs are constant
- Annual demand for the item is known and constant
- The complete order is delivered at one occasion
- No shortages are allowed (Axsäter 1991 ; Oskarsson et al. 2006)
In the Wilson formula equation a term for the fixed unit cost is included.
Following all these assumption the Wilson formula can be presented by
equation 6 (Oskarsson et al. 2006).
DpQ
prQ
kDTC
2 (6)
Where
tsrdering
Q
kDcosO
32
tsCarrying
Qpr cos
2
tpurchaseAnnualDp cos
p = delivery price, Q = order quantity, k = fixed cost per order, r =
carrying rate
EOQ can be found by deriving the total cost function with respect to the
order quantity and set this expression equal with zero (Olhager 2013), i.e. 7.
022
pr
Q
Dk
dQ
dTCE (7)
By rearranging equation 7, the equation 8 is obtained.
pr
DkQ
2 (8)
Two drawbacks with EOQ are that it assumes a constant demand over a
certain period. This can lead to some waste in terms of too high or low
inventory levels. But if calculations are done more frequently the risk of this
waste reduces (Relph & Newton 2014).
JIT purchasing
JIT can be defined from a managerial and/or manufacturing philosophical
standpoint or by its underlying techniques and practices used to implement
and support lean manufacturing (Danese et al. 2012). JIT is often associated
with lower costs, higher profitability and improved quality (Callen et al. 2000).
This can be achieved by reducing or eliminating wastes in production by
simplifying production processes. Essentially, there are seven types of waste
overproduction, waiting time, transports, over-processing, inventory, motion
and defects (Müller 2011). JIT production strives towards letting “all processes
produce the necessary parts at the necessary time and have on hand only the
minimum stock necessary to hold the processes together” (Sugimori 1977, p.
555).
One of the wastes is inventory, and rather than focusing on complete
elimination of inventory, the focus should lie on the elimination of
unnecessary inventory. The difference between unnecessary inventory and
necessary inventory is determined by the company setting. Müller (2011)
33
suggests that each company should define their own zero-tolerance inventory
policy and that this policy should focus on keeping a satisfying inventory level
that result in profitable and effectively operations. Establishing an inventory
policy helps companies to determine unnecessary inventory (Müller 2011).
Focusing on the streamlining in JIT production and elimination of
unnecessary waste has resulted in companies starting to order more frequently
and with lower quantities in each order. This brings large pressure on the
deliveries and bad delivery performance will require the company to keep a
large safety stock. In order to keep high delivery performance companies
usually keep a timeslot in which deliveries should arrive. If a delivery is too
early the transport has to wait and if it is late it has to turn back. Operating
according this approach, i.e. frequent orders with high delivery performance, is
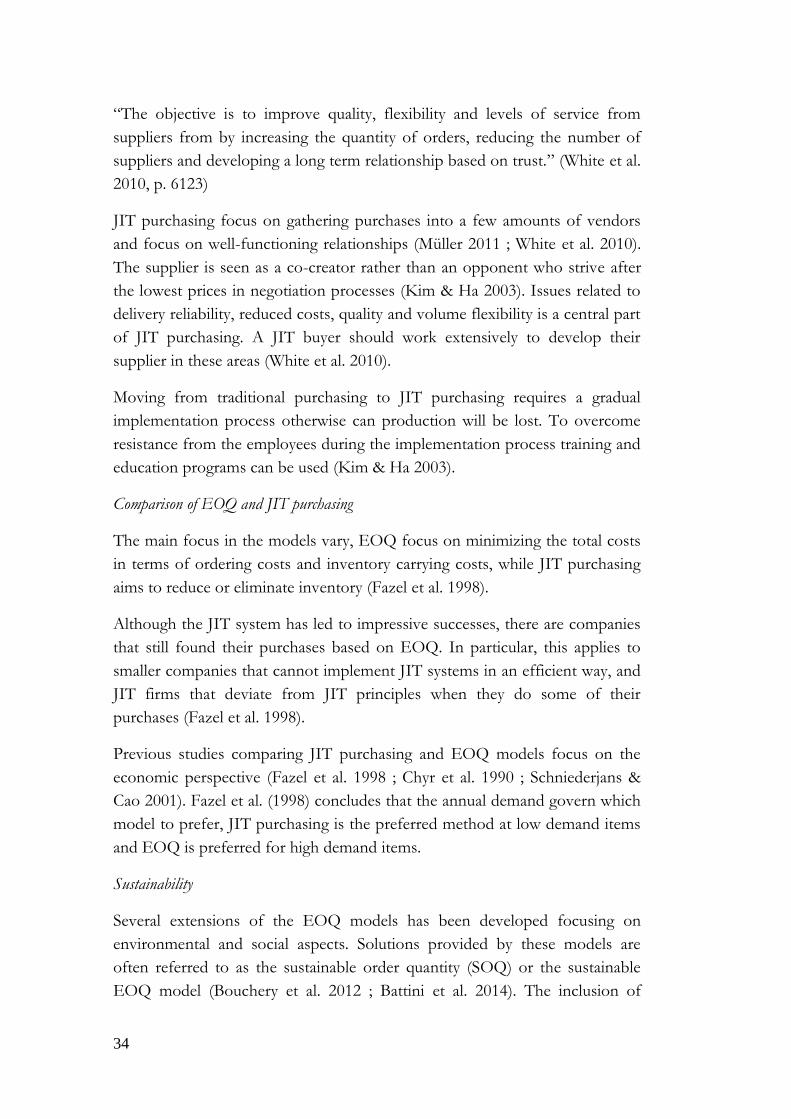
strongly associated with JIT deliveries. JIT deliveries differ from the traditional
approach according table 3 (Oskarsson et al. 2006).
Table 3: JIT deliveries compared with traditional deliveries.
JIT deliveries Traditional
deliveries
Transportation
time Short Long
Order quantities Small Large
Time precision High Low
Delivery
reliability High Low
Total
responsibility Yes No
Generally, the trend is towards JIT Deliveries. However, the amount of
companies working towards tight time margins for their deliveries is limited
(Oskarsson et al. 2006). Reducing the order quantities may improve the
productivity of a production system by obtaining lower inventory levels and
earlier detection of defect items (Kim & Ha 2003).
In attempt to achieve JIT delivery companies has started to focus on JIT
purchasing. The need to implement JIT purchasing could be found in the
objective behind it, which is:
34
“The objective is to improve quality, flexibility and levels of service from
suppliers from by increasing the quantity of orders, reducing the number of
suppliers and developing a long term relationship based on trust.” (White et al.
2010, p. 6123)
JIT purchasing focus on gathering purchases into a few amounts of vendors
and focus on well-functioning relationships (Müller 2011 ; White et al. 2010).
The supplier is seen as a co-creator rather than an opponent who strive after
the lowest prices in negotiation processes (Kim & Ha 2003). Issues related to
delivery reliability, reduced costs, quality and volume flexibility is a central part
of JIT purchasing. A JIT buyer should work extensively to develop their
supplier in these areas (White et al. 2010).
Moving from traditional purchasing to JIT purchasing requires a gradual
implementation process otherwise can production will be lost. To overcome
resistance from the employees during the implementation process training and
education programs can be used (Kim & Ha 2003).
Comparison of EOQ and JIT purchasing
The main focus in the models vary, EOQ focus on minimizing the total costs
in terms of ordering costs and inventory carrying costs, while JIT purchasing
aims to reduce or eliminate inventory (Fazel et al. 1998).
Although the JIT system has led to impressive successes, there are companies
that still found their purchases based on EOQ. In particular, this applies to
smaller companies that cannot implement JIT systems in an efficient way, and
JIT firms that deviate from JIT principles when they do some of their
purchases (Fazel et al. 1998).
Previous studies comparing JIT purchasing and EOQ models focus on the
economic perspective (Fazel et al. 1998 ; Chyr et al. 1990 ; Schniederjans &
Cao 2001). Fazel et al. (1998) concludes that the annual demand govern which
model to prefer, JIT purchasing is the preferred method at low demand items
and EOQ is preferred for high demand items.
Sustainability
Several extensions of the EOQ models has been developed focusing on
environmental and social aspects. Solutions provided by these models are
often referred to as the sustainable order quantity (SOQ) or the sustainable
EOQ model (Bouchery et al. 2012 ; Battini et al. 2014). The inclusion of
35
environmental and social parameters takes place through a transformation of
social and environmental concerns into costs, thereafter is an optimum order
quantity determined by minimization of all costs (Arslan & Turkay 2013 ;
Bouchery et al. 2012). Examples of previous studies focusing on a sustainable
order quantity are: Arslan and Turkay (2013) who includes working hours and
carbon emissions in their model; Bouchery et al. (2012) includes injury rates
related to ordering and inventory holding as social aspects and the carbon
footprint as a environmental aspect; and Bonney and Jaber (2011) focus on
minimizing carbon dioxide emissions and the following social costs the
emission bring.
Previous studies studying JIT and sustainability point in different directions.
As mentioned earlier is frequent orders a recurrent phenomena in JIT, and
according to Martínez-Jurado & Moyano-Fuentes (2014) will frequent orders
delivered in small lots increase the air pollutions and traffic congestions. Other
studies focus on how JIT can combine effective logistics and environmental
awareness. One with the latter focus is presented by Cusumano (1994).
Cusumano (1994) describe how Japanese companies had to deviate from the
JIT principles, in terms small lot sizes and frequent orders. The aim with this
was to lower the traffic congestions and thereby lower the probability of
delays due to traffic and reduce air pollutions. Mollenkopf et al. (2010) stresses
that companies should do trade-offs or develop solutions that handle conflicts
between JIT and green approaches so undesirable consequences diminish.
Further research studying JIT and sustainability points out that the elimination
of one factor can give birth to another.
3.3.2. Safety mechanisms
The safety mechanisms are usually distinguished into three different types:
safety stock, safety time and increased needs. Increased need assume a need
greater than the actual value (Olhager 2013).
Safety time
The safety time aim to deal with uncertainty in lead time (Olhager 2013).
Using safety time means bringing forward the arrival of an order to ensure that
it is available before the need arises (Axsäter 1991). To understand the
usability of safety time it can be useful to think of two basic cases. The first
case is when the actual lead time is longer than the forecasted lead time, and
this will lead to shortages and delays since the demand will exceed the supply,
36
i.e. there is no items available. The second case is the opposite of the first, i.e.
the actual lead time is smaller than the forecasted lead time. This outcome will
instead result in excessive inventory and leading to increased average inventory
(Molinder 1997).
Safety stock
Even if the demand is treated as deterministic in a forecast, it is known that
the true character of the demand is stochastic, i.e. the actual demand can
exceed the forecasted demand and bring shortages. Safety stocks are used as a
tool to deal with this uncertainty in the forecasted demand (Olhager 2013).
Safety stocks can be determined from either a desired service level (SERV) or
a lack cost model. The first-mentioned method is the most common and is
divided into two different definitions (Olhager 2013). These are:
- SERV1 - The probability of not getting shortages under an order cycle
- SERV2 - The fraction of demand that can be delivered immediately
from inventory
SERV1 can be seen as the probability that a delivery will arrive on time.
Calculations based on this concept are considered as relative simple, but they
also entail considerable disadvantages. The problem with SERV1 is that it
does not include the order quantity. If the order quantity is large and covers
the demand for a longer time, it does not matter if SERV1 is low, because
supplies take place so rarely. SERV2 is on the other side a little more difficult
to use, but still provides a good measure of the true customer service
(Axsäter1991).
When defining the service levels it is important for companies to express it in
a clear and unambiguous manner, and they should also define it in way
possible for monitoring according to the definition (SERV 1 or 2) used
(Axsäter1991). In general, it is not the same service requirements for all items.
To simply the work is the service level usually determined for a group of items
(Axsäter1991).
Calculations
The aim with safety stock calculations is to give an estimation of the safety
stock. The uncertainty of the calculations is dependent of the accuracy of the
estimation of the standard deviations. The accuracy can be improved by using
37
multiple measures and by reviewing them frequently over time (Oskarsson et
al. 2006).
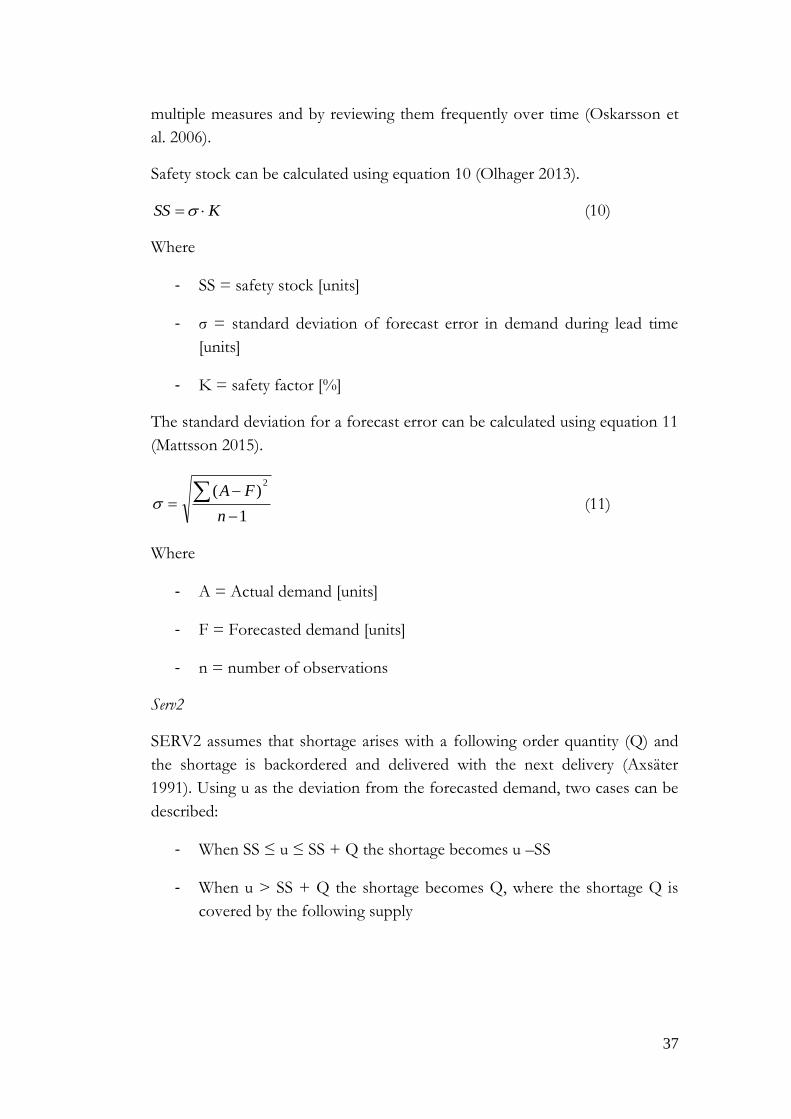
Safety stock can be calculated using equation 10 (Olhager 2013).
KSS (10)
Where
- SS = safety stock [units]
- σ = standard deviation of forecast error in demand during lead time
[units]
- K = safety factor [%]
The standard deviation for a forecast error can be calculated using equation 11
(Mattsson 2015).
1
)(2
n
FA (11)
Where
- A = Actual demand [units]
- F = Forecasted demand [units]
- n = number of observations
Serv2
SERV2 assumes that shortage arises with a following order quantity (Q) and
the shortage is backordered and delivered with the next delivery (Axsäter
1991). Using u as the deviation from the forecasted demand, two cases can be
described:
- When SS ≤ u ≤ SS + Q the shortage becomes u –SS
- When u > SS + Q the shortage becomes Q, where the shortage Q is
covered by the following supply
38
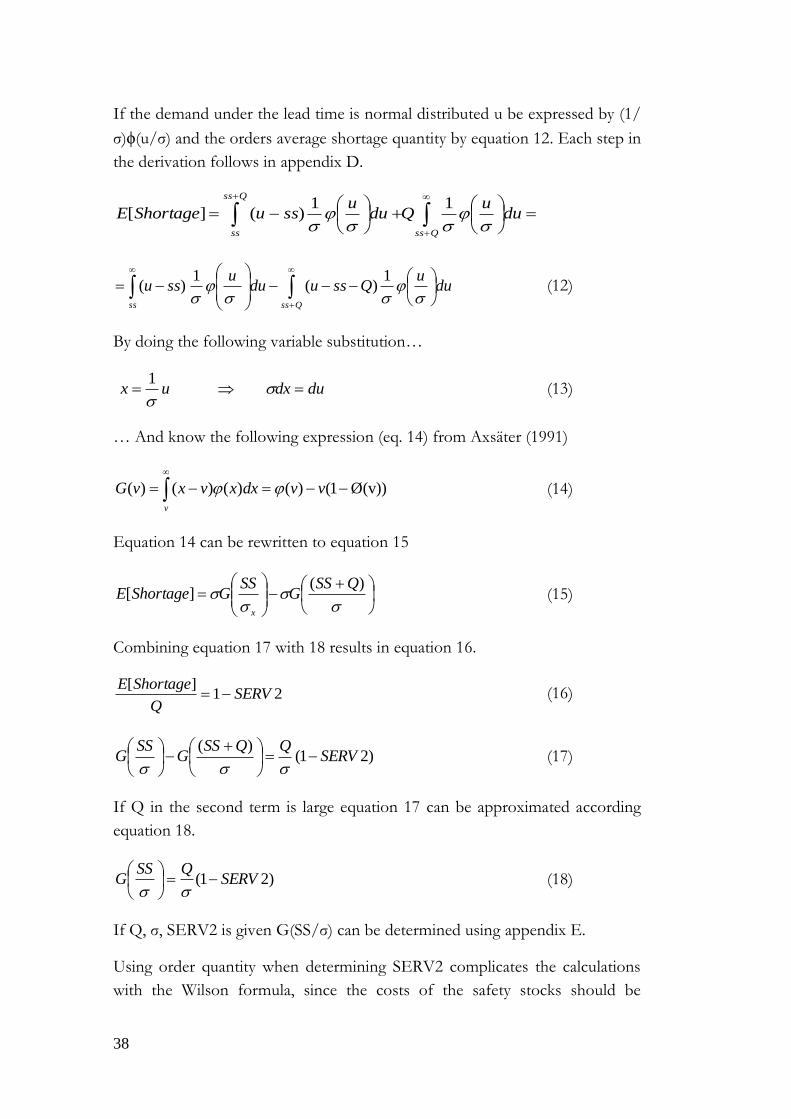
If the demand under the lead time is normal distributed u be expressed by (1/
σ)ϕ(u/σ) and the orders average shortage quantity by equation 12. Each step in
the derivation follows in appendix D.
Qss
Qss
ss
duu
Qduu
ssuShortageE
11)(][
Qssss
duu
Qssuduu
ssu
1)(
1)( (12)
By doing the following variable substitution…
dudxux
1 (13)
… And know the following expression (eq. 14) from Axsäter (1991)
Ø(v))1()()()()(
vvdxxvxvGv
(14)
Equation 14 can be rewritten to equation 15
)(][
QSSG
SSGShortageE
x
(15)
Combining equation 17 with 18 results in equation 16.
21][
SERVQ
ShortageE (16)
)21()(
SERVQQSS
GSS
G
(17)
If Q in the second term is large equation 17 can be approximated according
equation 18.
)21( SERVQSS
G
(18)
If Q, σ, SERV2 is given G(SS/σ) can be determined using appendix E.
Using order quantity when determining SERV2 complicates the calculations
with the Wilson formula, since the costs of the safety stocks should be
39
included. A simple formulation of how safety stocks depend of the quantity
can be hard to make in practice (Oskarsson et al. 2006). According Oskarsson
et al. (2006) should not the exclusion of the safety stock in the Wilson formula
bring large economic consequence.
40
4. Case company
This chapter presents general information of the case company. This knowledge is seen as
necessary to understand Chapter 5, which describes Barilla Sweden’s current inventory
management of packaging material.
4.1. Barilla Group
Barilla Sweden is today seen as the world leader in producing crispbread and
they sell their products under their brand Wasabröd. Their business was
founded by Karl Edvard Lundström in Skellefteå in year 1919 under the name
AB Skellefteå Spisbrödfabrik. The company moved to Filipstad in the year of
1931 after a land dispute with the municipality of Skellefteå. Sweden, Norway,
Suomi, Germany and Netherlands represent 80 % of Barilla Sweden total
market, and Sweden is the biggest market. Since 1999 Wasabröd is owned by
the Barilla Group and is referred to as Barilla Sweden AB. Several different
brands are included within the Barilla Group, see figure 5 to see the different
brands. The Barilla group is family owned and the ownership is divided
between three brothers. They are the fourth generation and they are
responsible for about 18 000 employees. The brothers have a goal to double
the corporate turnover during the 2020’s without increasing the environmental
impact. Their environmental concerns in the vision are also reflected in their
aspiration, which is:
“Grow the business, while continuously reducing our footprint on the Planet
and promoting wholesome and joyful food habits”
Figure 5: Brands owned by Barilla Group
41
4.2. Barilla Sweden, Filipstad
Barilla Sweden (further referred to as Barilla) have their bakery located in
Filipstad and the sales department located in Stockholm. When the bakery was
moved from Skellefteå to Filipstad the decision makers decided to build the
bakery processes according the “assembly” line principle. In the year of 1981
production line 18 (PL18) was opened. PL18 was then, and is today, the
production line with the largest production capacity. Over a year Barilla
produces a total amount of 36 000 ton crispbread, presented in 30 variants and
sold to 40 different countries. Barilla has a goal to produce 40 000 ton
crispbread each year until year 2020. The bakery in Filipstad has around 450
employees working with operations related to the refinement of raw materials
to finished crispbread. The production is distributed over eight different
production lines and fifteen packaging machines. After the bread is packed it is
transported to the high bay warehouse. Barilla has a full automated high bay
warehouse for finished goods.
4.2.1. Central planning
Barilla’s bakery production is mainly determined by forecasts made by the
central planning department. The central planning department has central
planner (CP) placed in Filipstad which makes the production planning over a
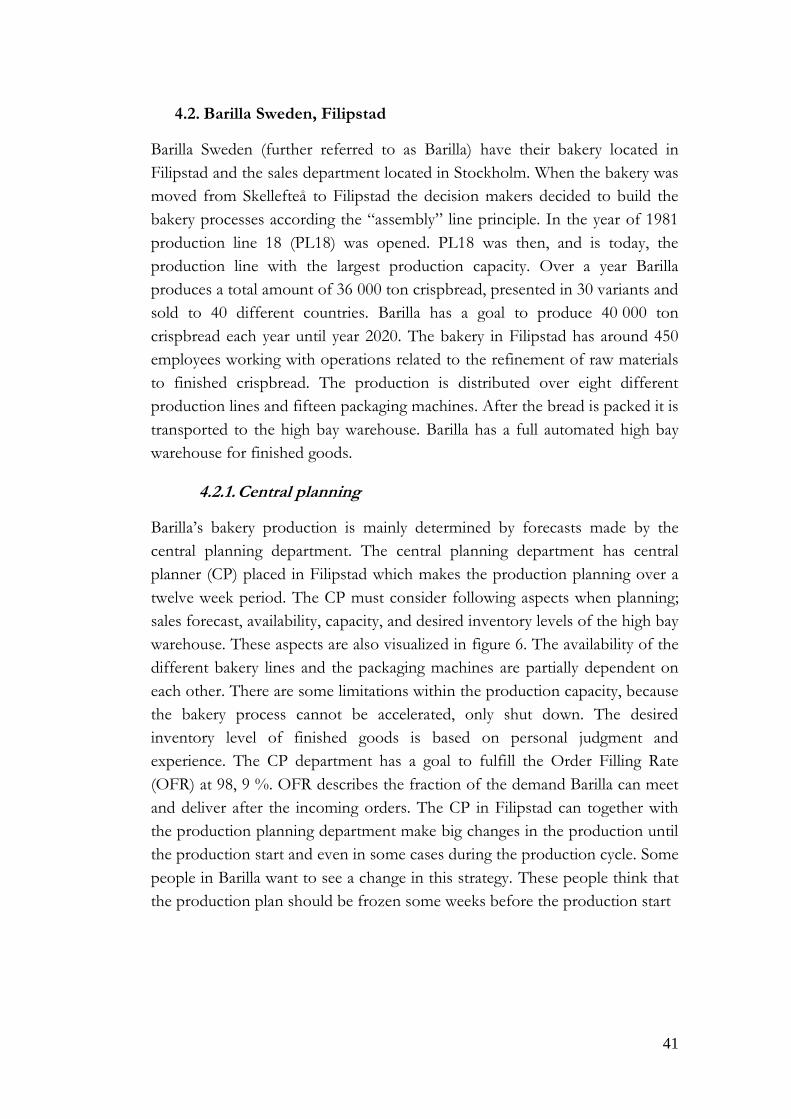
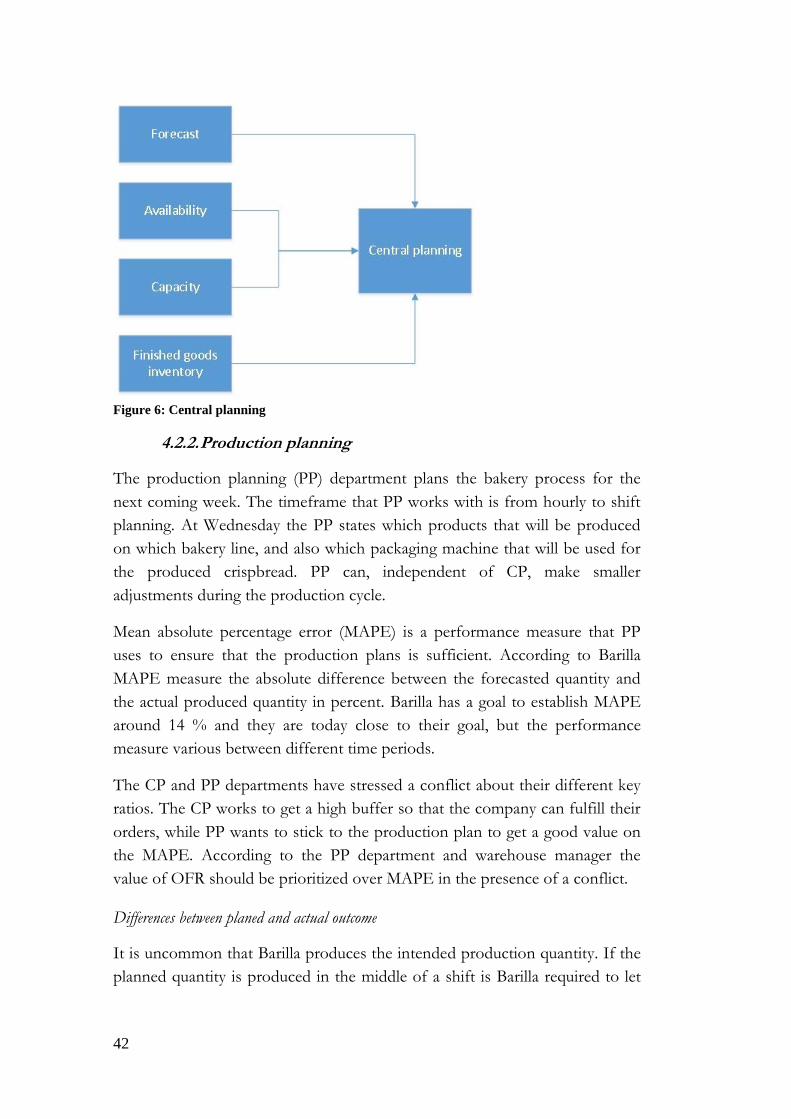
twelve week period. The CP must consider following aspects when planning;
sales forecast, availability, capacity, and desired inventory levels of the high bay
warehouse. These aspects are also visualized in figure 6. The availability of the
different bakery lines and the packaging machines are partially dependent on
each other. There are some limitations within the production capacity, because
the bakery process cannot be accelerated, only shut down. The desired
inventory level of finished goods is based on personal judgment and
experience. The CP department has a goal to fulfill the Order Filling Rate
(OFR) at 98, 9 %. OFR describes the fraction of the demand Barilla can meet
and deliver after the incoming orders. The CP in Filipstad can together with
the production planning department make big changes in the production until
the production start and even in some cases during the production cycle. Some
people in Barilla want to see a change in this strategy. These people think that
the production plan should be frozen some weeks before the production start
42
Figure 6: Central planning
4.2.2. Production planning
The production planning (PP) department plans the bakery process for the
next coming week. The timeframe that PP works with is from hourly to shift
planning. At Wednesday the PP states which products that will be produced
on which bakery line, and also which packaging machine that will be used for
the produced crispbread. PP can, independent of CP, make smaller
adjustments during the production cycle.
Mean absolute percentage error (MAPE) is a performance measure that PP
uses to ensure that the production plans is sufficient. According to Barilla
MAPE measure the absolute difference between the forecasted quantity and
the actual produced quantity in percent. Barilla has a goal to establish MAPE
around 14 % and they are today close to their goal, but the performance
measure various between different time periods.
The CP and PP departments have stressed a conflict about their different key
ratios. The CP works to get a high buffer so that the company can fulfill their
orders, while PP wants to stick to the production plan to get a good value on
the MAPE. According to the PP department and warehouse manager the
value of OFR should be prioritized over MAPE in the presence of a conflict.
Differences between planed and actual outcome
It is uncommon that Barilla produces the intended production quantity. If the
planned quantity is produced in the middle of a shift is Barilla required to let
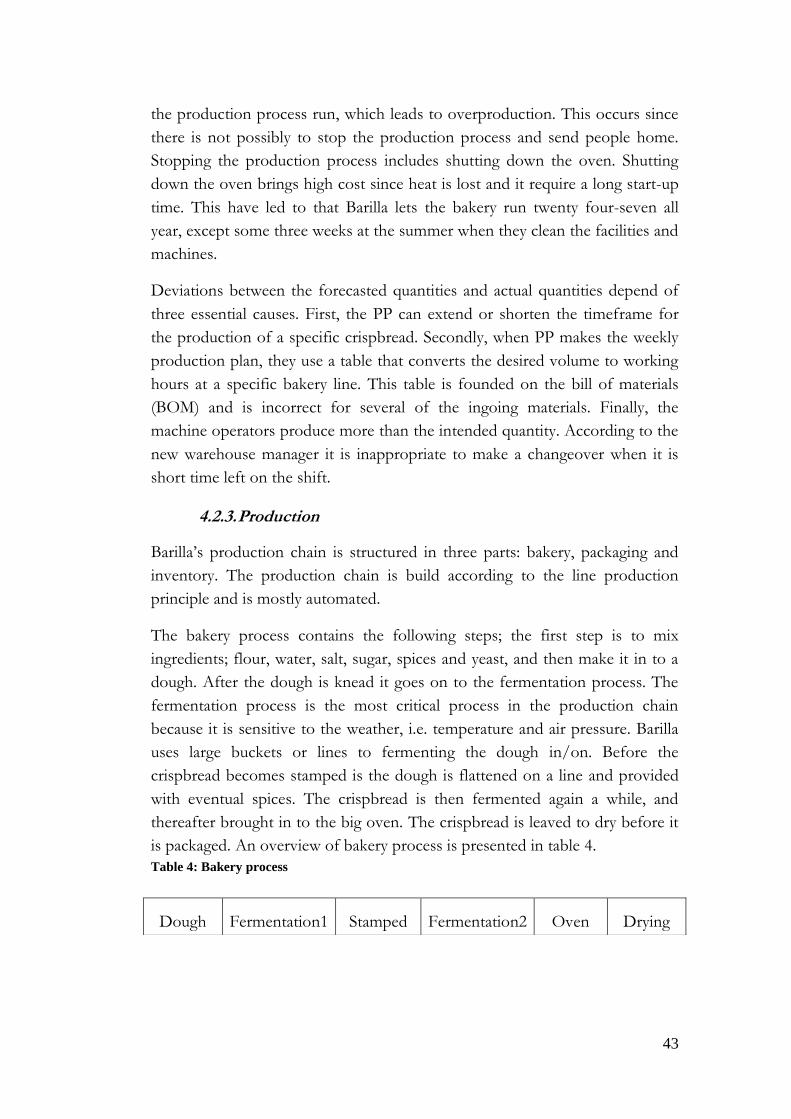
43
the production process run, which leads to overproduction. This occurs since
there is not possibly to stop the production process and send people home.
Stopping the production process includes shutting down the oven. Shutting
down the oven brings high cost since heat is lost and it require a long start-up
time. This have led to that Barilla lets the bakery run twenty four-seven all
year, except some three weeks at the summer when they clean the facilities and
machines.
Deviations between the forecasted quantities and actual quantities depend of
three essential causes. First, the PP can extend or shorten the timeframe for
the production of a specific crispbread. Secondly, when PP makes the weekly
production plan, they use a table that converts the desired volume to working
hours at a specific bakery line. This table is founded on the bill of materials
(BOM) and is incorrect for several of the ingoing materials. Finally, the
machine operators produce more than the intended quantity. According to the
new warehouse manager it is inappropriate to make a changeover when it is
short time left on the shift.
4.2.3. Production
Barilla’s production chain is structured in three parts: bakery, packaging and
inventory. The production chain is build according to the line production
principle and is mostly automated.
The bakery process contains the following steps; the first step is to mix
ingredients; flour, water, salt, sugar, spices and yeast, and then make it in to a
dough. After the dough is knead it goes on to the fermentation process. The
fermentation process is the most critical process in the production chain
because it is sensitive to the weather, i.e. temperature and air pressure. Barilla
uses large buckets or lines to fermenting the dough in/on. Before the
crispbread becomes stamped is the dough is flattened on a line and provided
with eventual spices. The crispbread is then fermented again a while, and
thereafter brought in to the big oven. The crispbread is leaved to dry before it
is packaged. An overview of bakery process is presented in table 4.
Table 4: Bakery process
Dough Fermentation1 Stamped Fermentation2 Oven Drying
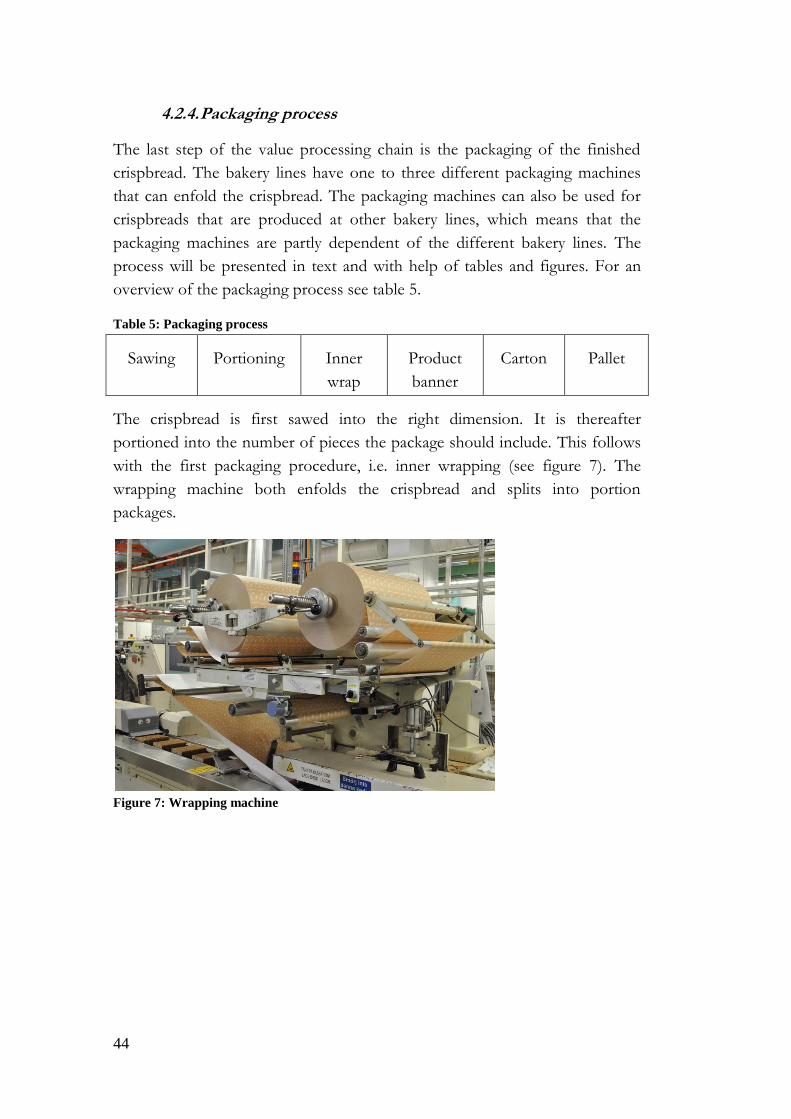
44
4.2.4. Packaging process
The last step of the value processing chain is the packaging of the finished
crispbread. The bakery lines have one to three different packaging machines
that can enfold the crispbread. The packaging machines can also be used for
crispbreads that are produced at other bakery lines, which means that the
packaging machines are partly dependent of the different bakery lines. The
process will be presented in text and with help of tables and figures. For an
overview of the packaging process see table 5.
Table 5: Packaging process
Sawing Portioning Inner
wrap
Product
banner
Carton Pallet
The crispbread is first sawed into the right dimension. It is thereafter
portioned into the number of pieces the package should include. This follows
with the first packaging procedure, i.e. inner wrapping (see figure 7). The
wrapping machine both enfolds the crispbread and splits into portion
packages.
Figure 7: Wrapping machine
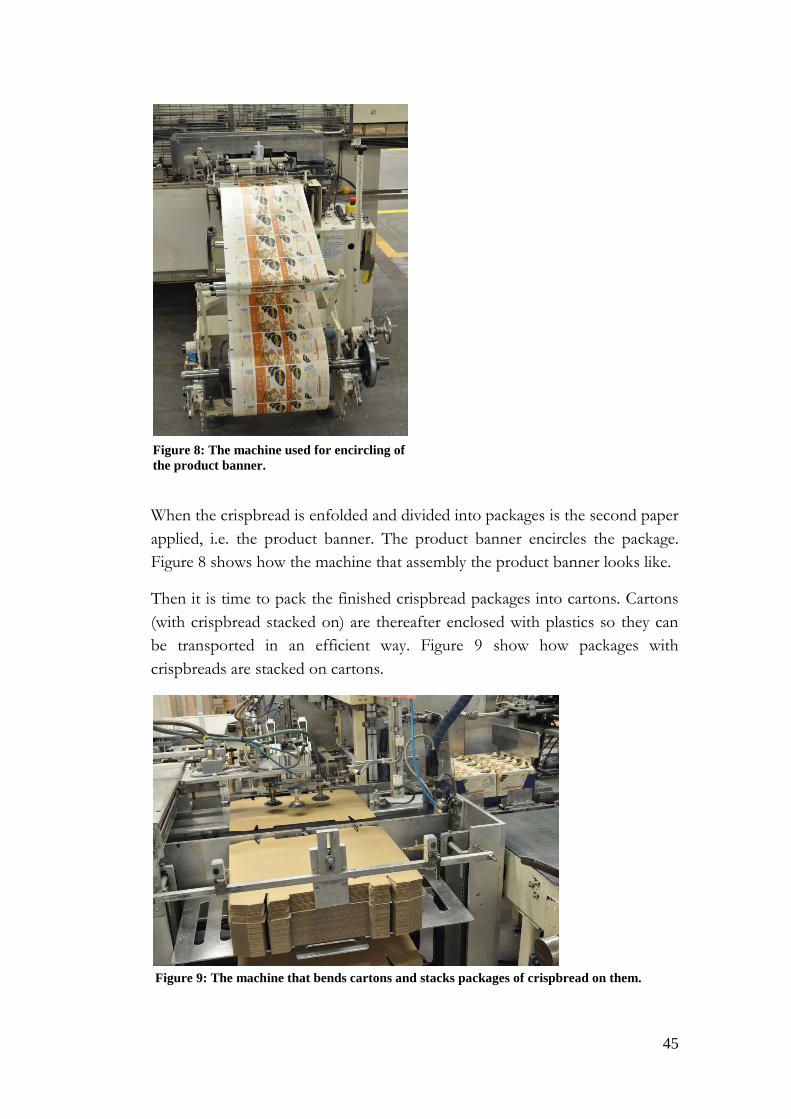
45
When the crispbread is enfolded and divided into packages is the second paper
applied, i.e. the product banner. The product banner encircles the package.
Figure 8 shows how the machine that assembly the product banner looks like.
Then it is time to pack the finished crispbread packages into cartons. Cartons
(with crispbread stacked on) are thereafter enclosed with plastics so they can
be transported in an efficient way. Figure 9 show how packages with
crispbreads are stacked on cartons.
Figure 9: The machine that bends cartons and stacks packages of crispbread on them.
Figure 8: The machine used for encircling of
the product banner.
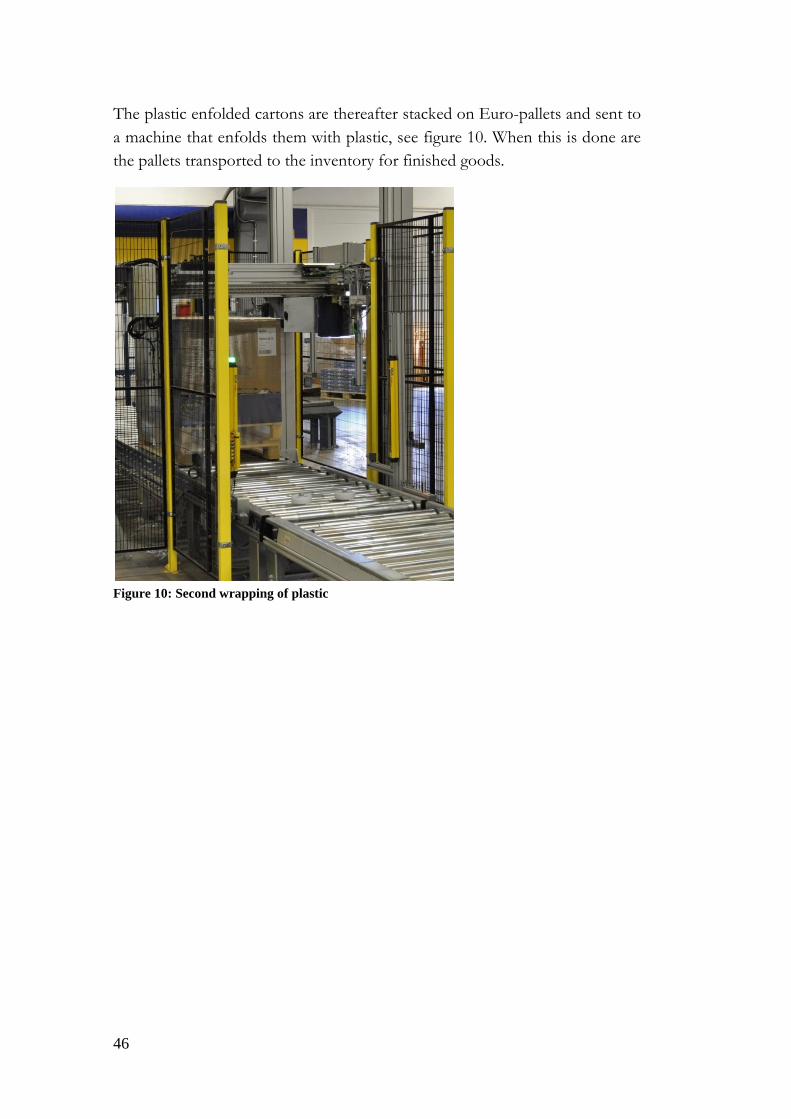
46
The plastic enfolded cartons are thereafter stacked on Euro-pallets and sent to
a machine that enfolds them with plastic, see figure 10. When this is done are
the pallets transported to the inventory for finished goods.
Figure 10: Second wrapping of plastic

47
5. Inventory management at Barilla
This chapter presents Barilla’s current inventory management related to packaging materials
5.1. Packaging material
5.1.1. Ordering of packaging material
The need of packaging material at Barilla is continuous and the required
quantities differ week to week. The material procurers found their ordering
based on a low price strategy, i.e. they order large quantities to get a low unit
price. This result in product banners being delivered every fourth to fifth
week, the inner wrap every three to four weeks, and cartons every two to three
weeks.
5.1.2. Transportation
All packaging material cannot be stored in the main inventory, therefore
Barilla use two extra inventory spaces that are located at the fourth and fifth
floor. The warehouse workers have to use an elevator to get up to these floors.
The truck does not fit in the elevator and the warehouse workers have to use a
manual fork lift. The elevator is not only used for transportation of packaging
material, and it is common that the warehouse workers have to wait for the
elevator to become available
5.1.3. Uncertainty in BOM
Barilla determines the production quantity based on forecasts. The production
quantities are transformed with help of a BOM into required quantities of
packaging material. This is done in Barilla’s MRP software based on an
estimation of the required raw material to produce one unit. These estimations
have shown to deviate substantially from the actual figures, leading to the
orders being found on incorrect values. Barilla must therefore do stocktaking
on a weekly and monthly basis. The weekly stocktaking investigates the
amount of raw materials used for production during the week. In the monthly
stocktaking are all packaging in stock counted by the material procurers and
warehouse workers.
5.1.4. Quality problems
The most common quality problem is cartons being curved by low humidity in
the material. Curved cartons require the production workers to hand-bend the
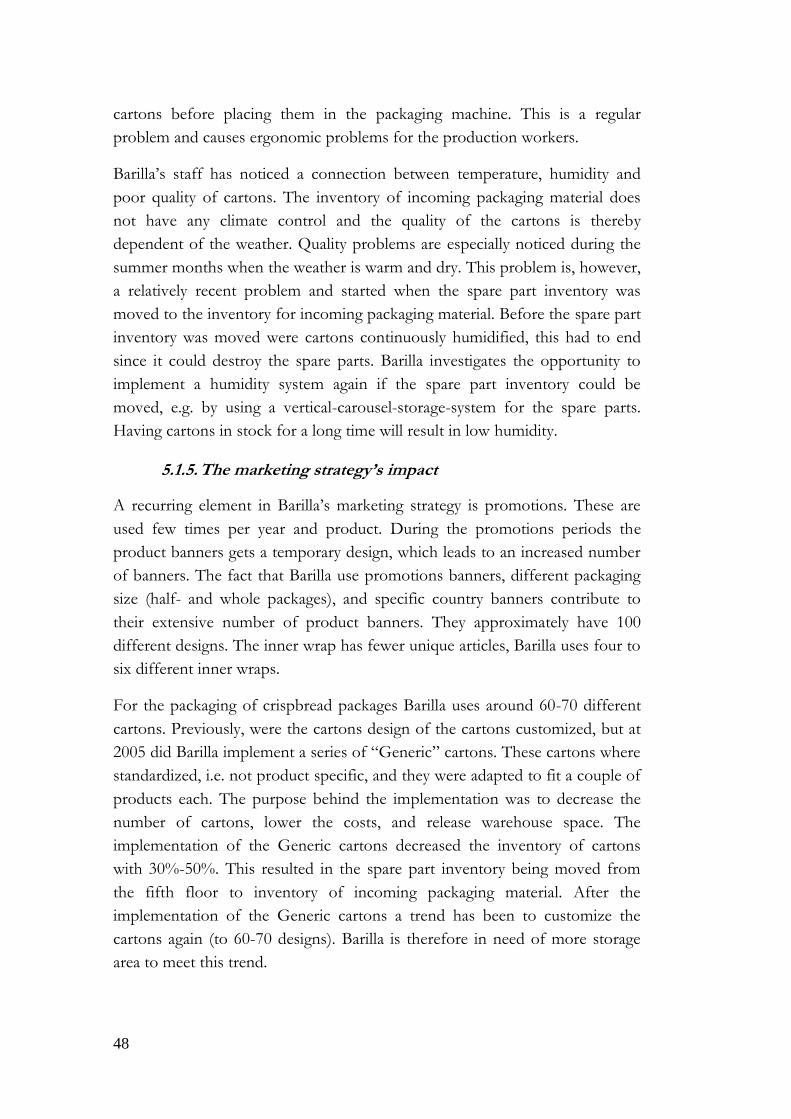
48
cartons before placing them in the packaging machine. This is a regular
problem and causes ergonomic problems for the production workers.
Barilla’s staff has noticed a connection between temperature, humidity and
poor quality of cartons. The inventory of incoming packaging material does
not have any climate control and the quality of the cartons is thereby
dependent of the weather. Quality problems are especially noticed during the
summer months when the weather is warm and dry. This problem is, however,
a relatively recent problem and started when the spare part inventory was
moved to the inventory for incoming packaging material. Before the spare part
inventory was moved were cartons continuously humidified, this had to end
since it could destroy the spare parts. Barilla investigates the opportunity to
implement a humidity system again if the spare part inventory could be
moved, e.g. by using a vertical-carousel-storage-system for the spare parts.
Having cartons in stock for a long time will result in low humidity.
5.1.5. The marketing strategy’s impact
A recurring element in Barilla’s marketing strategy is promotions. These are
used few times per year and product. During the promotions periods the
product banners gets a temporary design, which leads to an increased number
of banners. The fact that Barilla use promotions banners, different packaging
size (half- and whole packages), and specific country banners contribute to
their extensive number of product banners. They approximately have 100
different designs. The inner wrap has fewer unique articles, Barilla uses four to
six different inner wraps.
For the packaging of crispbread packages Barilla uses around 60-70 different
cartons. Previously, were the cartons design of the cartons customized, but at
2005 did Barilla implement a series of “Generic” cartons. These cartons where
standardized, i.e. not product specific, and they were adapted to fit a couple of
products each. The purpose behind the implementation was to decrease the
number of cartons, lower the costs, and release warehouse space. The
implementation of the Generic cartons decreased the inventory of cartons
with 30%-50%. This resulted in the spare part inventory being moved from
the fifth floor to inventory of incoming packaging material. After the
implementation of the Generic cartons a trend has been to customize the
cartons again (to 60-70 designs). Barilla is therefore in need of more storage
area to meet this trend.
49
5.2. Warehouse workers
5.2.1. Work tasks
The warehouse workers work five days a week (Monday to Friday). Since the
production runs twenty four-seven the warehouse workers has to prepare for
the weekend production, and overhaul the WIP inventories on Mondays. On
Fridays the warehouse workers ensures to amount of items in the WIP
inventories for the weekend. Friday’s and Monday’s results therefore in an
intense workload for the warehouse workers. To ease their workload Barilla
has required their suppliers to not deliver at these days.
The inventory of incoming packaging material is placed one level beneath the
main production floor. Delivering the material to the right floor require the
warehouse workers to use a material lift. It is one warehouse workers task to
feed the material lift with material, and the others task to receive and lift of the
material. The warehouse workers are therefore placed at each floor. A further
task for the worker at the upper floor is to supply the production with
packaging material. The worker at the lower floor has to receive incoming
orders and maintain the main inventory of packaging material.
5.2.2. The current ordering strategy’s impact
When an order arrives is the workload usually high since the order sizes often
are large. It is therefore common that the warehouse workers have to call for
help from other departments since they cannot make it on their own. To avoid
situations like these one of the warehouse workers suggested that orders
should be delivered in smaller amounts and more frequently, but also that
Barilla should use standardized packaging material that can be used in multiple
products. The current purchasing strategy has resulted in large quantities of
packaging material being stocked in the inventory of incoming packaging
material. Keeping large quantities in stock complicates the warehouse workers
attempt to follow the first in first out (FIFO) principle
5.2.3. Warehouse structure
The warehouse workers themselves are responsible for positioning of the
packaging material in the main inventory. This, but also the storing at different
floors, leads to a lot of the knowledge is restricted to the warehouse workers.
During an interview with one of the warehouse workers he pointed out that
50
there is bad communication between them and other functions within the
company.
5.3. Suppliers
5.3.1. Supplier relation and deliveries
The material procurers at Barilla find their suppliers as cooperative and see
their relations as good. They do however stress that some of the suppliers
have problems with delivering in time and follow the set order quantities. To
ensure that incoming goods arrive in time, Barilla requires their suppliers to
deliver five days before production. They do however accept the deliveries to
arrive one day ahead or one day late, resulting in arrival of deliveries four to six
days before production. The suppliers also has a restriction to not deliver
orders on Mondays and Fridays, this because of the high workload that the
warehouse workers already are exposed for. It is also accepted for the
suppliers to divide one delivery into suborders, i.e. one suborder can arrive in
time for production and a second can arrive during the production cycle. The
material procures try to some degree order raw material that can be co-
delivered from the same supplier. This is usually done when orders are close in
time to each other.
5.3.1. Pricing
Barilla’s suppliers use different pricing of the packaging material. Supplier A
give quantity discounts and therefore use a stepwise pricing. Supplier B uses a
fixed unit price based on an annual order volume. The third supplier C, set
their prices from an initial, fixed cost, independent of the order size and add a
variable cost dependent of the order size.
5.3.2. Survey
A survey was sent to out to Barillas three main suppliers. Two of the
respondents are sale managers and the third was a CEO. The purpose with the
survey was to get input of the suppliers’ opinion about increasing the delivery
frequent to Barilla. Table 6 shows the respondents answered on the following
two questions and their attitude on a scale 1 to 5.
Q1 - How do you feel about increasing the deliveries to Barilla in Filipstad, thereby lower
the order batches per delivery?
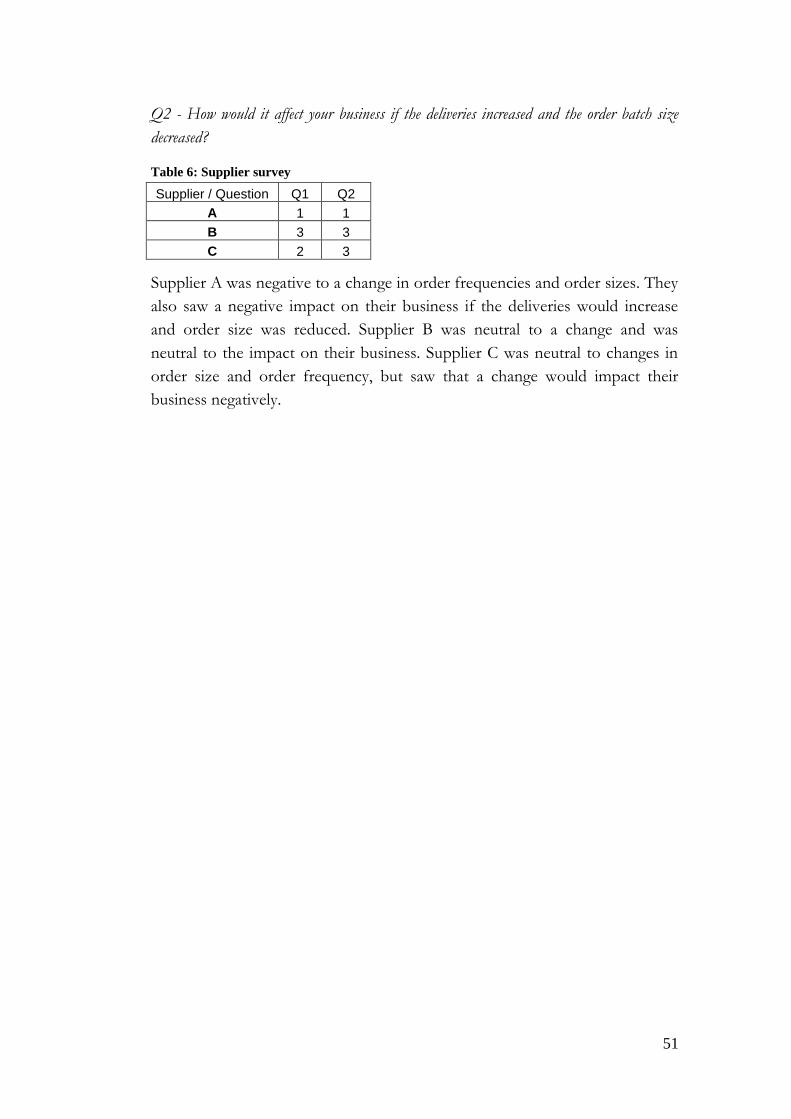
51
Q2 - How would it affect your business if the deliveries increased and the order batch size
decreased?
Table 6: Supplier survey
Supplier / Question Q1 Q2
A 1 1
B 3 3
C 2 3
Supplier A was negative to a change in order frequencies and order sizes. They
also saw a negative impact on their business if the deliveries would increase
and order size was reduced. Supplier B was neutral to a change and was
neutral to the impact on their business. Supplier C was neutral to changes in
order size and order frequency, but saw that a change would impact their
business negatively.
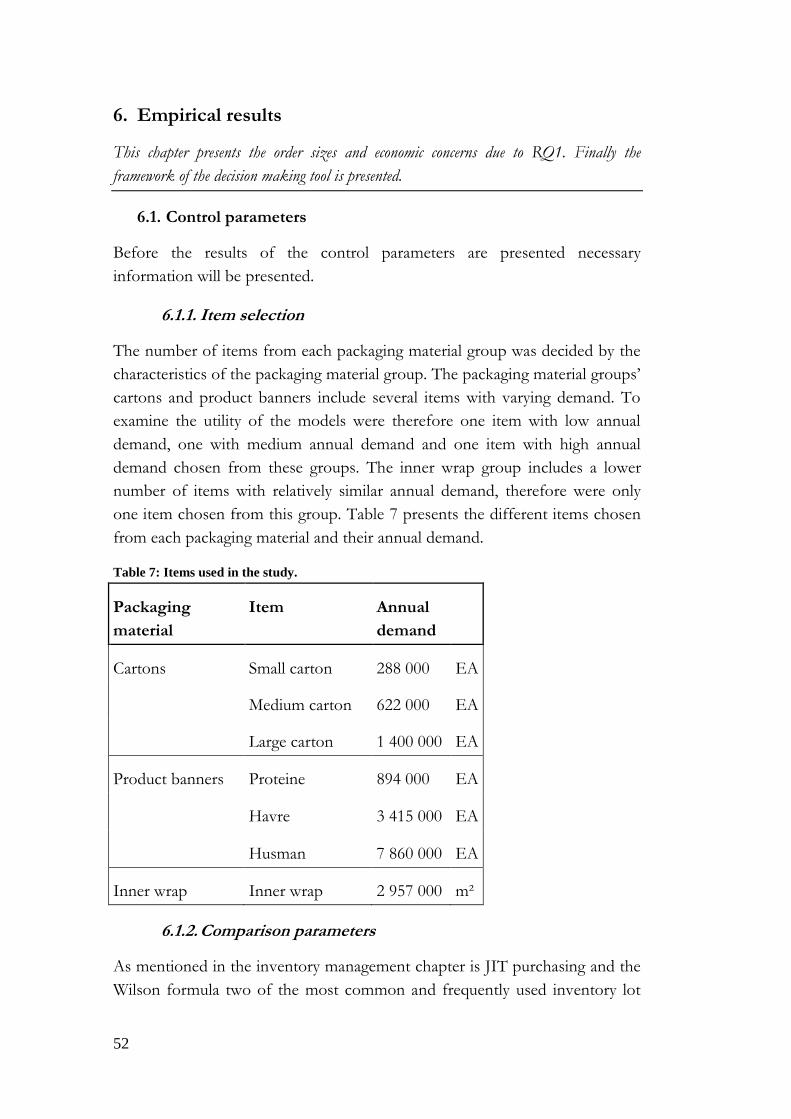
52
6. Empirical results
This chapter presents the order sizes and economic concerns due to RQ1. Finally the
framework of the decision making tool is presented.
6.1. Control parameters
Before the results of the control parameters are presented necessary
information will be presented.
6.1.1. Item selection
The number of items from each packaging material group was decided by the
characteristics of the packaging material group. The packaging material groups’
cartons and product banners include several items with varying demand. To
examine the utility of the models were therefore one item with low annual
demand, one with medium annual demand and one item with high annual
demand chosen from these groups. The inner wrap group includes a lower
number of items with relatively similar annual demand, therefore were only
one item chosen from this group. Table 7 presents the different items chosen
from each packaging material and their annual demand.
Table 7: Items used in the study.
Packaging
material
Item Annual
demand
Cartons Small carton 288 000 EA
Medium carton 622 000 EA
Large carton 1 400 000 EA
Product banners Proteine 894 000 EA
Havre 3 415 000 EA
Husman 7 860 000 EA
Inner wrap Inner wrap 2 957 000 m²
6.1.2. Comparison parameters
As mentioned in the inventory management chapter is JIT purchasing and the
Wilson formula two of the most common and frequently used inventory lot
53
sizing models. These two models are therefore used for the comparison. The
comparison is made towards Barilla’s present purchasing strategy.
Order sizes
The calculations aim to show the consequences of changing order size. The
different methods used to determine the order sizes are EOQ, JIT1 and JIT2
and these will be compared with Barilla’s present order size.
Barilla’s present purchasing strategy has been determined by studying the
history from their business system SAP. These purchasing records show when
an order is placed and its size. Order sizes due to JIT purchasing are in this
study determined as a 25% (JIT 1) and 50% (JIT2) lower than Barilla’s present
order quantity. The order quantities of JIT purchasing were determined in
consultation with Barilla’s new warehouse manager and can be motivated by a
gradual implementation of JIT purchasing. The EOQ can be determined by
equation 8. Order sizes are presented in either square meter (m2) or number of
pieces (e.a).
Safety stock
This study uses the simplified SERV2 approach (equation 21) to calculate the
safety stocks. The calculations uses forecast errors from the first of January
2014 and up to the beginning of April 2015 for each item. This period was set
to get at least teen measures for each item. The safety factor “k”, was
determined with table 13 in appendix E. Barilla did not have an value for their
service level, so in this study the value was assumed to be same as their OFR,
98,9 %. The present safety stock levels were given by the material procurers.
Average stock
Average stock is presented in pallets, this to give the reader an overview of the
tied warehouse area. The value of average stock is determined with equation 5.
ITO
The inventory turnover is determined with equation 4, and is used as a key
ratio to measure the holding costs of the packaging materials.
6.2. Order size results
In this section are only the results for product banners presented. The
packaging group cartons are relatively like the banner category and are
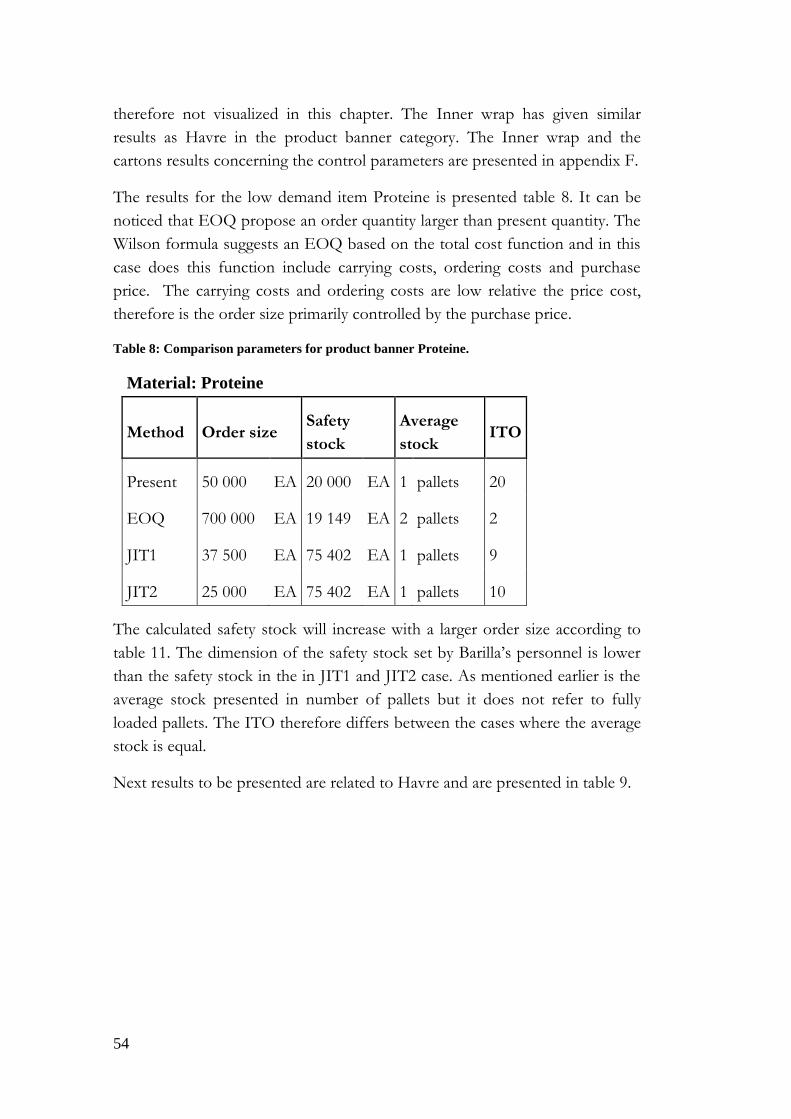
54
therefore not visualized in this chapter. The Inner wrap has given similar
results as Havre in the product banner category. The Inner wrap and the
cartons results concerning the control parameters are presented in appendix F.
The results for the low demand item Proteine is presented table 8. It can be
noticed that EOQ propose an order quantity larger than present quantity. The
Wilson formula suggests an EOQ based on the total cost function and in this
case does this function include carrying costs, ordering costs and purchase
price. The carrying costs and ordering costs are low relative the price cost,
therefore is the order size primarily controlled by the purchase price.
Table 8: Comparison parameters for product banner Proteine.
Material: Proteine
Method Order size Safety
stock
Average
stock ITO
Present 50 000 EA 20 000 EA 1 pallets 20
EOQ 700 000 EA 19 149 EA 2 pallets 2
JIT1 37 500 EA 75 402 EA 1 pallets 9
JIT2 25 000 EA 75 402 EA 1 pallets 10
The calculated safety stock will increase with a larger order size according to
table 11. The dimension of the safety stock set by Barilla’s personnel is lower
than the safety stock in the in JIT1 and JIT2 case. As mentioned earlier is the
average stock presented in number of pallets but it does not refer to fully
loaded pallets. The ITO therefore differs between the cases where the average
stock is equal.
Next results to be presented are related to Havre and are presented in table 9.
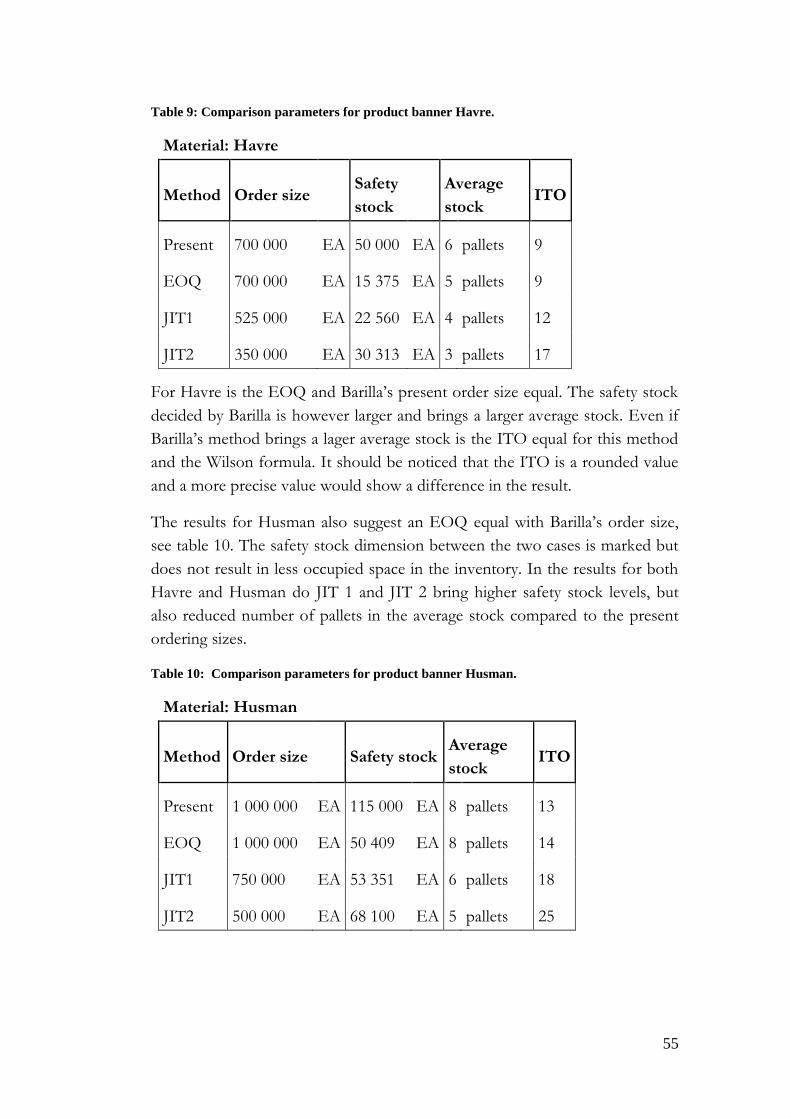
55
Table 9: Comparison parameters for product banner Havre.
Material: Havre
Method Order size Safety
stock
Average
stock ITO
Present 700 000 EA 50 000 EA 6 pallets 9
EOQ 700 000 EA 15 375 EA 5 pallets 9
JIT1 525 000 EA 22 560 EA 4 pallets 12
JIT2 350 000 EA 30 313 EA 3 pallets 17
For Havre is the EOQ and Barilla’s present order size equal. The safety stock
decided by Barilla is however larger and brings a larger average stock. Even if
Barilla’s method brings a lager average stock is the ITO equal for this method
and the Wilson formula. It should be noticed that the ITO is a rounded value
and a more precise value would show a difference in the result.
The results for Husman also suggest an EOQ equal with Barilla’s order size,
see table 10. The safety stock dimension between the two cases is marked but
does not result in less occupied space in the inventory. In the results for both
Havre and Husman do JIT 1 and JIT 2 bring higher safety stock levels, but
also reduced number of pallets in the average stock compared to the present
ordering sizes.
Table 10: Comparison parameters for product banner Husman.
Material: Husman
Method Order size Safety stock Average
stock ITO
Present 1 000 000 EA 115 000 EA 8 pallets 13
EOQ 1 000 000 EA 50 409 EA 8 pallets 14
JIT1 750 000 EA 53 351 EA 6 pallets 18
JIT2 500 000 EA 68 100 EA 5 pallets 25
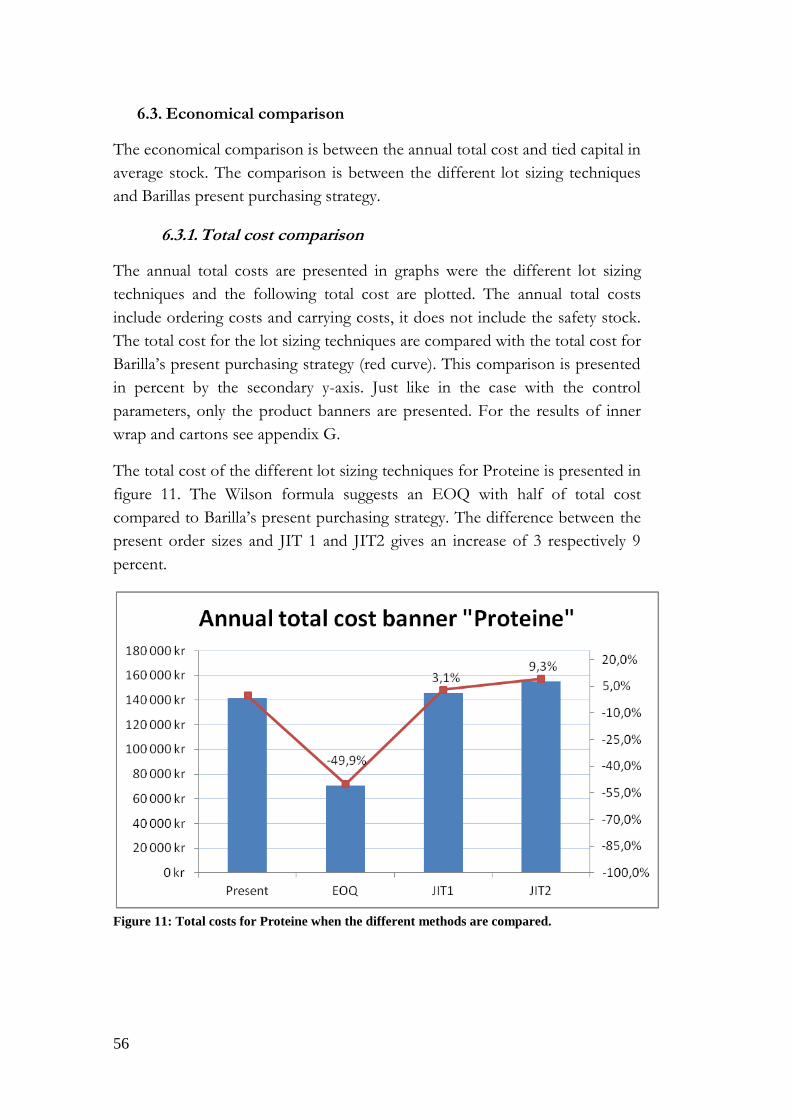
56
6.3. Economical comparison
The economical comparison is between the annual total cost and tied capital in
average stock. The comparison is between the different lot sizing techniques
and Barillas present purchasing strategy.
6.3.1. Total cost comparison
The annual total costs are presented in graphs were the different lot sizing
techniques and the following total cost are plotted. The annual total costs
include ordering costs and carrying costs, it does not include the safety stock.
The total cost for the lot sizing techniques are compared with the total cost for
Barilla’s present purchasing strategy (red curve). This comparison is presented
in percent by the secondary y-axis. Just like in the case with the control
parameters, only the product banners are presented. For the results of inner
wrap and cartons see appendix G.
The total cost of the different lot sizing techniques for Proteine is presented in
figure 11. The Wilson formula suggests an EOQ with half of total cost
compared to Barilla’s present purchasing strategy. The difference between the
present order sizes and JIT 1 and JIT2 gives an increase of 3 respectively 9
percent.
Figure 11: Total costs for Proteine when the different methods are compared.

57
The comparison for Havre shows that the annual total cost for EOQ and
present purchases is equal, see figure 12. This comes naturally since the two
methods calls for the same order quantity.
Figure 12: Total costs for Havre when the different methods are compared. It is important to
note that the y-axis does not start at 0.
Just like in the case with Havre do EOQ and the present strategy result in an
equal annual total cost for Husman, see figure 13.
Figure 13: Total costs for Husman when the different methods are compared. It is important
to note that the y-axis does not start at 0.
The difference between JIT1 and JIT2 and the present methods differ in the
different figures and the reason behind this is the pricing by the supplier. The
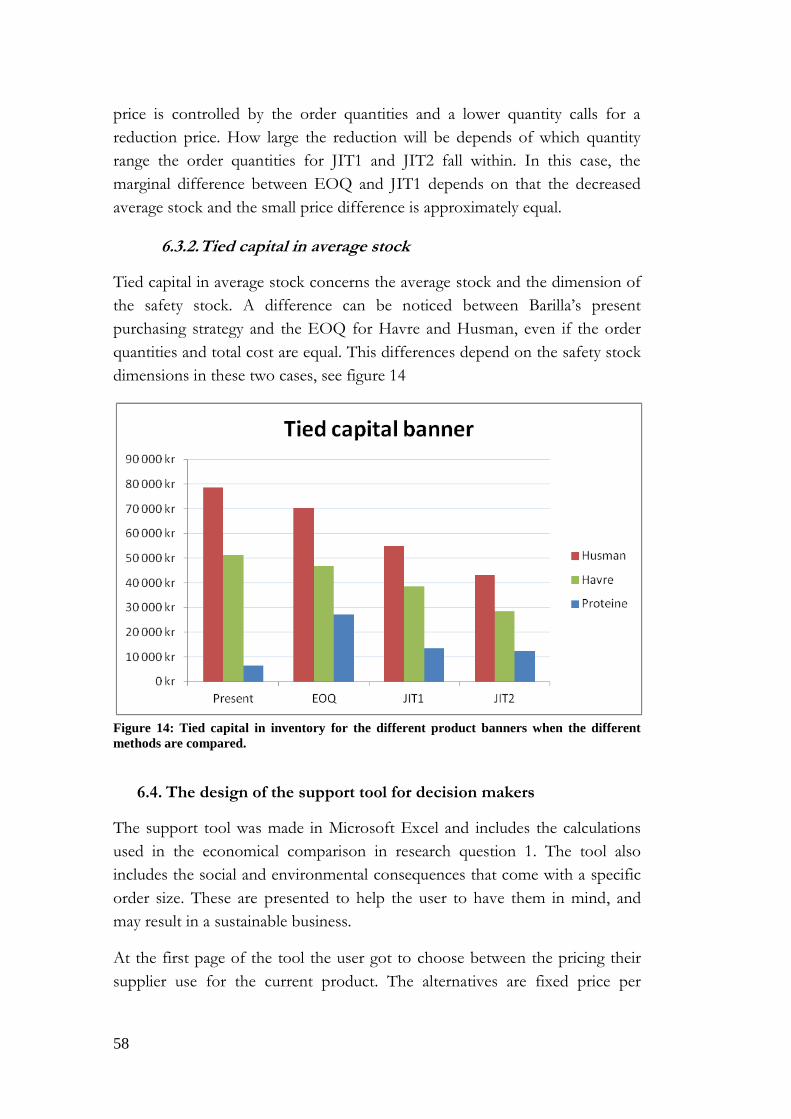
58
price is controlled by the order quantities and a lower quantity calls for a
reduction price. How large the reduction will be depends of which quantity
range the order quantities for JIT1 and JIT2 fall within. In this case, the
marginal difference between EOQ and JIT1 depends on that the decreased
average stock and the small price difference is approximately equal.
6.3.2. Tied capital in average stock
Tied capital in average stock concerns the average stock and the dimension of
the safety stock. A difference can be noticed between Barilla’s present
purchasing strategy and the EOQ for Havre and Husman, even if the order
quantities and total cost are equal. This differences depend on the safety stock
dimensions in these two cases, see figure 14
Figure 14: Tied capital in inventory for the different product banners when the different
methods are compared.
6.4. The design of the support tool for decision makers
The support tool was made in Microsoft Excel and includes the calculations
used in the economical comparison in research question 1. The tool also
includes the social and environmental consequences that come with a specific
order size. These are presented to help the user to have them in mind, and
may result in a sustainable business.
At the first page of the tool the user got to choose between the pricing their
supplier use for the current product. The alternatives are fixed price per
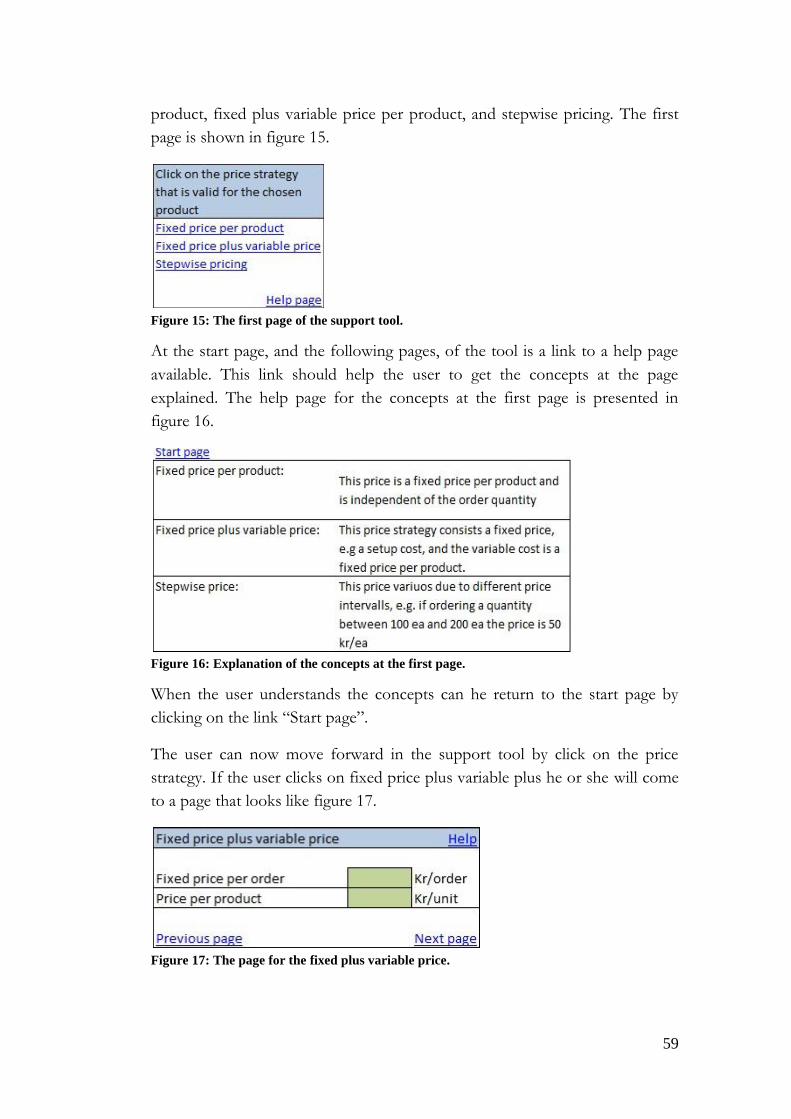
59
product, fixed plus variable price per product, and stepwise pricing. The first
page is shown in figure 15.
Figure 15: The first page of the support tool.
At the start page, and the following pages, of the tool is a link to a help page
available. This link should help the user to get the concepts at the page
explained. The help page for the concepts at the first page is presented in
figure 16.
Figure 16: Explanation of the concepts at the first page.
When the user understands the concepts can he return to the start page by
clicking on the link “Start page”.
The user can now move forward in the support tool by click on the price
strategy. If the user clicks on fixed price plus variable plus he or she will come
to a page that looks like figure 17.
Figure 17: The page for the fixed plus variable price.

60
When the price for the product is set the user will come to a page were the
current order size and safety stock should be specified. This page is shown in
figure 18.
Figure 18: Current work
The page after “Current work” is the page where all parameters should be
specified. At this page is also the user asked to define their desired percentage
reduction of the current order quantity according JIT purchasing. This page is
shown in figure 19.
Figure 19: Necessary parameters for calculations.
Next page in the support tool presents the economical (see figure 20), and
environmental and social consequences (see figure 21) with each order size, i.e.
current order size, EOQ, and JIT 1 and 2.
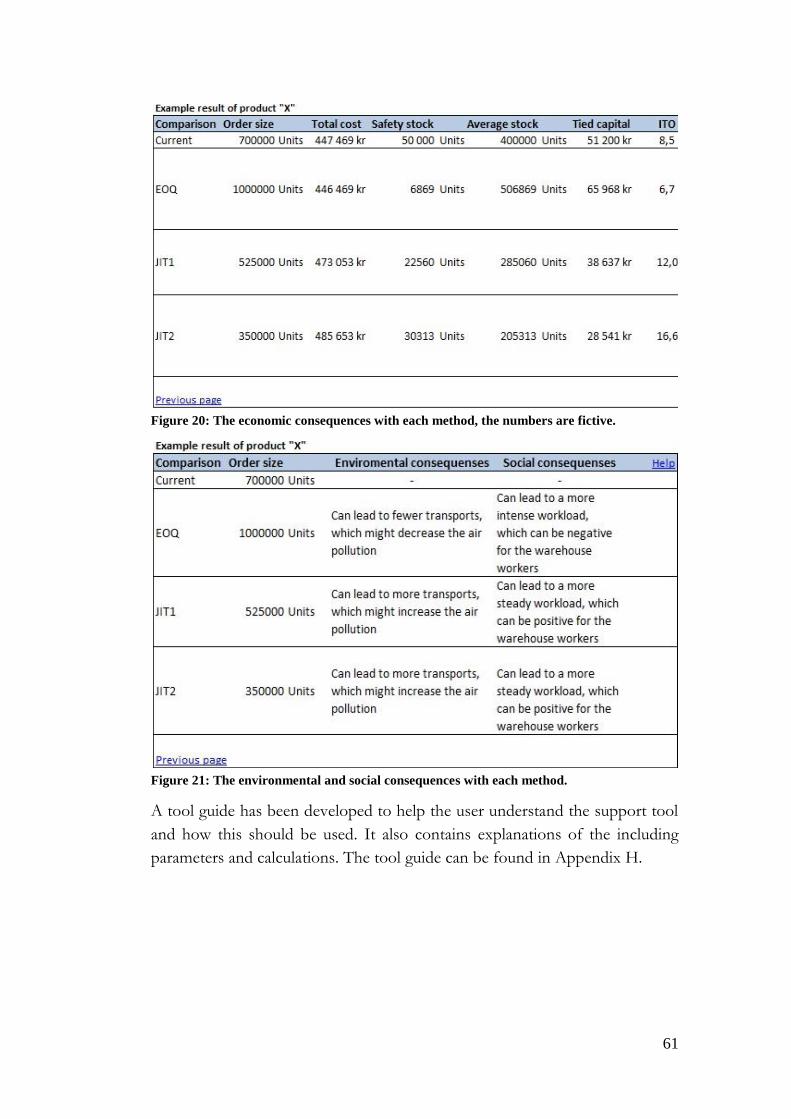
61
Figure 20: The economic consequences with each method, the numbers are fictive.
Figure 21: The environmental and social consequences with each method.
A tool guide has been developed to help the user understand the support tool
and how this should be used. It also contains explanations of the including
parameters and calculations. The tool guide can be found in Appendix H.

62
7. Analysis
The analysis is divided into two parts: The first part analyzes the empirical results related to
RQ1 with relevant previous research. The second part is related to the development of the
support tool.
7.1. Barilla’s current working strategy
Low price strategy
Barilla’s current purchasing strategy is price focused. They see a low price as a
major cost saving and do not consider carrying costs. Another cost that is
neglected is the storage costs. Barilla’s strategy thereby deviates from the view
Axelsson and Håkansson (1984) share where the purchase department also
should focus on cost reductions related to inventory carrying. Barilla’s facility
consist several spots with empty spaces and when too large quantities is
bought are these spaces used to store the items. This requires the warehouse
workers to distribute and collect items from several different locations. The
extreme case is when the warehouse workers store items at the fourth or fifth
floor, this leads to an increased amount of internal transportations.
Unnecessary transportation is one of the wastes that JIT strive to eliminate in
the attempt to gain an efficient material flow (Müller 2011). Unnecessary
transportations are unprofitable since the warehouse workers have to use their
working time to travel between different floors. Sometimes they also have to
wait for the elevator to become available, which creates another waste
parameter, i.e. waiting time. Unnecessary transportation and waiting time is
particularly crucial in Barilla’s case since they only got two workers handling
the packaging material. By ordering more effectively Barilla can decrease the
inventory volumes and reduce the operations costs, in terms of elimination of
transports and waiting. They have therefore a possibility to make cost savings
and double the impact on the profitability, just like Axelsson and Håkansson
(1984) claim.
Forecasts
The reason behind late changes in Barilla’s production plan is the
modifications in the forecast from the sales department, but also the wish to
achieve, according to the central planner, a satisfying stock level. The
acquisition of packaging material is based on the central planners forecast
which are made at least three weeks before production start. This requires the
material procurers to update changes to the suppliers. When they change their
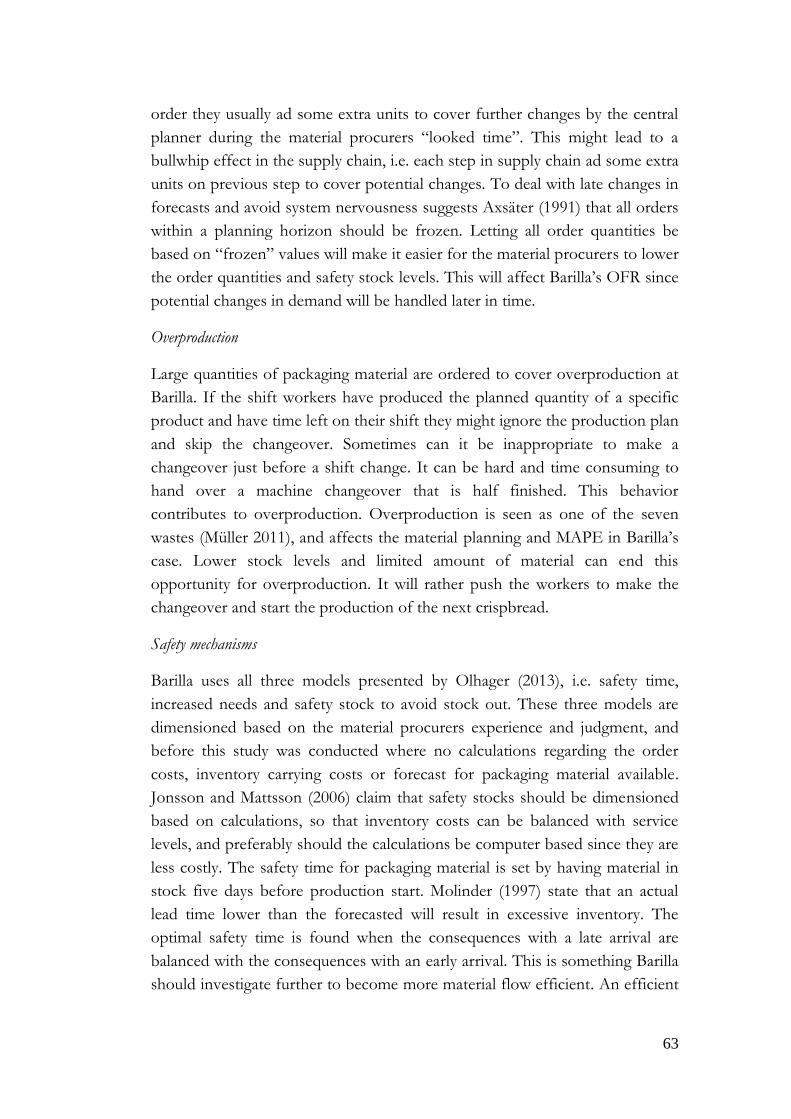
63
order they usually ad some extra units to cover further changes by the central
planner during the material procurers “looked time”. This might lead to a
bullwhip effect in the supply chain, i.e. each step in supply chain ad some extra
units on previous step to cover potential changes. To deal with late changes in
forecasts and avoid system nervousness suggests Axsäter (1991) that all orders
within a planning horizon should be frozen. Letting all order quantities be
based on “frozen” values will make it easier for the material procurers to lower
the order quantities and safety stock levels. This will affect Barilla’s OFR since
potential changes in demand will be handled later in time.
Overproduction
Large quantities of packaging material are ordered to cover overproduction at
Barilla. If the shift workers have produced the planned quantity of a specific
product and have time left on their shift they might ignore the production plan
and skip the changeover. Sometimes can it be inappropriate to make a
changeover just before a shift change. It can be hard and time consuming to
hand over a machine changeover that is half finished. This behavior
contributes to overproduction. Overproduction is seen as one of the seven
wastes (Müller 2011), and affects the material planning and MAPE in Barilla’s
case. Lower stock levels and limited amount of material can end this
opportunity for overproduction. It will rather push the workers to make the
changeover and start the production of the next crispbread.
Safety mechanisms
Barilla uses all three models presented by Olhager (2013), i.e. safety time,
increased needs and safety stock to avoid stock out. These three models are
dimensioned based on the material procurers experience and judgment, and
before this study was conducted where no calculations regarding the order
costs, inventory carrying costs or forecast for packaging material available.
Jonsson and Mattsson (2006) claim that safety stocks should be dimensioned
based on calculations, so that inventory costs can be balanced with service
levels, and preferably should the calculations be computer based since they are
less costly. The safety time for packaging material is set by having material in
stock five days before production start. Molinder (1997) state that an actual
lead time lower than the forecasted will result in excessive inventory. The
optimal safety time is found when the consequences with a late arrival are
balanced with the consequences with an early arrival. This is something Barilla
should investigate further to become more material flow efficient. An efficient
64
material flow can according Axelsson and Håkansson (1984) help companies
to become more profitable. As mentioned above, does Barilla also assumes
that the demand of the items will increase after an order is placed. The extra
ordered items result in a higher average stock which Barilla wants to avoid. An
alternative to avoid this is to freeze the production plan. Increased needs can
also be found in incorrect BOM’s. The material procurers at Barilla have
noticed that some BOM’s uses a lower value than the actual consumption for
inner wraps. The actual consumption brings a negative result in SAP leading to
a poor value of MAPE. In order to avoid material shortage under production
the material procurers have to add material. This problem indicates that Barilla
has to review their parameters more frequently just like Jonsson and Mattsson
(2006) found necessary for other Swedish companies.
Different targets
The observant reader might notice that the two performance measures,
MAPE and OFR, are closely linked to the inventory levels. A conflict between
the two measures has also been stressed by the central planner and production
planner, and when conflicts arise so are OFR prioritized leading to a sub
optimization. Barilla will have a hard time keeping their OFR level and at the
same time lower their inventory levels. If they freeze the production plan in an
earlier stage the uncertainties in consumption of packaging material would
decrease and the requirements of production workers would be easier to
predict. Barilla should therefore balance the different target components just
like Oskarsson et al. (2006) mention. One way to find a satisfying inventory
levels is to implement a zero tolerance inventory policy just like Müller (2011)
claims. Barilla can then determine what necessary inventory is or not, e.g. set a
maximum stock level for packaging material.
Suppliers
A thing that makes it hard for the warehouse workers is the undefined delivery
dates. Today can a supplier deliver an order either one day ahead or one day
after the intended arrival date. Orders do also arrive Mondays and Fridays
which they are not allowed to. This may indicate that Barilla does not set
requirements high enough to their suppliers, which is an important matter to
treat according to Axelsson and Håkansson (1984). They could for instance
apply a timeslot for the arrival of an order just like in Oskarsson et al. (2006)
description of JIT deliveries. This will push the supplier to deliver orders at
right time.
65
Barilla uses the traditional working strategy that Axelsson and Håkansson
(1984) mention and focus on a low unit price. Barilla should instead focus on
implementing parameters like supplier adaptability, possibility to a long-term
relation, supplier performance (Axelsson & Håkansson 1984), product quality
(Raut et al. 2010 ; Sen et al. 2008) and also suppler policies (Karamani et al.
2012). Barilla also use the traditional delivery approach found in Oskarsson et
al. (2006). Some of Barilla’s suppliers have bad delivery performance, and
requires Barilla to order greater quantities than the actual demand. The
interviews revealed that Barilla is accepting late delivery performance and
deficient product quality to a certain degree. This could be avoided if Barilla
focused on better supplier relations and higher supplier requirements, just like
Axelsson and Håkansson (1984) argues. However, the three suppliers that
answered the survey were not so positive to increase the number of delivery
points and decrease the delivery volumes. If Barilla choose to lower the order
quantities it is important for them to have a dialog with these suppliers about
the increased number of deliveries, delivery performance and the lack of
quality on the products.
Marketing strategy
The marketing strategy at Barilla has change over the last decade. For about
ten years ago, they standardized the product range of cartons. This
standardization led to an eased work load for both the material procurements
and the warehouse workers. Both departments had benefits from this change,
the warehouse workers have fewer articles to keep track of and the material
procurers have fewer articles to order. Letting the material procurers be
involved in the product development processes is something Oskarsson et al.
(2006) propose. This can increase the usage of standardized materials and
components. From an economical view is this change profitable. This because
of the lower unit price and time saved for both the material procurers and the
warehouse workers. It is worth mentioning that every saved Swedish crown
from purchases may contribute to a much higher profit, than the
corresponding case for every extra sold crown (Axelsson & Håkansson 1984).
However, the marketing department points out that Barilla sell more products
if the products are unique. The authors cannot determine if the whole
organization will become more profitable, this requires a more depth analysis
within this specific area.
66
Quality
Poor quality of cartons is mainly related to either damaged incoming goods or
long time in stock. Regardless of source of error so are damaged goods
primarily noticed in production since no quality control is made at the arrival.
Cartons with poor quality leads to that the workers have to hand-bent all
cartons so they can be fit in the packaging machine. If Barilla aim to gain an
efficient material flow should the issue of poor quality be dealt with in an early
stage.
As mentioned earlier, Barilla uses the unit price as predominant decision basis.
Since the quality aspect is partially left out, items might be delivered with poor
quality. This is something Barilla should investigate further. Poor quality
because of long time in stock can be handled by a reduction of the order
quantities. Lower order quantities results in reduced inventory level and fewer
items lead to an earlier consumption and reduced lead time. Lower inventory
levels help to detect defect items earlier (Kim & Ha 2003). Lowered inventory
levels will also ease the warehouse workers usability of the FIFO principle.
Today are some of the inventories so large so the FIFO principle cannot be
used at all because of bad accessibility of items.
Warehouse workers
The warehouse activities related to the packaging material at Barilla are poorly
integrated with the other company functions. Often are decisions made
without involving the warehouse workers leading to they have to adapt and
come up with their own solutions. As mentioned earlier in the analysis Barilla
store items at fourth and fifth floor. This solution is necessary since the
inventory levels in the warehouse of packaging material are too high.
Another indication of the poor internal communication between the
warehouse workers and company functions is the arrival of deliveries at
Mondays and Fridays. During the interviews did it emerge that interviewees
did not know that deliveries arrived at these days.
The bad communication became extra obvious when the warehouse workers
revealed that they did not know who to contact in some issues, and that they
felt taken for granted and wasn’t given feedback sometimes. These examples
can be related to Chikán’s (2011) definition of the old inventory management
paradigm, where inventories are separately managed from other company
functions. This poor integration of the warehouse activities at Barilla shows
67
another view of inventory management than Glock et al. (2014) claim, i.e. that
inventory management is one of the most important operational activities for
industrial companies.
7.2. Economical comparison
Product banners
The result for Proteine (table 8) shows that EOQ suggest a much larger order
quantity than Barilla’s present order quantity. Ordering according EOQ will
not bring a large impact on the average stock, the difference is only one pallet.
This results in a total average stock on two pallets. The space tied in the
average stock will however only be one pallet in area since these two pallets
can be stacked on height. The material handling of Proteine will not bring
remarkably higher workload for the workers. Ordering according EOQ will
bring more work when the order arrives since more pallets are ordered, but
will not affect their daily work significant. The number of transports for
Proteine may be affected if more pallets are ordered at the same time, but
since it only concerns delivering three more pallets will it probably not bring
any bigger changes for the supplier. Ordering according EOQ will lower the
annual total costs with 70 000 kr compared to the present quantities. The tied
capital in average stock will increase with 21 000 kr. JIT1 and JIT2 are not
interesting for this comparison since the effect by implementing a just-in-time
approach will have low impact on the flow efficiency. It will instead result in
increased annual costs compared to present quantities. Instead of becoming
more flow efficient or found their ordering on present quantities should
Barilla therefore consider purchasing larger quantities. Barilla should, however,
have in mind that their current marketing strategy can result in scrapping of
Proteine banners.
The numerical results for Husman show that the difference between the
annual total costs for EOQ, the present quantities, and JIT1 are minimal.
Ordering according JIT1’s quantities will lower the average stock with two
pallets, and thereby tie will less capital in average stock. Ordering according
JIT1 will also improve the situation for the workers without increasing the
annual total costs. By using JIT1, the frequency of the deliveries can be
affected since a lower quantity comes with each delivery. This can lead to
some increased environmental impact. The difference in order quantity
between the present quantity and JIT1 is only three and half pallet, and will
not probably impact the amount of deliveries. Compared to the other methods
68
will JIT2 increase the total costs with 60 000 kr and tie less capital in average
stock. The difference between tied capital in average stock for JIT1 and JIT2 is
15 000 kr. With respect to the increased total cost and the low effect by
lowering the order quantities further is JIT2 less interesting than JIT1. If
Barilla wants to become more flow efficient, lower their tied capital, and
improve the workload for the warehouse workers, without increasing the total
costs heavily are JIT1 worth to be considered.
Cartons
Just like in the case with the low demand item for product banners are the
benefits of adapting JIT1 or JIT2 insignificant for the small carton. JIT1 brings
slightly higher total costs, 14 000 kr in difference, but release only one pallet in
average stock. JIT2 increase the total costs with 45 000 kr and releases two
pallets in average stock. These results indicate that Barilla’s present order
quantity and dimension of safety stock is well dimensioned. The Wilson
formula suggest an EOQ with 100 000 pieces more than the present quantity,
which results in an increased average stock with 19 pallets, an increased tied
area by six pallets, total cost reduction with 29 000 kr per year, more intense
workload for the warehouse workers and probably a marginal reduction of
transports. EOQ is not therefore an alternative for Barilla since their main
goals are to release warehouse space, reduce tied capital and improve the
workload for the warehouse workers.
Large cartons are the item with the highest ITO under Barilla’s current
purchasing strategy. Having high ITO for large carton is a necessity for Barilla
since these ties a large warehouse area. The present order quantities are 50,000
EA and results in an average stock of 65 pallets and 66 000 kr tied in average
stock. Ordering according an EOQ would result in an average stock
containing 154 pallets, a number that is too large for Barilla. More interesting
results are instead given by JIT1 and JIT2. The acquisition of large carton
according JIT1 results in an increased total costs with 31 000 kr. The average
stock then contains 38 pallets, and the capital tied up in stock is 39 000 kr.
Ordering according JIT2 results in 96 000 kr more than the total cost for the
present situation. It brings an average stock on 32 pallets and ties 33 000 kr.
Both of JIT approaches decrease roughly half of the safety stock compared to
the current strategy. This would lead to a large release of warehouse space and
open-up an opportunity to apply the FIFO principle easier. Lowering order
quantities and order points will result in a steady workload for the warehouse
workers. Increased orders will not necessarily lead to more shipments since the
69
suppliers are open to co-transport of items. If this opportunity is neglected,
ordering according JIT will require more deliveries and a following negative
impact on the environment in terms of greater CO2 emissions. It is also
important to consider that the dimension of orders may affect the
environmental impact from the suppliers’ production. One supplier was
negative to a change while the other two were neutral.
The preferable method of JIT1 and JIT2 can be found by an examination of
the effect on average stock when the total cost increase. The effect of going
towards JIT1 instead JIT2 can be seen as more favorable since it brings a
larger reduction in average stock per invested Swedish crown. If Barilla wants
to become more flow efficient they are recommended to take a first step and
order according to JIT1. When the order quantities are lowered to JIT1 a new
evaluation of the situation can be done to see if it is profitable to lower the
order quantity further.
Inner wrap
The inner wrap group is rather special since the majority of the included items
have a consistent and high demand. The results from the inner wrap studied in
this case can therefore be generalized to create an augmented effect.
The order quantity for the studied inner wrap is today at 150 000 m², which
results in an average stock of 21 pallets. Studying the EOQ is not interesting
for the inner wrap since it suggest an even larger purchasing quantity, which
brings an average stock of 38 pallets. This is not a reasonable dimension of the
average stock just like in the case with large cartons. More interesting is to
compare JIT1 and JIT2 with the present situation. JIT1bring a rise of the
annual total cost with 5 000 kr per year, a reduction in average stock with 10
pallets and a reduction of tied capital in average stock with 9 000 kr. JIT2 have
an annual total cost with 14 000 kr compared to the current situation. The
average stock is reduced with 13 pallets and results in a reduction of tied
capital in average stock with 11 000 kr. Just as in the case of large carton, JIT1
brings a larger reduction in average stock per invested Swedish crown. It is
thereby preferable to have a JIT1 approach to begin with. A reduction of the
order quantities for inner wrap contributes to better working conditions for
the warehouse workers. Frequent deliveries with a lowered number of items
would lead to a steady workload. This could, however, contribute to an
increased number of transports which lead to a negative impact on the
environment in terms of CO2-emissions. The number of transports depends
70
on many different parameters that are not considered in this study, so the
number of transports is hard to determine.
7.3. Characteristics of the support tool
The development of the support tool was foremost founded on the Bouchery
et al. (2012) and Jawad et al. (2013) request of tools focusing on minimize the
environmental impact without reducing the profitability. Jonsson and
Mattsson (2006) remark of the need of an easy and user-friendly software for
order planning, and also inquiry of increased knowledge of planning and
control parameters used for material procurement also formed the basis for
the tool.
The authors therefore aimed to develop an easy, user-friendly, and effective
tool which included economic, environmental and social aspects with
inventory management. To achieve this, was the two most common lot sizing
techniques due to Fazel et al. (1998), EOQ and JIT purchasing, included in the
tool. According Glock et al. (2013) is EOQ a simple and effective calculation
tool to use in inventory management. JIT purchasing is defined on the authors
own interpretations of JIT purchasing presented in previous studies. Mainly,
the authors focused on JIT purchasing as a way to lower the order quantity,
like White et al. (2010) describes JIT and that it requires a gradual
implementation (Kim & Ha 2003). JIT purchasing is therefore defined as a
reduction in percentage of the current order quantity. It also expressed as
gradual reductions, where the first (JIT1) should correspond to a short-term
goal while the other (JIT2) a longer-term goal.
Expectations the authors had of the tool were that it would be user-friendly
and could be used to visualize costs in an easy way. This can result in an
increased knowledge of order planning at Barilla, but also for other companies
since Jonsson and Mattsson (2006) claim that companies possess inadequate
knowledge of order planning. The authors therefore provided the support tool
with a help-page that is possible to reach from each page in the tool, see figure
16.
The support tool was never sent out for confirmation of whether the
requirements above were fulfilled. The new warehouse manager at Barilla was
presented to the tool. He stated that:
71
“The tool can be used in different departments to provide greater knowledge of
order planning, and the impact of order sizes on social, environmental and economic
aspects” – New warehouse manager
The tool will also give Barilla the opportunity to experiment with possible
future scenarios according the new warehouse manager.
Due to its aim of being simple the tool brings some limitations. First, to make
the tool accessible and easily understandable the tool was chosen to be
developed in the well-known program Microsoft Excel. This makes it difficult
to continuously update planning parameters just like Jonsson and Matsson
(2006) asks for, since much of the data that is needed probably is collected
from a business system, which complicates the continuous updating of the
parameter values. Secondly, it is important to notice that the results that are
achieved only gives an overview of annual total costs, warehouse space, and
social and environmental aspects. The tool do not give answers of how the
company should work, there are a lot more of parameters to include when
choosing inventory strategy. Finally, the support tool only suggests possible
environmental and social consequences with the new stated order size. To
ensure these effects a more depth study is necessary. These consequences are
thereby vaguely presented and not founded on calculations because of its
complexity. The support tool cannot be used for minimization of the
environmental impact without reducing the profitability which Bouchery et al.
(2012) and Jawad et al. (2013) asked for. A company’s specific circumstances
are very hard to make general assumptions of. If a company wants to change
their strategy and increase their order sizes the tool suggests a social
consequence in terms of more intense workload for the warehouse workers.
The tool also points out that an increased number of orders can influence the
environment negatively. This due to the assumption of more orders is equal to
more transports, which is a rough assumption and is not always correct.
The fact that the tool includes limitations is seen as natural, especially since it
is a prototype. The limitations do however advocate the potential development
of the tool. Something the authors want to point out specifically is the
integration of the tool into a business system. This would open up
opportunities for easy access within a company, and as well open up
opportunities to base calculations on current values.
72
7.4. Source of error
7.4.1. Correct data
The result of this study depends of the data collected at Barilla. Incorrect data
would result in a misleading result. Some parameter values were not available
at Barilla, which led to assumptions and estimations had to be made. These
assumptions have usually been made together with the supervisor at Barilla.
The values should therefore be reasonable. Assumptions have been presented
at the position in the report where they were made.
The assumptions made in the study have according to the authors’ low impact
on the overall result. The only known assumption that causes notable impact
on the result is the one made with respect to the service level (SERV2) for the
safety stock calculations. This value has not been determined by Barilla when
it came to their warehouse of packaging material. The authors did then assume
that this value to be equal with Barilla’s OFR for their warehouse of finished
goods. More realistic would be if Barilla had a service level slightly higher than
OFR for their warehouse of packaging material, otherwise could it be hard to
maintain the OFR for the inventory of finished goods. Using a service level
equal with the OFR is though seen as more credible than just coming up with
a value. The determination of a service level requires Barilla to have
discussions and analysis.
7.4.2. Survey
A survey was sent to the suppliers of the packaging material to determine
general information about their deliveries, but also their attitude to change the
order quantities and the frequency of the deliveries. The general information
about the deliveries concerned the distance between the supplier and Barilla’s
bakery, number of deliveries they sent each month, and their transportation
equipment. This information was intended for calculations of the CO2
emissions of each delivery. This part was later removed from the thesis since it
was too complicated and time consuming to obtain values, something that the
authors did not expect from the beginning.
The parts from the survey that were used, i.e. the suppliers’ attitude towards a
change from the current state, should be interpreted with respect. Only one
respondent at each supplier company has been asked to answer the survey,
leaving the answers with low validity and reliability. The idea behind the survey
has always been to capture the suppliers overall opinion of changed delivery
73
parameters. Therefore is the survey a secondary part in this study and do not
affecting the results intensively.
7.4.3. Lot-sizing techniques
Wilson formula
The EOQ model assumes a constant demand which is not always the case for
Barilla since many aspects of are regarded when the central planner make the
forecast. This can result in periods with too high or low inventory levels. The
authors claim that the problem with too small order quantities is solved with
the safety stock (something the Wilson formula neglect). Too high inventory
levels cannot be handled in the same way. The effect of these drawbacks can
however be handled by frequent calculations of an EOQ just like Relph &
Newton (2014) claim.
JIT purchasing
Just like with the Wilson formula does JIT purchasing, according to the
definition in this study, use a fixed order quantity. This results in the same
scenario as the Wilson formula. The effects will however become amplified
since JIT purchasing in all cases are smaller than the EOQ.
74
8. Conclusion and further studies
This master thesis comprises the significance of inventory management
principles and purchasing routines. The purpose of studying this is to assess
possibly advantages of changing inventory strategies.
Regarding to research question one, Barilla wants to be more profitable by
release capital, unlock inventory space and keep working in a sustainable way.
To gain these results Barilla has some points they need to improve. There is
important that Barilla increase the interactions between departments and
works against same goals to achieve effectiveness like Oskarsson et al. (2006)
points out. They should consider increasing the accuracy of planned
production, two to three weeks before the production. This affects the extra
amounts of packaging material that is purchased and also held in safety stock.
To ensure the availability of packaging material should Barilla also review their
requirements concerning delivery accuracy, improve their supplier relation,
supplier communication and critical review which suppliers they can build
long-term relations with, which is in line with what Raut et al. (2010) and
Kermani et al. (2012) suggests.
The authors recommend that Barilla should increase the order volumes of low
demanded banners, if they increase their communication with the marketing
department. They should decrease the order volume of the high demanded
cartons, which leads to much released warehouse area to a marginal cost. Also
the order volume of the inner wrap recommends to be decreased to release
warehouse area and capital. These changes could, due to Olhager (2013) and
Müller (2011), make companies more profitable like. This by release inventory
area and tied capital, but also improve their material flow.
With these strategies can Barilla unlock capital, release inventory space and
contribute to a more consistent workload for the warehouse workers. They
will also save money on the low demand products but spent some extra
money on the high demanded products. Barilla can with these inventory
strategies and purchasing routines develop their organization and become
more profitable.
The parameters, methods, and calculations from research question one was
applied into a prototype of a support tool. The methods used were just-in-time
purchasing and the economic order quantity. The order sizes these two models
presents are compared with a company’s current order sizes. Results from the
75
calculations are presented in a table, and the economic results are also
visualized in graphs. Potential social and environmental consequences are
presented for each order size. The tool has been evaluated by the new
warehouse manager at Barilla. He/she found the support tool usable and
thinks it can increase the knowledge about the consequences with different
order sizes. He has also pointed out that it can be used at different
departments to contribute to a shared vision on the company’s inventory
strategy.
Further studies within this research field could focus on a deeper assessment
of how an inventory strategy affects the environmental and social
consequences. A niche that the study could have is to assess how the number
of transports is reformed with changed order volumes, and with this
information develop the tool prototype even further. The tool can then be
used to find an order quantity that minimizes the environmental impact
without reducing the profitability, something Bouchery et al. 2012 and Jawad
et al. 2013 asks for. This can also give companies a guideline of how
sustainable inventory strategies can be achieved. Another suggestion is to test
and confirm the applicability of the tool. This will probably lead to further
development of the tool. Further studies can also focus on integrate the tool in
business systems and open up opportunities for automatic reviews of order
parameters just like Jonsson and Mattsson (2006) find as necessary.
76
References
Arnold, J.R.T. (1991). Introduction to materials management. Englewood Cliffs,
N.J.: Prentice Hall, 1991.
Arslan, M.C. & Turkay, M. (2013). EOQ revisited with sustainability
considerations. Foundations of Computing and Decision Sciences, 38 (4), 223-249.
Axelsson, B. & Håkansson, H. (1984). Inköp för konkurrenskraft. Malmö :
LiberFörlag, 1984 (Stockholm : LiberTryck); 1. ed.
Axsäter, S. (1991). Lagerstyrning. Lund : Studentlitteratur; Stockholm :
Transportforskningsberedningen, 1991 (Lund : Studentlitteratur).
Battini, D., Persona, A., & Sgarbossa, F. (2014). A sustainable EOQ model:
Theoretical formulation and applications. International Journal Of Production
Economics, 149, 145-153.
Bell, J. (2010). Doing Your Research Project : A Guide for First-time Researchers in
Education, Health and Social Science. Maidenhead: McGraw-Hill Education.
Bonney, M. & Jaber, M.Y. (2011). Environmentally responsible inventory
models: Non-classical models for a non-classical era. International Journal of
Production Economics, 133 (1), 43-53.
Borrego, M., Douglas, E.P., & Amelink, C.T. (2009). Quantitative, qualitative,
and mixed research methods in engineering education. Journal of Engineering
Education, 98 (1), 53-66.
Bouchery, Y., Ghaffari, A., Jemai, Z. & Dallery, Y. (2012). Including
sustainability criteria into inventory models. European Journal of Operational
Research, 222 (2), 229-240.
Bryman, A. & Bell, E. (2011). Business research methods. Oxford : Oxford
University Press, cop. 2011; 3. ed.
Bushuev, M.A., Guiffrida1, A., Jaber, M.Y. & Khan, M. (2015). A review of
inventory lot sizing review papers. Management Research Review, 38 (3), 283-298.
Chikán, A. (2011). Managers’ view of a new inventory paradigm. International
Journal of Production Economics, 133 , 54-59.
77
Chyr, F., Lin, T.M. & Ho, C.-. (1990). Comparison between just-in-time and
EOQ system. Engineering Costs and Production Economics, 18 (3), 233-240.
Dahmström, K. (2011). Från datainsamling till rapport : att göra en statistisk
undersökning. Lund : Studentlitteratur, 2011; 5. uppl.
Danese, P., Romano, P. & Bortolotti, T. (2012). JIT production, JIT supply
and performance: Investigating the moderating effects. Industrial Management
and Data Systems, 112 (3), 441-465.
Davino, M., De Simone, V. & Schiraldi, M.M. (2014). Revised MRP for
reducing inventory level and smoothing order releases: A case in
manufacturing industry. Production Planning and Control, 25 (10), 814-820.
Eisenhardt, K.M. (1989). Building Theories from Case Study Research.
Academy of Management Review, 14 (4), 532-550.
Fazel, F., Gilbert, E.W. & Fischer, K.P. (1998). JIT purchasing vs. EOQ with
a price discount: An analytical comparison of inventory costs. International
Journal of Production Economics, 54 (1), 101-109.
Glock, C.H., Grosse, E.H. & Ries, J.M. (2014). The lot sizing problem: A
tertiary study. International Journal of Production Economics, 155 , 39-51.
Hancock, D.R. & Algozzine, R. (2011). Doing case study research : a practical guide
for beginning researchers. New York : Teachers College Press, c2011; 2nd ed.
Isaksson, O.H.D. & Seifert, R.W. (2014). Inventory leanness and the financial
performance of firms. Production Planning & Control, 25 (12), 999-1014.
Iwu, H.C., Ogbonna, C.J., Jude,O. & Onuma, K. G. (2014). Application of
Inventory Model in Determining Stock Control in an Organization. American
Journal of Applied Mathematics and Statistics, 2(5), 307-317.
Jawad, H., Jaber, M.Y. & Bonney, M. (2013). The Economic Order Quantity
model revisited: An Extended Exergy Accounting approach. Journal of Cleaner
Production, .
Jonsson, P. & Mattsson, S. (2006). A longitudinal study of material planning
applications in manufacturing companies. International Journal of Operations and
Production Management, 26 (9), 971-995.
78
Kermani, M.A.M.A., Navidi, H. & Alborzi, F. (2012). A novel method for
supplier selection by two competitors, including multiple criteria. International
Journal of Computer Integrated Manufacturing, 25 (6), 527-535.
Kim, S.-. & Ha, D. (2003). A JIT lot-splitting model for supply chain
management: Enhancing buyer-supplier linkage. International Journal of Production
Economics, 86 (1), 1-10.
Labib, A.W. (2011). A supplier selection model: a comparison of fuzzy logic
and the analytic hierarchy process. International Journal Of Production Research,
49(21), 6287-6299.
Larsen, C. & Thorstenson, A. (2014). The order and volume fill rates in
inventory control systems. International Journal of Production Economics, 147 , 13-
19.
Leseure, M. (2010). Key Concepts in Operations Management. Los Angeles: SAGE
Publications Ltd.
Lindgreen, A., Vanhamme, J., van Raaij, E.M. & Johnston, W.J. (2013). Go
Configure: THE MIX OF PURCHASING PRACTICES TO CHOOSE FOR
YOUR SUPPLY BASE. California management review, 55 (2), 72-96.
Martínez-Jurado, P.J. & Moyano-Fuentes, J. (2014). Lean management, supply
chain management and sustainability: A literature review. Journal of Cleaner
Production, 85, 134-150.
Mattsson, S. (2015). Handbok i materialstyrning - Del B Parametrar och variabler.
[Online] Available from:
http://lagerstyrningsakademin.se/Hbok%20B/b41_berakna_standardavvikels
er.pdf [2015-04-26].
Molinder, A. (1997). Joint optimization of lot-sizes, safety stocks and safety
lead times in an MRP system. International Journal of Production Research, 35 (4),
983-994.
Mollenkopf, D., Stolze, H., Tate, W.L. & Ueltschy, M. (2010). Green, lean, and
global supply chains. International Journal of Physical Distribution and Logistics
Management, 40 (1-2), 14-41.
Müller, M. (2011). Essentials of Inventory Management. New York: AMACOM.
79
Obermaier, R. & Donhauser, A. (2012). Zero inventory and firm performance:
a management paradigm revisited. International Journal of Production Research, 50
(16), 4543-4555.
Olhager, J. (2013). Produktionsekonomi : principer och metoder för utformning, styrning
och utveckling av industriell produktion. Lund : Studentlitteratur, 2013; 2., rev.] uppl.
Oskarsson, B., Ekdahl, B. & Aronsson, H. (2006). Modern logistik : för ökad
lönsamhet. Malmö : Liber, 2006; 3., rev. ed.
Patton, M.Q. (2002). Qualitative research & evaluation methods. London : SAGE,
cop. 2002; 3. ed.
Raut, R.D., Bhasin, H.V. & Kamble, S.S. (2010): Exploring Critical Criteria for
Supplier Selection by CNG/LPG Manufacturers in India-Selection of
Suppliers for Compressed Natural Gas and Liquefied Pretoleum Gas Kit
Manufacturers: A case Study and Proposed Methodology. International Journal of
Business Insights and Transformation, Vol. 3 (2), 35-45.
Relph, G. & Newton, M. (2014). Both Pareto and EOQ have limitations
combining them delivers a powerful management tool for MRP and beyond.
International Journal of Production Economics, 157 , 24-30.
Råde, L. & Westergren, B. (2004). Mathematics handbook for science and engineering.
Lund : Studentlitteratur, 2004; 5., rev. ed.
Roy, M.D., Sana, S.S. & Chaudhuri, K. (2012). An integrated producer–buyer
relationship in the environment of EMQ and JIT production systems.
International Journal of Production Research, 50 (19), 5597-5614.
Samak-Kulkarni, S. & Rajhans, N.R. (2013). Determination of Optimum
Inventory Model for Minimizing Total Inventory Cost. Procedia Engineering, 51 ,
803-809.
Sânchez, A.M. & Pérez, M.P. (2001). Lean indicators and manufacturing
strategies. International Journal of Operations and Production Management, 21 (11),
1433-1451.
Sandelowski, M. (2000). Focus on research methods: Combining qualitative
and quantitative sampling, data collection, and analysis techniques in mixed-
method studies. Research in Nursing and Health, 23 (3), 246-255.
80
Saunders, M., Lewis, P. & Thornhill, A. (2009). Research methods for business
students. Harlow : Financial Times Prentice Hall, 2009; 5. ed.
Schniederjans, M.J. & Cao, Q. (2001). An alternative analysis of inventory
costs of JIT and EOQ purchasing. International Journal of Physical Distribution and
Logistics Management, 31 (2), 109-123.
Schoenherr, T., Modi, S.B., Benton, W.C., Carter, C.R., Choi, T.Y., Larson,
P.D., Leenders, M.R., Mabert, V.A., Narasimhan, R. & Wagner, S.M. (2012).
Research opportunities in purchasing and supply management. International
Journal of Production Research, 50 (16), 4556-4579.
Sen, S., Basligil, H., Sen, C.G. & BaraÇli, H. (2008). A framework for defining
both qualitative and quantitative supplier selection criteria considering the
buyer-supplier integration strategies. International Journal of Production Research, 46
(7), 1825-1845.
Silver, E.A. (1981). OPERATIONS RESEARCH IN INVENTORY
MANAGEMENT: A REVIEW AND CRITIQUE. Operations research, 29 (4),
628-645.
Sugimori, Y., Kusunoki, K., Cho, F. & Uchikawa, S. (1977). Toyota
production system and Kanban system Materialization of just-in-time and
respect-for-human system. International Journal of Production Research, 15 (6), 553.
Tang, O. & Grubbström, R.W. (2002). Planning and replanning the master
production schedule under demand uncertainty. International Journal of Production
Economics, 78 (3), 323-334.
Tyagi, S., Yang, K., Choudhary, A. & Cai, X. (2015). Value stream mapping to
reduce the lead-time of a product development process. International Journal of
Production Economics, 160 , 202-212.
White, R.E., Ojha, D. & Kuo, C.-. (2010). A competitive progression
perspective of JIT systems: Evidence from early US implementations.
International Journal of Production Research, 48 (20), 6103-6124.

81
Appendices
Appendix A – Employees involved packaging material management
Table 11: Some of the interview dates with employees managing packaging material.
Respondent Position in Barilla Date
A Warehouse foreman 2015-03-10
B Material procurers 2015-02-26
C Supply chain controller 2015-03-10
D Inventory worker 2015-03-03
E Purchase manager 2015-03-02
F Production planning
manager
2015-03-09
G Warehouse manager 2015-03-03
H Operator packaging
machine
2015-03-03
I New warehouse manager 2015-03-02
82
Appendix B – Interviews
Interview with participant A - 2015-03-10
Fråga 1. Hur mycket packmaterial kasseras varje år?
Fråga 2. Varför förekommer kassering och när uppstår det vanligtvis?
Fråga 3. Vilken är din allmänna uppfattning av packmateriallagrets storlek?
Fråga 4. Har du några övriga kommentarer gällande packmaterial?
83
Interview with participant B - 2015-02-26
Fråga 1. Hur många veckors ledtid har ni på wellpapp, banderoll samt innerpapp?
Fråga 2. Hur många artiklar inom varje kategori har ni?
Fråga 3. Hur stort är ert säkerhetslager i dagsläget?
Fråga 4. Vilka parametrar tar ni hänsyn till när ni bestämmer säkerhetslagret?
Fråga 5. Hur många veckors ledtid har ni på wellpapp, banderoll samt innerpapp?
84
Interview with participant C - 2015-03-10
Fråga 1. Vad använder ni er av för lagerränta och internränta?
Fråga 2. Hur mycket avviker er faktiska produktion mot produktionsprognoserna?
Fråga 3. Hur följer ni upp avvikelsen? Finns det något nyckeltal/mätetal ni studerar?
Fråga 4. Hur värderar ni risken att få brist på packmaterial?
Fråga 5. Vad har ni för personalkostnader för lagerpersonal samt avrop?
85
Interview with participant D - 2015-03-03
Fråga 1. Hur upplever du flödet av packmaterial in i fabriken?
Fråga 2. Hur påverkas du av det nuvarande flödet av packmaterial in i fabriken?
Fråga 3. Hur ser ett ”optimalt flöde” ut enligt ditt perspektiv?
Fråga 4. Hur får ni reda på att datum och tid för ankomst av ingående gods?
Fråga 5. Hur får ni reda på att ni ska köra ut material till produktion, samt vilka kvantiteter som ska levereras?
86
Fråga 6. Var har ni era olika lagerplatser som ni förvarar packmaterial på?
Fråga 7. Hur mycket tid lägger du på att flytta om material varje dag, så att FIFU följs?
87
Interview with participant E - 2015-03-02
Fråga 1. Hur går er upphandlingsprocess till och vilka parametrar styr kontrakten?
Fråga 2. Vilka leverantörersegenskaper utgår ni från när ni väljer en ny leverantör?
Fråga 3. Då en och samma leverantör producerar flera artiklar, tas det hänsyn till att dessa kan fraktas samtidigt till ert bageri?
Fråga 4. Tar ni hänsyns till er leverantörs produktion vid beställning, t.ex. beställer ni produkter som kan samköras hos er leverantörs produktion?
Fråga 5. Hur bestäms priser?
88
Fråga 6. Hur bestäms orderantal?
Fråga 7. Hur ser du på er lagerkapacitet?
89
Interview with participant F - 2015-03-09
Fråga 1. Vad baseras er produktionsplanering på och hur utförs den?
Fråga 2. Hur sker uppdelningen av produkter på de olika maskinerna?
Fråga 3. Hur ser er produktionsflexibilitet ut?
Fråga 4. Vad gör att det uppstår avvikelser inom produktion?
Fråga 5. Hur stor avvikelse i prognoserna förekommer?
90
Interview with participant G - 2015-03-03
Fråga 1. Hur upplever du samarbetet med era leverantörer?
Fråga 2. Händer det att leveranser kommer försent? Är det vanligt förekommande?
Fråga 3. Förekommer det att leveranser blir så pass sena att de medför produktionsändringar hos er?
Fråga 4. Hur lång tid innan produktion ska material finnas på plats?
91
Interview with participant H - 2015-02-03
Fråga 1. Hur ofta behöver ni fylla på med en ny innerpapprulle?
Fråga 2. Hur ofta behöver ni fylla på med en ny banderollrulle?
Fråga 3. Hur går det till när maskinlagret ska fyllas på?
92
Interview with participant I - 2015-03-09
Fråga 1. Har ni definierat en servicenivå för ert slutlager?
Fråga 2. Har ni beräknat lageromsättningshastigheten för packmaterialet?
Fråga 5. Hur stora är era produktionsavvikelser?
Fråga 4. Har ni upprättat en lagerränta, alt. vad använder ni för kalkylränta?
Fråga 3. Har ni tidigare räknat på era ordersärkostnader och lagerföringskostnader?
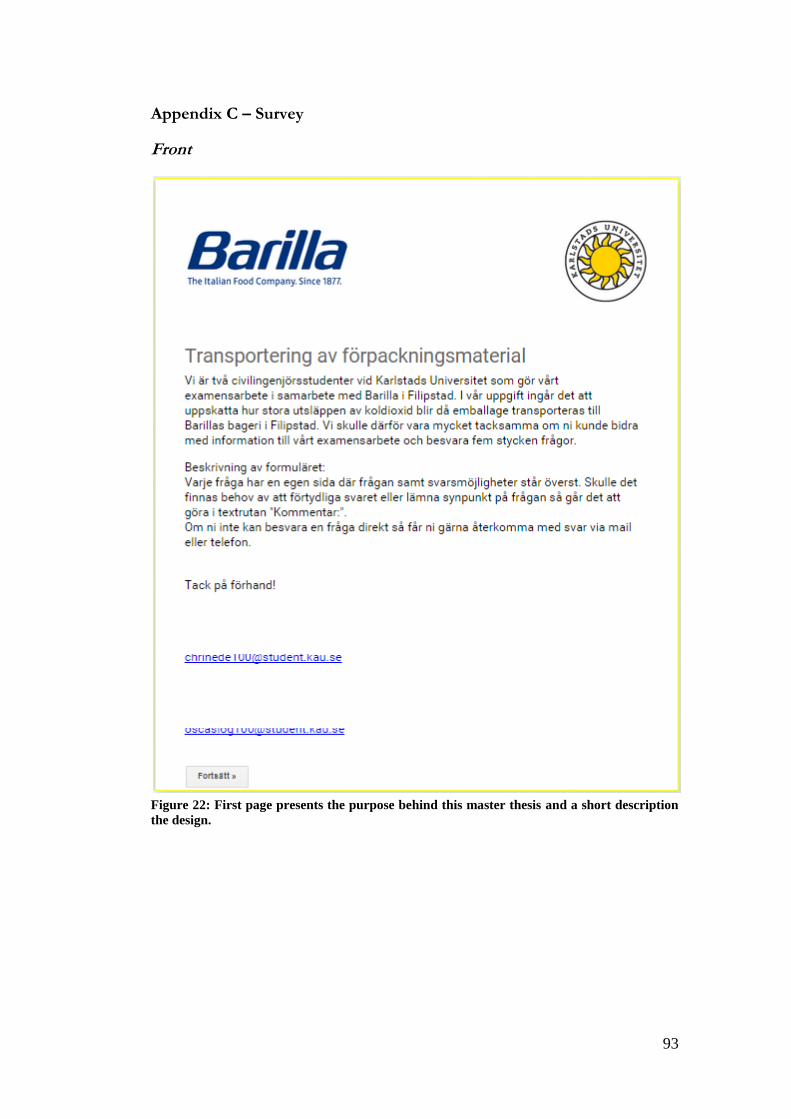
93
Appendix C – Survey
Front
Figure 22: First page presents the purpose behind this master thesis and a short description
the design.

94
First page
Figure 23: Page one includes questions about general delivery information.
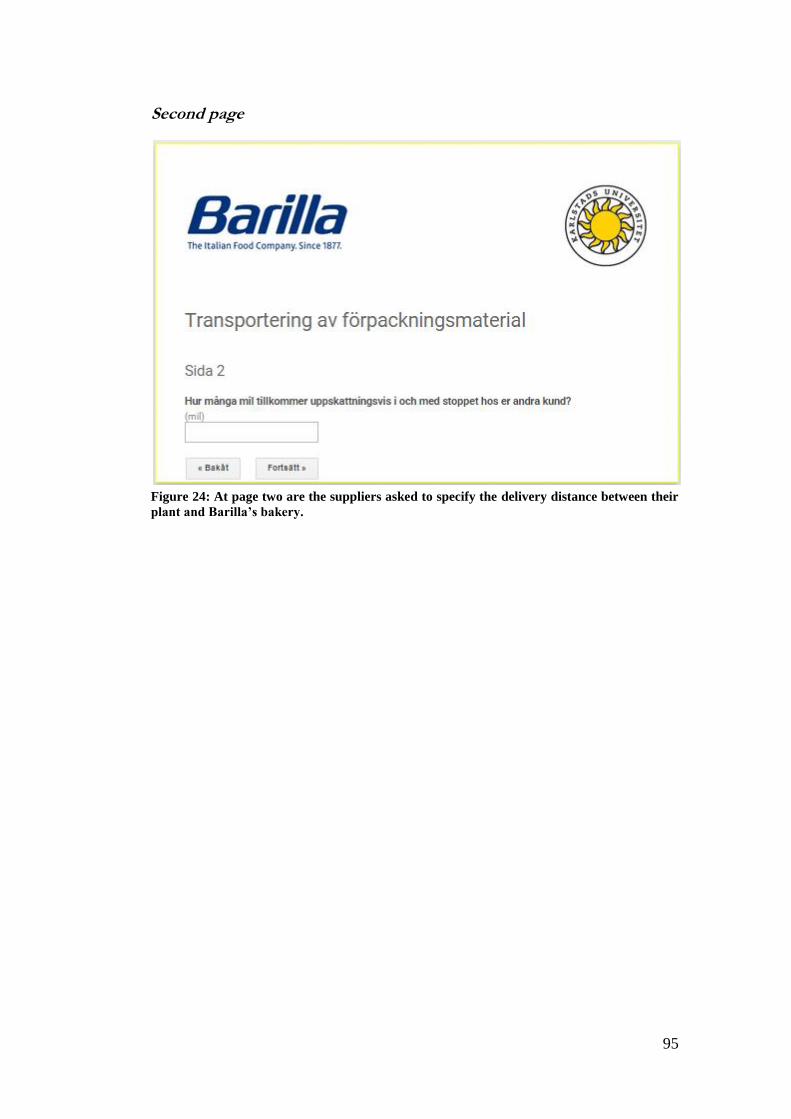
95
Second page
Figure 24: At page two are the suppliers asked to specify the delivery distance between their
plant and Barilla’s bakery.
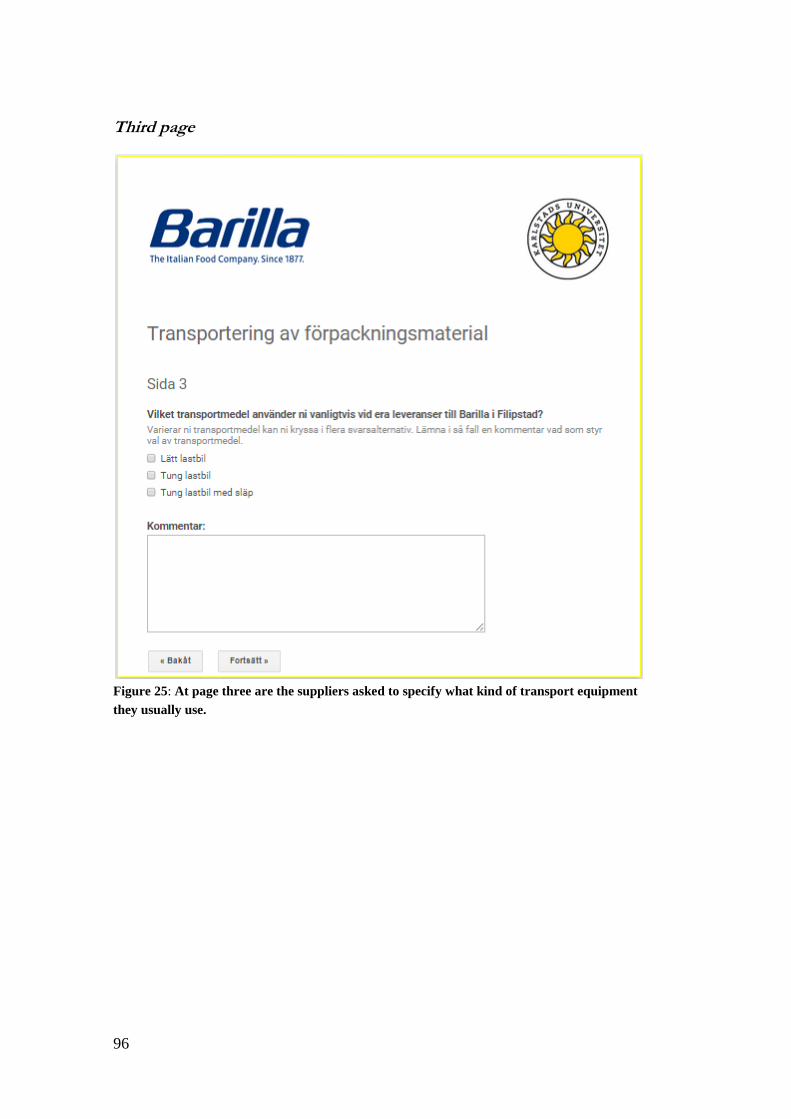
96
Third page
Figure 25: At page three are the suppliers asked to specify what kind of transport equipment
they usually use.
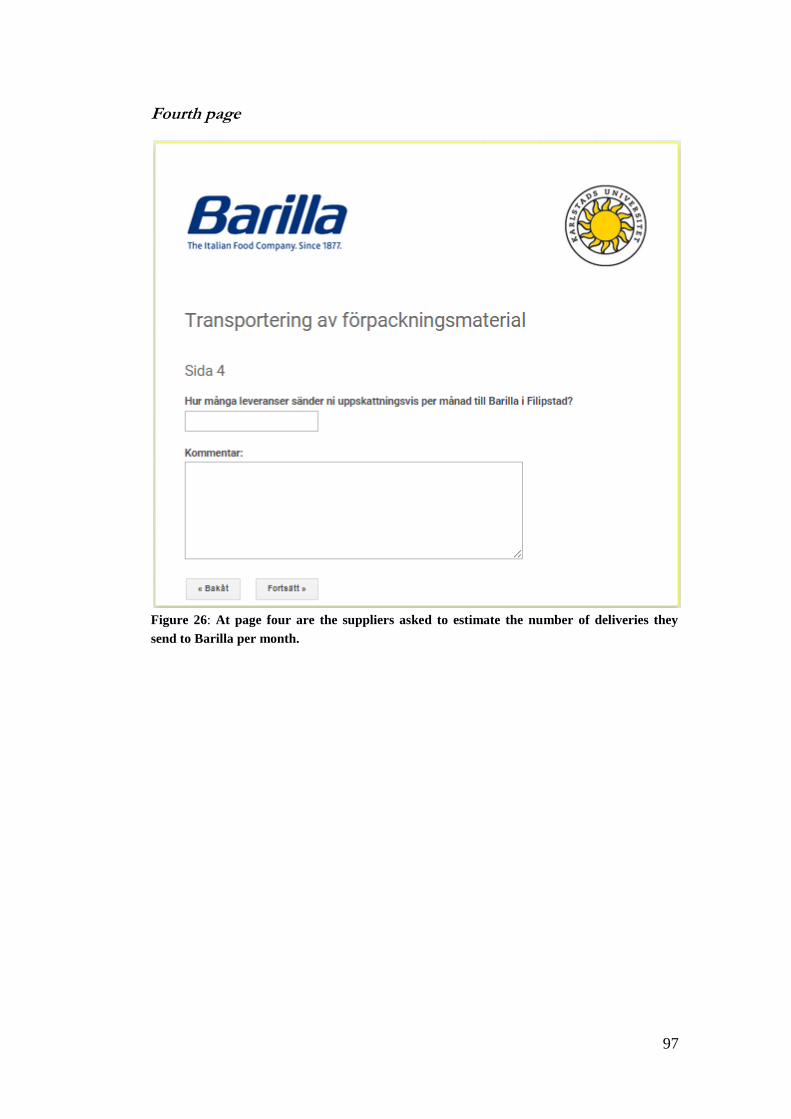
97
Fourth page
Figure 26: At page four are the suppliers asked to estimate the number of deliveries they
send to Barilla per month.
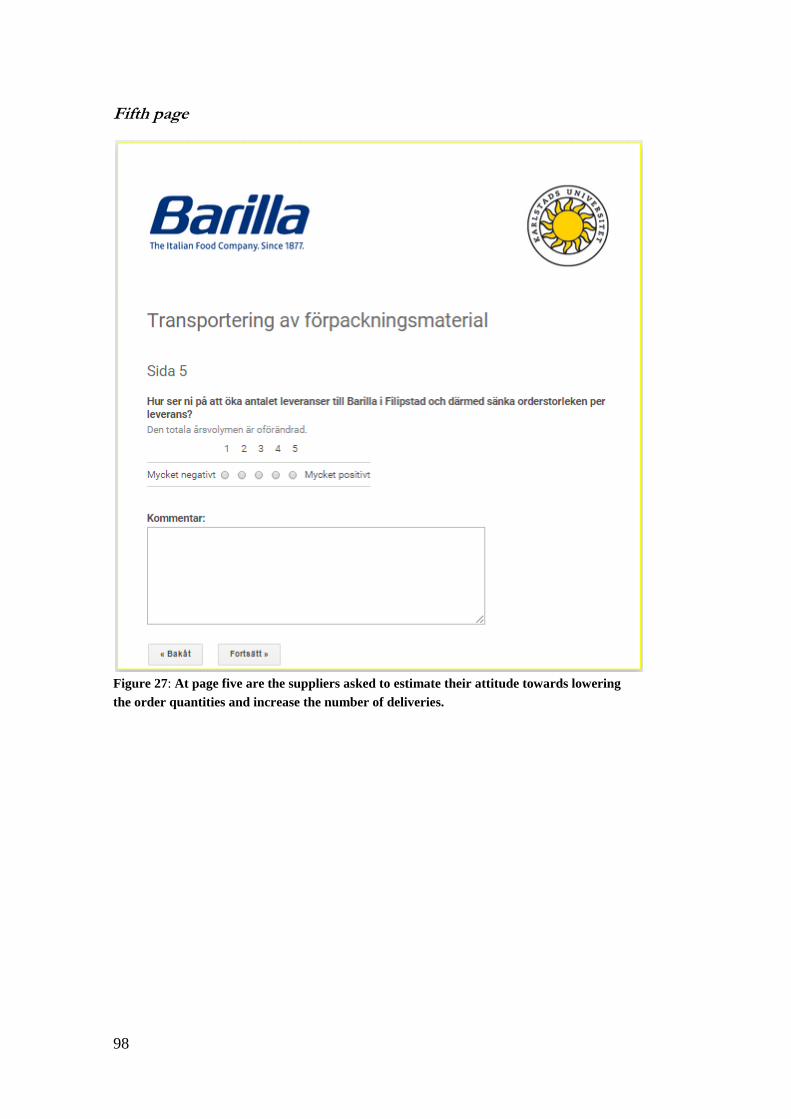
98
Fifth page
Figure 27: At page five are the suppliers asked to estimate their attitude towards lowering
the order quantities and increase the number of deliveries.
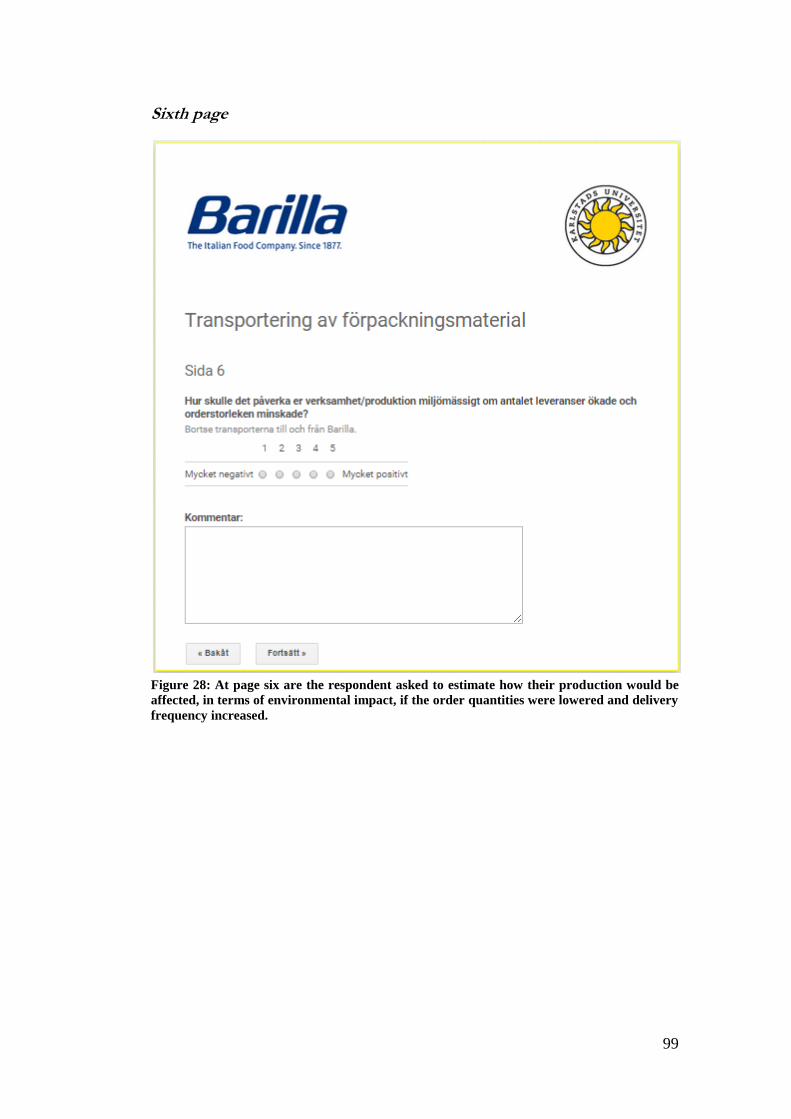
99
Sixth page
Figure 28: At page six are the respondent asked to estimate how their production would be
affected, in terms of environmental impact, if the order quantities were lowered and delivery
frequency increased.
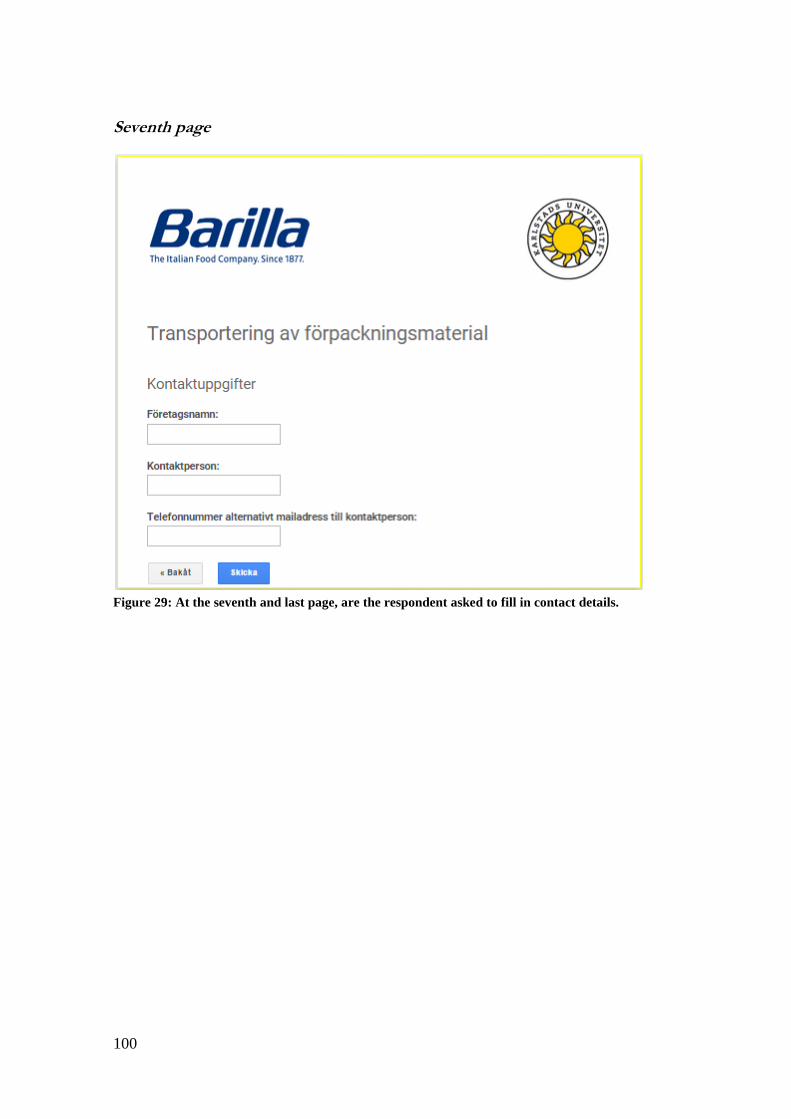
100
Seventh page
Figure 29: At the seventh and last page, are the respondent asked to fill in contact details.
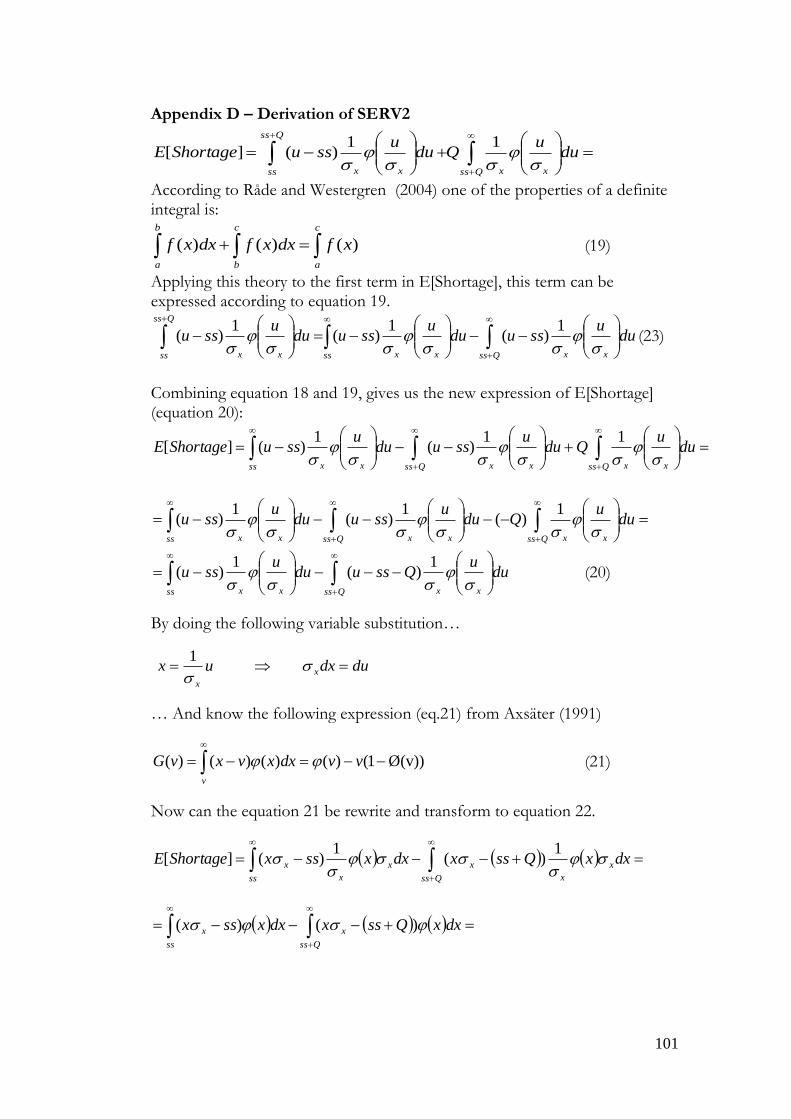
101
Appendix D – Derivation of SERV2
Qss xx
Qss
ss xx
duu
Qduu
ssuShortageE
11)(][
According to Råde and Westergren (2004) one of the properties of a definite integral is:
c
a
b
a
c
b
xfdxxfdxxf )()()( (19)
Applying this theory to the first term in E[Shortage], this term can be expressed according to equation 19.
Qss xxss xx
Qss
ss xx
duu
ssuduu
ssuduu
ssu
1)(
1)(
1)( (23)
Combining equation 18 and 19, gives us the new expression of E[Shortage] (equation 20):
Qss xxQss xxss xx
duu
Qduu
ssuduu
ssuShortageE
11)(
1)(][
Qss xxQss xxss xx
duu
Qduu
ssuduu
ssu
1)(
1)(
1)(
Qss xxss xx
duu
Qssuduu
ssu
1)(
1)( (20)
By doing the following variable substitution…
dudxux x
x
1
… And know the following expression (eq.21) from Axsäter (1991)
Ø(v))1()()()()(
vvdxxvxvGv
(21)
Now can the equation 21 be rewrite and transform to equation 22.
Qss
x
x
x
ss
x
x
x dxxQssxdxxssxShortageE
1
)(1
)(][
Qss
x
ss
x dxxQssxdxxssx )()(
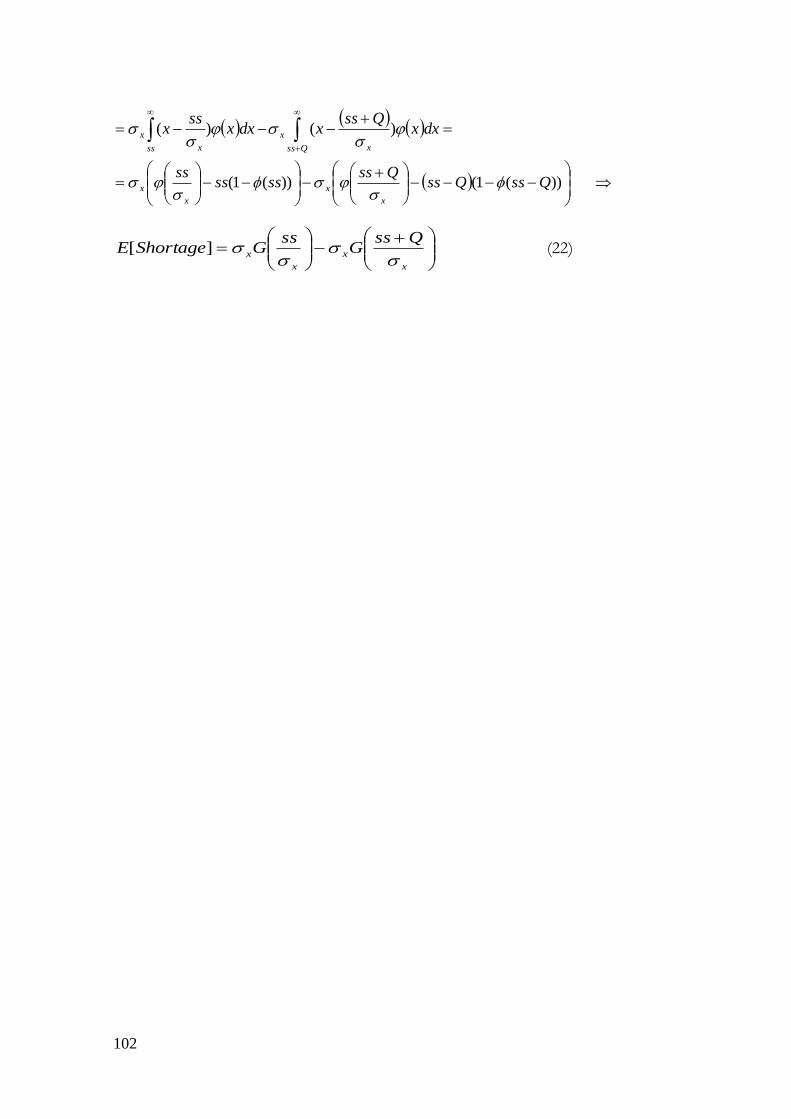
102
Qss x
x
ss x
x dxxQss
xdxxss
x
)()(
))(1())(1( QssQss
Qssssss
ss
x
x
x
x
x
x
x
x
QssG
ssGShortageE
][ (22)
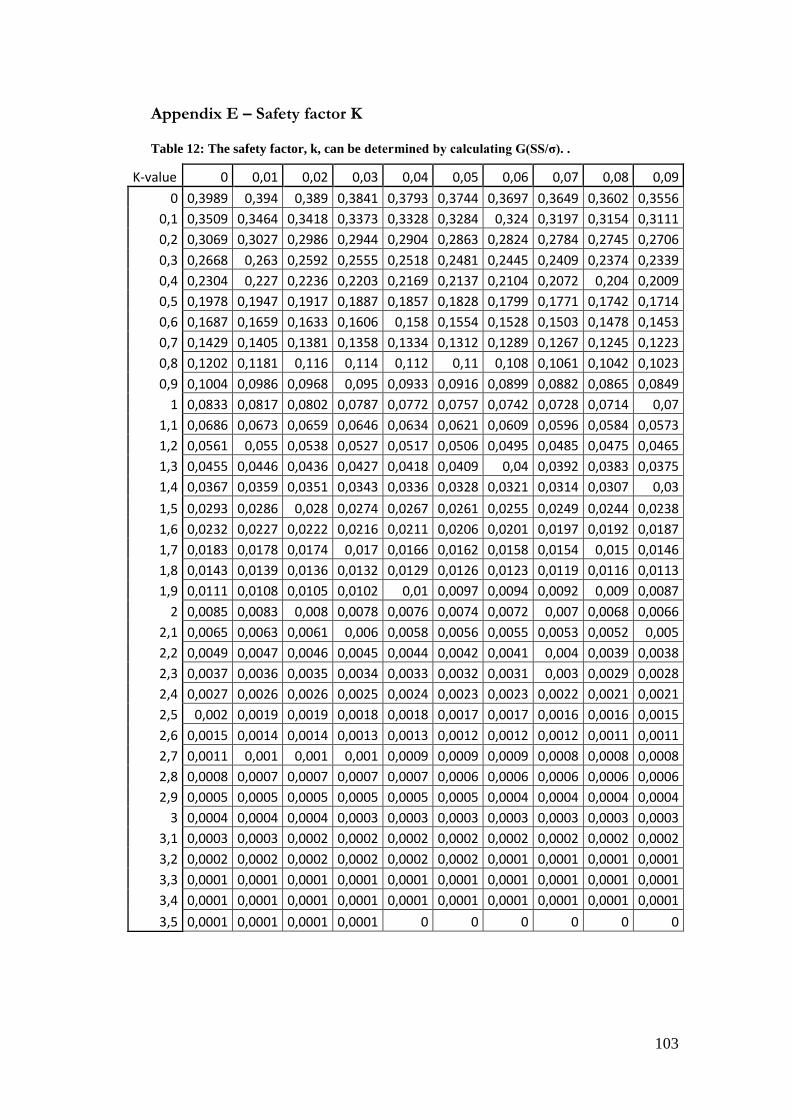
103
Appendix E – Safety factor K
Table 12: The safety factor, k, can be determined by calculating G(SS/σ). .
K-value 0 0,01 0,02 0,03 0,04 0,05 0,06 0,07 0,08 0,09
0 0,3989 0,394 0,389 0,3841 0,3793 0,3744 0,3697 0,3649 0,3602 0,3556
0,1 0,3509 0,3464 0,3418 0,3373 0,3328 0,3284 0,324 0,3197 0,3154 0,3111
0,2 0,3069 0,3027 0,2986 0,2944 0,2904 0,2863 0,2824 0,2784 0,2745 0,2706
0,3 0,2668 0,263 0,2592 0,2555 0,2518 0,2481 0,2445 0,2409 0,2374 0,2339
0,4 0,2304 0,227 0,2236 0,2203 0,2169 0,2137 0,2104 0,2072 0,204 0,2009
0,5 0,1978 0,1947 0,1917 0,1887 0,1857 0,1828 0,1799 0,1771 0,1742 0,1714
0,6 0,1687 0,1659 0,1633 0,1606 0,158 0,1554 0,1528 0,1503 0,1478 0,1453
0,7 0,1429 0,1405 0,1381 0,1358 0,1334 0,1312 0,1289 0,1267 0,1245 0,1223
0,8 0,1202 0,1181 0,116 0,114 0,112 0,11 0,108 0,1061 0,1042 0,1023
0,9 0,1004 0,0986 0,0968 0,095 0,0933 0,0916 0,0899 0,0882 0,0865 0,0849
1 0,0833 0,0817 0,0802 0,0787 0,0772 0,0757 0,0742 0,0728 0,0714 0,07
1,1 0,0686 0,0673 0,0659 0,0646 0,0634 0,0621 0,0609 0,0596 0,0584 0,0573
1,2 0,0561 0,055 0,0538 0,0527 0,0517 0,0506 0,0495 0,0485 0,0475 0,0465
1,3 0,0455 0,0446 0,0436 0,0427 0,0418 0,0409 0,04 0,0392 0,0383 0,0375
1,4 0,0367 0,0359 0,0351 0,0343 0,0336 0,0328 0,0321 0,0314 0,0307 0,03
1,5 0,0293 0,0286 0,028 0,0274 0,0267 0,0261 0,0255 0,0249 0,0244 0,0238
1,6 0,0232 0,0227 0,0222 0,0216 0,0211 0,0206 0,0201 0,0197 0,0192 0,0187
1,7 0,0183 0,0178 0,0174 0,017 0,0166 0,0162 0,0158 0,0154 0,015 0,0146
1,8 0,0143 0,0139 0,0136 0,0132 0,0129 0,0126 0,0123 0,0119 0,0116 0,0113
1,9 0,0111 0,0108 0,0105 0,0102 0,01 0,0097 0,0094 0,0092 0,009 0,0087
2 0,0085 0,0083 0,008 0,0078 0,0076 0,0074 0,0072 0,007 0,0068 0,0066
2,1 0,0065 0,0063 0,0061 0,006 0,0058 0,0056 0,0055 0,0053 0,0052 0,005
2,2 0,0049 0,0047 0,0046 0,0045 0,0044 0,0042 0,0041 0,004 0,0039 0,0038
2,3 0,0037 0,0036 0,0035 0,0034 0,0033 0,0032 0,0031 0,003 0,0029 0,0028
2,4 0,0027 0,0026 0,0026 0,0025 0,0024 0,0023 0,0023 0,0022 0,0021 0,0021
2,5 0,002 0,0019 0,0019 0,0018 0,0018 0,0017 0,0017 0,0016 0,0016 0,0015
2,6 0,0015 0,0014 0,0014 0,0013 0,0013 0,0012 0,0012 0,0012 0,0011 0,0011
2,7 0,0011 0,001 0,001 0,001 0,0009 0,0009 0,0009 0,0008 0,0008 0,0008
2,8 0,0008 0,0007 0,0007 0,0007 0,0007 0,0006 0,0006 0,0006 0,0006 0,0006
2,9 0,0005 0,0005 0,0005 0,0005 0,0005 0,0005 0,0004 0,0004 0,0004 0,0004
3 0,0004 0,0004 0,0004 0,0003 0,0003 0,0003 0,0003 0,0003 0,0003 0,0003
3,1 0,0003 0,0003 0,0002 0,0002 0,0002 0,0002 0,0002 0,0002 0,0002 0,0002
3,2 0,0002 0,0002 0,0002 0,0002 0,0002 0,0002 0,0001 0,0001 0,0001 0,0001
3,3 0,0001 0,0001 0,0001 0,0001 0,0001 0,0001 0,0001 0,0001 0,0001 0,0001
3,4 0,0001 0,0001 0,0001 0,0001 0,0001 0,0001 0,0001 0,0001 0,0001 0,0001
3,5 0,0001 0,0001 0,0001 0,0001 0 0 0 0 0 0
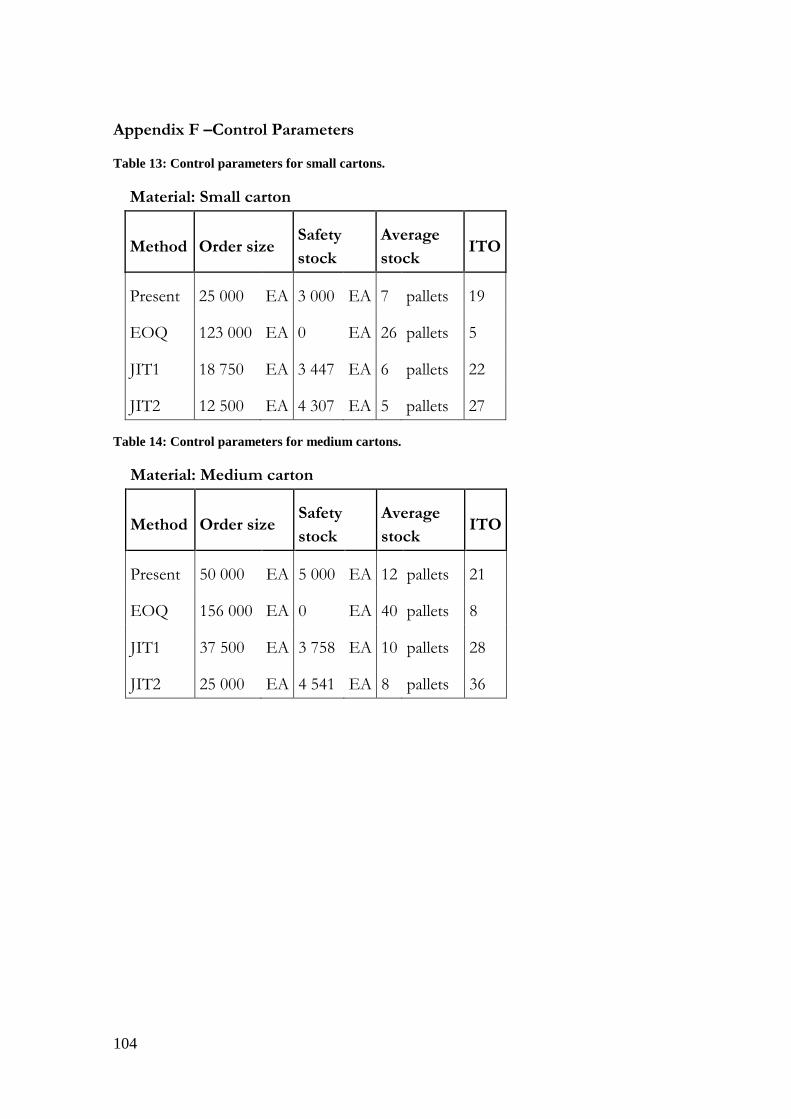
104
Appendix F –Control Parameters
Table 13: Control parameters for small cartons.
Material: Small carton
Method Order size Safety
stock
Average
stock ITO
Present 25 000 EA 3 000 EA 7 pallets 19
EOQ 123 000 EA 0 EA 26 pallets 5
JIT1 18 750 EA 3 447 EA 6 pallets 22
JIT2 12 500 EA 4 307 EA 5 pallets 27
Table 14: Control parameters for medium cartons.
Material: Medium carton
Method Order size Safety
stock
Average
stock ITO
Present 50 000 EA 5 000 EA 12 pallets 21
EOQ 156 000 EA 0 EA 40 pallets 8
JIT1 37 500 EA 3 758 EA 10 pallets 28
JIT2 25 000 EA 4 541 EA 8 pallets 36
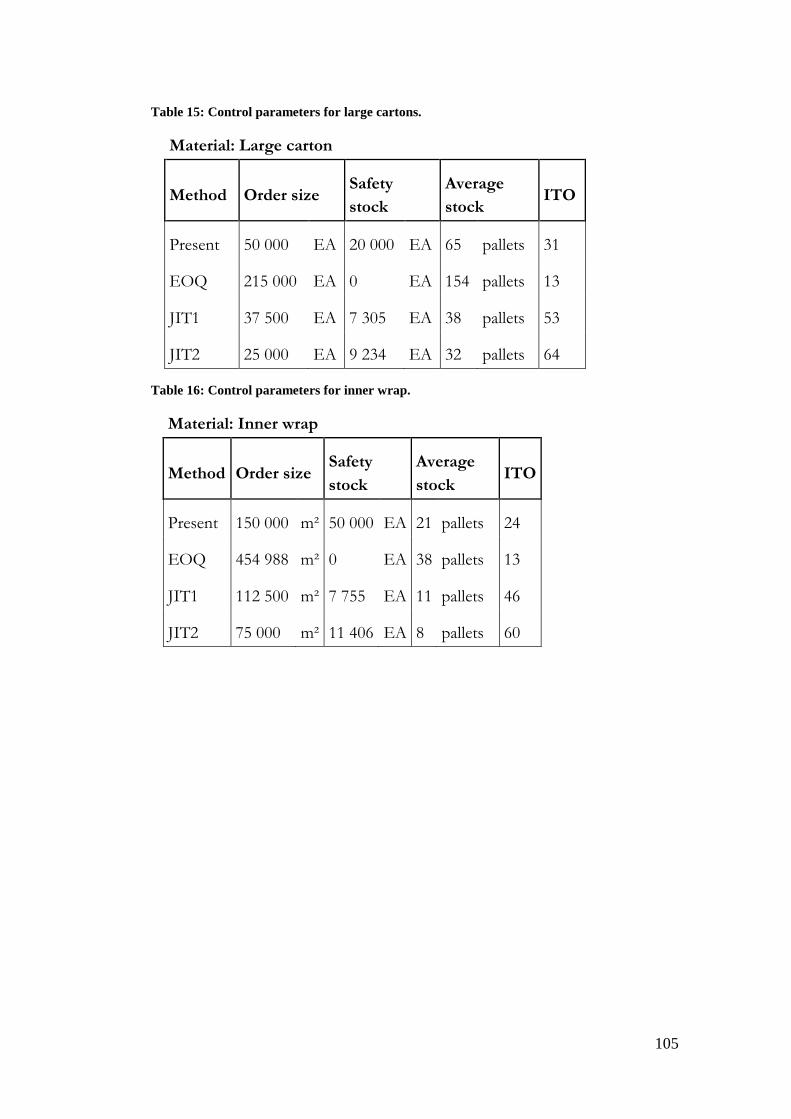
105
Table 15: Control parameters for large cartons.
Material: Large carton
Method Order size Safety
stock
Average
stock ITO
Present 50 000 EA 20 000 EA 65 pallets 31
EOQ 215 000 EA 0 EA 154 pallets 13
JIT1 37 500 EA 7 305 EA 38 pallets 53
JIT2 25 000 EA 9 234 EA 32 pallets 64
Table 16: Control parameters for inner wrap.
Material: Inner wrap
Method Order size Safety
stock
Average
stock ITO
Present 150 000 m² 50 000 EA 21 pallets 24
EOQ 454 988 m² 0 EA 38 pallets 13
JIT1 112 500 m² 7 755 EA 11 pallets 46
JIT2 75 000 m² 11 406 EA 8 pallets 60
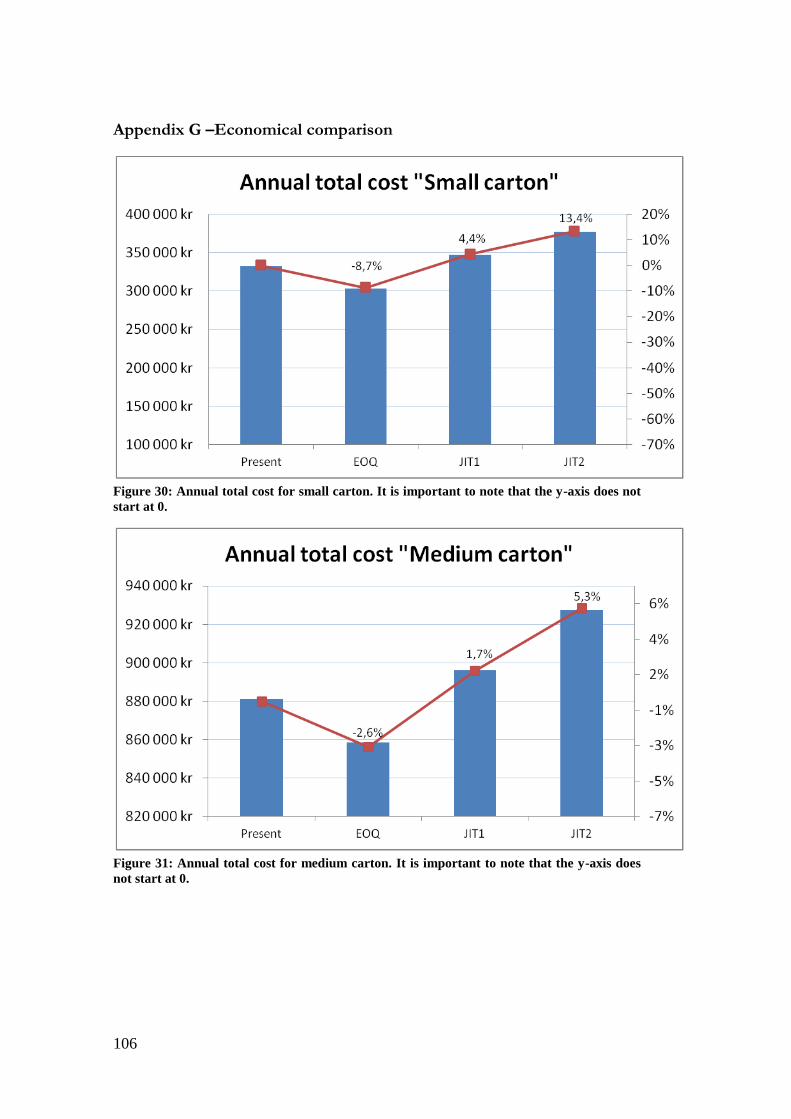
106
Appendix G –Economical comparison
Figure 30: Annual total cost for small carton. It is important to note that the y-axis does not
start at 0.
Figure 31: Annual total cost for medium carton. It is important to note that the y-axis does
not start at 0.
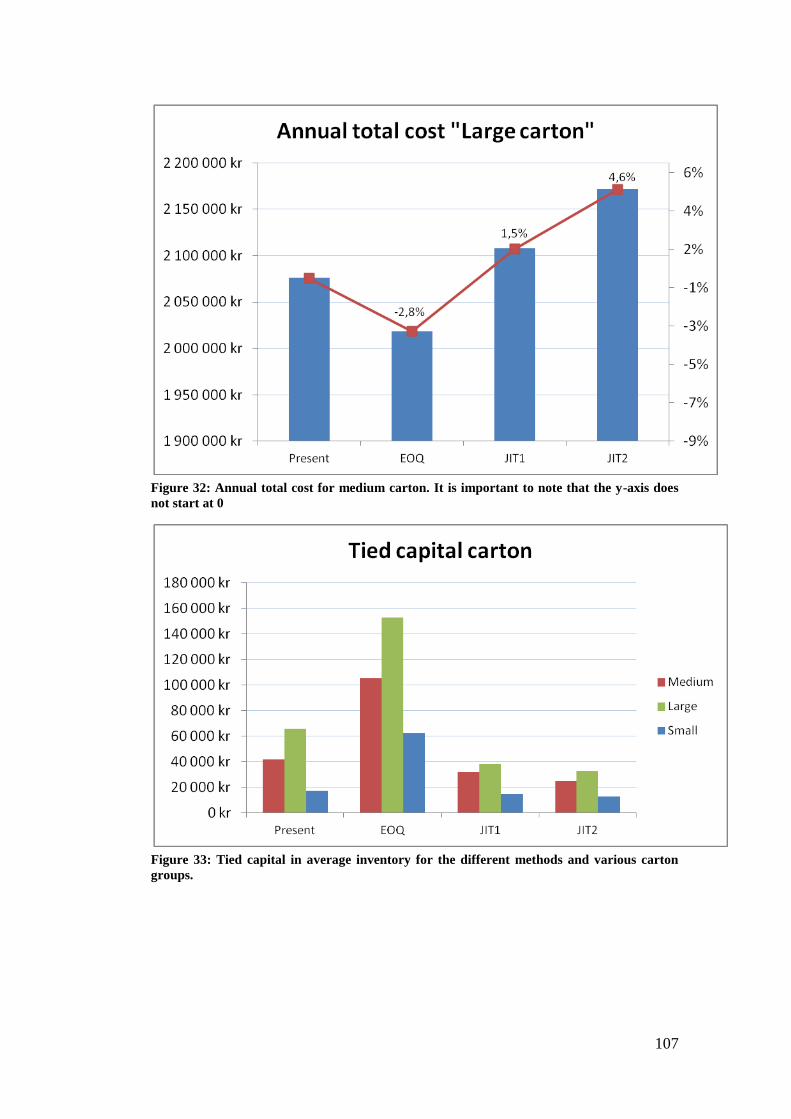
107
Figure 32: Annual total cost for medium carton. It is important to note that the y-axis does
not start at 0
Figure 33: Tied capital in average inventory for the different methods and various carton
groups.
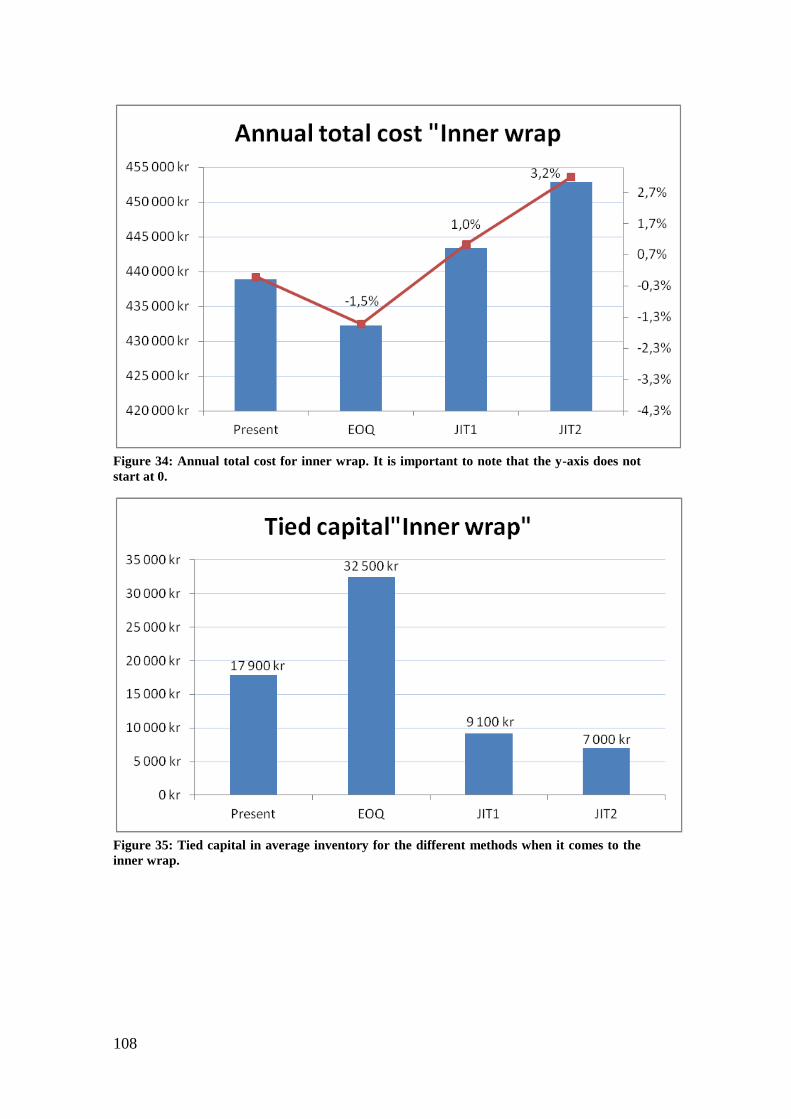
108
Figure 34: Annual total cost for inner wrap. It is important to note that the y-axis does not
start at 0.
Figure 35: Tied capital in average inventory for the different methods when it comes to the
inner wrap.
109
Appendix H –Tool guide
Christer Nederman and Oscar Slogén at Karlstad University
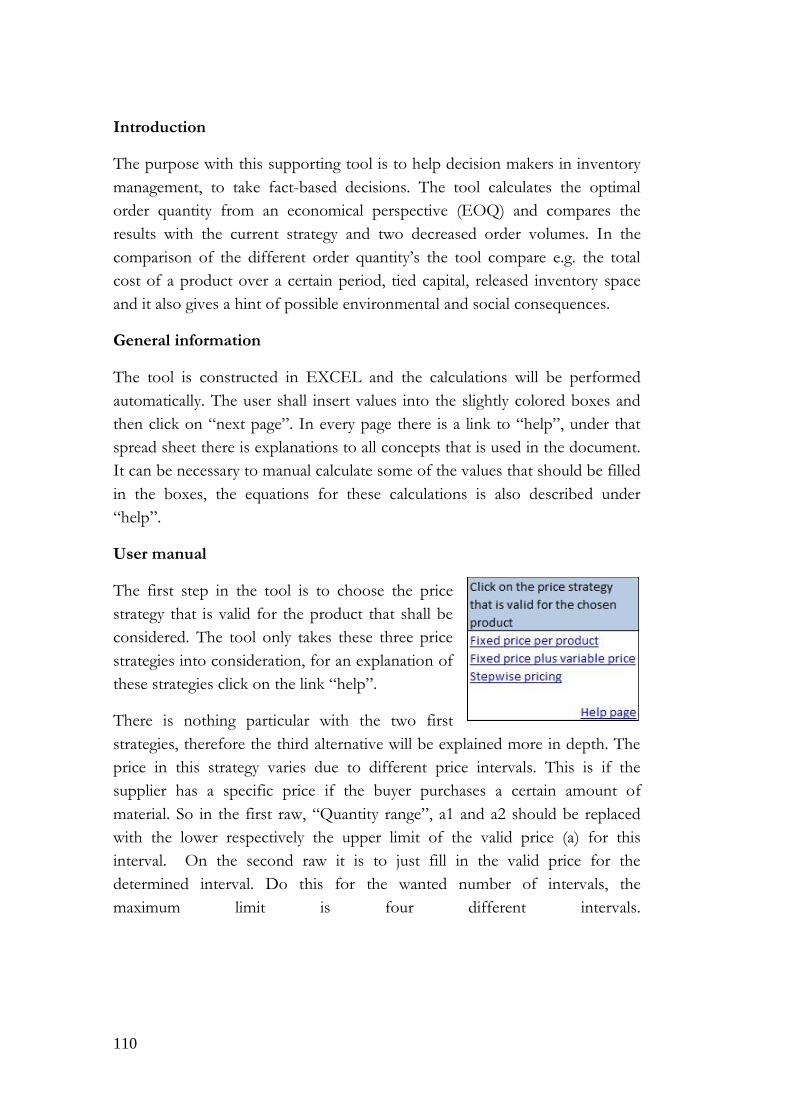
110
Introduction
The purpose with this supporting tool is to help decision makers in inventory
management, to take fact-based decisions. The tool calculates the optimal
order quantity from an economical perspective (EOQ) and compares the
results with the current strategy and two decreased order volumes. In the
comparison of the different order quantity’s the tool compare e.g. the total
cost of a product over a certain period, tied capital, released inventory space
and it also gives a hint of possible environmental and social consequences.
General information
The tool is constructed in EXCEL and the calculations will be performed
automatically. The user shall insert values into the slightly colored boxes and
then click on “next page”. In every page there is a link to “help”, under that
spread sheet there is explanations to all concepts that is used in the document.
It can be necessary to manual calculate some of the values that should be filled
in the boxes, the equations for these calculations is also described under
“help”.
User manual
The first step in the tool is to choose the price
strategy that is valid for the product that shall be
considered. The tool only takes these three price
strategies into consideration, for an explanation of
these strategies click on the link “help”.
There is nothing particular with the two first
strategies, therefore the third alternative will be explained more in depth. The
price in this strategy varies due to different price intervals. This is if the
supplier has a specific price if the buyer purchases a certain amount of
material. So in the first raw, “Quantity range”, a1 and a2 should be replaced
with the lower respectively the upper limit of the valid price (a) for this
interval. On the second raw it is to just fill in the valid price for the
determined interval. Do this for the wanted number of intervals, the
maximum limit is four different intervals.
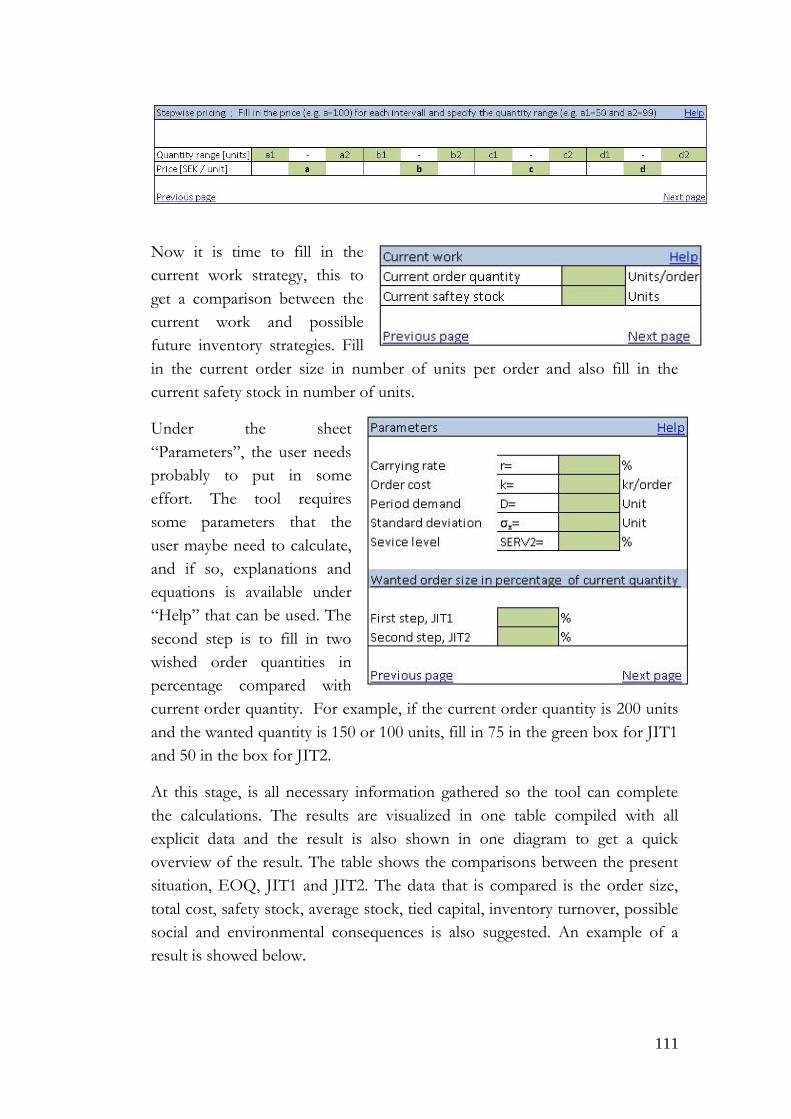
111
Now it is time to fill in the
current work strategy, this to
get a comparison between the
current work and possible
future inventory strategies. Fill
in the current order size in number of units per order and also fill in the
current safety stock in number of units.
Under the sheet
“Parameters”, the user needs
probably to put in some
effort. The tool requires
some parameters that the
user maybe need to calculate,
and if so, explanations and
equations is available under
“Help” that can be used. The
second step is to fill in two
wished order quantities in
percentage compared with
current order quantity. For example, if the current order quantity is 200 units
and the wanted quantity is 150 or 100 units, fill in 75 in the green box for JIT1
and 50 in the box for JIT2.
At this stage, is all necessary information gathered so the tool can complete
the calculations. The results are visualized in one table compiled with all
explicit data and the result is also shown in one diagram to get a quick
overview of the result. The table shows the comparisons between the present
situation, EOQ, JIT1 and JIT2. The data that is compared is the order size,
total cost, safety stock, average stock, tied capital, inventory turnover, possible
social and environmental consequences is also suggested. An example of a
result is showed below.
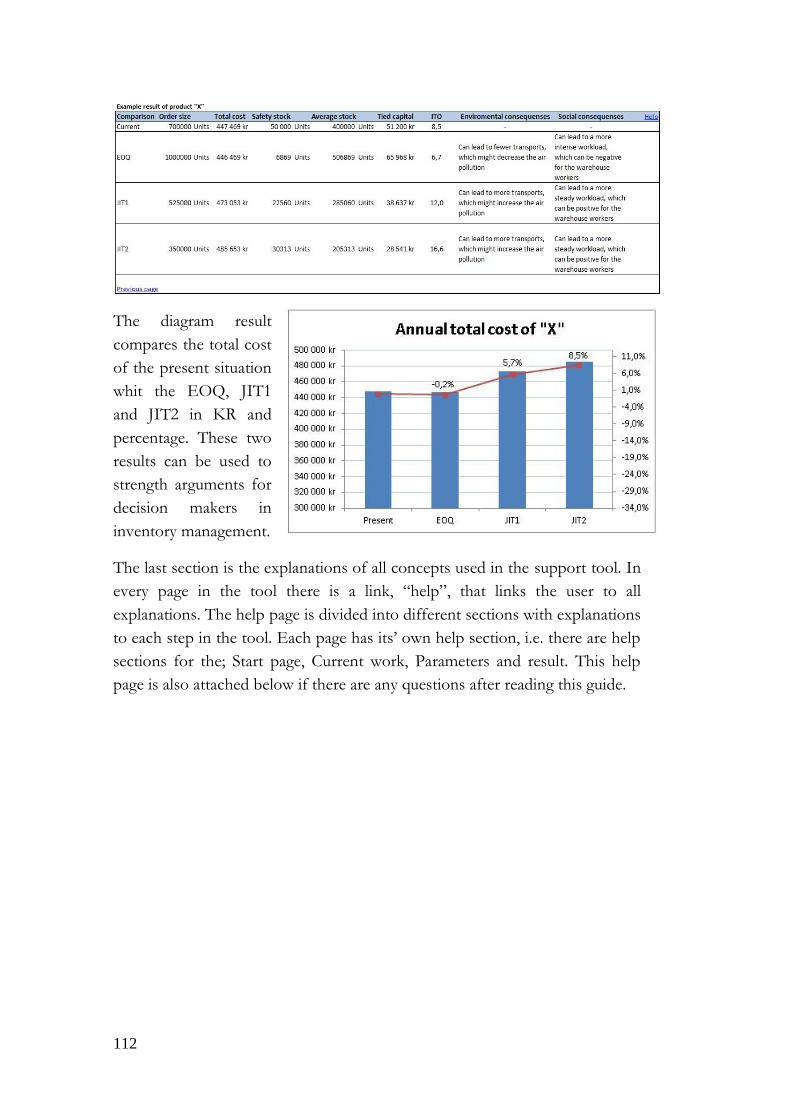
112
The diagram result
compares the total cost
of the present situation
whit the EOQ, JIT1
and JIT2 in KR and
percentage. These two
results can be used to
strength arguments for
decision makers in
inventory management.
The last section is the explanations of all concepts used in the support tool. In
every page in the tool there is a link, “help”, that links the user to all
explanations. The help page is divided into different sections with explanations
to each step in the tool. Each page has its’ own help section, i.e. there are help
sections for the; Start page, Current work, Parameters and result. This help
page is also attached below if there are any questions after reading this guide.
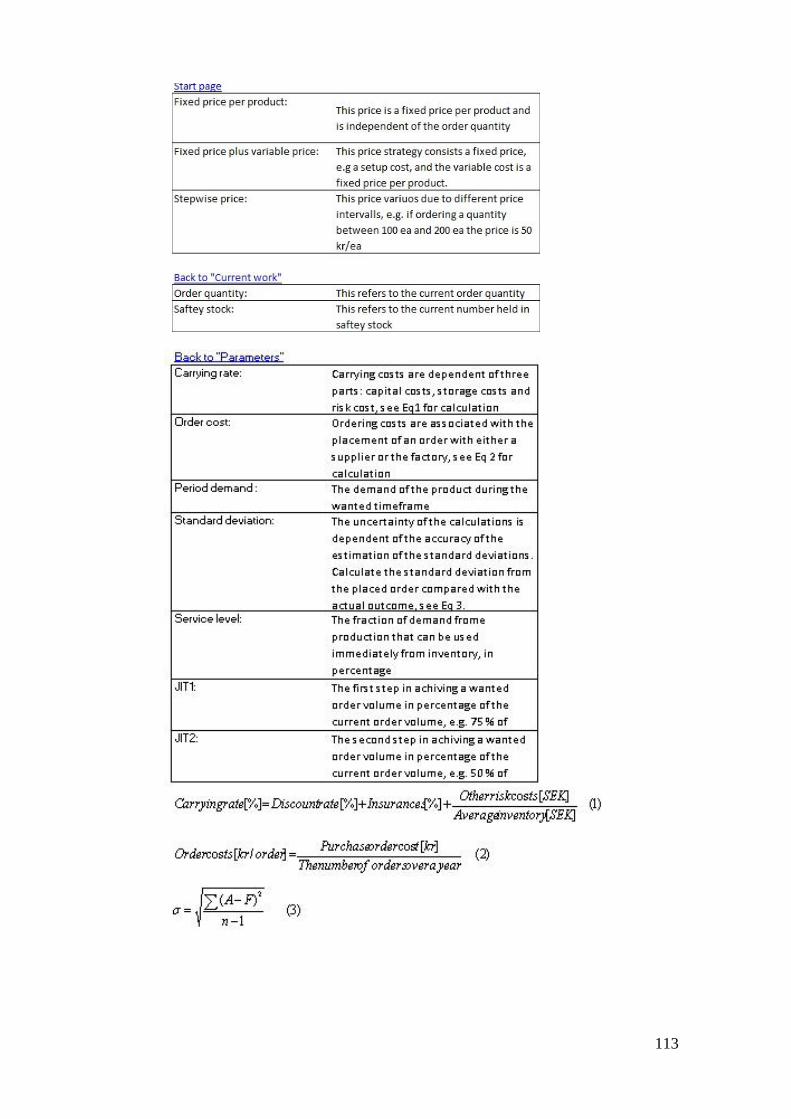
113
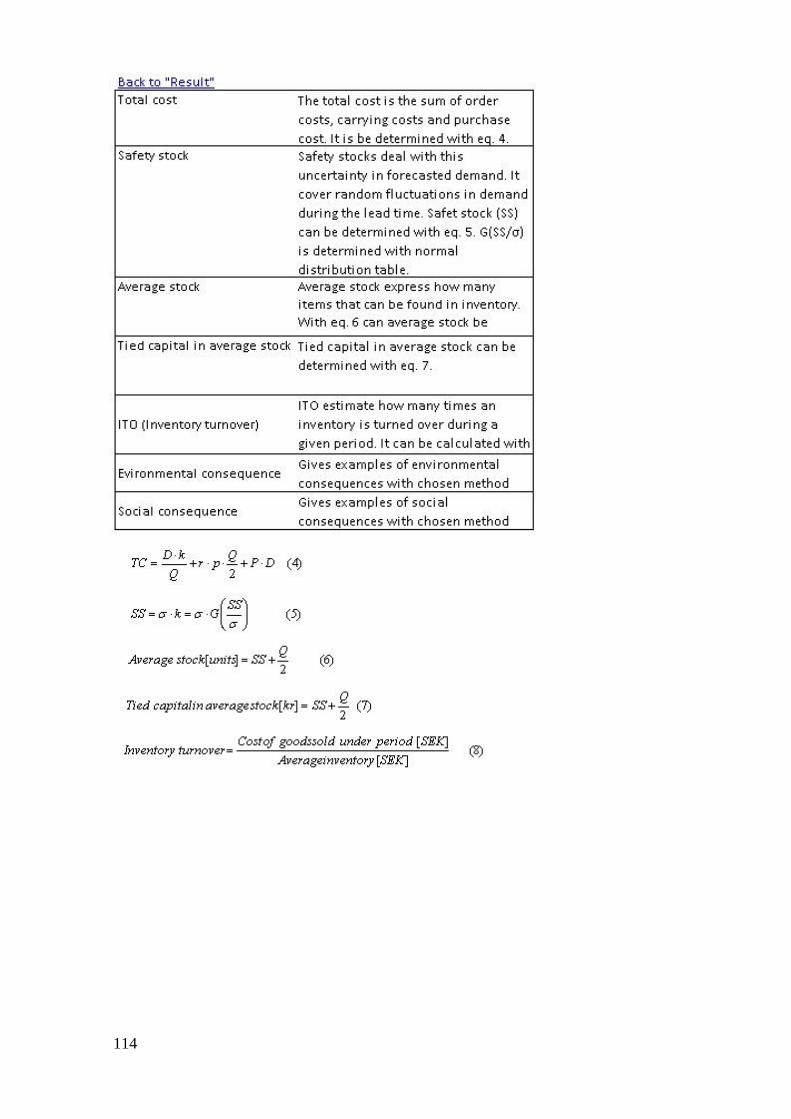
114

115