application of critical chain principles to improve
TRANSCRIPT
Application of Critical Chain Principlesto Improve Microprocessor Technology Ramps
By
Lane P. Ballard
Bachelors of Science in Mechanical Engineering, Virginia Polytechnic Institute (1997)
Submitted to the Department of Mechanical Engineering and theSloan School of Management
In Partial Fulfillment of the Requirements for the Degrees of
Master of Business AdministrationMaster of Science in Mechanical Engineering
In Conjunction with the Leaders for Manufacturing Program at theMassachusetts Institute of Technology
June 2005
0 2005 Massachusetts Institute of Technology, All rights reserved
Signature of AuthorMay 6, 2005
Sloan School of ManagementDepartment of Mechanical Engineering
Certified by(6koy E. Welsch, Thesis Advisor
Professor of Management Science, Statistics, and Engineering SystemsSloan School of Management and Engineering Systems Division
Certified byDaniel WhitnreyhIs\dvisor
Lecturer, MIT Engineering Systems E1 vision
Accepted by')avio(Capodilupo
Execut Director of Masters Programloan School of Management
Accepted by
MASSACHUSEFTS INSTITUTE,OF TECHNOLOGY
SEP 0 1 2005
LIBRARIES
fallit AnandChairman, Committee on Graduate Studies
Department of Mechanical Engineering
BARKER -
I

This page is intentionally left blank
2
Application of Critical Chain Principlesto Improve Microprocessor Technology Ramps
By
Lane P. Ballard
Submitted to Sloan School of Management and the Department of Mechanical Engineering on May 6,2005 in partial fulfillment of the requirement for the Degrees of
Master of Business AdministrationMaster of Science in Mechanical Engineering
Abstract
Across Intel's microprocessor production there exists high variability on new technology process tools
meeting standard installation and qualification (I/Q) schedule durations. To reduce project schedule
variability and increase time to money, Intel has begun examining critical chain management philosophies
to aid in the reduction of high volume manufacturing (HVM) process tool I/Q durations. The goal of this
assignment was to develop and implement a project management process using the principles of critical
chain to enable continuous improvement on I/Q planning durations over technologies. Looking into the
future, this thesis also examines a progression from product innovation towards process innovation in the
microprocessor industry. This shift will further demand decreased I/Q durations and increased
predictability for Intel on future microprocessor technology transitions.
Thesis Supervisor: Roy E WelschTitle: Professor of Management Science, Statistics, and Engineering Systems
Thesis Supervisor: Daniel WhitneyTitle: Senior Lecturer, MIT Engineering Systems Division
3
Acknowledgements
I wish to acknowledge the Leaders for Manufacturing Program for its support of this work. A special
note of thanks goes to Don Rosenfield and Nancy Young for making the LFM Program run so well. My
advisors, Roy Welsch and Dan Whitney, also deserve applause for their help during all stages of the
internship.
To my colleagues and mentors at Boeing, I appreciate your faith and sponsorship during the last two years.
What puts Boeing at the top of my career aspirations are the great people and great products. I look
forward to the challenges ahead.
Of course I wish to thank the Intel Corporation both for their support of the LFM Program as well as for
the internship in Ireland. I especially want to thank Venkatesh Patil, Sean McCarthy, and Margaret
Cuddigan for their guidance through the assignment.
Finally I wish to thank my wife and family. My life has been truly been blessed with the gift of a strong
loving family.
I dedicate this thesis to my wife Carolyn who has unselfishly supported my schooling the last two years.
I look forward to now helping you reach your educational and career dreams!
4
Table of Contents
1.0 OVERVIEW OF THE PROBLEM..................................................................................7
1.1 MICROPROCESSOR INSTALLATION/QUALIFICATION (I/Q) PROCESS............................. 71.2 NEED FOR CONTINUOUS I/Q DURATION/VARIATION REDUCTION.................................81.3 PROJECT GOAL AND OBJECTIVES................................................................................. 81.4 T HESIS STRU CTURE ........................................................................................................ 9
2.0 PROJECT MANAGEMENT CHALLENGES.......................................................... 11
2.1 IDENTIFY THE PROPER PROBLEM/PROJECT................................................................ 132.2 IDENTIFY THE PROPER SOLUTION .............................................................................. 13
2.2.1 Poor Upfront Planning.........................................................................................132.2.2 Ineffective Schedule Protection .......................................................................... 132.2.3 Poor Team Execution ......................................................................................... 17
2.3 PROJECT MANAGEMENT SUMMARY........................................................................... 18
3.0 CRITICAL CHAIN PRINCIPLES ............................................................................. 19
3.1 THEORY OF CONSTRAINTS (TOC)............................................................................... 193.2 CRITICAL CHAIN METHODOLOGIES - BUILDING ON CRITICAL PATH........................... 20
3.2.1 Building a Critical Chain Project ........................................................................ 203.2.1 Monitoring a Critical Chain Project .................................................................... 23
3.4 CRITICAL CHAIN SUMMARY ....................................................................................... 24
4.0 OBSERVATIONS OF THE CURRENT REALITY.................................................. 27
4.1 COLLECTED DURATION DATA ANALYSIS.................................................................. 274 .1.1 D uration D ata ......................................................................................................... 274 .1.2 V ariation D ata ........................................................................................................ 28
4.2 DURATION MANAGEMENT - LOW PRIORITY .............................................................. 294.3 DURATION VARIATION CONTRIBUTORS .................................................................... 30
4.3.1 Working on the Technology Frontier .................................................................. 304.3.2 "Copy Exactly" Specifications.............................................................................304.3.3 Workforce Coordination.....................................................................................314.3.4 The Working Environment ................................................................................ 31
4.4 THE BUFFER PROTECTS ............................................................................................. 324.5 OBSERVATIONS SUMMARY ....................................................................................... 32
5.0 OVERVIEW OF PROPOSED SOLUTIONS................................................................35
5.1 WORKFORCE VARIATION - PROJECT MANAGEMENT CHANGES................................. 355.1.1 Building on Past Checklist Success.................................................................... 355.1.2 Aspects of Critical Chain.....................................................................................36
5.2 ENVIRONMENT VARIATION - PRODUCTION IMPACT APPROVAL SYSTEM REVAMP......... 375.3 PROPOSED SOLUTIONS SUMMARY ............................................................................. 38
6.0 DURATION MANAGEMENT EXPERIMENTATION........................................... 40
6.1 WORKFORCE VARIATION - INTEGRATED CHECKLIST AND ASSUMPTIONS (ICLA)......... 416.1.1 Released ICLA Best Known Method - Rev 1 ..................................................... 416.1.2 ICLA Implementation and Initial Results............................................................48
6.2 ENVIRONMENT VARIATION - EQUIPMENT RESERVATION SYSTEM (ERS)................... 496.3 IMPLEMENTATION SUMMARY ..................................................................................... 50
5
7.0 INTEL I/Q ORGANIZATIONAL BARRIERS TO ICLA........................................ 51
7.1 STRATEGIC DESIGN LENS ......................................................................................... 51
7.2 POLITICAL DESIGN LENS ........................................................................................... 52
7.2.1 Competing For Future Business ........................................................................... 527.2.2 I/Q Taking a Backseat to Production...................................................................527.2.3 The Missing Project Champion...........................................................................52
7.3 CULTURAL DESIGN LENS............................................................................................ 53
7.3.1 CE .......................................................... 537.3.1 M eritocracy ............................................................................................................ 53
7.4 ANALYSIS AS A WHOLE .............................................................................................. 54
8.0 GOING FORWARD.......................................................................................................55
8.1 THE CHANGING MARKET - PRODUCT MATURITY/DOMINANT DESIGN.......................... 55
8.2 RECOMMENDATION - CONTINUE CREATING THE GROUND SWELL ................................ 57
8.2.1 Top-Down - Define/Create the Need for Change................................................578.2.2 Bottom-up - Develop the Continuous Improvement Culture ............................... 58
APPENDIX A: AUTHOR'S BIOGRAPHICAL INFORMATION ............................... 61
TERMS AND ACRONYMS ............................................................................................. 62
REFERENCES.....................................................................................................................63
6
1.0 Overview of the Problem
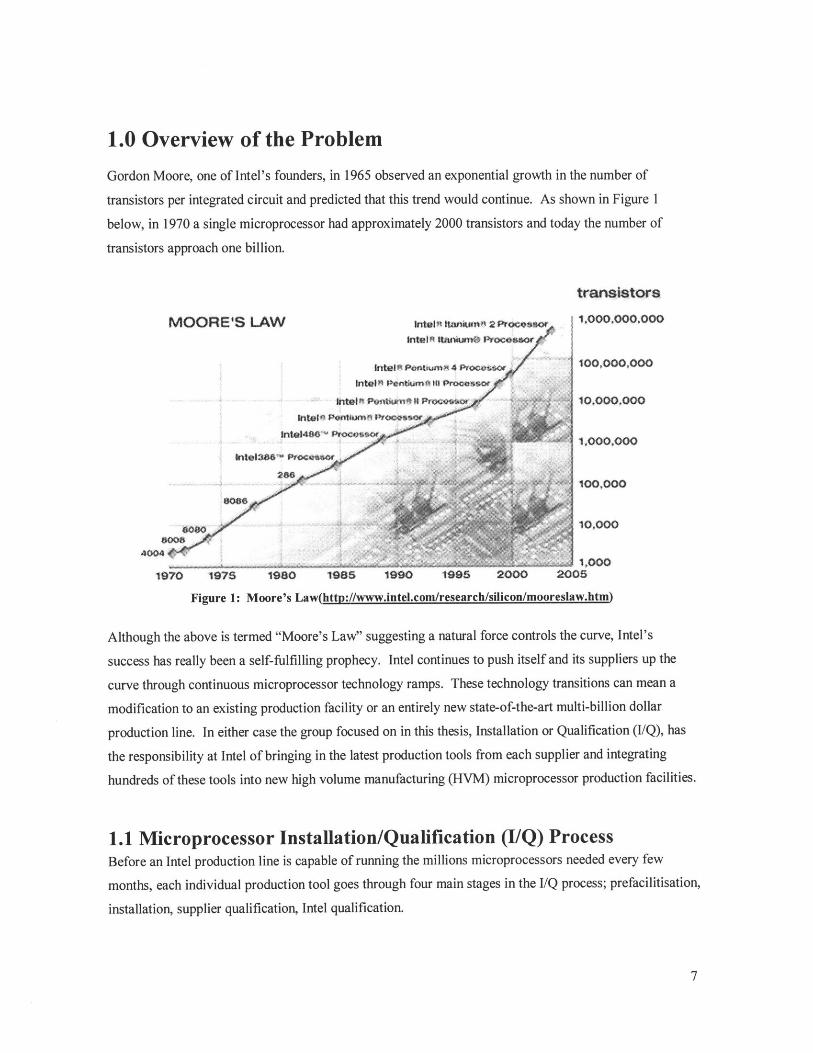
Gordon Moore, one of Intel's founders, in 1965 observed an exponential growth in the number of
transistors per integrated circuit and predicted that this trend would continue. As shown in Figure 1
below, in 1970 a single microprocessor had approximately 2000 transistors and today the number of
transistors approach one billion.
MOORE'S LAW Inta ln"I nv' 2PrCooeusorInteis tankX4 Proceo r
ntle A
IOWAas t$ PwroMioe4rIntt368" P 0t~tt*8f
"W**4 ""
800W00e
1970 1975 1980 1985 1990 1995 2000
Figure 1: Moore's Law(http://www.intel.com/research/silicon/moor
transistors11000,00.000
100,000,000
10,Q00,000
1 00000
10,000
2005
eslaw.htm)
Although the above is termed "Moore's Law" suggesting a natural force controls the curve, Intel's
success has really been a self-fulfilling prophecy. Intel continues to push itself and its suppliers up the
curve through continuous microprocessor technology ramps. These technology transitions can mean a
modification to an existing production facility or an entirely new state-of-the-art multi-billion dollar
production line. In either case the group focused on in this thesis, Installation or Qualification (I/Q), has
the responsibility at Intel of bringing in the latest production tools from each supplier and integrating
hundreds of these tools into new high volume manufacturing (HVM) microprocessor production facilities.
1.1 Microprocessor Installation/Qualification (I/Q) ProcessBefore an Intel production line is capable of running the millions microprocessors needed every few
months, each individual production tool goes through four main stages in the I/Q process; prefacilitisation,
installation, supplier qualification, Intel qualification.
7
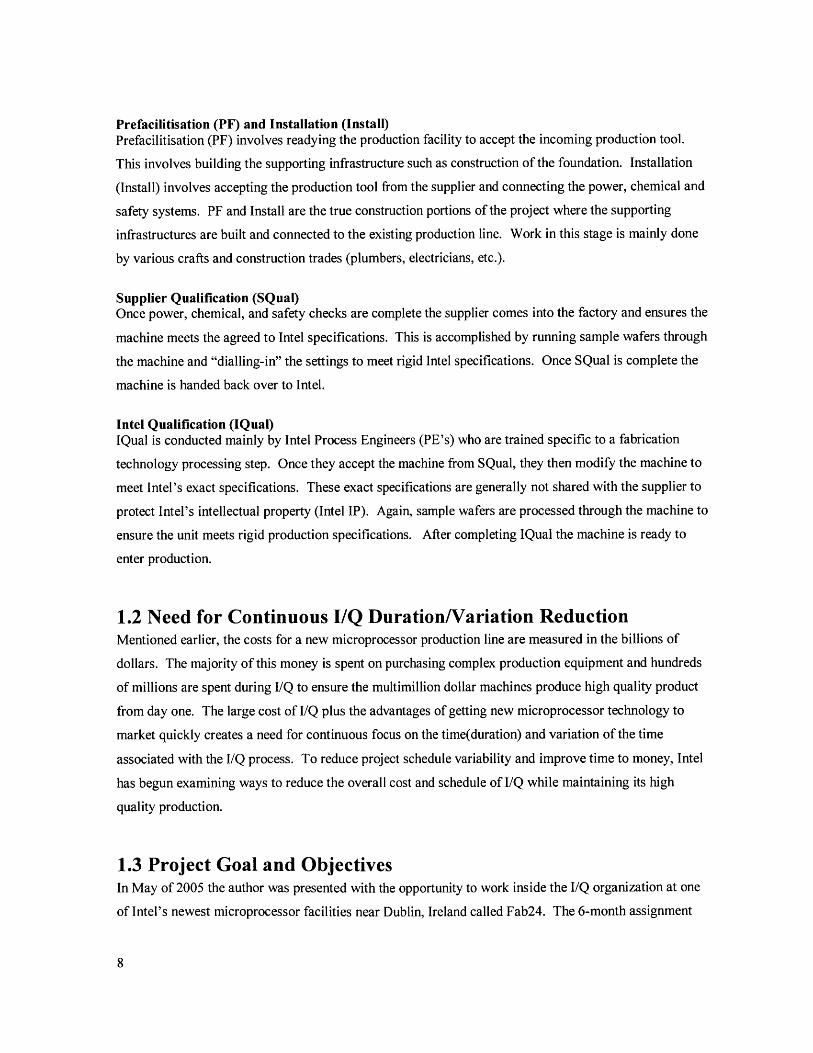
Prefacilitisation (PF) and Installation (Install)Prefacilitisation (PF) involves readying the production facility to accept the incoming production tool.
This involves building the supporting infrastructure such as construction of the foundation. Installation
(Install) involves accepting the production tool from the supplier and connecting the power, chemical and
safety systems. PF and Install are the true construction portions of the project where the supporting
infrastructures are built and connected to the existing production line. Work in this stage is mainly done
by various crafts and construction trades (plumbers, electricians, etc.).
Supplier Qualification (SQual)Once power, chemical, and safety checks are complete the supplier comes into the factory and ensures the
machine meets the agreed to Intel specifications. This is accomplished by running sample wafers through
the machine and "dialling-in" the settings to meet rigid Intel specifications. Once SQual is complete the
machine is handed back over to Intel.
Intel Qualification (IQual)IQual is conducted mainly by Intel Process Engineers (PE's) who are trained specific to a fabrication
technology processing step. Once they accept the machine from SQual, they then modify the machine to
meet Intel's exact specifications. These exact specifications are generally not shared with the supplier to
protect Intel's intellectual property (Intel IP). Again, sample wafers are processed through the machine to
ensure the unit meets rigid production specifications. After completing IQual the machine is ready to
enter production.
1.2 Need for Continuous I/Q Duration/Variation ReductionMentioned earlier, the costs for a new microprocessor production line are measured in the billions of
dollars. The majority of this money is spent on purchasing complex production equipment and hundreds
of millions are spent during I/Q to ensure the multimillion dollar machines produce high quality product
from day one. The large cost of I/Q plus the advantages of getting new microprocessor technology to
market quickly creates a need for continuous focus on the time(duration) and variation of the time
associated with the I/Q process. To reduce project schedule variability and improve time to money, Intel
has begun examining ways to reduce the overall cost and schedule of I/Q while maintaining its high
quality production.
1.3 Project Goal and ObjectivesIn May of 2005 the author was presented with the opportunity to work inside the I/Q organization at one
of Intel's newest microprocessor facilities near Dublin, Ireland called Fab24. The 6-month assignment
8
was part of the Leaders for Manufacturing program requirements and the focus of the work was to
examine critical chain management philosophies to aid in the reduction of high volume manufacturing
process (HVM) tool I/Q durations.
Prior to the internship during a recent technology ramp, Fab 24's I/Q organization had successfully
piloted a new project management process using detailed integrated checklists. The process was credited
with substantial duration performance breakthroughs at the site. Wanting to build on the groups' initial
success, Fab24 I/Q Director gave the task of exploring the use of critical chain along with the integrated
checklist process. The benefits of critical chain will be discussed on Chapter 3.
The goal of this work was to further develop and implement integrated checklist processes making the
process available for use by all Intel projects to enable continuous improvement on IQ planning durations
over technologies.
The three objectives of the assignment were as follows;* Increase predictability of I/Q project deliverables for Intel, Suppliers, and Crafts on current
technology capacity ramps.
* Enable reduction on planning and project durations for future microprocessor technology
transitions
" Deliver an Intel Best Known method (BKM) for coordination and development of I/Q Integrated
Checklists
1.4 Thesis StructureThis thesis is divided into eight chapters. The next chapter will explore general project management
practices and identify common mistakes. Chapter 3 will present how critical chain project management
attempts to correct those concerns. Chapter 4 then gives initial observations coming into the I/Q
organization. Here both the organization and the data are evaluated to lay the foundation for future
improvement. From those observations, Chapter 5 then captures the proposed solutions and Chapter 6
covers the implementation of those solutions. In Chapter 7, the Intel organization is examined to present
potential barriers towards future critical chain implementation inside the I/Q organization. Finally,
Chapter 8 lists final conclusions and recommendations of the study.
9

This page is intentionally left blank
10

2.0 Project Management Challenges
Product development fuels future success in the private industry. No matter the business, the faster you
can develop new products and get them in front of the consumer the better your chances for success.
Historically the first to market on a product has three advantages. First, the product life is extended since
the company can begin selling the product earlier as shown in Figure 2 below. [Cook, 1998] Second,
shorter development cycles free up the valuable product development resources for work on other projects.
Third, you start with 100% market share which allows the company to initially extract higher margins.
100% market share also means your competitors will have a much tougher time trying to take away your
market share than you will have to simply maintain it.
Increased Sales
Maturity End of product cycle
Sales
Time
Figure 2: Benefits of Quicker Product Development and Release [Cook, 19981
The key to efficient time-to-market lies in how well a company manages each development effort.
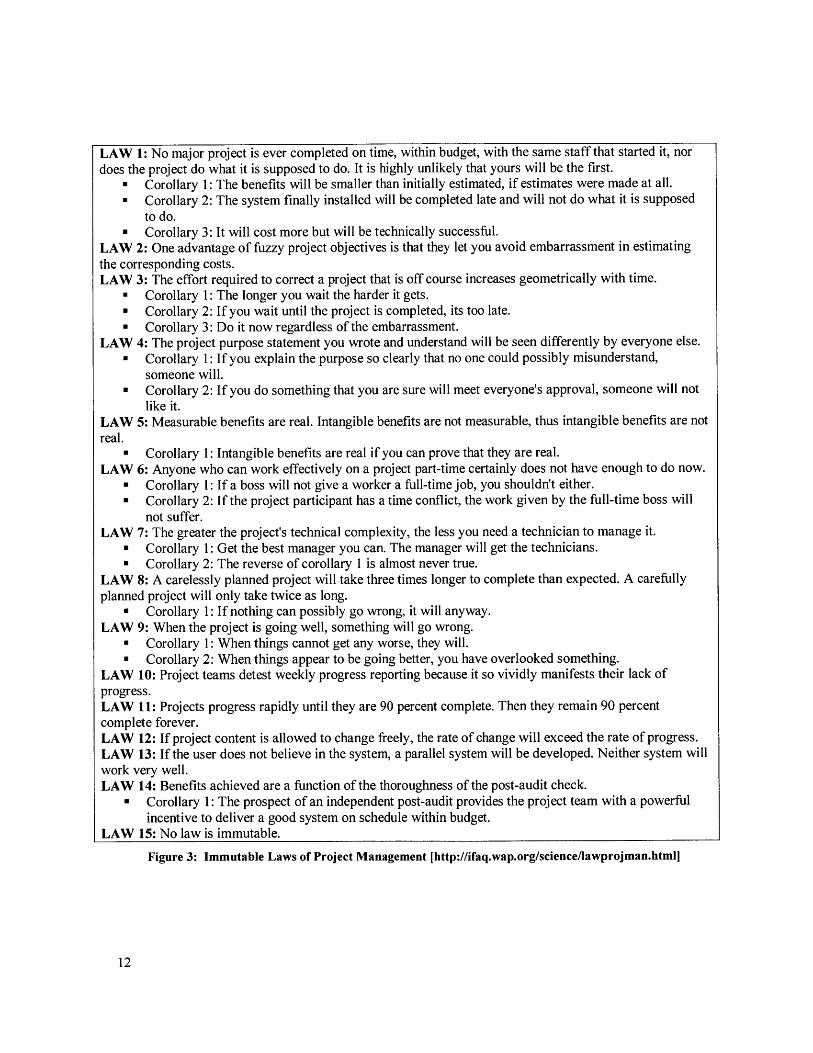
Project management is all about managing resources to achieve quality, cost and schedule
requirements/goals. Effective project management is very difficult as expressed in the Immutable Laws
of Project Management which can be found in books and websites worldwide throughout the project
management community (Figure 3). These "Laws" really capture the typical problems companies have
when managing products and serve as a great introduction to the subject of effective project management.
The 15 laws below are great to keep in mind during the execution of a project, but before execution you
must identify the problem/project to work and how best to solve it. The next two sections will review
past mistakes project managers commonly make in these initial stages.
11
LAW 1: No major project is ever completed on time, within budget, with the same staff that started it, nordoes the project do what it is supposed to do. It is highly unlikely that yours will be the first.
- Corollary 1: The benefits will be smaller than initially estimated, if estimates were made at all." Corollary 2: The system finally installed will be completed late and will not do what it is supposed
to do." Corollary 3: It will cost more but will be technically successful.
LAW 2: One advantage of fuzzy project objectives is that they let you avoid embarrassment in estimatingthe corresponding costs.LAW 3: The effort required to correct a project that is off course increases geometrically with time.
* Corollary 1: The longer you wait the harder it gets.- Corollary 2: If you wait until the project is completed, its too late.- Corollary 3: Do it now regardless of the embarrassment.
LAW 4: The project purpose statement you wrote and understand will be seen differently by everyone else.- Corollary 1: If you explain the purpose so clearly that no one could possibly misunderstand,
someone will.- Corollary 2: If you do something that you are sure will meet everyone's approval, someone will not
like it.LAW 5: Measurable benefits are real. Intangible benefits are not measurable, thus intangible benefits are notreal.
- Corollary 1: Intangible benefits are real if you can prove that they are real.LAW 6: Anyone who can work effectively on a project part-time certainly does not have enough to do now.
- Corollary 1: If a boss will not give a worker a full-time job, you shouldn't either.- Corollary 2: If the project participant has a time conflict, the work given by the full-time boss will
not suffer.LAW 7: The greater the project's technical complexity, the less you need a technician to manage it.
- Corollary 1: Get the best manager you can. The manager will get the technicians.- Corollary 2: The reverse of corollary 1 is almost never true.
LAW 8: A carelessly planned project will take three times longer to complete than expected. A carefullyplanned project will only take twice as long.
- Corollary 1: If nothing can possibly go wrong, it will anyway.LAW 9: When the project is going well, something will go wrong.
- Corollary 1: When things cannot get any worse, they will.- Corollary 2: When things appear to be going better, you have overlooked something.
LAW 10: Project teams detest weekly progress reporting because it so vividly manifests their lack ofprogress.LAW 11: Projects progress rapidly until they are 90 percent complete. Then they remain 90 percentcomplete forever.LAW 12: If project content is allowed to change freely, the rate of change will exceed the rate of progress.LAW 13: If the user does not believe in the system, a parallel system will be developed. Neither system willwork very well.LAW 14: Benefits achieved are a function of the thoroughness of the post-audit check.
- Corollary 1: The prospect of an independent post-audit provides the project team with a powerfulincentive to deliver a good system on schedule within budget.
LAW 15: No law is immutable.
Figure 3: Immutable Laws of Project Management Ihttp://ifaq.wap.org/science/lawprojman.html]
12
2.1 Identify the Proper Problem/ProjectLawrence Leach writes the "The most important decision you make when you go about improving
anything is what to change. Everything else follows from that decision."[Leach, 2000, p 75] Basically he
is saying choose projects important to the company so that the environment is ripe for the coming change.
So the first task in the project management arena is to choose the right project or problem to solve. Once
the problem is identified the next step is to identify the right solution.
2.2 Identify the Proper SolutionAssuming the proper problem/project has been identified, the next crucial decision is how best to
solve/execute it. When developing the project management solution many projects fail due to poor initial
planning, ineffective schedule protection, and a lack of team execution as discussed below.
2.2.1 Poor Upfront PlanningPoor planning shows-up in the form of a project schedule lacking sufficient detail. Most can attest to the
common way schedules are built and implemented. To sell the project a few individuals come up with a
rough draft schedule containing estimates, usually ideal, of the time and money needed to execute a
project. If the proposal is accepted, teams are quickly formed and due to "time constraints" the rough
draft schedule becomes the final schedule to begin managing to with no buy-in from those responsible for
the work. So out of the gate most projects have set unrealistic targets.
2.2.2 Ineffective Schedule ProtectionGoing back to Figure 3, the final immutable law of project management is that none of the laws are
absolute. Along with poor planning, most projects are not built to properly deal with unforeseen
problems.
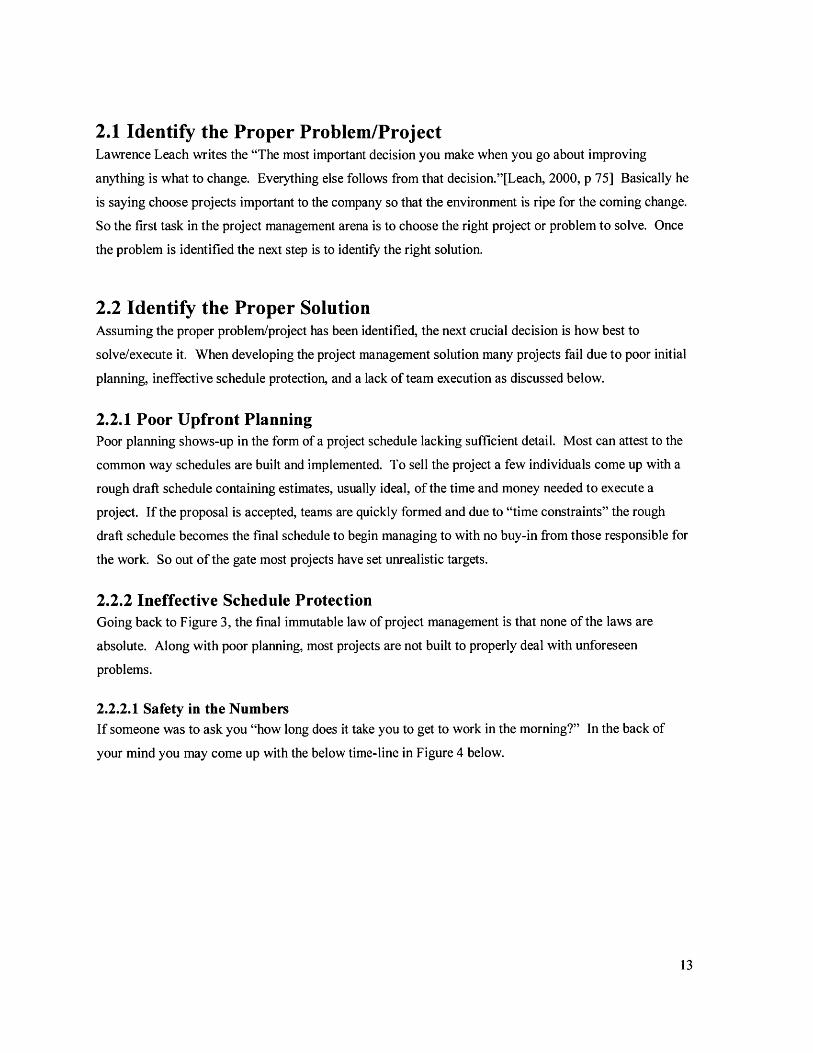
2.2.2.1 Safety in the NumbersIf someone was to ask you "how long does it take you to get to work in the morning?" In the back of
your mind you may come up with the below time-line in Figure 4 below.
13
to ti t2 t3 t4
tl = The amount of time the task will take if everything goes reasonably well.t2 = tl+ The amount of time to cope with uncertainty in the task. (Flat Tire)t3 = t2+ The amount of time spent working on other activities. (Get gas and stop for coffee)t4 = t3+ The amount of time we allow for interruptions. (Potential Traffic)
Figure 4: Driving To Work Time-Line
If the person asking you the question was your boss, you would probably add additional time to the
duration to further protect yourself from possible embarrassment at a later date. Now suppose your boss
went about asking you and everyone in your office how long it takes to complete all aspects of your job
on a project. Most everyone would follow a similar thought process and add plenty of buffers to avoid
potential embarrassment at a later date. The final project schedule would be full of protection or buffer.
WI I
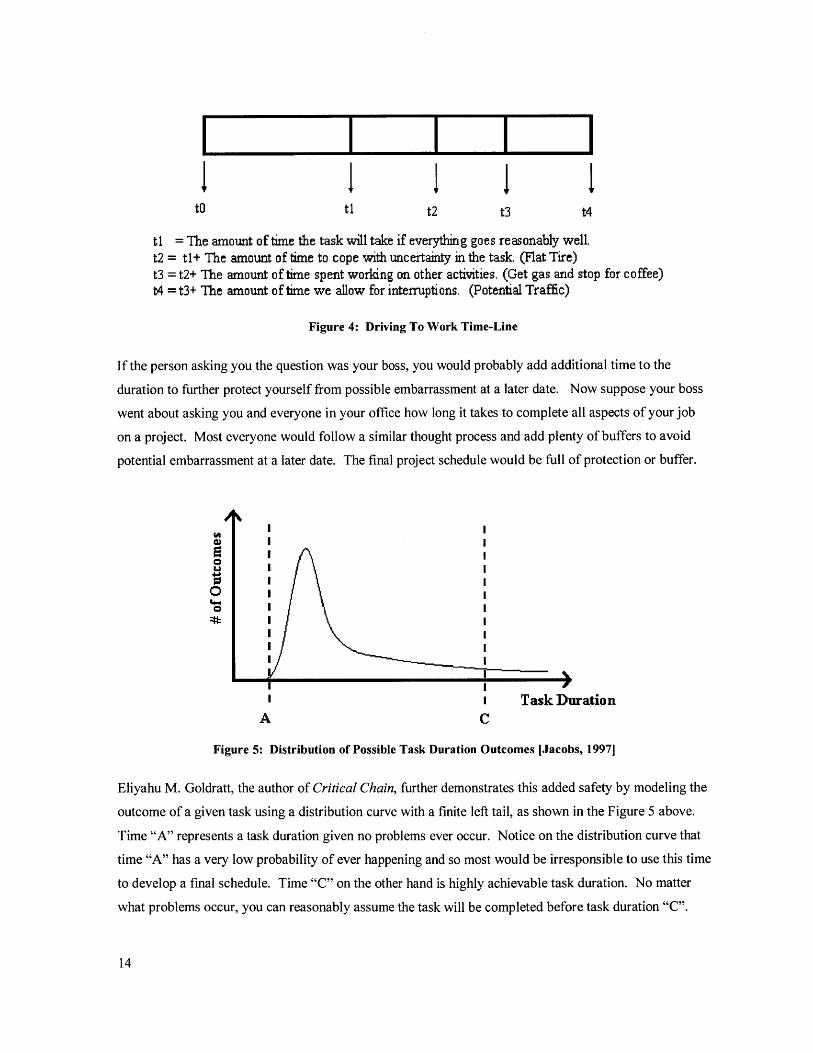
T ask DurationA C
Figure 5: Distribution of Possible Task Duration Outcomes [Jacobs, 1997]
Eliyahu M. Goldratt, the author of Critical Chain, further demonstrates this added safety by modeling the
outcome of a given task using a distribution curve with a finite left tail, as shown in the Figure 5 above.
Time "A" represents a task duration given no problems ever occur. Notice on the distribution curve that
time "A" has a very low probability of ever happening and so most would be irresponsible to use this time
to develop a final schedule. Time "C" on the other hand is highly achievable task duration. No matter
what problems occur, you can reasonably assume the task will be completed before task duration "C".
14
Time "C" is what Goldratt terms the "95% time" because 95% of the time a resource will finish the task
in less time then the given estimate "C". Unfortunately it is time "C" that most planners use when
deciding on task durations. To make matters worse this added time only makes the schedule longer, not
safer for reasons discussed below.
2.2.2.2 Milestone Behavior - Consuming the Safety
Although the inherent safety of the "95% time" is intended to protect the overall project date, human
nature, resource conflict, and milestone structure do not allow for the proper use of the time.
Human Nature - Parkinson's Law and the Student SyndromeCyril Northcote Parkinson developed Parkinson's Law which states that work expands so as to fill the
time available for its completion. [Parkinson, 1957] Many of us have missed an alarm clock in the
morning and once we wake-up and realize we are about to miss an important meeting, are able to shower,
dress, and eat in the time is normally takes us to stumble out of bed. This efficiency is due to the shortage
of time we have before us. Another example of the Parkinson's Law is when your boss tells you to have
the report, he just assigned you, on his desk by close of business today. Under normal conditions we may
take a few days, but given our leader's request, we produce the report in record time.
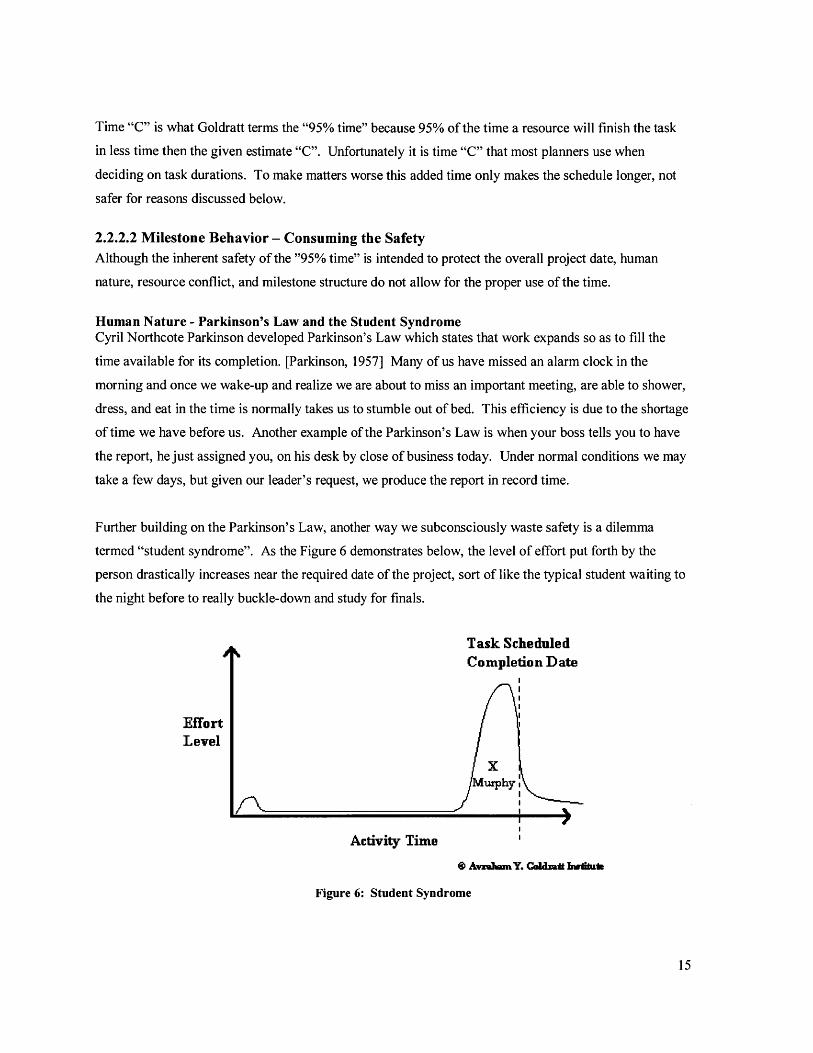
Further building on the Parkinson's Law, another way we subconsciously waste safety is a dilemma
termed "student syndrome". As the Figure 6 demonstrates below, the level of effort put forth by the
person drastically increases near the required date of the project, sort of like the typical student waiting to
the night before to really buckle-down and study for finals.
Task ScheduledCompletion Date
EffortLevel
XMurphy:
Activity Time
@ Avrah)Y. Ceimtk Ln&ala
Figure 6: Student Syndrome
15
So because of the Parkinson's Law and the Student Syndrome, safety time simply allows individuals to
delay starting tasks. The major problem with waiting until the last minute is that unexpected problems
tend to present themselves during this critical time, Murphy's Law. To fix these problems means missed
completion dates.
Resource Conflict - MultitaskingAnother way safety is wasted is due to resource conflicts. In a perfect world each employee would have a
single task to complete at any given time and we would have the power to work each task from start to
finish uninterrupted. Unfortunately many of us have multiple projects/managers to support on any given
day, and as most of us have experienced, the priority for the tasks to change daily, forcing us to multitask.
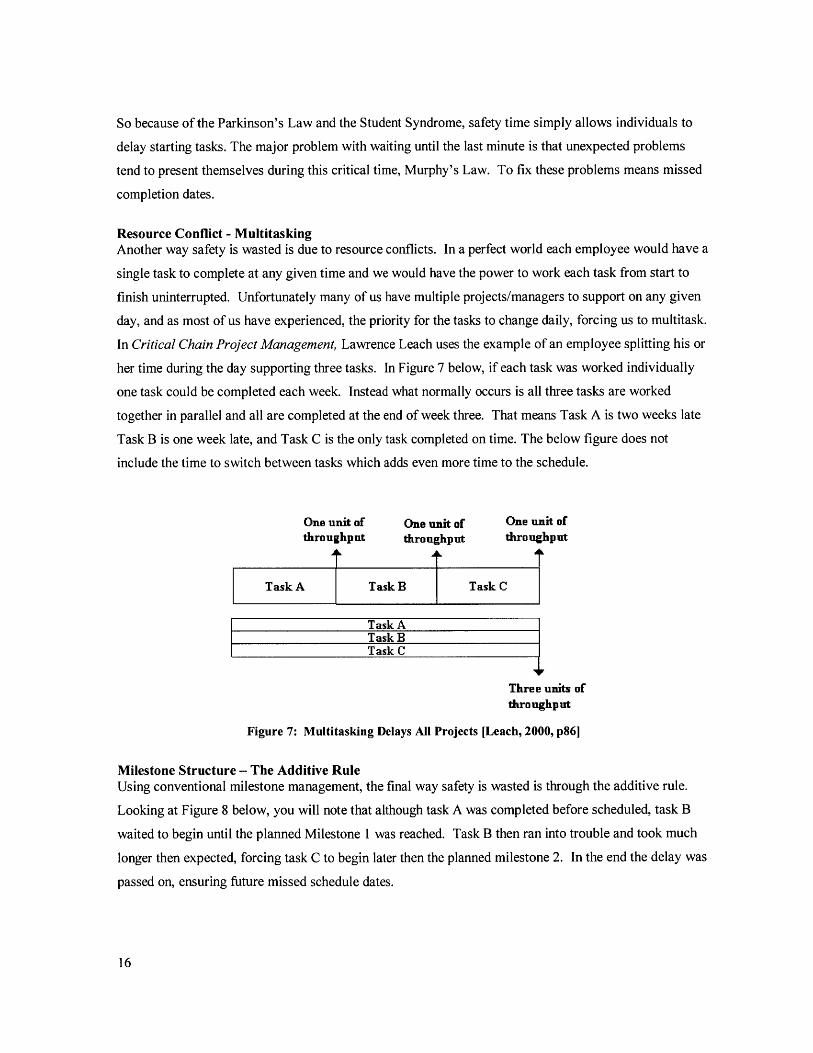
In Critical Chain Project Management, Lawrence Leach uses the example of an employee splitting his or
her time during the day supporting three tasks. In Figure 7 below, if each task was worked individually
one task could be completed each week. Instead what normally occurs is all three tasks are worked
together in parallel and all are completed at the end of week three. That means Task A is two weeks late
Task B is one week late, and Task C is the only task completed on time. The below figure does not
include the time to switch between tasks which adds even more time to the schedule.
One unit of One unit of One unit ofthroughput throughput throughput
t fTask A Task B Task C
Task ATask BTask C
Three units ofthroughput
Figure 7: Multitasking Delays All Projects [Leach, 2000, p861
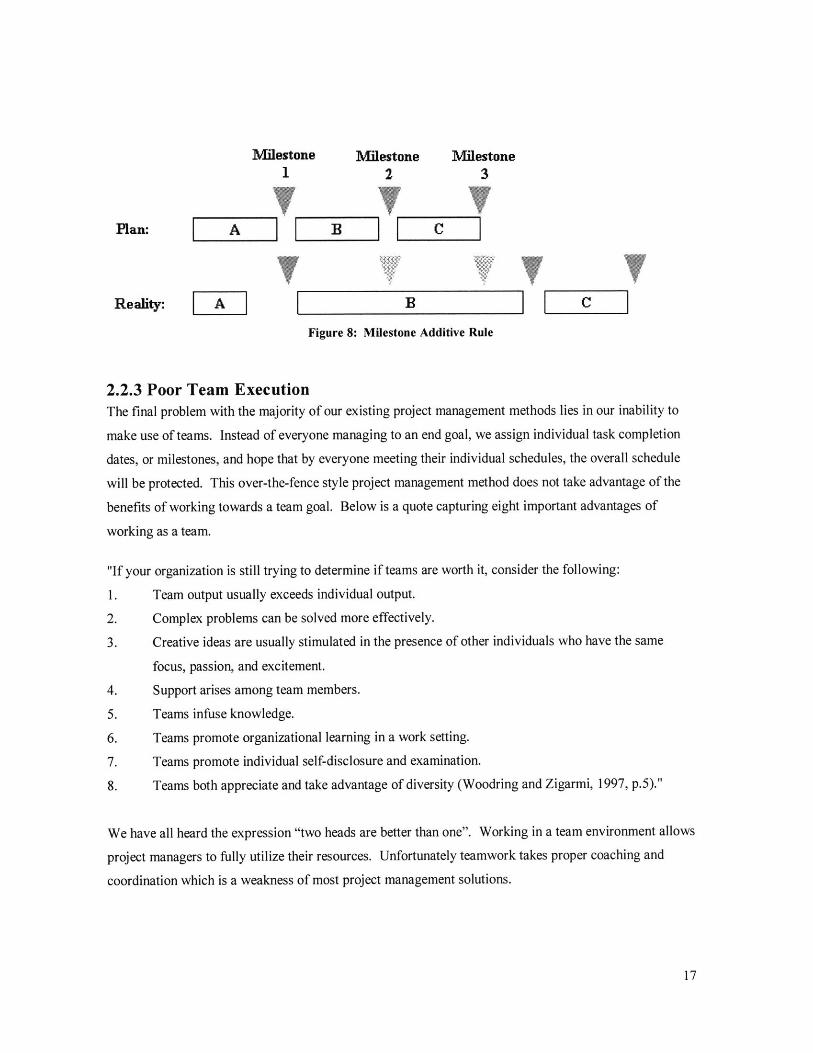
Milestone Structure - The Additive RuleUsing conventional milestone management, the final way safety is wasted is through the additive rule.
Looking at Figure 8 below, you will note that although task A was completed before scheduled, task B
waited to begin until the planned Milestone 1 was reached. Task B then ran into trouble and took much
longer then expected, forcing task C to begin later then the planned milestone 2. In the end the delay was
passed on, ensuring future missed schedule dates.
16
Milestone Milestone Milestone1 2 3
Pln VFlan: A _JB C
C
Figure 8: Milestone Additive Rule
2.2.3 Poor Team ExecutionThe final problem with the majority of our existing project management methods lies in our inability to
make use of teams. Instead of everyone managing to an end goal, we assign individual task completion
dates, or milestones, and hope that by everyone meeting their individual schedules, the overall schedule
will be protected. This over-the-fence style project management method does not take advantage of the
benefits of working towards a team goal. Below is a quote capturing eight important advantages of
working as a team.
"If your organization is still trying to determine if teams are worth it, consider the following:
1. Team output usually exceeds individual output.
2. Complex problems can be solved more effectively.
3. Creative ideas are usually stimulated in the presence of other individuals who have the same
focus, passion, and excitement.
4. Support arises among team members.
5. Teams infuse knowledge.
6. Teams promote organizational learning in a work setting.
7. Teams promote individual self-disclosure and examination.
8. Teams both appreciate and take advantage of diversity (Woodring and Zigarmi, 1997, p.5)."
We have all heard the expression "two heads are better than one". Working in a team environment allows
project managers to fully utilize their resources. Unfortunately teamwork takes proper coaching and
coordination which is a weakness of most project management solutions.
17
Reality: IIA
2.3 Project Management SummaryCompanies rely on project management to maintain a competitive advantage in the free market. For
reasons pointed out in the Immutable Laws of Project Management, project execution can be very
difficult. Even before project execution a project leader must correctly identify the problem or project to
focus resources on. For this assignment Intel had identified the time (duration) and variation of time
required installing and qualifying process tools as the area in need of improvement at Intel. Whether or
not this was the properly identified problem/project will be discussed in Chapter 4. The second task a
project manager must accomplish prior to execution is to develop an effective solution to the identified
problem. For reasons discussed above, past project management solutions tend to implement poor
planning, ineffective schedule protection, and fail to take advantage of teamwork. Going into this
assignment, Intel I/Q management had suggested applying the principles of critical chain to enable
continuous improvement on future I/Q planning durations. Critical Chain, as will be discussed in the next
chapter, attempts to better address the above identified planning, schedule protection and team execution
concerns.
18
3.0 Critical Chain Principles
In 1997 Eliyahu Goldratt published Critical Chain to explain the application of Theory of Constraints
(TOC) to project planning and development. To understand critical chain let's first briefly summarize
TOC.
3.1 Theory of Constraints (TOC)"Give me a place to stand and a long enough lever and I can move the world."
Archimedes
TOC is a theory based on leverage. It is a management philosophy that focuses on improving the system
performance by finding the constraint of the system and then concentrating on elevating the capacity of
the constraint. To simplify the definition a chain is most often used to represent the concept of TOC.
Since the weakest link in a chain determines the overall chain's strength, focusing on improving the
strength of the other links would have no impact to the strength of the chain. [Goldratt, 1984] So to
strengthen the overall system, effort must be placed on the weakest chain link.
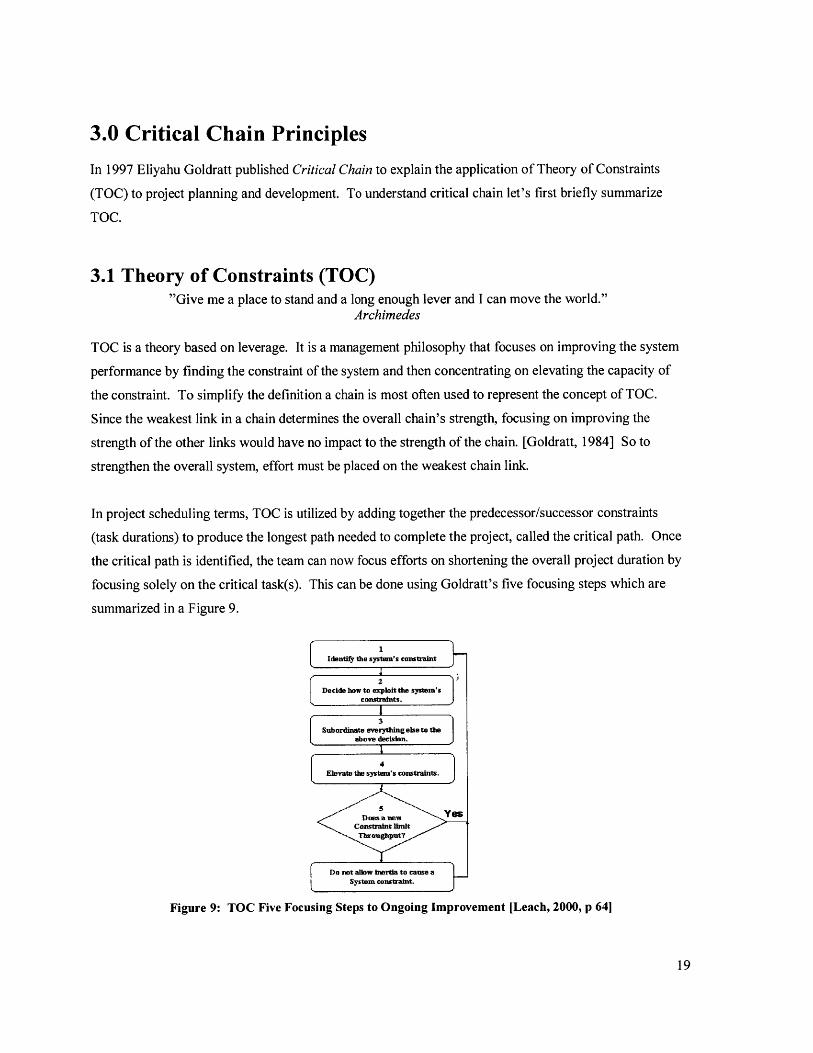
In project scheduling terms, TOC is utilized by adding together the predecessor/successor constraints
(task durations) to produce the longest path needed to complete the project, called the critical path. Once
the critical path is identified, the team can now focus efforts on shortening the overall project duration by
focusing solely on the critical task(s). This can be done using Goldratt's five focusing steps which are
summarized in a Figure 9.
Identify the system's constraint
2Decide how to exploit the system's
constraints.
3Subordinate everything else to the
above decision.
4Elevate the system's constraints.
5
Dmsem' '8SConstraint limit
Throughput?
Do not allow inertia to cause aSystem constraint.
Figure 9: TOC Five Focusing Steps to Ongoing Improvement [Leach, 2000, p 641
19
This method of project management is termed critical path method (CPM) and acts as the foundation on
which the critical chain method (CCM) is built.
3.2 Critical Chain Methodologies - Building on Critical PathThe critical chain is defined as the longest path through the program considering both technical and
resource dependencies that determines the overall program duration. So after the critical path is
determined, the critical chain method looks into resolving resource conflicts. Also added to the CPM is a
means for dealing with the probabilistic nature of task durations for a given project or how best to exploit
the constraints (step 3 above) in the system once they are identified. Goldratt's main focus is on
challenging the way we develop and use safety in project management schedules.
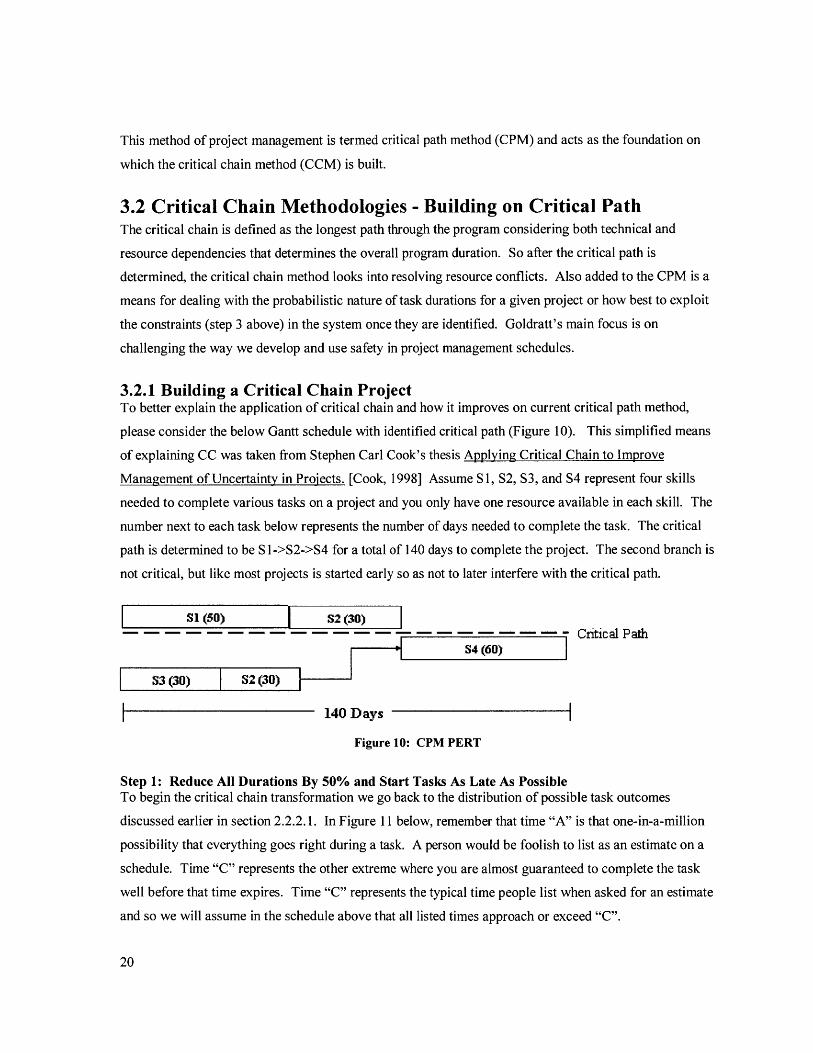
3.2.1 Building a Critical Chain ProjectTo better explain the application of critical chain and how it improves on current critical path method,
please consider the below Gantt schedule with identified critical path (Figure 10). This simplified means
of explaining CC was taken from Stephen Carl Cook's thesis Applying Critical Chain to Improve
Management of Uncertainty in Projects. [Cook, 1998] Assume Sl, S2, S3, and S4 represent four skills
needed to complete various tasks on a project and you only have one resource available in each skill. The
number next to each task below represents the number of days needed to complete the task. The critical
path is determined to be Sl->S2->S4 for a total of 140 days to complete the project. The second branch is
not critical, but like most projects is started early so as not to later interfere with the critical path.
S1(50) S2(30)S3(30)---------------Critical Path
54 (60)
53 (30) 52 (30)
140 Days
Figure 10: CPM PERT
Step 1: Reduce All Durations By 50% and Start Tasks As Late As PossibleTo begin the critical chain transformation we go back to the distribution of possible task outcomes
discussed earlier in section 2.2.2.1. In Figure 11 below, remember that time "A" is that one-in-a-million
possibility that everything goes right during a task. A person would be foolish to list as an estimate on a
schedule. Time "C" represents the other extreme where you are almost guaranteed to complete the task
well before that time expires. Time "C" represents the typical time people list when asked for an estimate
and so we will assume in the schedule above that all listed times approach or exceed "C".
20
0 I
I I
Task DurationA B C
Figure 11: Distribution of Possible Task Duration Outcomes [Jacobs, 1997]
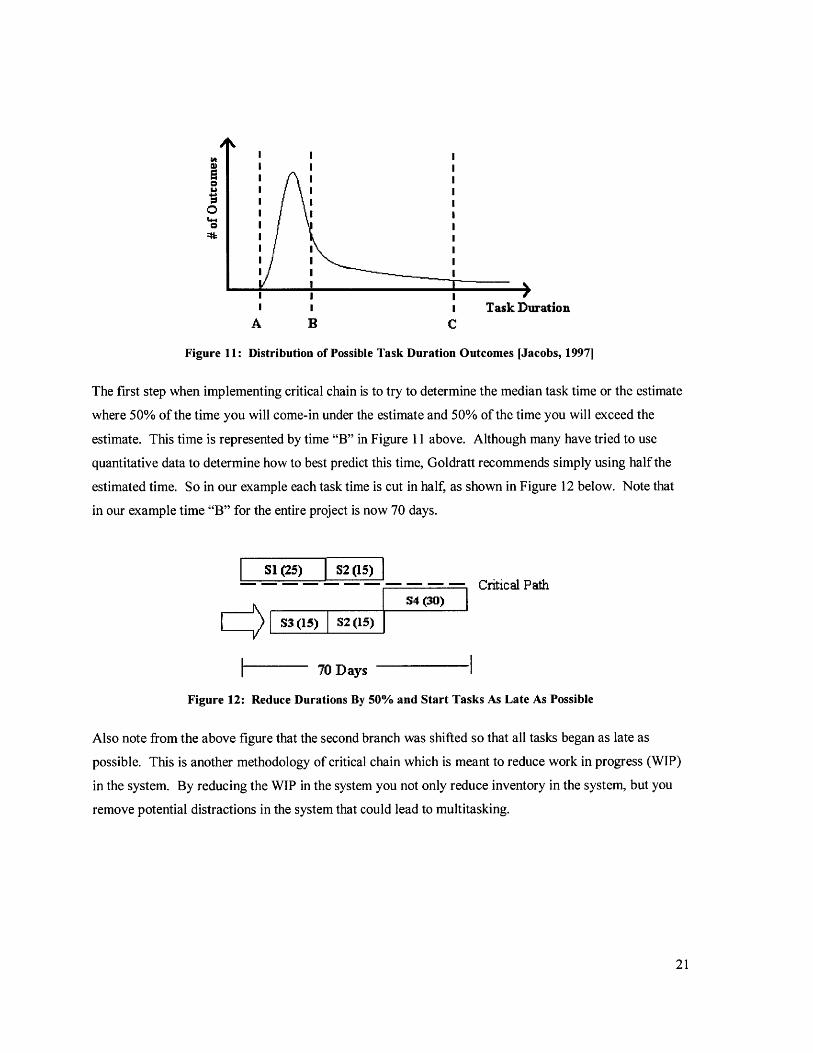
The first step when implementing critical chain is to try to determine the median task time or the estimate
where 50% of the time you will come-in under the estimate and 50% of the time you will exceed the
estimate. This time is represented by time "B" in Figure 11 above. Although many have tried to use
quantitative data to determine how to best predict this time, Goldratt recommends simply using half the
estimated time. So in our example each task time is cut in half, as shown in Figure 12 below. Note that
in our example time "B" for the entire project is now 70 days.
51(25) 52(15)Critical Path
S4(30)
S3 (15) S2 (15)
70 Days
Figure 12: Reduce Durations By 50% and Start Tasks As Late As Possible
Also note from the above figure that the second branch was shifted so that all tasks began as late as
possible. This is another methodology of critical chain which is meant to reduce work in progress (WIP)
in the system. By reducing the WIP in the system you not only reduce inventory in the system, but you
remove potential distractions in the system that could lead to multitasking.
21
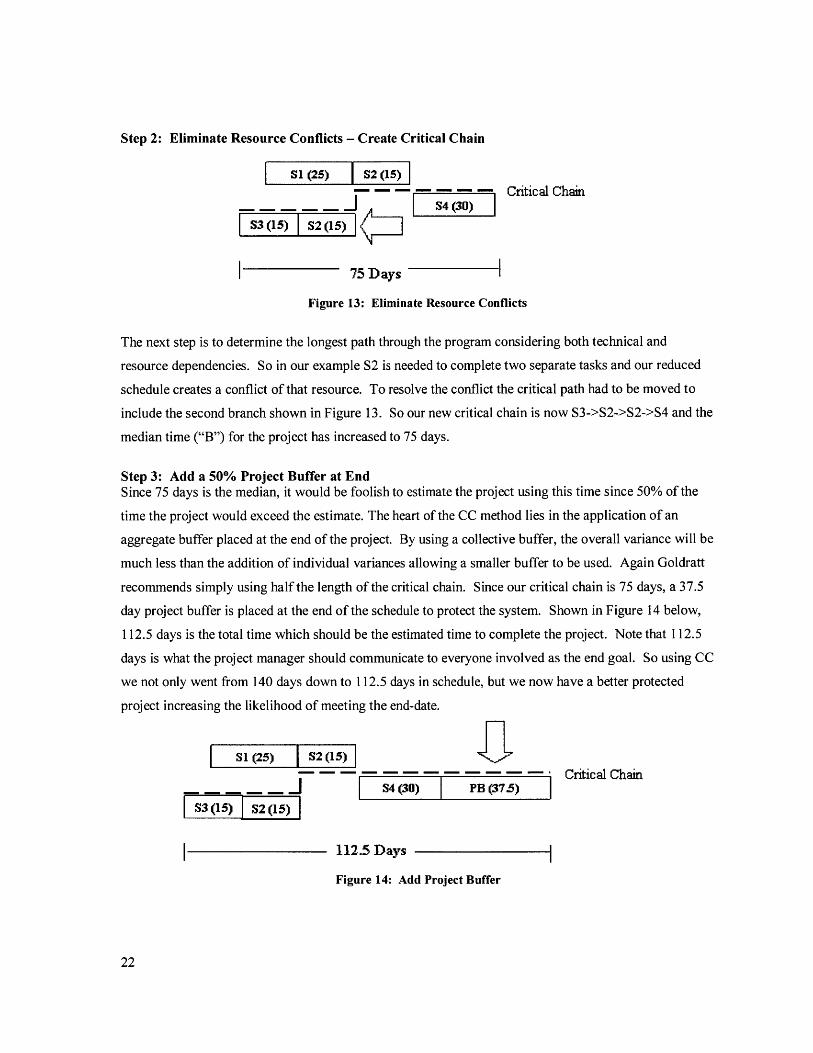
Step 2: Eliminate Resource Conflicts - Create Critical Chain
L 3Z (2 (1)---- - - - - - - - Ctitical Chain_J S4 (30)
S3(15) 52(15)
75 Days
Figure 13: Eliminate Resource Conflicts
The next step is to determine the longest path through the program considering both technical and
resource dependencies. So in our example S2 is needed to complete two separate tasks and our reduced
schedule creates a conflict of that resource. To resolve the conflict the critical path had to be moved to
include the second branch shown in Figure 13. So our new critical chain is now S3->S2->S2->S4 and the
median time ("B") for the project has increased to 75 days.
Step 3: Add a 50% Project Buffer at EndSince 75 days is the median, it would be foolish to estimate the project using this time since 50% of the
time the project would exceed the estimate. The heart of the CC method lies in the application of an
aggregate buffer placed at the end of the project. By using a collective buffer, the overall variance will be
much less than the addition of individual variances allowing a smaller buffer to be used. Again Goldratt
recommends simply using half the length of the critical chain. Since our critical chain is 75 days, a 37.5
day project buffer is placed at the end of the schedule to protect the system. Shown in Figure 14 below,
112.5 days is the total time which should be the estimated time to complete the project. Note that 112.5
days is what the project manager should communicate to everyone involved as the end goal. So using CC
we not only went from 140 days down to 112.5 days in schedule, but we now have a better protected
project increasing the likelihood of meeting the end-date.
SL(25) S2(15)- -'Cntical Chain
- JS4(30) PB (37.5)
S3 (15) S2 (15)
112.5 Days
Figure 14: Add Project Buffer
22
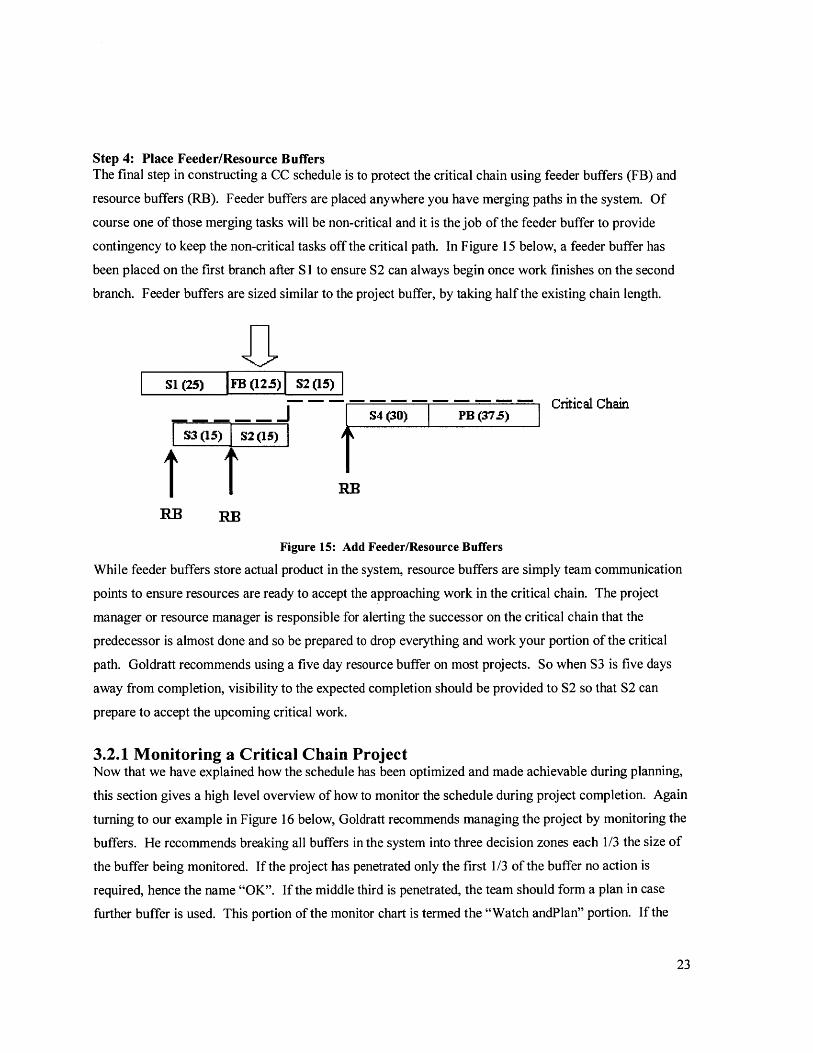
Step 4: Place Feeder/Resource BuffersThe final step in constructing a CC schedule is to protect the critical chain using feeder buffers (FB) and
resource buffers (RB). Feeder buffers are placed anywhere you have merging paths in the system. Of
course one of those merging tasks will be non-critical and it is the job of the feeder buffer to provide
contingency to keep the non-critical tasks off the critical path. In Figure 15 below, a feeder buffer has
been placed on the first branch after SI to ensure S2 can always begin once work finishes on the second
branch. Feeder buffers are sized similar to the project buffer, by taking half the existing chain length.
I S1(25) FB (12.5) 52(15)
Critical Chain_ S4(30) PB (37.5)
S3(15) 52(15)
11 RERB RE
Figure 15: Add Feeder/Resource Buffers
While feeder buffers store actual product in the system, resource buffers are simply team communication
points to ensure resources are ready to accept the approaching work in the critical chain. The project
manager or resource manager is responsible for alerting the successor on the critical chain that the
predecessor is almost done and so be prepared to drop everything and work your portion of the critical
path. Goldratt recommends using a five day resource buffer on most projects. So when S3 is five days
away from completion, visibility to the expected completion should be provided to S2 so that S2 can
prepare to accept the upcoming critical work.
3.2.1 Monitoring a Critical Chain ProjectNow that we have explained how the schedule has been optimized and made achievable during planning,
this section gives a high level overview of how to monitor the schedule during project completion. Again
turning to our example in Figure 16 below, Goldratt recommends managing the project by monitoring the
buffers. He recommends breaking all buffers in the system into three decision zones each 1/3 the size of
the buffer being monitored. If the project has penetrated only the first 1/3 of the buffer no action is
required, hence the name "OK". If the middle third is penetrated, the team should form a plan in case
further buffer is used. This portion of the monitor chart is termed the "Watch andPlan" portion. If the
23
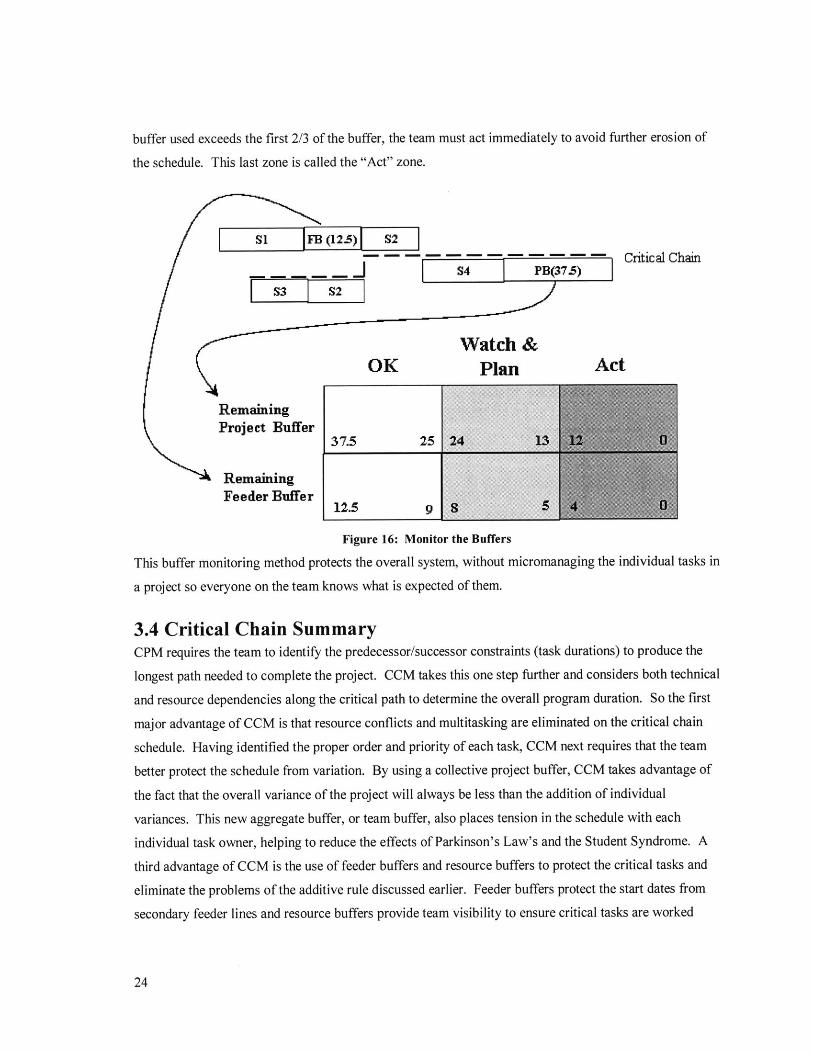
buffer used exceeds the first 2/3 of the buffer, the team must act immediately to avoid further erosion of
the schedule. This last zone is called the "Act" zone.
(125) 52
52
Watch &OK Plan
- - Critical Chain7A)
Act
SI FBm
S;3
RemainingProject Buffer
RemainingFeeder Buffer
12.5 9 18
Figure 16: Monitor the Buffers
This buffer monitoring method protects the overall system, without micromanaging the individual tasks in
a project so everyone on the team knows what is expected of them.
3.4 Critical Chain SummaryCPM requires the team to identify the predecessor/successor constraints (task durations) to produce the
longest path needed to complete the project. CCM takes this one step further and considers both technical
and resource dependencies along the critical path to determine the overall program duration. So the first
major advantage of CCM is that resource conflicts and multitasking are eliminated on the critical chain
schedule. Having identified the proper order and priority of each task, CCM next requires that the team
better protect the schedule from variation. By using a collective project buffer, CCM takes advantage of
the fact that the overall variance of the project will always be less than the addition of individual
variances. This new aggregate buffer, or team buffer, also places tension in the schedule with each
individual task owner, helping to reduce the effects of Parkinson's Law's and the Student Syndrome. A
third advantage of CCM is the use of feeder buffers and resource buffers to protect the critical tasks and
eliminate the problems of the additive rule discussed earlier. Feeder buffers protect the start dates from
secondary feeder lines and resource buffers provide team visibility to ensure critical tasks are worked
24
S4 PB(3
37.5 25
_ _
when the predecessor task is complete. The fourth and final advantage of CCM is the team behavior it
drives. How a coach may lead a track relay race is an analogy often used to describe CCM.
- The only goal in a relay race is for the team of runners to get the baton over the finish line as fast as
possible. In CCM terms the finish line is the estimated team completion date (112.5 days in the example
above).
- In a relay race it is the previous runner's job to get the baton in the hands of the next runner as soon as
possible. Use of a team project buffer encourages everyone to complete their task as soon as possible.
Use of resource buffers ensures communication of the approaching work.
- Once a runner receives the baton he/she must begin to run their part with no distractions. The critical
tasks are the runners and the feeder and resource buffers are the tools used to ensure there are no
distractions.
As explained above, the goal of CCM is to produce a better project management solution aimed at
producing more realistic schedule dates, protecting the system from variation, and encouraging and
rewarding team behavior. While CCM implementation seems simple on paper, replacing existing project
management methods within organizations requires leadership and time to really change the cultural
thinking of an organization. Chapters 6 and 7 will mainly deal with the challenges of critical chain
implementation within the Intel I/Q organization. Before we discuss the implementation of critical chain
let's go back to the first critical step of project planning, to properly identify the problem/project.
25

This page is intentionally left blank
26
4.0 Observations of the Current Reality
Given the task of developing a project management solution better able to reduce the time (duration) and
variability associated with I/Q durations, the first objective was to better define the problem. The first
few months of the internship were spent observing the current I/Q duration management reality within
Fab 24 to better understand the problem. Below are some of the quantitative and qualitative results from
those observations.
4.1 Collected Duration Data AnalysisAround Boeing, the author's current employer, an expression you always hear is "the data will set you
free." So what better way to size-up the problem than to first analyze duration and variability data sets
from past technology ramps within the I/Q organization. To meet confidentiality concerns small parts of
the analysis are shared below, but provide a good picture of historical I/Q duration records.
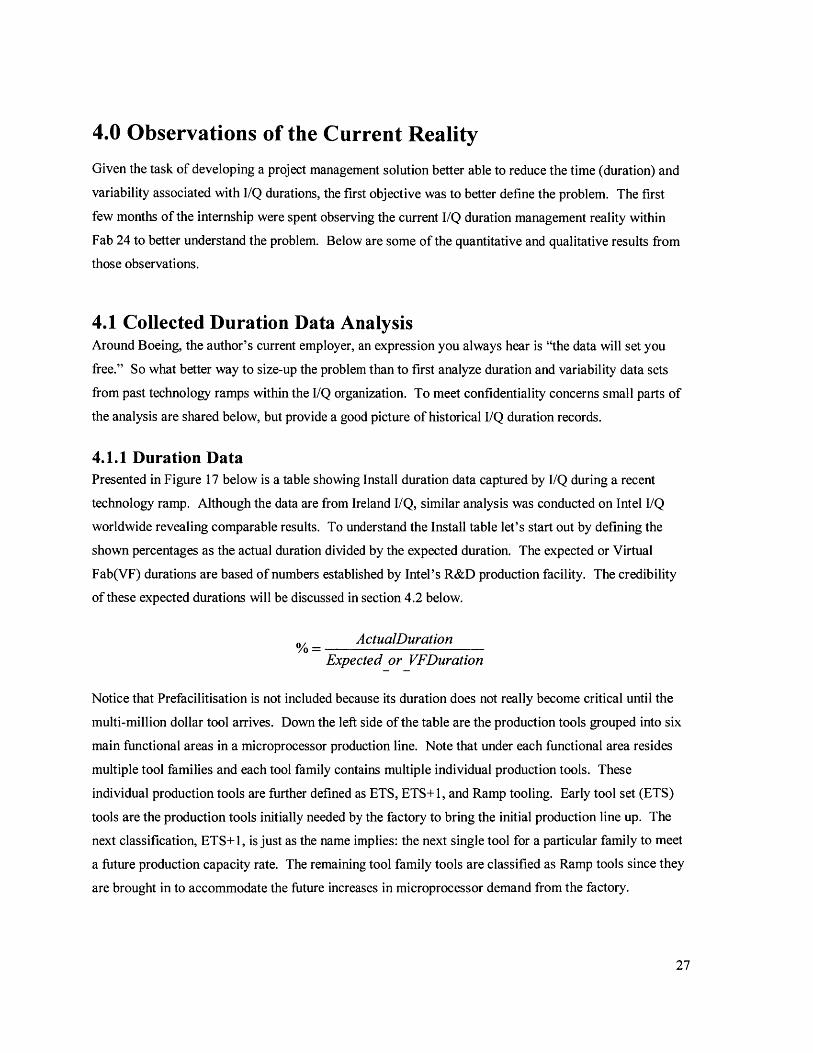
4.1.1 Duration DataPresented in Figure 17 below is a table showing Install duration data captured by I/Q during a recent
technology ramp. Although the data are from Ireland I/Q, similar analysis was conducted on Intel I/Q
worldwide revealing comparable results. To understand the Install table let's start out by defining the
shown percentages as the actual duration divided by the expected duration. The expected or Virtual
Fab(VF) durations are based of numbers established by Intel's R&D production facility. The credibility
of these expected durations will be discussed in section 4.2 below.
% ActualDuration
Expected or VFDuration
Notice that Prefacilitisation is not included because its duration does not really become critical until the
multi-million dollar tool arrives. Down the left side of the table are the production tools grouped into six
main functional areas in a microprocessor production line. Note that under each functional area resides
multiple tool families and each tool family contains multiple individual production tools. These
individual production tools are further defined as ETS, ETS+ 1, and Ramp tooling. Early tool set (ETS)
tools are the production tools initially needed by the factory to bring the initial production line up. The
next classification, ETS+ 1, is just as the name implies: the next single tool for a particular family to meet
a future production capacity rate. The remaining tool family tools are classified as Ramp tools since they
are brought in to accommodate the future increases in microprocessor demand from the factory.
27
InstallationProcess Area I
ETS 74%ETS+1 76%
Rame 47%Process Area2
ETS 91%Rampi 121%
Process Area 3ETS 78%
Rampl 84%Process Area 4
ETS 91%ETS+1 79%Rampi 73%
P rocess Area 6ETSa 77%
ReMPI 76%Process Area 6
ETSI 78%1ETS4-11 76%4
Rampi71%
Total 78%DayS 8 Days Ahead
Figure 17: Historical Duration Data
Looking at the total across the bottom of the figure, on average Install finished eight days ahead of VF
expected schedule. Unfortunately similar data was collected for SQual and IQual and on average both
stages exceeded expected delivery dates. Even with the eight days freed-up by Install, the data clearly
indicated the overall I/Q process on average exceeded the expected VF duration. This pattern was
consistent across microprocessor process areas. Within each process area on average there are only slight
differences between ETS, ETS+1, and Ramp tools. A slight learning curve does appear as you go from
ETS to Ramp tools. In summary, looking at the collected data, on average individual process tools fail to
meet expected VF durations during the I/Q process.
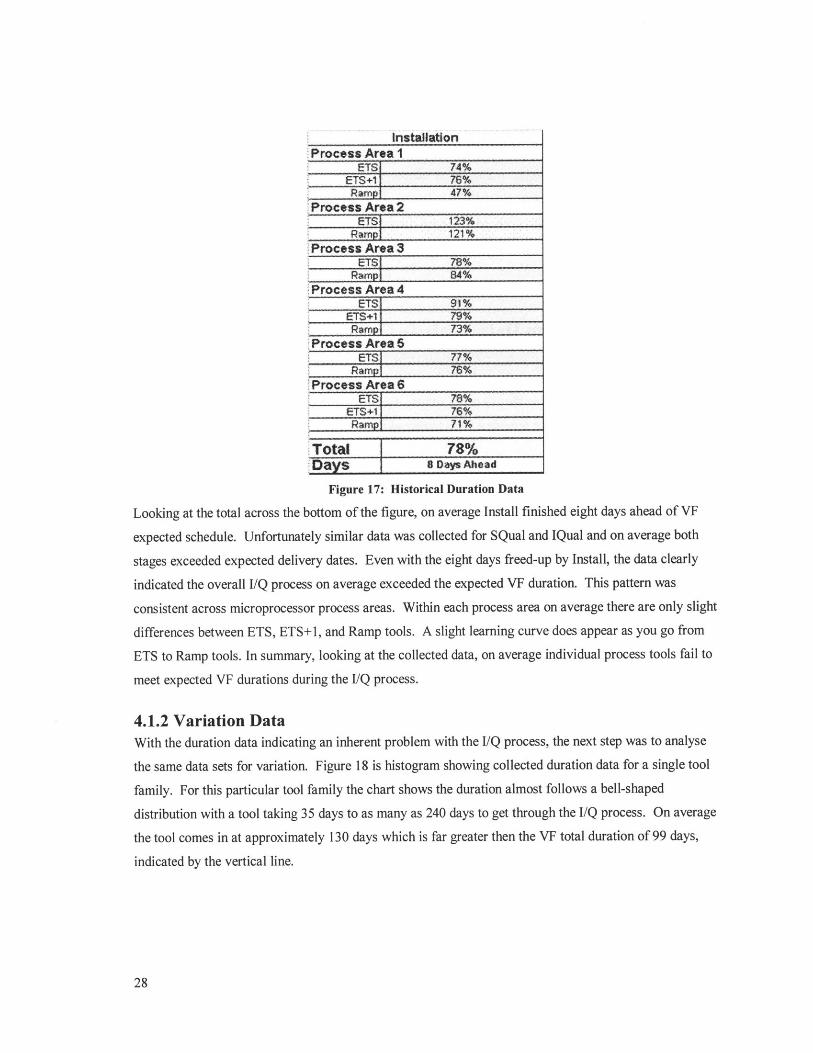
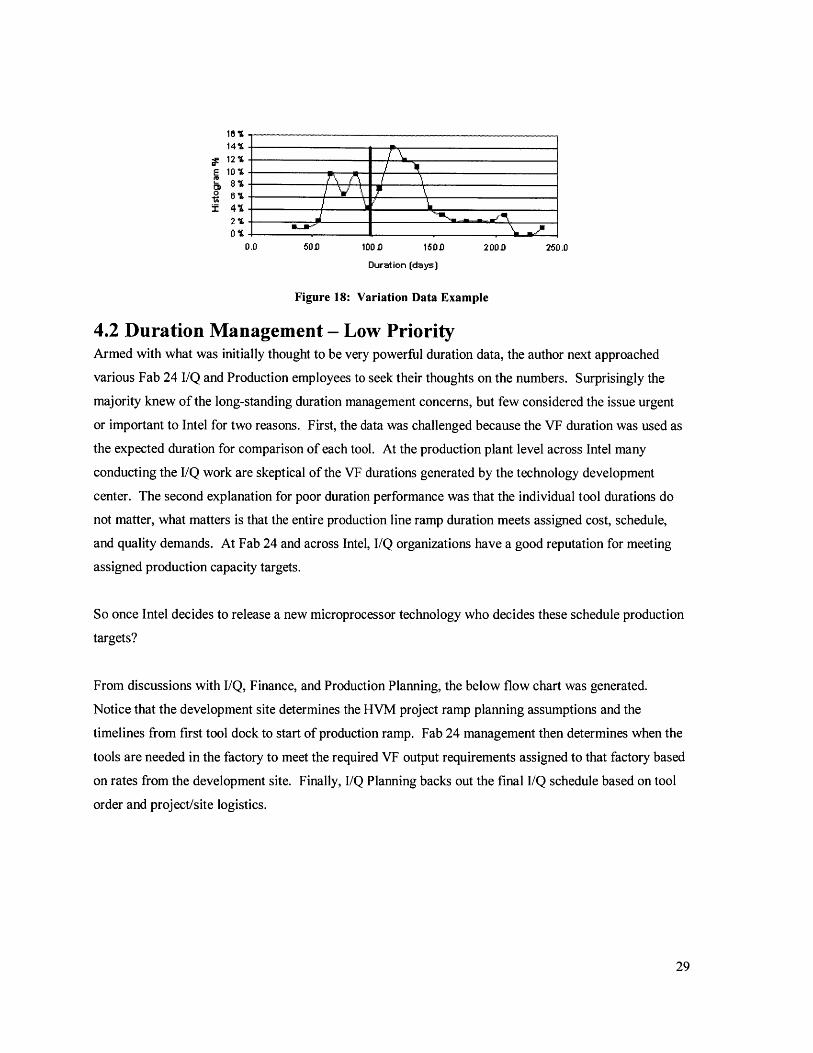
4.1.2 Variation DataWith the duration data indicating an inherent problem with the I/Q process, the next step was to analyse
the same data sets for variation. Figure 18 is histogram showing collected duration data for a single tool
family. For this particular tool family the chart shows the duration almost follows a bell-shaped
distribution with a tool taking 35 days to as many as 240 days to get through the I/Q process. On average
the tool comes in at approximately 130 days which is far greater then the VF total duration of 99 days,
indicated by the vertical line.
28
18%14%12%
E 10%8%
T_ 4%2%0%
______ I
0.0 50D 100 D 150D 200D 250.0
Duration (days)
Figure 18: Variation Data Example
4.2 Duration Management - Low PriorityArmed with what was initially thought to be very powerful duration data, the author next approached
various Fab 24 I/Q and Production employees to seek their thoughts on the numbers. Surprisingly the
majority knew of the long-standing duration management concerns, but few considered the issue urgent
or important to Intel for two reasons. First, the data was challenged because the VF duration was used as
the expected duration for comparison of each tool. At the production plant level across Intel many
conducting the I/Q work are skeptical of the VF durations generated by the technology development
center. The second explanation for poor duration performance was that the individual tool durations do
not matter, what matters is that the entire production line ramp duration meets assigned cost, schedule,
and quality demands. At Fab 24 and across Intel, I/Q organizations have a good reputation for meeting
assigned production capacity targets.
So once Intel decides to release a new microprocessor technology who decides these schedule production
targets?
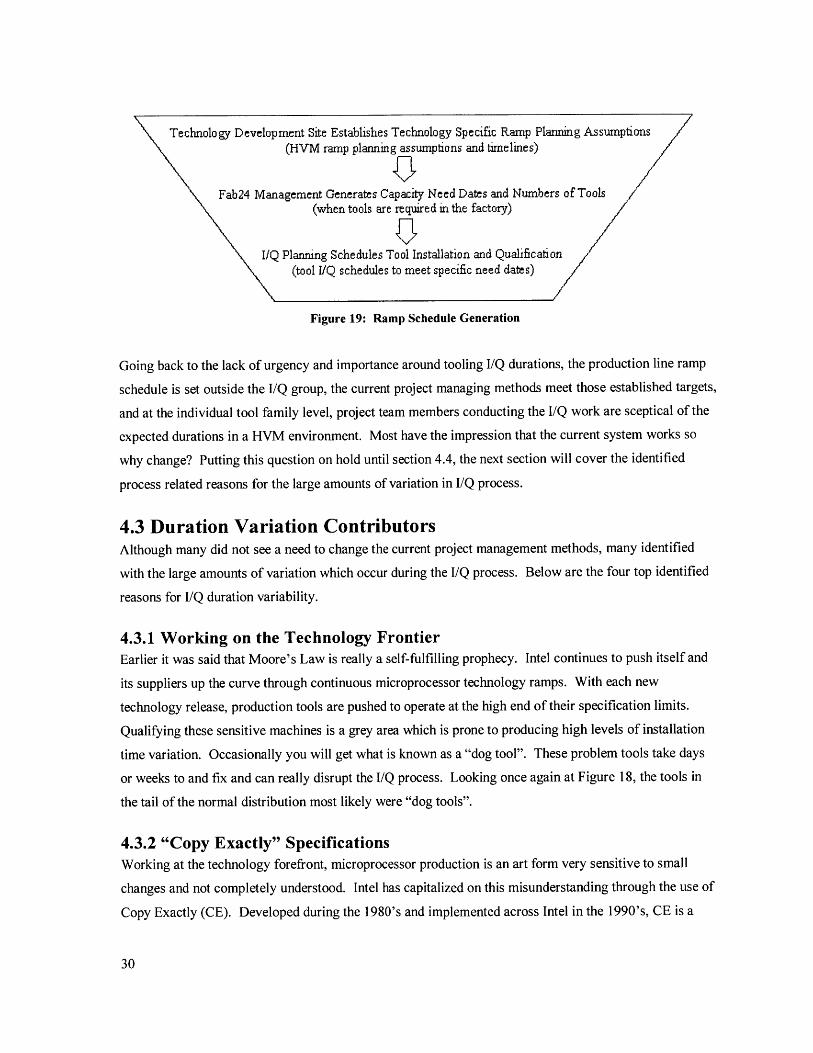
From discussions with I/Q, Finance, and Production Planning, the below flow chart was generated.
Notice that the development site determines the HVM project ramp planning assumptions and the
timelines from first tool dock to start of production ramp. Fab 24 management then determines when the
tools are needed in the factory to meet the required VF output requirements assigned to that factory based
on rates from the development site. Finally, I/Q Planning backs out the final I/Q schedule based on tool
order and project/site logistics.
29
Technolo gy Development Site Establishes Technology Specific Ramp Plannmg Assumptions(HVM ramp planning assumptions and timelines)
Fab24 Management Generates Capacity Need Dates and Numbers of Tools /(when tools are required in the factory)
I/Q Planning Schedules Tool Installation and Qualification(tool I/Q schedules to meet specific need dates)
Figure 19: Ramp Schedule Generation
Going back to the lack of urgency and importance around tooling I/Q durations, the production line ramp
schedule is set outside the I/Q group, the current project managing methods meet those established targets,
and at the individual tool family level, project team members conducting the I/Q work are sceptical of the
expected durations in a HVM environment. Most have the impression that the current system works so
why change? Putting this question on hold until section 4.4, the next section will cover the identified
process related reasons for the large amounts of variation in I/Q process.
4.3 Duration Variation ContributorsAlthough many did not see a need to change the current project management methods, many identified
with the large amounts of variation which occur during the I/Q process. Below are the four top identified
reasons for I/Q duration variability.
4.3.1 Working on the Technology FrontierEarlier it was said that Moore's Law is really a self-fulfilling prophecy. Intel continues to push itself and
its suppliers up the curve through continuous microprocessor technology ramps. With each new
technology release, production tools are pushed to operate at the high end of their specification limits.
Qualifying these sensitive machines is a grey area which is prone to producing high levels of installation
time variation. Occasionally you will get what is known as a "dog tool". These problem tools take days
or weeks to and fix and can really disrupt the I/Q process. Looking once again at Figure 18, the tools in
the tail of the normal distribution most likely were "dog tools".
4.3.2 "Copy Exactly" SpecificationsWorking at the technology forefront, microprocessor production is an art form very sensitive to small
changes and not completely understood. Intel has capitalized on this misunderstanding through the use of
Copy Exactly (CE). Developed during the 1980's and implemented across Intel in the 1990's, CE is a
30
factory build strategy credited with enabling the company to bring factories online quickly with high
yields. [Intel.com, 2 March 2005] CE basically means all fabrication sites, for a particular technology,
are nearly identical to each other so that mistakes are not repeated and products are consistent across sites.
All production sites are mirrored after the Technology Development R&D plant line used to develop the
new technology specifications. Below is an excerpt from Intel's website indicating the magnitude of
oversight provided by CE.
"When "Copy Exactly" was first implemented, only equipment and process output parameters were
copied exactly to the high-volume plant. During the last decade, Intel has widely expanded the functions
that were duplicated in high-volume factories. Now, everything at the development plant - the process
flow, equipment set, suppliers, plumbing, manufacturing clean room, and training methodologies - is
selected to meet high volume needs, recorded, and then copied exactly to the high-volume plant."
[Intel.com, 2 March 2005]
While the net result of CE is reduced quality variation across production plants, CE does contribute to
individual tool installation duration variation. Meeting such exact standards requires large amounts of
oversight and when problems are found, time is always sacrificed to ensure CE specifications are met.
CE also requires increased quality checks leading us into our next variation source; workforce
coordination.
4.3.3 Workforce CoordinationBecause most microprocessor production tools are extremely complicated and unique, each of the four
stages of I/Q requires the coordination of highly skilled crafts, technicians and engineers from all over the
world. Existing planning and project management methods lack sufficient communication between
Install, SQual, and IQual. From observations the three stages were planned and managed almost
independently of each other. Combining this "over the fence" planning and management style with the
large amounts of variation in the system, the effects of Parkinson's Law, Student Syndrome, multitasking
and the additive rule discussed in Chapter 2 further magnify the variation.
4.3.4 The Working EnvironmentFinally the installation and qualification of production tools takes place in a dynamic environment. For
starters microprocessors must be made in an ultra-clean environment to protect the microscopic circuitry.
This means the production tools must be installed and qualified in an environment extremely sensitive to
vibration and dust. To further complicate matters, the production facility ramps to meet capacity. That
means tool installation occurs next to existing running production machines. So, something as simple as
31
drilling a hole becomes very complicated requiring training and oversight because it has the potential to
bring down the whole production plant. To protect production, I/Q must notify and/or seek permission
for many of the installation procedures. Because production has microprocessor demands, permission is
often not granted forcing a complete stop in the installation process. It is not uncommon for the Install
team to wait days and sometimes weeks at a time to finally get permission to conduct an hour-long job.
4.4 The Buffer ProtectsGoing back to the question presented at the end of section 4.2, if the current I/Q system achieves Intel
targets why must it change? The author would argue there are significant amounts of buffer in the system
to protect technology ramps and in the future these buffers may not be as large. How else could a system
accommodate the large amounts of duration variations shown in Figure 18 and the missed schedule
durations shown in Figure 17 and still meet end targets?
Intel has always been a powerful force in the microprocessor market. At the close of 2004, Intel
maintained 82.3% of the world's microprocessor market share. [Hachman, 2005] In such a powerful
position you can understand not needing to run a "lean" I/Q process. In fact to protect themselves from
cannibalizing their existing product lines, it is in Intel's best interest to pace new microprocessor
technology introductions. As shown in their extreme use of CE, product yield (quality) is also extremely
important to Intel during a technology ramp. To protect quality, Intel buffers customer need dates and
places requirements for redundant tools sets (RTS) in the production system to protect internal capacity
targets.
To finish answering the question above, Advanced Micro Devices (AMD) maintains the other 16.6% of
the market share and has the potential to claim even more in the future. [Hachman, 2005] Remember that
it is in the customers' best interest to have competition in the market place.
4.5 Observations SummaryAs an outsider, looking at the above data trends one might conclude Intel's I/Q process was out of control
and in need of immediate attention. As a new I/Q employee, the author was surprised to quickly learn
that this was not the current feeling inside Intel. Through interviews and daily communication with
various I/Q and production employees the author found that most knew of the duration management
concerns, but few considered them urgent or important. Across Intel in fact, I/Q organizations are known
for meeting expected end cost, schedule and quality targets.
32
One explanation for this relaxed attitude is based on a heavily protected technology ramp schedule.
Schedule buffer and tool capacity buffers are added to protect the existing product lines, promised
customer dates, and to ensure high quality products are released. As competition in the industry continues
to climb, Intel must examine ways to reduce their costs and time-to-market which will involve re-
examining their current buffer strategies. The author believes this thinking is what generated his
assignment in Ireland.
Focusing on the process related activities which add variation to the I/Q process, working on the
technology frontier, meeting CE specifications, coordinating a highly specialised workforce and working
in an extremely sensitive environment were identified as the top contributors. Focused on these variation
contributors, the next step was to develop possible solutions.
33

This page is intentionally left blank
34
5.0 Overview of Proposed Solutions
Knowing there was by no means a cultural ground swell around the issue of duration management, it was
important that proposed solutions obtain support from the workforce implementing the improvements.
Given location within the company and a short six-month timeline, the author chose to focus on the
workforce and environment sources of variation addressed above.
5.1 Workforce Variation - Project Management ChangesObserving the current I/Q project management methods, this is the area marked by poor initial planning,
ineffective schedule protection, and a failure to take advantage of teamwork. To tackle workforce
coordination issues the intern host site manager asked that the author focus on refining current I/Q project
management methods. The first step was to examine a recent checklist implementation success.
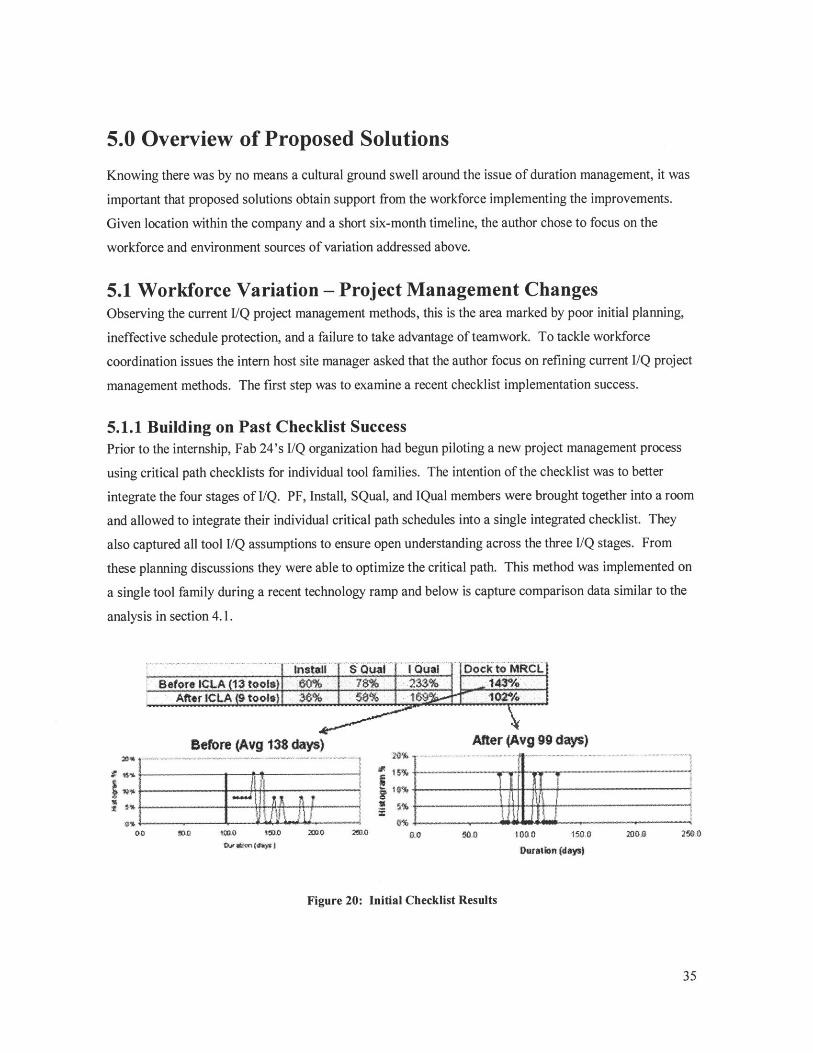
5.1.1 Building on Past Checklist SuccessPrior to the internship, Fab 24's I/Q organization had begun piloting a new project management process
using critical path checklists for individual tool families. The intention of the checklist was to better
integrate the four stages of I/Q. PF, Install, SQual, and IQual members were brought together into a room
and allowed to integrate their individual critical path schedules into a single integrated checklist. They
also captured all tool I/Q assumptions to ensure open understanding across the three I/Q stages. From
these planning discussions they were able to optimize the critical path. This method was implemented on
a single tool family during a recent technology ramp and below is capture comparison data similar to the
analysis in section 4.1.
Ins * Si" 0 uIl I Qual A o71 Co MtCLBetoro ICLA (1 tooIs 6O% 7$% 233% 143%
After ICLA 9 tooQs) 3$% $$% 45 102%
Before (Avg 138 days)p
4.4*~J
~2WT~F700 ~0 icoo tS3i~ Z~0 2~
0~.v t~m~ ~E&ys
After (Avg gg days)
...... ....... .. 4 1
CI 0.0 5040 1000 15040 200D 250
fluratiolt tdyqft
Figure 20: Initial Checklist Results
35
'D
From the data above, you will notice dramatic duration and variation effects between the 13 tools
before checklist implementation and the 9 tools after. The strength of the checklist above was
from improving the initial planning of the I/Q schedule. Once planning was complete the three
stages went back to individual project management efforts during implementation. The new
integrated schedule also did not better protect the project schedule from variation, relying on
individuals to protect their individual tasks. Although the results of the upfront planning met
targets, this was for a single tool family during a slow time in the I/Q organization and under the
current buffers of the technology ramp. Simply implementing the above checklist procedure
during a new technology ramp across hundreds of tools would not be as fruitful. The addition of
the checklist also ensured that the overall dock to MRCL duration was met for this tool type by
focusing on the more predictable activities of Install and Supplier Qual to give buffer protection
to the more variable activity of Intel Qual and from this success to promote the continued use in
the Intel Qual activities.
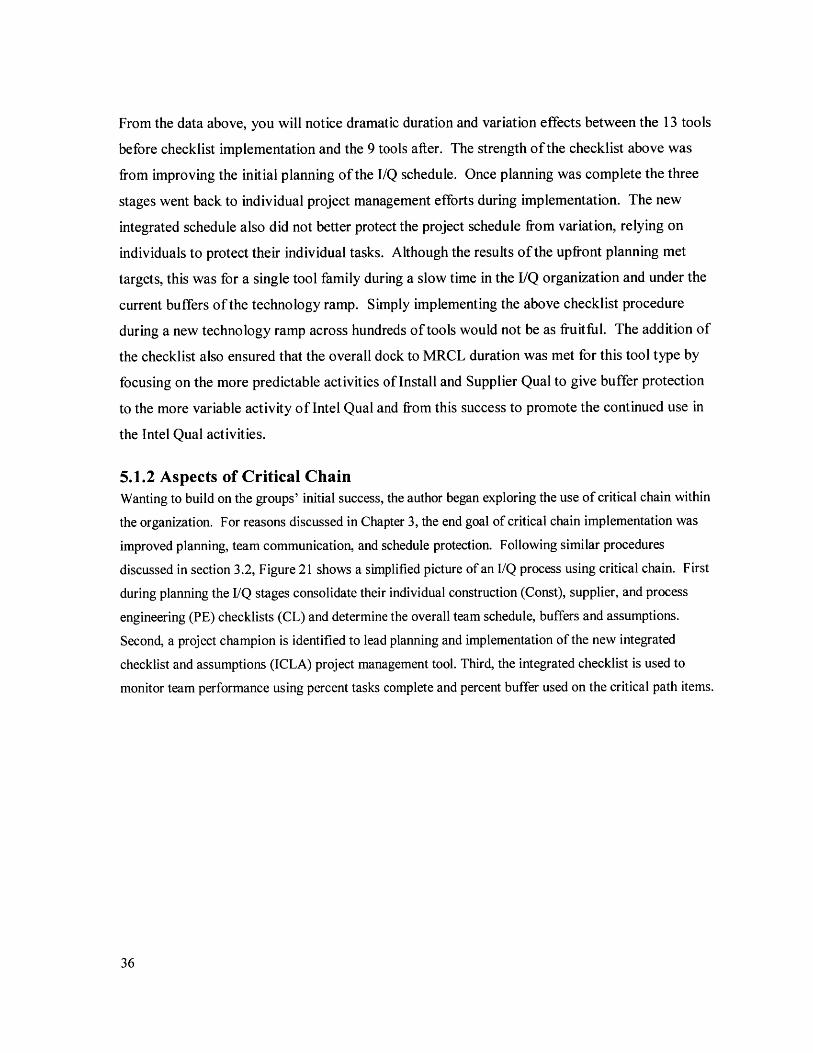
5.1.2 Aspects of Critical ChainWanting to build on the groups' initial success, the author began exploring the use of critical chain within
the organization. For reasons discussed in Chapter 3, the end goal of critical chain implementation was
improved planning, team communication, and schedule protection. Following similar procedures
discussed in section 3.2, Figure 21 shows a simplified picture of an I/Q process using critical chain. First
during planning the I/Q stages consolidate their individual construction (Const), supplier, and process
engineering (PE) checklists (CL) and determine the overall team schedule, buffers and assumptions.
Second, a project champion is identified to lead planning and implementation of the new integrated
checklist and assumptions (ICLA) project management tool. Third, the integrated checklist is used to
monitor team performance using percent tasks complete and percent buffer used on the critical path items.
36
InstallationIntegrated Checklist & Assumptions
mvawdl e FeederBuffer
SupplierQualficationP 4 P5
Buffer
- Ensures everyone develops, shares, & optimizes
SntpI integration level critical work flowQuulncaton " Uncovers hidden assumptions
" Assigns project champion (FAL)
ICLA End Product -Daily Management Tool ProvidesV Updated Critical Path Status
% tasks complete% buffer used
Captured Working Assumptions
Figure 21: Proposed ICLA Process
The net result would be a continued focus on high yield, but with an added focus on schedule since the
improved project management method would:
* use "median" task durations
* aggregate and make buffer time visible at the end of the critical chain
* add a high degree of focus on interrelationships among tasks
* add throughput focus rather than milestone focus
Of course critical chain requires extensive changes in behaviour and Figure 21 is the end-state which
takes time and leadership to achieve as will be discussed in the next chapter.
5.2 Environment Variation - Production Impact Approval SystemRevampFrom interviews and observations, data from I/Q and Production pointed to the existing Impact approval
system as a large contributor to duration variation. A production impact requires factory permission to
temporarily bring down parts of an existing production. For example if you had to tie-in a new tool
exhaust duct into existing building exhaust system, all tools using that exhaust ducting would have to be
shut-down or impacted. Every morning multiple impacts are presented to the factory for acceptance or
rejection. Much of the time those impacted machines are needed to meet microprocessor delivery goals,
so the factory rejects the work and requests it be moved to a later date.
I/Q Focus - Reduce Rejections
37
Imagine you had a workforce of construction trades, engineers, and quality focals ready to complete the
tool duct installation that morning, but two hours prior to the scheduled time you are told the impact was
rejected and to try again next week. That means not only must you find other work for the workforce to
fill today's void, but you must schedule their time next week and hope the impact is accepted. Besides
the workforce coordination issues, now the tool Install schedule must slide affecting SQual and IQual
schedules. This scenario plays out each week, sometimes each day in the I/Q organization. Obviously
I/Q would like to reduce the number of rejected impacts as much as possible.
Production Focus - Group Impacts and Accommodate Production ScheduleFrom a production standpoint I/Q impacts are often viewed as a necessary evil which hinders the daily
production schedule. Attending many of the impact review meetings an excuse to reject impacts that was
constantly mentioned by production was "we are here to send microprocessors out the door." By
rejecting an impact today the weeks capacity may be met, but the resource snow-ball effect of the
rejection within the I/Q organization may eventually hinder long-term capacity targets. This thinking
once again showed Intel placing less value on I/Q resources than production resources.
To aid the factory in the future, I/Q can provide two aids which should increase impact acceptance rates.
First, I/Q can put more effort into grouping similar impacts to reduce the number of factory shut-downs.
For example, in the tool duct example above, all future impacts in the area of the tool as well as all
impacts affecting tools on the central duct could be completed at the same time. Second, I/Q could better
forecast upcoming impacts to the factory so that the factory could better work to accommodate the
production schedule. Providing this future visibility will help increase communication and shared
interests between groups.
Overall FocusKey takeaways from discussions led to the following improvements to the existing impact system;
* simplify the submission/review process - current process very time intensive and confusing to
the requestor and the factory
" begin tracking approval rates - important data to determine trends between functional groups
" begin providing future impact visibility - helpful for resource planning for I/Q and factory
* begin grouping similar impacts - synergy would reduce the overall number of impacts
5.3 Proposed Solutions SummaryOnce again the goal of this project was to reduce variation within I/Q and provide a means to further
reduce overall durations on future microprocessor technology transitions. Workforce and environmental
sources of variation were chosen to meet the six-month assignment timeline. To tackle workforce
38
variation the existing integrate checklist concept served as a starting point since it improved the initial
planning of the I/Q process and already had some successful results. Added to the process in the
proposed ICLA process is a means for increased team communication and schedule protection during the
daily management of the project through critical chain methodologies. To tackle environmental variation
factory I/Q impact approval process was selected since many parties pointed to the system as a major
bottleneck in the process. Similar to the ICLA, the intention of the I/Q impact approval process
improvements were to improve communication between team members.
39

This page is intentionally left blank
40
6.0 Duration Management ExperimentationWith the areas of focus identified above, this chapter discusses the implementation of those proposed
solutions.
6.1 Workforce Variation - Integrated Checklist and Assumptions(ICLA)Through interviews, data analysis, and establishment of a cross-site duration task team, we set out to
develop and implement a standardized critical chain process to better integrate the three stages of the I/Q
process. Towards the end of the internship the Integrated Checklist and Assumptions Best Known
Method was released. At Intel a Best Known Method (BKM) is a simple whitepaper used to share
information inside the company. This Rev 1 BKM was the product of working with both Ireland (Fab 24)
and Arizona (Fab 12) I/Q organizations to begin develop a standardized ICLA format for future
technology ramps. Below is a summarized version of that initial ICLA BKM released to the company.
6.1.1 Released ICLA Best Known Method - Rev 1There exists high variability on process tools meeting standard installation and qualification (I/Q)
schedule durations. Intel has begun applying critical path project management philosophy to aid in the
reduction of process tool I/Q durations and to increase the predictability of qualification meeting standard
durations. The Integrated Checklist and Assumptions (ICLA) method was developed to better coordinate
technology process ramps across the four main I/Q segments; Prefacilitisation (PF),
installation/construction (Install), supply qualification (SQual), and Intel qualification (IQual). This is
accomplished by ensuring that everyone develops, shares, and optimizes the critical work flow involved
with installation and qualification of high volume manufacturing (HVM) tools.
6.1.1.1 ICLA Objectives* Institutionalize a closed-loop process to enable continuous improvement on I/Q planning
durations over technologies.
" Increase predictability of I/Q project deliverables for Intel, Suppliers, and Crafts on HVM ramps
6.1.1.2 ICLA OwnerThe intention of the ICLA is to reduce variation through increased integration of the four I/Q segments.
The ICLA was developed for use by the tool champion (Functional Area Leads (FAL's) or Group Leaders
(IQGL's)). They are accountable to ensure an ICLA is developed, in place and used for the installation
and qualification of HVM tools.
41
Key contributors to the ICLA include; the tool supplier, process engineering (PE), manufacturing
technician (MT), construction trades, project managers (PM), construction consultants (CC), and
construction managers (CM)).
6.1.1.3 ICLA GenerationTimingTo yield greatest benefit the ICLA generation process should begin seven weeks prior to I" tool
prefacilitisation tool dock. This ensures plenty of time to optimize the existing work flow during the
generation process. It is also recommended that the ICLA be generated all at once from PF through IQual.
If, however, the team does not have all necessary information to complete through IQual, the process can
be broken into two phases.
* Phase 1- PF, Install and SQual - completed 4 weeks prior to PF start. Note the SQual may not be
fully determined in phase one of development, services to enable SQual start should be covered.
* Phase 2- Remainder SQual, IQual, integrated into one ICLA - completed prior to tool set.
Timing Process Note: Both ICLA planning schedules above depend on timing of the actual resource
selection for a technology ramp. In some cases, contractors, trades and even the tool champion are
assigned to the project very close to the 10 tool prefacilitisation tool dock, forcing the ICLA generation
process later in the schedule. The generation schedule must be compressed to accommodate the Is tool
prefacilitisation tool dock.
Communicate to the TeamAs mentioned earlier, the ICLA ensures everyone develops, shares, and optimizes the critical work flow
involved with installation and qualification of HVM tools. Before the generation process can occur, the
key contributors must all be educated about the ICLA process. This can be done in a group meeting or in
a one-on-one environment by the tool champion. The ICLA is best presented as a communication tool
which will allow everyone improved coordination information - leading to improved resource utilization.
PreparationOnce key contributors are brought up to speed, the next step is for everyone to individually prepare three
items.
* Item 1: A complete list of all the critical steps involved with your individual work flow. These
critical tasks should be defined as either series or parallel tasks. Series critical tasks are those
tasks which drive the actual work duration. As the name implies, series critical tasks must be
completed sequentially and each task is dependent on the one before it. Parallel critical tasks, on
42
the other hand, do not drive the overall duration and do not necessarily need to be completed in a
particular order. They are, however, tasks which have a high potential to affect series critical
tasks if left unmonitored.
" Item 2: Minimum technical durations (MTD) for each of the series and parallel tasks must next
be determined. MTD's can be defined as the time to do the work given everything goes well and
all resources are present (the duration without the typical safety buffer). The industry standard
for developing a representative MTD is to list the 50/50 chance of finishing on time. That means
50% of the outcomes will be less than the time and 50% of the outcomes will be greater. It is up
to the individual to decide their true MTD, but care must be taken to insure buffer is not captured.
Buffer will be captured later in the process.
" Item 3: The last item is a complete list of your working assumptions. Working assumptions can
be listed resource and schedule demands which are required prior to beginning your portion of the
work in order to achieve the aggressive MTD. Generate the list by assuming infinite resources
and top priority for your portion of work.
Generation Process notes: Item 1 is best captured on MS Project Gantt format, or similar program, since
it will help with the overall integration. This is the only item sent to the tool champion in preparation for
the integration meeting. Items 2 and 3 can be captured in Word, Excel or in email form since they are just
your notes to be brought to the integration meeting. Expected time to complete individual three items is
3-4 hours, but should be done over 3-4 day period giving time for reflection and optimization.
IntegrationWith individual preparation complete, the tool champion is responsible for collecting/compiling
everyone's task list (item 1). The next step in the process is the integration of the task list and the
development of a team working assumptions list. This is done during a 2-3 hour meeting organized by
the tool champion and attended by all key contributors. At the meeting the tool champion leads the group
through three steps.
Step 1: Task List Optimization/Agreement
Beginning with the combined task list, the group must first step through the list task-by-task and organize
the events into an agreed sequence. Once complete, the team must then focus on possible improvements
to the current sequence. The mindset should be that the time from Install start to IQual finish is critical
and every effort should be made to reduce the overall duration. Improvements such as moving work back
43
into the less critical prefacilitisation schedule or rearranging task order to better utilize resources have in
the past yielded substantial improvements. While the group is securitizing the list, each task must be
identified as series or parallel task (see Item 1 above for definition). Put an (S) at the end of every series
task and ensure they are in sequential order. For the parallel tasks put a (P) at the end of each task and
ensure they are placed in approximate order with series tasks.
Step2: Duration Optimization/Agreement
Once the task list has been scrutinized and optimized, the group must next agree on the duration of each
task. Every task duration should be challenged to ensure a true MTD is provided. Durations in place, the
next step is to link the series tasks and ensure proper placement of the parallel tasks. Linked series tasks
will give the team the overall MTD. Note the MTD does not contain buffer which will be added later in
the process.
Step 3: Working Assumptions Development
The team MTD is effectively the time to do the work given everything goes well and all resources are
present (the duration without the typical safety buffer). The working assumption list is created by the
team to document the assumptions made to develop the MTD. Base build preparation, quality support,
impact factory buy-off, and facilities turn-on support are just a few items captured in the list. Another
benefit of the working assumption list is the elimination of any past hidden assumptions between team
members.
Integration Process Note: The integration meeting, by far, adds the most value to the existing process as
well as the ICLA. Depending on the tool type, 2-3 hours may not be sufficient to complete the three steps
above. It is critical that proper time is added to ensure an optimized task list and assumptions are built.
This may include additional integration team meetings. Note that the ICLA is tool type specific, so once
complete is used for all tools entering the factory.
6.1.1.4 ICLA FormationWith the completed linked task list, durations, and working assumptions, the tool champion is ready to
build the ICLA worksheet. This is best accomplished by modifying the existing ICLA workbook
provided at the Duration Task Team website.
The ICLA workbook contained four worksheets
44
* Worksheet 1: The Checklist
The main task list for a tool family type used to track progress of every tool ID.
" Worksheet 2: Working Assumptions
Maintains an up-to-date list of working assumptions agreed to by team.
" Worksheet 3: Task Revision List
Maintains a running list of all revisions proposed (accepted/rejected) for changing the current
ICLA checklist.
* Worksheet 4: Key Contributors
Maintains running lists of everyone involved in the ICLA development (FAL, IQGL's, tool
suppliers, process engineering (PE), manufacturing technician (MT), construction trades, project
managers (PM), construction coordinators (CC), and construction managers (CM))
6.1.1.5 Buffer SelectionUnfortunately the I/Q organization was not ready to accept true CCM buffer management methods taking
50% of the total critical chain MTD. Instead they wished to use the VF standard duration for each tool
family as the upper limit of duration. So the buffer equalled the VF standard duration minus the team
agreed MTD. On certain tools the VF duration was challenged using site-wide statistically achievable
goals. So by selecting a buffer size equal to the statistical goal minus the MTD, the team in a sense
placed positive schedule tension in the system. How this buffer is divided between tool install buffer
(feeder) and qualification buffer is up to the individual tool champion. See assumptions for explanation
of feeder buffer.
6.1.1.6 ICLA ModificationsModifications to the ICLA worksheet should be kept to a minimum to maintain the standard format
across tool families. If changes are needed, they must be agreed on at the local site tool team level since
everyone will utilize the worksheet. If task list changes are required after generation, be sure to capture
change in the Task Revision List to ensure proper documentation. Adding/removing tasks can be
accomplished by simply adding/deleting rows on the worksheet.
45
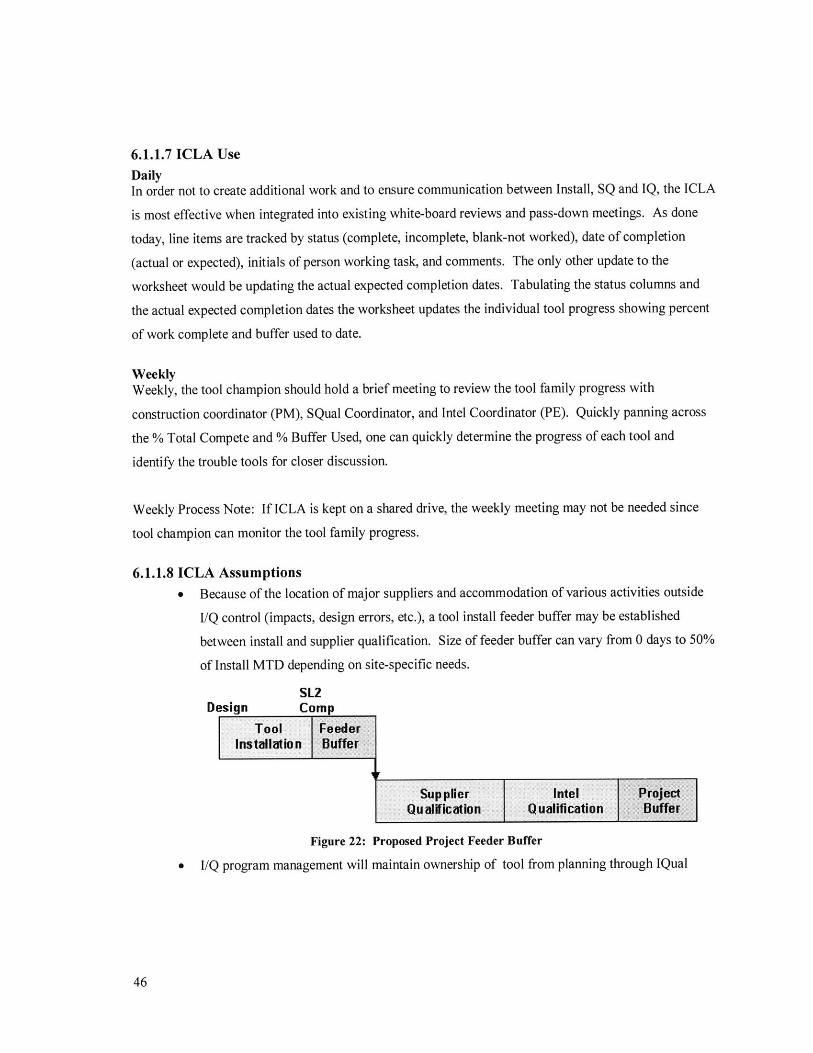
6.1.1.7 ICLA UseDailyIn order not to create additional work and to ensure communication between Install, SQ and IQ, the ICLA
is most effective when integrated into existing white-board reviews and pass-down meetings. As done
today, line items are tracked by status (complete, incomplete, blank-not worked), date of completion
(actual or expected), initials of person working task, and comments. The only other update to the
worksheet would be updating the actual expected completion dates. Tabulating the status columns and
the actual expected completion dates the worksheet updates the individual tool progress showing percent
of work complete and buffer used to date.
WeeklyWeekly, the tool champion should hold a brief meeting to review the tool family progress with
construction coordinator (PM), SQual Coordinator, and Intel Coordinator (PE). Quickly panning across
the % Total Compete and % Buffer Used, one can quickly determine the progress of each tool and
identify the trouble tools for closer discussion.
Weekly Process Note: If ICLA is kept on a shared drive, the weekly meeting may not be needed since
tool champion can monitor the tool family progress.
6.1.1.8 ICLA Assumptions* Because of the location of major suppliers and accommodation of various activities outside
I/Q control (impacts, design errors, etc.), a tool install feeder buffer may be established
between install and supplier qualification. Size of feeder buffer can vary from 0 days to 50%
of Install MTD depending on site-specific needs.
SL2Design Comp
Tool FeederIns tallatio n Buffer
T Sup plier Intel ProjectQualification Qualification Buffer
Figure 22: Proposed Project Feeder Buffer
" I/Q program management will maintain ownership of tool from planning through IQual
46
* Install to IQual time is critical. Along with critical chain process, a major source of duration
reduction has and will continue to come from pulling work back to before tool set
(prefacilitisation)
* ICLA will be managed and maintained by FAL's and IQGL's for tool family
" Intel has recently applied statistical techniques to analyse duration performance across HVM
projects. This data is used to generate upper bound IQ duration limits across Intel for the
various tools Goals were then set for each tool based on historical data and these goals will
serve as a process check to the final duration generated by the ICLA tool team. The total
duration will be site specific, but all final times must not exceed the identified VF duration
standard durations.
6.1.1.9 ICLA Q and ACan the tool champion (FAL or IQGL) delegate ICLA generation and application to various tool
owners (PM, PE, etc)?
The intention of the ICLA is to better integrate the work completed by the individual owners. The tool
champion is the only member of the team who has the complete visibility and responsibility for the tool
family. So although parts can be delegated, the tool champion needs to be intimately involved in every
aspect of the process.
Does the importance lie in the development of the checklist alone or also in their use as a better
means of cross-functional communication?
Both, importance lies with development process and the use of the checklist as a tool to reach program
goals. Experience to date has demonstrated the immediate win to the project team is to jointly develop
the ICLA in a scenario where all stakeholders are present. The process generates an open discussion
where all tasks are discussed (common team understanding of what is involved and when); process also
questions breakthrough change vs. 'we always do it this way'. The output of the ICLA development
journey yields a common team understanding of tool scope, minimum time to complete a task (including
what can be done in parallel or in series and associated risk) and a general sense of inclusion of all team
members (trades, PM, MTs, PE, Vendors). Team judgement is then used to plan buffer size due to risk.
Will the use of detailed checklists for all tools create an enormous overhead burden on project
resources to keep current?
47
The ICLA is to be developed as part of the planning phase for a net HVM technology. Use of the ICLA
should take the same if not less time than currently invested in the program management of the tool I/Q
process. Maintaining open communication between functions will only help increase resource utilization.
What is the balance between detail and time to track detail vs. high level and shared understanding,
behaviour and mgmt style?
The ICLA is a tool for the site project teams to improve predictability and achieve significant duration
reduction. The format of the checklist will balance high level project tracking by toolset with the ability
to track individual tasks should the risk warrant it. The recommendation is to use the checklist as part of
daily operations; this will vary based on team experience.
Is the final tool a checklist or a micro-schedule or combination of both?
It's a combination of both that need to be an integral part of daily operations. Tool set dates establish the
start and VF duration determine the finish. The ICLA works between these dates to insure scheduled
dates are met.
Will the standalone checklist, used by the individual project teams, need to be linked directly to the
overall project macro schedule?
Indirectly the ICLA is linked through the buffer to the I/Q schedule. The current intention of the ICLA is
to more predictably meet the current scheduled durations.
Eventually the true benefits of the ICLA will be to provide Intel I/Q with a method for exceeding VF
standard durations. This will require that the workforce get away from working to an end date or
milestone and instead work to complete every tool as quickly as possible. For this project management
change to occur, more importance and urgency must be placed on reducing durations by company
leadership. Also, planning and finance (both factory and corporate) must become more flexible to
accommodate reduced ramp durations. As with all technology life cycles, reduced margins and increased
competition requires that we continually reduce our technology ramps cycles to stay competitive. The
ICLA is an early step, establishing the foundation for achieving a reduced development cycle.
6.1.2 ICLA Implementation and Initial ResultsBy no means does the above ICLA BKM capture the complete critical chain project process discussed in
Chapter 3. It was intended as a start towards a better upfront plan, a more effective buffer management
strategy, and a process to encourage better team dynamics. Implementation of the ICLA was occurring as
48
the author left the assignment in December, 2004. Rather than roll the process across the entire upcoming
technology ramp, 37 tool families were selected for ICLA implementation. From six months in I/Q, the
author left with serious reservations about the successful implementation of the process on the 37 tools.
Even though the ICLA BKM was developed using Fab 24 and Fab 12 recommendations, major resistance
occurred around the use of a central project buffer. This resistance was not due to lack of understanding
the problem or the solution, but that the priority for shifting to a new team model was very low at the
working level. Based on comments from Chapter 4, this thinking will be explained fully in Chapter 7.
6.2 Environment Variation - Equipment Reservation System (ERS)Along with existing project management practices, the overburdened production impact system was
identified as a major constraint in the system. Unlike the ICLA development, finding support for the
impact system optimization was a much easier task since it was a simple process fix requiring little
workforce change. Working with I/Q's systems division, we went about changing the current online
impact system. The first change we made was the name of the system. Now called the Equipment
Reservation System (ERS), we felt this name more softly described the systems and I/Q's main objective.
We next met with everyone involved with the system and optimized the approval flow, eliminating many
steps in the existing process. This involved placing requestor time restrictions to eliminate continual late
entries into the system. Once we had the process set, we next updated and further automated the approval
database. With every impact, before it goes to the factory, tool engineers and micro-contamination
experts must be notified of the impact. In the past it was the responsibility of the requester to track-down
these individuals. Adding to the online database, the new system automatically sends email notifications
to these individuals for approval. Finally we created a user-friendly web-based environment more
tailored to the needs of the requestor and the factory.
With the new ERS system in beta testing, we also began working on a means of tracking past data and
predicting future data. By capturing past approval metrics both I/Q and Production are able to track
target performance (factory sets a 90% approval goal) and examine trends between the different shifts.
Figure 23 presents representative output of the system showing the factory target of 90%, the weekly the
number of impacts reviewed/accepted, and finally the comparison of shift acceptance rates. Note that the
data is actual collected data during the last two quarters of 2004. The data makes it clear that factory
acceptance targets are not being met across shifts and that shift B acceptance rates are especially low.
49
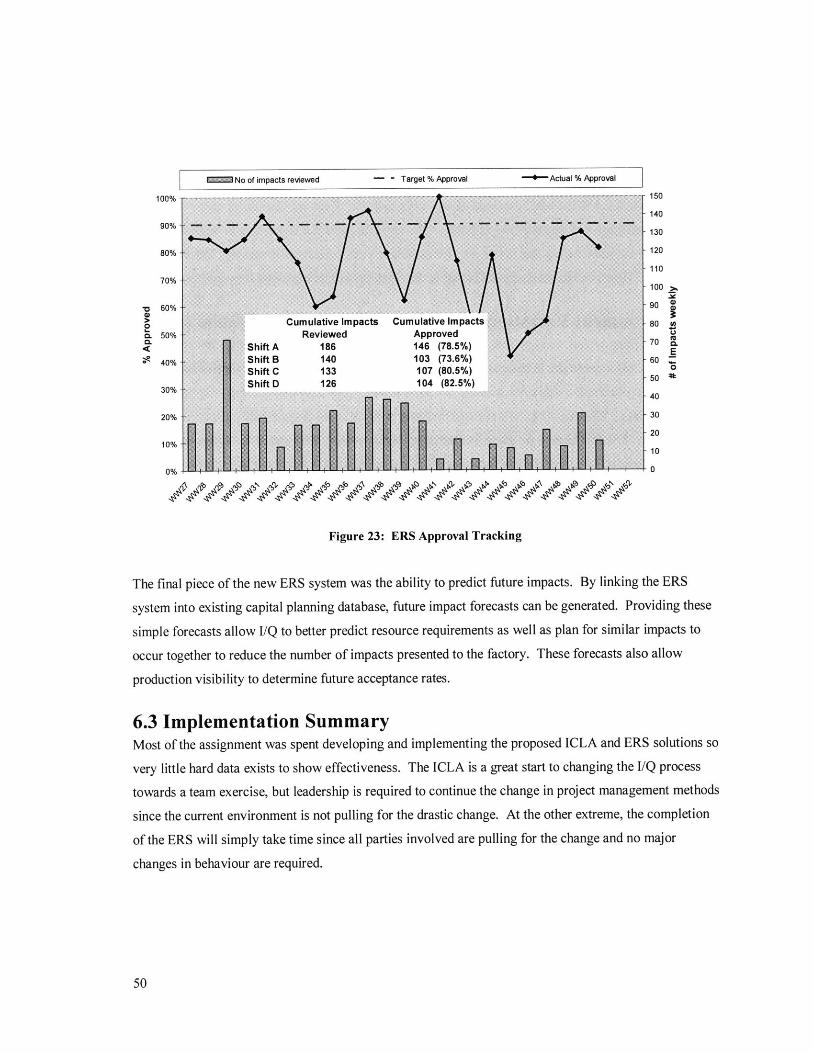
No of impacts reviewed - - Target % Approval - -Actual % Approval
100%
90%-
80% .
70%-
60%
Cumulative Impacts Cumulative Impacts
o. 50% Reviewed ApprovedShift A 186 146 (78.5%)
/ 40% Shift B 140 103 (73.6%)
150
140
130
120
110
100
90
80
70
60
50
40
30
20
10
0
30%
20%
10%
*1E
0
Figure 23: ERS Approval Tracking
The final piece of the new ERS system was the ability to predict future impacts. By linking the ERS
system into existing capital planning database, future impact forecasts can be generated. Providing these
simple forecasts allow I/Q to better predict resource requirements as well as plan for similar impacts to
occur together to reduce the number of impacts presented to the factory. These forecasts also allow
production visibility to determine future acceptance rates.
6.3 Implementation SummaryMost of the assignment was spent developing and implementing the proposed ICLA and ERS solutions so
very little hard data exists to show effectiveness. The ICLA is a great start to changing the I/Q process
towards a team exercise, but leadership is required to continue the change in project management methods
since the current environment is not pulling for the drastic change. At the other extreme, the completion
of the ERS will simply take time since all parties involved are pulling for the change and no major
changes in behaviour are required.
50
0 % 1 fff I IM AMI f V11 I VE1 I M
7.0 Intel I/Q Organizational Barriers to ICLA
At the end of the assignment in December, the author had serious reservations about the effective daily
team implementation of the ICLA. In this chapter the author wishes to further explain the pessimism by
looking at the organizational issues associated with duration change management from multiple
perspectives. The intention is to provide insight into the true motivations of employees, managers, and
the Intel Company as a whole. Below the organization will be viewed through an academic
organizational process tool using a three-lens analysis method [Anaona, 1999]. These three lenses are:
strategic design, political, and cultural. Below, each lens will be examined to identify how each may
influencing the implementation of CCM style project management.
7.1 Strategic Design LensStrategic design lens looks at the organization as a kind of machine designed to achieve goals and carry
out tasks. [Caroll, 2002] When it comes to microprocessor production my observations conclude that
Intel sets Fab strategic goals around duplication of yield rates. This is evident through their strict use of
CE and establishment of the Virtual Factory. Below is a quote from their website capturing the strategy
of the Virtual Factory.
"The "Copy Exactly" strategy creates great flexibility for Intel's factory network. Because each Fab is
nearly identical, wafers can be partially completed in one Fab and finished in another, yet yield at the
same level as if the wafer were built in only one factory. No other semiconductor manufacturer can do this
now." [Intel.com, 2 March 2005]
I/Q's task in fulfilling the above goal is to bring the new production line up, given schedule and budget
assumptions out of Corporate, with the high initial yield rates. As the analysis above attempts to
demonstrate, corporate schedule and cost targets are not very aggressive and I/Q and Production use this
buffer to accommodate existing variation in the system. Of course, the intention of CCM is to focus on
cost and schedule reductions, so from a strategic lens the goal of CCM does not currently match existing
Intel's production quality goals.
51
7.2 Political Design LensThe political design lens does not see the organization aiming towards a common goal; instead it looks at
the interests and goals that guide individuals, groups, and departments each of whom struggle for power
among stakeholders with different goals and underlying interests. [Caroll, 2002]
7.2.1 Competing For Future BusinessA key measure of success for each individual Fab startup is to meet the yield and quality metrics for that
technology to position the factory both for a successful ramp on that technology and for future investment
for subsequent technologies. This objective creates competition between Fab sites and between I/Q
organizations vying to capture the next technology. Knowing that CE ensures duplicate I/Q procedures
are followed, it was no surprise that project management mindsets for future project management change
were very different between Fab sites. Working on a cross-site duration management team during the
ICLA development, cross-site standardization encountered much resistance so the majority of the efforts
were conducted at Fab 24 in Ireland to lay the foundation for future cross-site buy-in. Future cross-site
implementation will require an ICLA which maintains the standardized CCM methods, but allow for
some continued autonomy between I/Q sites. One idea is to allow individual sites to determine their
minimum technical duration times.
7.2.2 I/Q Taking a Backseat to ProductionSince CE works to guarantee quality of the production line and system buffers protect the schedule, Fab
sites are measured greatly on their ability to meet production capacity targets from existing lines. As seen
in impact approval meetings, I/Q's work takes second priority to sending microprocessors out the door
each week. This low priority is also shown in I/Q use of Process Engineers. PE's are responsible for the
final qualification of all production tools yet in most cases they do not report directly to the I/Q
organization. Instead they report through Production and place production issues well before I/Q issues.
I/Q taking a backseat to Production may be the best way to meet Intel's production goal given current
buffers. This attitude however makes the ICLA implementation difficult because if Production and PE's
don't see I/Q tasks as critical, how can I/Q expect them to function as part of the critical chain?
7.2.3 The Missing Project ChampionThe I/Q organizations have responsibility for completion of the entire I/Q process, but most of I/Q's
direct reports have responsibility for only the PF and Install stages. The new ICLA process requires
Functional Area Leads (FAL's) to expand their duties to cover the entire I/Q process as project champion.
52
This is to provide buffer visibility and coordinate the teams' daily and weekly activities. The role of I/Q
project champion in the new ICLA process was met with resistance from most FAL's. What generated
this opposition was that FAL's felt they have little control over the SQual and IQual portions so why
should they have the responsibility? Most also had trouble viewing the entire project as the goal since the
current system rewards the completion of individual stages. Once again in order to implement a
standardized process such as CCM management must adjust the incentives to reward team performance.
7.3 Cultural Design LensThe cultural lens looks at how the past history of the company and informal relationships shape the feel of
the organization. This section begins with the Intel Values displayed everywhere inside the company
including the back of every employee's badge.
Intel Values" Risk Taking
* Quality
" Great Place To Work
* Discipline
* Results Orientation
" Customer Orientation
7.3.1 CE!It is ironic that risk taking is the first value because at the production level CE attempts to removes most
risk from daily production operations. The author found the product culture and production culture quite
different at Intel. While Intel's product culture is one of continuous improvement through innovation, its
production culture is one of CE making localized improvement difficult. Combine the CE culture with a
protected cost and schedule and most see an I/Q system that works, so why change?
7.3.1 MeritocracyThe fifth Intel value is results orientation. The author found the Intel culture to be a true meritocracy
where advancement is based on individual ability or achievement. This sink-or-swim mentality was made
evidently clear during the week-long new-hire class where the common phase was "you own your
employability". While meritocracy has individual performance advantages, the author found promoting
the team goals of CCM very difficult since people do not see teamwork as a way to get ahead in the
organization.
53
7.4 Analysis as a WholeCCM, like most major change, requires urgency and importance in the minds of those implementing the
change. The author learned early in the assignment that although I/Q duration management has the
potential to yield substantial cost and schedule improvements, Intel's current production strategy is to
focus on high consistent yields. From a political prospective, I/Q holds little control over the cost and
schedule of a technology ramp. Once again, the Technology Development Site sets the cost and schedule
targets which, based on my understanding, are very achievable and present little risk. This protected
system means I/Q tasks take a backseat to existing production, making duration management a non-
critical issue. Finally from a cultural prospective, CE creates an environment based on conformance
which distracts from continuous improvement efforts since individual employees do not feel empowered.
Along with CE, the Intel culture rewards individual achievement making team based solutions such as
CCM very difficult.
Under the current strategic, political and cultural undercurrents of Intel, implementation of the ICLA will
be a tough up-hill battle with uncertain success. The author has no doubt that the employees of Intel have
the ability to tackle duration management when the climate is right. In the final chapter the author will
highlight a potential climate change and give recommendations for future work in the area of I/Q duration
management.
54
8.0 Going Forward
The main deliverable from the 6-month assignment was the development of the integrated checklists and
assumptions (ICLA) process using critical chain methods. The ICLA process:
* ensures everyone develops, shares, and optimizes integration level critical work flow
* uncovers hidden working assumptions between resources
* assigns a project champion across all three I/Q stages
* replaces individual buffers with a smaller aggregate team buffer
The author wishes he could also say another deliverable was the successful implementation of the ICLA
process or at least a strong sense of near-term implementation success. Unfortunately it is the opinion of
the author that the Intel climate is not currently right for such a major change. As evident in the
generation of the internship, Intel does see concern for the changing microprocessor market and in the
future duration management efforts will be treated with greater importance. The ICLA presents a great
foundation on which to begin building.
8.1 The Changing Market - Product Maturity/Dominant DesignMost people looking at Moore's law see great innovation behind the ever shrinking microprocessor.
While Intel has had its share of innovations, microprocessor development has really centered on the
continuous improvement of past production tools, allowing for smaller and smaller circuits. Staying on
the aggressive curve, Intel has used CE to ensure production control of this not so well understood
process, creating consistent high performing processors from all their production facilities. This
outstanding quality and unrivaled performance has allowed them to remain the "thousand pound gorilla"
in the industry over the last 35 years maintaining an overwhelming majority of the world's market share.
Over the last few years though, performance demand and difficulties staying on the curve have forced
Intel to reexamine their future processor strategy. In November Intel announced they have "hit a power
wall" and the company is making a "right hand turn" in their microprocessor strategy. [Jajeh, 2004] The
power wall is the problem of dissipating the heat as the transistors get smaller and made to run at faster
clock speeds. This heat dissipation problem is driving Intel and the industry away from the traditional
increasing speed giving increasing performance model and towards alternate solutions that will still meet
'Moore's law.
The heat dissipation technical problem is a valid excuse for changing strategy, but the author believes
there is a potential other reason for this change. Plain and simple, the market does not value performance
55
as much as it once did. The author remembers buying his first desktop computer for undergraduate
engineering and paying $3700 to get the latest Intel 486 chip running at 66 MHz. It was fast for its time,
but still had trouble with complicated programs such as AutoCAD. In the coming years after the initial
purchase, the author bought new desktops because of the dramatic increases in performance going from
66MHz to 1 GHz and the large reductions in cost of the machines. Today, this very thesis was written
using a five year old laptop containing an Intel Pentium III processor running at around 1GHz. This
laptop handles all software capabilities and the author no longer sees a need to upgrade every few years.
Even if a faster machine were needed, there are plenty of low cost 2-3Ghrz machines on the market. The
majority of computer users no longer require the fastest processing speed since the software does not
demand the speed. These buyers take advantage of slightly older processors which cost less and are in
greater supply.
Given the above technical and market demand, the change from increased speed for increased
performance presents a potential problem. Short-term, this change in the technology may present
competitors the chance to improve their production quality and capture more of the existing market share.
Once again with Intel currently controlling 82.3% of the market share, competitors have a lot of incentive,
and now the time, to match current quality. Intel's current strategy is to begin developing multi-core
processors to achieve increased processing speeds. Just as the name implies, multi-core processors
simply have more than one computational engine or core on the processor. [Jajeh, 2004] Using existing
chip technology these cores can be run at lower frequencies producing less heat. The question for this
new strategy is: what makes Intel better able to produce these multi-core processors over their
competitors?
The author sees Intel's departure from the gigahertz speed race and the associated new challenges to
Moore's law as a sign of the maturity of the industry and the potential growing importance of process
innovation. Figure 24 below shows a model developed in the 1970's to explain the rate of product and
process innovation as an industry matures. [Albernathy, 1978] At the beginning, or during the fluid
phase, product innovation exceeds process innovation. In our case the number of microprocessors on a
chip grew exponentially by physically shrinking the existing product. Next from a host of alternatives,
the producers and consumers decide on a" dominant design". This might be the departure from the
gigahertz race or size of circuitry. Once a "dominant design" emerges, competition usually shifts to
reducing the cost of the "dominant design" through process innovations. [Hayes, 2005]
56
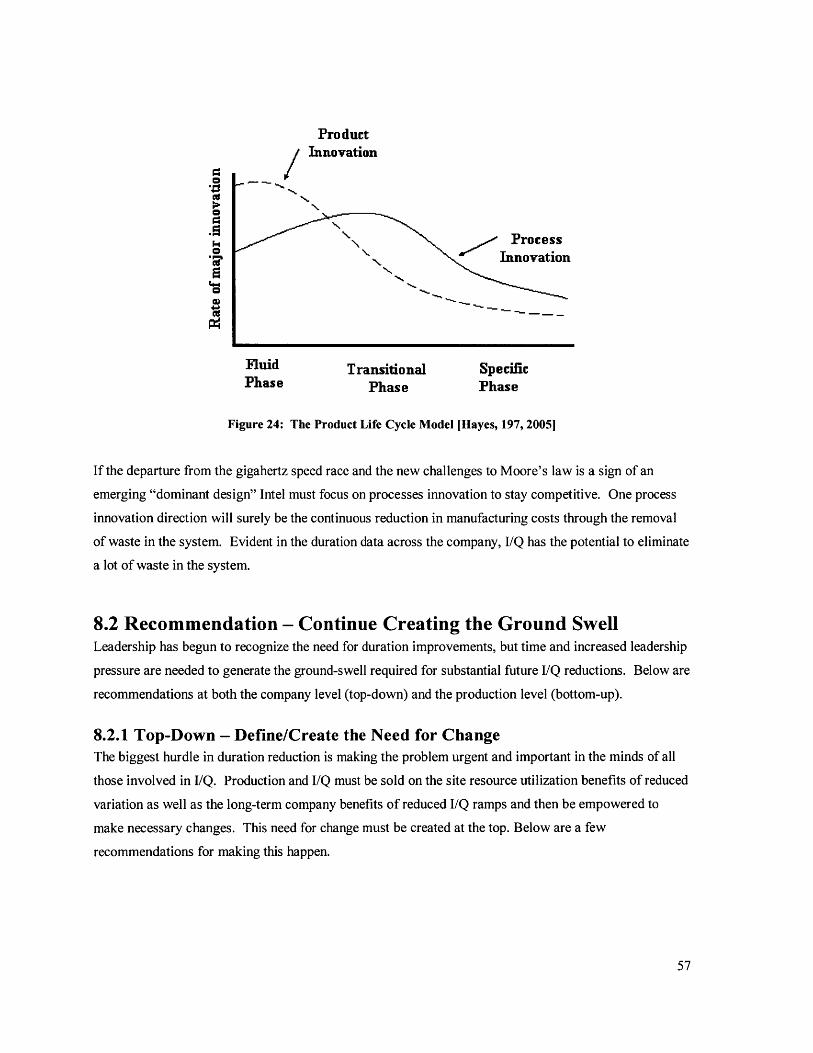
Pro ductInnovation
Process.- Innovation
0
Fluid Transitional SpecificPhase Phase Phase
Figure 24: The Product Life Cycle Model [Hayes, 197, 20051
If the departure from the gigahertz speed race and the new challenges to Moore's law is a sign of an
emerging "dominant design" Intel must focus on processes innovation to stay competitive. One process
innovation direction will surely be the continuous reduction in manufacturing costs through the removal
of waste in the system. Evident in the duration data across the company, I/Q has the potential to eliminate
a lot of waste in the system.
8.2 Recommendation - Continue Creating the Ground SwellLeadership has begun to recognize the need for duration improvements, but time and increased leadership
pressure are needed to generate the ground-swell required for substantial future I/Q reductions. Below are
recommendations at both the company level (top-down) and the production level (bottom-up).
8.2.1 Top-Down - Define/Create the Need for ChangeThe biggest hurdle in duration reduction is making the problem urgent and important in the minds of all
those involved in I/Q. Production and I/Q must be sold on the site resource utilization benefits of reduced
variation as well as the long-term company benefits of reduced I/Q ramps and then be empowered to
make necessary changes. This need for change must be created at the top. Below are a few
recommendations for making this happen.
57
- Intel leadership must agree on the long-term duration management strategy of the company. If it makes
sense to reduce durations on future I/Q technology ramps, challenge the existing ramp schedule and begin
rewarding Fab I/Q for cost and schedule performance along with CE performance.
- I/Q leadership from across the company should work together to standardize an ICLA project
management process. Employees are familiar with obtaining set standards (CE). This same work culture
could be applied to project management methods making cross-site learning possible as well as
standardizing the expectations of outside parties such as contractors and suppliers.
- The final top-down recommendation would be to repeat a similar internship assignment at the
Technology Development Site where the ramp schedule assumptions are created. This would allow for
better framing of the problem. Working from Technology Development Site would also put the intern in
a better position to collaborate between sites, since they would not be associated with a single Fab site.
8.2.2 Bottom-up - Develop the Continuous Improvement CultureThe author believes his greatest contribution to Fab 24's I/Q organization was his outside perspective and
new energy to create change. The presence represented to the group that duration variability was
important to Intel's I/Q leadership, laying the foundation for future improvement. Now that ICLA BKM
exists changes must be made to the organization to accommodate implementation and future changes to
the process. This is to accommodate the strong CE/Meritocracy culture of I/Q which may be very
resistant to the continuous improvement nature of ICLA. To create this culture of continuous
improvement the following recommendations are made.
- Continue the ICLA implementation effort and look for improvements. Care must be taken to ensure
buffer management is used at all levels on the team. Without buffer management the benefits of CCM
will not be realized.
- Expand the role of the Function Area Leads to include Prefacilitisation through IQual. Making them
project champion provides the coach needed to run the relay race. FAL's must be measured in this
capacity.
- Begin measuring the success of the team along with individual performance. Cost, schedule, and
quality should share equal importance during employee evaluations.
58
- Seek greater involvement from Production and Process Engineering. Without their support there is no
critical chain.
- Develop better team dynamics (Install through Intel Qualification). Development and implementation
of the ICLA is a great way to encourage team dynamics. Maintaining a team environment ensures
communication and trust from start to finish which is critical to efficient use all resources. Critical chain
is a way to simplify and ensure this team communication.
To end, CCM implementation requires time and a sense of urgency to implement effectively. CCM is
more about changing the culture of the organization then about implementing a simple solution. With
increased importance the author believes the culture will embrace the competitive advantages of CCM.
59

This page is intentionally left blank
60
Appendix A: Author's Biographical InformationTo better understand observations in the thesis the author wishes to provide a brief background into his
manufacturing experience. Prior to working at Intel, he spent six years working for The Boeing Company,
three years in defense aircraft and three years in commercial aircraft. The majority of his assignments
were functioning in a manufacturing research and development capacity on new aircraft programs
including the Joint Strike Fighter and Sonic Cruiser (now the 787). The author also has served in several
factory management assignments leading unionized machinists on the shop floor. Combining his
mechanical engineering education, aerospace project management manufacturing background, and his
ingrained Boeing culture over to Intel's microprocessor division was quite a change.
Along with his past career history, the author wishes the reader also keep Boeing's current reality in the
back of your mind to better understand his point of view in this thesis. Over the last ten years Boeing's
commercial aircraft market share has dropped from -85% down to -49%, losing the 36% to AIRBUS.
This new competitive challenge from our European counterparts has forced Boeing to refocus our
manufacturing strategy. While maintaining their historical advantage of top quality aircraft, Boeing's
manufacturing strategy has been to lower production costs and reduce schedules. This long-term focus
has changed the culture over the last ten years and created a company culture of continuous
manufacturing improvement at every level in the company.
61
Terms and AcronymsBKM: Best Known MethodCC: Construction consultantsCCM: Critical Chain MethodCM: Construction managersCPM: Critical Path MethodERS: Equipment Reservation SystemFAB 12: Name of Fabrication Site in ArizonaFAB 24: Name of Fabrication Site in IrelandFAL: Function Area Leads- managers called in Ireland Fab 24 (same as IQGL's at Fab 12)HVM: High Volume ManufacturingICLA: Integrated Checklist and AssumptionsINSTALL: Installation portion of I/Q process comes after PFI/Q: Installation and QualificationIQual: Intel Qualification portion of I/Q comes after SQualIOGL: I/Q Group Leads - managers called in Arizona Fab 12 (same as FAL's at Fab 24)MT: Manufacturing TechnicianMTD: Minimum Technical Duration - 50/50 chance of getting task donePB: Process EngineerPM: Project managersPF: PrefacilitisationRTS: Rredundant Tools SetsSQual: Supplier Qualification portion of I/Q process comes after InstallVF Duration: Virtual Fab Duration - Intel standard duration for given tool family
62
ReferencesAbernathy, W., and J. Utterback (1978). "Patterns of Industrial Innovation." Technology Review 80, no. 7
(June-July 1978): 2-9
Anaona, Kochan, Scully, Van Maanen, Westney. Organizational Behavior and Processes. Cincinnati:South-Western College Publishing, 1999.
Caroll, John S.: Introduction to Organizational Analysis - The Three Lenses, MIT Sloan School ofManagement Working Paper 14, 1-13. Sloan Communication Office
Cook, Stephen Carl. "Applying Critical Chain to Improve Management of Uncertainty in Projects"Thesis, Massachusetts Institute of Technology, 1998.
"Copy Exactly" Factory Strategy Virtual Press Kit Intel's Worldwide Manufacturing OperationsIntel.com.2 March 2005<http://www.intel.com/pressroom/kits/manufacturing/copyexactlybkgrnd.htm>
Goldratt, Eliyahu M. Critical Chain The North River Press, Great Barrington, MA., 1997
Goldratt, E.M., The Goal. Great Barrington, MA: The North River Press, 1984
Hachman, Mark AMD's Processor Share Climbshttp://www.extremetech.com/article2/0,1558,1758071,00.asp
Hayes, Robert, Gary Pisano, David Upton, Steven Wheelwright. Operations, Strategy, and technologyPursuing the Competitive Edge. Wiley, 2005.
Jacobs, D. Introduction to the Theory of Constraints. Project Management Application. The GoldrattInstitute, New Haven, CT. 1997.
Jajeh, Daniel P. Intel accelerates in a new directionhttp://www.intel.com/employee/retiree/circuit/righthandturn.htm
Leach, Lawrence P. Critical Chain Project Management ARTECH HOUSE, INC, Norwood, MA., 2000
Parkinson, C.N. Parkinson 's Law. The Riverside Press, Cambridge, 1957.
Woodring, S.F. and Zigarmi, D., (1997). The team leader's idea-a-day guide. 250 ways to make yourteam more effective and productive every working day of the year. Chicago: The DartnellCorporation.
63