a conceptual framework for promoting inclusive ... · 0 michigan state university department of...
TRANSCRIPT

0
Michigan State University Department of Agricultural, Food and Resource Economics
A Conceptual Framework for Promoting Inclusive Agricultural Value Chains
by Steven Haggblade, Veronique Theriault,
John Staatz, Nango Dembele and Boubacar Diallo
November 2012
prepared for the International Fund for Agricultural Development (IFAD)
under Grant # G-I-R-1352-MSU Improving the Inclusiveness of Agricultural Value Chains in West Africa
1
Table of Contents 1. Objectives .......................................................................................................................2 2. Key Value Chain Concepts ............................................................................................ 4 3. Value Chain Dynamics .................................................................................................12 4. Implications for the Poor, Women and Youth ..............................................................16 5. Best-Practices for Designing Effective, Inclusive Value Chain Interventions .............21 Appendix A. Value Chain Mapping Conventions ............................................................26 References .........................................................................................................................27 Figures 1. Sorghum Beer Value Chain in Botswana 2. Gender and Returns to Labor Overlays 3. Thai Silk Value Chain 4. Kenya Dairy Value Chain 5. Vulnerable Groups 6. Inclusive Business Models Tables 1. Marketing Margins in Kenya’s Milk Value Chain 2. Capital Intensity and Returns to Labor in Rural Nonfarm Activities, Bangladesh 3. Competitive and Complementary Small Firm-Large Firm Relationships
2
1. Objectives Poor rural households in the developing world work in both agriculture and rural nonfarm activities (Sanchez et al. 2005; IFAD 2012). Given the pronounced seasonality of agricultural calendars, many farm households engage in part-time and seasonal nonfarm activities during the slack agricultural season (Haggblade, Hazell and Reardon 2007). Typically, both the farm and nonfarm enterprises operated by poor households involve simple, labor-intensive technologies using limited capital and few purchased inputs. As a result, productivity, incomes and returns to family labor remain low (Lanjouw 2007). Historically, efforts to raise rural incomes have focused primarily on improving agricultural productivity. Indeed, most empirical evidence suggests that agriculture-led growth offers an unusually powerful vehicle for broad-based poverty reduction (Thirtle Lin and Piesse, 2003; de Janvry and Sadoulet, 2009; Christiaensen, Demery and Kuhl, 2010; Diao et al. 2012). Nonetheless, the nonfarm dimensions of rural development – particularly in agricultural marketing and agro-processing –often prove critical to successful agricultural growth (Abbott 1986). Without well-functioning agricultural markets, productivity gains on the farm lead to temporary production surges and price collapses. Improved market access proves necessary for maintaining production incentives, permitting household specialization and enabling movement to high-value products and to value-added activities. As a result, sustained agricultural growth typically occurs where productivity-enhancing agricultural technology and favorable market incentives converge (Haggblade and Hazell 2010). Value chains provide a valuable visual framework for understanding the structural connective tissue linking small farmers with input suppliers, processors, traders and final consumers. Value chains provide an analytical and diagnostic tool for identifying viable, remunerative income-earning opportunities for poor households in the rural developing world. In highly competitive and increasingly global agribusiness markets, poor households must find niches in which they can compete effectively in the rapidly growing urban, rural and export markets. Yet the large agribusiness that increasingly drive change in agricultural value chains seek to reduce costs and raise profits, often by scaling up production and market share, reducing the number of suppliers they deal with and squeezing supplier prices (Reardon and Timmer 2005). The business school graduates who drive corporate strategy at large agribusiness firms conduct proprietary market assessments that form the basis for internal strategic plans. Serving as a counterweight, value chain assessments provide open-source, countervailing analytical and diagnostic power on behalf of the least powerful members of global value chains, the rural poor. In an effort to help IFAD improve the effectiveness of its value chain interventions, this paper tackles the following three tasks: a) summarize key value chain concepts; b) distill emerging lessons on value chain dynamics and what they imply for income-earning opportunities of the poor; c) outline best-practices for the design of effective, inclusive value chain interventions. In order to do so, the paper draws on over 30 years of experience with value chain diagnostics and related operational work. 1
1 Shaffer (1973), Goldberg (1974), Boomgard et al. (1992), Montigard (1992), Porter (1998), Dowds and Hinjosa (1999), Bourgeois and Hererra (2000), Kaplinsky (2000), Vorley (2001), Kaplinsky and Morris (2003), Meyer-
3
To draw out the key lessons clearly, and to avoid lapsing into generalities, the paper relies on three inclusive value chain case studies to illustrate the key issues, challenges and lessons emerging from this large body of experience. The first case study covers the sorghum beer value chain in Botswana, a female-dominated rural industry that served as the country’s largest nonfarm employer and rural manufacturing industry during the 1980s. Second is the Thai silk value chain, another large, female-dominated rural industry that employed over 350,000 women in Northeast Thailand, the poorest part of the country, during the 1990s. Finally, the paper draws on evidence from the Kenya dairy industry, one of the fastest growing and most lucrative smallholder success stories in Africa over the past two decades.2
Stamer (2003), Miehlbradt et al. (2005), Haggblade (2007), Raswant and Khanna (2010), Staatz and Ricks (2010), IFAD (2011), Stamm and von Drachenfels (2011). 2 These case studies draw on Boomgard et al. (1992), Haggblade and Ritchie (1992), Bear et al. (1992), Staal et al. (2008), Baiya and Kithinji (2010), Ngigi et. al. (2010) and Grant (2011).

4
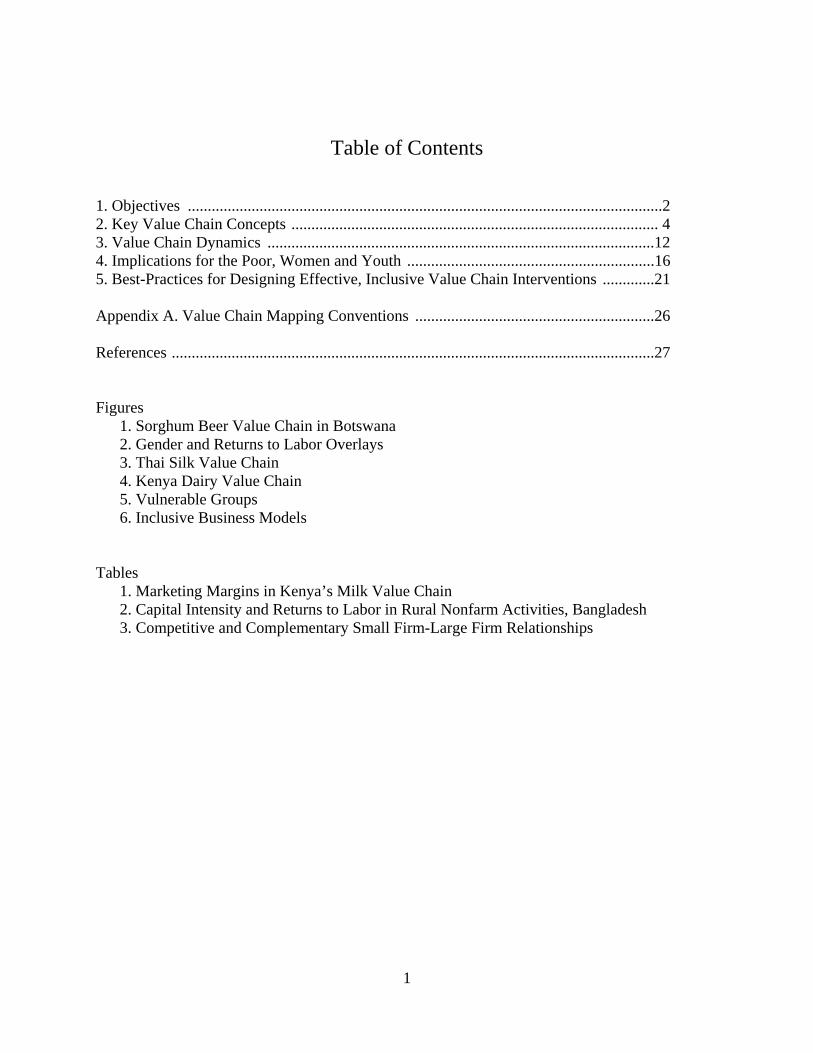
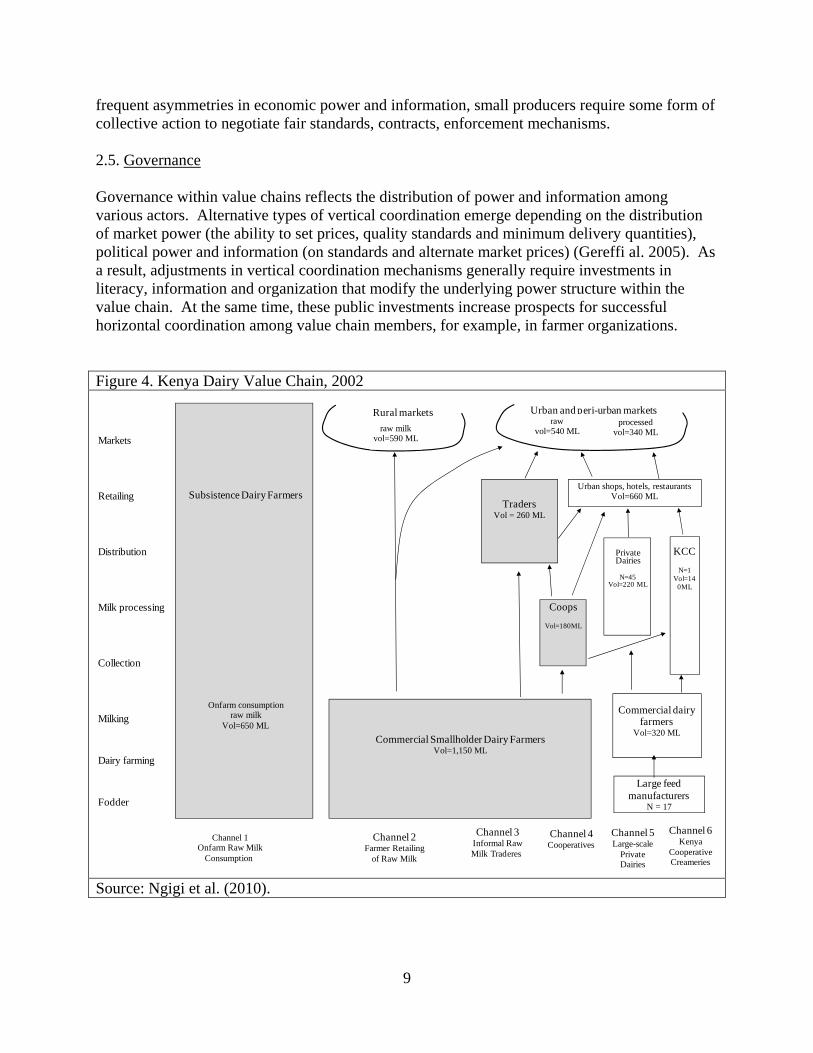
2. Key Value Chain Concepts 2.1. Value chains Value chains provide the framework for designing and implementing many development programs and projects. Given a multitude of different arenas of application, geographical locations, commodity types, target groups and desired outcomes, a variety of closely related conceptualizations of value chains has emerged (Stamm and von Drachenfels 2011). For the purpose of this study, we define a value chain as “the full range of activities and services required to bring a product or service from its conception to sale in its final markets” (microLINKS 2012). A value chain, thus, encompasses the entire network of actors involved in input supply, production, processing, marketing and consumption. These value chain actors operate within an institutional environment, which can either facilitate or hinder its performance (Gereffi 1995). Laws, rules, regulations, policies, international trade agreements, social norms and customs all contribute to this institutional environment as do public goods such as infrastructure, research, extension, price information systems and business development services. Businesses that provide cross-cutting services such as finance and transport likewise contribute key elements to the institutional environment affecting the value chain performance. 2.2. Supply channels Value chains encompass a network of competing vertical supply channels that link input suppliers, farmers, processors, distributors and final consumers. Examples from the following three value chains illustrate the diversity of supply channels operating in many typical value chains. During the early 1980s, four major supply channels served Botswana’s consumers of sorghum beer (Figure 1). Two centered around home-brewed sorghum beer produced by village women in 50- to 200-liter batches, while two additional competing channels produced factory-brewed sorghum beer in 15,000 liter batches and delivered it in bulk or in red-white-and-blue wax-paper cartons to retail consumers. Participation by women and vulnerable groups centered on home brewing (Channels 1 and 2) and home retailing of factory brewed sorghum beer (Channel 3) (Figure 2). In the Thai silk value chain, during the 1990’s, four major factory-based supply channels delivered $150 million worth of Thai silk to retail outlets, while a much smaller fifth channel served the needs of traditional village consumers (Figure 3). In Kenya’s milk value chain, during the early 2000’s, four major supply channels served major urban milk markets while another two served rural consumers (Figure 4). Overall, these channels supplied 85% of milk products in the form of raw (unpasteurized) milk while the remaining 15% was pasteurized, processed, packaged and sold as milk and milk products for primarily urban markets. Even in urban areas, raw milk accounted for about 60% of total dairy product consumption. Value chain maps – such as those displayed in Figures 1 through 4 – provide a schematic snapshot of the key value chain actors and the existing structure of raw material, product and information flows at a given point in time. The vertical product flows delineate the alternative supply channels, while each horizontal level in the value chain designates the productive function.

5
Figure 1. Sorghum Beer Value Chain in Botswana, 1982
Retailing
Brewing
Malting
Farming
N = number of enterprisesVol = volume of beer in millions of liters (ML)
Village and adult consumers,Vol = 245 million liters
Urban and youth markets,Vol = 29 million liters
Fully IntegratedHome Brewers
N = 40,000Vol = 175 ML
Home Brewers Using "Trade Malt"
N = 16,000Vol = 70 ML
Factory Made "Trade Malt"
N = 2
Home Retailers N = 2,400
Vol = 9 ML
Licensed Sorghum Beer Bars, N = 150
Vol = 20 ML
Factory Brewing N = 2
Vol - 29 ML
Factory Produced"Municipal Malt"
N = 1
Channel 1Traditional Home Brewers
Channel 2Home Brewers with
Trade Malt
Channel 3Home Retailers of
Chubuku
Channel 4Factory Brewing via
Licensed Bars
Commercial Sorghum Farms
Source: Boomgard et al. (1992). Production technology, product quality, perishability, price, input and skill requirements and investment costs often vary substantially across supply channels. As a result, financial, physical and human capital often pose entry barriers that limit access by the poor. 2.3. Competitive niches Where can poor households compete? The enterprise types displayed in each value chain map provide a pictorial inventory of the alternate competitive niches available to potential entrants—and potentially available to vulnerable households. The horizontal levels in a value chain map (the rows) designate the sequence of productive functions performed by the participating firms. In agricultural value chains, these typically run from input provision to farming, trading, processing, marketing and consumption.

6
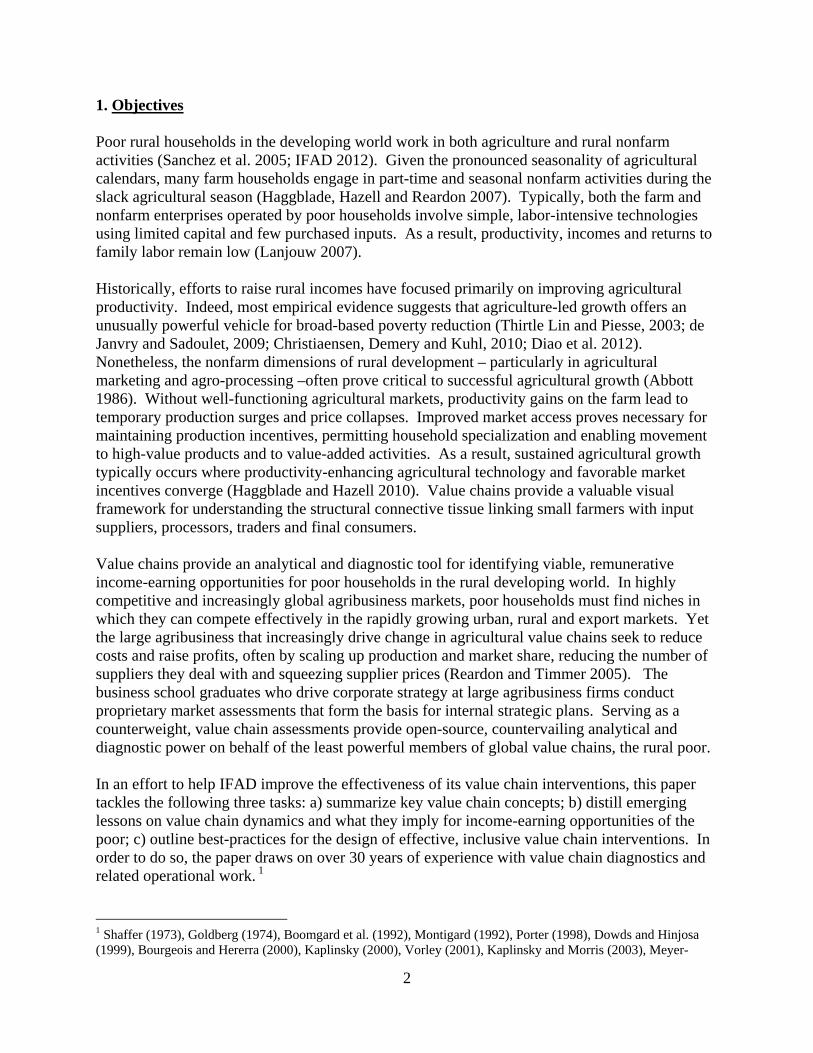
Figure 2. Gender and Returns to Labor Overlays in Botwana’s Sorghum Beer Value Chain, 1982
Retailing
Brewing
Malting
Farming
Legend
K/L = fixed capital per worker (current 2012 $US) = niches accessible to the poor
Village and adult consumers,Vol = 245 million liters
Urban and youth markets,Vol = 29 million liters
Fully IntegratedHome Brewers
Home Brewers Using "Trade Malt"
Factory Made "Trade Malt"
Home Retailers Licensed S.Beer Bars
Factory Brewing
K/L = $45,000
Factory Produced"Municipal Malt"
Channel 1Traditional Home Brewers
Channel 2Home Brewers with
Trade Malt
Channel 3Home Retailers of
Chubuku
Channel 4Factory Brewing via
Licensed Bars
Commercial Sorghum Farms
= returns to labor (current 2012 US dollars per day)
2.50
4.50
= women's income share
= 80%
= 80%
= 95% = 40%
= 30%
= 20%
= 29%= 54%= 64%= 80%
= 30%
K/L = $250
K/L = $250
K/L = $4,800 K/L = $45,000
K/L = $508.50
K/L = $5,250
Source: Haggblade (1987), Boomgard et al. (1991). Within a given vertical supply channel, enterprises select their competitive niche by deciding which market segments to target, how much to specialize (that is, how many consecutive functions they perform) and what type of technology to adopt in order to meet required quantity and quality requirements. The resulting grid in the value chain schematic maps the productive functions (the rows) across each of the vertical supply channels (the columns). In doing so, the value chain map defines the major enterprise types operating in the value chain. Vertical integration occurs when an individual enterprise conducts a sequence of value chain functions in-house. Visually on the value chain map, vertical integration appears as tall,
7
elongated enterprise types. The height of each reflects the number of vertical functions it encompasses, thus designating the level of vertical integration. For example, in Channel 1 of Botswana’s sorghum beer value chain, forty thousand fully integrated home brewers grow their own sorghum, malt it, brew it and retail their home brew (Figure 1). Similarly in Channel 1 of the Thai silk value chain, nearly three hundred thousand vertically integrated village silk producers grow their own mulberry leaves, rear their own silkworms, reel their yearn, weave and retail their distinctive checked silk in rural markets (Figure 3). Likewise in the Kenya milk industry, fully integrated but low-productivity rural producers in Channel 1 dominate overall volumes, accounting for 30% of total national milk production (Figure 4). Specialization emerges in some supply channels, often in response to technology change that permits quality improvements and scale economies in production. For example, in Channel 2 of the sorghum beer value chain, two specialized malting firms emerged to produce high-quality “trade malt” for home brewers. Because of its higher diastatic power, that is, its ability to break down cereal starches more efficiently, trade malt enables specialized home brewers to reduce cereal inputs by 40% (Haggblade 1987). The 16,000 more specialized home brewers in Channel 2 took advantage of trade malt to brew more consistent batches of beer, reduce spoilage and increase returns to labor from $1.00 to $1.80 per day (Figure 2). The same sort of productivity-enhancing specialization emerged in Channel 2 of the Thai silk value chain, where village producers who specialize in yarn production using improved breeds of silk worms were able to quadruple their returns to labor, from $0.25 to $1.00 per day, compared to what they previously earned in Channel 1 (Figure 3). The different enterprise types displayed in the value chain map define different competitive niches, each of which typically implies different technology, skill sets, investment requirements and marketing arrangements. Overlays on the basic value chain map display information of interest to potential entrants and interveners. Common overlays include firm numbers and volumes of production. Based on data availability, additional useful overlays can include gender access, investment costs, value added, employment, returns to labor or any other statistic of interest to potential interveners. The gender overlay in Figure 2 shows that while women dominate the home brewing channels (Channels 1 and 2), their employment share drops to under 30% in the most capital-intensive factory brewing channel (Channel 4). Among the niches open to women, the specialized home retailers of factory-brewed sorghum beer (Channel 3) earn the highest returns to labor, double the earnings in Channel 2 and more than triple the earnings in Channel 1 (Figure 2). 2.4. Vertical coordination Vertical coordination describes how different types of enterprises interact with their input suppliers (one or more functional level below them in the value chain map) and with the firms that purchase their output (one or more functional levels above them in the value chain map). The nature of these interactions defines the governance structure, which influences the distribution of benefits and, in turn, reflects the distribution of power and control within the value chain. Three major options for managing commercial transactions within a given supply channel revolve around vertical integration, spot markets or contract production.

8
Figure 3. Thai Silk Value Chain, 1991
Retailing
Weaving
Yarn trading
Reeling
Rearing
Egg multiplication
Mulberry
T = traditional silkworms returns to labor, in current (2012) US dollars per dayY = yellow hybrid silkworms n = number of enterprisesW = white hybrid silkworms DOAE =Deparment of Agricultural Extension
Traditional Thai Consumers
(500 M Baht)
Traditional household producers
0.25
T
Channel 1Integrated household
producers
Yarn traders
n = 100
Modern Thai Silk(4,500 M baht)
DOAE
Small reeling mills
Small weaving factories
Large weaving factories
Large reeling mills
Jim Thompson Silk Company
8.20
Household contract
Channel 5Jim Thompson Silk,
integrated market leader
Channel 4Large factories
Channel 3Specialized cocoon producers
supply small mills
Channel 2Household yarn
producers
n = 295,000n = 7 n = 1
n=2,400n = 20n = 120
W
n=20 n = 1,400
W
3.25
n = 2,000
Contract farmers
n = 8
Household yarn
producers
n = 65,000
T Y
0.60 1.00
Source: Haggblade and Ritchie (1992) Vertically integrated firms perform multiple production, processing and marketing functions in-house. Like the traditional Thai household weavers in Channel 1, the Jim Thompson Silk Company, is fully integrated – growing its own mulberry, rearing its own hybrid silkworms, reeling silk yarn in large mechanized factories, weaving and marketing themselves (Figure 3, Channel 5). But unlike the traditional household weavers, the Jim Thompson Company uses improved, best-in-class technology for each function. Spot markets, however, mediate many agribusiness transactions. Where large numbers of buyers compete for product, farmers and value-added processors can receive high prices. But in the presence of thin markets and few traders, farmers and processors face difficulties negotiating a good price. Contract production and subcontracting offers a third system for managing commercial relationships with input suppliers and output marketers. In the Thai silk value chain, highly lucrative contract weaving enables women to earn $8.20 per day, eight times higher than they can earn in Channel 2 and more than double the $3.25 per day earned by specialized white cocoon producers in Channel 3 (Figure 3). Typically, contract production requires agreed-upon grades, standards, quantity stipulations and delivery conditions (Mead 1986). In the presence of
9
frequent asymmetries in economic power and information, small producers require some form of collective action to negotiate fair standards, contracts, enforcement mechanisms. 2.5. Governance Governance within value chains reflects the distribution of power and information among various actors. Alternative types of vertical coordination emerge depending on the distribution of market power (the ability to set prices, quality standards and minimum delivery quantities), political power and information (on standards and alternate market prices) (Gereffi al. 2005). As a result, adjustments in vertical coordination mechanisms generally require investments in literacy, information and organization that modify the underlying power structure within the value chain. At the same time, these public investments increase prospects for successful horizontal coordination among value chain members, for example, in farmer organizations. Figure 4. Kenya Dairy Value Chain, 2002
Markets
Retailing
Distribution
Milk processing
Collection
Milking
Dairy farming
Fodder
Commercial dairy farmers
Vol=320 ML
Urban and peri-urban marketsRural markets
raw milkvol=590 ML
processedvol=340 ML
rawvol=540 ML
Large feed manufacturers
N = 17
KCC
N=1Vol=14
0ML
Urban shops, hotels, restaurantsVol=660 ML
TradersVol = 260 ML
Channel 6Kenya
Cooperative Creameries
Channel 5Large-scale
Private Dairies
Channel 4Cooperatives
Channel 2Farmer Retailing
of Raw Milk
Channel 3Informal Raw Milk Traderes
Channel 1Onfarm Raw Milk
Consumption
Private Dairies
N=45Vol=220 ML
Coops
Vol=180ML
Commercial Smallholder Dairy Farmers Vol=1,150 ML
Subsistence Dairy Farmers
Onfarm consumptionraw milk
Vol=650 ML
Source: Ngigi et al. (2010).
10
2.6. Horizontal coordination A horizontal slice of a value chain traces out the major categories of competing firms in a given industry, for example, the malting industry, the milling industry or the feed industry. In many instances, firms competing in different supply channels involve different types of technology. While home malting requires only about $100 worth of equipment (soaking basins, grass baskets and grass mats), trade malting requires water control equipment, concrete malting floors and drying floors and hammer mills, costing close to $2,000 per worker (Figure 2). Horizontal coordination among like firms can often confer competitive advantages as well. Farmer associations and marketing cooperatives emerge for precisely this reason, in order to help large numbers of small value chain actors increase their bargaining power, reduce their transaction costs, attain the scale necessary to attract high prices and assemble the minimum lot sizes necessary to meet the requirements of large-scale intermediaries from whom they purchase or to whom they sell. The emergence of dairy trader groups and a Dairy Traders Association (DTA) in Kenya, for example, played a critical role in obtaining official recognition for the previously illegal raw milk trade while at the same time promoting quality standards and food safety (Baiya and Kithinji 2010). 2.7. Competitiveness Value-chain analysis originally emerged as a tool for increasing competitiveness by pinpointing where and how participants could introduce efficiencies, reduce costs and maximize value. The implementation of competitive strategies, initially popularized by Porter (1985), aimed to promote behaviors that make value chains more competitive. Indeed, value-chain analysis provides useful information on structure linkages, actors, and dynamics. It helps to identify where, how, why, and by whom value is added and created along the chain, as well as how changes could result in improved performance (Hawkes and Ruel 2011). These improvements or “upgrades” in the competitiveness of value chains can occur in different ways, through process upgrading, product upgrading or functional upgrading (Kaplinsly and Morris 2000; Knorringa and Pegler 2006). Process upgrading involves improving the efficiency of internal processes. Product upgrading involves the introduction of new, improved or more profitable goods and services. Functional upgrading involves increasing profitability by changing the mix of activities undertaken. In many instances, these forms of upgrading require investment in equipment, know-how or human capacity, potential barriers that risk excluding the poor. 2.8. Inclusiveness While most early work on value chains centered on improving competitiveness of different supply channels, many recent efforts have instead focused on increasing opportunities for the poor (Altenburg 2007). This shift began in the 1990s, when economic liberalization reduced direct government involvement in many agricultural markets while the simultaneous relaxation of foreign exchange controls unleashed a wave for foreign direct investment across the developing world (Reardon 2007). “As a result, large exporters, agribusiness firms and supermarket chains increasingly penetrate rural economies of the developing world, altering the scale and structure of rural supply chains as they do. These new investments open up

11
opportunities for some rural suppliers to access new markets. But they expose others to new threats by … imposing quantity requirements and quality standards that risk excluding undercapitalized rural enterprises on which the rural poor often depend” (Haggblade, Hazell and Reardon 2007, p.3). The purely commercial incentives that motivate large agribusiness investments generate value-chain structures and distributional outcomes that are not inherently pro-poor. In response to these rapid changes in agribusiness supply chains, new efforts have emerged to make value chains a more inclusive and pro-poor (Vorley 2001; Vellema 2010). Pro-poor value chain development approaches refer to interventions that aim to overcome challenges and seize opportunities that can benefit the rural poor (Stamm and von Drachenfels 2011). The emergence of pro-poor value-chain approaches raises new challenges on how to make value chains more inclusive for poor smallholder farmers, women and youth, without hampering their competitiveness. “It calls for a balanced approach, which takes both competitiveness and equity issues into account” (Altenburg 2007, p.4). Desired outcomes of a pro-poor value chain approach typically include higher income earnings for poor and vulnerable groups as well as higher participation of women and youth.

12
3. Value Chain Dynamics The static picture summarized in the value chain map provides a snapshot of the system at a given point in time. Over time, that picture changes, sometimes rapidly. In Kenya’s milk industry, aggregate production has grown at about 3.7% per year over the past forty years. During the 1980s, growth accelerated to over 10% per year as a result of improved disease control, improved breeds, artificial insemination and veterinary services (Ngigi et al. 2010). This aggregate growth often masks striking shifts among competing supply channels, with some growing rapidly at the expense of others. During the 1990s, for example, sales of processed milk fell in Kenya, particularly in Channel 6 as a result of acute financial and management problems at the parastatal Kenya Cooperative Creameries. In response, private dairies in Channel 5 expanded to fill this gap, as did raw milk sales in Channels 3 and 4 (Baiya and Kithinji 2010, Ngigi et al. 2010). During the 2000’s, ongoing dialogue between Kenya’s raw milk traders association and regulators, coupled with active training programs to ensure product quality, resulted in full legalization of the raw milk trade and further growth in the dominant raw milk supply channels (Baiya and Kithinji (2010). In general, two sets of forces drive changes in agricultural value chains, shifts in market demand and shifts in technology or other factors affecting supply. 3.1. Changes in market demand Urban market growth. Rapid urbanization, coupled with growing per capita incomes and a rising middle class, is triggering rapid growth in urban food markets. Even the world’s most rural continent, Africa, will become majority urban by 2030, as urban population continues to grow at about 3.5% per year. In Africa, domestic food markets, which account for about three-quarters of total agricultural sales, are poised to grow rapidly (Diao and Hazell 2004; Diao and Dorosh 2007). For example, projections from Tanzania suggest that urban food markets will grow very rapidly over the next 40 years, from roughly $16 billion in annual sales in 2010 to over $120 billion by 2050. Markets for prepared foods, beverages, meat, poultry, dairy will grow most rapidly (Haggblade and Baraki 2011). Similar changes in West Africa are leading to rapid urbanization and major growth in urban consumer markets for convenience foods, milk, poultry and horticulture products (Bricas et al. 2009, Soule 2010). The rapid growth of Africa’s middle class, over the last 30 years has underpinned this steady increase urban demand for processed and prepared foods (ADB 2011). Growing urban markets underpinned the steady long-term growth in Kenyan milk markets as well as early growth in Botswana’s sorghum beer market. Export markets. Sales to the tourist and export markets opened up rural employment opportunities for an additional 70,000 mostly female workers in Northeast Thailand in the rapidly growing, modern segment of the Thai silk value chain. Although demand for traditional ceremonial silk garments (Figure 3, Channel 1) has stagnated for many decades, sales of modern Thai silk to tourists and export markets (Channels 2-5) have grown at about 10% per year over several decades. Active promotion, marketing and investment in improved quality silk yarn, silk
13
worms, looms and designs by the Jim Thompson Company played a leading role in raising the quality and demand for Thai silk products. On-farm consumption requirements. Many staple food value chains feature a large share of on-farm consumption in total demand. Kenya’s dairy value chain is typical in this respect, with on-farm milk consumption accounting for about one-third of total milk production (Figure 4, Channel 1). In these circumstances, the food security needs of producing households influence both farmer production and marketing decisions. During drought years, when farm production falls, surpluses available for sale diminish. Reductions in production variability and improved market access both tend to favor the growth of commercial production by ensuring food security needs of farm families. As a result, trends in the distribution of production across farms, in onfarm productivity and in production volatility may all influence the dynamics of marketed volumes as well as rural household food security. Policies. In many instances, government policies influence aggregate market growth as well as the relative prominence of individual supply channels. For many years, the Kenyan government banned sales of raw milk in urban areas on public health grounds. The liberalization of the milk markets in 1992 opened an active debate on this topic, resulting in less active suppression and triggering rapid growth of raw milk trade in urban centers. Liberalization likewise broke the KCC monopoly on milk processing, resulting in the emergence of over 50 privately owned milk processing plants. These major policy changes have triggered rapid growth in Channels 4 and 5. In the Thai silk case, trade policy drove wide swings in the viability of Channel 3 among producers of white cocoons for high-quality warp3 yarn. Because the weaving factories have the option of importing white silk yarn from Japan or China, the Thai government faces pressure to impose import quotas to protect its domestic reeling industry. Over time, the government has periodically imposed silk quotas, triggering objections from the local weaving factories. As a result, the import quotas have varied over time. The on-again off-again import quotas on the white silk yarn have resulted in heavy volatility of prices and demand for white cocoons and white yarn in Channel 3. As a consequence, producers of yellow weft yarn in Channel 2 have enjoyed more stable market growth and lower risks over time. 3.2. Supply side drivers of change New technologies. Frequently, the availability and choice of alternative production technologies governs quality, production cost and market access to growing supply channels. In Kenya’s milk value chain, long-term investments in improved production technology have resulted in significant productivity gains that underpin the steady growth in Channels 3, 4 and 5. The import of improved diary breeds, artificial insemination services, tick control and improved
3 Warp yarn runs the lengths of a bolt of cloth. Thus, the quality of warp yarn must be very high to ensure a quality final garment. Most weavers prefer pure white silk yarn from hybrid silkworms for their warp yarn with which they set their looms. The weft yarn, in contrast, runs horizontally across the loom. The modern Thai silk, popularized by the Jim Thompson Company, relies on hybrid yellow weft yarn to give Thai silk its characteristic texture. Yarn producers in Channel 2 produce hybrid yellow weft yarn while the specialized white cocoon producers and reeling mills in channel 3 produce the white warp yarn.
14
veterinary services have resulted in the widespread availability of highly productive cross-bred dairy cattle, even among smallholder dairy farmers. As a result, Kenyan dairy farmers attain milk yields two to three times higher than other countries in the region, productivity gains that result in cost reductions that favor market expansion over time. Botswana’s sorghum beer industry drew on technology spillovers from South Africa, where industrial research began in the mid-1950s on sorghum malting and the biochemistry of sorghum beer fermentations. Scientific work at South Africa’s Council for Scientific and Industrial Research (CSIR) identified the diastatic and proteolytic enzymes active in sorghum malt as well as the bacterial cultures and optimal conditions driving key fermentations, thereby enabling the emerging factory brewing industry to scale up sorghum beer production to industrial scales without spoilage from pathogenic bacteria. This scientific research laid the foundation for the trade malting industry that launched Channel 2 and the factory brewing industry that launched Channels 3 and 4 in Botswana during the early 1980s. The commercial resurrection of the Thai silk market likewise depended heavily on improved technology at all stages of production. Research by the Department of Agriculture and Extension (DOAE) produced highly productive hybrid silk worms by crossing white Japanese silkworms with yellow Thai silkworms. These hybrid silkworms produce cocoons with roughly double the thread length of native Thai silkworms, raising quality as well as profitability of rearing. Improved fly-shuttle looms and weaving designs introduced by the Jim Thompson Company spread rapidly throughout the industry, as employees split off from the parent company to produce a cluster of small-, medium- and large-scale weaving factories in and around the village of Pakton Chai where the Jim Thompson Company established its original production facility. Large firm investments. In many instances, large firms are the ones to introduce new technologies. Though sometimes disruptive, these new technologies sometimes open up new opportunities for small rural producers. In the Thai silk case, the Jim Thompson Company largely drove the development of the modern Thai silk industry beginning in the early decades following World War II. It introduced hybrid worms, improved reeling mills, improved looms and improved designs and quality control systems that formed the new quality standards for modern Thai silk. Over time, roughly 150 former employees branched out to establish weaving factories of their own, maintaining the procedures and quality standards they had learned from the Jim Thompson Company. In the Botswana sorghum beer case, as well, private investors in the Chibuku brewing company launched the first commercially successful factory-brewed sorghum beer in Botswana during the late 1970’s. At the same time, several local agribusiness entrepreneurs opened up trade malting production facilities that launched Channel 2 and improved quality and profitability of home brewing (Figure 2). Grades and standards. Large firms often introduce standards in order to contract production with local suppliers. In these situations, the commercial competitiveness of small firms often depends on their ability to comply with these new quantity and quality requirements (Box 1).

15
Public authorities likewise introduce grades and standards, often on public health grounds. In the case of Kenya’s milk industry, longstanding bans on raw milk sales in urban areas, which aimed to preserve public health, simultaneously reduced prospects for small firms marketing fresh milk (Figure 4, Channels 3 and 4). In response to the high transaction costs imposed by unevenly enforced sanctions against raw milk sellers, a program of active quality assurance training and dialogue between milk traders and regulators resulted in legalization of the raw milk trade, increased investment by raw milk traders in equipment and services, improved milk quality, rapid increases in marketed volumes and farmer incomes, and continued low consumer prices for raw milk (Baiya and Kithinji 2010; Grant 2011). Labor market changes. The effect of changing labor market conditions on value chains emerged most clearly in the Botswana sorghum beer case when, during the 1980’s, rapid mining-led economic growth triggered an urban economic boom. Rising urbanization and employment opportunities, for men and women, triggered rapidly rising urban wages. This increased the opportunity cost of home-brewing labor and diminished the profitability of home brewing, particularly in urban areas where the bulk of the population, income and growth in sorghum beer demand emerged. Over time, incomes have risen to such high levels that home brewing has been supplanted by more lucrative wage employment in modern retail and service sector supporting the mines. At the same time, increasing affluence has triggered a demand-side shift from sorghum beer to clear beers. The home brewing of sorghum beer, the country’s largest nonfarm employers during the 1970s, has been replaced by a dwindling market on the demand side and a legion of more lucrative employment opportunities on the supply side. Looking forward across the continent, Africa’s emerging demographic bulge will pose a daunting challenge over the coming several decades as African economies attempt to find gainful employment for this rapidly growing young workforce. As a result, the key labor market problem in most value chains will center around how to generate more employment for the burgeoning youth segment of the labor force.
16
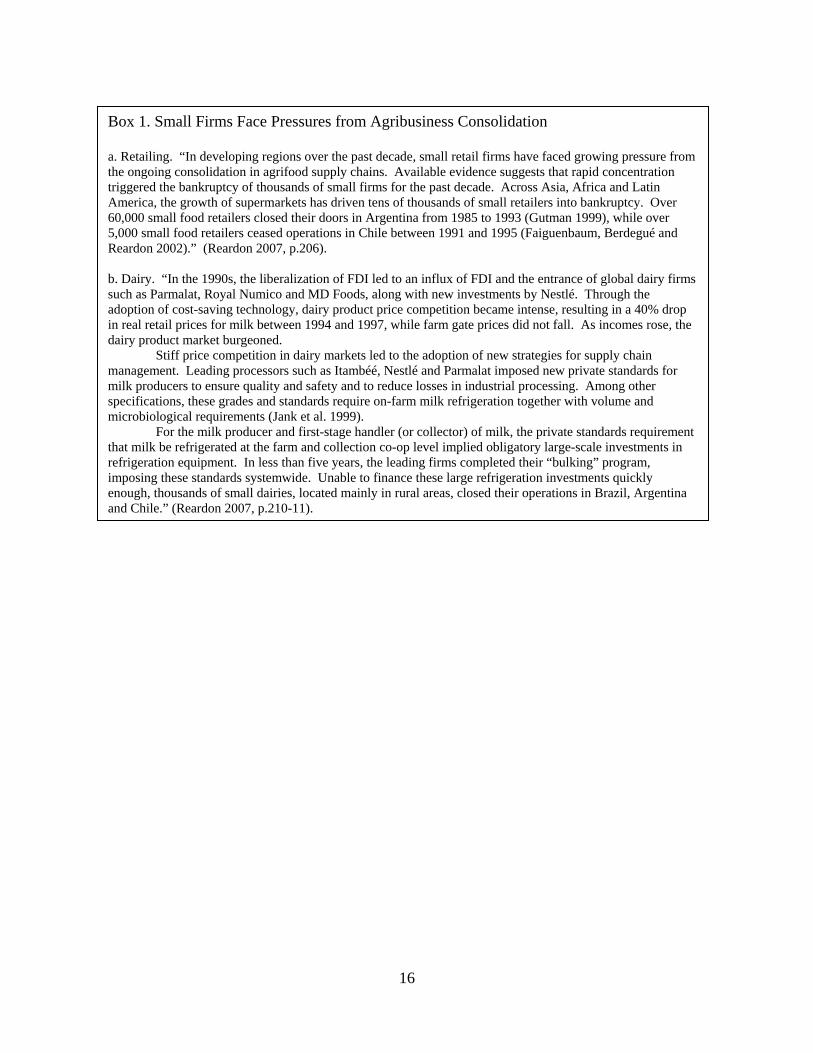
Box 1. Small Firms Face Pressures from Agribusiness Consolidation a. Retailing. “In developing regions over the past decade, small retail firms have faced growing pressure from the ongoing consolidation in agrifood supply chains. Available evidence suggests that rapid concentration triggered the bankruptcy of thousands of small firms for the past decade. Across Asia, Africa and Latin America, the growth of supermarkets has driven tens of thousands of small retailers into bankruptcy. Over 60,000 small food retailers closed their doors in Argentina from 1985 to 1993 (Gutman 1999), while over 5,000 small food retailers ceased operations in Chile between 1991 and 1995 (Faiguenbaum, Berdegué and Reardon 2002).” (Reardon 2007, p.206). b. Dairy. “In the 1990s, the liberalization of FDI led to an influx of FDI and the entrance of global dairy firms such as Parmalat, Royal Numico and MD Foods, along with new investments by Nestlé. Through the adoption of cost-saving technology, dairy product price competition became intense, resulting in a 40% drop in real retail prices for milk between 1994 and 1997, while farm gate prices did not fall. As incomes rose, the dairy product market burgeoned. Stiff price competition in dairy markets led to the adoption of new strategies for supply chain management. Leading processors such as Itambéé, Nestlé and Parmalat imposed new private standards for milk producers to ensure quality and safety and to reduce losses in industrial processing. Among other specifications, these grades and standards require on-farm milk refrigeration together with volume and microbiological requirements (Jank et al. 1999). For the milk producer and first-stage handler (or collector) of milk, the private standards requirement that milk be refrigerated at the farm and collection co-op level implied obligatory large-scale investments in refrigeration equipment. In less than five years, the leading firms completed their “bulking” program, imposing these standards systemwide. Unable to finance these large refrigeration investments quickly enough, thousands of small dairies, located mainly in rural areas, closed their operations in Brazil, Argentina and Chile.” (Reardon 2007, p.210-11).
17
4. Implications for the Poor, for Women and Youth 4.1. Good news and bad Change in any particular value chain can bring good news or bad news for the poor. In the three cases examined in this paper, changes in markets, technology, policies and large firm investments opened up clear opportunities for some groups of rural producers, while placing others under pressure. In the Botswana sorghum beer value chain, the large private investment in factory production of sorghum beer clearly placed the traditional home brewer in Channel 1 under pressure. Her market shrank overnight as brightly packaged factory-brewed “shake shake” entered to contest the sorghum beer market. As a result, employment in the sorghum beer value chain fell by about 30 percent and income distribution worsened considerably, with factory brewing transferring earnings from poor and middle-income groups to the wealthy factory owners and from women to men. However, at the same, time these developments opened up new opportunities for some women entrepreneurs. About one quarter of the home brewers shifted from Channel 1 to Channel 2, where the availability of improved “trade” malt enabled them to lower production costs, improved product consistency reduce spoilage and increased returns from $1.00 to $1.80 per day. Another group was able to switch from home brewing (Channel 1) to retailing of factory-brewed sorghum beer (Channel 3), a move that increased returns still further, to $3.50 per day (Figure 2). Thus, as new competitive pressures closed one door (in Channel 1), it opened up new opportunities in Channels 2 and 3 for women nimble enough to transition to these new, more profitable competitive niches. The Thai silk value chain offers more unambiguously good news for poor rural households. Before the launching of the Jim Thompson Company, traditional Thai silk was a stagnant, even dying industry. Yet the investments, design and marketing work by the Jim Thompson Company, together with allied research in silkworm breeding by the government’s DOAE, led to the commercial revival of the Thai silk industry by developing new export and tourist markets that created employment for an additional 70,000 rural women in the poorest section of Thailand. To participate in growing segments of the silk market, rural household producers had to shift out of Channel 1 and into the rapidly growing channels supplying modern Thai silk. The most lucrative opportunities lie in Channel 4, where most women prefer to work as employees or contract weavers for the large weaving mills, earning about $8.20 per day. But because of the heavy geographic clustering of weaving factories around the original Jim Thompson facility, this opportunity is only available to women living within a 15-kilometer radius of the village of Pakton Chai, where the many spinoff firms have emerged. Alternatively, women living outside the weaving hub can shift to become specialized producers of silk cocoons and yarn, hybrid yellow yarn in Channels 2 and pure exotic white cocoons in Channel 3. Adoption of improved reeling and rearing technology is necessary to make this option financially attractive. With mechanical reeling equipment and yellow hybrid eggsheets, women can earn $1.00 per day in Channel 2 or $3.25 per day using white silkworms in Channel 3. The Kenya dairy value chain illustrates an intermediate case, where thousands of small producers can feasibly grow their productivity and incomes by shifting to improved dairy breeds, rearing

18
practices and supplying either raw milk (Figure 4, Channels 3) or fresh milk for pasteurizing and further processing by cooperatives or private dairies (in Channel 4). Raw milk sales (in Channels 3 and 4) dominate Kenya’s urban milk markets because of raw milk retails for roughly half of the price of packaged, pasteurized milk (Table 1). Because most Kenyans consume fresh milk in hot tea, which they boil before consuming, raw milk serves their needs without pasteurization and the cost that entails. This considerable cost savings enables raw milk traders to procure milk from farmers at higher prices than those offered by formal processors and to retail at lower prices. Consumers benefit from low raw milk prices which, at half the level charged for pasteurized milk, considerably expand access to this source of animal protein and nutrients by low-income groups. Farmers benefit as well, receiving a 15-50% price premium when selling raw milk through Channels 3 and 4, while raw milk traders earn profits averaging $3.00 to $5.00 per day (Table 1). Key questions in any inclusive value chain analysis revolve around the following:
In which channels and competitive niches can the poor, women and youth compete? How can they adapt in order to raise productivity and shift into the growing, lucrative and
competitive channels? In what circumstances do the presence of large firms and small firms prove
complementary? How can IFAD or other support groups help poor and vulnerable groups to compete in
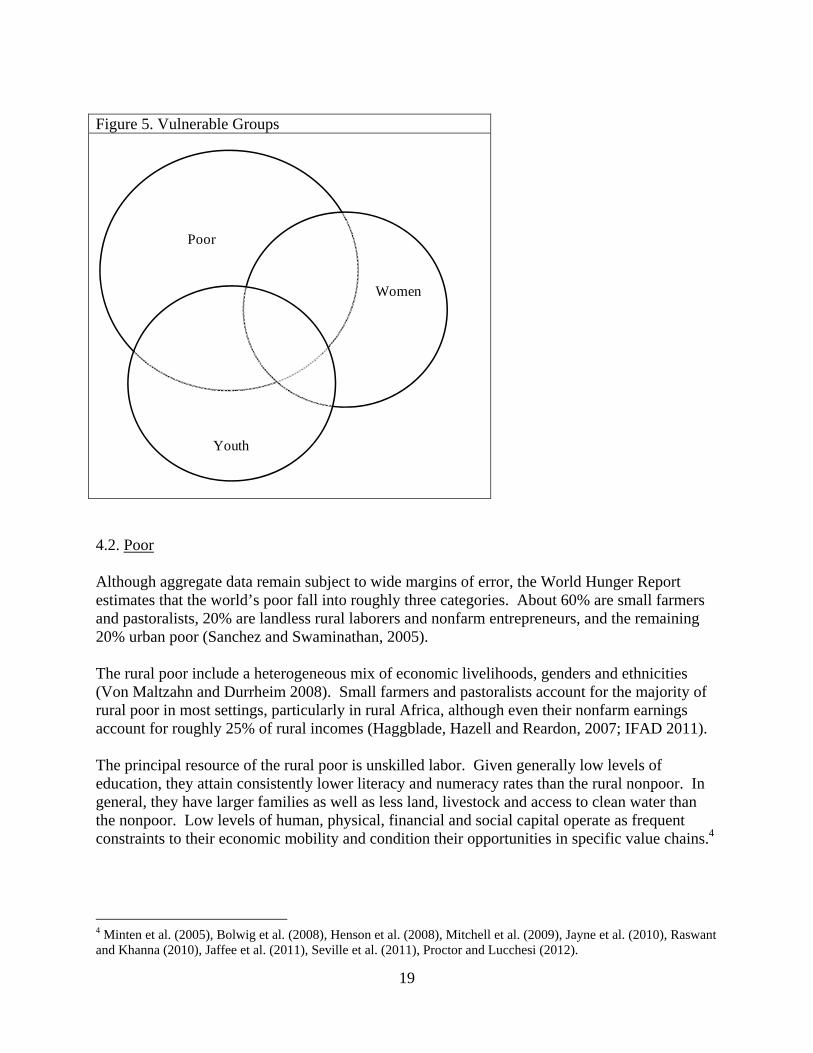
commercially viable market niches? In each specific instance, answers to these questions will depend on the prevalence and composition of vulnerable groups and on their resource endowments, their geographic location, information flows and on a wide variety of political, social and economic institutions that affect their economic mobility. The three groups of special interest to IFAD – the rural poor, women and youth – share some common characteristics as well as specific opportunities and challenges (Figure 5). Table 1. Marketing Margins in Kenya’s Milk Value Chain, 2000
Farm price/ ProfitabilityFarm-gate Retail retail price ($/day)
Pasteurized milk, formal supply channel 16 50 0.32 n.a.
Raw milk, informal channelsNakuru town
milk bar 19 24 0.77 $5.37hawker 16 25 0.64 $4.65
Nairobimilk bar 25 31 0.79 $3.76hawker 21 27 0.76 $2.83
Milk Price (Ks/liter)
Source: Ngigi et al. (2000).
19
Figure 5. Vulnerable Groups
Poor
Youth
Women
4.2. Poor Although aggregate data remain subject to wide margins of error, the World Hunger Report estimates that the world’s poor fall into roughly three categories. About 60% are small farmers and pastoralists, 20% are landless rural laborers and nonfarm entrepreneurs, and the remaining 20% urban poor (Sanchez and Swaminathan, 2005). The rural poor include a heterogeneous mix of economic livelihoods, genders and ethnicities (Von Maltzahn and Durrheim 2008). Small farmers and pastoralists account for the majority of rural poor in most settings, particularly in rural Africa, although even their nonfarm earnings account for roughly 25% of rural incomes (Haggblade, Hazell and Reardon, 2007; IFAD 2011). The principal resource of the rural poor is unskilled labor. Given generally low levels of education, they attain consistently lower literacy and numeracy rates than the rural nonpoor. In general, they have larger families as well as less land, livestock and access to clean water than the nonpoor. Low levels of human, physical, financial and social capital operate as frequent constraints to their economic mobility and condition their opportunities in specific value chains.4
4 Minten et al. (2005), Bolwig et al. (2008), Henson et al. (2008), Mitchell et al. (2009), Jayne et al. (2010), Raswant and Khanna (2010), Jaffee et al. (2011), Seville et al. (2011), Proctor and Lucchesi (2012).
20
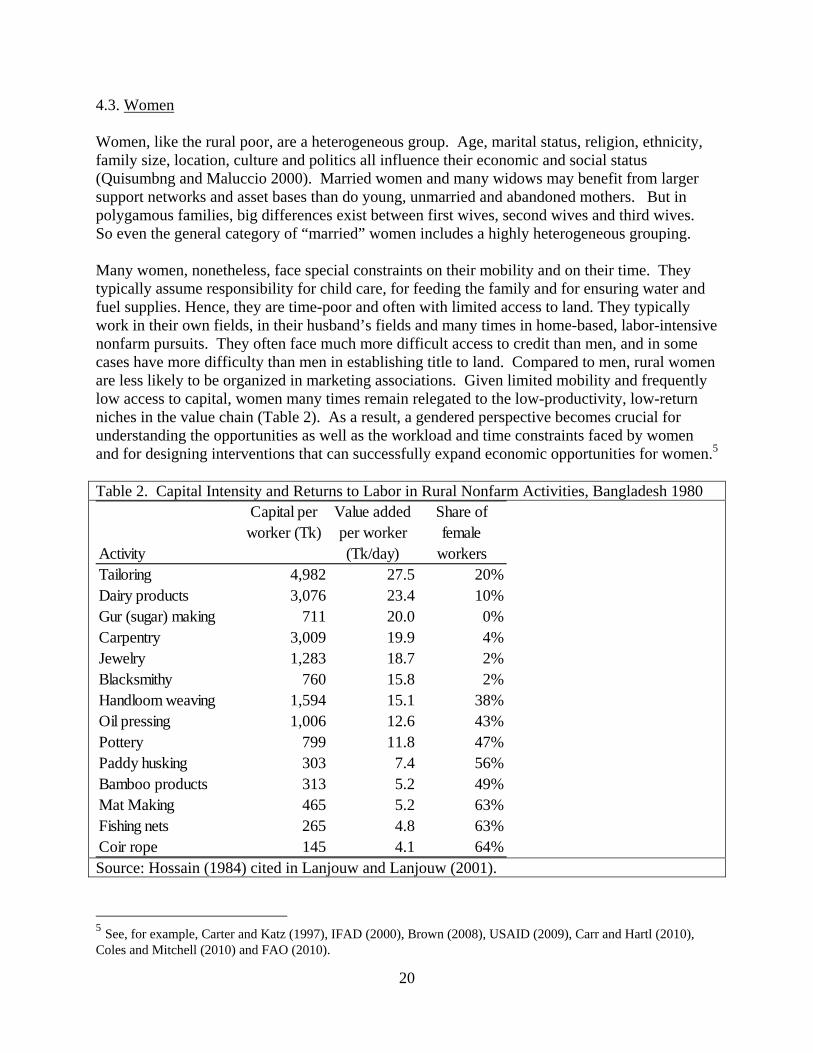
4.3. Women Women, like the rural poor, are a heterogeneous group. Age, marital status, religion, ethnicity, family size, location, culture and politics all influence their economic and social status (Quisumbng and Maluccio 2000). Married women and many widows may benefit from larger support networks and asset bases than do young, unmarried and abandoned mothers. But in polygamous families, big differences exist between first wives, second wives and third wives. So even the general category of “married” women includes a highly heterogeneous grouping. Many women, nonetheless, face special constraints on their mobility and on their time. They typically assume responsibility for child care, for feeding the family and for ensuring water and fuel supplies. Hence, they are time-poor and often with limited access to land. They typically work in their own fields, in their husband’s fields and many times in home-based, labor-intensive nonfarm pursuits. They often face much more difficult access to credit than men, and in some cases have more difficulty than men in establishing title to land. Compared to men, rural women are less likely to be organized in marketing associations. Given limited mobility and frequently low access to capital, women many times remain relegated to the low-productivity, low-return niches in the value chain (Table 2). As a result, a gendered perspective becomes crucial for understanding the opportunities as well as the workload and time constraints faced by women and for designing interventions that can successfully expand economic opportunities for women.5 Table 2. Capital Intensity and Returns to Labor in Rural Nonfarm Activities, Bangladesh 1980
Activity
Capital per worker (Tk)
Value added per worker (Tk/day)
Share of female
workersTailoring 4,982 27.5 20%Dairy products 3,076 23.4 10%Gur (sugar) making 711 20.0 0%Carpentry 3,009 19.9 4%Jewelry 1,283 18.7 2%Blacksmithy 760 15.8 2%Handloom weaving 1,594 15.1 38%Oil pressing 1,006 12.6 43%Pottery 799 11.8 47%Paddy husking 303 7.4 56%Bamboo products 313 5.2 49%Mat Making 465 5.2 63%Fishing nets 265 4.8 63%Coir rope 145 4.1 64%Source: Hossain (1984) cited in Lanjouw and Lanjouw (2001).
5 See, for example, Carter and Katz (1997), IFAD (2000), Brown (2008), USAID (2009), Carr and Hartl (2010), Coles and Mitchell (2010) and FAO (2010).

21
4.4. Youth In the short run, high fertility rates among poor households translate into larger families, higher dependency ratios. In the medium term, high fertility gives rise to a demographic bulge of youth (between the ages of 15 and 24) whose numbers pressure labor markets, land access and social systems. The challenge of this emerging youth bulge remains particularly acute in Africa. Given continued high fertility rates, the African continent remains the youngest in the world. As a result, youth (between the ages of 15 and 24) represent 40% of the workforce and 60% of the unemployed (World Bank 2009). In rural areas, youth account for about two-thirds of agricultural employment (ILO 2007). The growing demographic bulge suggests that youth employment will constitute one of the continent’s key challenges over the coming decades.6 Young job seekers face generation-specific challenges, particularly difficulties in accessing land, livestock and other productive assets while their parents continue to farm actively. Under Africa’s ruling rural gerontocracy, those holding power may not be in formal leadership positions. Growing demographic pressure on farmland and pastures restrict young adults’ futures in agriculture. In general, these pressures make high-value, land-conserving agricultural products such as horticulture and poultry increasingly attractive. Nonetheless, young workers do enjoy some advantages over older workers. They are typically more mobile, physically stronger and better able to adapt to new information and communication technologies. Moreover, they enjoy longer productive working spans over which to amortize training and education investments. In many agricultural value chains, youth occupy specific entry-level niches, as apprentices, assembly traders and porters, from which they can accumulate savings and transition over time. Although gender has historically received more attention in value chain work than have youths,7 the same diagnostic methods and value chain overlays described here can be applied to focus attention on prospects for young entrepreneurs and young workers in specific value chains. The following discussion examines how vulnerable groups and their advocates groups can identify competitive niches in which the poor, women and youth can effectively compete in growing value chains.
6 Curtain (2001), Chiguata et al. (2005), Godfrey (2006), World Bank (2009). ), Bennell and Hartl (2011), IFAD (2012), Proctor and Lucchesi (2012). 7 See, for example, Chen (1996), IFAD (2000) and USAID (2009).

22
5. Best-Practices for Designing Effective, Inclusive Value Chain Interventions 5.1. Select value chains wisely Poor women and youth cannot always compete successfully in today’s rapidly consolidating agribusiness value chains. Rapid supermarket expansion in South America led to the closure of tens of thousands small food retailers starting in the 1980s, while similar large-scale dairy investments led to the bankruptcy of thousands of small dairies (Box 1). So it is important to select targets wisely by identifying arenas where opportunities exist for large numbers of poor people to compete effectively in growing value chains. Selection criteria favoring inclusive value chain interventions:
Current large-scale employment Growth potential for both employment and income of poor, women and youth Low barriers to entry Complementary rather than competitive value chain relationships between large and
small firms lead to “win-win” opportunities where large and small firms grow together (Table 3).
5.2. Conduct public-domain value chain diagnostics A large number of detailed manuals exist describing step-by-step diagnostic procedures and data sources that advocates of vulnerable groups can use to identify competitive growth opportunities for their preferred client groups.8 Data collection typically proceeds in phases: first, a review of existing literature and secondary data, second a rapid rural appraisals involving key informant interviews, and finally, where necessary, collection of selected primary data to fill in key gaps. The many available field manuals describe in detail analytical and diagnostic procedures for designing interventions, typically following the four general steps outlined below. 5.2.1. Construct a snapshot of current value chain structure
a. Map the current value chain structure (the base map). b. Quantify the size of each supply channel as well as other dimensions of interest:
number of enterprises, volume of production in each channel, value added, prices at each stage, income, employment, investment requirements (quantitative overlays).
c. Identify the key niches where poor people, women and youth are most prevalent. d. Evaluate the technology used at each stage: factor intensity, costs, skills needed to
operate it, potential barriers to entry. e. Analyze the value chain governance structure and the institutional environment.
5.2.2. Identify the key dynamics under way
f. Evaluate past growth trajectories: including aggregate and channel-specific growth rates.
8 See, for example, Goldberg (1968), Haggblade and Gamser (1991), Bear et al. (1993), Fabre (1993), Bourgeois and Herera (2000), Kaplinsky and Morris (2000), Ferrand et al. (2004), KIT et al. (2006), Roduner and Gerrits (2006), Meihlbrandt et al. (2006), da Silva and da Souza (2007), FIAS (2007), Lundy et al. (2007), van Melle et al. (2007), DfID (2008), DfID and SDC (2008), Riisgaard et al. (2008), Vermeulen et al. (2008) and UNIDO (2011) .
23
g. Identify key driving forces using the supply and demand factors outlined in this paper.
h. Assess growth prospects and competitive pressures faced by the poor, women and youth.
5.2.3. Identify feasible transitions for the poor, women and youth
i. Conduct a rapid inventory of the strengths and weaknesses of these groups: literacy rates, numeracy, access to markets, financial capital, social capital stocks and familiarity with technology critical in the value chain.
j. Identify needed steps for the poor, women and youth to adapt to changes (growth opportunities or competitive pressures) under way (combining information from steps g and h).
5.2.4. Design interventions likely to expand commercially viable, competitive opportunities for the poor, women and youth The steps a through j detailed above typically lead to the identification of a set of feasible competitive niches as well as a menu of potential interventions designed to assist vulnerable groups adjust in ways that allow them to take advantage of growing commercial opportunities. These may include shifting to a more profitable or competitive niche (often this involves adopting different or improved technology) or improving skills, production quality and efficiency in existing niches (Figure 6). Each potential intervening institution draws on its specific philosophy, human capital and institutional strengths in identifying attractive avenues for providing assistance. As a result, a wide variety of potential interventions may emerge in any given value chain. The following characteristics generally offer the best chance for success:
• Temporary interventions that stimulate sustainable viable private businesses. • Leveraged interventions, that is, intervention points that affect large numbers of
vulnerable people at once through policy, training programs, financial institutions, business associations, cooperatives or work with up- or down-stream intermediaries that expand market opportunities for large numbers of linked small enterprises simultaneously. This is in contrast to focusing mainly on one-on-one assistance to individuals.
• Strong links with key private sector participants.

24
Figure 6. Business Models for Inclusive Agricultural Value Chains
Consumption
Retailing
Wholesaling
ProcessingAssembly
Farming
Inputs
spot market salescontract services
Farm Consumption of Own Production
Processors/Assembly Traders
Farmers
Farmer Groups
Model 0Subsistence Farming
Model 1Smallholders in Spot
Markets
Model 2Farmer Groups
Model 4Integrated
Agribusinesses
Agro Input Dealers
Informal retailers and wholsealers
Model 3 Contract Farming
Integrated Agribusinesses
Formal Retailers
Consumers
Processors
Processor input depots
Contract Farmers
Source: Byerlee (2012) and Haggblade (2012). 5.3. Build coalitions for implementation and value chain monitoring In order for vulnerable groups to compete in rapidly changing value chains, they must be able to adapt to new competitive opportunities and pressures as they emerge. And change often comes rapidly, as the three examples in this paper have emphasized. For that reason, it becomes important for implementing organizations to maintain an ongoing capacity to monitor value chain performance. This, in turn, requires solid, ongoing communication links with the key business operators and institutions governing a given value chain. In many instances, existing service providers (market information systems, technical institutes, etc.) or local research organizations can fill these ongoing monitoring and liaison functions. During the diagnostic, design and implementation phases of value chain involvement, it becomes important to maintain strong links with the private sector and to work with associations or industry groups that are widely respected and trusted by value chain participants. While busy businessmen and women rarely have the time to participate as full-time members of diagnostic and design teams, most successful design efforts engage in strong consultation with the private

25
sector early on and throughout the process. Strong private sector participation in a validation workshop offers a good tool for making sure their views are well represented. Many value chain operational manuals emphasize the importance of building coalitions among value chain participants and support institutions through what they variously call value chain task forces, industry councils, “interprofessionnels,” or “mesas de consultacon” (Bourgeois and Herera 2005, Chitundu et al. 2009, Ricks and Staatz, 2010). Ongoing dialogue among groups with a vested interested in value chain performance becomes a vehicle for recognizing shifting opportunities and monitoring ongoing performance of commercially viable vulnerable groups.

26
Table 3. Competitive and Complementary Small Firm-Large Firm Relationships
Product market Location Complementary Relationships Competitive
Input supplier Output marketer
Bamboo products Bangladesh large traders assemble and market output from small producers
small producers vs. large factories
Batik Indonesia wholesalers market output of household producers
household vs. medium-sized producers
Bean marketing Bolivia large exporter markets production from 2,500 rural producers
Dairy Egypt large modern firms vs. micronenterprises
Maize marketing Zimbabwe small hammer mills vs. large mills
Poultry Bangladesh large hatchery supplies chicks to small farmers
traders market eggs produced by many small farmers
small producers vs. integrated large farms
Rice marketing Bangladesh itinerant traders supply large wholesalers
husking mills vs. small mills vs. automatic mills
Rattan furniture Indonesia factory producers market through itinerant retailers
large exporters market village production
small producers vs. large factories
Shrimp Indonesia large hatcheries supply fry to small producers
brokers buy from small producers
small producers vs. large fishermen
Silk Thailand large factories subcontract with home weavers
yarn merchants market weft yarn from home reelers
home weavers vs. large integrated factories
Vegetable marketing India small women vendors vs. licensed retailers
Wheat marketing Bangladesh itinerant traders supply large wholesalers
hammer mills vs. large flour millers
Source: Haggblade (2007).

27
Annex 1. Value Chain Mapping Conventions Figure A.1. Value Chain Mapping Conventions
Consumption
Retailing
Wholesaling
Processing
Assembly
Farming
Legend OverlaysN = number of enterprises
existing enterprise type V = volume of salespotential enterprise type S = sales valuespot market sale VA = value addedassembly point K/L = investment cost per workercontract sale = niche accessible to vulnerable groups
Final Market #1
Farm Production of Own Consumption
Integrated Agribusinesses
Subcontractors
Retailers
Wholesalers
Processors
Channel 1Subsistence Production
Channel 4Integrated
Agribusinesses
Channel 2Fully Specialized
Businesses
Small Commercial
Farms
Assembly Traders
Large Commercial Farms
Channel 3Subcontracting
Supermarkets
Final Market #2
New Farmer
Cooperatives
Channel 5Possible Future
Channel
Source: modified based on Haggblade and Gamser (1991).

28
References Abbott, J.C. (1986). Marketing Improvement in the Developing World: What Happens and What
We Have Learned. FAO Economic and Social Development Series No. 37. Rome: Food and Agriculture Organization.
African Development Bank (ADB). (2011). The Middle of the Pyramid: The Dynamics of the
Middle Class in Africa. Market Brief, April 20, 2011. Tunis: African Development Bank. Agbor, J., Taiwo, O., and J. Smith. (2012). Sub-Saharan Africa’s Youth Bulge: A Demographic
Dividend or Disaster? Foresight Africa: Top Priorities for the Continent in 2012. Africa Growth Initiative at Brookings, pp.9-11
Altenburg, T. (2007). Donor Approaches to Supporting Pro-Poor Value Chains. Baiya, Hzrun and Kithinji, Judith. 2010. Transforming the Dairy Sector: Benefits from the
Formalization of the Raw Milk Trade in Kenya. SITE Case Study. Nairobi: SITE Enterprise Promotion.
Bear, Marshall A., Gibbons, Caythy; Haggblade, Steven and Ritchie, Nick. (1992). Facilitator’s
Guide for Training in Subsector Analysis. GEMINI Tools for Micro Enterprise Programs. Washington, DC: Development Alternatives Inc.
Bennell P. (2010). Investing in the Future: Creating Opportunities for Young Rural People.
IFAD Paper, December. Bennell, P. and Hartl, M. (2011). Investing in the future, Creating opportunities for young rurall
people. Rome: IFAD. Bolwig, S., S. Ponte, A. Du Toit, L. Riisgaard and N. Halberg. (2008). Integrating poverty,
gender and environmental concerns into value chain analysis: A Conceptual Framework and lessons for Action Research, DIIS, Working Paper no 2008:16
Bolwig S., Ponte, S., de Toitm A., Riisgaard L., and N. Halberg. (2010). Integrating Poverty and
Environmental Concerns into Value-Chain Analysis: A Conceptual Framework. Development Policy Review, 28(2): 173-194.
Boomgard, James J., Davies, Stephen P., Haggblade, Steven, and Mead, Donald C. (1992). A
Subsector Approach to Small Enterprise Promotion and Research. World Development, 20(2), pp. 199-212.

29
Bourgeois, Robin and Herrera, Danilo. (2000). Actor-Led Change for Efficient AgriFood Systems: Handbook of the Participatory Actor-Based CADIAC Approach (Bogor, Indonesia: CGRPT Centre: Regional Coordination Center for Research and Development of Coarse Grains, Pulses, Roots and Tuber Crops in the Humid Tropics of Asia and the Pacific).
Bricas, Nicolas, Marie-Cécile Thirion, and Bernardin Zoungrana. (2009). Bassins de production
et de consommation des cultures vivrières en Afrique de l’Ouest et du Centre. Ougadougou: CILSS.
Brown, L. (2008). Module 1: Gender and food security, Gender in Agriculture Sourcebook,
World Bank. Byerlee, Derek. (2012). Business Models for Promoting the Modernization of Smallholder
Value Chains. Washington, DC: Partnership to Cut Hunger and Poverty in Africa. Carr, M. and Hartl, M. (2010). Lightening the Load: Labour-saving technologies and practices
for rural women, IFAD. Carter, M. and Katz, M. (1997). Separate spheres and the conjugal contract: Understanding the
impact of gender-biased development, in Intrahousehold resource allocation in developing countries: Models, methods, and policy, The John Hopkins University Press
Choudhary, V. (2008). Strengthening Vertical Linkages Briefing Paper, USAID Chambers, Robert. (1994). Participatory rural appraisal (PRA): analysis and experience. World
Development, 22(9), pp. 1253-1268. Chen, Martha Alter. (1996). Beyond Credit: A Subsector Approach to Promoting Women’s
Enterprises. Ottawa, Canada: The Aga Khan Foundation. Chiguata F., Schnurr J., Jones-Wilson D. and V. Torres (2005). Being 'real' about youth
entrepreneurship in Eastern and Southern Africa. ILO SEED Working Paper No. 72, ILO, Geneva.
Coles, C. and Mitchell, J. (2010). Gender and agricultural value chains: A review of current
knowledge and practice and their policy implications, FAO, ESA Working paper No. 11-05.
Cooke, Ben and Kothari, Uma. (2001). Participation, The New Tyranny? (London: Zed Books). Christiaensen, L., Demery, L. and Kuhl, J. (2010) ‘The Evolving Role of Agriculture in Poverty
Reduction: An Empirical Perspective’, Working Papers UNU-WIDER Working Paper W, World Institute for Development Economic Research UNU-WIDER.
30
Curtain R. (2001). Youth and employment: a public policy perspective. Development Bulletin, no. 55: 7-11
Da Silva, Carlos A. and da Souza Filho, Hildo M. (2007). Guidelines for Rapid Appraislas of
Agrifood Chain Performance in Developing Countries. Rome: FAO. DeJanvry, A. and Sadoulet, E. (2009). Agricultural growth and poverty reduction: additional
evidence. Oxford: Oxford University Press. DfID (2008). Making Value Chains Work Better for the Poor: A Toolbook for Practitioners of
Value Chain Analysis. London: DFID. DFID and SDC. (2008). The Operational Guide for the Making markets Work for the Poor
(M4P) Approach. London and Berne: DFID and SDC. Diao, Xinshen, Thurlow, James, Benin, Samuel and Fan, Shenggen. (2012). Strategies and
Priorities for African Agriculture: Economywide Perspectives from Country Studies. Washington, DC: IFPRI.
Dowds, Curtis M. and Hinojosa, Jorge. (1999). An Introductory Guide to the Subsector
Approach to Community and Economic Development Washington, DC: National Council of La Raza.
Ebony Consulting International (ECI). 2001. The Kenyan Dairy Subsector: A Study for
DfID/Kenya. Nairobi: DfID. Elbehri, Azia and Lee, Maria. (2011). The Role of Women Producer Organizations in
Agricultural Value Chains: Practical Lessons from Africa and India. Rome: FAO. FAO. (2010). Gender dimensions of agricultural and rural employment: Differentiated pathways
out of poverty, Status, trends and gaps, Pathways Out of Poverty Program. Rome: FAO. FAO. (2011). Guidance on how to address rural employment and decent work concerns in FAO
country activities. Guidance Material #1. Rome: FAO. FAO, IFAD, MIJARC. (2012). Summary of the Findings of the FAO/IFAD/MIJARC Joint
Project on ‘Facilitating Access of Rural Youth to Agricultural Activities’. Background Paper, Youth Session of the 2012 Farmer’ Forum.
Fabre, P. (1993). Note de méthodologie générale sur l’analyse de filière. Rome: FAO. Ferrand, D., Gibson, A., and Scott, H. (2004). Making Markets Work for the Poor: an Objective
and an Approach for Governments and Development Agencies. Woodmead: Commark Trust.

31
Foreign Investment Advisory Service (FIAS). (2007). Moving Toward Competitiveness: A Value Chain Approach. Washington, DC: The World Bank.
Fowler, B. and M. Brand. (2011). Pathways out of poverty: Applying key principles of the value
chain approach to reach the very poor, USAID, Microreport #173 Gereffi, G. (1995). “Global Production Systems and Third World Development.” in: B. Stallings
(ed.), Global Change, Regional Response: The New International Context of Development, New York, Cambridge University Press, pp.100-142.
Gereffi G., Humphrey, J., and T. Sturgeon. (2005). The Governance of Global Value Chains.
Review of International Political Economy, 12(1): 78-104. Gereffi, G., Lee J., and M. Christian. (2009). US-Based Food and Agricultural Value Chains and
Their Relevance to Healthy Diets. Journal of Hunger & Environmental Nutrition, 4(3): 357-374.
Godfrey, M.. (2006). Youth employment in sub-Saharan Africa, an assessment of existing
interventions, World Bank, Workshop, February 2005. Washington, DC: World Bank. Goldberg, Ray A. (1968). Agribusiness Coordination: A Systems Approach to the Wheat,
Soybean and Florida Orange Economies (Boston: Harvard University Graduate School of Business Administration).
Goletti, Francesco. (2005). Agricultural Commercialization, Value Chains and Poverty
Reduction. Making Markets World Better for the Poor, Discussion Paper No.7 (Hanoi: Asian Development Bank).
Grant, William. 2011. Formalizing the Warm Milk Industry in Kenya. Nairobi: Micro-Links.
http://microlinks.kdid.org/breakfast. Haggblade, Steven and Gamser, Matthew. (1991). A Field Manual for Subsector Practitioners.
GEMINI tools for Microenterprise Programs. Washington, DC: Development Alternatives Inc.
Haggblade, Steven. (2007). Subsector Supply Chains: Operational Diagnostics for a Complex
Rural Economy. Chapter 15 in Haggblade, Hazell and Reardon, editors Transforming the Rural Nonfarm Economy (Baltimore, MD: Johns Hopkins University Press).
Hamre C. (2008). Selecting Pro-Poor Value Chains : A Useable Framework. Dissertation.
London School of Economics. London. Hartwich, F. and Kormawa, P. (2009). Value chain diagnosis: Building blocks for a holistic and
rapid analytical tool, UNIDO, Italy

32
Hawkes, C. and M.T. Ruel. (2011). Value Chains for Nutrition. 2020 Conference Paper 4, prepared for the IFPRI 2020 International Conference “Leveraging Agriculture for Improving Nutrition and Health”, February 10-12, New Delhi, India.
Hemmati, Minu. (2002). Multi-Stakeholder Processes for Governance and Sustainability -
Beyond Deadlock and Conflict (London: Earthscan). Henson, S., S. Jaffee, J. Cranfield, J. Blandon and P. Siegel. (2008). Linking African
smallholders to high-value markets: Practitioner perspectives on benefits, constraints and intervention, World Bank, Policy Research Working Paper 4573
Humphrey, J. and L. Navas-Aleman. (2010). Value chains, donor interventions and poverty
reduction: A review of donors practices, University of Sussex, IDS Research Report 63. IFAD. (2012). Youth in Agriculture, Special session of the Farmers' Forum Global Meeting,
Synthesis of Deliberations, 18 February, Italy. IFAD. (2011a). Access to Markets: Making Value Chains Work for Poor Rural People. Accessed
online at http://www.ifad.org/english/market/index.htm on April 20, 2012. IFAD. (2011b). Rural Poverty Report 2011. Rome: International Fund for Agricultural
Development. IFAD. (2000). Gender perspective: focus on rural poor: An overview of gender issues in IFAD
assisted projects, Programme Management Department. Rome: IFAD. International Labor Office (ILO). (2007). African Employment Trends. Accessed online at
http://www.ilo.org/wcmsp5/groups/public/---ed_emp/---emp_elm/---trends/documents/publication/wcms_114278.pdf on April 23, 2012
International Labor Office (ILO). (2004). Improving prospects for young women and men in the
world of work: A guide to youth employment. Policy Considerations and Recommendations for the Development of National Actions Plans on Youth Employment. Accessed online at http://www.ilo.org/public/libdoc/ilo/2004/104B09_280_engl.pdf on April 23, 2012.
Jaffee, S., S. Henson and L. Diaz Rios. (2011). Making the grade: Smallholders Framers,
emerging standards and development assistance programs in Africa, Word bank, A research program synthesis, Report No. 62324-AFR
Jayne, T.S., N. Mason, R. Myers, J. Ferris, D. Mather, M. Beaver, N. Lenski, A. Chapoto and D.
Boughton. (2010). Patterns and trends in food staples markets in Eastern and Southern Africa: Toward the identification of priority investments and strategies for developing markets and promoting smallholder productivity growth, Michigan State University

33
Kaplinsky, Raphael. (2000). Globalisation and Unequalisation: What Can Be Learned from Value Chain Research? Journal of Development Studies, 37(2), pp. 117-146.
Kaplinsky, Raphael and Morris, Mike. (2000). A Handbook for Value Chain Research (Ottawa:
International Development Research Center). Kaplinsky, Raphael and Morris, Mike. (2003). Governance Matters in Value Chains. Developing
Alternatives 9(1), pp. 11-18. Kingsbury, D. (2010). Issues Paper on Value Chains for Opportunities and Growth: Roles for
IFAD Co-Funded Projects. Regional Project Implementation Workshop in Western and Central Africa. November 8-11, Dakar, Senegal.
KIT, Faida MaLi, and IRR. (2006). Chain Empowerment: Supporting African Farmers to
Develop Markets. Amsterdam: Royal Tropical Institute. Kleinberg, S. and Campbell, R. (2008). Business Enabling Environment and the Value Chain,
USAID Knorringa P., and L. Pegler (2006). Globalisation, Firm Upgrading, and Impacts on Labour.
Royal Dutch Geographical Society KNAG, 97 (5): 470-479. Lauret, F. (1993). Sur les études de filières agro-alimentaires. Economies et Societes 17 (May). Lundy, Mark, María Verónica Gottret, Carlos Ostertag, Rupert Best, and Shaun Ferris. 2007.
Participatory Market Chain Analysis for Smallholder Producers. Cali, Colombia: CIAT. Lusby, Frank and Panliburton, Henry. (2002). Subsector/Business Service Approach to Program
Design. Office of Microenterprise Development, USAID. Washington, DC: USAID. Magistro, John, Roberts, Mike, Yoder, Robert, Kramer, Fritz and Weight, Elizabeth. (2004).
PRISM: A Model for Smallholder Wealth Creation through Integrated Service Provision, Value Chain Market Development and Micro Irrigation Technology. Paper presented at the IWMI Regional Workshop and Policy Roundtable on Pro-Poor Intervention Strategies in Irrigated Agriculture in Asia, 25-27 August, Colombo, Sri Lanka.
Matthias, L. and Herr Tapera, J. (2009). Value Chain Development for Decent Work: A guide
for development practitioners, government and private sector initiatives, ILO. Minten, B., L. Randrianarison and J. Swinnen. (2005). Global retail chains and poor farmers:
Evidence from Madagascar, LICOS Discussion paper 16406, Centre for Institutions and Economic Performance, UK.
Mitchell, J., J. Keane and C. Coles. (2009). Trading up: How a Value Chain Approach can
benefit the rural poor, COPLA - Comercio y Pobreza en Latino America and the Overseas Development Institute, UK.

34
Miehlbradt, Alexandra O., McVay, Mary and Tanburn, Jim. (2005). From BDS to Making
Markets Work for the Poor: the 2005 Reader (Geneva: International Labour Office). Meyer-Stamer, Jorg. (2002). PACA: Participatory Appraisal of Competitive Advantage
http://www.paca-online.de. Meyer-Stamer, Jorg and Waitring, Frank. (2006). Value Chain Analysis and Making Markets
Work for the Poor: Poverty Reduction Through Value Chain Promotion (Eschborn: GTZ(.
microLINKS Wiki. (2010a). Youth and the Value Chain Approach. Accessed online at
http://apps.develebridge.net/amap/index.php/Youth_and_the_Value_Chain_Approach on April 18, 2012
microLINKS Wiki. (2010b). Value Chain Approach. Accessed online at
http://apps.develebridge.net/amap/index.php/Value_Chain_Approach on April 18, 2012 Miehlbrade, Alexandra O., McVay, Mary and Tanburn, Jim. (2006). Implementing Sustainable
Private Sector Development : Striving for Tangible Results for the Poor. Geneva : International Labour Office.
Montigard, J. (1992). L’analyse des filières agro-alimentaires. Economies et Sociétés, Cahiers de
l’ISMEA 26(6), pp. 59-70. Ngigi, Margaret et al. (2010). Smallholder dairying in Eastern Africa. Chapter 6 in Steven
Haggblade and Peter B.R. Hazell (editors) Successes in African Agriculture: Lessons for the Future. Baltimore: Johns Hopkins University Press.
OECD. (2006). Promoting Pro-Poor Growth. Policy Statement. DAC High-Level Meeting Porter, Michael E. (1998). Clusters and the New Economics of Competition. Harvard Business
Review 76(6), pp. 77-90. Proctor F. and Lucchesi V. (2012). Small-Scale Farming and Youth in an Era of Rapid Rural
Change. Knowledge Programme Small Producer Agency in the Globalised Market, International Institute for Environment and Development (IIED), London.
Quisumbing, A.R. and Maluccio, J.A. (2000). Intrahousehold allocation and gender relations:
New empirical evidence from four developing countries, International Food Policy Research Institute, Food Consumption and Nutrition Division, Discussion paper No. 84, USA.
Raswant, V. and R. Khanna. (2010). Pro-poor rural value chain development, IFAD, Thematic
study

35
de Ruijter, M. de Wildt, D. Elliot and R. Hitchins. (2006). Making Markets Work for the Poor: Comparative Approaches to Private Sector Development, Springfield Centre for the Swiss Agency for Development and Cooperation
Reardon, Thomas and Timmer, C. Peter. (2005). Transformation of Markets for Agricultural
Output in Developing Countries Since 1950: How Has Thinking Changes? in R. Evenson and P. Pingail, editors, Handbook of Agricultural Economics,Volume 3A (Amsterdam: North Holland Press).
Reardon, Thomas. (2007). Agribusiness Transitions in the Developing World. Chapter 5 in
Haggblade, Hazell and Reardon (editors), The Rural Nonfarm Economy: Opportunites and Threats in the Developing World. Baltimore: Johns Hopkins University Press.
Regoverning Markets. (2008). Farmers Innovation- Linking with Modern Agrifood Markets.
Conference Issues Paper 4 prepared for the International Conference on “Inclusive Business in Agrifood Markets: Evidence and Actions”, March 5-6, Beijing.
Riisgaard, Lone, Bolwig, Simon, Matose, Frank, Ponte, Stefano, du Toit, Andries and Halberg,
Niels. (2008). A Strategic Framework and Toolbox for Action Research with Small Producers in Value Chains. DIIS Working Paper no 2008/17. Copenhagen: Danish Institute for International Studies.
Roduner, Daniel. (2007). Donor Interventions in Value Chain Development (Berne: Swiss
Agency for Development and Cooperation). Roduner, Daniel and Gerrits, Andreas. (2006). The Role of Donors in Value Chain
Interventions. Rural Development News (2):7-19. Seville, D., Buxton, A. and Vorley, B.. (2011). Under what conditions are value chains effectives
tools for pro-poor development? World Foundation, International Institute for Environment and Development
Shaffer, James. (1968). Changing Orientation of Marketing Research. American Journal of
Agricultural Economics 50(5), pp. 1437-1449. Spore. (2012). Making the Connection: The Rise of Agricultural Value Chains. Special Issue,
July 2012. Wageningen,The Netherlands: CTA (Technical Center for Agricultural and Rural Cooperation).
Staal, S. J., A. Nin Pratt, and M. Jabbar. 2008. Dairy development for the resource poor. Part 2:
Kenya and Ethiopia dairy development case studies. Pro-Poor Livestock Policy Initiative. Stamm, A. and C. von Drachenfels. (2011). Value Chain Development: Approaches and
Activities by Seven UN Agencies and Opportunities for Interagency Cooperation. International Labor Office, Geneva.

36
Staatz, John and Rick, Donald. (2010). Value chain participant councils: a tool for improved
market coordination and broad-based growth. Ashford: CAB International. Thirtle, C., Lin, L. & Piesse, J. (2003). The Impact of Research-Led Agricultural Productivity
Growth on Poverty Reduction in Africa, Asia and Latin America, World Development 3112:1959–1975.
Tracey-White J. (2005). Rural-Urban Market Linkages: An Infrastructure Identification and
Survey Guide. FAO Agricultural Services Bulletin 161. United Nations Economic Commission for Africa (UNECA). (2011). African Youth Report:
Addressing the Youth Education and Employment Nexus in the New Global Economy. Accessed online at http://www.uneca.org/ayr2011/African%20Youth%20Report_2011_Final.pdf on April 23, 2012
United Nations Division for Social Policy and Development (UNDSPD). (2000). Definition of
youth 2. Accessed online at http://www.un.org/events/youth2000/def2.htm on April 20, 2012
United Nations Economic Commission for Africa (UNECA) and United Nations Programme on
Youth (UNPY). (2011). Regional Overview: Youth in Africa. Fact Sheet, International Year of Youth.
United Nations Industrial Development Organisation (UNIDO). 2011. Pro-poor Value Chain
Development: 25 guiding questions for designing and implementing agroindustry projects. United Nations Industrial Development Organization (UNIDO). Vienna, Austria.
USAID. (2007). Value chain program design: Promoting market-based solutions for MSME and
industry competitiveness. Washington, DC: USAID. USAID. (2009). Promoting gender equitable opportunities in agricultural value Chains: a
Handbook, GATE Project under Women in Development lQC, GEW-I-00-02-00018-00, Task Order No. 02. Washington, DC: USAID.
van Melle, Cathelijne, Coulibaly, Ousmane, Hell, Kerstin. (2007). Agricultural Value Chain
Development in West Africa – Methodological framework and case study of mango in Benin. American Agricultural Economics (AAE) Conference Proceedings (2007) 49-52.

37
Vellema, S. (2010). Value Chains for Pro-Poor Development. DGIS-WUR Partnership Globalization and Sustainable Development. Wageningen University and Research Center. Accessed online at http://www.dgis.wur.nl/NR/rdonlyres/5B2BC447-EDB8-4F0A-A296-86498587ED91/105462/ValueChains4PropoorDevelopmentfocus2010.pdf on April 23, 2012.
Vermeulen, S., Woodhill, J., Proctor, F. & Delnoye. R. (2008). Chain-wide Learning for
Inclusive Agrifood Market Development. A Guide to Multi-stakeholder Processes for Linking Small-scale Producers to Modern Markets. IIED (London) and Wageningen University.
Visser, Piet, Marc Steen, Juergen Greiling, Timoteos Hayesso, Rem Neefjes and Heinz Greijn
(2012). Pro-Poor Value Chain Development: Private Sector-Led Innovative Practices in Ethiopia. Addis Ababa: SNV Ethiopia.
Von Maltzahn, R. and Durrheim, K. (2008). Is poverty multidimensional? A comparison of
income and asset based measures in five Southern African countries, Social Indicators Research, Vol 86 No 1, pp 149-162.
Vorley, Bill. (2001). The Chains of Agriculture: Sustainability and the Restructuring of Agri-
Food Markets. Opinion: World Summit on Sustainable Development (London: International Institute for Environment and Development).
Warner, Jeroen F. (2006). Still waters run deep: (Non-)Participation in Multi-Stakeholder
Platforms. Water Resources Development, 22(1), pp.15-35. Weatherspoon, David D. and Reardon, Thomas. (2003). The Rise of Supermarkets in Africa:
Implications for Agrifood Systems and the Rural Poor. Development Policy Review 21(3),pp. 333-355.
Williams, Glyn. (2004). Evaluating participatory development: tyranny, power and (re)-
politicisation. Third World Quarterly, 25(3), pp. 577-578. World Bank. (2009). Youth and Employment in Africa: The Potential, the Problem, the Promise.
Africa Development Indicator 2008/09, Publication 46951. Washington, DC: World Bank.