a comparison of wage levels and wage inequality in the ... · this paper sets out to investigate...
TRANSCRIPT
A Comparison of Wage Levels and Wage Inequality in
the Public and Private Sectors, 1995 and 2000
Ingrid Woolard1 Senior Research Specialist
Human Sciences Research Council and Senior Lecturer Department of Economics University of Port Elizabeth E-mail: [email protected]
Development Policy Research Unit February 2002 Working Paper 02/62 ISBN 0-7992-2113-9
1 Senior Research Specialist, Human Sciences Research Council. The views expressed are those of the author and do not necessarily reflect those of the HSRC.

Abstract
This paper sets out to investigate relative wages and wage dispersion for formal sector workers in the private and public sectors. The paper explicitly measures the size of the public sector wage premium and offers some reasons for its existence. It also attempts to document the changing pattern of wage differentials between public and private sector employees between 1995 and 2000.
Three sources of differences in the public and private sector wage distributions are considered. These are: differences in the distributions of worker characteristics in the two sectors; differences in the returns to various worker characteristics in the two sectors; and differences in the distributions of unexplained wage residuals across sectors (Juhn, Murphy and Pierce, 1993).
Acknowledgements
This paper is the seventh in a series of research outputs related to a two-year project entitled Understanding Labour Demand Trends and Patterns in South Africa, housed within the Development Policy Research Unit. This research paper is funded by USAID and administered by the Joint Centre for Political and Economic Studies Inc. under Subcontract No. JCNAT98-954-0800 from Nathan Associates Inc. Their generous financial assistance in this regard is acknowledged.
I would like to thank Haroon Bhorat for extremely useful discussions during the writing of this paper. All errors and omissions are mine alone.
The views expressed herein are those of the authors and not necessarily those of the DPRU or USAID.
Development Policy Research Unit Information about our Working Papers and other Tel: +27 21 650 5705 published titles are available on our website at:
Fax: +27 21 650 5711 http://www.uct.ac.za/depts/dpru

Table of Contents
1. INTRODUCTION ..................................................................................................... 1
2. THE LFS DATA........................................................................................................ 2
3. PROFILE OF THE PUBLIC SECTOR.................................................................. 4
4. WAGE DIFFERENCES IN PUBLIC VERSUS PRIVATE SECTOR EMPLOYMENT IN SOUTH AFRICA....................................................................... 5
5. MULTIVARIATE COMPARISONS OF EARNINGS IN THE PUBLIC AND PRIVATE SECTORS ................................................................................................... 8
5.1 THE EFFECTS OF GENDER, RACE, EDUCATION, OCCUPATION AND LOCATION................................................................................................................... 12
5.2 PUBLIC SECTOR WAGE PREMIUM.................................................................... 13
6. COMPARISON OF FINDINGS FOR 1995 AND 2000 ....................................... 15
7. WAGE DISPERSION ............................................................................................. 17
8. CONCLUSION ........................................................................................................ 18
REFERENCES ............................................................................................................ 19
APPENDIX .................................................................................................................... 1

P r i v a t e S e c t o r s , 1 9 9 5 a n d 2 0 0 0
1
1. Introduction
The public service is the largest single employer in South Africa, employing almost 1,1 million people in 2001. With one in six formal sector workers employed by the State, this in itself makes this sector so large as to merit attention. Moreover, while the public service has much in common with other formal employers, it differs in its size, its skills profile and the state’s special role in society. The government is required by the Constitution to lead by example and thus public sector employment should be scrutinised in terms of equity and efficiency objectives.
Since the transition to democratic rule, there have been substantial changes in public sector employment. The number of people employed by national and provincial government has declined2, pay scales have been simplified and the State has made great strides in improving representations. At the same time, the number of managers has been increasing (Thompson and Woolard, 2002) and wage increases at all levels have out-performed inflation, resulting in better pay for most government employees.
This paper sets out to investigate relative wages and wage dispersion for formal sector workers in the private and public sectors. The paper explicitly measures the size of the public sector wage premium and offers some reasons for its existence. It also attempts to document the changing pattern of wage differentials between public and private sector employees between 1995 and 2000.
There are three sources of differences in the public and private sector wage distributions, namely differences in the distributions of worker characteristics in the two sectors; differences in the returns to various worker characteristics in the two sectors; and differences in the distributions of unexplained wage residuals across sectors (Juhn, Murphy and Pierce, 1993). Each of these elements is considered.
In the first part of the study, regression analysis is used to compare public and private sector wages so as to control factors such as age, education levels, location, race, and occupation. Both least squares and quantile regression estimates of the public sector premium are presented.
In the second part of the paper, very simple inequality measures are employed to investigate whether the public sector exhibits less or more wage inequality than the private sector.
Throughout the paper, only full-time formal-sector employees are considered. The primary source of data is the raw data from the February 2000 Labour Force Survey (LFS) conducted by Statistics South Africa. This is a particularly useful survey for the purposes of this paper because it explicitly distinguishes between public and private employment. However, a comparison over time was also required. For this reason the 1995 October Household Survey (OHS) was also analysed. The 1995 OHS provides detailed information about occupation and economic sector, but does not specify whether the worker’s employer is the State or a private sector firm. Consequently, a public/private proxy was created, based on occupation, economic sector and (in a few difficult cases) working conditions.3 This is an imperfect variable and inferior to the “clean”
2 In 1995 there were 1 267 763 public sector employees. By 2001 this number had shrunk to 1 053 569 (Public Service payroll information (PERSAL)). 3 My thanks to Keith Thompson (Department of Economics, University of Port Elizabeth) for doing this.

D P R U W o r k i n g P a p e r 0 2 / 6 2 I n g r i d W o o l a r d
2
split that is available for the 2000 LFS, but nevertheless the best available for the purposes of a comparison across time.
The 2000 LFS and 1995 OHS data are also not directly comparable because the 1995 survey asked about net wages, while the 2000 survey asked about gross wages. Consequently, the wage cannot be compared. Neither can the degree of wage dispersion be directly compared, since net wages will always be less dispersed than gross wages (as a result of the progressive nature of the personal income tax system). The purpose of the comparison is simply to see whether there has been a shift in the differences between public and private sector wages and their dispersion.
2. The LFS Data
The LFS is a newly introduced, twice-yearly rotating panel household survey, specifically designed to measure the dynamics of employment and unemployment in the country. The pilot round of LFS fieldwork took place in February 2000, based on a probability sample of 10 000 dwelling units. This round was considered to be a pilot, because it represented the start of the rotating panel survey in South Africa and it had a relatively small sample size (Statistics South Africa, 2001: 2). Both the sampling methodology and the questionnaire design have changed, when compared with the previous measurements of labour market issues in the October household surveys (OHS).
For the purpose at hand, the great merit of the LFS lies in the detailed information provided about the type of employer, which makes it possible to distinguish public sector employees. (In fact, it is possible to dissect this further into levels of government, but this is not done here.)
The LFS questionnaire asked respondents to state their “total salary”, including overtime and bonuses, and before the deduction of tax. Questions about income are always problematic, with the biggest problem being under-reporting. While under-reporting is sometimes deliberate, it is often simply the case that respondents do not have a clear understanding of the meaning of terms such as “gross” or do not know what their “total package” is. Table 1 shows the distribution of wages reported by those who said they were employed by central or provincial government and compares this to the distribution derived from the payroll (PERSAL) data provided by the Department of Public Service Administration. (For the purposes of this comparison, those employed by local government are excluded since they are not paid via PERSAL). The annual PERSAL salaries were divided by 13 (not 12), since public servants receive a 13th cheque which respondents were likely to ignore.
A C o m p a r i s o n o f W a g e L e v e l s a n d W a g e I n e q u a l i t y i n t h e P u b l i c a n d P r i v a t e S e c t o r s , 1 9 9 5 a n d 2 0 0 0
3
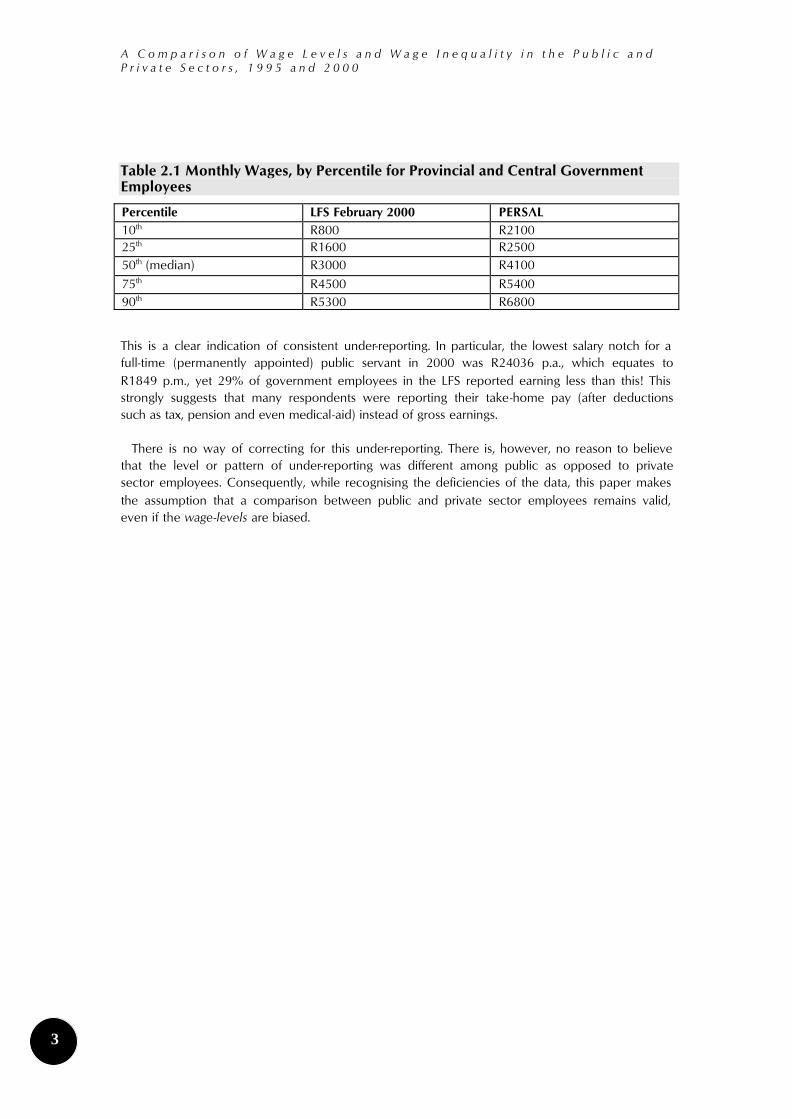
Table 2.1 Monthly Wages, by Percentile for Provincial and Central Government Employees
Percentile LFS February 2000 PERSAL 10th R800 R2100 25th R1600 R2500 50th (median) R3000 R4100 75th R4500 R5400 90th R5300 R6800
This is a clear indication of consistent under-reporting. In particular, the lowest salary notch for a full-time (permanently appointed) public servant in 2000 was R24036 p.a., which equates to R1849 p.m., yet 29% of government employees in the LFS reported earning less than this! This strongly suggests that many respondents were reporting their take-home pay (after deductions such as tax, pension and even medical-aid) instead of gross earnings.
There is no way of correcting for this under-reporting. There is, however, no reason to believe that the level or pattern of under-reporting was different among public as opposed to private sector employees. Consequently, while recognising the deficiencies of the data, this paper makes the assumption that a comparison between public and private sector employees remains valid, even if the wage-levels are biased.

D P R U W o r k i n g P a p e r 0 2 / 6 2 I n g r i d W o o l a r d
4
3. Profile of the public sector
Table 3.1 shows the breakdown of major occupational groups in the public sector.
Table 3.1 Employment and Average Salary in Major Occupational Groups in the Public Sector, 1999
Occupation Number % of public sector
Average salary (Rand p.a.)
Educator 369 000 34% R63 000
Police, Correctional Services, Defence 200 000 18% R50 600
Administration 125 000 5% R40 900
Elementary occupations 212 000 19% R25 400
Nurses 75 000 7% R50 600
Skilled production workers 59 000 5% R34 600
Nursing assistants 29 000 3% R34 600
Professionals & high-level professionals (other than health and legal professionals)
21 000 2% R72 000
Medical doctors 13 000 1% R78 300
Health professionals other than doctors and nurses
9 000 1% R63 000
Legal personnel 5 000 <1% R94 000
Senior management 4 000 <1% R220 000
Total public service 1 101 000 100 R40 900
Source: Adapted from Seidman-Makgetla, 2000:20
There are 30 departments at national level and more than 200 in the provinces. Some 80% of public servants work for SAPS, the SANDF, Correctional Services or the provincial health and education departments (Seidman-Makgetla, 2000:19). The average provincial education department has 43 000 employees and the average health department 25 000. SAPS and the SANDF have around 100 000 employees each. At the other end of the spectrum, administrative and economic services departments are much smaller, with most having less than 500 employees.
Table 3.2 shows the change in average remuneration per worker in the private and public sectors for the period 1995-2000. Real wages have been increasing in both sectors, although not as rapidly in the public service as in the private sector. Table 3.2 shows that there was a

A C o m p a r i s o n o f W a g e L e v e l s a n d W a g e I n e q u a l i t y i n t h e P u b l i c a n d P r i v a t e S e c t o r s , 1 9 9 5 a n d 2 0 0 0
5
substantial increase in public service salaries in 1995, but in subsequent years private sector increases outstripped those in the public sector.
This table needs to be interpreted with caution. Public sector employment dropped dramatically over this period and many of the jobs that were shed were low-skill (and thus low-paid) ones (Bhorat, 2001:6 and Seidman-Makgetla, 2000:20). The loss of low-income jobs will in itself push up average remuneration levels without there, necessarily being an increase in the individual salaries of those that remain.
Table 3.2 Percentage change in Remuneration per worker, Public and Private Sectors, 1995 - 2000
Percentage change in remuneration per worker At current prices At constant prices* Year Public sector Private sector Public sector Private sector 1995 14.3 11.0 4.0 0.9 1996 10.2 11.0 0.9 1.7 1997 11.7 10.4 3.5 2.3 1998 10.2 16.5 3.6 9.4 1999 4.6 9.2 -1.3 3.0 2000 9.6 9.1 2.7 2.2 1995-2000 77.7 88.8 14.1 20.9 Source: South African Reserve Bank Quarterly Bulletins, various years. * Deflated using the non-agricultural GDP deflator
In order to show actual changes in wages for public servants who have retained their jobs and not changed salary scale, Table A1 in the Appendix shows the increase in salary levels by a notch between 1996 and 1999. The nominal increases range from 48% at the very bottom end to 32% at the top-end. While these increases are small in real terms, the larger increases at the lower-end of the salary spectrum, implies a narrowing of the wage-gap in the public service over this period.
4. Wage differences in public versus private sector employment in South Africa
The mean public sector wage in the February 2000 LFS was R45 034 per annum. In comparison, the February 2000 LFS finds that the average (formal) private sector wage was only R28 300 per annum.
As a first exploratory step, Table 1 compares private and public sector wages in relation to a number of variables considered singly. For the purposes of this exercise, medians are reported so as to compare the wages of average workers, rather than average wages, which might be skewed by large outliers.
Beginning with education level, it is clear that the private sector heavily penalises those with little education, while the public sector pays roughly the same for all those with less than Grade 12. On the other hand, someone with a degree, especially a postgraduate one, is more highly rewarded in the private sector. It is thus immediately apparent that there is less wage dispersion in the public sector: the average graduate (without a postgraduate qualification) in the private sector

D P R U W o r k i n g P a p e r 0 2 / 6 2 I n g r i d W o o l a r d
6
is earning 10 times that of the average worker with no education, while in the public sector this ratio is only 3.5.
Moving on to occupational classes, it is evident that it is only professionals that on average do worse in the public sector. All other occupational classes seem to experience a small premium if they work for the state. Not surprisingly, this premium is especially large for those in (low-paid) elementary occupations where minimum wages play an important role in determining wage levels.
The last part of Table 1 shows what the average, formal sector worker person of a given race and gender is earning in the public and private sectors. It is apparent that the average African or Coloured person in the public sector is earning more than the average person (of the same race and gender) in the private sector.

A C o m p a r i s o n o f W a g e L e v e l s a n d W a g e I n e q u a l i t y i n t h e P u b l i c a n d P r i v a t e S e c t o r s , 1 9 9 5 a n d 2 0 0 0
7
Table 1 Comparison of Median Monthly Wages in Public and Private Sectors
Median monthly gross wages Private Sector Public Sector Educational attainment No schooling Some primary schooling Completed primary Some secondary Completed secondary Diploma (without grade 12) Diploma (with grade 12) First degree Postgraduate qualification
600 800 1100 1290 2380 3000 4000 6000 9000
1505 1500 1500 2000 3000 4000 4000 5250 5250
Occupational class Legislators, senior officials and managers Professionals Technicians Clerks Service workers, shop and market sales workers Skilled agricultural and fishery workers Craft & related trade workers (incl. mining) Plant and machine operators and assemblers Elementary occupations
5250 6000 3000 2000 1300 800 1500 1500 700
8000 5250 4000 3000 3000 1300 2000 2000 1500
Race and gender African male African female Coloured male Coloured female Indian male Indian female White male White female
1250 800 1400 1250 2400 2000 5250 3500
2000 2500 2500 3000 4000 -- 5250 4000
Source: author’s calculations using LFS February 2000, Statistics South Africa
It must be noted that these univariate comparisons may be completely misleading. It is only once we place all these variables in a multivariate context and allow them to compete, that we will be able to say whether, for example, a White female in the public sector is earning more than her private sector counterpart after controlling for education, experience, occupation, sector and location. This is done in the next section.

D P R U W o r k i n g P a p e r 0 2 / 6 2 I n g r i d W o o l a r d
8
5. Multivariate comparisons of earnings in the public and private sectors
A wage equation (or earnings function) was used to estimate the premium associated with public sector employment. The wage equation employed, relates the logarithm of monthly earnings to a set of individual characteristics and an indicator variable (“public”) for working in national, provincial or local government.
The following basic earnings function was employed:
ln (Earnings) = β0 + β1(Edu) + β2(Exp) + β3(Exp2) + β4(Race) + β5(Gender) + β6(Region) + β7(occupation) + β8(Public)
where:
• Edu represents educational attainment. Following Kingdon and Knight (2001:22), Edu was included as a set of categorical variables, rather than simply as years of schooling.
• Exp is proxied using the standard technique, which is to take age less years of schooling less
six.4 • Race represents a set of dummy variables describing the four official South African racial
groups. • Gender is a dummy variable. • Region is a set of dummy variables that describe the nine different South African provinces
and urban and rural locations. • Occupation is a set of dummies for the (one digit) major occupation groupings. • Public is a dummy variable for the type of employer (private/public).
Education was allowed to affect wages through a set of seven categorical variables, with “no education” as the omitted category. The wage equation includes linear and quadratic powers of experience. (Following Poterba and Rueben (1994), cubic and quartic powers of experience were also tested but were not significant.) A set of control variables for nine broad occupational
4 This proxy for experience has been criticized on the grounds that individuals do not have continuous work histories outside of schooling. Such a critique is particularly relevant in a country with an unemployment rate as high as South Africa’s, but the proxy is nevertheless used here in the absence of a better alternative.

A C o m p a r i s o n o f W a g e L e v e l s a n d W a g e I n e q u a l i t y i n t h e P u b l i c a n d P r i v a t e S e c t o r s , 1 9 9 5 a n d 2 0 0 0
9
classifications, were also included, with “elementary workers” as the omitted category. The wage equation was estimated separately, for various groups so as to tease out whether the premium differs across groups.
In addition, the wage equation was estimated separately for public and private sector employees, respectively. This serves two purposes. Firstly, it allows us to see whether the effects of (or returns on) different individual characteristics differ across the two sectors. Secondly, it allows us to predict average wages in each sector for hypothetical workers with fixed characteristics.
Ordinary Least Squares (OLS) and quantile regressions were estimated. The results of the OLS are shown in Tables 2 and 3. In order to keep the paper of manageable length, the results of the quantile regressions are not presented in full, and the results are discussed only in the section on public sector premia.
D P R U W o r k i n g P a p e r 0 2 / 6 2 I n g r i d W o o l a r d
10
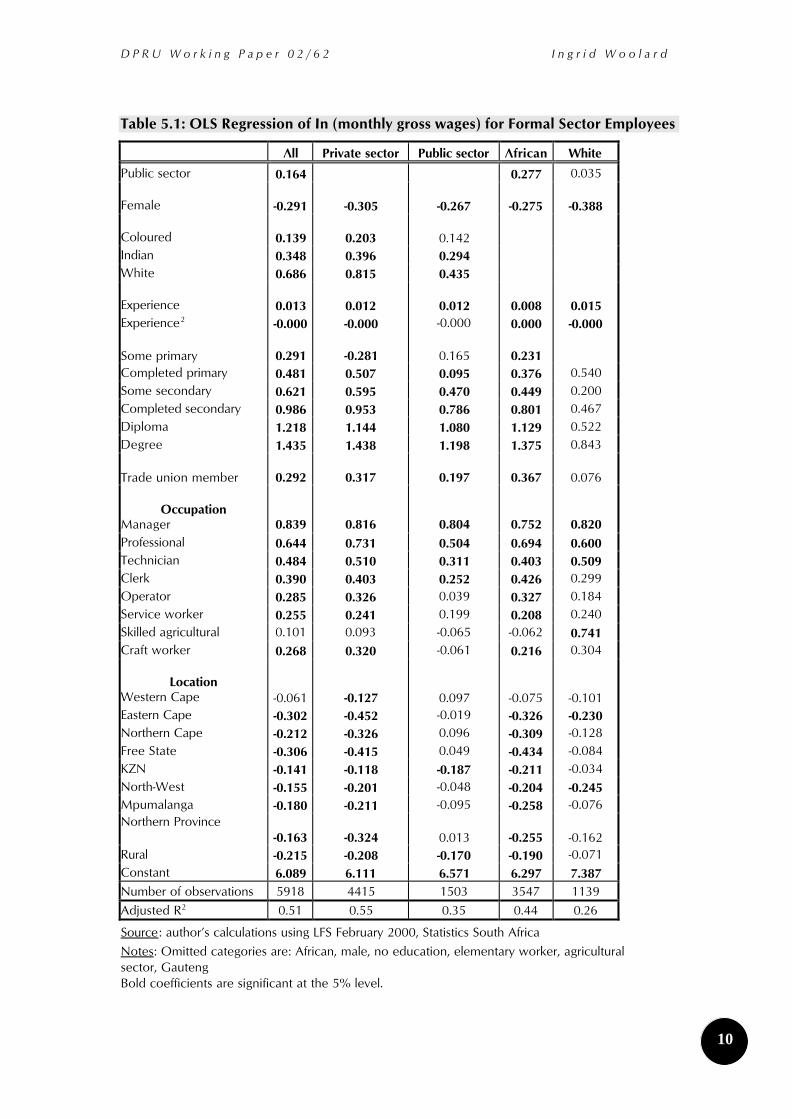
Table 5.1: OLS Regression of In (monthly gross wages) for Formal Sector Employees
All Private sector Public sector African White
Public sector 0.164 0.277 0.035 Female -0.291 -0.305 -0.267 -0.275 -0.388 Coloured 0.139 0.203 0.142 Indian 0.348 0.396 0.294 White 0.686 0.815 0.435 Experience 0.013 0.012 0.012 0.008 0.015 Experience2 -0.000 -0.000 -0.000 0.000 -0.000 Some primary 0.291 -0.281 0.165 0.231 Completed primary 0.481 0.507 0.095 0.376 0.540 Some secondary 0.621 0.595 0.470 0.449 0.200 Completed secondary 0.986 0.953 0.786 0.801 0.467 Diploma 1.218 1.144 1.080 1.129 0.522 Degree 1.435 1.438 1.198 1.375 0.843 Trade union member 0.292 0.317 0.197 0.367 0.076
Occupation Manager 0.839 0.816 0.804 0.752 0.820 Professional 0.644 0.731 0.504 0.694 0.600 Technician 0.484 0.510 0.311 0.403 0.509 Clerk 0.390 0.403 0.252 0.426 0.299 Operator 0.285 0.326 0.039 0.327 0.184 Service worker 0.255 0.241 0.199 0.208 0.240 Skilled agricultural 0.101 0.093 -0.065 -0.062 0.741 Craft worker 0.268 0.320 -0.061 0.216 0.304
Location Western Cape -0.061 -0.127 0.097 -0.075 -0.101 Eastern Cape -0.302 -0.452 -0.019 -0.326 -0.230 Northern Cape -0.212 -0.326 0.096 -0.309 -0.128 Free State -0.306 -0.415 0.049 -0.434 -0.084 KZN -0.141 -0.118 -0.187 -0.211 -0.034 North-West -0.155 -0.201 -0.048 -0.204 -0.245 Mpumalanga -0.180 -0.211 -0.095 -0.258 -0.076 Northern Province -0.163 -0.324 0.013 -0.255 -0.162 Rural -0.215 -0.208 -0.170 -0.190 -0.071 Constant 6.089 6.111 6.571 6.297 7.387 Number of observations 5918 4415 1503 3547 1139 Adjusted R2 0.51 0.55 0.35 0.44 0.26
Source: author’s calculations using LFS February 2000, Statistics South Africa Notes: Omitted categories are: African, male, no education, elementary worker, agricultural sector, Gauteng Bold coefficients are significant at the 5% level.
A C o m p a r i s o n o f W a g e L e v e l s a n d W a g e I n e q u a l i t y i n t h e P u b l i c a n d P r i v a t e S e c t o r s , 1 9 9 5 a n d 2 0 0 0
11
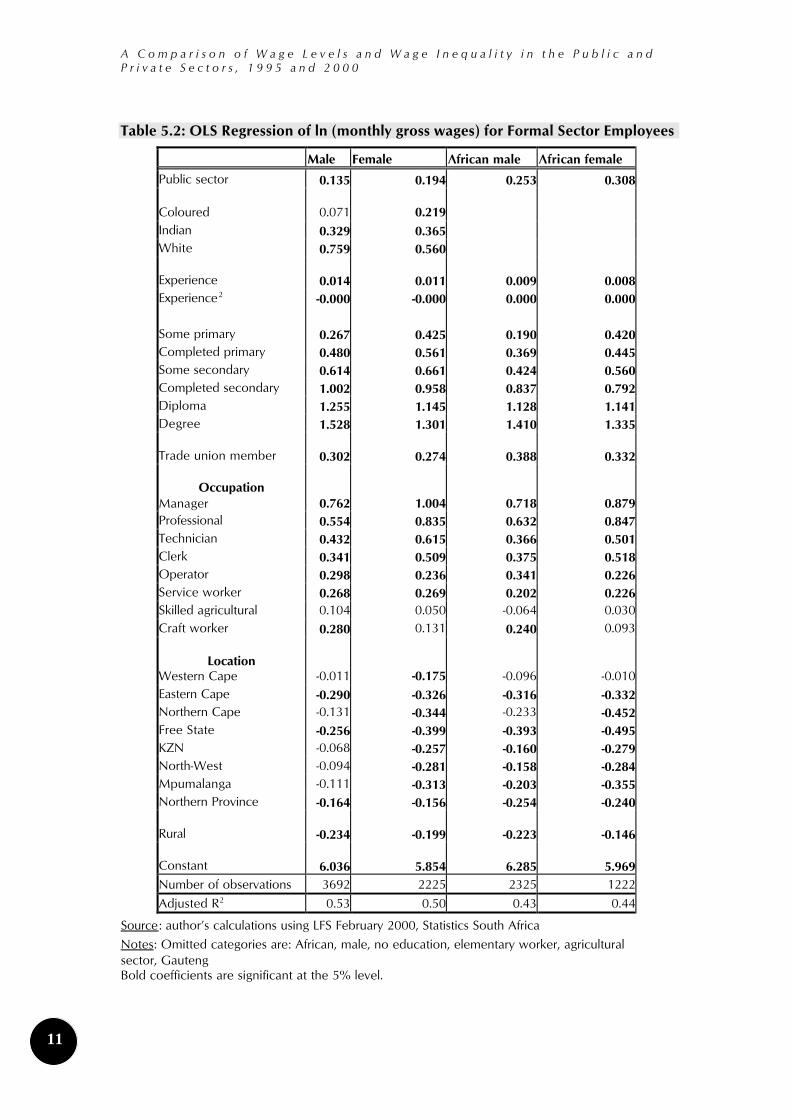
Table 5.2: OLS Regression of ln (monthly gross wages) for Formal Sector Employees
Male Female African male African female
Public sector 0.135 0.194 0.253 0.308 Coloured 0.071 0.219 Indian 0.329 0.365 White 0.759 0.560 Experience 0.014 0.011 0.009 0.008Experience2 -0.000 -0.000 0.000 0.000 Some primary 0.267 0.425 0.190 0.420Completed primary 0.480 0.561 0.369 0.445Some secondary 0.614 0.661 0.424 0.560Completed secondary 1.002 0.958 0.837 0.792Diploma 1.255 1.145 1.128 1.141Degree 1.528 1.301 1.410 1.335 Trade union member 0.302 0.274 0.388 0.332
Occupation Manager 0.762 1.004 0.718 0.879Professional 0.554 0.835 0.632 0.847Technician 0.432 0.615 0.366 0.501Clerk 0.341 0.509 0.375 0.518Operator 0.298 0.236 0.341 0.226Service worker 0.268 0.269 0.202 0.226Skilled agricultural 0.104 0.050 -0.064 0.030Craft worker 0.280 0.131 0.240 0.093
Location Western Cape -0.011 -0.175 -0.096 -0.010Eastern Cape -0.290 -0.326 -0.316 -0.332Northern Cape -0.131 -0.344 -0.233 -0.452Free State -0.256 -0.399 -0.393 -0.495KZN -0.068 -0.257 -0.160 -0.279North-West -0.094 -0.281 -0.158 -0.284Mpumalanga -0.111 -0.313 -0.203 -0.355Northern Province -0.164 -0.156 -0.254 -0.240 Rural -0.234 -0.199 -0.223 -0.146 Constant 6.036 5.854 6.285 5.969Number of observations 3692 2225 2325 1222Adjusted R2 0.53 0.50 0.43 0.44
Source: author’s calculations using LFS February 2000, Statistics South Africa Notes: Omitted categories are: African, male, no education, elementary worker, agricultural sector, Gauteng Bold coefficients are significant at the 5% level.

D P R U W o r k i n g P a p e r 0 2 / 6 2 I n g r i d W o o l a r d
12
By using the coefficients from the “private sector” equation in Table 5.1, it is possible to predict the wage distribution of all employees as if they were employed in the private sector. In this way, it is possible to explore the differences in the distribution of worker attributes in the two sectors. Figure 5.2 shows that the predicted monthly wages in the public sector is right-shifted, relative to the analogous private sector wage distribution. This indicates that there are proportionately more workers with high human capital in the public than private sectors.
Figure 5.2 Predicted Private Sector earnings of Public and Private Sector Employees
3 4 5 6 7 8 9 10
ln monthly wage (R)
Rel
ativ
e fr
eque
ncy
private sector public sector
5.1 The Effects of Gender, Race, Education, Occupation and Location
A few general points will be made about the regressions, before turning to the primary issue of analysing the public sector premium.
Women earn less than their male counterparts (after controlling for other factors) and this effect is almost as large in the public sector as in the private sector.
Whites and Indians earn more than Africans (after controlling for other factors) in both the public and private sectors, but the difference is much larger in the private sector. Interestingly, in the pubic service there is no positive wage discrimination for Coloureds (unlike in the private sector) and the racial premium for Indians and Whites is much smaller than in the private sector, although still significant. The much smaller racial effects in the public sector relative to the private sector should be pleasing to government.
The education variables bear some scrutiny, as the univariate cross-tabulations above indicated that education made less of a difference to wages in the public sector than in the private sector. The omitted education variable is completed secondary education and thus all the educational coefficients need to be seen in relation to this. Public sector employees with no education are
A C o m p a r i s o n o f W a g e L e v e l s a n d W a g e I n e q u a l i t y i n t h e P u b l i c a n d P r i v a t e S e c t o r s , 1 9 9 5 a n d 2 0 0 0
13
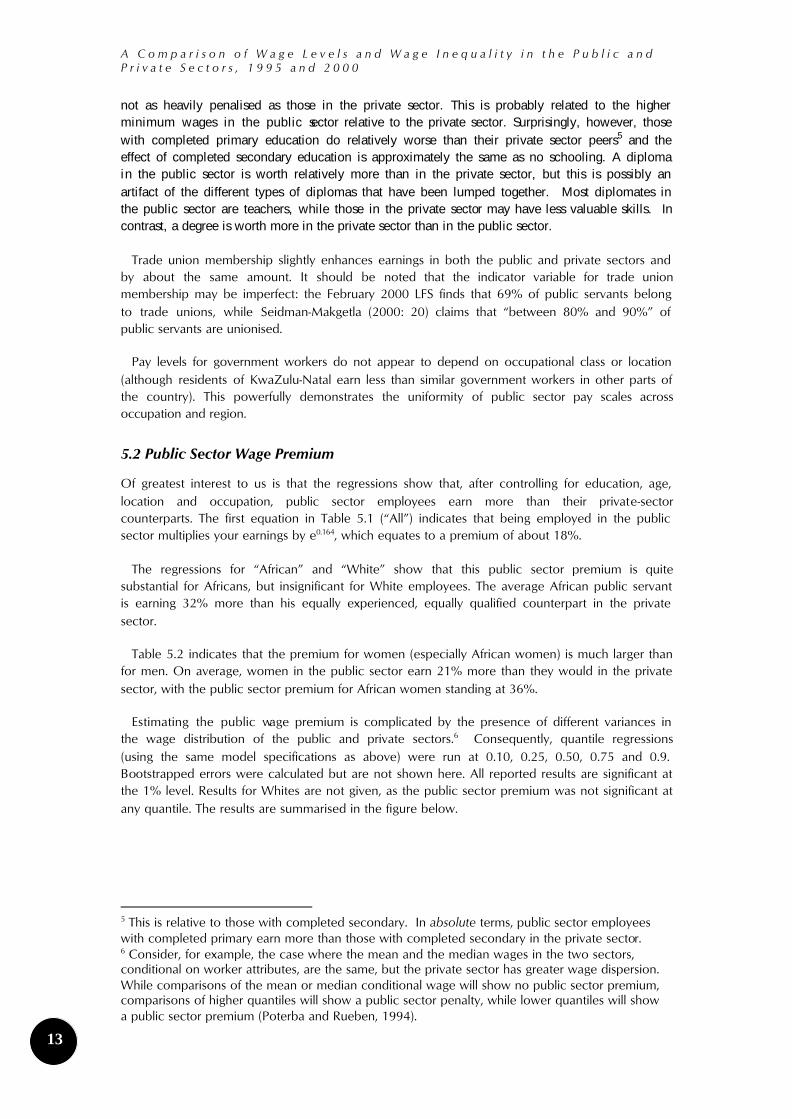
not as heavily penalised as those in the private sector. This is probably related to the higher minimum wages in the public sector relative to the private sector. Surprisingly, however, those with completed primary education do relatively worse than their private sector peers5 and the effect of completed secondary education is approximately the same as no schooling. A diploma in the public sector is worth relatively more than in the private sector, but this is possibly an artifact of the different types of diplomas that have been lumped together. Most diplomates in the public sector are teachers, while those in the private sector may have less valuable skills. In contrast, a degree is worth more in the private sector than in the public sector.
Trade union membership slightly enhances earnings in both the public and private sectors and by about the same amount. It should be noted that the indicator variable for trade union membership may be imperfect: the February 2000 LFS finds that 69% of public servants belong to trade unions, while Seidman-Makgetla (2000: 20) claims that “between 80% and 90%” of public servants are unionised.
Pay levels for government workers do not appear to depend on occupational class or location (although residents of KwaZulu-Natal earn less than similar government workers in other parts of the country). This powerfully demonstrates the uniformity of public sector pay scales across occupation and region.
5.2 Public Sector Wage Premium
Of greatest interest to us is that the regressions show that, after controlling for education, age, location and occupation, public sector employees earn more than their private-sector counterparts. The first equation in Table 5.1 (“All”) indicates that being employed in the public sector multiplies your earnings by e0.164, which equates to a premium of about 18%.
The regressions for “African” and “White” show that this public sector premium is quite substantial for Africans, but insignificant for White employees. The average African public servant is earning 32% more than his equally experienced, equally qualified counterpart in the private sector.
Table 5.2 indicates that the premium for women (especially African women) is much larger than for men. On average, women in the public sector earn 21% more than they would in the private sector, with the public sector premium for African women standing at 36%.
Estimating the public wage premium is complicated by the presence of different variances in the wage distribution of the public and private sectors.6 Consequently, quantile regressions (using the same model specifications as above) were run at 0.10, 0.25, 0.50, 0.75 and 0.9. Bootstrapped errors were calculated but are not shown here. All reported results are significant at the 1% level. Results for Whites are not given, as the public sector premium was not significant at any quantile. The results are summarised in the figure below.
5 This is relative to those with completed secondary. In absolute terms, public sector employees with completed primary earn more than those with completed secondary in the private sector. 6 Consider, for example, the case where the mean and the median wages in the two sectors, conditional on worker attributes, are the same, but the private sector has greater wage dispersion. While comparisons of the mean or median conditional wage will show no public sector premium, comparisons of higher quantiles will show a public sector penalty, while lower quantiles will show a public sector premium (Poterba and Rueben, 1994).

D P R U W o r k i n g P a p e r 0 2 / 6 2 I n g r i d W o o l a r d
14
Quantile estimates of the public sector wage premium
0
0.05
0.1
0.15
0.2
0.25
0.3
0.35
0.4
0.45
0.5
All 0.132 0.224 0.254 0.232 0.189
African 0.314 0.338 0.373 0.366 0.281
Male 0.099 0.195 0.212 0.203 0.148
Female 0.059 0.181 0.279 0.294 0.275
African male 0.24 0.345 0.369 0.275 0.255
African female 0.398 0.294 0.395 0.432 0.387
Quantile=0.1 Quantile=0.25 Quantile=0.5 Quantile=0.75 Quantile=0.9
The quantile regression results suggest that the size of the public sector premium is sensitive to the choice of quantile. The premium is largest in the middle of the distribution for all groups other than African females. The median regression (for “all”) finds a public sector premium, which is about 10% higher than the OLS estimate.
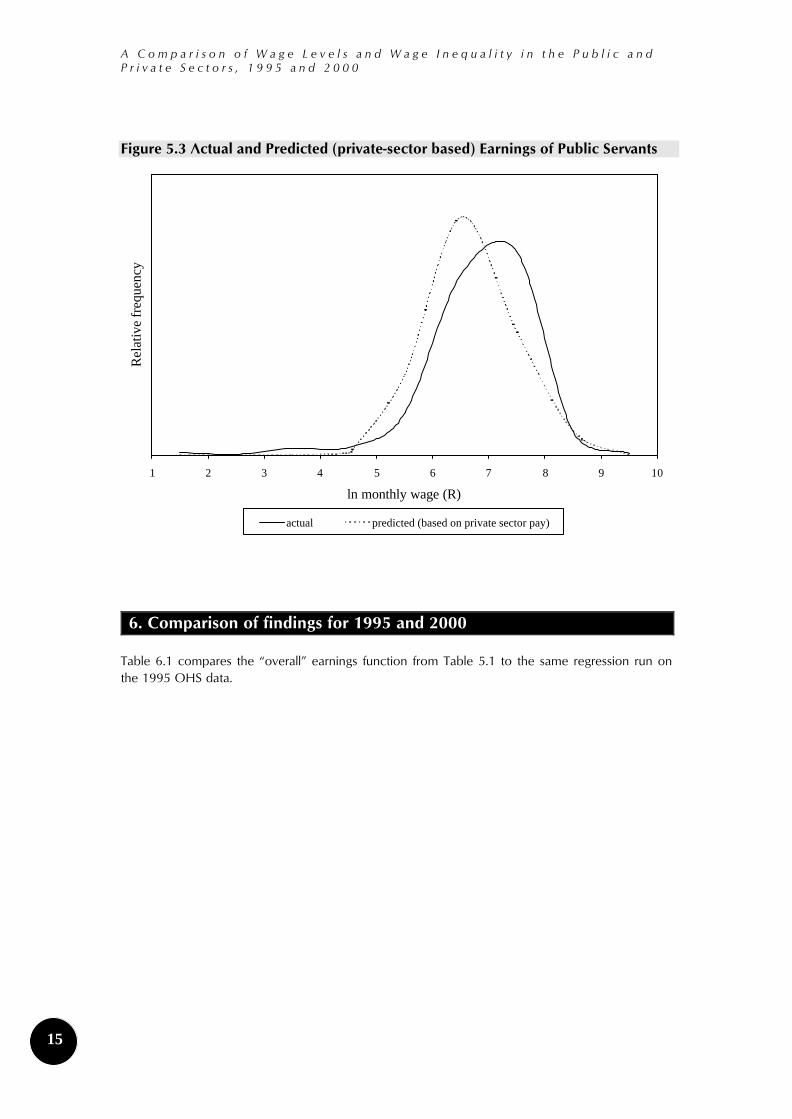
Another way of depicting the existence of a public sector premium is to compare the actual public sector earnings distribution with the distribution of predicted earnings for the same group of people, but based on the private-sector regression. In other words, we are comparing actual earnings with what people would have earned had they been employed in the private sector. The graph is simply a graphical device for showing what we already know: predicted earnings are left-shifted relative to actual earnings indicating the existence of a wage premium in the public sector.
A C o m p a r i s o n o f W a g e L e v e l s a n d W a g e I n e q u a l i t y i n t h e P u b l i c a n d P r i v a t e S e c t o r s , 1 9 9 5 a n d 2 0 0 0
15
Figure 5.3 Actual and Predicted (private-sector based) Earnings of Public Servants
1 2 3 4 5 6 7 8 9 10
ln monthly wage (R)
Rel
ativ
e fr
eque
ncy
actual predicted (based on private sector pay)
6. Comparison of findings for 1995 and 2000
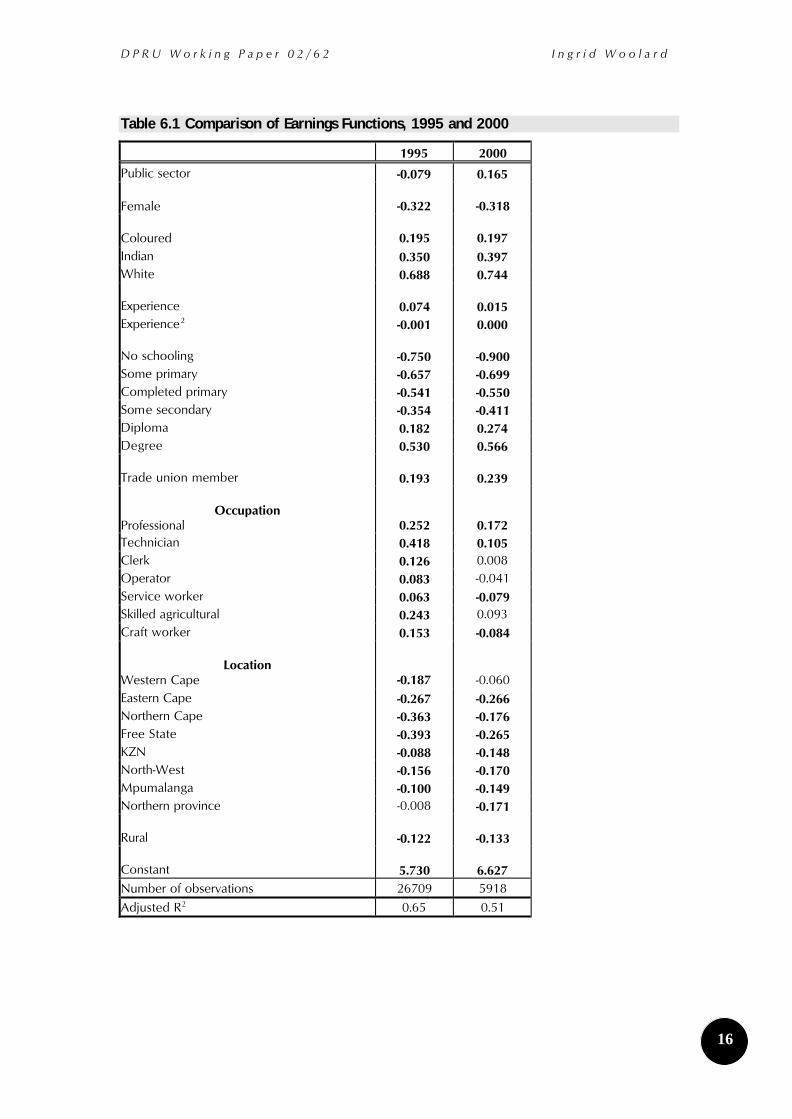
Table 6.1 compares the “overall” earnings function from Table 5.1 to the same regression run on the 1995 OHS data.
D P R U W o r k i n g P a p e r 0 2 / 6 2 I n g r i d W o o l a r d
16
Table 6.1 Comparison of Earnings Functions, 1995 and 2000
1995 2000
Public sector -0.079 0.165 Female -0.322 -0.318 Coloured 0.195 0.197 Indian 0.350 0.397 White 0.688 0.744 Experience 0.074 0.015 Experience2 -0.001 0.000 No schooling -0.750 -0.900 Some primary -0.657 -0.699 Completed primary -0.541 -0.550 Some secondary -0.354 -0.411 Diploma 0.182 0.274 Degree 0.530 0.566 Trade union member 0.193 0.239
Occupation Professional 0.252 0.172 Technician 0.418 0.105 Clerk 0.126 0.008 Operator 0.083 -0.041 Service worker 0.063 -0.079 Skilled agricultural 0.243 0.093 Craft worker 0.153 -0.084
Location Western Cape -0.187 -0.060 Eastern Cape -0.267 -0.266 Northern Cape -0.363 -0.176 Free State -0.393 -0.265 KZN -0.088 -0.148 North-West -0.156 -0.170 Mpumalanga -0.100 -0.149 Northern province -0.008 -0.171 Rural -0.122 -0.133 Constant 5.730 6.627 Number of observations 26709 5918 Adjusted R2 0.65 0.51

A C o m p a r i s o n o f W a g e L e v e l s a n d W a g e I n e q u a l i t y i n t h e P u b l i c a n d P r i v a t e S e c t o r s , 1 9 9 5 a n d 2 0 0 0
17
Table 6.1 shows the identically specified earnings function on 1995 OHS and 2000 LFS data. The 1995 data has been inflated to 2000 price levels using the overall Consumer Price Index for the period. The OHS 1995 regression results for all the groups reported in Tables 5.1 and 5.2 can be found in Appendix A2.
As discussed in Section 2, the two data-sets are not entirely comparable as the 1995 survey collected net wages while the 2000 data recorded gross earnings. Consequently, it is unsurprising that the constant for the 2000 regression is quite a bit higher than that for 1995.
The 1995 regression shows that there was a small wage penalty to working in the public sector while in 2000 there was an advantage. This is hard to explain. It is possible that this is partly the result of an imperfect proxy for public and private sector employment in the 1995 data. As such, it would be a mistake to make too much of this result. There has, however, been considerable restructuring in the public sector since the transition to democratic rule. The South African government has actively sought to make public sector employment more attractive and to pay employees salaries, which are market-related. This realignment could conceivably have made sufficient impact to swing the coefficient on the public sector dummy variable from negative to positive.
7. Wage dispersion
Table 7.1 employs the Gini coefficient as a measure of wage dispersion and compares it for the private and public sectors.
Table 7.1 Gini Coefficients, Public and Private Wages, 1995 and 2000
1995 2000 Private Public All Private Public All Gini coefficient of wages 0.51 0.34 0.49 0.57 0.41 0.54
Source: author’s calculations using OHS 1995 and LFS February 2000, Statistics South Africa
These results should be interpreted with caution: the values for the two years are not comparable, because the 1995 data is for net wages, while the 2000 data is for gross wages. It is to be expected that the progressive nature of the South African personal income tax system “compresses” the wage distribution, and thus inequality of net wages should always be less than inequality of gross wages.
Results for both years are shown simply to demonstrate that both surveys found that wage inequality in the public sector is much lower than in the private sector. (The two surveys also suggest a very similar picture in terms of the size of the difference between the private and public sector Gini coefficients.) The divergence in measured wage dispersion is considerable, with a Gini coefficient in the private sector of 0.57 (0.51) compared with only 0.41 (0.34) in the public sector in 2000 (1995).
Table 6 shows the distribution of wages in the private and public sectors. (Again, the caveats about the data raised in Section 2 should be borne in mind.) It is immediately evident that the lower wage dispersion in the public sector is the result of public sector wages having a much higher “floor” and a slightly lower “ceiling”. The ratio of wages at the 90th percentile to wages at the 10th percentile is 15 in the public sector, but only 7 in the public sector.

D P R U W o r k i n g P a p e r 0 2 / 6 2 I n g r i d W o o l a r d
18
Table 6 Distribution of Wages in the Public and Private Sectors, 2000
Private Public All Wage at the 10th percentile Wage at the 25th percentile Median wage Wage at the 75th percentile Wage at the 90th percentile Wage at the 95th percentile
400 775 1500 3000 6000 9500
1000 1800 3000 5000 7000 9000
450 900 1900 3800 6500 9500
Source: author’s calculations using LFS February 2000, Statistics South Africa
8. Conclusion
The South African Government is a major employer in South Africa. In recent years it has strived to restructure the public service in the interests of enhancing both equity and efficiency. This has seen the realignment of pay scales and a concerted effort to attract quality staff. While the size of the public service has been trimmed, the number of managers has increased and overall wages have been rising.
This paper has demonstrated that average wages in the public sector are much higher than in the private sector, but this is the result of more than one factor. Firstly, there is considerable human capital in the public service. Teachers alone, account for more than 15% of all South Africans with a tertiary degree (Seidman-Makgeta, 2000: 20). Therefore, part of the higher salaries is accounted for simply by the fact that the State employs people who, because of their individual attributes, would ordinarily earn more than average.
Secondly, this paper aims to demonstrate that a small wage premium exists to working in the public sector. On average, public servants earn 18% more than they would in the private sector. The State is intent on being a model employer and sets national norms and standards for the employment relationship. As such, working conditions in the public sector are often considerably better than in the private sector. Hand-in-hand with this goes the commitment to pay a living wage. As a result, the lowest paid government employees are earning considerably more than many of their private-sector counterparts.
This paper has also demonstrated that public sector wages are far less dispersed than private sector wages, largely as a result of much higher wages at the lower end of the salary scales.

A C o m p a r i s o n o f W a g e L e v e l s a n d W a g e I n e q u a l i t y i n t h e P u b l i c a n d P r i v a t e S e c t o r s , 1 9 9 5 a n d 2 0 0 0
19
References
Bhorat, H. 2001. “Labour market challenges in the post-Apartheid South Africa: A country profile”. Processed. Report to the ILO.
Juhn, C., Murphy, KM and Pierce, B. 1993. “Wage inequality and the rise in returns to skill”. Journal of Political Economy volume 101.
Kiefer, N.M. 1975. Bayesian Estimation of the Earnings Function. Working Paper No. 74, Industrial Relations Section: Princeton University.
Kingdon, G.G. and Knight, J. 2001. Why high open unemployment and small informal sector in South Africa? Centre for the Study of African Economies, Department of Economics: University of Oxford.
Mincer, J. 1974. Schooling, Experience, and Earnings. New York: Columbia University Press for NBER.
Poterba, J. and Rueben, K. 1994. “The distribution of public sector wage premia: new evidence using quantile regression methods”. NBER Working Paper #4734.
Seidman-Makgetla, N. 2000. “A new labour policy for the public service”. Indicator SA, volume 17 no. 4.
Thompson, K. and Woolard, I. 2002. “Achieving employment equity in the public service: a study of changes between 1995 and 2000”. Unpublished mimeograph, University of Port Elizabeth.

Appendix
Table A1 Wage Increases by Notch
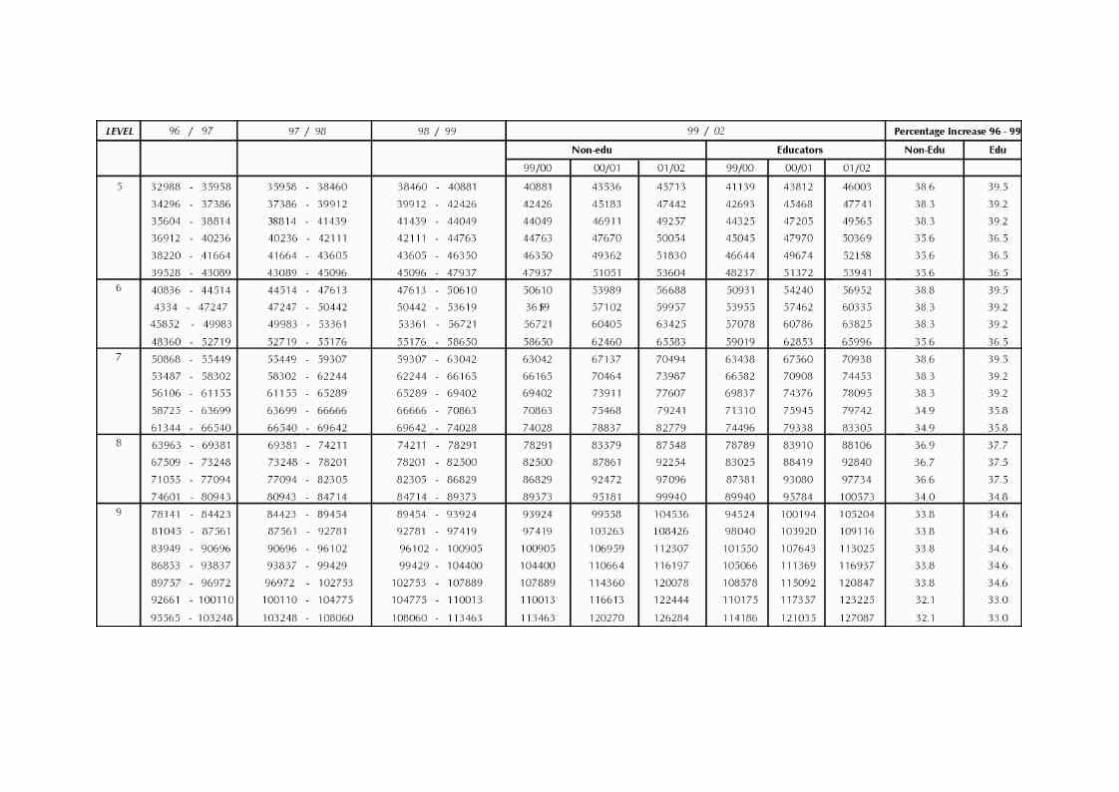
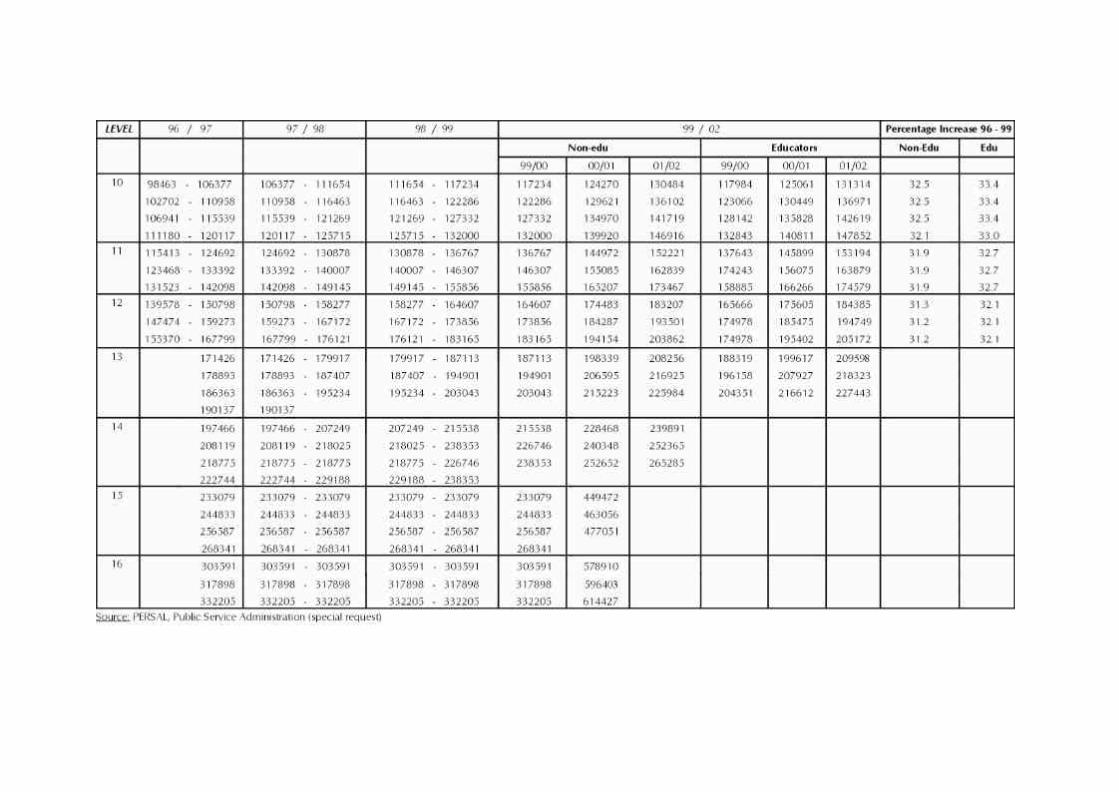

Table A2 OLS Regression of ln (monthly net wages) for Formal Sector Employees, OHS 1995