a comparative study on four oleaginous yeasts on their ... · a comparative study on four...
TRANSCRIPT

The Faculty of Natural Resources and Agricultural Sciences
A comparative study on four oleaginous yeasts on their lipid accumulating capacity
Qier Sha
Department of Microbiology Master´s thesis • 45 hec • Second cycle, A2E Biology • Examensarbete/Sveriges lantbruksuniversitet, Institutionen för mikrobiologi: 2013:7 • ISSN 1101-8151 Uppsala 2013


A comparative study on four oleaginous yeasts on their lipid accumulating capacity
Qier Sha
Supervisor: Johanna Blomqvist, Swedish University of Agricultural Sciences, Department of Microbiology
Examiner: Volkmar Passoth, Swedish University of Agricultural Sciences,
Department of Microbiology
Credits: 45 hec Level: Second cycle, A2E Course title: Independent project in Biology - Master's thesis Course code: EX0596 Programme/education: Biotechnology Place of publication: Uppsala Year of publication: 2013 Title of series: Examensarbete/Sveriges lantbruksuniversitet, Institutionen för mikrobiologi: no: 2013:7 ISSN: 1101-8151 Online publication: http://stud.epsilon.slu.se Key Words: Biodiesel; Yeast; Strains; Glucose; Xylose; Fermentation; Cell dry weight; Lipid content; Lipid yield; Optical density
Sveriges lantbruksuniversitet
Swedish University of Agricultural Sciences
The Faculty of Natural Resources and Agricultural Sciences Uppsala BioCenter Department of Microbiology


Abstract
Under the premise of high energy price with estimated petroleum crisis, biodiesel extracted from plant oil, animal fat and microorganisms is considered as a promising replacement for fossil raw material. However, the increasing price of animal feeding and decreasing tillable land for oil plants have brought great difficulty to achieve biodiesel from feedstock plant oil and animal fat.
In this study, four oleaginous yeasts including Lipomyces lipofer, Lipomyces starkeyi, Rhodotorula glutinis and Yarrowia lipolytica were compared for their lipid accumulating productivity in different carbon sources: glucose, xylose and a mixture of both glucose and xylose. According to the experimental results, Rhodotorula glutinis had the highest lipid yield in both glucose sole carbon source and mixed sugar in shake flask test. Lipomyces starkeyi was able to utilize xylose as sole carbon source to accumulate lipid with highest yield in shake flask test. In comparison with Lipomyces lipofer, Lipomyces starkeyi had higher lipid yield in both shake flask test and fermentation bioreactors. Yarrowia lipolytica could not utilize xylose sole carbon source and its lipid yield was the lowest one when compared to other three oleaginous yeasts. During fermentation in the bioreactor test, lipid content of Lipomyces lipofer showed a maximum, later the lipid content decreased. A similar peak of lipid content was observed in the fermentation test in bioreactor of Lipomyces starkeyi, but after a temporary decrease the lipid content increased again. Lipid content reached its highest amount at early stationary phase and decreased may be due to lipid remobilization.


Table of Contents
1. Introduction................................................................................................................7 1.1 Feedstock for biodiesel...................................................................................7 1.2 Oleaginous yeasts...........................................................................................8 1.3 Fatty acid metabolism.....................................................................................8 1.4 Influencing factors for lipid accumulation.....................................................9
1.4.1 Nitrogen and sulfate limitation...................................................................9 1.4.2 Minerals and other growth factors..............................................................9 1.4.3 Temperature................................................................................................9 1.4.4 pH value....................................................................................................10 1.4.5 Aeration.....................................................................................................10 1.4.6 Culturing time...........................................................................................10
1.5 Study aim......................................................................................................10
2. Material and Methods.............................................................................................11 2.1 Media............................................................................................................11
2.1.1 Pre-culture..............................................................................................11 2.1.2 Main culture...........................................................................................11
2.2 Yeasts used in the study.................................................................................11 2.3 Growth curve determination.........................................................................11 2.4 Inoculums preparation..................................................................................11 2.5 Shake flask culturing.....................................................................................12 2.6 Freeze drying................................................................................................12 2.7 Lipid extraction.............................................................................................12 2.8 Dry weight determination.............................................................................12 2.9 Bioreactor test...............................................................................................13 2.10 HPLC analysis..............................................................................................13 2.11 Lipid composition analysis...........................................................................13
3. Results.......................................................................................................................14 3.1 Growth curve determination.........................................................................14 3.2 Shake flask batch test in different sugars.......................................................14
3.2.1 Cell dry weight and lipid weight comparison........................................14 3.2.2 Lipid content and lipid yield comparison..............................................15 3.2.3 Lipid yield comparison in different sugars............................................17
3.3 Fermentation test..........................................................................................19 3.3.1 Optical density, cell weight, lipid content and lipid weight....................19 3.3.2 Lipid content and sugar consumption during fermentation.....................21
3.4 Fatty acid composition analysis....................................................................22 3.4.1 Fatty acid composition from shake flask test........................................22 3.4.2 Fatty acid composition change during fermentation.............................22
3.5 Dry weight determination.............................................................................23

4. Discussion.................................................................................................................24 4.1 Culturing condition was important................................................................24 4.2 Dry weight determination needed other solution..........................................24 4.3 Further study is required...............................................................................25
5. Conclusions and Future perspectives.....................................................................26
6. Acknowledgment......................................................................................................27
7. References.................................................................................................................27
Appendix.......................................................................................................................29

7
1. Introduction
Because the global crude oil reserves are shrinking there is a globally increasing interest in developing substitutable renewable energy materials. Considering energy price and environmental concerns biodiesel had been regarded as one of the most promising potential substitute for traditional energy oil. The advantages of biodiesel is that it does not contain any polycyclic hydrocarbons which can be damaging to a wide variety of substances, so that biodiesel is less corrosive and thus easier to transport and store than conventional petroleum. Due to its ability to mix with petroleum diesel in any ratio and still to function, biodiesel can be considered as clean and renewable first alternative solution of oily energy resource (Sheedlo, 2008). It has great features for example, higher energy density, lower S content than conventional petroleum with sufficient burning ability and lubricating property. It also has the characteristic that it is easily biodegradable, safe to transport and hardly to explode (Tyson et al., 1998).
1.1 Feedstock for biodiesel
A variety of feedstock can be used to produce biodiesel. The most commonly used vegetable feedstock includes rapeseed and soybeans. The first amount of oil extracted from feedstock which was called virgin oil also could be obtained from other crops such as mustard, sunflower and coconut (Antolin et al., 2002). Animal fats were also good choice for feedstock, which included tallow, lard and chicken fat etc (Lang et al., 2001).
Recently, microorganisms have been studied for their potential to be used for producing biodiesel with similar composition as oil from plants and animal fats. Microorganisms available for biodiesel production included bacteria, algae, filamentous fungi and yeasts. Some waste material such as sewage can be used as substrate for growing algae to produce biodiesel (Yusuf et al., 2007). In the oleaginous fungus Mucor circinelloides lipid content up to 30 % was found when cultured in high carbon: nitrogen ratio and high temperature condition. The advantages of fungi fermentation was that very easy to harvest because of the formation of cell pellets (Xia et al., 2011).
Nowadays, efficient generation of lipids could be obtained from cheap and abundant material such as lignocellulosic materials. This kind of feedstock could be from agricultural residues such as corn stover, wood residues such as sawdust or paper mill residues, and energy crops such as willow and poplar. Lignocellulosic materials are composed of carbohydrate polymers (cellulose and hemicellulose), and lignin. The cellulose and hemicelluloses typically comprise up to two thirds of the lignocellulosic materials. Hemicelluloses consist of pentose (typically xylose) and hexose (typically glucose). Depending on the process and conditions used during pre-treatment, hemicelluloses can be hydrolyzed into monomeric and oligomeric forms which are the main substrates for biodiesel production and directly influence the lipid yield potential (Girio et al., 2010). Some research reports have been published that are describing oleaginous yeasts converting lignocellulosic materials to biodiesel which has potential

8
developing prospect. Biodiesel production produced by various microorganisms is now called Single cell oils (Ratledge et al., 2008).
1.2 Oleaginous yeasts
Some oleaginous yeasts have been reported to accumulate lipids up to almost 70 % of their cell dry weight when cultured under nitrogen limited condition. These yeasts belong to genera like Rhodosporidium, Rhodotorula, Yarrowia, Candida, Cryptococcus, Trichosporon and Lipomyces (Ageitos et al., 2011). Lipids synthesized by oleaginous yeasts mainly contained stearic (18:0), oleic (18:1) and linoleic (18:2) acids together with palmitic acid (16:0), which was almost similar to the oily product from plants, which means that yeast lipids could be used for the same purpose as biodiesel from plants (Xin et al., 2009).
Table 1: Common fatty acids of yeast accumulating lipids were summarized in Table 1 (Lin et al.,
2011).
Fatty acid Chemical structure
Palmitic (16:0) CH3(CH2)14COOH
Stearic (18:0) CH3(CH2)16COOH
Oleic (18:1)(n-9) CH3(CH2)7CH=CH(CH2)7COOH
Linoleic (18:2)(n-6) CH3(CH2)4CH=CHCH2CH=CH(CH2)7COOH
Linolenic (18:3)(n-3) CH3CH2CH=CHCH2CH=CHCH2CH=CH(CH2)7COOH
1.3 Fatty acid metabolism
Mainly, under nitrogen-limited condition, the first step of lipid accumulation is an increase in glucose catabolism through pentose phosphate pathway from glycolysis to pyruvate which is the basic substrate for fatty acid synthesis in both cytosol and mitochondria.
Nitrogen limitation in the culture directly results in decreasing of the concentration of AMP: adenosine monophosphate because of de-amination of adenosine to inosine by AMP deaminase. Isocitrate dehydrogenase is an enzyme of the citrate cycle (TCC) which is highly dependent on AMP. Thus decreasing concentration of AMP leads to increasing of the concentration of isocitrate which is then converted to citrate (Ageitos et al., 2011). Citrate is transported out of the mitochondria and in the cytoplasm converted to Acetyl-CoA and oxaloacetate, by the ATP: citrate lyase (ACL). In the transhydrogenase cycle pyruvate is carboxylated to oxaloacetate, which is then converted to malate (NADH-dependent). Malic enzyme converts malate to pyruvate, generating NADPH and releasing CO2. NADPH is very important for fatty acid synthesis, because each step of the carbon chain elongation needs two molecules of NADPH (Beopoulos et al., 2011). Acetyl-CoA is the initial biosynthetic unit for fatty acid synthesis which is converted to acyl-CoA. Glycerol 3 phosphate (G3P) as the acyl acceptor which is followed by Kennedy pathway by using two acyltransferases to form lysophospatidic acid (LPA), and phosphatidic acid (PA) step by step. Then PA is

9
dephosphorylated to release diacylglycerol (DAG). Finally DAG is acylated to produce triacylglycerol (TAG).The final step in biodiesel production is the chemical conversion of these neutral lipids into fatty acid short-chain alcohol esters (Kosa et al., 2010).
1.4 Influencing factors for lipid accumulation
1.4.1 Nitrogen and sulfate limitation
Lipid accumulation in oleaginous yeasts occurs at a surplus of carbon source with one limiting element usually nitrogen limitation (Wu et al., 2011). Common nitrogen source for yeast accumulating lipids can be yeast extract, peptone, and ammonium sulfate. It has been reported that using yeast extract containing broth as a nitrogen source is the most common way to culture yeasts and this can contribute to produce high amount of cell biomass and lipid content for example around 24 % of lipid in Rhodotorula glutinis and 22 % of it in Lipomyces starkeyi (Kumar et al., 2010).
Sulfate limitation in the medium is another influencing factor which can affect the biosynthesis of some special amino acids and cellular cofactors such as cysteine, biotin, thiamine and iron-sulfur clusters. Limitation for synthesis of these cellular assemblies could influence cell growth greatly and induce lipid accumulation. (Scott et al., 2007) It has been reported that sulfate limitation can directly influence fatty acid composition of the total lipid. Main fatty acids component- cocoa butter equivalent content was increased from 47 % to 63 % when Rhodosporidium toruloides was cultured under sulfate limitation (Wu et al., 2011).
1.4.2 Minerals and other growth factors
Mineral elements such as Magnesium, Potassium, and Calcium etc. are normally essential for yeast growth or lipid accumulation at lower concentration (Spencer et al., 1997). Other compounds also affect lipid accumulation in the yeast cells for instance inositol, pantothenic acid and biotin omission results in a decrease of the total lipid amount (Rattray et al., 1975). It has been recorded that Vitamin B6 absence of medium leaded to decreasing of total lipids level with dramatically reduction on Palmitoleic acid by Hanseniaspora valbyensis (Betty et al., 1965).
1.4.3 Temperature
Optimal temperature for high growth rate for each yeast strain is different but generally around 25 ºC. Too high or too low temperature affects the cell growth and lilpid accumulation. During yeast cells lipid accumulation, dropping temperature from optimal growth generally results in increasing of the lipid content and influence lipid composition. Usually, melting point of unsaturated fatty acids is lower than saturated fatty acids and for short chain fatty acids lower than long chain fatty acids. Thus, temperature decreasing results in increasing level of unsaturated and short chain fatty acids, for example increasing ratio of linoleic acid to oleic acid (Rattray et al., 1975).

10
1.4.4 pH value
The optimal growth pH value for each yeast strain is different and varies from pH 3.0 to pH 7.0 (Rattray et al., 1975). However, it has been shown that the pH optimal for lipid accumulation is generally lower than that for optimal growth. For example, when using sewage sludge to accumulate lipids by Lipomyces starkeyi, highest lipid content was observed at pH 5.0 while the highest growth was at pH 6.5 (Angerbauer et al., 2008). Another case is that highest lipid content occurred at pH 3.2 in Trichoderma reesei in glucose substrate while the highest growth was calculated at pH 4.0 (Brown et al., 1990).
1.4.5 Aeration
Aeration is a very important factor for yeast cell growth as well as total lipid level. Dissolved oxygen amount in the culture could highly influence fatty acids composition in lipids. Under oxygen limited conditions, the glyceride fraction varies highly and the amounts of phospholipids and sterol decrease. These variations directly result in increasing amounts of saturated fatty acids, which become the main component of lipids. In an aerated culture, cellular viability increased and free fatty acids were oxidized to unsaturated fatty acids since yeast cells need unsaturated fatty acids for continued growth. For example after input of plenty of oxygen to a culture contents of linolenic acid was highest in Candida utilis (Babij et al., 1969) and palmitoleic acid was highest in Saccharomyces cerevisiae (Valero et al., 2001).
1.4.6 Culturing time
Previous studies have shown that lipid accumulation in the yeast cell dramatically increased in the logarithmic growth period because lipids are used for membrane lipid synthesis to support cellular growth in size first. When cells reach their maximum size they turn to accumulate lipids as an oil bubble inside the cell. Cell lipids content reached highest value at stationary phase and upon nutrient depletion fatty acid accumulation rate decreased gradually until cells exit starvation, accumulated lipids will degraded to free fatty acid rapidly. Based on upon, harvesting cell time is better at early stationary phase and prevents lipids degradation (Beopoulos et al., 2008).
1.5 Study aim
Several oleaginous yeasts have been reported which could accumulate lipids under nitrogen limited condition. In this study, lipids accumulation potential of several oleaginous yeasts from glucose and xylose, and indentifying the influence of cultivation factors like temperature on lipid accumulation was tested in lab work. Quantitative work of cell dry weight determination was made as well.

11
2. Material and methods
2.1 Media
2.1.1 Pre-culture
YM medium was used as pre-culture to cultivate yeast cells. It contained glucose as carbon source 10 g/l, yeast extract 3 g/l, malt extract 3 g/l and peptone 5 g/l. To obtain solid medium, 16 g/l agar was added. High temperature moist heat sterilization method was used for medium sterilization, 120 ºC temperature for 20 minutes.
2.1.2 Main culture
Semi-synthetic medium was prepared to grow oleaginous yeasts. Glucose, xylose or a mixture of both were used as carbon sources with concentration 70 g/l, nitrogen sources (yeast extract 0.75 g/l and NH4Cl 0.1 g/l), MgCl2×6H2O 1 g/l, Na2SO4 0.1 g/l, and phosphate buffer (KH2PO4 11.8 g/l and K2HPO4×3H2O 3.7 g/l or K2HPO4 2.8 g/l). Mineral-element solution was a of: CaCl2×2H2O 40 mg/l, FeSO4×7H2O 5.5 mg/l, citric acid×H2O 5.2 mg/l, ZnSO4×7H2O 1.0 mg/l, MnSO4×H2O 0.76 mg/l and 18 mol/l of H2SO4 diluted by 1.84×10⁻³ mg/l. Medium pH was measured as 5.8 by pH meter (based on high buffering properties of the medium itself, it is possibly no chance to adjust its pH value without influencing liquid volume) (Hu et al. 2011).
2.2 Yeasts used in the study
Lipomyces lipofer CBS 5842 and Lipomyces starkeyi CBS 1807 were ordered from CBS. Rhodotorula glutinis J195, Yarrowia lipolytica J134 were from obtained from the strain collection of the Department of Microbiology.
All yeasts were grown on solid YM medium and incubated in 25 °C room. When yeast colonies became visible, then culture plates were stored in 2 °C until use.
2.3 Growth curve determination
All yeasts were cultured in YM medium and optical density (OD) was measured every 2 hours in an Ultrospec 1100 Pro, Biochrom (Agilent, Germany) spectrophotometer at wave length 600 nm. Clear YM medium was used as blank for the OD measurement. For getting appropriate OD values which was between 0.1-0.5 for accurate readings, the cell suspensions were diluted 10, 20 or 100 times if required. Yeasts were inoculated in two batches of pre-cultures, cultivated at different temperatures (25 and 30 ºC and samples were taken at different time points from the two cultures in order to get complementary data to complete the growth curve and identifying the impact of the growth temperature.
2.4 Inoculums preparation
Cultures of yeasts were inoculated in liquid YM medium and incubated at 25 °C before inoculation. Measuring OD of the culture and calculating the amount of cell suspension

12
needed in main culture to reach its OD to 1 were the next steps. An appropriate volume of cells was calculated and centrifuged at 8000 g for 5 min and washed with normal saline (9 g/L NaCl) once and centrifuged again. The pellets were re-suspended in 1 ml normal saline and used as inoculums.
2.5 Shake flask culturing
All four oleaginous yeasts studied during the project were inoculated in three different carbon source conditions (each experiment was performed in triplicates). 100 ml semi-synthetic medium was prepared in 500ml shake flasks. Inoculation cultures were shaking at 220 rpm and 25 °C. Every 3 - 4 hours the OD values of the cultures were measured. At the same time, 1 ml sample was taken from each flask, and centrifuged at 13000 g for 3 min. The supernatant was filter sterilized through a 0.2 μm filter to remove remaining particles. Samples were stored in 2 ml centrifuge tubes at -20 °C until analyzed by HPLC.
2.6 Freeze drying
50 ml of yeast cells were harvested at the stationary phase. Collected samples were centrifuged at 4000 g 10 min and washed with sterile water once, then centrifuged again. The pellets were transferred into pre-weighed vials and kept at -50 °C until freeze drying. After 50 hours freeze drying, the vials were weighed again and the cell dry weight was determined. All determinations were performed in triplicates.
2.7 Lipid extraction
Lipid extraction was performed using the chloroform- methanol method (Folch et al., 1957). Freeze-dried pellets were dissolved in 4 M HCl 3.2 ml and incubated at 55 °C for two hours. Then 8 ml of chloroform: methanol mixture (1:1 as molarity) was added, transferred into glass tubes and shaken at 20 °C for three hours. Then samples were centrifuged at 2000 g for 15 min to obtain a clear chloroform phase (lower phase). The lower phase was carefully transferred into new tubes by using rubber head dropper. Then 4 ml chloroform was added into the chloroform phase and shaken vigorously. The new tubes were centrifuged once more. Clear chloroform was obtained and transferred into pre-weighted glass tubes. Then tubes were gassed with N2 two hours to evaporate all chloroform. Glass tubes were weighed after evaporation to calculate lipids weight.
2.8 Dry weight determination
0.45 µm membrane filters were dried in a microwave at 350 W for 4 minutes and placed in an exsiccator to cool down. These filters were weighed in electronic balance and filters’ weights were noted. At each time point of the growth curve three samples of 2 ml cell suspension were taken. This 2 ml cell suspension was carefully filtrated and washed with 6 ml distilled water. Afterwards, the filters were dried in the microwave oven at 350 W for 8 minutes. As in the previous step, filters were placed in exsiccator to cool down. After that filters weights were determined in electronic balance again. Pure
13
cells weight then could be calculated by filter with cells weight subtract with filter weight. Then dry cell weight per liter was calculated and plotted against OD to obtain a calibration curve for the dry weight determination.
2.9 Bioreactor test
In order to further determine the lipid yield per cell weight, two yeasts Lipomyces lipofer CBS 5842 and Lipomyces starkeyi CBS 1807 were cultured in 14-cm diameter stirred two liters of scale fermentation bioreactors. Two bioreactors ran at the same time for culturing one yeast strain. They were equipped with automatic controls for the environmental conditions of temperature, pH, and stirrer speed. Fermentations were run at 25 ℃ and pH 5.0. Stirring started at 500 rpm and the culture medium was aerated with 0.5 l/min air while dissolved oxygen (DO) probe was using to monitor the dissolved oxygen tension to keep it at 30 %.
950 ml of semi synthetic medium with glucose as carbon source was filled in the bioreactors. 100 ml of cell suspension was collected from pre-culture, centrifuged 8000 g by 4 min to get cell pellets and suspended with NaCl solution to 50 ml as inoculation. Sterilization of the fermentors and associated pipework was carried out in situ using steam heat sterilization.
When high culture density fermentation started, OD measurement and 50 ml cell samples for freeze-dry and lipid extraction was proceed at regular intervals.
2.10 HPLC analysis
Standard solution was prepared to contain glucose: xylose: ethanol: acetate: glycerol in concentration of 30, 15, 10, 5, 1 and 0.1 g/l. All components were weighed up in the highest concentration in 100 ml deionized water and diluted into the lower concentrations. Samples (2 ml) were taken at each time point (see Results) and centrifuged at 8000 g for 4 minutes. Then cell suspensions were filtrated through 2 µm filters. 600 µl cell suspensions were pipetted into marked HPLC tubes
2.11 Lipid composition analysis
Fatty acid composition was analyzed at the Department of Food Science, SLU Uppsala. The following analytical procedure was performed by the staff of the Department of Food Science: 2 ml dry methanol with 0.01 M sodium hydroxide (NaOH) was added to the samples, which were subsequently incubated in a heating block at 60 ºC for 10 min. Then 3 ml of boron trifluoride (BF3) was added into the samples, which were then again incubated at 60 ºC for 10 min. After that samples were placed in ice-cold water bath to cool down. Then 2 ml sodium chloride solution (200 g/l NaCl) and 2 ml of hexane was added into the tubes and shaken vigorously.
The hexane phase was collected in another tube and analyzed with gas chromatography CP 3800 (Varian AB, Stockholm, Sweden) equipped with flame ionizations detector (FID) and split injector and fitted with a fused silica capillary column BPX 70 (SGE, Austin, Tex.), length 50 m id. 0.22 mm, film thickness was
14
0.25 µm. C17:1 (larodan, 21-1715-7) was used as internal standard. The column temperature was programmed to start at 158 ºC for 5 min and then increased by 2 ºC/ min up to 220 ºC where it remained for 8 min. Helium was pumped with 0.8 ml/ min as carrier gas and nitrogen as the make-up gas. The injector temperature was 230 ºC and detector temperature 250 ºC, respectively. The peaks were identified by comparing their retention times with those of the standard mixture GLC-68 A (Nu-check Prep, Elysian, USA). Peak areas were integrated using Star chromatography workstation software version 5.5 (Varian AB, Stockholm, Sweden) (Appelqvi.La 1968).
3. Results
3.1 Growth curve determination
Candidate yeasts were cultured in 250 ml shake flasks with pre-culture medium and cultivated in two different temperature rooms at 25 ℃ and 30 ℃. Optical density was measured with a spectrophotometer at wave length 600 nm every 2 hours. Appropriate OD readings were used for drawing a growth curve to identify which time point is suitable for harvesting the yeast culture. According to the test results the best harvesting times were determined to be around 42 hours for Yarrowia lipolytica, 44 hours for Rhodotorula glutinis and 75 hours for Lipomyces lipofer and Lipomyces starkeyi. All yeasts were decided to grow on shaking bed with 120 rpm at 25 ℃.
3.2 Shake flask batch test in different sugars
3.2.1 Cell dry weight and lipid weight comparison
All yeasts were cultured in three different sugar conditions and harvested at the early stationary growth phase according to measured optical density data. (Figure 4).
Lipomyces lipofer was able to grow on each tested sugar as sole carbon source but prefered glucose which directly influenced the cell biomass. The same amount of mixed sugar did not result in producing the same amount of biomass compared to glucose shake flask batch. However, it is notably that although it produced fewer cells in the mixture batch the corresponding lipid weight was almost the same as which in the glucose shake flask batch. Lipomyces starkeyi was more adaptable than Lipomyces lipofer, sugar type only slightly influenced the produced cell dry weight, and even lipid production amount was almost the same in three tests.
Rhodotorula glutinis was an exceptional case in evaluating lipid production, which produced same amount of cells in glucose and mixture sugar, though the production amount was much less in the xylose only.

15
All tested yeasts could utilize both hexose and pentose except Yarrowia lipolytica, which did not grow in xylose only. However, the result indicated there might be a tendency that the presence of xylose in mixed sugar facilitated producing more biomass and lipids than only in glucose. However, since the observed increase was smaller than the standard deviation the effect may not be significant.
Figure 4: Cell dry weight and corresponding extracted lipid weight comparison in each tested yeast
with different carbon source. Blue bars represent calculated cell dry weight (g) per culture medium
volume. Red bars represent extracted lipid weight (g) per culture medium volume. Error bars
represent the standard deviation of three biological replicates.
3.2.2 Lipid content and lipid yield comparison
Lipid content and yield of the four tested yeasts were shown in Figure 5. None of the tested yeasts preferred xylose for lipid production but in one case xylose might have a subsidiary effect on increasing the lipid yield. Lipomyces starkeyi produced less cell biomass than Lipomyces lipofer in xylose but the corresponding lipid content and lipid yield were higher than in Lipomyces lipofer. In fact, the highest lipid content and lipid yield from Lipomyces starkeyi had been indicated from the result by using xylose only.
Lipid content expression in mixed sugar was as good as in glucose for Rhodotorula glutinis but it was lower in xylose. Rhodotorula glutinis was an exceptional case regarding lipid production, since it was slightly affected by sugar type and it showed the highest lipid content and lipid yield (calculated with the consumed amount of sugar) in all four yeasts.
Yarrowia lipolytica could not utilize xylose for lipid accumulation. The lipid content and lipid yield was the lowest among all candidates.
0
2
4
6
8
10
glucose xylose glucose+xylose
concentration g/l
L.lipofer
cell mass g/l lipid g/l
0
1
2
3
4
5
glucose xylose glucose+xylose
concentration g/l
L.starkeyi
cell mass g/l lipid g/l
0
1
2
3
4
5
glucose xylose glucose+xylose
concentration g/l
R.glutinis
cell mass g/l lipid g/l
0
0,5
1
1,5
2
2,5
3
3,5
glucose xylose glucose+xylose
concentration g/l
Y.lipolytica
cell mass g/l lipid g/l

16
Figure 5: Lipid content and lipid yield comparison between different sugar substrate. Blue bars
represent lipid content (gram lipid weight per gram cell dry weight). Red bars represent lipid yield
(extracted lipid weight per consumed sugar amount). Error bars represent the standard deviation of
three biological replicates. The bars representing R. glutinis in xylose are lacking standard error bars
because of the accidental loss of two samples.
0
0,01
0,02
0,03
0,04
0,05
0
2
4
6
8
10
12
14
glucose xylose glucose+xylose
lipid yield g/g
lipid content %
L. lipofer
lipid content % lipid yield g/g
0
0,02
0,04
0,06
0,08
0,1
0,12
0,14
0
5
10
15
20
25
30
35
glucose xylose glucose+xylose
lipid yield g/g
lipid content %
L. starkeyi
lipid content % lipid yield g/g
0
0,05
0,1
0,15
0
10
20
30
40
50
60
glucose xylose glucose+xylose
lipid yield g/g
lipid content %
R. glutinis
lipid content % lipid yield g/g
0
0,005
0,01
0,015
0,02
0,025
0,03
0
5
10
15
glucose xylose glucose+xylose
lipid yield g/g
lipid content %
Y. lipolytica
lipid content % lipid yield g/g
17
3.2.3 Lipid yield comparison in different sugars
In glucose only shake flask tests, Rhodotorula glutinis had the highest lipid yield compared to the two other tested strains. Its corresponding consumed sugar was lower than 15 g/l. Second one was Lipomyces starkeyi which lipid yield was around 0.06 which was almost half of the yield from Rhodotorula glutinis. Lipomyces lipofer consumed most of the sugar but lipid yield just stayed third place and followed by Yarrowia lipolytica.
In the xylose only shake flask test, Lipomyces starkeyi had a remarkable record on lipid yield and its corresponding consumed sugar even less than Lipomyces lipofer. Rhodotorula glutinis consumed even less sugar but lipid yield was almost half of it from the former one. On the other hand, Lipomyces lipofer still consumed most amount of sugar but had a low lipid yield. Yarrowia lipolytica even could not grow in xylose only medium. In glucose and xylose mixture sugar substrates, consumed glucose amounts were higher than xylose for all four candidates yeasts. Rhodotorula glutinis had the highest lipid yield on mixed sugars and consumed almost as much sugar as Lipomyces starkeyi. However, the lipid yield of Lipomyces starkeyi was only about half of the yield from Rhodotorula glutinis. Lipomyces lipofer was on the third place on lipid yield comparison but notably that in the mixture sugar batch which consumed xylose was less than Lipomyces starkeyi and Rhodotorula glutinis. This result differed from the xylose only test (Figure 5). The lipid yield from Yarrowia lipolytica was still the minimum between four candidates since it could not utilize xylose.

18
Figure 6: Lipid yield comparison and corresponding consumed sugar in different carbon source for
four yeasts. Error bars represent the standard deviation of three biological replicates.
0
10
20
30
40
50
60
0
0,02
0,04
0,06
0,08
0,1
0,12
0,14
0,16
L.lipofer L.starkeyi R.glutinis Y.lipolytica
consumed sugar g/l
lipid yield g/g
glucose
lipid yield consumed sugar
0
5
10
15
20
25
0
0,02
0,04
0,06
0,08
0,1
0,12
0,14
L.lipofer L.starkeyi R.glutinis Y.lipolytica
consumed sugar g/l
lipid yield g/g
xylose
lipid yield consumed sugar
0
5
10
15
20
25
0
0,02
0,04
0,06
0,08
0,1
0,12
L.lipofer L.starkeyi R.glutinis Y.lipolytica
consumed sugar g/l
lipid yield g/g
glucose + xylose
lipid yield consumed glucose consumed xylose

19
3.3 Fermentation test
3.3.1 Optical density, cell weight, lipid content and lipid weight
Lipomyces lipofer and Lipomyces starkeyi were cultured in 2 L-scaled fermentation bioreactor to examine the relationships between optical densities, cell dry weight and extracted lipid weight (Figure 7). 50 ml culture sample was taken every 2 or 3 hours during fermentation from each bioreactor. During fermentation bioreactor No.2 for Lipomyces lipofer had an aeration problem so that two fermentation results showed big difference. For Lipomyces lipofer bioreactor No.1, at time point 97 hour lipid content was decreased slightly but extracted lipid weight was increased since total cell weight was increased and optical density as well. At time point 120 hour the optical density decreased and cell dry weight decreased as well. However, lipid content and corresponding extracted lipids reached a peak at 120 hours, decreased greatly and increased a little bit again. However, cell dry weight was increased from 120 hour until fermentation stopped though optical density was getting another peak and decreased again. Comparing to the results of Lipomyces starkeyi fermentation, a similar peak could be observed at time point 65 hour. All parameters were increased at this time. However, in the next time point 71 hour lipid weight and lipid content were decreased while optical density and cell weight were increased slightly. Then at next time cell weight, lipid weight and lipid content were increased but notably the optical density decreased. Appearance of this kind of lipid content peak and following reduction might be due to lipid remobilization.
Bioreactor No.2 from Lipomyces lipofer had been observed that the set of bioreactor had aeration problem during fermentation. Thus, the trend of cell growth from the graph differed from the graph of bioreactor No.1. An increasing peak of lipid content was not been found but at the end of the fermentation, the lipid content and lipid weight were higher than bioreactor No.1.
On the other hand, Lipomyces lipofer cells could hardly be pelleted by centrifugation, which was possibly due to high oily content.

20
Figure 7: optical density, cell dry weight, lipid weight and corresponding lipid content during
fermentation for yeasts L. lipofer and L. starkeyi were illustrated in the pictures. Error bars in the
third figure represent the standard deviation of two biological replicates. Cell samples were not
taken at the time point 0 of fermentation L. lipofer. Because the bioreactor No. 2 of L. lipofer had
aeration problem during fermentation, the results from two bioreactors show great differences
especially at time point 120 hour.
0
5
10
15
20
25
30
0
0,2
0,4
0,6
0,8
1
1,2
1,4
0 50 100 150 200
optical densidy
cell dry weight g/l
lipid content %
lipid weight g/l
growth time (hour)
L. lipofer fermenter 1
lipid g/l OD cell g/l lipid concent %
0
5
10
15
20
25
30
0
0,2
0,4
0,6
0,8
1
1,2
0 50 100 150 200
optical density
cell dry weight g/l
lipid content %
lipid weight g/l
growth time (hour)
L. lipofer fermenter 2
lipid g/l OD cell g/l lipid concent
0
5
10
15
20
25
30
35
40
45
0
1
2
3
4
5
6
7
0 20 40 60 80 100
optical density
cell dry weight g/l
lipid content %
lipid weight g/l
growth time (hour)
L. starkeyi fermenters
lipid g/l OD cell g/l lipid content %
21
3.3.2 Lipid content and sugar consumption during fermentation
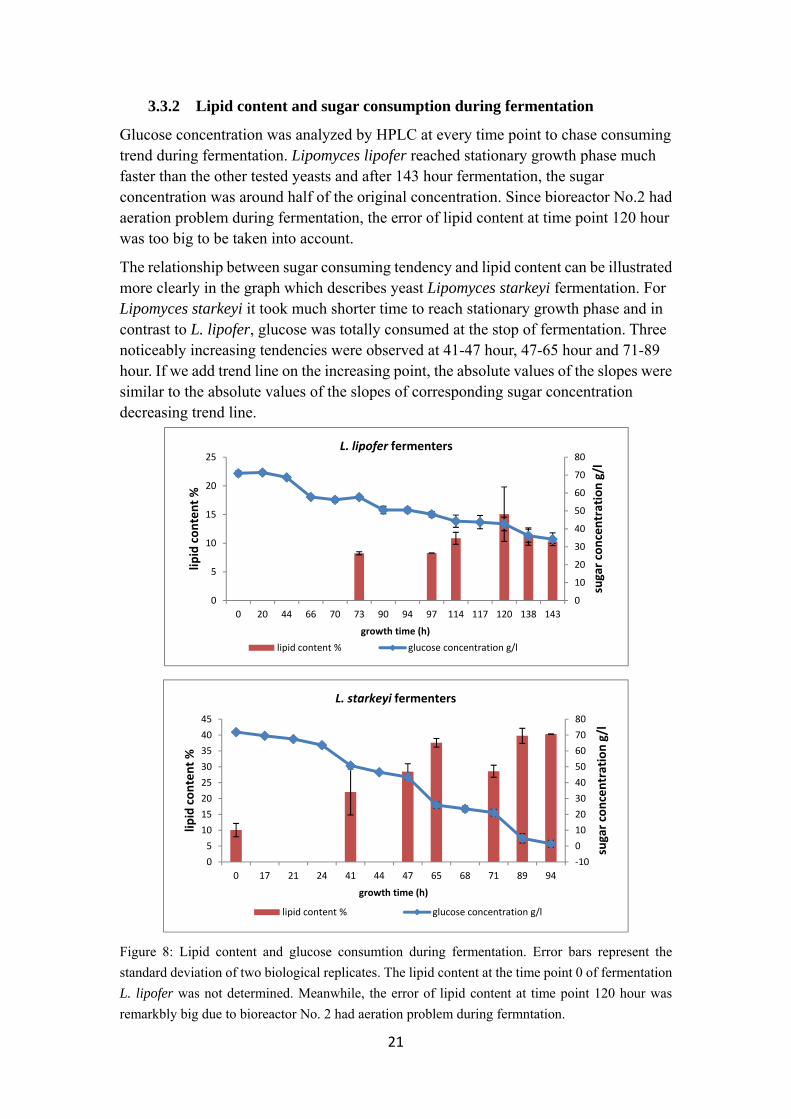
Glucose concentration was analyzed by HPLC at every time point to chase consuming trend during fermentation. Lipomyces lipofer reached stationary growth phase much faster than the other tested yeasts and after 143 hour fermentation, the sugar concentration was around half of the original concentration. Since bioreactor No.2 had aeration problem during fermentation, the error of lipid content at time point 120 hour was too big to be taken into account.
The relationship between sugar consuming tendency and lipid content can be illustrated more clearly in the graph which describes yeast Lipomyces starkeyi fermentation. For Lipomyces starkeyi it took much shorter time to reach stationary growth phase and in contrast to L. lipofer, glucose was totally consumed at the stop of fermentation. Three noticeably increasing tendencies were observed at 41-47 hour, 47-65 hour and 71-89 hour. If we add trend line on the increasing point, the absolute values of the slopes were similar to the absolute values of the slopes of corresponding sugar concentration decreasing trend line.
Figure 8: Lipid content and glucose consumtion during fermentation. Error bars represent the
standard deviation of two biological replicates. The lipid content at the time point 0 of fermentation
L. lipofer was not determined. Meanwhile, the error of lipid content at time point 120 hour was
remarkbly big due to bioreactor No. 2 had aeration problem during fermntation.
0
10
20
30
40
50
60
70
80
0
5
10
15
20
25
0 20 44 66 70 73 90 94 97 114 117 120 138 143
sugar concentration g/l
lipid content %
growth time (h)
L. lipofer fermenters
lipid content % glucose concentration g/l
‐10
0
10
20
30
40
50
60
70
80
0
5
10
15
20
25
30
35
40
45
0 17 21 24 41 44 47 65 68 71 89 94
sugar concentration g/l
lipid content %
growth time (h)
L. starkeyi fermenters
lipid content % glucose concentration g/l
22
3.4 Fatty acid composition analysis
3.4.1 Fatty acid composition from shake flask test
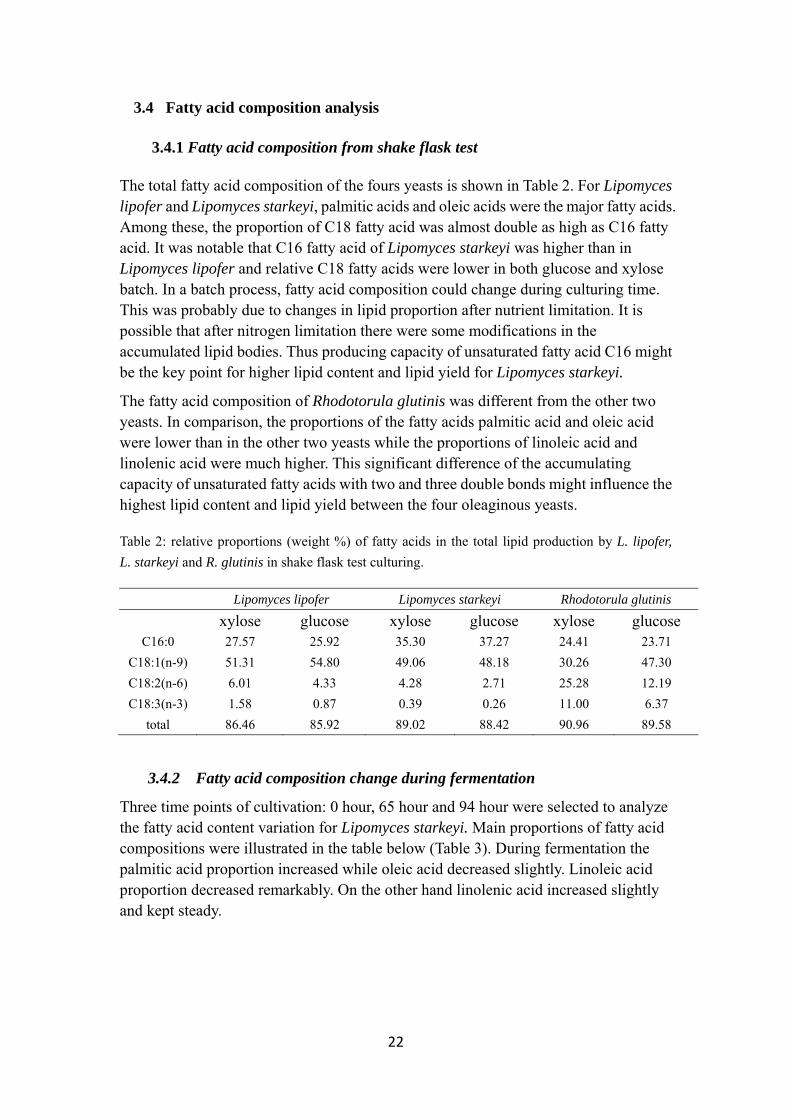
The total fatty acid composition of the fours yeasts is shown in Table 2. For Lipomyces lipofer and Lipomyces starkeyi, palmitic acids and oleic acids were the major fatty acids. Among these, the proportion of C18 fatty acid was almost double as high as C16 fatty acid. It was notable that C16 fatty acid of Lipomyces starkeyi was higher than in Lipomyces lipofer and relative C18 fatty acids were lower in both glucose and xylose batch. In a batch process, fatty acid composition could change during culturing time. This was probably due to changes in lipid proportion after nutrient limitation. It is possible that after nitrogen limitation there were some modifications in the accumulated lipid bodies. Thus producing capacity of unsaturated fatty acid C16 might be the key point for higher lipid content and lipid yield for Lipomyces starkeyi.
The fatty acid composition of Rhodotorula glutinis was different from the other two yeasts. In comparison, the proportions of the fatty acids palmitic acid and oleic acid were lower than in the other two yeasts while the proportions of linoleic acid and linolenic acid were much higher. This significant difference of the accumulating capacity of unsaturated fatty acids with two and three double bonds might influence the highest lipid content and lipid yield between the four oleaginous yeasts.
Table 2: relative proportions (weight %) of fatty acids in the total lipid production by L. lipofer,
L. starkeyi and R. glutinis in shake flask test culturing.
Lipomyces lipofer Lipomyces starkeyi Rhodotorula glutinis
xylose glucose xylose glucose xylose glucose C16:0 27.57 25.92 35.30 37.27 24.41 23.71
C18:1(n-9) 51.31 54.80 49.06 48.18 30.26 47.30
C18:2(n-6) 6.01 4.33 4.28 2.71 25.28 12.19
C18:3(n-3) 1.58 0.87 0.39 0.26 11.00 6.37
total 86.46 85.92 89.02 88.42 90.96 89.58
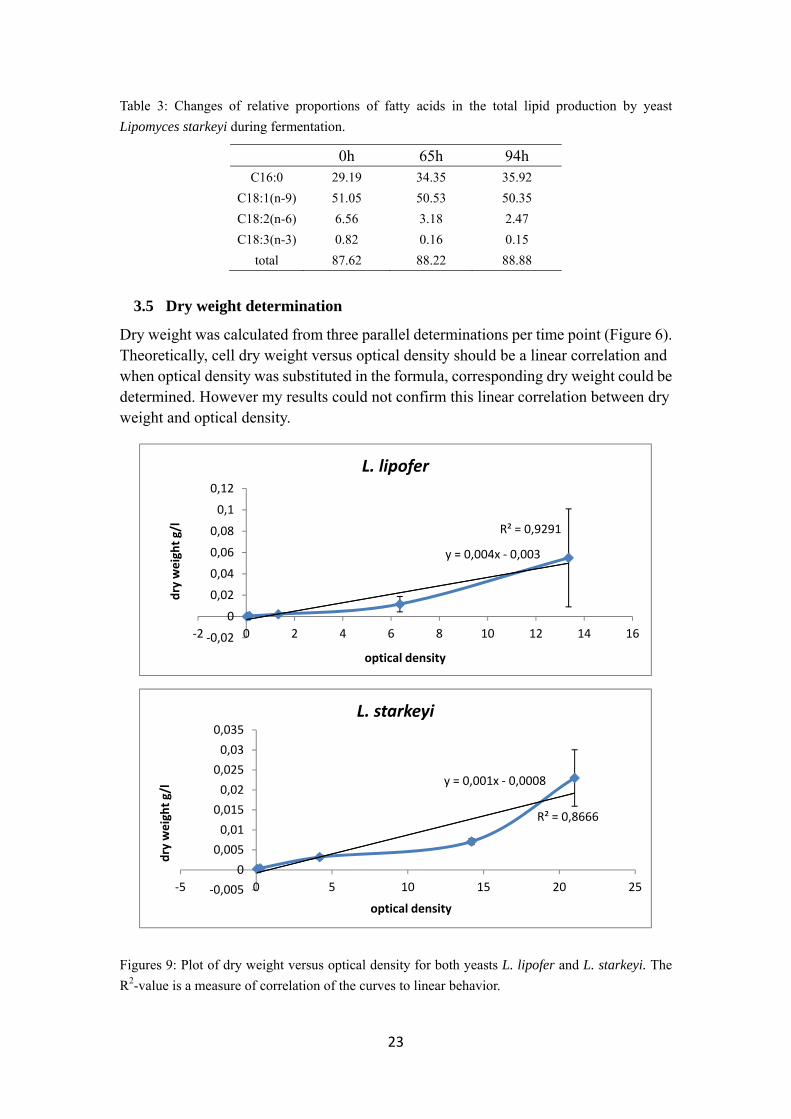
3.4.2 Fatty acid composition change during fermentation
Three time points of cultivation: 0 hour, 65 hour and 94 hour were selected to analyze the fatty acid content variation for Lipomyces starkeyi. Main proportions of fatty acid compositions were illustrated in the table below (Table 3). During fermentation the palmitic acid proportion increased while oleic acid decreased slightly. Linoleic acid proportion decreased remarkably. On the other hand linolenic acid increased slightly and kept steady.
23
Table 3: Changes of relative proportions of fatty acids in the total lipid production by yeast
Lipomyces starkeyi during fermentation.
0h 65h 94h C16:0 29.19 34.35 35.92
C18:1(n-9) 51.05 50.53 50.35
C18:2(n-6) 6.56 3.18 2.47
C18:3(n-3) 0.82 0.16 0.15
total 87.62 88.22 88.88
3.5 Dry weight determination
Dry weight was calculated from three parallel determinations per time point (Figure 6). Theoretically, cell dry weight versus optical density should be a linear correlation and when optical density was substituted in the formula, corresponding dry weight could be determined. However my results could not confirm this linear correlation between dry weight and optical density.
Figures 9: Plot of dry weight versus optical density for both yeasts L. lipofer and L. starkeyi. The
R2-value is a measure of correlation of the curves to linear behavior.
y = 0,004x ‐ 0,003
R² = 0,9291
‐0,02
0
0,02
0,04
0,06
0,08
0,1
0,12
‐2 0 2 4 6 8 10 12 14 16
dry weight g/l
optical density
L. lipofer
y = 0,001x ‐ 0,0008
R² = 0,8666
‐0,005
0
0,005
0,01
0,015
0,02
0,025
0,03
0,035
‐5 0 5 10 15 20 25
dry weight g/l
optical density
L. starkeyi

24
4. Discussion
4.1 Culturing condition was important.
Culturing condition was crucial for lipid accumulation by oleaginous yeasts. Temperature, aeration, pH etc all could influence the growth rate and lipid accumulation. Under the optimum temperature, Rhodotorula glutinis could grow much faster and had a higher cell density than other three oily yeasts.
All the conditions which could affect yeast growth and lipid accumulation were important to control during the test. Rhodotorula glutinis was best of the four oleaginous yeasts in our test with highest lipid content at 45 % of its cell biomass. However, it had been reported that lipid accumulations of Rhodotorula glutinis could reach 66 % of biomass with glucose as a carbon source at pH 4.0 (Johnson et al. 1992). The initial pH in our semi-synthetic medium was 5.8 and hardly to adjust to lower pH. This might be due to strong buffering effect of medium itself. Thus, optimization of medium pH could be one of the key for increasing lipid accumulation by Rhodotorula glutinis.
Several studies had been proceeded to produce single cell oil in different carbon substrate by the species Yarrowia lipolytica such as alkanes, fatty acids, industrial fats, crude glycerol etc. In some cases, accumulated lipid content reached more than 50 % of its dry weight (Aggelis et al., 2009; Fickers et al., 2005; Ratledge et al., 2005). Y.lipolytica was able to utilize hydrophobic substrates efficiently as a sole carbon source. Compared with our research study, this oleaginous yeast might be not a good choice for fermenting lignocellulosic material but oily waste for producing biodiesel.
After 124 hours culturing only 50 % of the carbon source was consumed, and thus it was valuable to further investigate factors influencing substrate consumption. Carbon source was not consumed completely, which may be because nitrogen or another essential element had exhausted in the culture.
As a study subject for expended production for industrial biodiesel, culturing times was also an important parameter to estimate if one yeast species was suitable for fermenting. Because fermenting time would directly affect input cost for whole bioreactor set up, such as more acid base solution would be needed to regulate pH in longer fermentation, and more electricity to aeration etc. Based on this, Rhodotorula glutinis would be a good choice for lipid accumulation because this yeast could grow much faster than others and could produce more lipids in shorter time. Lipomyces lipofer cost almost same time to reach it stationary phase. However, accumulated lipid content was just half of the former one.
4.2 Dry weight determination needed other solution.
High density cell cultures required too long time to filtrate which was not optimal to operate in lab, even when diluting the cell suspension. Filtering 10 ml cell suspension took more than one hour to be filtrated completely. This might be because the yeasts accumulated lipids rather decrease surface tension and clogging the filters used. 2 ml

25
cell suspension required less filtration time (around 10-15 min) but differences between single measurements could be huge influencing the final results. There was supposed to be a straight line when plot dry weight versus optical density. However the graph showed imperfect slope. When we calculated the dry weight through the formula using optical density, the getting dry weight was bigger than the real freeze-dried weight. This probably meant filtration dry weight determination was not an optimal method for determining dry weight for yeast cells at least for Lipomyces lipofer and Lipomyces starkeyi.
On the other hand, freeze dry samples may also be sub-optimal for dry weight determination. When collecting cell pellets, in order to minimizing the cell lost water content was inescapable, especially Lipomyces lipofer was hardly to centrifuge completely to get tight cell pellet. However, when cell pellet volume formed quite much, it may not easy to evaporate all water in the cells after minus 50 ºC, since some crystal formation could be observed in the vials. Whether it included water content needs further analysis.
4.3 Further study is required
To determine lipid content and lipid yield, cell dry weight determination could give valuable parameter to estimate oleaginous yeast’s lipid accumulating capacity. According to the problems we met above, efficient and reliable methods are required. Increasing cell lipid content was the key link while using yeast cells to extracting lipids for biodiesel. Some enzymes had been studied that which could play key roles in the cell lipid metabolism, for example malic enzyme and ATP: citrate lyase. Malic enzyme was a crucial part of producing NADPH which was merged with acetyl-CoA in the cytosol for biosynthesis of fatty acid (Ratledge et al., 2004). Over expression of this enzyme maybe have positive influence on the lipid yield. ATP: citrate lyase was reported as a key to lipid accumulation due to it was the only enzyme to provide acetyl-CoA for fatty acid synthesis (Boulton et al., 1981). Enhancement of this enzyme might be another way to breakthrough in fatty acid synthesis. Without doubt, screening high lipid producing yeast among induced mutants could be also one way to find breach in the biodiesel research area.
There were many aspects to concern when considering putting biodiesel from single cell oils into industrial progress and continuing to mature into the market. Strong competition could be from second generation bio-ethanol. Even low cost energy crops faced great challenges for competing edible crops, depending on climates, nitpicking local soil condition and deterring to political land management (Lin et al., 2011).

26
5. Conclusions and future perspectives
Glucose was the preferred carbon substrate for all oleaginous yeasts. Yarrowia lipolytica even could not grow in xylose only. The best ability of xylose utilization was found in Lipomyces starkeyi. According to the results from shake flask test and fermentation test, Lipomyces starkeyi was better than Lipomyces lipofer on lipid accumulating capacity. However, considering practical application on utilizing lignocelluloses as raw material for producing biodiesel, Rhodotorula glutinis might be a promising organism since its lipid yield was the highest one between all candidates.
Drawing a calibration curve for cell dry weight versus optical density using butcher
flack filtration method met great challenge since too small volume of culture may have
significant error to calculate and high volume of culture cost too long time to operate.
From fermentation test results, it had been found that there was no direct correlation between OD, cell weight and lipid content. In some time point dry weight was decreased a little bit but increased in OD and lipid content.
Fermentation conditions have great influence on culturing cells, for instance oxygen, pH etc. In further study investment, designing a series of medium with pH or aeration gradient for culturing each yeast could be considered performing in lab work to investigate optimum culturing condition for Lipomyces lipofer and Lipomyces starkeyi. Rhodotorula glutinis had highest perspectives between four yeasts on lipid accumulation in the shake flask test, thus 2 L- scaled fermentation test could be considered run in the future work. Meanwhile, using xylose as co-utilizing carbon source to run fermenters have great expectation according to the xylose consumption result because Rhodotorula glutinis could highly utilize xylose compare to other yeasts.
For future perspectives
Searching new strains of yeast and using biotechnological or biochemical methods to get high output oleaginous yeast.
Optimization of culturing condition such as pH, temperature, aeration etc, for improving efficiency of biodiesel production from yeast oil industrialization.
The study of versatility of unsaturated fatty acid may bring another financial development in the application of biodiesel.
Decreasing cost for feedstock and developing cost effective catalyst are still a notable point to facilitate single cell oil industrialization.
Decreasing lipid extraction cost could be another way to enforce yeast producing lipid replacing vegetable oil.
27
6. Acknowledgment
I sincerely thank my supervisor Johanna Blomqvist for excellent supervision and nice guidance for my whole lab work. I also sincerely thank Volkmar Passoth for great help on my project.
Also I appreciate Jana Pickova from the department of food science of SLU for analyzing the fatty acid composition of the lipid production.
7. References
Ageitos, J. M., Vallejo, J. A. et al. (2011). "Oily yeasts as oleaginous cell factories." Appl Microbiol
Biotechnol. 90:1219-1227
Aggelis George (2009). "Biotechnological valorization of biodiesel derived glycerol waste throuth
production of single cell oil and citric acid by Yarrowia lipolytica." Lipid Technol. 21: 83-87
Angerbauer, C., Siebenhofer, M. et al. (2008). "Conversion of sewage sludge into lipids by Lipomyces
starkeyi for biodiesel production." Bioresour Technol. 99:3051-3056
Antolin, G., Tinaut, F. V. et al. (2002). "Optimisation of biodiesel production by sunflower oil
transesterification." Bioresour Technol. 83: 111-4
Appelqvi.La (1968). "Rapid Methods of Lipid Extraction and Fatty Acid Methyl Ester Preparation for
Seed and Leaf Tissue with Special Remarks on Preventing Accumulation of Lipid
Contaminants." Archiv for Chemi 28: 551
Babij, T., Moss, F. J. et al. (1969). "Effects of oxygen and glucose levels on lipid composition of yeast
Candida utilis grown in continuous culture." Biotechnol Bioeng. 11:593-603
Beopoulos, A., Nicaud, J. M. et al. (2011). "An overview of lipid metablism in yeasts and its impact on
biotechnological processes." Appl Microbiol Biotechnol. 90: 1193-1206
Betty, E., Haskell et al. (1965), "Effect of vitamin B6 deficiency on the composition of yeast lipids"
Archiv of Biochem Biophys. 112: 494-505
Beopoulos, A., Mrozova, Z. et al. (2008). "Control of lipid accumulation in the yeast Yarrowia
lipolytica." Appl Environ Microbiol. 74: 7779-7789
Boulton, A., Ratledge, C. (1981) "Correlation of lipid accumulation in yeast with possession of ATP:
Citrate lyase." Journal of General Microbiol. 127: 169-176
Brown, D. E., Hasan, M. et al. (1990). "Effect of temprature and pH on lipid accumulation by
Trichoderma reesei." Appl Microbiol Biotechnol. 34:335-339
Girio, F, M., Fonseca, C. et al. (2010). “Hemicelluloses for fuel ethanol: A review.” Bioresour Technol.
101: 4775-4800
Hu, C., Wu, S. et al. (2011). "Simultaneous utilization of glucose and xylose for lipid production by
Trichosporon cutaneum." Biotechnol Biofuels. 4: 25.
Fickers, P., Benetti, P. H. (2005). "Hydrophobic substrate utilization by the yeast Yarrowia lipolytica, and
its potential applications." FEMS Yeast Res. 5:527-543
Folch, J., Lees, M. et al. (1957). "A simple method for the isolation and purification of total lipides from
animal tissues." J Biol Chem 226: 497-509.
28
Johnson, V., Singh, M. et al.(1992). "Effect of pH on lipid accumulation by an oleaginous yeast:
Rhodotorula glutinis IIP-30." World Journal of Microbiol Biotechnol. 8:382-384
Kosa, M., Ragauskas, A. et al.(2011). "Lipids from heterotrophic microbes: advances in metabolism
research." Trends Biotechnol. 29: 53-61.
Kumar, S. V., Kumutha, K. et al. (2010). "Influence of nitrogen on lipid and biomass production by
oleaginous yeast culture." Asian Journal of Bio Science. 5:87-91
Michael Sheedlo. (2008). "A review of the processes of biodiesel production." MMG 445 Basic
Biotechnol Ejournel. 4:61-65
Lang, X., Dalai, A. K. et al. (2001). "Preparation and characterization of biodiesel from various bio-oils"
Bioresour Technol. 80:53-62
Lin, L., Zhou, C. et al. (2011). "Opportunities and challenges for biodiesel fuel." Appl Energ. 88: 1020-1031.
Ratledge, C. (2004). "Fatty acid biosynthesis in microorganisms being used for single cell oil
production." Biochem. 86:807-815
Ratledge, C. (2005). Single cell oils for the 21st century, p. 1-20. In Z. Cohen and C. Ratledge (ed.),
Single cell oils. AOCS Press, Champaign, IL.
Rattrat, J. B., Schibeci, A. et al. (1975) “Lipids of Yeasts.” American Society for Microbiol. 39:197-231
Scott, C., Hilton, M E. et al. (2007). "A global response to sulfur starvation in Pseudomonas putida and
its relationship to the expression of low-sulfur-content proteins." FEMS Microbiol Lett. 267:
184-193.
Spencer, J. F. T. Spencer, D.M. (1997). "Chapter 5-Yeats as Living objects: Yeast Nutrition" in "Yeasts in
Natural and Artifical Habitats". 68-74
Tyson K S. (1998) "Biodiesel research progress 1992-1997." NREL Technical Report,
NREL/TP-580-24443
Wu, S., Zhao, X. et al. (2011). "Microbial lipid production by Rhodosporidium toruloides under
sulfate-limited conditions." Bioresour Technol. 102: 1803-1807.
Xia, C., Zhang, J. et al. (2011). "A new cultivation method for microbial oil production: cell pelletization
and lipid accumulation by Mucor circinelloides." Biotechnol for Biofuels. 4:15
Xin, M., Yang, J. et al. (2009). "Biodiesel production from oleaginous microorganisms." Renewable
energ. 34: 1-5
Valero, E., Millan, C. et al. (2001). "Influence of oxygen addition during growth phase on the
biosynthesis of lipids in Saccharomyces cerevisiae (M(3)30-9) in enological fermentations.”
Journal of Bioscien Bioeng. 92:33-38
Yusuf, C. et al. (2007) "Biodiesel from microalgae" Biotecnol Adv. 25:294-306

29
Appendix
(1) Harvest time of batch test
According to the measurement of optical density of each strain, cells were harvested at their early stationary phase.
Table 4: harvest time for four yeasts in the shake flask batch test.
yeast harvested time
Lipomyces lipofer 124 hour
Lipomyces starkeyi 97 hour
Rhodotorula glutinis 71 hour
Yarrowia lipolytica 71 hour
(2) Shake flask batch test in different sugars
The result of consumed sugar, cell dry weight, extracted lipid weight, lipid content and yield of each yeast strain was illustrated in the table below. The data after plus minus signs was standard deviation of three biological replicates.
Table 5: Each yeast’s cell dry weight, lipid content, lipid yield and consumed sugar amount with
correlated standard deviation. The symbol “*” in the table means these numbers were single datum
from one sample without replicates.
consumed sugar g/l cell dry weight g/l lipid weight g/l lipid content lipid yield g/g
L. lipofer glu 37.6077±10.9298 8.1233±1.0766 0.8507±0.1460 0.1054±0.0195 0.0248±0.0120
xyl 15.9189±6.2331 4.6207±2.1579 0.5113±0.2872 0.1051±0.0189 0.0301±0.0093
glu+xyl 17.3117±1.9522(glu)
3.205±0.9024(xyl) 5.9827±1.2892 0.7013±0.1323 0.1179±0.0076 0.0350±0.0103
L. starkeyi glu 16.5439±1.9984 3.9453±0.3464 1.0600±0.0501 0.2693±0.0122 0.0644±0.0047
xyl 9.6662±0.9442 3.3313±0.5752 0.9907±0.1701 0.2974±0.0029 0.1023±0.0121
glu+xyl 11.6926±0.1000(glu)
5.6449±1.7232(xyl) 3.9433±0.3194 0.9347±0.1842 0.2371±0.0432 0.0536±0.0054
R. glutinis glu 13.8971±2.4659 3.4447±0.3678 1.5667±0.0348 0.4585±0.0521 0.1151±0.0201
xyl 5.1574* 0.926* 0.274* 0.2959* 0.0531*
glu+xyl 11.0157±1.6441(glu)
5.3155±1.5342(xyl) 3.5247±0.3300 1.5580±0.0610 0.4455±0.0563 0.0959±0.0070
Y. lipolytica glu 15.1838±1.4662 2.2507±0.3698 0.2800±0.0370 0.1252±0.0131 0.0185±0.0029
glu+xyl 12.4412±0.1995 2.5393±0.3458 0.3020±0.0106 0.1208±0.0212 0.0243±0.0012

30
(3) Fatty acid composition analysis
The fatty acid compositional profile was illustrated in the Table 6.
Table 6: the occupation of each lipid composition in the total lipid amount from shake flask batch
test of strain Lipomyces lipofer, Lipomyces starkeyi and Rhodotorula glutinis. The table also shows
lipid composition analysis from fermentation test of Lipomyces starkeyi.
(Bioreactor) L. starkeyi L. starkeyi L. lipofer R. glutinis
0h 65h 94h xylose glucose xylose glucose xylose glucose
C14:0 0.40 0.23 0.26 0.27 0.40 0.20 0.18 1.59 1.68
C15:0 0.25 0.00 0.00 0.00 0.00 0.00 0.00 0.00 0.00
C16:0 29.19 34.35 35.92 35.30 37.27 27.57 25.92 24.41 23.71
C16:1(n-7) 4.02 1.85 2.08 4.28 3.92 3.88 2.75 1.92 1.79
C17:0 0.57 0.17 0.14 0.15 0.14 0.00 0.00 0.00 0.00
C17:1 0.00 0.00 0.00 0.00 0.00 0.00 0.00 0.00 0.87
C18:0 4.67 7.87 7.16 4.81 5.63 6.26 8.04 2.27 2.30
C18:1(n-9)trans 0.00 0.00 0.00 0.00 0.25 0.00 0.00 0.00 0.00
C18:1(n-9) 51.05 50.53 50.35 49.06 48.18 51.31 54.80 30.26 47.30
C18:2(n-6) 6.56 3.18 2.47 4.28 2.71 6.01 4.33 25.28 12.19
C18:3(n-6) 0.00 0.00 0.00 0.00 0.00 0.00 0.00 0.26 0.15
C18:3(n-3) 0.82 0.16 0.15 0.39 0.26 1.58 0.87 11.00 6.37
C20:0 0.26 0.50 0.47 0.43 0.28 0.45 0.66 0.17 0.26
C20:1(n-9) 0.00 0.00 0.00 0.11 0.00 0.13 0.11 0.22 0.23
C20:2(n-6) 0.00 0.00 0.00 0.00 0.00 0.00 0.06 0.09 0.00
C20:4(n-6) 1.32 0.62 0.54 0.46 0.58 0.87 0.80 1.48 1.01
C20:3(n-3) 0.07 0.08 0.07 0.04 0.06 0.39 0.36 0.10 0.12
C22:0 0.36 0.46 0.41 0.35 0.32 0.70 0.85 0.40 0.45
C24:4 0.00 0.00 0.00 0.00 0.00 0.00 0.00 0.00 0.34
C24:1 0.09 0.00 0.00 0.00 0.00 0.00 0.00 0.08 0.00
C22:3 0.18 0.00 0.00 0.00 0.00 0.12 0.09 0.00 0.06
C22:5 (n-6) 0.07 0.00 0.00 0.00 0.00 0.00 0.00 0.27 0.09
total 99.87 100.00 100.00 99.92 100.00 99.44 99.82 99.81 98.93