a comparative study and assessment of socio-economic
TRANSCRIPT

P a g e | i
Sponsored by National Commission for Women, 4 Deen Dayal
Upadhya Marg, New Delhi-110002
SRIJANA C-19, Trimurti Gram, Ring Road, Kalyanpur,
Lucknow-226022
A Comparative Study and Assessment of Socio-economic Status of Trained and Un-
Trained Handicraft Women Artisans in Lucknow and Surrounding Districts-
Barabnki, Sitapur and Unnao.

P a g e | ii
Contents
List of Tables iii List of Figures iv Abbreviations iv Acknowledgements v Executive Summary 1 CHAPTER I: Introduction 3-9 CHAPTER II: Purpose, Scope and Methodology 10-12
FINDINGS 13-50 CHAPTER III: Comparative analysis of status of trained and un-trained
artisans on the ground of districts
14-32
1 Demographic Profile of Respondents 14 2 Working Condition and Socio-Economic Concern 15 3 Status of Artisan Card / Health Insurance Card 25 4 Education and Account Practices 26 5 Health Related Issues 29 6 Status of House and Sanitation 30 7 Finding based on the discussion with the middlemen and traders 32
CHAPTER IV : Comprehensive analysis of various projects undertaken for the welfare of handicraft artisans
33-39
1 Details of artisans interviewed under the various training projects 34
2 Duration of the Training Projects 35
3 Status of Resources/Inputs provided to artisans 35
4 Exposure Visits 36
5 General Sensitization 37
6 Influence of the various project initiatives on lives of poor 37
7 Gaps in various project interventions 39 CHAPTER V: Major finding during observation and FGD 41-47 CHAPTER VI: Recommendations 48-49 CHAPTER VII: Conclusions 50 REFERENCES 51 APPENDIX 1 Tables of Comparative Analysis of Status of Trained and Un-Trained
Artisans on the ground of Districts in Number (From Table 4 to Table 19) 52-57
APPENDIX 2 Table of distribution of Artisans according to their Category at village level of both trained and untrained
58-59

P a g e | iii
List of Tables
Table 1 : Distribution of informal and formal sector workers by sector and sex between 1999-2000 and 2004-05 (in million) Sector
6
Table 2 : Profiles of women workers in the informal sector 9
Table 3 : Details of Sample Size of the survey 12
Table 4 : Distribution of artisans according to their category 14
Table 5 : Working place of artisans 16
Table 6 : Working hours/day of artisans 18
Table 7 : Artisans working for whom 19
Table 8 : Wage Group (WG) of artisans 21
Table 9 : Responses of artisans on saving, wage and wage rate 23
Table 10 : Responses of artisans on marketing concern 24
Table 11 : Artisans who were member of Self Help Group (SHG) 24
Table 12 : Loan/dent/borrow by artisans 25
Table 13 : Status of artisan card/health insurance card 26
Table 14 : Education status of artisans 27
Table 15 : Account of artisans in bank and its operation 28
Table 16 : Status of Health & Hygiene Sensitization Camp 29
Table 17 : Status of institutional delivery of married women 29
Table 18 : Status of house 30
Table 19 : Availability of toilets in artisans premises 31
Table 20 : Details of the number of trained artisans interviewed under the various projects/schemes
34
Table 21 : Duration of the Training Project 35
Table 22 : Resources/Inputs received by artisans during training 36
Table 23 : Status of exposure visits during training 36
Table 24 : Status of general sensitization during training 37
Table 25 : Benefits of the training programs 37
Table 26 : Analysis of project influence based on response on various project indicators
38
P a g e | iv
List of Figures
Figure 1 : The study area 22 Figure 2 : Distribution of artisans according to their category 15 Figure 3 : Working place of artisans 17 Figure 4 : Working hours of artisans per day 18 Figure 5 : Artisans working for whom 20 Figure 6 : Wage Group (WG) of artisans 22 Figure 7 : Educational status of artisans 27 Figure 8 : Status of House 30 Figure 9 : Framework of the industry 32
Abbreviations SHG Self Help Group
FGDs Focus Group Discussions
HRD Human Resource Development
DC Development Commissioner
IGA Income Generating Activity
NGO Non Governmental Organization
JSSs Jan Shikshan Sansthans
CSR Corporate Social Responsibility
BKT Bakshi Ka Talab
DUDA District Urban Development Authority
CAPART Council For Advancement Of People’s Action And Rural Technology
RGSSBY Rajiv Gandhi Shilpi Swasthya Bima Yojana
STEP Support To Training And Employment Programme For Women
HRD Human Resource Development

P a g e | v
Acknowledgements
SRIJANA is thankful to the 600 handicraft women artisans of Lucknow, Barabanki, Sitapur and Unnao especially those who were poor, vulnerable and living in very difficult situation for their time and support, for providing their valuable information and generously sharing their experience with us. SRIJANA is grateful to National Commission for Women for providing us opportunity to work for poor and vulnerable handicraft artisans in order to examine their current socio-economic status and finding out the probable solutions of various problems and hindrances in the way of their overall development. We are thankful to the honorable chairperson of NCW, honorable members, research staff, administrative staff and all the personnel working with NCW for their assistance at various levels. We would like to express our deep gratitude to Smt. Richa Ojha (Senior Research Officer, NCW) for her valuable comments and review.
SRIJANA is thankful to ShriShiva Charan Singh, Joint Director, Economics and Statistics Division, Government of Uttar Pradesh for his valuable and constructive suggestions during the planning and development of this research work. His willingness to give his time, so generously has been very much appreciated.
We would like to express our deep gratitude to Dr. R P Singh (former Professor and Head Agriculture Management Centre, Indian Institute of Management, Lucknow) for his enthusiastic encouragement and useful critiques during the review of the research paper.
We would like to express our very great appreciation to Shri Sudhir Kumar Singh working as Assistant Manager, Uttar Pradesh Skill Development Mission for his extensive assistance from the planning and execution of research to final report preparation.
The organization wishes to acknowledge the sincere contribution of Ms. Priya Singh, Consultant, Primes “Centre for Career Excellence”, Indira Nagar, Lucknow in the analysis and writing of this Report.

P a g e | 1
Executive Summary The Indian economy has a prevalence of informal and unorganized sector, both in terms of the number of workers and enterprises. The various studies reveal that the socio-economic condition of artisans is very pathetic. In the surrounding area of Lucknow, the capital of Uttar Pradesh has a copious number of artisans working in un-organized sector. In this context proposed study aims to promote the inclusive growth by providing appropriate understanding and feedback for the expansion of various development initiatives in the right perspective for the welfare of handicraft artisans and highlights the key gaps or challenges to enhance well being of target beneficiaries. This study examines the socio-economic status of trained and untrained women handicraft artisans engaged Chikankari and similar art related to embroidery Like Ari- zardozi, Mukesh, Jali Work, cloth cutting, stitching, printing, final stitching, washing, pressing, etc. in Lucknow and its surrounding districts Barabanki, Sitapur and Unnao. In the above concern, the primary data were collected from 43 villages of Lucknow,Barabanki, Sitapur and Unnao districts by applying tools like responses to interview schedule, focus group discussions and observations in the respective villages. During the study we had interaction with 600 trained and un-trained women ages between 18-45, 16 middle man and 8 traders.
The major findings of the study envisaged that the major portion of the respondents in both categories were Muslim (42 percent in trained category and 59 percent in un-trained category because this work is more popular in the Muslim community. Many of them did not have other source of income except this craft. Around 67 percent of the artisans were working from home in both the categories when they found themselves free from daily chores. The majority of the artisans were working for 2-4 hours in a day (57 percent in trained category and 48 percent in un-trained category). Overall, 79 percent artisans in the trained category and 85 percent artisans in un-trained category were working through middlemen. The artisans had very less opportunity to bargain from middlemen and artisans were depending badly on middle man for wage and work. The majority of the artisans were working ata very low wage rate. Many of them totally dependent on this craft for their subsistence but they find it difficult to make both their ends meet. The majority of the artisans in both the categories were not satisfied with the wage rate (81 percent in trained category and 89 percent in un-trained category) and they did not have any monthly savings. Most of artisans did not have any institutional support in area of forward and backwardlinkages.Most of the artisans had got no any opportunity to participate in exhibitions organized by various agencies working for the welfare of handicraft. Most of artisans needed money on various junctures of time. They borrowed it from relatives, friends, middle man and traders, but there was a little percentage of artisans found who took loan from the bank. Many of the young and energetic artisans wanted to do this work ona larger scale, but they were lacking financial support. The majority of the artisans neither had an artisan card nor a health insurance card. Most of the respondents in both the categories were literate (83 percent in trained category and 73 percent in untrained category). We preferred literate respondent during the survey to know about the actual condition of these artisans. Overall, 60 percent artisans in the trained category had a personal bank account, but it was found only 38 percent in untrained category. Only 48.6 percent of the artisans of the trained category had a toilet in their premises in comparison to 47.6 percent in untrained category.

P a g e | 2
Overall 300 artisans were interviewed under various training projects undertaken for the welfare of handicraft artisans. Overall, 34 percent of the trainings were of very short duration about ½ month to 3 months. Only 17 percent of respondents received a stipend during the training and only 56 percent of the respondents were provided training certificates. Very less percentage of the artisans(Overall,11 percent)had the opportunity to participate in exposure visits during training. Overall, 28 percent of the artisans responded that they were sensitized to some other important issues vital to improve the life skill and living standard except skill enhancement training.Overall, 50.4 percent of the artisans told that they got over-all benefits of the training program while 49.6 percent of the artisans told that although their skill has been improved but did not get any positive change in their income.It pulls our attention on the various shortcomings of project implementation. The probable reason could be related to selection of beneficiaries, forward and backward linkages, follow-up of the training program, support services, etc. Overall,61 percent of the artisans in training category had a personal bank account in comparison to 38 percent in untrained category. Overall, 31 percent ofthe artisans had an artisan card in the trained category,but it was nil in untrained categories. The artisans were not aware enough about the benefits of artisan card they could have availed of it. Overall, 15 percent artisans in the trained category were member of SHG in compare 2 percent of artisans in un-trained category. Overall,23 percent of the artisans in the trained category responded that they had some monthly saving, in compared to 11percent of the respondents in untrained category, however many of them were un-married in both the category. Overall, 32 percent of the artisans participated in the health sensitization camp in the trained category in comparison to only 11 percent of artisans in untrained category. It was found that major portion of artisans were Muslims in both the categories. On one side, they were not aware about the various government schemes available for them and on the other were lagging behind on various development aspects.
• The funding organizations-state/central government and other private agencies working for welfare of these artisans, should focus on empowering the existing artisans with new market led skill enhancement training programs with integrated approach (livelihood creation and supporting activities by imparting training on technical, managerial and behavioral skills) for rapid adoption of latest technology by the artisans and enabling the artisans to cope with emerging demand and globalizing economy.
The recommendations under the study are as follows:-
• The sponsoring agency should make the provision of stipend including provision of raw materials and equipments etc. in the skill enhancement training programs to compensate their loss of income of poor artisans from their productive work.
• The central /state government and other private agencies should make certification of training program compulsory after successful execution of such training program either it is short term or long term. Participants should be provided with a certificate of training when they fulfil certain parameters designed in their training program may be in the form of practical test during the training. It will improve the quality of training.
• The sponsoring agencies working for welfare of handicraft artisans should promote and give priority to skill enhancement training program proposals that also include comprehensive approach to improve the lives’ of poor artisans like sensitization of artisans on their rights and entitlements, providing backward and forward linkages, raising awareness on reproductive child health, imparting life skill education on various aspects of life to achieve significant and measurable impacts of the project activities as per the targets and objectives of the project.

P a g e | 3
• The sponsoring agencies (state/central and other private agencies) working for the welfare of handicraft artisans should promote exposure visits, especially in long term initiatives.
• The various agencies working for welfare artisans should promote participation of artisans in
exhibitions/trade shows/various mahotsava by organizing sensitization camps in the artisans’ concentrated area, providing them free of cost stalls in exhibitions, travelling and transportation charges including boarding and lodging.
• Development commissioner handicraft, state /central government and other bilateral/private agencies should organize sensitization camp on the need and importance of artisan card for an artisan and promote registration/issuance of the card.
• The various central /state government and other private/bilateral agencies working for the welfare of artisans, especially the Development Commissioner Handicraft should time to time organize sensitization camps in artisans’ concentrated areas on Rajiv Gandhi Shilpi Swasthya Bima Yojana (RGSSBY) and promote their linkage with RGSSBY.
• The central governments/state government/bilateral agencies working for the welfare of artisans and lead bank of the area should organize sensitization camps in artisans’ concentrated areas to open the bank account and may promote its linkage with Pradhan Mantri- Jan Dhan Yojana (PMJDY).
• The local level organizations-NGOs and other bilateral agencies working for the welfare of artisans should find out some other source of income (need based and demand driven) in the particular area which can utilize the working potential of the artisans and enhance their income and ensure their regular work availability.
• The sponsoring agencies working for the welfare of handicraft artisans should promote and design a comprehensive and specific program, (like program comprising of new market led skill enhancement training, leadership development, sensitization on schemes related to minority welfare, life skill education, addressing gender based/local issues etc.) which can pull them above poverty line and address the various issues and social problems of these Muslim women artisans by involving local Panchayati Raj Institutions, religious leaders and local level organizations.
• The sponsoring agencies may promote the selling of articles of women artisans through establishing a separate website, either by itself or by public-private partnership or linkages with similar institutions as a tool to diminish middlemen involvements and promote online marketing.
• The artisans may be mobilized and trained about forming their own cooperative society to deal with their own affairs. Through it, they can sell their products directly to traders/consumers at offline/on-line mode. It will also give the cumulative bargaining power to deal with middlemen/traders.

P a g e | 4
I Introduction

P a g e | 5
Introduction “Empowering Women is a prerequisite for creating a good nation, when women are empowered, society with stability is assured. Empowerment of women is essential as their value systems lead to the development of a good family, good society and ultimately a good nation” – Dr. A.P.J. Abdul Kalam
Various development initiatives have been expanded in the various part of our country and have been expanding in the social sector in order to ensure access to health, education and livelihood security for the common man, particularly for the weaker section of society but we have been still lacking inclusive growth and we have miles to go. This study is a very small effort towards these initiatives, especially for women working in the unorganized sector.
Unorganized/ Informal Sector According to National Statistical Commission, Report (2012)Unorganized or informal sector constitutes a pivotal part of the Indian economy. More than 90 percent of the workforce and about 50 per cent of the national product are accounted for by the informal economy. A high proportion of socially and economically underprivileged sections of society are concentrated in the informal economic activities. The high levels of growth of the Indian economy during the past two decades are accompanied by increasing informalisation. There are indications of growing inter-linkages between informal and formal economic activities. There has been new dynamism of the informal economy in terms of output, employment and earnings. Faster and inclusive growth needs special attention to the informal economy. Sustaining high levels of growth are also intertwined with improving domestic demand of those engaged in the informal economy, and addressing the needs of the sector in terms of credit, skills, technology, marketing and infrastructure.
The concept of the informal sector was first introduced by Hart, with the distinction between wage and self employment as the essential difference between the formal and informal sectors. Later ILO broadened the scope of the informal sector. Informal activities are typically characterized by ease of entry, reliance on indigenous resources, family ownership of enterprises, small scale of operations of labour intensive and adaptive technology, skills acquired outside the formal schooling system, and unregulated and competitive markets.
Image 3: Artisan of village-Goyala, BKT, Lucknow

P a g e | 6
The Resolution concerning Statistics of Employment in the Informal Sector, adopted by the Fifteenth International Conference of Labour Statisticians in 1993, defined the informal sector as follows: The informal sector is regarded as a group of household enterprises or unincorporated enterprises owned by households that includes:
• Informal own-account enterprises, which may employ contributing family workers and employees on an occasional basis; and
• Enterprises of informal employers, which employ one or more employees on a continuous basis.
Reviewing various reports, informal sector has multi- conditions and not uniformed in nature and condition of jobs. The informal sector consists of regular workers and casual labour, self employed and those working for others, illiterate to semi-educated, in all age groups (including below and above the normal working age bracket). This combination of differentiated and distinct characters is more pronounced when we talk of informal sector in the urban areas; of a country like India.
The First Indian National Commission on Labour (1966-69) defined „unorganized sector workforce‟ as –“those workers who have not been able to organize themselves in pursuit of their common interest due to certain constraints like the casual nature of employment, ignorance and illiteracy, small and scattered size of establishments”.
The National Sample Survey Organization (NSSO), which has been conducting surveys of un-organized enterprises at periodical intervals, generally adopted the following criteria for the identification un-organized sector:
a. In the case of manufacturing industries, the enterprises not covered under the Annual Survey of Industries (ASI) are taken to constitute the un-organized sector.
b. In the case of service industries, all enterprises, except those run by the Government (Central, State and Local Body) and in the corporate sector were regarded as un-organized.
Magnitude of workforce engaged in the unorganized/informal sector
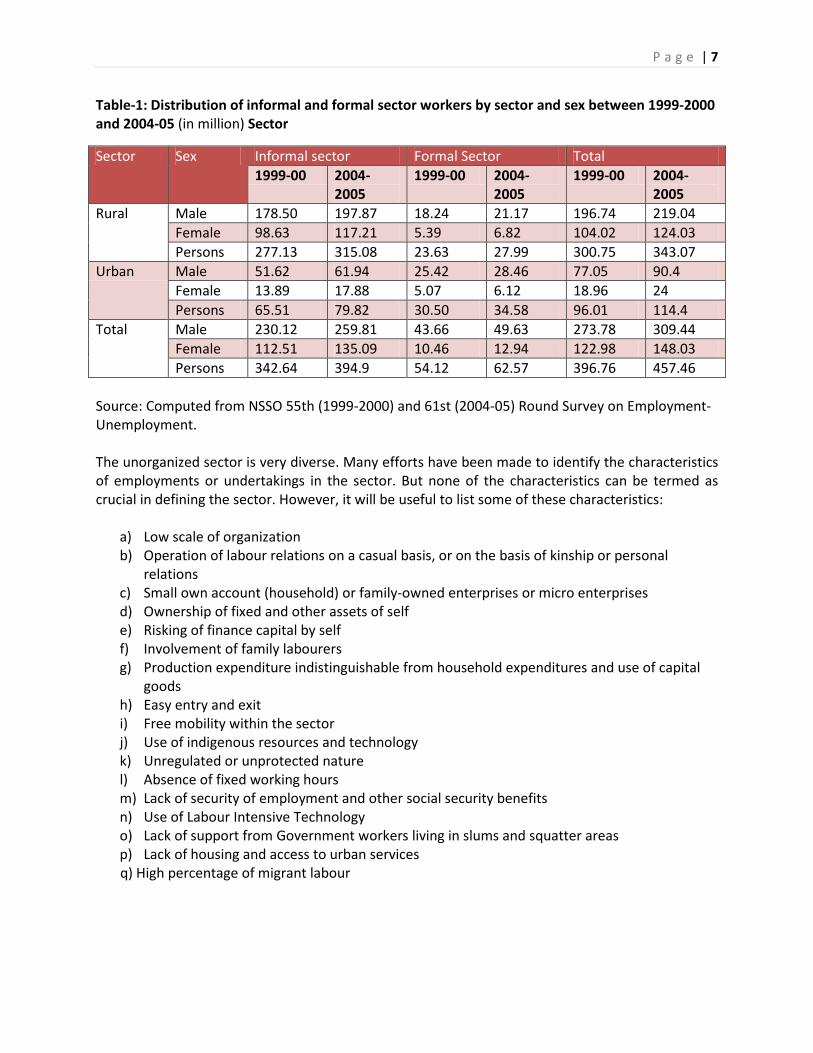
India is an emerging economy with 457.46 million workers in 2004-05. The size of the workforce was 396.76 million in 1999-2000.A large chunk of the workforce was engaged in the informal sector. The estimated number of informal sector workers in 2004-05 was 394.90 million in India contributing 86 percent of total workers. Table 1 shows the distribution of informal and formal sector workers by sector and sex between 1999-2000 and 2004-05. In rural areas the share of informal sector workers in each population segment recorded more than 90 percent and the share of female workers (94.50 percent) is more than male workers (90.34 percent) in 2004-05. In 1999-00 the situation was same for rural area, but over the years the percentage share declined in rural areas. Contrast to rural areas, in urban areas around 70 percent of workers worked in the informal sector, but between the study periods the share of informal workers in urban areas increased.
P a g e | 7
Table-1: Distribution of informal and formal sector workers by sector and sex between 1999-2000 and 2004-05 (in million) Sector
Sector Sex Informal sector Formal Sector Total 1999-00 2004-
2005 1999-00 2004-
2005 1999-00 2004-
2005 Rural Male 178.50 197.87 18.24 21.17 196.74 219.04
Female 98.63 117.21 5.39 6.82 104.02 124.03 Persons 277.13 315.08 23.63 27.99 300.75 343.07
Urban Male 51.62 61.94 25.42 28.46 77.05 90.4 Female 13.89 17.88 5.07 6.12 18.96 24 Persons 65.51 79.82 30.50 34.58 96.01 114.4
Total Male 230.12 259.81 43.66 49.63 273.78 309.44 Female 112.51 135.09 10.46 12.94 122.98 148.03 Persons 342.64 394.9 54.12 62.57 396.76 457.46
Source: Computed from NSSO 55th (1999-2000) and 61st (2004-05) Round Survey on Employment-Unemployment. The unorganized sector is very diverse. Many efforts have been made to identify the characteristics of employments or undertakings in the sector. But none of the characteristics can be termed as crucial in defining the sector. However, it will be useful to list some of these characteristics:
a) Low scale of organization b) Operation of labour relations on a casual basis, or on the basis of kinship or personal
relations c) Small own account (household) or family-owned enterprises or micro enterprises d) Ownership of fixed and other assets of self e) Risking of finance capital by self f) Involvement of family labourers g) Production expenditure indistinguishable from household expenditures and use of capital
goods h) Easy entry and exit i) Free mobility within the sector j) Use of indigenous resources and technology k) Unregulated or unprotected nature l) Absence of fixed working hours m) Lack of security of employment and other social security benefits n) Use of Labour Intensive Technology o) Lack of support from Government workers living in slums and squatter areas p) Lack of housing and access to urban services
q) High percentage of migrant labour

P a g e | 8
Women Working in Unorganized/ Informal Sector
According to Ministry of Women and Child Development report on Working Group on Empowerment of Women for the XI PlanWomen as an independent group constitute 48% of the country’s total population as per the 2001 Census. The importance of women as an important human resource wasrecognized by the Constitution of India, which not only accorded equality to women, but also empowered the State to adopt measures of positive discrimination in their favor. Anumber of Articles of the Constitution specially reiterated the commitment of the constitution towards the socio economic development of women and upholding theirpolitical right and participation in decision making.
The unorganized sector is the largest in India, accounting for 370 million workers in 1999-2000ii, constituting 93% of the total workforce and 83% of the non agricultural work force.
Women account for 32% of the workforce in the informal economy, including agriculture and 20% of the non agricultural workforce. 118 million women workers are engaged in the unorganized sector in India, constituting 97% of the total women workers in India. The informal sector in the non agriculture segment alone engaged 27 million women workers in India.
Image 4: Artisan of Rustam Nagar, Chowk side, Lucknow

P a g e | 9
Women informal workers are concentrated mainly in agriculture – so much so that three-quarters of all employed women are in informal employment in agriculture. 90% of those employed in manufacturing and construction are also unorganized sector workers. Within manufacturing, they predominate in certain industries such as garments, textiles, food and electronics. The seasonality of work in this sector and the lack of other avenues of work make them vulnerable to a range of exploitative practices. They remain the most vulnerable and the poorest. And yet they are economically active and contributing to the national economy
Various studies by Papola (1982, 92), clearly and emphatically show another amazing fact that, the urban labour market discriminates against women much more than the rural labour market. This discrimination results in a decline in the participation of women in economic activities.
Source: WCD Report Empowerment of Women for the XI Plan
A large number of women work as home based workers. About 23% of the non-agricultural workers were home based or working in their own dwellings. Home based workers were an overwhelming 57% of the workforce among women. Home-based worker refers to the general category of workers who carry out remunerative work within their homes or in the surrounding grounds. Women turn to home-based work for a number of reasons. Lack of necessary qualifications and formal training, absence of childcare support, social & cultural constraints and the absence of alternatives are some of the reasons. Families need cash incomes for their survival. Loss in formal employment and reduced returns from agriculture often result in men migrating to urban centres, leaving behind women and children. With home-based work being the only alternative available forpoor communities, it is not confined only to women but also involves children, especially girls. There are positive aspects of home-based work also. It gives women the opportunity to combine work with domestic chores, flexible and sometimes better working conditions. While designing strategies to meet the challenges, it is important to retain the positive aspects of home-based work.
Women’s Work in India -- Invisible, Unrecognized and Unremunerated • India has 397 million workers • 123.9 million are women • 106 million are in rural areas • 18 million are in urban areas • Only 7% of India’s labour force is in the organized sector; 93% is in unorganized, informal
sector • 96% of women workers are in unorganized sector • Female work participation rate (WPR) has increased from 19.7% in 1981 to 25.7% in2001 • In rural areas female WPR has increased from 23.1 to 31% • In urban areas it has increased from 8.3 to 11.6% • But women reported as non workers in the census found to spending 4 hours a day
picking, sowing, grazing cattle, threshing, or working as domestic servants for 8-10 hours a day!

P a g e | 10
TABLE 2 PROFILES OF WOMEN WORKERS IN THE INFORMAL SECTOR Category
Reasons for Particular Profession
Terms and Condition of Job
Wages Discrimination on the basis of Gender
Domestic Workers • Job available near their residence
• Economic Compulsion
• No other skill
• No define rules
• Increment in wage only when working for long periods
• Negotiable • Wages not
enough to satisfy bare minimum needs
• No discrimination
• More preferred against men for household jobs
Construction Workers
• No other skill • No land • No other
option
• Depend for local contractors for work
• No regular or security of jobs
• Disparity in wages and in nature of work
• Ill-treatment and harassment at the hand of contractor
Garment Workers • Lower middle class who wants white collar jobs
• Can Work from home
• No significant information
• Work based commission
• Negotiable /Arbitrary
• No incidents reported
Petty Traders/Vendors
• Find pride in being self employed
• Self employed • Uncertain • No incidents reported
Sales Person • Economic Compulsion
• Very tedious and also involves the risk of personal assaults
• Mostly work based
• Arbitrary and Low
• No incidents reported
Source: article on “Women Working in Informal Sector in India: A saga of Lopsided Utilization of Human Capital” in 2011 International Conference on Economics and Finance Research IPEDR vol.4 (2011) © (2011) IACSIT Press, Singapore
According to the work place embroideryartisans can be generally classified as:
Home based worker: the artisans take the work from the traders/ middlemen/ organizations/ federation and complete it at their homes, whenever they have free time at hand. Centre based worker: the artisans come to a specific place and do the embroidery for a specific time period. The Centre may be in the house of one of the artisans or it may be a separate unit all together.
P a g e | 11
II Purpose, Scope and Methodology

P a g e | 12
This paper examines the socio-economic status of trained and un-trained handicraft artisans engaged Chikankari and similar arts related to embroidery Like Ari- Zardozi, Mukesh, Jali Work, cloth cutting, stitching, printing, final stitching, washing, pressing, etc in Lucknow and surrounding districts Barabanki, Sitapur and Unnao. The city of Lucknow has a prominent place in the history of India, particularly for its arts, historical monuments and rich cultural heritage. The rulers of Awadh, particularly the Mughals were very fond of art and cultural activities such as music, poetry, architecture and handicrafts. Besides being famous for its hot summers and a glorious past, Lucknow is also known the world over for its many fine Handicrafts. Some of the most popular names in this list are Chikankari, Hand Block Textile Printing, Zari Zardozi, Ivory or Bone Carving, Terracotta and many others that are being practiced by various artisans of Lucknow. CHIKANKARI is considered to be the most popular amongst these and is recognized worldwide. Many times the organization had the opportunity to visit the artisans’ concentrated areas and had a deep conversation with them to know about the present Overall situation of these artisans. It was found that Overall conditions of these artisans were very pathetic. They were left out of development trajectory. They were struggling for their subsistence and to improve their living standard. This called for examining the current status of these artisans. The terms handicraft women artisans, trained women artisans and untrained women artisans have been used in our research topic. The explanations of the terms have been described as follows to understand this study in right perspective. Handicraft Women Artisans: - Handicraft women artisan means women engaged in Chikankari and similar art related to embroidery Like Ari- Zardozi, Mukesh, Jali Work, cloth cutting, stitching, printing, final stitching, washing, pressing etc. Trained Women Artisans: - Trained women artisans’ means artisans who have been provided skill enhancement training, incentives, raw-materials, insurance, marketing linkages and other such support through various project interventions by government or other national and international organization during the last five to ten years. Untrained Women Artisans Untrained women artisans means artisans who have not been provided skill enhancement training, incentives, raw-materials, insurance, marketing linkages and other such support through various project interventions by government or other national and international organization during the last five to ten years.
Objectives of the Study
• To measure the impact of various Government and Non-government and other national and international agencies project interventions for the welfare of handicraft women artisans.
• To find out the gaps in implementation of various project interventions for the welfare of women artisans.
• To measure the current socio-economic status of handicraft women artisans. • To find out the required policy framework for bringing about positive change and
empowerment of handicraft women artisans.
Purpose, Scope and Methodology

P a g e | 13
Geographical area and target group The study was conducted with handicraft women artisans scattered in Lucknow (the capital of Uttar Pradesh, India) and its surrounding districts well-known for this craft,namely Barabanki, Sitapur and Unnao. The major target groups were trained and un- trained handicraft women artisan ages between 18-45 years.
Sample Size and Methodology of data collection The primary datawere collected from 43 villages of Lucknow, Barabanki, Sitapur and Unnao districts of Uttar Pradesh by applying tools like responses to interview schedule, focus group discussions and observations in the respective villages. During the study 300 trained and 300 un-trained women artisans between the age group of 18-45, were interviewed.Overall75 trained women artisans, 75 un-trainedwomen artisans, 4 middlemen and 2 traders in each district were selectedfor interview on the basis of purposive random sampling.
Table 3:Details of Sample Size
District Number of Artisans Number of Middlemen
Numbers of Traders Trained Un-Trained
Lucknow 75 75 4 2 Barabanki 75 75 4 2 Sitapur 75 75 4 2 Unnao 75 75 4 2 Total 300 300 16 8
Figure 1: The study area

P a g e | 14
Findings
III District wise Comparative Analysis of the Status of Trained and Un-Trained artisans

P a g e | 15
1. Demographic Profile of Respondents The primary datawas collected from 43 villages of Lucknow, Barabanki, Sitapur and Unnao districts by applying tools like responses to interview schedules, focus group discussions and observations in the respective villages. The surveys, interviewed handicraft women artisan ages between 15 and 45. Overall 600 artisans were interviewed during our survey out of which 300 were from Trained Category and 300 from Un-Trained Category. There wereoverall 150 artisans in each district out of which 75 from Trained Category and 75 from Un-Trained Category.
As it can be seen in Table 4 and Figure 2in the trained category,42 percent of respondents were Muslims, 23 percent ofthe Other Backward Class, 21 percent from Schedule Caste and 14 percent from General. While in Un-Trained Artisans Category majority of the respondents were Muslims (59 percent), 18.6 percent ofthe Other Backward Class, 16.6 percent from Schedule Caste and 5.6 percent from General.
Table 4: Distribution of artisans according to their category
Districts Trained Artisans Category (% of overall respondents)
Un-Trained Artisans Category (% of overall respondents)
n GEN
OBC SC Minority (Muslims)
n GEN OBC SC Minority (Muslims)
Lucknow 75 24 34.6 41.3 75 21.3 32 46.6 Barabanki 75 24 22.6 32 21.3 75 1.3 26.6 72 Sitapur 75 2.6 1.3 1.3 94.6 75 2.6 2.6 94.6
Unnao 75 29.3 44 16 10.6 75 21.3 24 32 22.6
Overall 300 14 23 21 42 300 5.6 18.6 16.6 59 Note: - n denotes number of overall respondents
District-wise Comparative Analysis of the Status of Trained and Un-Trained Artisans
Image 7: Artisans of Goyala, Bakshi Ka Talab, Lucknow

P a g e | 16
General14%
OBC23%
SC21%
Muslims42%
Figure 2:Distribution of artisans according to their category
A. Trained Artisans B. Un-Trained Artisans
Figure 2shows that the percentage of Un-Trained Muslim artisan categorywas higher in comparison to the Trained MuslimArtisans category because during the survey it was found that many of Hindu beneficiaries were undertaken in various training project interventions funded by central /state government and other national and international agencies out of which 14 percent of the artisans were from the General community. It indicates the expansion of this income generating activity towards other than Muslims. As it is known that this work is more popular in the Muslim community and many of the Muslim women do not have any other choice of earnings except this art. They depend for their subsistence on it.
2. Working Condition and Socio-Economic Concern
2.1 Place of Work According to the work place artisans can be generally classified as Home based workerandCentre/Adda based worker. The home based worker: the artisans take the work from the traders/ middlemen/ organizations/ federations and complete it at their homes, whenever they have free time at hand. Centre based worker: the artisans come to a specific place and do the embroidery for a specific time period. The centre may be in the house of one of the artisans or it may be a separate unit all together.
General5%
OBC19%
SC17%
Muslim59%

P a g e | 17
Some of the artisans in a group of 2-5 work at specific place called Adda (local terms for Ari-Zardozi Work). The Ari-Zardozi work gives better return in comparison to simple embroidery work. The working hour at the centre is higher in comparison to working hours at home. Home: The Table 5 shows that the overall majority of artisans were working from home in both the categories. In trained categoryof artisans, Overall 67 percent were working from home while in untrained it was 67.7 percent. In Barabanki 96 percent of the artisans were working from home intrained category in comparison to 86 percent in untrained category. In most of the cases it was observed that artisans,those who were working from home spend less time than thoseof working at centre generally 2-4 hours in a day.The artisans working from home have a very less opportunity to bargain. There was no any mechanism found that can ensure minimum wage/fixed wage to artisans. Centre/Adda:Table 5 shows that overall 33 percent artisans in trained category were working at centre in comparison to 32.3 percent in untrained category.In Lucknow 54 percent of the artisans in trained category were working atcentres in comparison to 22 percent of artisans in untrained category. In Unnao it was 41 percent in trained category in comparison to 34 percent in Untrained Category. In Barabanki only 4 percent of the artisans were working at centre in trained category in comparison to 13.3 percent in untrained category.During the survey, it was observed that many of the artisans did not have proper light and space in their premises. They were working in very unhygienic conditions.
Table 5:Working place of artisans
Districts Trained Artisans (% of overall respondents)
Un-trained Artisans (% of overall respondents)
n Home Centre/Addas n Home Centre/Addas Lucknow 75 45.4 54.6 75 77.3 22.6 Barabanki 75 96 4 75 86.6 13.3 Sitapur 75 68 32 75 41.3 58.6 Unnao 75 58.6 41.4 75 65.3 34.6 Overall 300 67 33 300 67.6 32.3
Image 8: Artisans of MiyaSaraya, Kairabad, Sitapur

P a g e | 18
Home 67%
Centre /Addas
33%
Place of W
ork o…
Home68%
Centre/Addas
32%
A. Trained Artisans
Figure3:Working place of artisans
B. Un-Trained Artisans
Referring to the Figure 3it can be seen thatoverall, there was not any significant difference in working place of the artisans in both the categories.During the survey,it was found that new beneficiaries, those who have been never engaged in this type of activity were undertaken under the various project interventions undertaken by different agencies.Some of the NGOs provided various support services to the artisans after completion of the training program but it was not consistent. Most of the artisans were craving for more and regular work.
2.2 Working Hours Table 6 indicates that in the trained category of artisans, 57 percent were working 2-4 hours in a day out of which it was 77 percent in Barabanki, 68 percent in Sitapur, 57 percent in Unnao and 28 percent in Lucknow. It was least in Lucknow indicates that the working hours of artisans in Lucknow were higher in comparison to other districts. It indicates that the artisans of Lucknow had better access to work and market linkage in comparison to other districts. Overall, 35 percent of the artisans were working 4-6 hours per day and 6.6 percent of the artisans were working 6-8 hours per day in the trained category. In the untrained category of artisans, it was found that 48 percent were working 2-4 hours in a day when they were free from their daily chores while 35 percent of the artisans were working 4-6 hours in a day. Around 14 percent of the artisans were working 6-8 hours in a day. During our survey,it was found that some of the artisans were working more than 8 hours in a day out of which most of them were from the Chowk side of Lucknow.
Image 9: Artisans of Hasanganj, Unnao

P a g e | 19
0
10
20
30
40
50
60
70
2-4 hours/
day
4-6 hours/
day
6-8 hours/
day
% o
f Tra
ined
Art
isan
s
Working hours of artisans per day
0
10
20
30
40
50
60
2-4 hours/
day
4-6 hours/
day
6-8 hours/
day
>8 hours/
day
% o
f Un-
Trai
ned
Artis
ans
Working hours of artisans per day
Table6:Working hours of artisans per day
Districts Trained Artisans (% of Overall respondent)
Un-Trained Artisans (% of Overall respondent)
n 2-4 hours/day
4-6 hours/day
6-8 hours/day
n 2-4 hours/day
4-6 hours/day
6-8 hours/day
>8 hours
Lucknow 75 28 54.6 17.4 75 40 46.6 8 5.3 Barabanki 75 77.3 22.7 75 54.6 38.6 6.6 Sitapur 75 68 26.6 5.4 75 28 29.3 37.3 5.3 Unnao 75 57.3 38.7 4 75 69.3 25.3 5.3 Overall 300 57.6 35.6 6.6 300 48 35 14.3 2.66
A. Trained Artisans Figure4:Working hours of artisans per day
B. Un-Trained Artisans
Figure 4 shows that the majority of the artisans were working for 2-4 hours in a day in both categories when they were free from all types of daily chores. Most of them were home based workers. This percentage was higher in Trained Artisans category, one of its reasons was new beneficiaries living in remote/rural areas already engaged in agriculture, animal husbandry, horticulture and allied works were taken under various project initiatives. They did not find it as productive as they wanted it to be. Overall, there was no significant difference in the group of artisans working 4-6 hour/day. In the group of artisans working 6-8 hours/day, the percentage of untrained artisans were
as high around 14 percent in comparison to trained artisans (6.7 percent) because during the survey some of the respondentsbelonged to the Chowk side of Lucknow which was one of the most concentrated areas and the artisans were traditionally engaged in this work for their subsistence and had no any other source of income.
Image 10: Artisan of MiyaSaraya,Kairabad, Sitapur

P a g e | 20
2.3 For whom artisans were working
There were mainly three categories with those the artisans were working. They were middlemen, traders and Organizations/Groups/Federations.Table 7shows that in the trained category of the artisans 79 percent of them were working for middlemen. This proportion was higher in Barabanki, Sitapur and Unnao districts. Around 22 percent artisans were in direct contact with Traders in Lucknow whereas in Barabanki it was only 4 percent. Overall around 12 percent of the artisans were working with organizations/groups/federations out of which 40 percent were from Lucknow.
Table 7:Artisans working for whom
Districts Trained Artisans (% of overall respondent (n))
Un-Trained Artisans (% of overall respondent (n))
n Middlemen
Traders Organizations/Groups/ Federations
n Middlemen
Traders Organizations/Groups/ Federations
Lucknow 75 37.3 22.7 40 75 69.3 16 14.6 Barabanki 75 92 4 4 75 85.3 14.6 Sitapur 75 90.6 5.3 4 75 90.6 9.3 Unnao 75 97.3 2.6 75 93.3 6.6 Overall 300 79.3 8.6 12 300 84.6 11.6 3.6 In un-trained category of the artisans majority of them were working for middlemen cumulatively in all surveyed districts around 84 percent, whereas 12 percent were working for traders and 4 percent for Groups/ Institutes/ Federations. Most of the respondents who were working for Groups/ Institutes/ Federations were from Lucknow and Barabanki.
Image 11: Artisan of Rustam Nagar, Lucknow

P a g e | 21
A. Trained Artisans
Figure 5:Artisans working for whom
B. Un-Trained Artisans
The artisans, those who were working for middlemen had a very less opportunity to bargain. Many of the Muslim artisans were dependingbadly on this craft for their subsistence and they did not have any other source of income. During FGDsthey told that they were lacking regular access of work and it varies from season to season. They were craving for more and regular work with better wages. They were asking for government support in this regard.
Figure 5shows that the majority of the artisans were working for Middlemen in both the categories. This percentage was higher in un-trained artisans’ category around 85 percent in comparison to trained artisans category because 12 percent artisans in trained category were working for organizations/groups/federations that can be seen as support services by NGOs and other implementing organizations working for the welfare of handicraft artisans and also asa positive project impact indicator.
79%
9%
12%
MiddlemenTradersOrganizations/ Groups/ Federations
85%
11%4%
MiddlemenTradersOrganizations/ Groups/ Federations
Image 12: Artisan of Prahaladpur, Laharpur, Sitapur

P a g e | 22
2.4 Estimated Wages The wages were negotiable and generally not fixed and depended on the piece of work. Referring to the Table 8, in the trained category of artisans overall 41 percent of the artisans were found in the wage group of Rs 10-20 per day. It was 69 percent in Barabanki, 40 percent in Sitapur, 49 percent in Unnao and 5 percent in Lucknow. Overall, 28 percent of the artisans were inthe wage group of Rs. 20-40 per day, 11
percent were in wage groupRs. 40-60 per day, 13 percent of the artisans were in wage groupRs. 60-80 per day and around 6 percent of the artisans were in the wage group of Rs 80-100 per day in the trained category. In Barabanki only 6 percent artisans were in the wage group of Rs 40-60 per day, whereas it was 20 percent in Lucknow, 10 percent in Unnao and 8 percent in Sitapur.
In Barabanki there were no artisans found in the wage groupof Rs 60-80 and 80-100 per day, whereasit was 9 percent in Lucknow, 17 percent in Sitapur and 26 percent in Unnao. There were 14.6 percent artisans in Lucknow, 6.6 percent in Sitapur and 4 percent in Unnao found in the wage group of Rs 80-100 per day. In most of the cases, wages were not enough to satisfy their bare minimum needs, but the artisans continue to work and could not bargain.
Table8:Wage Group (WG) of artisans
Districts Trained Artisans in the Wage Group (WG) (% of n)
Un-Trained Artisans in the Wage Group (WG) (% of n)
n 10-20 Rs/ day
20-40 Rs/ day
40-60 Rs/ day
60-80 Rs/ day
80-100 Rs/ day
n 10-20 Rs/ day
20-40 Rs/ day
40-60 Rs/ day
60-80
Rs/ day
80-100 Rs/ day
>100 Rs/ day
Lucknow 75 5.3 50.6 20 9.3 14.6 75 2.6 57.3 20 9.3 4 6.6 Barabanki 75 69.3 24 6.6 75 18.6 57.4 21.3 2.7 Sitapur 75 40 28 8 17.3 6.6 75 26.6 17.3 28 13.4 14.6 Unnao 75 49 9.4 10.7 26.7 4 75 56 8 17.3 13.3 5.3 Overall 300 41 28 11.3 13.3 6.3 300 26 35 21.7 9.6 6 1.6
Image 13: Artisans of Mahamudabad, Sitapur

P a g e | 23
In the un-trained category of the artisans overall 26 percent of the artisans were in the wage group of Rs 10-20 per day, 35 percent were in wage group Rs. 20-40 per day, 21.7 percent were in wage group Rs. 40-60 per day, 9.6 percent were in wage group Rs. 60-80 per day and 6 percent were inwage group Rs. 80-100 per day. Around 6.6 percent of the artisans of Lucknow were earning more than Rs. 100 per day. They all were from the Chowk side of Lucknow. Chowk is the centre point of this art. During the survey, it was observed that the artisans, engaged in Ari Zardozi work were earning better wages in comparison to simple embroidery work. Ari Zardozi work had more demand in the market and gives better earning in comparison to simple embroidery work.
A. Trained Artisans Figure6:Wage Group (WG) of artisans
B. Un-Trained Artisans
Referring to the Figure 6, it can be seen that the percentage of ‘trained artisans’ category in Rs. 10-20 per day income/wage groupwas higher, i.e. 41 percent in comparisonto 26 percent of untrained artisans. One of its reasons was new beneficiaries who had never been engaged in this kind of work and had any other alternative income.Many of them were from Hindu community who were selected under various training project initiatives and they did not find this work as productive as they wanted it to be. Whereas in the wage groupof Rs. 60-80 per day the percentage of trained artisans were higher (13.3 percent) in comparison to un-trained artisans (9.6 percent)which can be seen as indicators of the positive impact of projects. There were also few artisans in untrained category,who were earning more than Rs 100 per day in Chowk side were highly traditionally skilled. The artisans, who were engaged in Ari Zardozi work, were earning better wages in comparison to simple embroidery work. The wages were depending on the duration of the work and the time devoted by artisans for this craft and artisans’ own capabilities and professionalism.
05
1015202530354045
10-20 Rs/day
20-40 Rs/day
40-60 Rs/day
60-80 Rs/day
80-100 Rs/day
% o
f Tra
ined
Art
isan
s
Wage Group
0
5
10
15
20
25
30
35
40
10-20 Rs/day
20-40 Rs/day
40-60 Rs/day
60-80 Rs/day
80-100 Rs/day
>100 Rs/day
% o
f Un-
Trai
ned
Artis
ans
Wage Group
Image 14: Artisan of Bishunpur, Deva, Barabanki

P a g e | 24
2.5 Savings, wages and wage rate
The majority of the artisans were not satisfied with the wages they were earning in compensation for their work. They did not find it enough even to fulfil their basic needs. In trained category of the artisans,Table 9 indicates that overall only 23 percent of the artisans said that they have some monthly savings out of which 42.6 percent were from Lucknow, 16 percent were from Barabanki, 10.6 percent were from Sitapur and 21.3 percent were from Unnao. Overall, 19 percent of the artisans said that they are satisfied with the wage rate out of which 40 percent from Lucknow, 8 percent from Barabanki, 13.3
percent Sitapur and 14.6 percent from Unnao. In trained artisans’ category only 14.6 percent of the artisans said about some increase in wages during last five years. Out of these respondents, most of them were in direct contact with the traders.It was observed that most of the artisans who responded positively towards wage rate satisfaction and monthly savingswere unmarried and had no such family responsibilities. In untrained artisans’ category, only 11.3 percent of the artisans said that they had some monthly savings and only 11.3 percent were satisfied with the wage rate. However, 10.6 percent of the artisans had some increase in wages during the last five years. It was observed that many of the respondents who were satisfied with the wage rate were un-married in this category also.
Table9:Responses of artisans on savings, wages and wage rate Districts
Trained Artisans(% of n) Un-Trained Artisans(% of n) Monthly Savings
(n=75 in each district)
Satisfaction to wage
rate (n=75)
Increase in wages (n=75)
Monthly Savings (n=75)
Satisfaction to wage rate
(n=75)
Increase in wages (n=75)
Lucknow 42.6 40 13.3 8 5.3 6.6 Barabanki 16 8 8 6.6 16 14.6
Sitapur 10.6 13.3 9.3 17.3 14.6 12 Unnao 21.3 14.6 8 13.3 9.3 9.3
Overall 22.6 19 14.6 11.3 11.3 10.6 Overall, 22.6 percent of the trained artisans said that they had some monthly savings in comparison to 11.3 percent in un-trained artisans’ category.Overall, 19 percent of the artisans in the trained category were satisfied with the wage rate in compared to 11 percent in untrained category. It can be seen as an indicator of the positive impact of the projects. However, it was observed that the portion of unmarried artisans in the trained category was bigger than in the untrained category of artisans during our survey because un-married beneficiaries were taken-up under various training project initiatives. Many of them were from Hindu community and they were also engaged in some other productive work like agriculture, animal husbandry, horticulture etc.

P a g e | 25
2.6 Marketing Concern Table 10 shows that overall 8 percent of the artisans in the trained category some time sell their products directly to customers at various platforms like Exhibitions, Mahotsav, fair, etc. It was 14.6 percent in Lucknow, 8 percent in Barabanki, 5.3 percent in Sitapur and 4 percent in Unnao. Overall, 5.6 percent of the artisans said that they participated in exhibitions organized by various government agencies in order to have direct exposure to buyers. Exhibitions provide a better platform to artisans to understand the current markettrend and it also improves their marketing skills. Most of the artisans did not have opportunities and capabilities to produce and sell their products on its own. Most of the artisan did not find any such mechanism to help them to produce and sell on their own. Overall, only 6.3 of the artisans in un-trained category any time sold their products directly to customers.In un-trained category of artisans none of them participated in any exhibitions and had any exposure to the market.
2.7 Artisans who were member of Self Help Group Table 11 shows that overall 14.6 percent artisans were member of SHGs in the trained category in comparison to only 1.6 percent in untrained category. It can be seen as a positive project impact indicator. Self Help Group (SHGs) promotes saving habit in poor artisans and provide easy inter-loan for various needs.
Table 10:Responses of artisans on marketing concerns Districts Trained Artisans
(% of n) Un-Trained Artisans
(% of n) Sell by artisans themselves (n=75)
Participation in Exhibition (n=75)
Sell by artisans themselves (n=75)
Participation in Exhibition (n=75)
Lucknow 14.6 5.3 4 Barabanki 8 12 10.6 Sitapur 5.3 5.3 5.3 Unnao 4 5.3 Overall 8 5.6 6.3
Table 11:Artisans who were members of Self Help Group (SHG)
Districts Trained Artisans Member of SHG
(% of n)
Un-Trained Artisans
Member of SHG (% of n)
Lucknow 1.3 5.3 Barabanki 28 Sitapur 28 1.3 Unnao 1.3 Overall 14.6 1.6 Image 16: Artisan of Palhari, Banki,
Barabanki

P a g e | 26
2.8 Loan/ Debt/Borrow Table 12 shows that the majority of the artisansborrowedloan/debt/borrow due to various needs.It was overall, 55.6 percent in trained category and 56 percent in untrained category. Overall in the trained category 79 percent of the respondents borrowed it from their relatives, 8.5 percent from groups/federations/ institutions and 11.3 percent from middlemen/traders and only 0.5 percent borrowed it frombanks, whereas in the untrained categoryOverall, 67 percent borrowed from their relatives, 3.6 percent from groups/federations/ institutions and 27.6 percent from middlemen/traders and only 1.2% borrowed it frombanks. Most of the artisans avoid borrowing
from middlemen or traders. Theywere afraid that they can be badly entangled in the web of middlemen/traders and it can worsen their condition. There were only 1.2 percent of the artisans in un-trained category and 0.5 percent in trained category who took loan from a bank. During the survey, it was observed that most of the artisansneither found it easy to take loans from banks nor they were aware about the various formalities even they were scared of it. The percentage of institutional loans in the trained categorywere slightly better than un-trained category which showsa positive impact indicator of training and support initiatives taken up by various agencies for the artisans.
Table 12:Loan/debt/borrow by artisans
Districts Trained Artisans(% of n) Untrained Artisans(% of n) n Middle
Man/ Traders
Groups / Federations / Institution
Relatives/ Friends
Bank n Middle Man/ Traders
Groups / Federations / Institution
Relatives/ Friends
Bank
Lucknow 50 8 2 90 56 19.6 7.1 73.2 Barabanki 53 11.4 20.7 66 1.8 48 33.3 2 60.4 4.2 Sitapur 28 21.4 7.1 71.4 38 29 2.6 68.4 Unnao 36 8.3 91.6 26 36.6 65.4 Overall 167 11.3 8.5 79.6 0.5 168 27.9 3.6 67.3 1.2
3 Status of Artisan Card / Health Insurance Card
The artisan cardis the identity proof of artisans and it entitlesthem to avail thevarious types of government benefits. According to the survey Table 13 shows that overall 31 percent artisans in the trained category had artisan card out of which it was 38 percent in Lucknow, 56 percent in Barabanki and 30 percent in Sitapur. Most of the artisancards were made under the project initiatives of development commissioner handicrafts and under the STEP project of ministry of women and child development. Although many of these artisans did not have enough information regarding the use of
Image 17: Artisans of Rendua, Banki, Barabanki

P a g e | 27
artisan card to get benefits from it. The majority of the artisans were not aware about health insurance card and they did not have it either. In un-trained category it was found that most of the artisans were not aware about artisan card and health insurance card and they did not have it.During the survey and focus group discussions they were told about how to get artisan card and avail the benefitsof it. Most of the artisans were eager to get their artisan card issued.They did not have any health risk cover. Many times their economy ends in overall fiasco whenever the serious health problem occurs.
4. Education and Account Practices
4.1 Educational Status of Artisans
In our survey majority of the respondents were literate as it can be seen in Table 14,in trained category Overall, 83 percent were literate. Out of which 14 percent obtained primary level education, 19 percent upper primary, 16 percent high school and 33 percent studied high school and above. During the study literate artisans were preferred in the study so that the real situation of artisans can be known.
Table 13:Status of Artisan Cards/ Health Insurance Card Districts
Trained Artisans Category (% of n)
Un-Trained Artisans Category (% of n)
Artisan Card
Holders
Health Insurance
Card Holders
Artisan Card Holders
Health Insurance Card Holders
Lucknow(n=75)
38.6 2.6
Barabanki(n=75)
56
Sitapur(n=75)
30.6
Unnao(n=75)
Overall 31.3 0.6 Image 18: Artisan of Bishunpur, Deva, Barabanki showing her ArtisanCard
Image 19: Discussion with artisans of Mujasha, Malihabad, Lucknow

P a g e | 28
5th 15%
5th-8th19%
10th16%
>10th33%
Illierate
17%5th26%
8th20%
10th 11%
>1016%
Illiterate27%
Table 14:Educational Status of Artisans
Districts
Trained Artisans(% of n) Untrained Artisans(% of n) n Primary Upper
Primary High
School Above
High School
Illiterate
n Primary Upper Primary
High School
Above High
School
Illiterate
Lucknow 75 18.7 22.7 18.6 34.6 5.4 75 28 24 14.7 10.7 22.6 Barabanki 75 20 21.3 14.6 16 28 75 21.3 21.3 4 10.7 42.7 Sitapur 75 12 24 5.3 36 22.6 75 41.3 16 5.4 9.3 28 Unnao 75 8 9.3 24 48 10.6 75 14.6 20 17.3 33.3 14.7 Overall 300 14.7 19.3 15.7 33.6 16.7 300 26.4 20.3 10.3 16 27
In un-trained category 73 percent of the respondents were literate. Out of which 26 percent of the respondentshada primary level of education, 20 percent upper primary, 10 percent high school and 16 percent studiedmore than high school.
Figure7:Educational status of artisans
A. Trained Artisans B. Un-Trained Artisans
Referring to the Figure 7it can be seen that only 17 percent of the artisans in trained category were illiterate in comparison to 27 percent in untrained category. It shows educated beneficiaries were preferred under the various training initiatives. Overall, 33 percent of the artisans had studiedmore than high schoolin the trained category in comparison to 16 percent in the untrained category.
P a g e | 29
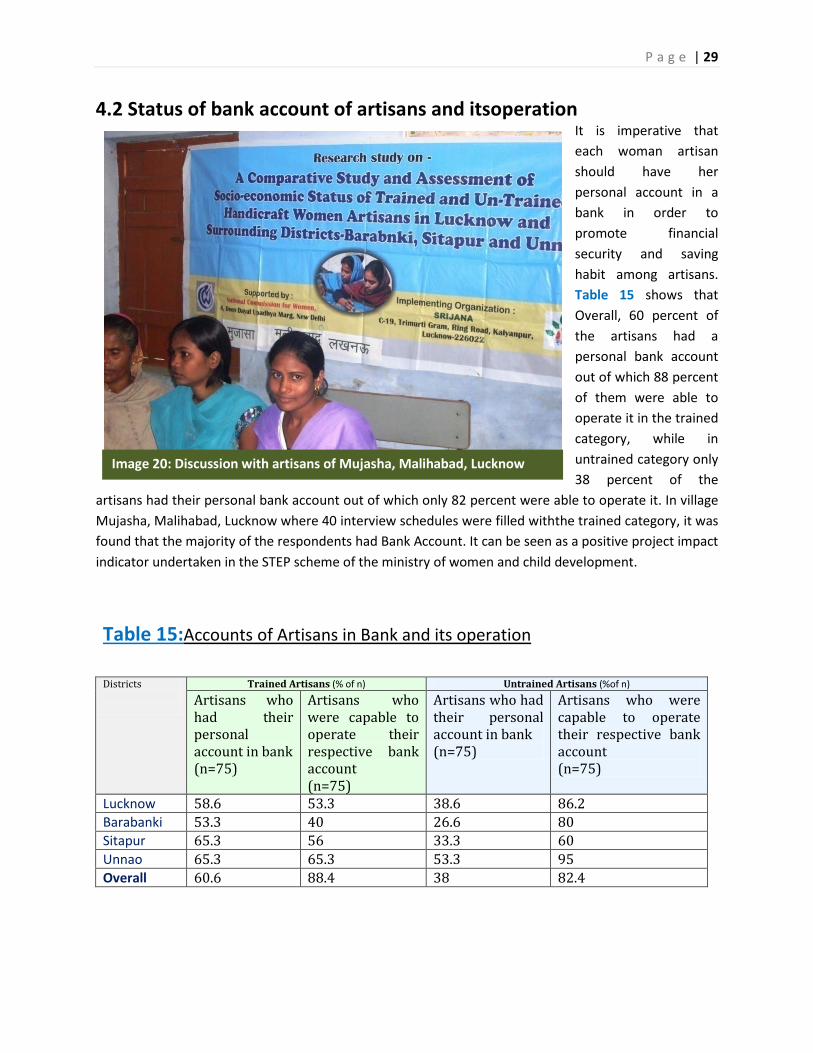
4.2 Status of bank account of artisans and itsoperation It is imperative that each woman artisan should have her personal account in a bank in order to promote financial security and saving habit among artisans. Table 15 shows that Overall, 60 percent of the artisans had a personal bank account out of which 88 percent of them were able to operate it in the trained category, while in untrained category only 38 percent of the
artisans had their personal bank account out of which only 82 percent were able to operate it. In village Mujasha, Malihabad, Lucknow where 40 interview schedules were filled withthe trained category, it was found that the majority of the respondents had Bank Account. It can be seen as a positive project impact indicator undertaken in the STEP scheme of the ministry of women and child development.
Table 15:Accounts of Artisans in Bank and its operation
Districts
Trained Artisans (% of n) Untrained Artisans (%of n) Artisans who had their personal account in bank (n=75)
Artisans who were capable to operate their respective bank account (n=75)
Artisans who had their personal account in bank (n=75)
Artisans who were capable to operate their respective bank account (n=75)
Lucknow 58.6 53.3 38.6 86.2 Barabanki 53.3 40 26.6 80 Sitapur 65.3 56 33.3 60 Unnao 65.3 65.3 53.3 95 Overall 60.6 88.4 38 82.4
Image 20: Discussion with artisans of Mujasha, Malihabad, Lucknow

P a g e | 30
5. Health Related Issues
5.1 Sensitization on Health& Hygiene The status of participation in the health sensitization campof artisans has been shown in Table 16,it indicates that overall, 32 percent of the artisans participated in the health sensitization camp in the trained category in comparison to only 11 percent of artisans in untrained category. By this it was obvious that trained artisans were more aware towards various initiatives undertaken for them in comparison to the untrained category.
5.2 Status of Institutional Deliveries (Childbirth) Institutional deliveries means ensuring that every woman who is pregnant reaches a hospital or medical facility in time.Table 17 shows that 13 percent of deliveries took place at artisans’ home in trained category in comparison to 30 percent in un-trained category of artisans. It shows that the trained artisans were more aware about institutional delivery in comparison to the untrained artisans. Overall, 21 percent deliveries of married women in the trained category reported in a private hospital, 54 percent in government hospital and 11.3 percent in both government and private while untrained category it was reported as 12 percent in a private hospital, 55.6 percent in government hospital and 1.1 percent in both government and private hospital in our survey.
Table 17:Status of pregnant women and delivery of babies
Districts Trained Artisans(% of n) Untrained Artisans(% of n) n
At their
Home
In Private
Hospital
In Govt. Hosp
Both in Govt. & Private
Hospital
n
At their Home
In Private Hospit
al
In Govt. Hosp
Both in Govt. & Private
Hospital
Lucknow 29 17.2 13.8 37.9 31 66 30.3 12.1 57.5 Barabanki 50 12 20 60 8 60 20 18.3 58.3 3.3 Sitapur 24 16.6 8.3 75 39 30.7 2.5 66.7 Unnao 12 75 25 13 77 23 Overall 115 13 21.7 54 11.3 178 30.3 12.9 55.6 1.1
Table 16:Health Sensitization Camp
Districts
Trained Artisans Yes (% of n) (n=75 in each district)
Un-Trained Artisans Yes (% of n) (n=75 in each district)
Lucknow 38.6 9.3 Barabanki 21.3 10.6 Sitapur 41.3 14.6 Unnao 28 12 Overall 32.3 11.6

P a g e | 31
6. Status of House and Sanitation
Table 18 and Figure 8 show that 54 percent of the artisans had Semi Pucca House in the trained category in comparison to 51 percent in untrained category. In trained category 32 percent of the artisans had Pucca House and 13 percent of the artisans had Kachacha House. Whereas in untrained category 25 percent of the artisans had Pucca House and 24 artisans had Kachcha house.The artisan of the Lucknow had the highest percentage of Pucca houses in both categories- 48 percent and 41 percent respectively. While Sitapur had the highest percentage of Kachacha houses in both
categories. It was observed that many of the artisans did not have proper light and space and were working in very unhygienic condition. It was badly needed for those who were working at Addas.
A. Trained Artisans Figure8:Status of House
B. Un-Trained Artisans
Kachcha House
13%
Pucca House32%
Semi Pucca House55%
Kachcha House24%
Pucca House25%
Semi Pucca House51%
Table 18:Status of House Districts
Trained Artisans(% of n) Un-Trained Artisans(% of n) n Kachcha
House Pucca House
Semi- Pucca House
n Kachcha House
Pucca House
Semi- Pucca House
Lucknow 75 9.3 48 42.6 75 16 41.3 42.6 Barabanki 75 12 37.3 50.6 75 26.6 20 53.3 Sitapur 75 21.3 29.3 49.3 75 41.3 21.3 37.3 Unnao 75 10.7 14.7 74.6 75 14.6 16 69.3 Overall 300 13.3 32.3 54.3 300 24.6 24.7 50.7
Image 21: Artisan of Anawari, Nindura, Barabanki

P a g e | 32
Table 19 shows that overall 48.6 percent of the artisans had a toilet in their premises in the trained artisan category, while in the un-trained category, 47.6 percent of the artisans had a toilet in their premises. It was observed that percentage availability of toilets was higher in urban area in comparison to rural area. In Barabanki only 20
percent artisans had a toilet in their premises because most of the trained artisans interviewed during the survey were belonging to rural areas. The 80 percent respondents under trained category in Sitapur district had a toilet in their premises; most of them were fromurban areas.
Table 19:Availability of Toilets in Artisans Premises Districts
Trained Artisans Premises
Yes (% of n) (n=75 in each district)
Un-Trained Artisans Premises
Yes (% of n) (n=75 in each district)
Lucknow 57.3 80 Barabanki 20 26.6 Sitapur 80 41.3 Unnao 37.3 42.6 Overall 48.6 47.6
Image 22: Sensitization and FGD with artisans of Novakheda, Sidhauli, Sitapur

P a g e | 33
7. Findings based on discussions with Middlemen and Traders
Overall, 16 middlemen and 8 traders were interviewed during the survey of the districts. It was found that there was mostly three- tier system. In this system traderwasthe chief regulator.
There wasa substantial difference in selling price of the completed article and the actual cost. The major part of this difference goes into the hand of the traders. The traders normally work with 8-12 agents/middle men. Each middle man/agent works with 10-50 artisans. Artisans are the main functional unit of the Industry. However, in some cases traders make direct contact with artisans or artisans make direct contact with the traders, in this case, both traders and artisans get the best return on their work. Most of the agents/middle men work with artisans on the basis of commission. The payment is made on the basis of pieces prepared by the artisans and it is mostly in cash. Most of the artisans want to work from their home in free time, but they have very limited opportunity to bargain. In some cases middle men and traders provide loan/debt to artisans in advance. Many times it happens that due to the immense pressure of needs and limited opportunity the artisans who took loan/debt from middle men/traders fail to return the loan/debton time and get entangled in this cycle. In the changing situation of market pattern and product quality, the trader prefers artisans who are more capable and skilled. Some of the embroideries likeChikankari have good market in summer while some others like Ari-Zardozi, Mukesh etc. have a good marketat the time of festivals and marriage season. The traders wished that they should get relaxation in different type of taxes from the government. Most of the traders were not performing any activities for the welfare of handicraft artisans except wage based work.
Traders
Middle Man/Agent (i)
Artisan (i) Artisan (...)
Agent (ii) Agent (...)
Figure 9: Framework of the Industry

P a g e | 34
IV Comprehensive analysis of various projects undertaken for the welfare of handicraft artisans

P a g e | 35
1. Details of overall number of trained artisans interviewed under the various training projects/schemes undertaken for the welfare of handicraft artisans
As shown in Table 20.Overall 300 artisans were interviewed under trained category, out which 75 artisans were interviewed in each district.
Table 20:Details of the number of trained artisans interviewed under the various projects/schemes undertaken for the welfare of handicraft artisans Name of District
Name of Block
Name of different Scheme/ project initiatives Numbers of respondent
Overall Numbers of respondent
Lucknow Malihabad Support To Training And Employment Programme For Women (STEP) Scheme under Ministry of Women and Child Development, Government of India
33 75
Malihabad Skill up-gradation project Scheme under Jan Shikshan Sansthans (JSSs) the Ministry of Human Resource Development (HRD), Government of India
07
Bakshi Ka Talab
Skill Enhancement Training Program from Telco
29
Lucknow Urban Area
Skill Up-gradation program from District Urban Development Authority (DUDA) Uttar Pradesh
6
Barabanki Deva Design, Development Workshop Scheme under Development Commissioner (DC) Handicraft, Government of India
34 75
Nindura Skill up-gradation program from Art Action, Singapore
18
Deva Integrated Design, Development Workshop Scheme under DC Handicraft, Govt. of India
11
Banki Skill Enhancement Training Program from Telco
12
Unnao Mohan Skill up-gradation project implemented by JSSsunderHRD, Government of India
75 75
Sitapur Mahmudabad
Skill up-gradation from District Urban Development Authority (DUDA) Uttar Pradesh
09 75
Skill up-gradation project implemented by JSSsunderHRD, Government of India
19
Skill up-gradation from St Josef Community Centre
25
Design, Development Workshop Scheme under DC Handicraft, Govt. of India
22
300
COMPREHENSIVE ANALYSIS OF VARIOUS PROJECTS UNDERTAKEN FOR WELFARE OF HANDICRAFT ARTISANS

P a g e | 36
2. Duration of the Training Projects Table 21 shows that the training duration of overall, 34 percent of the artisans in the trained category wasfrom 1/2 month to 3 months while training duration of 66percent artisans was 3-6 months. Shorter duration training hasa lessOverall impact in comparison to longer duration training.
3. Status of Resources/Inputs provided to artisans during training
Various types of training inputs/resources are provided by different departments/ government agencies (central/state)/corporate (under CSR) and other bilateral agencies to ensure smooth running of training programs and for a positive impactof the project on the lives’ of the poor. The stipend is an important provision made under the project for poor beneficiaries in order to compensate their loss when they are away from their productive works. It also minimizes dropouts of trainees during the training program and ensures successful completion
of the training program. Table 22, shows that only 16.6 percent of the trainees’ artisans said that they received a stipend during training programs and 83.4 percent said that they did not get any stipend during the training programs. However, during the focus group discussions and referring to the table 20, 55.6 percent of the trainees participants said that there was no provision of stipend made under the project for them, out of which 33.6 percent (101 respondents) were under the training initiative of Jan Shikshan Sansthans (JSSs) (a ministry of HRD initiatives), 13.6 percent, (42 respondents) under the training initiative of Telco, Lucknow (under CSR) and 8.3 percent (25 respondents) were training initiative St Josef community centre Sitapur. The majority of the respondent told that they had been provided raw material and equipments.
Table 21: Duration of the Training Project
District n Time duration of the training (In percentage ofoverall respondents (n))
1/2 month, -3 months 3month-6moths Lucknow 75 4 96 Barabanki 75 70 30 Sitapur 75 64 36 Unnao 75 - 100 Overall 300 34 66
Image 24: Artisans of Malihabad, Lucknow during FGD

P a g e | 37
The survey indicates that only 56 percent of the artisans were provided training certificate after completion of the training program. The various reasons (during the FGDs) behind non-receipt of the certificate were
• Dropouts of trainee participants before completion of the training programs, • Non adherence of the implementing organization towards the terms and conditions made
under the projects, and • No obligatory provision made under some training programs.
Table 22: Resources/Inputs received by artisans during training District Various inputs received by artisansduring the training (%)
(n=75 Respondents each district) Stipend
(n=75) Raw Material
(n=75) Equipments
(n=75) Refreshment
(n=75) Certificate
(n=75) Lucknow 14.6 97.3 93.3 54.6 57.3 Barabanki 20 98.6 98.6 - 14.6 Sitapur 32 64 96 32 56 Unnao 100 100 - 97.3 Overall 16.6 90 97 21.6 56.3
4. Exposure Visits
Exposure visit is one of the important components of effective and integrated training projects. It provides platform for better learning and adoption in the area of skill enhancement and marketing.Table 23 shows thatoverall only 11 percent of the artisans had the opportunity to participate in exposure visits. It was 19 percent in Lucknow, 17 percent in Sitapur and only 8 percent in Barabanki.
Table 23:Status of Exposure visits
Sr. Name of District
n Exposure Visits (n=75) No (%)
1 Lucknow 75 14(18.6) 2 Barabanki 75 6 (8) 3 Sitapur 75 13 (17.3) 4 Unnao 75 - Overall 300 33 (11)
Image 25: Artisan of Mujasha, Malihabad, Lucknow

P a g e | 38
General Sensitization
The training programs which integrate general sensitization on the issues related to life skill education havea greater and positive impact on the lives of beneficiaries. Table 24 shows that only 28percent of the artisans responded that they were sensitized on some of such issues. The General sensitization program could have covered issues of rights and entitlement. As we know that major portion of the artisans were from Muslim community. During FGD it was found that most of them were not aware about various schemes available for them.
Influence of the various project initiatives on lives of poor
6.1 Artisans’ responses towards the benefits of the training programs
Table 25 indicates that 50 percent ofrespondents availed overallbenefits in terms of income, skill and improved theirliving standard and economic conditions. It was 93 percent in Lucknow, 24 percent in Barabanki, 44 percent in Sitapur and 44 percent in Unnao. There were various causes of low percentage in Barabanki. Table 21 shows that the 34 percent of the training was of very short duration ranging 1/2 month to 3 months. The impact of shorter duration training often quickly lost if there is no follow-up and support service. In the rural areas, the beneficiaries who were already engaged in agriculture related activities did not find it as beneficial as they wanted it to be. It was observed during the survey at many places that there were not any direct market linkage and resource support except middlemen.
Table 25:Benefits of the training programs
Sr. Districts n Overall Benefits respondents in each district
No (percent)
Benefits in terms of skill enhancement only
No (%)
1 Lucknow 75 70 (93.3) 05(6.6) 2 Barabanki 75 18 (24) 57(76) 3 Sitapur 75 30(44) 45(60) 4 Unnao 75 33(44) 42(56) Overall 300 151 (50.4percent) 149(49.6%)
Table 24:Status of general sensitization during training Sr. Name of District n General Sensitization
No (%) 1 Lucknow 75 31 (41.3) 2 Barabanki 75 24 (32) 3 Sitapur 75 29 (38.6)
4 Unnao 75 -
Overall 300 84 (28%)

P a g e | 39
6.2 Analysis of project influence based on responses on various project indicators
Table 26 shows Overall project influence on the lives of the poorartisans based on various project indicators during our survey. Overall, 61 percent of the artisans in the trained category had their personal bank account in comparison to 38 percent in trained category. It happened due to various initiatives and efforts taken up by implementing agencies during the project interventions. Overall, 6 percent of the artisans participated in exhibitions to get real experience of the market and to improve the marketing skill. Overall, 31 percent artisans had Artisan Card in the trained category where it was nil inthe untrained category.
Table 26:Analysis of project influence based on response on various project indicators Impact Indicators Category of Artisans
(Percentofoverall respondents) Trained Artisans Untrained Artisans
Artisans who had own bank account
61 38
Participation in Exhibitions
6 -
Artisans who had their Artisan Card
31 -
Artisans who were members of the SHGs
15 2
Artisans response towards monthly savings
23 11
Artisans response towards satisfaction with wage rate
19 11
Artisans working with organizations/federations/groups
12 4
Delivery of babies in hospitals
87 70
Participation in health and hygiene sensitization camp
32 11

P a g e | 40
Although during FGD it was found that most of the artisans were not aware enough to avail the benefit of Artisan Card. Overall, 15percent of the artisans in the trained category were member of SHGs in comparison to 2 percent in untrained category. Overall, 23 percent of the artisans in the trained category responded that they had some monthly saving, in comparison to 11percent of the artisans in untrained category, however many of them were unmarried. In trained category 12 percent of the artisans who were working with organizations/federations/groups in comparison to 4percent artisans in untrained category. The artisans got better forward and backward linkages with organizations/federations/groups. In our survey, 87 percent institutional deliveries reported in the trained category in comparison to 70 percent in un-trained category. Overall, 32 percent of the artisans participated in the health sensitization camp in the trained category in comparison to only 11 percent of artisans in untrained category. By this it was obvious that trained artisans were more aware towards various initiatives undertaken for them in comparison to theartisans of untrained category.
5. Gaps in various project interventions • The fact has emerged from the analysis that the major portion of the women artisans working
under this craft were Muslims (Table 4: 42 percent in trained category and 59 percent in
untrained category). On one side, they were earning low wages on the other they were not
aware about the various government schemes available for them so that they could claim
benefits. They were also facing various social problems. There wasa lack of comprehensive
initiatives focusing their issues.
Image 26: Sensitization and FGD with artisans of Goyala, BKT, Lucknow
P a g e | 41
• The artisans were not aware enough to avail the benefits of government schemes
available for them to the extent they should have.
• Since majority of artisans were working for middlemen (Table 7:Overall, 79 percent in
trained category and 84 percent in untrained category), artisans had a very less
opportunity to bargain.The majority of the artisans lacks institutional support services.
• The very less percentage of artisans (Table 22:only 17 percent of the artisans in the
trained category)received a stipend during training program which is an important
component of any training program in order to compensate the loss of poor artisans
when they are away from their work.
• A big portion of artisans (Table 22:44 percent of in thetraining category) was not
provideda certificate after completion of the training program.
• Very less percentage (Table 23:11 percent in the trained category) of artisanshad the
opportunity to participate in exposure visits.
• The very less percentage of the artisans (Table 24: 28 percent of the artisans in the
trained category) responded that they had the opportunity to participate in general
sensitization camps covering various important issues pertaining to improving their lives
except training in skill development.
• The major percentage of artisans (Table 25: 49.5 percentof the artisans in the trained
category)said that they had only skill enhancement, but they did notget any positive
change in their income. It pulls our attention on various causes andshortcomings of
project implementation. The probable reasons could have been related to selection of
beneficiaries, forward and backward linkages, follow-up of the training program,
support services etc.
• Many of the artisans did not have their personal bank account (Table 15:39.3 percent in
the trained categoryand 62 percent in un-trained category).
• The very less percentage of artisans (Table 10:only 5.6 percent of the artisans in the
trained category) participated in exhibitions.

P a g e | 42
V Major findings during observations and FGDs

P a g e | 43
The FGDs were organized in each respective village after completion of individual interview of artisans. During FGDs sensitization campswere also organized on women related issues,including sensitization regarding the rights and entitlements of the artisans at organization level.But thetime duration of these camps were veryshort.
Mujasha, Malihabad, Lucknow • The artisans were demanding training on other
Income Generating Activities to ensure job security and to increase their income.
• The artisans had very less opportunity to bargain because they depend on middlemen and traders to work and wages.
• Most of the artisans did not have regular work. They want more and regular work.
• Although there was anincrease in income after training, but they did not find it sufficient.
• They were wishing for marketing support and direct contact with the traders.
• It was found that NGOs working in that area promoted savings habit and facilitated the artisansin opening their personal account in the bank.
Goyala, Bakshi Ka Talab, Lucknow • The artisans were demanding sensitization
program on various issues related to women. • The artisans had no access to direct marketing. • The artisans were desiring for regular and more
work. • Most of the artisans did not have toilets in their
premises owing to which they face serious health and privacy problems. The area is under process of urbanization.
• The artisans were demanding for training on other IGA activities to improve their wages/income and to diversify their skills.
• Most of artisans did not have artisans card and health insurance card, during the FGD and general sensitization program all had shown interest to get these.
MAJOR FINDINGS DURING OBSERVATIONS, AND FOCUS GROUP DISCUSSIONS
Image 28: FGD with Artisans of Mujasha, BKT, Lucknow
Image 29: FGD with Artisans of Gyala, BKT, Lucknow

P a g e | 44
Janata Nagari, Musalchi Tola and Madeyaganj, Lucknow (Urban Areas)
• Some of the artisans who were young and energetic wished to do this work at large scale, butthey were lacking resources to manage it.
• Most of artisans did not have artisans card and health insurance card. After the FGD and general sensitization program they showed interest to get these.
• Some of the artisans were asking for economic support in marriage of their daughter.
• Artisans were living in very un-hygienic conditions.
• Most of the artisans were belonging to BPL families and some of them did not have a ration card.
Rustam Nagar (Urban Area)
• This locality is situated in an urban area of Lucknow near Chowk.This place can be calledthe heartof this craft.
• Most of the artisans were working at Adda-Ari and Zari-Zardozi works.
• Most of them had no proper working space in their premises. Artisans were living in accommodations of less than 400 square feet area.
• Most of the artisans were observed malnourished and were living in an unhealthy condition.
• Most of the artisans did not have artisan card and health insurance card.
• Most of the artisans were belonging to BPL families. • Most of the female artisans had no other income/wages and were depending on middlemen for
work and wages.
Katara Visen Beg and Noor Badi Harwad, Lucknow (Urban Area) • Most of artisans did not have artisans card or health
insurance card. • Most of the artisans did not have proper working
space, especially in ARI and ZARDOZI work. • The majorities of the artisans wereMuslimsand were
not aware about the various government schemes available for them.
• Many of the artisans were belonging to BPL families, but they did not have Ration Card.
Image 30: FGD with artisans of MasalchiTola, Lucknow
Image 31: FGD with Artisans of Rustam Nagar, Lucknow
Image 32: FGD with artisans of Katara Visen Beg, Lucknow

P a g e | 45
Bulakihar, Malihabad, Lucknow • The artisans were not satisfied with wages. • The artisans want integrated training on IGA
activity to ensure their livelihood and secure their future.
• They were calling for long term projects for Overall improvement in their life.
• Most of the artisans did not have artisan card and health insurance card.
• Some of the artisans were well educated, but they had no regular employment.
Bishunpur, Deva, Barabanki • The period of training program was very short.
Many of the artisans said that they did not find any change in their wages after completion of the training program.
• The artisans were calling for more integrated and long term training programs.
• They were facilitated by the NGOs working in the area to get their artisan card issued, butthey were not aware how to get benefit from this card.
• Most of the artisans did not have electricity in their premises
• There was no electricity in the village and many of the artisans had no toilet facility in their premises.
• Some of the artisans were students. They were asking for government support to continue their education.
• There were some incidences of domestic violence found with some artisans.
Anawari, Nindura, Barabanki • They were asking for more intensive public
interventions for improving theirliving standard.
• Most of the artisans were not satisfied with the wage rate.They told that theydid not get any change in wage rates during last 5 years.
• Most of the artisans did not have artisans card and health insurance card.
• Most of artisans did not have a toilet facility in their premises.
• Some of the artisans were living in a rented house.
• Many of the artisans were belonging to BPLfamilies, but were lacking Ration Card.
Image 35: FGD with artisans of Anawari, Nindura, Barabanki
Image33: FGD with artisans of Bulakihar, Malihabad, Lucknow
Image 34: FGD with artisans of Bishunpur, Deva, Barabanki
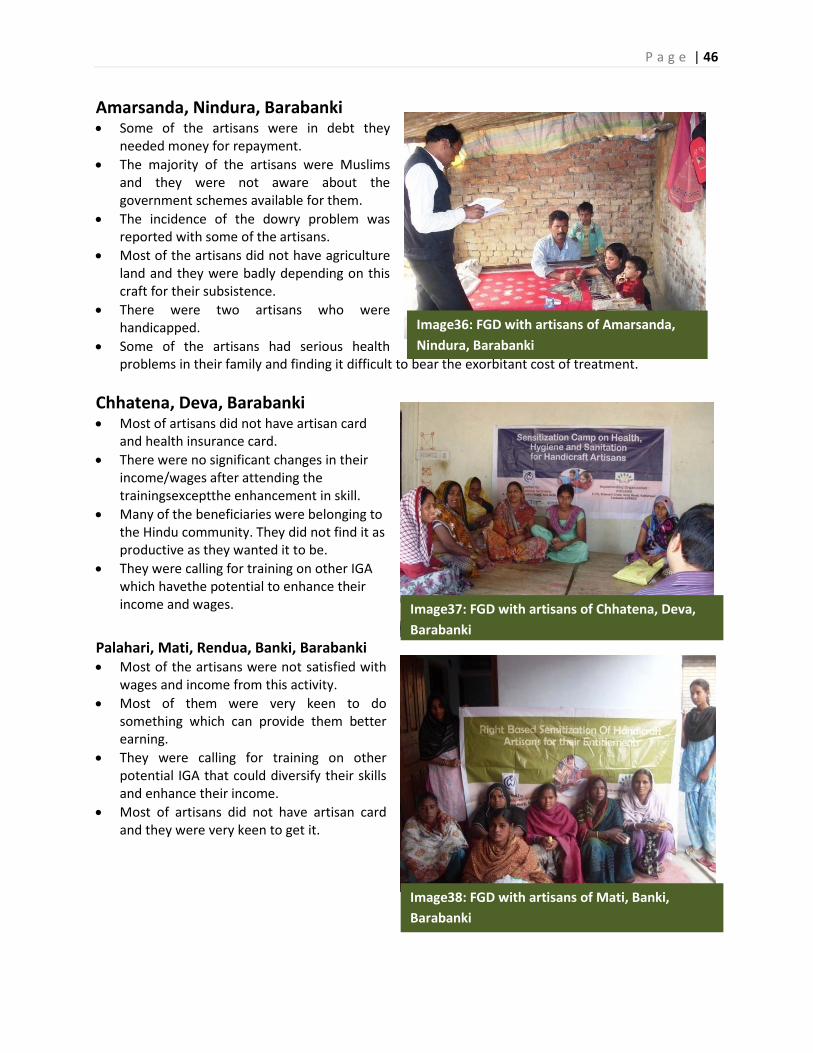
P a g e | 46
Amarsanda, Nindura, Barabanki • Some of the artisans were in debt they
needed money for repayment. • The majority of the artisans were Muslims
and they were not aware about the government schemes available for them.
• The incidence of the dowry problem was reported with some of the artisans.
• Most of the artisans did not have agriculture land and they were badly depending on this craft for their subsistence.
• There were two artisans who were handicapped.
• Some of the artisans had serious health problems in their family and finding it difficult to bear the exorbitant cost of treatment.
Chhatena, Deva, Barabanki • Most of artisans did not have artisan card
and health insurance card. • There were no significant changes in their
income/wages after attending the trainingsexceptthe enhancement in skill.
• Many of the beneficiaries were belonging to the Hindu community. They did not find it as productive as they wanted it to be.
• They were calling for training on other IGA which havethe potential to enhance their income and wages.
Palahari, Mati, Rendua, Banki, Barabanki • Most of the artisans were not satisfied with
wages and income from this activity. • Most of them were very keen to do
something which can provide them better earning.
• They were calling for training on other potential IGA that could diversify their skills and enhance their income.
• Most of artisans did not have artisan card and they were very keen to get it.
Image36: FGD with artisans of Amarsanda, Nindura, Barabanki
Image37: FGD with artisans of Chhatena, Deva, Barabanki
Image38: FGD with artisans of Mati, Banki, Barabanki

P a g e | 47
Gadi, Deva, Barabanki • There were no significant changes in their
income/wages after attending the training except enhancement in skill and product quality.
• Most of the beneficiaries were belonging to the Hindu community.
• Due to the poor wage rate they had low interest in this activity.
• There was no marketing supports or institutional support available to them.
Phutaha Mahal,Kajiyana, Tilak Nagar Mohan, Mohan Kota, Aliganj, Khurd Mohan,Husain Gari, Hasanganj, Unnao • Most of the artisans were working for
middlemen and they had a very less opportunity to bargain.
• Extension of activity was reported in the Hindu community after project intervention.
• Most of the artisans did not have artisans card and health insurance card.
• They were asking fora right based sensitization program for women.
Paigambarpur, Sagat Kila, Mahamudabad Khas, Purani Bazar, Sherapur, Mahmudabad, Sitapur • Most of the artisans did not have any other
source of income except this craft. • The majority of the artisans did not have
agriculture land. • The majority of the artisans were not aware
about the schemes available to them. • Some of the artisans did not have atoilet in
their premises. • Most of the artisans were working for middle
men and did not have regular work.
Image39: FGD with artisans of Gadi, Deva, Barabanki
Image40: FGD with artisans of Hansanganj, Unnao
Image41: FGD with artisans of Mahamudabad, Sitapur

P a g e | 48
Khairabad, Sitapur • The majority of the artisans were very keen
to have some government intervention in the form of training and sensitization program for them.
• The majority of the artisans were living below the poverty line;still they did not have Red Card.
• There wasno any institutional support available to them.
Novakheda, Kuwarpur, Sidhauli, Sitapur • Most of the artisans did not have regular
work. They were craving for more and regular work.
• The majority of the artisans did not have any land holding or had very small land holding although they were living in rural areas.
• The majority of the artisans were working for middle men.
• Most of the artisans were not aware about their rights and entitlements.
• They were asking for government support to improve their living standard and economic condition.
Prahaladpur, Laharpur, Sitapur • The majority of the artisans were workingfor
middlemen. • The majority of the artisans were not aware
about their rights and entitlements. • The majority of the artisans did not have
artisans card and health insurance card neither they were aware about its benefits.
Image42: FGD with artisans of MiyasarayaKhairbad, Sitapur
Image44: FGD with artisans of Prahaladpur, Laharpur, Sitapur
Image 43 FGD with artisans of Novakheda, Sidhauli, Sitapur

P a g e | 49
VI Recommendations

P a g e | 50
• The majority of the women artisans were earning very low wage rate under this craft and were deprived of various technical and managerial support. The funding organizations-state government ( District Urban Development Authority(DUDA), Uttar Pradesh Mahila Kalyan Nigam etc), central government (Ministry of Handicraft, Ministry of Women and Child Development, Ministry of Rural Development, CAPART etc.) and other private agencies working for welfare of these artisans, should focus on empowering the existing artisans with new market led skill enhancement training programs with integrated approach (livelihood creation and supporting activities by imparting training on technical, managerial and behavioral skills) for rapid adoption of latest technology by the artisans and enabling the artisans to cope with emerging demand and globalizing economy.
• The majority of the women artisans were extremely poor and had very low income and growth so it is essential to make the provision of stipend including provision of raw materials and equipments etc. in the skill enhancement training programs to compensate their loss of income from their productive work, which will help in reducing dropouts of the participants and enhance their willingness to join the training program under the various initiatives undertaken by state /central government and other private/bilateral agencies working for artisans.
• The certificate of skill training is a written testimony which helps the artisan to get a better work/job and wages in the changing market demands. The central /state government and other private agencies should make certification of training program compulsory after successful execution of such training program either it is short term or long term.Participants should be provided with a certificate of training when they fulfill certain parameters designed in their training program may be in the form of practical test during the training. It will improve the quality of training.
• The sponsoring agencies working for welfare of handicraft artisans should promote and give priority to skill enhancement training program proposals that also include comprehensive approach to improve the lives’ of poor artisans like sensitization of artisans on their rights and entitlements, providing backward and forward linkages, raising awareness on reproductive child health, imparting life skill education on various aspects of lifeto achieve significant and measurable impacts of the project activities as per the targets and objectives of the project.
Recommendations
P a g e | 51
• The majority of the women artisans had very limited opportunity to visit the different regions- intra-districts or inter-districts or interstate to learn from each other in the area of their craft and to view practical examples of different successful practices. The sponsoring agencies (state/central and other private agencies) working for the welfare of handicraft artisans should promote exposure visits, especially in long term initiatives.
• The majority of the women artisans were lacking knowledge about the modern market
trends and had very limited opportunity to interact directly with buyers, the various agencies working for welfare of artisans like Development Commissioner handicraft, Ministry of Women and Child Development, Khadi & Village Industry Commission, Ministry of Rural Development, CAPART and other bilateral/private agencies should promote participation of artisans exhibitions/trade shows/various mahotsava by organizing sensitization camps in the artisans concentrated area, providing them free of cost stalls in exhibitions, travelling and transportation charges including boarding and lodging. It will not only increase their knowledge about current market trends, but also it will diminish middlemen involvement in this sector.
• Artisan Card is the identity proof of an artisan and the study reveals the fact that the majority of the women artisans did not have artisan card. Development commissioner handicraft, state /central government and other bilateral/private agencies should organize sensitization camp on the need and importance of artisan card for an artisan and promote registration/issuance of the card.
• The working environment of the majority of the women artisans was not pleasant and
the poverty worsens the situation of these artisans’ to sustain their lives. In such difficult circumstances, if any unforeseen health hazard comes into their family, the family’s economy ends in total fiasco. The study reveals the fact that the majority of the women artisans did not have any health insurance. Keeping this in view various central /state government and other private/bilateral agencies working for the welfare of artisans, especially the Development Commissioner Handicraft should time to time organize sensitization camps in artisans’ concentrated areas on Rajiv Gandhi Shilpi Swasthya Bima Yojana (RGSSBY) and promote their linkage with RGSSBY.
• The majority of artisans did not have their personal bank account. Keeping this in view the various central governments/state government/bilateral agencies working for the welfare of artisans and lead bank of the area should organize sensitization camps in artisans’ concentrated areas to open the bank account and may promote its linkage with Pradhan Mantri- Jan Dhan Yojana (PMJDY).
P a g e | 52
• During the Focus Group Discussions with artisans the fact reveals that the majority of the artisans were lacking regular job/work availability and were wishing to diversify their source of income. The local level organizations-NGOs and other bilateral agencies working for the welfare of artisans should find out some other source of income (need based and demand driven) in the particular area which can utilize the working potential of the artisans and enhance their income and ensure their regular work availability.
• The study reveals the fact that the major portion of the women artisans under this craft were poor Muslims. They play the multi-faceted roles in the family. On one hand, they were carrying out cooking, fetching water, sending children to school and on the other they were extensively working under this craft to support the family income. In spite of their important contributions these artisans were suffering from various constraints and discrimination in their life and were left out of development trajectory. They had insufficient knowledge about their rights and entitlements and were badly entangled in the poverty cycle. Keeping this in view the sponsoring agencies working for the welfare of handicraft artisans should promote and design a comprehensive and specific program, (like program comprising of new market led skill enhancement training, leadership development, sensitization on schemes related to minority welfare, life skill education, addressing gender based/local issues etc.) which can pull them above poverty line and address the various issues and social problems of these Muslim women artisans by involving local Panchayati Raj Institutions, religious leaders and local level organizations.
• The sponsoring agencies may promote the selling of articles of women artisans
through establishing a separate website, either by itself or by public-private partnership or linkages with similar institutions as a tool to diminish middlemen involvements and promote online marketing.
• The artisans may be mobilized and trained about forming their own cooperative society to deal with their own affairs. Through it, they can sell their products directly to traders/consumers at offline/on-line mode. It will also give the cumulative bargaining power to deal with middlemen/traders.

P a g e | 53
VII Conclusions There were enormous numbers of handicraft women artisans working in and around Lucknow in Uttar Pradesh under this craft. The finding reveals the fact that major portion of artisans under this craft were Muslims, they were traditionally engaged with this craft. The majority of Muslim artisans did not have any other source of income except this craft.The majority of the artisans were not aware about their rights and entitlements.They had poorknowledge about the various government schemes available for them. Majority ofartisans were low paid, marginalized and left out of development trajectory. Preponderantly, the artisans were working for middlemen near their habitat and their wages were very low and negotiable. In most of the cases the artisans were not satisfied with the wage rate neither they felt any substantial change in the wage during the last five years in comparison to rising prices of daily needs. Many of the artisans did not have their personalbank account;neither they had any monthly savings. Most of the artisans were malnourished and were facing various health concerns and were also lacking any health insurance. When the comparisons executed between the trained handicraft women artisans and un-trained handicraft women artisans on the ground of the various aspects and impact indicator like status of personal bank account of artisans, status of artisan card holders, status of monthly savingsand other various issues related to them, some positive changes were reported under the various project initiatives, but it was not enough. This all call out for long term comprehensive initiatives that can address the need based issues of these artisans in order to improve overall status of these artisans’ life and enabling them to claim their rights and entitlements.

P a g e | 54
References 1. Government of India, (February 2012), Report of the Committee on Unorganized Sector
Statistics, National Statistical Commission, New Delhi.
2. Government of India, ( ), Report of the Working Group on Empowerment of Women for the XI Plan, Ministry of Women and Child Development, New Delhi.
3. Gupta Anvita.,Greetika. and Singh Tripti., (2011),“Women Working in Informal Sector in India: A saga of Lopsided Utilization of Human Capital”., International Conference on Economics and Finance Research IPEDR vol.4 IACSIT Press, Singapore
4. Hazt,KeithMarch,(1973), “Informal Income Opportunities and UrbanEmployment in Ghana', Modern African Studies”,
5. Jeemol Unni., “ Size ,contribution and characteristics of informal employment in India” (2001)<http://www.ilo.org/public/English/employment/infeco/index.htm>. views on
6. NSSO 2001a. “Employment-Unemployment Situation in India 1999-2000”, Round 55th, Report No. 458 – I and II (55/10/2), Ministry of Statistics and Program Implementation. Government of India, New Delhi.
7. NSSO 2006a. “Employment-Unemployment Situation in India 2004 – 2005”, Round 61st, Report No. 515 – I and II (61/10/1&2), Ministry of Statistics and Program Implementation. Government of India, New Delhi.
8. Papola T.S.,(1992) “ Industrialisation for Rural Development”, in Singh, A.K, Papola T.S. and Mathur, R.S. (ed). Economic Policy and Planning in India, Sterling Publications, New Delhi,.
9. Unni, (2003) ‘Gender Informality and Poverty’, Seminar, 531.
10. United Nations (2000), The World’s Women 2000: Trends and Statistics, New York: UN Statistical Division.

P a g e | 55
APPENDIX 1
Table 4: Distribution of artisans according to their category
Districts Trained Artisans Category in number of artisans (%)
Un-Trained Artisans Category in number of artisans(%)
n GEN
OBC SC Minority (Muslims)
n GEN OBC SC Minority (Muslims)
Lucknow 75 - 18 26 31 75 16 24 35 Barabanki 75 18 17 24 16 75 1 20 54 Sitapur 75 2 1 1 71 75 2 2 71
Unnao 75 22 33 12 8 75 16 18 24 17
Overall 300 42 (14%)
69 (23%
)
63 (21%
)
126 (42%)
300 17 (5.6%)
56 (18.6
%)
50 (16.6
%)
177 (59%)
Note:- n denote number of Overall respondents
Table 5:Working place of artisans
Districts Trained Artisans in number of artisans (%)
Un-Trained Artisans in number of artisans (%)
n Home Centre/Addis n Home Centre/Addis Lucknow 75 34 41 75 58 17 Barabanki 75 72 03 75 65 10 Sitapur 75 51 24 75 31 44 Unnao 75 44 31 75 49 26 Overall 300 201 (67%) 99 (33%) 300 203(67.65%) 97(32.3%)
Table6:Working hours of artisans per day
Districts Trained Artisans in number of artisans (%)
Un-Trained Artisans in number of artisans (%)
n 2-4 hours/day
4-6 hours/day
6-8 hours/day
n 2-4 hours/day
4-6 hours/day
6-8 hours/day
>8 hours
Lucknow 75 21 41 13 75 30 35 6 4 Barabanki 75 58 17 - 75 41 29 5 Sitapur 75 51 20 4 75 21 22 28 4 Unnao 75 43 29 3 75 52 19 4 Overall 300 173
(57.6%)
107 (35.6%
)
20 (6.7%)
300 144 (48%)
105 (35%)
43 (14.3%
)
8 (2.6%)
Tables of Comparative Analysis of Status of Trained and Un-Trained Artisans on the ground of Districts in Number

P a g e | 56
Table 7:Artisans working for whom
Districts Trained Artisans in number of artisans (%)
Un-Trained Artisans in number of artisans (%)
n Middlemen
Traders Organization/Groups/ Federation
n Middle men
Traders Organization/Groups/ Federation
Lucknow 75 28 17 30 75 52 12 11 Barabanki 75 69 3 3 75 64 11 Sitapur 75 68 4 3 75 68 7 Unnao 75 73 2 - 75 70 5 Overall 300 238
(79.3) 26
(8.6%) 36
(12%) 300 254
(84.6) 35
(11.6) 11
(3.6)
Table8:Wage Group (WG) of artisans
Districts Trained Artisans in the Wage Group (WG) in number of artisans (%)
Un-Trained Artisans in the Wage Group (WG) in number of artisans (%)
n 10-20 Rs/ day
20-40 Rs/ day
40-60 Rs/ day
60-80 Rs/ day
80-100 Rs/ day
n 10-20 Rs/ day
20-40 Rs/ day
40-60 Rs/ day
60-80
Rs/ day
80-100 Rs/ day
>100 Rs/ day
Lucknow 75 04 38 15 07 11 75 2 43 15 7 3 5 Barabanki 75 52 18 05 - - 75 14 43 16 2 Sitapur 75 30 21 6 13 5 75 20 13 21 10 11 Unnao 75 37 7 8 20 3 75 42 6 13 10 4 Overall 300 123
(41%) 84
(28%) 34
(11.3%)
40 (13.3
%)
19 (6.3%)
300 78 (26%)
105 (35%)
65 (21.7
%)
29 (9.6
%)
18 (6%
)
5 (1.6
%)
Table9:Responses of artisans on saving, wage and wage rate
Districts
Trained Artisans Un-Trained Artisans Monthly
Saving (n=75 in
each districts)
Satisfaction to wage rate
(n=75 )
Any Increase in wage
(n=75)
Monthly Saving (n=75)
Satisfaction to wage
rate (n=75)
Any Increase in wage
(n=75)
Lucknow 32 30 25 6 4 5 Barabanki 12 06 06 5 12 11
Sitapur 8 10 7 13 11 9 Unnao 16 11 6 10 7 7
Overall 68 (22.6%)
57 (19%)
44 (14.6%)
34 (11.3%)
34 (11.3%)
32 (10.6%)

P a g e | 57
Table 12:Loan/debt/borrow by artisans
Trained Artisans Un-Trained Artisans n Middle
Men/ Traders
Groups / Federations / Institutions
Relatives/ Friends
Bank n Middle Men/ Traders
Groups / Federations / Institutions
Relatives/ Friends
Bank
50 4 1 45 - 56 11 4 41 53 6 11 35 1 48 16 1 29 2 28 6 2 20 - 38 11 1 26 36 3 - 33 - 26 9 - 17 167 19
(11.3) 14 (8.5)
133 (79.6)
1(0.5) 168 47(27.9)
6(3.6) 113(67.3)
2(1.2)
Table 10:Responses of artisans on marketing concerns
Districts Trained Artisans in number of artisans
Un-Trained Artisans in number of artisans
Sell by own (n=75)
Participation in Exhibition (n=75)
Sell by own (n=75)
Participation in Exhibition (n=75)
Lucknow 11 4 3 Barabanki 6 9 8 Sitapur 4 4 4 Unnao 3 4 Overall 24
(8%) 17
(5.6%) 19
(6.3%)
Table 11:Artisans who were members of Self Help Group (SHG)
Districts Trained Artisans Member of SHG
in number of artisans
Un-Trained Artisans Member of SHG
in number of artisans Lucknow 01 4 Barabanki 21 Sitapur 21 1 Unnao 01 Overall 44 (14.6%) 5(1.6%)

P a g e | 58
Table 14 :Educational Status of Artisans
Districts
Trained Artisansin number Untrained Artisansin number n Primary Upper
Primary High
School Above
High School
Illiterate
n Primary Upper Primary
High School
Above High
School
Illiterate
Lucknow 75 14 17 14 26 4 75 21 18 11 8 17 Barabanki 75 15 16 11 12 21 75 16 16 3 8 32 Sitapur 75 9 18 4 27 17 75 31 12 4 7 21 Unnao 75 6 7 18 36 8 75 11 15 13 25 11 Overall 300 44
(14.7) 58
(19.3 47
(15.7) 101
(33.6) 50
(16.7)
300 79 (26.3)
61 (20.3)
31 (10.3)
48 (16)
81 (27)
Table 13:Status of Artisan Cards/ Health Insurance Card Districts
Trained Artisans Category in number
Un-Trained Artisans Category in number
Artisan Cards
Holders
Health Insurance
Card Holders
Artisan Cards Holders
Health Insurance Card Holders
Lucknow(n=75)
29 2
Barabanki(n=75)
42
Sitapur(n=75)
23
Unnao(n=75)
-
Overall 94 (31.3%)
2(0.6)

P a g e | 59
Table 17:Status of institutional delivery of married women
Districts Trained Artisansin number) Untrained Artisansin number n
At their
Home
In Private
Hospital
In Govt. Hosp
Both in Govt. & Private
Hospital
n
At their Home
In Private Hospit
al
In Govt. Hosp
Both in Govt. & Private
Hospital
Lucknow 29 5 4 11 9 66 20 8 38 Barabanki 50 6 10 30 4 60 12 11 35 2 Sitapur 24 4 2 18 39 12 1 26 Unnao 12 - 9 3 13 10 3 Overall 115 15
(13%) 25
(21.7%) 62
(54%) 13
(11.3%) 178 54
(30.3%) 23
(12.9%)
99 (55.6%)
2 (1.1%)
Table 15:Accounts of Artisans in Bank and its operation Districts
Trained Artisansin number Un-Trained Artisansin number Artisans who have their persnonal account in bank (n=75)
Artisans who are capable to operate their respective bank account (n=75)
Artisans who have their personal account in bank (n=75)
Artisans who are capable to operate their respective bank account (n=75)
Lucknow 44 40 29 25 Barabanki 40 30 20 16 Sitapur 49 42 25 15 Unnao 49 49 40 38 Overall 182(60.6) 161(88.4) 114(38%) 94(82.4)
Table 16:Health Sensitization Camp
Districts
Trained Artisans Yes in number (n=75 in each districts)
Un-Trained Artisans Yes(in number (n=75 in each districts)
Lucknow 29 7 Barabanki 16 8 Sitapur 31 11 Unnao 21 9 Overall 97(32.3%) 35(11.6%)

P a g e | 60
Table 18:Status of House
Districts
Trained Artisansin number Un-Trained Artisansin number n Kachcha
House Pucca House
Semi Pucca House
n Kachcha House
Pucca House
Semi Pucca House
Lucknow 75 7 36 32 75 12 31 32 Barabanki
75 9 28 38 75 20 15 40
Sitapur 75 16 22 37 75 31 16 28 Unnao 75 8 11 56 75 11 12 52 Overall 300 40
(13.3%) 97
(32.3%)
163 (54.3%)
300 74 (24.6%)
74 (24.7
%)
152 (50.7%)
Table 19:Availability of Toilets in Artisans Premises
Districts
Trained Artisans Premises
Yes in number (n=75 in each districts)
Un-Trained Artisans Premises
Yes in number (n=75 in each districts)
Lucknow 43 60 Barabanki 15 20 Sitapur 60 31 Unnao 28 32 Overall 146(48.6%) 143(47.6%)

P a g e | 61
APPENDIX 2 Distribution of Trained-Artisans according to their Category (village level data) Sr. Name of
District Name of blocks
Name of Village
Total Respondent Interviewed
Category (In Nos of Respondents)
General OBC SC Minority (Muslims)
1 Lucknow Malihabad Mujasha 40 - 9 19 12 2 Lucknow Bakshi Ka
Talab Goyala 29 - 8 7 14
3
Lucknow Lucknow Janata Nagari 6 - 1 - 5
1 Barabanki Deva Bishunpur 19 - - 4 15 2 Barabanki Nindura Anawari 18 - 3 14 1 3 Barabanki Deva Chatena 11 3 7 1 4 Barabanki
Banki Palari 12 2 7 3
5 Barabanki Deva Gadi 15 13 2 6 Sitapur Mahamudabad Paigambarpur 18 1 17 7 Sitapur Mahamudabad Sagat Kila 24 1 23 8 Sitapur Mahamudabad Mahamudabad
Khas 11 2 9
9 Sitapur Mahamudabad Purani Bazar 12 12 10 Sitapur Mahamudabad Sherapur 6 6 11 Sitapur Mahamudabad Bhattha 4 4 12 Unnao Hasanganj Phutaha Mahal 13 9 4 13 Unnao Hasanganj Kajiyana 14 1 9 3 1 14 Unnao Hasanganj Tilak Nagar 19 2 17 15 Unnao Hasanganj Mohan 13 7 1 5 16 Unnao Hasanganj Mohan Kota 4 1 1 2 17 Unnao Hasanganj Aliganj 6 1 1 4 18 Unnao Hasanganj Khurd Mohan 2 2 19 Unnao Hasanganj Husain Gari 4 3 1 Total 300 42 69 63 126

P a g e | 62
Table 1: Distribution of Un-Trained Artisans according to their Category Sr. Name of
District Name of blocks
Name of Village
Total Respondent Interviewed
Category (In Nos of Respondents)
General OBC SC Minority (Muslims)
1 Lucknow Bakshi Ka Talab Goyala 11 - 1 1 9 2 Lucknow Lucknow Rustam Nagar 12 - 12
3 Lucknow Lucknow Katara Vigen Beg
10 - 2 8
4 Lucknow Lucknow Noorbadi Harwara
8 - 8
5 Lucknow Lucknow Janata Nagari 10 - 3 7 6 Lucknow Lucknow Masalchi Tola 9 - 1 4 4 7 Lucknow Lucknow Madeyaganj 10 - 4 3 3
8 Lucknow Malihabad Bulakihar 5 - 5
9 Barabanki Nindura Amarsanda 5 - 5
10 Barabanki Nindura Anawari 7 - 7
11 Barabanki Deva Chatena 4 - 4
12 Barabanki Banki Mati 15 - 3 12
13 Barabanki Banki Rendua 3 - 2 1
14 Barabanki Banki Palari 9 - 9
15 Barabanki Nindura Bajagahani 32 1 2 29
16 Sitapur Sidhauli Novakheda 25 1 2 22
17 Sitapur Sidhauli Kuwarpur 20 1 19
18 Sitapur Khairabad Miya Saraya 15 15
19 Sitapur Laharpur Prahaladpur 15 15
20 Unnao Hasanganj Azamatgari 8 1 2 1 4
21 Unnao Hasanganj Husaingari 17 8 1 8
22 Unnao Hasanganj Kabilagari 12 5 1 1 5
23 Unnao Hasanganj Pakara 31 2 14 8 7
24 Unnao Hasanganj Khalanga 7 6 1
Total 300 17 56 50 177