a brief essay on the financialization of agricultural commodity markets
TRANSCRIPT
Munich Personal RePEc Archive
A brief essay on the financialization of
agricultural commodity markets
Girardi, Daniele
University of Siena, Department of Economics and Statistics, Centro
Studi CRESME
10 October 2012
Online at https://mpra.ub.uni-muenchen.de/44771/
MPRA Paper No. 44771, posted 05 Mar 2013 22:51 UTC
1
A brief essay on the financialization of agricultural commodity markets
Daniele Girardi1 – [email protected]
Introduction and abstract
Following a dramatic surge in financial investment in commodity derivatives markets by institutional
investors, hedge funds and large investment banks, agricultural commodity prices started to
fluctuate together in an unprecedented fashion. In June 2008 all main agricultural prices peaked at
their highest level in 30 years, and then fell sharply in the next six months. In 2010 there was a
new steep rise, with prices peaking in early 2011 at levels higher than those reached in 2008. A
worldwide debate has erupted over the role of financial speculation in driving these price dynamics.
The hypothesis put forward by several observers goes as follows: during the last decade financial
investors significantly increased their investment in commodity futures markets, influencing the
formation of futures prices, which are the benchmark for spot prices. In particular, financial actors
had been buying large amounts of futures contracts between 2004 and 2008, putting a huge
upwards pressure on prices. Then they temporarily exited those markets between late 2008 and
early 2009, selling the contracts they held and causing the fall in prices. They started being bullish
again from mid-2009, triggering the new price peak of 2010/2011. If this hypothesis holds true,
then the policy implication is that new regulatory measures are needed in order to curb excessive
speculation on commodity derivatives markets.
Although this theory seems convincing, the underlying evidence is still not clear-cut. Some
empirical results have been presented (for example by Gilbert, 2009; Tang and Xiong, 2010;
Buyuksahin and Robe, 2010) which suggest that financial speculation affected recent agricultural
commodity price dynamics, but conclusive evidence is still to be found. In my view this is due to a
lack of appropriate statistical information about commodity derivatives markets (as explained later
on).
In this essay I give a short descriptive overview of recent agricultural price dynamics (Section 1),
present some reflections on the recent boom cycle of commodity derivatives markets, with a
special focus on agricultural commodities, (Section 2) and discuss the empirical literature that tries
to assess whether financial investors have affected agricultural commodity price dynamics in
recent years (Section 3).
1 University of Siena – Department of Economics and Statistics; Centro Studi CRESME

2
1. Recent agricultural price dynamics in brief
A long phase of stability and moderation in international agricultural prices, which started in the
early Eighties, ended abruptly in the second half of the last decade. Crop prices began to rise
sharply in 2007, and by June 2008 they had reached their highest level in thirty years. The
subsequent reversal was even faster, with prices falling by around 40% in six months (between
July 2008 and January 2009). A new surge has been observed since spring 2010, with prices
peaking in early 2011 at levels slightly higher than those reached in 2008. Since mid-2011, prices
appear to have been declining again.
Table 1. International prices, main agricultural commodities and oil (% change)
2002-2006 June ‘08/Jan ‘07 Dec ‘08/June ‘08 June ‘11/Dec ‘08 Dec ‘11/June ‘11
Wheat 63% 78% -37% 48% -18%
Corn 75% 75% -45% 96% -17%
Rice 62% 166% -34% -6% 12%
Soybeans 52% 116% -42% 57% -16%
Oil* 219% 146% -69% 157% -2%
* Average petroleum spot price. Average of UK Brent, Dubai and WTI, equally weighted
Source: Author’s own elaboration on IMF data
Figure 1. International agricultural commodity prices: wheat, maize, rice and soybeans Source: Our own elaboration on IMF data
These price swings were shared not only by agricultural commodities, but also by energy and
metal commodities. They don‟t appear fundamental-driven, since offer and demand were not (and
probably cannot be) so volatile in the short term. Even if during the 2000s an overall cereal
production deficit was observed in six years out of ten, if we stick to the data made available by the
3
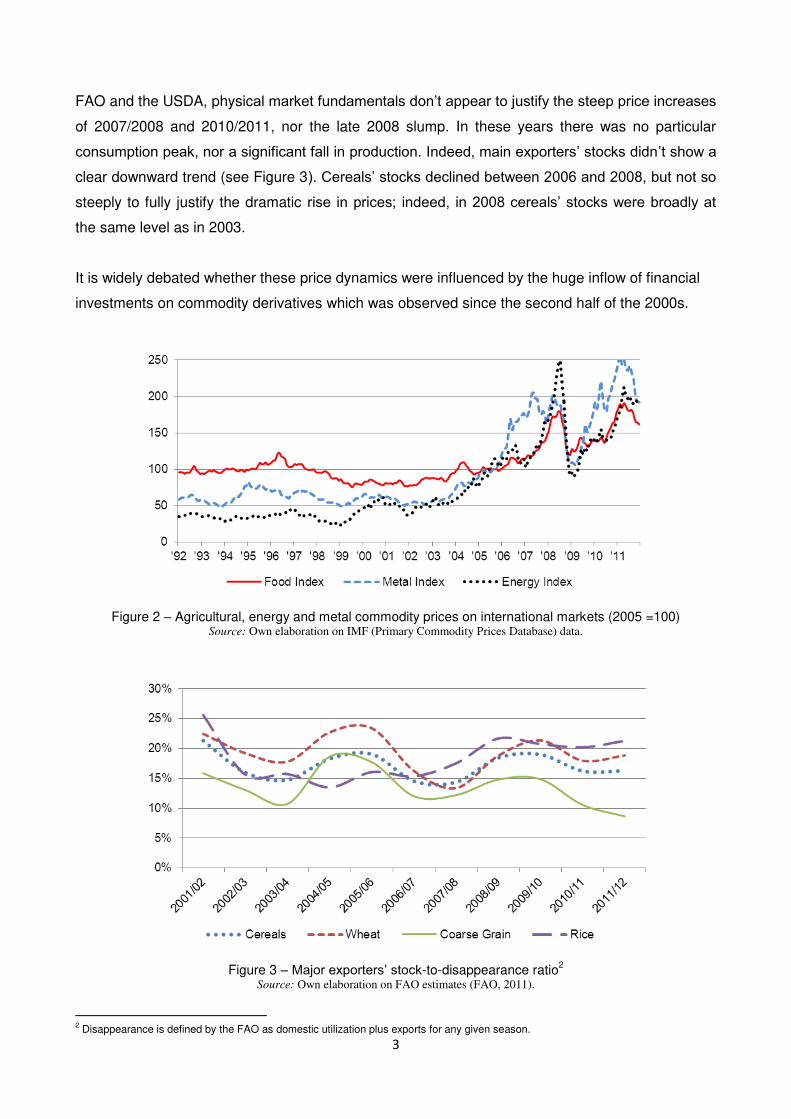
FAO and the USDA, physical market fundamentals don‟t appear to justify the steep price increases
of 2007/2008 and 2010/2011, nor the late 2008 slump. In these years there was no particular
consumption peak, nor a significant fall in production. Indeed, main exporters‟ stocks didn‟t show a
clear downward trend (see Figure 3). Cereals‟ stocks declined between 2006 and 2008, but not so
steeply to fully justify the dramatic rise in prices; indeed, in 2008 cereals‟ stocks were broadly at
the same level as in 2003.
It is widely debated whether these price dynamics were influenced by the huge inflow of financial
investments on commodity derivatives which was observed since the second half of the 2000s.
Figure 2 – Agricultural, energy and metal commodity prices on international markets (2005 =100) Source: Own elaboration on IMF (Primary Commodity Prices Database) data.
Figure 3 – Major exporters‟ stock-to-disappearance ratio
2
Source: Own elaboration on FAO estimates (FAO, 2011).
2 Disappearance is defined by the FAO as domestic utilization plus exports for any given season.
4
2. The boom cycle of commodity derivatives markets
2.1 A ‘wall of money’ flowing into commodities
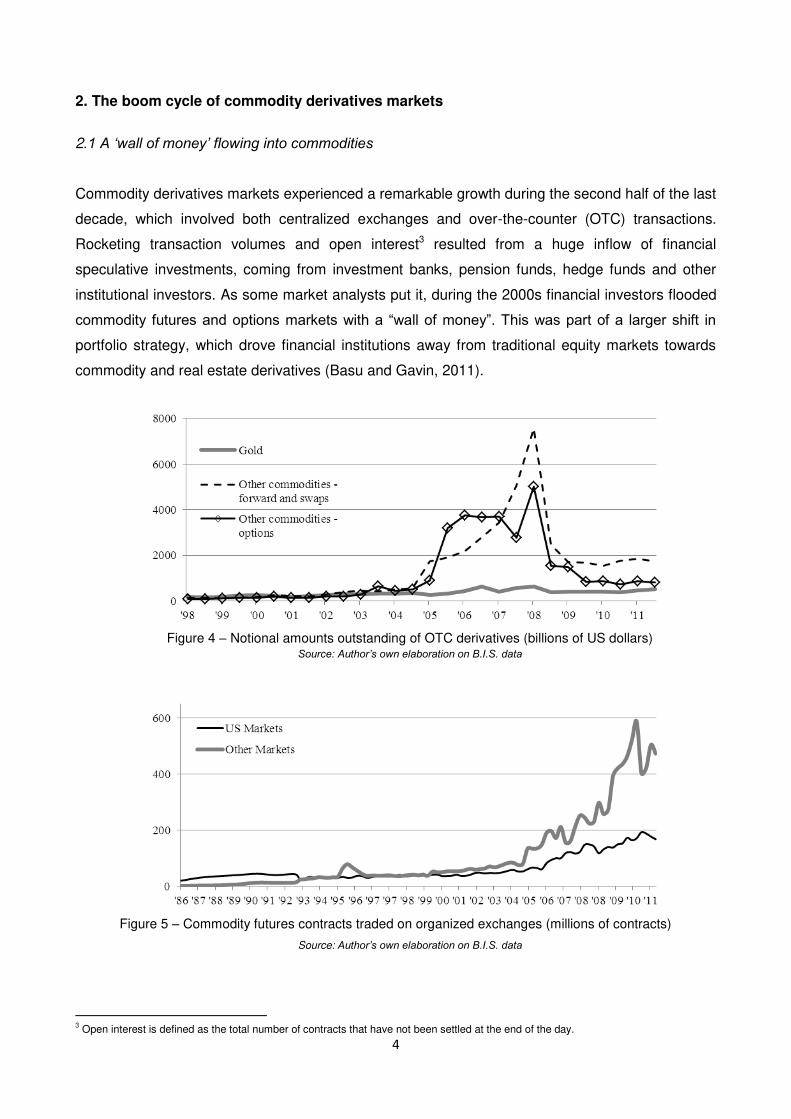
Commodity derivatives markets experienced a remarkable growth during the second half of the last
decade, which involved both centralized exchanges and over-the-counter (OTC) transactions.
Rocketing transaction volumes and open interest3 resulted from a huge inflow of financial
speculative investments, coming from investment banks, pension funds, hedge funds and other
institutional investors. As some market analysts put it, during the 2000s financial investors flooded
commodity futures and options markets with a “wall of money”. This was part of a larger shift in
portfolio strategy, which drove financial institutions away from traditional equity markets towards
commodity and real estate derivatives (Basu and Gavin, 2011).
Figure 4 – Notional amounts outstanding of OTC derivatives (billions of US dollars)
Source: Author’s own elaboration on B.I.S. data
Figure 5 – Commodity futures contracts traded on organized exchanges (millions of contracts)
Source: Author’s own elaboration on B.I.S. data
3 Open interest is defined as the total number of contracts that have not been settled at the end of the day.
5
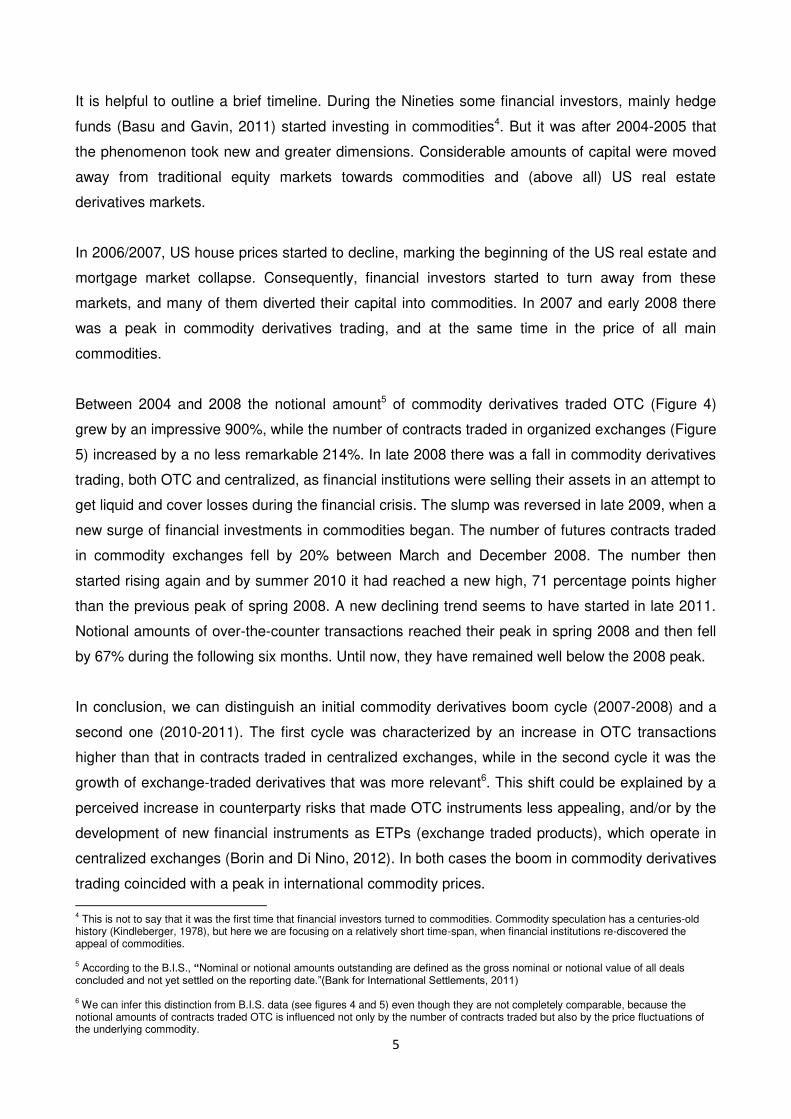
It is helpful to outline a brief timeline. During the Nineties some financial investors, mainly hedge
funds (Basu and Gavin, 2011) started investing in commodities4. But it was after 2004-2005 that
the phenomenon took new and greater dimensions. Considerable amounts of capital were moved
away from traditional equity markets towards commodities and (above all) US real estate
derivatives markets.
In 2006/2007, US house prices started to decline, marking the beginning of the US real estate and
mortgage market collapse. Consequently, financial investors started to turn away from these
markets, and many of them diverted their capital into commodities. In 2007 and early 2008 there
was a peak in commodity derivatives trading, and at the same time in the price of all main
commodities.
Between 2004 and 2008 the notional amount5 of commodity derivatives traded OTC (Figure 4)
grew by an impressive 900%, while the number of contracts traded in organized exchanges (Figure
5) increased by a no less remarkable 214%. In late 2008 there was a fall in commodity derivatives
trading, both OTC and centralized, as financial institutions were selling their assets in an attempt to
get liquid and cover losses during the financial crisis. The slump was reversed in late 2009, when a
new surge of financial investments in commodities began. The number of futures contracts traded
in commodity exchanges fell by 20% between March and December 2008. The number then
started rising again and by summer 2010 it had reached a new high, 71 percentage points higher
than the previous peak of spring 2008. A new declining trend seems to have started in late 2011.
Notional amounts of over-the-counter transactions reached their peak in spring 2008 and then fell
by 67% during the following six months. Until now, they have remained well below the 2008 peak.
In conclusion, we can distinguish an initial commodity derivatives boom cycle (2007-2008) and a
second one (2010-2011). The first cycle was characterized by an increase in OTC transactions
higher than that in contracts traded in centralized exchanges, while in the second cycle it was the
growth of exchange-traded derivatives that was more relevant6. This shift could be explained by a
perceived increase in counterparty risks that made OTC instruments less appealing, and/or by the
development of new financial instruments as ETPs (exchange traded products), which operate in
centralized exchanges (Borin and Di Nino, 2012). In both cases the boom in commodity derivatives
trading coincided with a peak in international commodity prices.
4 This is not to say that it was the first time that financial investors turned to commodities. Commodity speculation has a centuries-old
history (Kindleberger, 1978), but here we are focusing on a relatively short time-span, when financial institutions re-discovered the appeal of commodities. 5 According to the B.I.S., “Nominal or notional amounts outstanding are defined as the gross nominal or notional value of all deals
concluded and not yet settled on the reporting date.”(Bank for International Settlements, 2011) 6 We can infer this distinction from B.I.S. data (see figures 4 and 5) even though they are not completely comparable, because the
notional amounts of contracts traded OTC is influenced not only by the number of contracts traded but also by the price fluctuations of the underlying commodity.
6
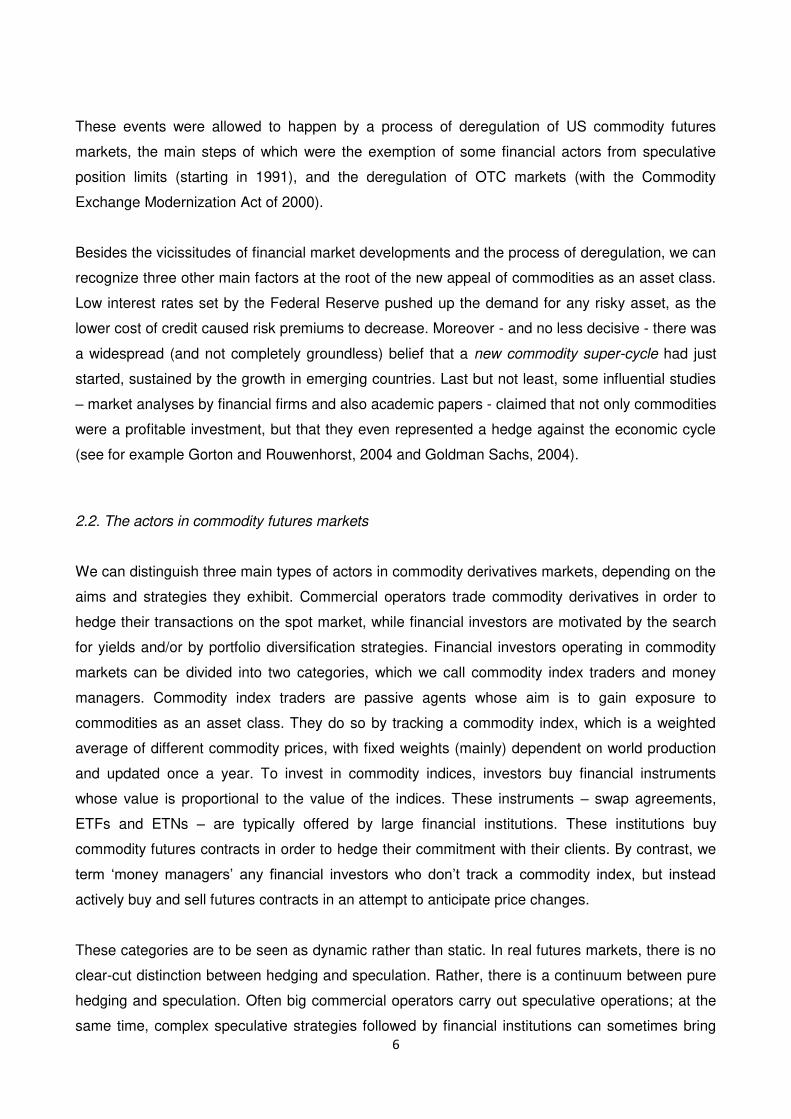
These events were allowed to happen by a process of deregulation of US commodity futures
markets, the main steps of which were the exemption of some financial actors from speculative
position limits (starting in 1991), and the deregulation of OTC markets (with the Commodity
Exchange Modernization Act of 2000).
Besides the vicissitudes of financial market developments and the process of deregulation, we can
recognize three other main factors at the root of the new appeal of commodities as an asset class.
Low interest rates set by the Federal Reserve pushed up the demand for any risky asset, as the
lower cost of credit caused risk premiums to decrease. Moreover - and no less decisive - there was
a widespread (and not completely groundless) belief that a new commodity super-cycle had just
started, sustained by the growth in emerging countries. Last but not least, some influential studies
– market analyses by financial firms and also academic papers - claimed that not only commodities
were a profitable investment, but that they even represented a hedge against the economic cycle
(see for example Gorton and Rouwenhorst, 2004 and Goldman Sachs, 2004).
2.2. The actors in commodity futures markets
We can distinguish three main types of actors in commodity derivatives markets, depending on the
aims and strategies they exhibit. Commercial operators trade commodity derivatives in order to
hedge their transactions on the spot market, while financial investors are motivated by the search
for yields and/or by portfolio diversification strategies. Financial investors operating in commodity
markets can be divided into two categories, which we call commodity index traders and money
managers. Commodity index traders are passive agents whose aim is to gain exposure to
commodities as an asset class. They do so by tracking a commodity index, which is a weighted
average of different commodity prices, with fixed weights (mainly) dependent on world production
and updated once a year. To invest in commodity indices, investors buy financial instruments
whose value is proportional to the value of the indices. These instruments – swap agreements,
ETFs and ETNs – are typically offered by large financial institutions. These institutions buy
commodity futures contracts in order to hedge their commitment with their clients. By contrast, we
term „money managers‟ any financial investors who don‟t track a commodity index, but instead
actively buy and sell futures contracts in an attempt to anticipate price changes.
These categories are to be seen as dynamic rather than static. In real futures markets, there is no
clear-cut distinction between hedging and speculation. Rather, there is a continuum between pure
hedging and speculation. Often big commercial operators carry out speculative operations; at the
same time, complex speculative strategies followed by financial institutions can sometimes bring

7
the latter to trade on physical markets. Furthermore, there are cases in which the same trader runs
multiple lines of business, blurring the distinction between index traders and money managers.
2.3. Agricultural commodities and financialization
During the last decade, the remarkable influx of financial speculative investment has drastically
changed the composition of commodity futures markets. Fairly reliable data about trading volumes
and net positions of each category of traders are only available for U.S. centralized exchanges and
only for the 2006-2011 period.7 However, the growth in commodity derivatives trading was so
steep that only speculative investments could have triggered it, because physical production did
not grow at similar rates; so the huge new demand for futures contracts can‟t have come from
commercial operators trying to hedge their physical markets‟ operations. Better Markets, a
nonprofit organization, roughly calculated that in the period 2005-2008 commodity index funds
alone pumped as much as 300 billion dollars into US commodity futures markets, and that the
market share of financial speculators in the Chicago Board Of Trade wheat futures market rose
from 12% of the market in 1996 to 65% in 2008, with the hedging of producers and purchasers
dropping to 35%.
The composition of the futures market is important because it determines the relative importance of
the different factors that affect futures prices. Money managers‟ demand for commodity futures
contracts is a function of their own expectations about the future fluctuations of prices and of the
present and future returns of the other financial markets in which they operate, while commercial
hedgers‟ demand is a function of physical production and consumption of the commodity. Index
traders‟ demand depends on their own expectations about the future returns of the commodity
index they are tracking, and on the present and future fluctuations of the other financial markets in
which they operate. That is why a futures market dominated by financial speculators can
disconnect prices from physical market fundamentals, linking them instead to financial investors‟
expectations about their own collective behavior (the “beauty contest” described by Keynes, 1936)
and to other financial markets‟ dynamics.
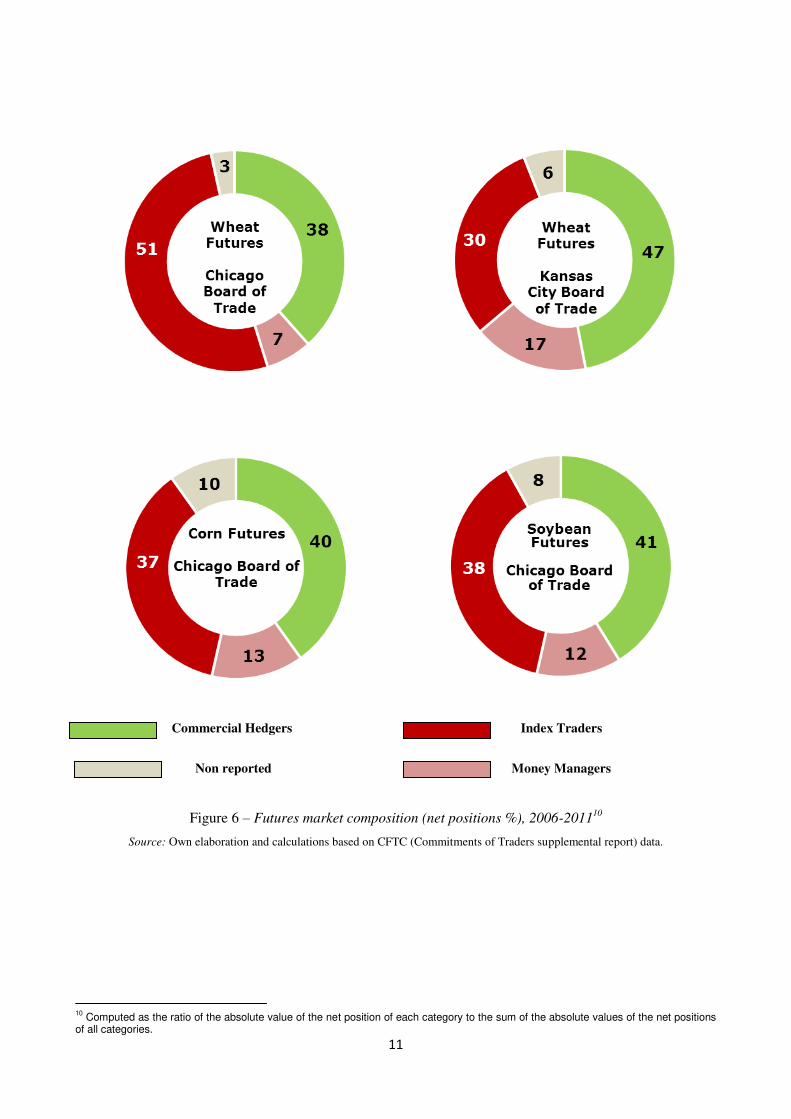
According to the data made available by the US market authority (CFTC), in the period 2006-2011
financial speculators held on average a market share of more than 50% in all main US agricultural
exchanges (see Table 3 and Figure 6). The large majority of this financial investment came from
commodity index funds. At first glance this could seem counter-intuitive, given that agricultural
commodities are present in commodity indices with only small weightings. Indeed, it is energy 7 This information is made available by the CFTC. For years prior to 2006, the CFTC‟s data is such that a considerable part of index
traders are classified as commercial hedgers.
8
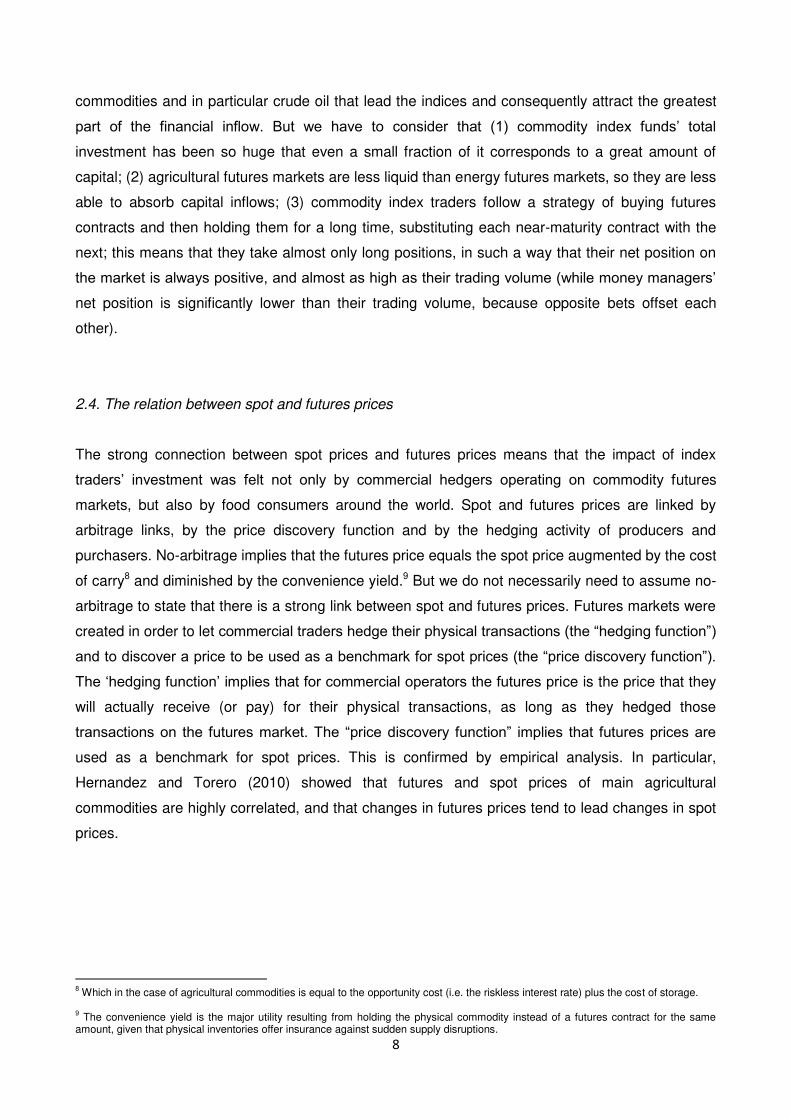
commodities and in particular crude oil that lead the indices and consequently attract the greatest
part of the financial inflow. But we have to consider that (1) commodity index funds‟ total
investment has been so huge that even a small fraction of it corresponds to a great amount of
capital; (2) agricultural futures markets are less liquid than energy futures markets, so they are less
able to absorb capital inflows; (3) commodity index traders follow a strategy of buying futures
contracts and then holding them for a long time, substituting each near-maturity contract with the
next; this means that they take almost only long positions, in such a way that their net position on
the market is always positive, and almost as high as their trading volume (while money managers‟
net position is significantly lower than their trading volume, because opposite bets offset each
other).
2.4. The relation between spot and futures prices
The strong connection between spot prices and futures prices means that the impact of index
traders‟ investment was felt not only by commercial hedgers operating on commodity futures
markets, but also by food consumers around the world. Spot and futures prices are linked by
arbitrage links, by the price discovery function and by the hedging activity of producers and
purchasers. No-arbitrage implies that the futures price equals the spot price augmented by the cost
of carry8 and diminished by the convenience yield.9 But we do not necessarily need to assume no-
arbitrage to state that there is a strong link between spot and futures prices. Futures markets were
created in order to let commercial traders hedge their physical transactions (the “hedging function”)
and to discover a price to be used as a benchmark for spot prices (the “price discovery function”).
The „hedging function‟ implies that for commercial operators the futures price is the price that they
will actually receive (or pay) for their physical transactions, as long as they hedged those
transactions on the futures market. The “price discovery function” implies that futures prices are
used as a benchmark for spot prices. This is confirmed by empirical analysis. In particular,
Hernandez and Torero (2010) showed that futures and spot prices of main agricultural
commodities are highly correlated, and that changes in futures prices tend to lead changes in spot
prices.
8 Which in the case of agricultural commodities is equal to the opportunity cost (i.e. the riskless interest rate) plus the cost of storage.
9 The convenience yield is the major utility resulting from holding the physical commodity instead of a futures contract for the same
amount, given that physical inventories offer insurance against sudden supply disruptions.
9
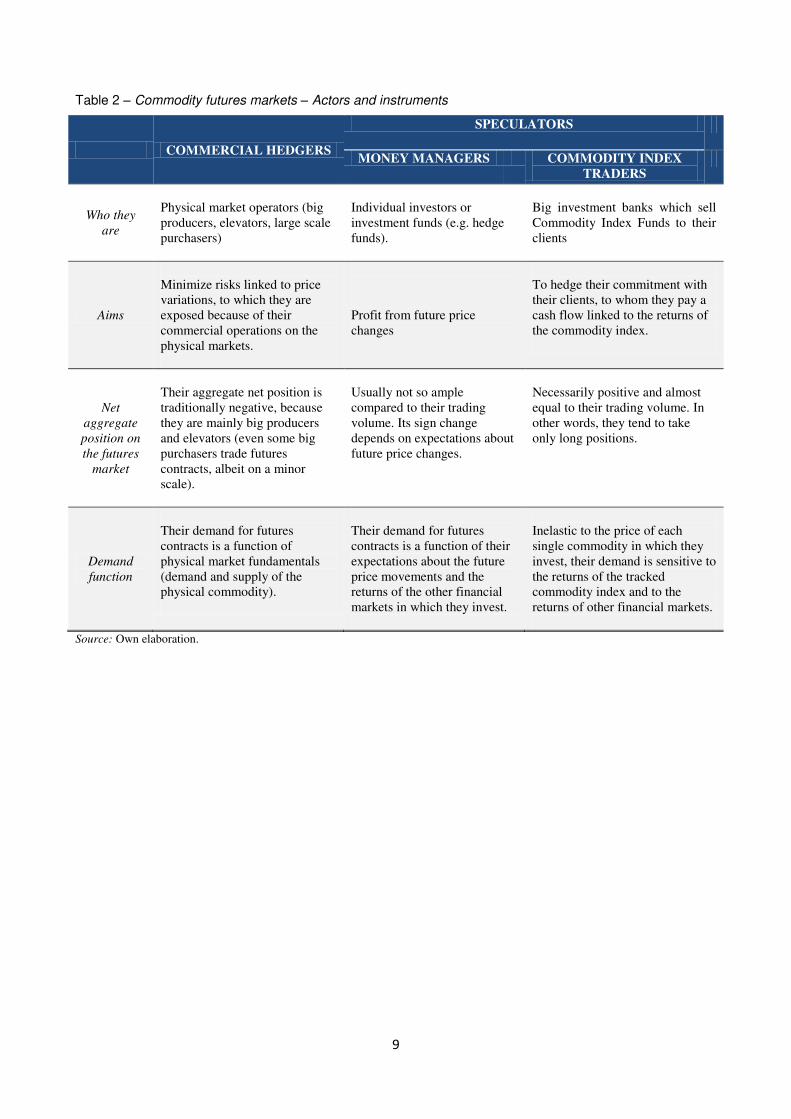
Table 2 – Commodity futures markets – Actors and instruments
COMMERCIAL HEDGERS
SPECULATORS
MONEY MANAGERS COMMODITY INDEX
TRADERS
Who they
are
Physical market operators (big
producers, elevators, large scale
purchasers)
Individual investors or
investment funds (e.g. hedge
funds).
Big investment banks which sell
Commodity Index Funds to their
clients
Aims
Minimize risks linked to price
variations, to which they are
exposed because of their
commercial operations on the
physical markets.
Profit from future price
changes
To hedge their commitment with
their clients, to whom they pay a
cash flow linked to the returns of
the commodity index.
Net
aggregate
position on
the futures
market
Their aggregate net position is
traditionally negative, because
they are mainly big producers
and elevators (even some big
purchasers trade futures
contracts, albeit on a minor
scale).
Usually not so ample
compared to their trading
volume. Its sign change
depends on expectations about
future price changes.
Necessarily positive and almost
equal to their trading volume. In
other words, they tend to take
only long positions.
Demand
function
Their demand for futures
contracts is a function of
physical market fundamentals
(demand and supply of the
physical commodity).
Their demand for futures
contracts is a function of their
expectations about the future
price movements and the
returns of the other financial
markets in which they invest.
Inelastic to the price of each
single commodity in which they
invest, their demand is sensitive to
the returns of the tracked
commodity index and to the
returns of other financial markets.
Source: Own elaboration.

10
Table 3 – Futures market structure, 2006-2011
(Millions of contracts)
Wheat Futures – Chicago Board of Trade
Volume % Long % Short % Net %
Commercial Hedgers 84.9 31% 20.7 18% 64.3 58% -43.6 38%
Money Managers 83.0 31% 16.6 14% 24.2 22% -7.6 7%
Index Traders 72.8 27% 65.6 57% 7.2 6% 58.3 51%
Non Reported 30.8 11% 11.9 10% 15.8 14% -3.9 3%
Total 271.5 100% 114.7 100% 111.5 100% - -
Wheat Futures – Kansas City Board of Trade
Volume % Long % Short % Net %
Commercial Hedgers 37.0 43% 10.9 29% 26.1 65% -15.1 47%
Money Managers 21.2 25% 9.1 24% 3.7 9% 5.4 17%
Index Traders 11.2 13% 10.6 28% 0.9 2% 9.7 30%
Non Reported 16.5 19% 7.3 19% 9.2 23% -1.9 6%
Total 85.9 100% 37.9 100% 39.9 100% - -
Corn Futures- Chicago Board of Trade
Volume % Long % Short % Net %
Commercial Hedgers 363.3 41% 117.2 31% 246.1 65% -128.9 40%
Money Managers 235.4 27% 74.4 20% 31.2 8% 43.2 13%
Index Traders 143.5 16% 130.5 34% 13.0 3% 117.5 37%
Non Reported 145.0 16% 56.6 15% 88.4 23% -31.8 10%
Total 887.2 100% 378.7 100% 378.7 100% - -
Soybeans Futures – Chicago Board of Trade
Volume % Long % Short % Net %
Commercial Hedgers 129.4 39% 38.8 28% 90.6 65% -51.8 41%
Money Managers 100.7 30% 28.8 21% 13.3 10% 15.5 12%
Index Traders 55.8 17% 53.0 38% 4.7 3% 48.3 38%
Non Reported 49.5 15% 19.7 14% 29.9 22% -10.2 8%
Total 335.5 100% 140.3 100% 138.4 100% - -
Source: Our own elaboration on CFTC data
11
Commercial Hedgers Index Traders
Non reported
Money Managers
Figure 6 – Futures market composition (net positions %), 2006-201110
Source: Own elaboration and calculations based on CFTC (Commitments of Traders supplemental report) data.
10
Computed as the ratio of the absolute value of the net position of each category to the sum of the absolute values of the net positions of all categories.
12
3. Empirical evidence Several studies aim to assess the impact of financial investment on commodity prices. Some of
them test whether changes in commodity futures prices have tended to be anticipated by changes
in financial investors‟ positions on commodity exchanges (see Hamilton and Wu, 2012, pp.2-5, for
a brief review of these studies). In other words, these empirical studies test whether financial
investments „Granger-cause‟ commodity price dynamics. Overall, the results of these studies are
mostly negative or inconclusive (Singleton, 2011 is a significant exception regarding the crude oil
market). In particular, Borin and Di Nino (2012) focus on agricultural commodities. Through a VAR
specification, they find no clear evidence that the movements of financial investors help to predict
future price changes, while in half of the eleven agricultural markets they examine higher futures
returns tend to be followed by an increase in money managers‟ investment (which could suggest
the presence of some kind of herding-behavior). They also find no systematic relationship between
financial investment and price volatility11.
In my view, the evidence provided by these works is far from conclusive, mainly because of crucial
flaws in the available data on investors‟ net positions. Data are available only for US commodity
exchanges, so OTC markets and non-US commodity exchanges are not taken into account - see
Figures 4 and 5. But it seems likely that trading OTC and in foreign markets do influence price
formation in US exchanges, because of arbitrage connections. Moreover, data are available only
since 200612. Another critical issue is that these studies only analyze weekly returns, because daily
data on the positions of traders are not available. This could result in a huge loss of information,
since futures markets can display significant short-term movements (which is why empirical
analysis of financial returns is traditionally based on daily-frequency data).
An alternative strategy is the one used by Gilbert (2009), which tested several commodities‟ price
dynamics in order to find evidence of speculative bubbles caused by feedback trading or by index
trading. Only in a few commodity markets – in particular soybean and copper – did his model point
to a speculative bubble caused by extrapolative expectations, while in many he finds evidence of a
bubble caused by index traders.
11
Overall, money managers‟ investment seems to be followed by a decrease in volatility in some markets, while “the evidence on swap
dealers is more mixed and their investments seem to amplify price volatility in some markets” (Borin and Di Nino, 2012) 12
Before 2006 index traders were not recognized as a category of traders per se. Many of them where classified as „hedgers‟ and some
other as „non-commercial‟, thus making CFTC data not usable for the kind of analysis that we are discussing here. Further flaws in
these data are the following: the classification of a trader as an index-trader is largely based on an assessment of his activity in early
2007 (the first time the report was released) and not updated; if a trader has several business lines, the CIT report does not separate his
position for different trading purposes and instead treats his aggregate positions under his classified category (Tang and Xiong, 2010,
p.10).
13
A further approach is to test whether financial actors have influenced commodity price variations by
linking them to financial market dynamics and by increasing the connections between different
commodity markets. This strategy has been followed by some recent empirical studies, perhaps as
a reaction to the impossibility of finding conclusive results using the more direct „Granger-
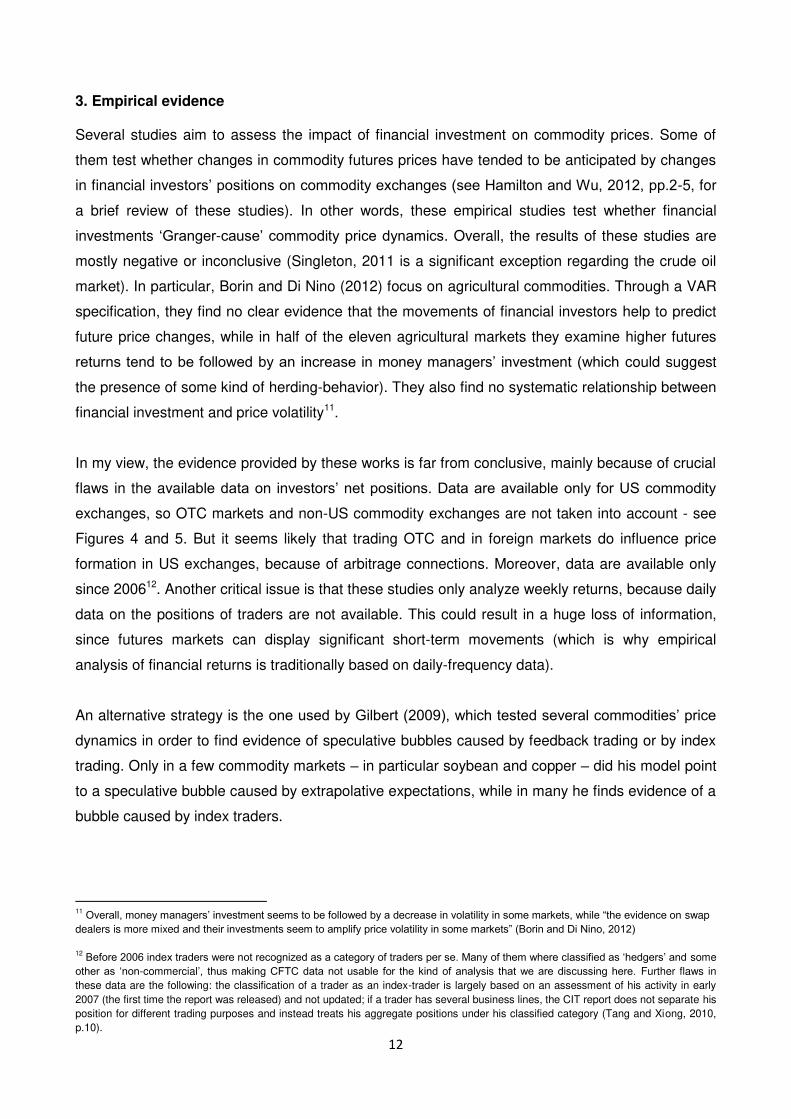
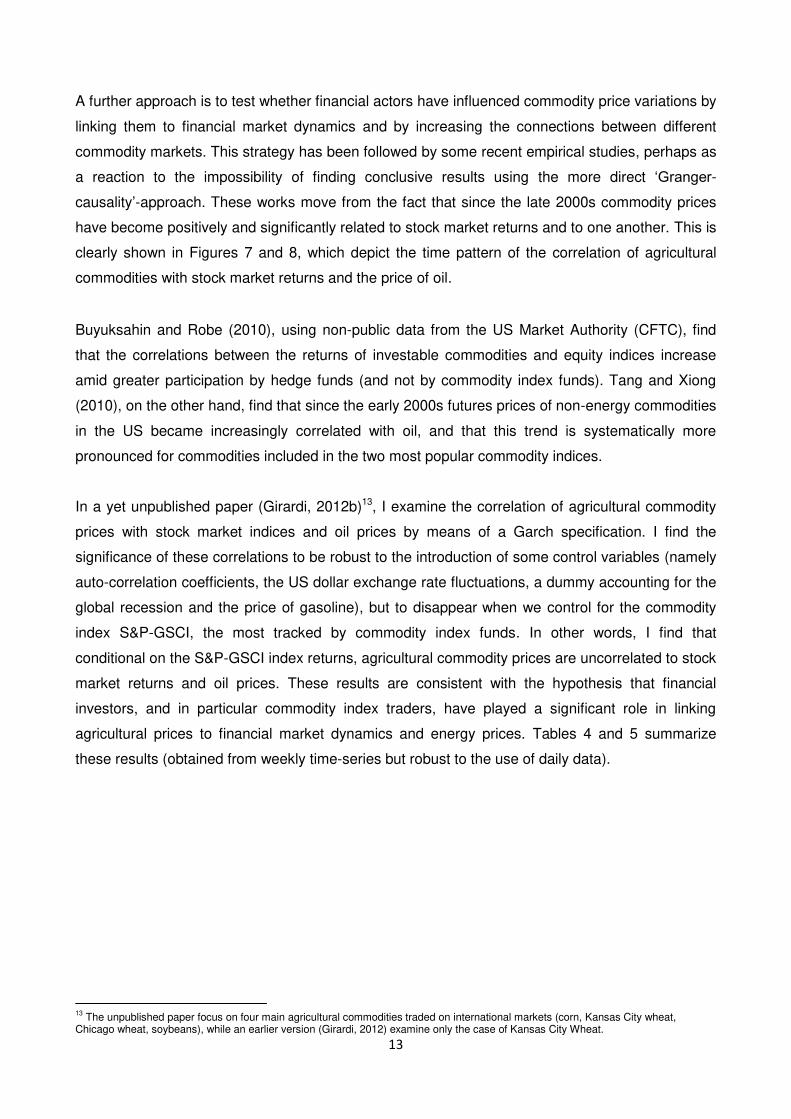
causality‟-approach. These works move from the fact that since the late 2000s commodity prices
have become positively and significantly related to stock market returns and to one another. This is
clearly shown in Figures 7 and 8, which depict the time pattern of the correlation of agricultural
commodities with stock market returns and the price of oil.
Buyuksahin and Robe (2010), using non-public data from the US Market Authority (CFTC), find
that the correlations between the returns of investable commodities and equity indices increase
amid greater participation by hedge funds (and not by commodity index funds). Tang and Xiong
(2010), on the other hand, find that since the early 2000s futures prices of non-energy commodities
in the US became increasingly correlated with oil, and that this trend is systematically more
pronounced for commodities included in the two most popular commodity indices.
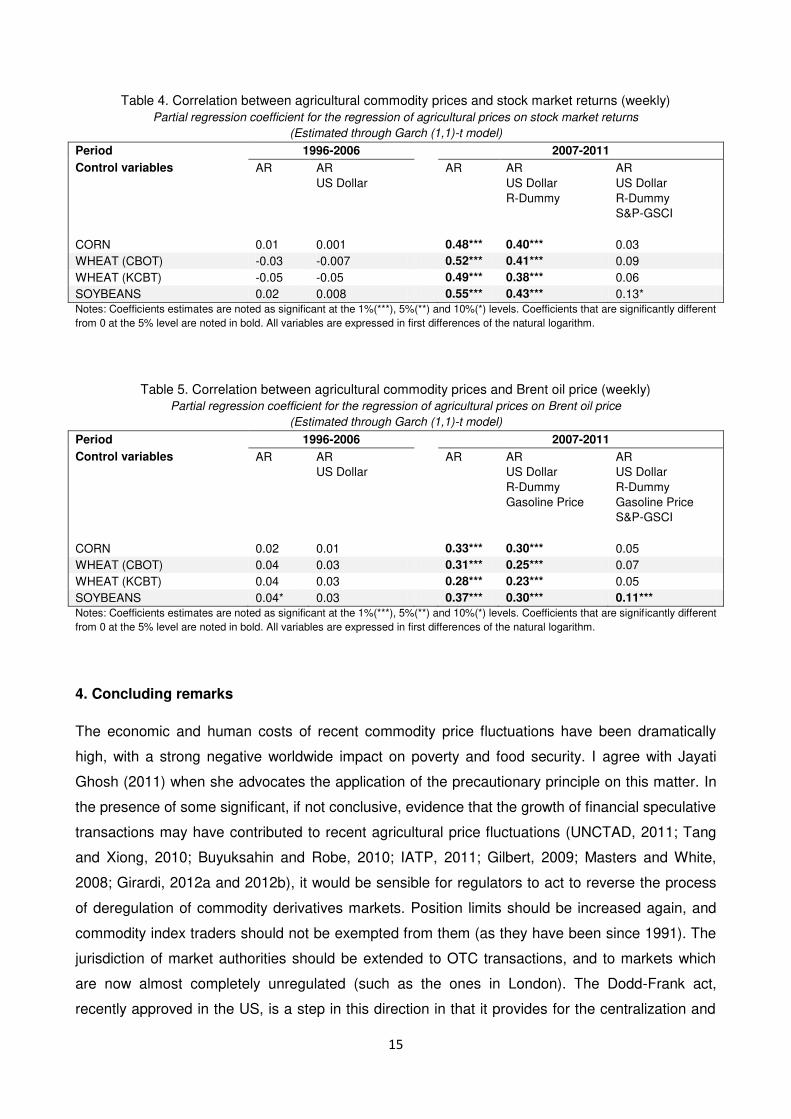
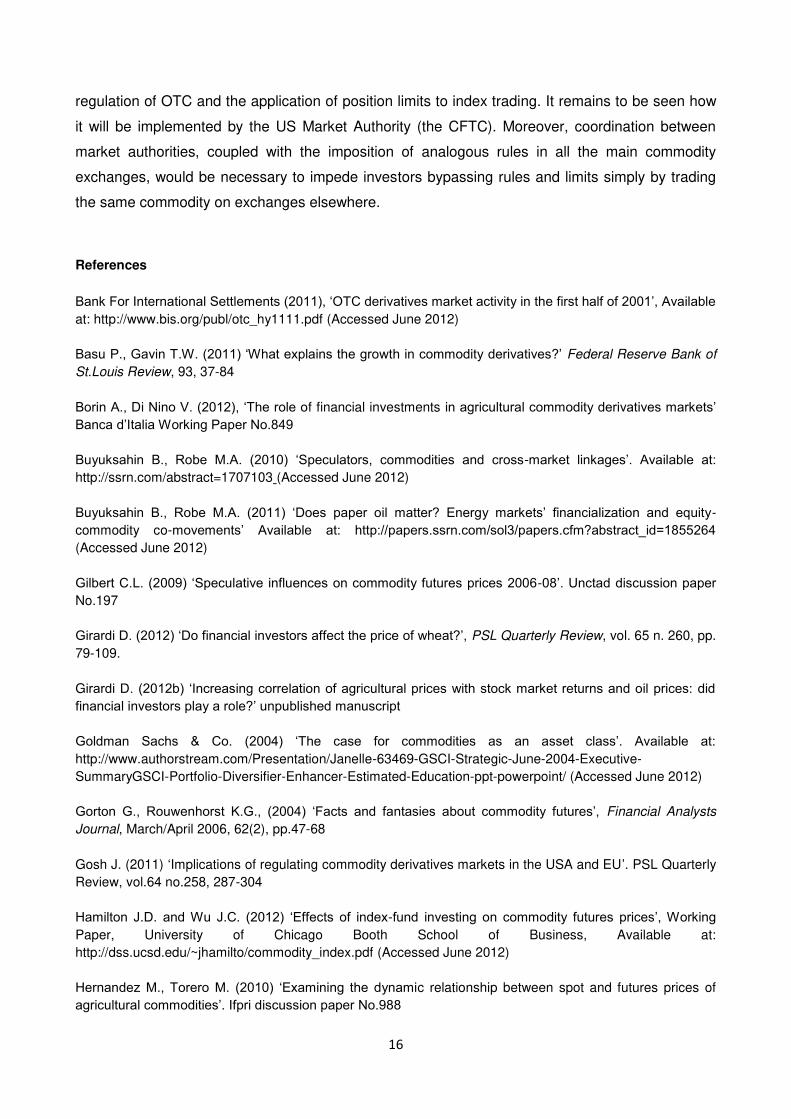
In a yet unpublished paper (Girardi, 2012b)13, I examine the correlation of agricultural commodity
prices with stock market indices and oil prices by means of a Garch specification. I find the
significance of these correlations to be robust to the introduction of some control variables (namely
auto-correlation coefficients, the US dollar exchange rate fluctuations, a dummy accounting for the
global recession and the price of gasoline), but to disappear when we control for the commodity
index S&P-GSCI, the most tracked by commodity index funds. In other words, I find that
conditional on the S&P-GSCI index returns, agricultural commodity prices are uncorrelated to stock
market returns and oil prices. These results are consistent with the hypothesis that financial
investors, and in particular commodity index traders, have played a significant role in linking
agricultural prices to financial market dynamics and energy prices. Tables 4 and 5 summarize
these results (obtained from weekly time-series but robust to the use of daily data).
13
The unpublished paper focus on four main agricultural commodities traded on international markets (corn, Kansas City wheat, Chicago wheat, soybeans), while an earlier version (Girardi, 2012) examine only the case of Kansas City Wheat.
14
Source: Girardi, 2012b
Figure 7. 250-days rolling correlation14
of the "four crops futures index15
" with the US equity index S&P500
(1970-2011)
Source: Girardi (2012b)
Figure 8. 250-days rolling correlation14
of the "four crops futures index4" with oil price
16 (1986-2011)
14
The rolling correlation (or moving correlation) is a linear correlation coefficient calculated over an initial subset of the series, in this case the first year of the sample, and then rolled forward over the entire sample. 15
Simple average of the futures prices of Chicago wheat, Kansas City wheat, soybean and corn. 16
We used the WTI front contract futures price, in order to have daily data
15
Table 4. Correlation between agricultural commodity prices and stock market returns (weekly)
Partial regression coefficient for the regression of agricultural prices on stock market returns
(Estimated through Garch (1,1)-t model)
Period 1996-2006 2007-2011
Control variables
AR AR
US Dollar
AR AR
US Dollar
R-Dummy
AR
US Dollar
R-Dummy
S&P-GSCI
CORN 0.01 0.001 0.48*** 0.40*** 0.03
WHEAT (CBOT) -0.03 -0.007 0.52*** 0.41*** 0.09
WHEAT (KCBT) -0.05 -0.05 0.49*** 0.38*** 0.06
SOYBEANS 0.02 0.008 0.55*** 0.43*** 0.13*
Notes: Coefficients estimates are noted as significant at the 1%(***), 5%(**) and 10%(*) levels. Coefficients that are significantly different
from 0 at the 5% level are noted in bold. All variables are expressed in first differences of the natural logarithm.
Table 5. Correlation between agricultural commodity prices and Brent oil price (weekly)
Partial regression coefficient for the regression of agricultural prices on Brent oil price
(Estimated through Garch (1,1)-t model)
Period 1996-2006 2007-2011
Control variables
AR AR
US Dollar
AR AR
US Dollar
R-Dummy
Gasoline Price
AR
US Dollar
R-Dummy
Gasoline Price
S&P-GSCI
CORN 0.02 0.01 0.33*** 0.30*** 0.05
WHEAT (CBOT) 0.04 0.03 0.31*** 0.25*** 0.07
WHEAT (KCBT) 0.04 0.03 0.28*** 0.23*** 0.05
SOYBEANS 0.04* 0.03 0.37*** 0.30*** 0.11***
Notes: Coefficients estimates are noted as significant at the 1%(***), 5%(**) and 10%(*) levels. Coefficients that are significantly different
from 0 at the 5% level are noted in bold. All variables are expressed in first differences of the natural logarithm.
4. Concluding remarks
The economic and human costs of recent commodity price fluctuations have been dramatically
high, with a strong negative worldwide impact on poverty and food security. I agree with Jayati
Ghosh (2011) when she advocates the application of the precautionary principle on this matter. In
the presence of some significant, if not conclusive, evidence that the growth of financial speculative
transactions may have contributed to recent agricultural price fluctuations (UNCTAD, 2011; Tang
and Xiong, 2010; Buyuksahin and Robe, 2010; IATP, 2011; Gilbert, 2009; Masters and White,
2008; Girardi, 2012a and 2012b), it would be sensible for regulators to act to reverse the process
of deregulation of commodity derivatives markets. Position limits should be increased again, and
commodity index traders should not be exempted from them (as they have been since 1991). The
jurisdiction of market authorities should be extended to OTC transactions, and to markets which
are now almost completely unregulated (such as the ones in London). The Dodd-Frank act,
recently approved in the US, is a step in this direction in that it provides for the centralization and
16
regulation of OTC and the application of position limits to index trading. It remains to be seen how
it will be implemented by the US Market Authority (the CFTC). Moreover, coordination between
market authorities, coupled with the imposition of analogous rules in all the main commodity
exchanges, would be necessary to impede investors bypassing rules and limits simply by trading
the same commodity on exchanges elsewhere.
References
Bank For International Settlements (2011), „OTC derivatives market activity in the first half of 2001‟, Available at: http://www.bis.org/publ/otc_hy1111.pdf (Accessed June 2012)
Basu P., Gavin T.W. (2011) „What explains the growth in commodity derivatives?‟ Federal Reserve Bank of
St.Louis Review, 93, 37-84
Borin A., Di Nino V. (2012), „The role of financial investments in agricultural commodity derivatives markets‟ Banca d‟Italia Working Paper No.849
Buyuksahin B., Robe M.A. (2010) „Speculators, commodities and cross-market linkages‟. Available at: http://ssrn.com/abstract=1707103 (Accessed June 2012)
Buyuksahin B., Robe M.A. (2011) „Does paper oil matter? Energy markets‟ financialization and equity-
commodity co-movements‟ Available at: http://papers.ssrn.com/sol3/papers.cfm?abstract_id=1855264 (Accessed June 2012)
Gilbert C.L. (2009) „Speculative influences on commodity futures prices 2006-08‟. Unctad discussion paper No.197
Girardi D. (2012) „Do financial investors affect the price of wheat?‟, PSL Quarterly Review, vol. 65 n. 260, pp.
79-109.
Girardi D. (2012b) „Increasing correlation of agricultural prices with stock market returns and oil prices: did financial investors play a role?‟ unpublished manuscript
Goldman Sachs & Co. (2004) „The case for commodities as an asset class‟. Available at: http://www.authorstream.com/Presentation/Janelle-63469-GSCI-Strategic-June-2004-Executive-
SummaryGSCI-Portfolio-Diversifier-Enhancer-Estimated-Education-ppt-powerpoint/ (Accessed June 2012)
Gorton G., Rouwenhorst K.G., (2004) „Facts and fantasies about commodity futures‟, Financial Analysts
Journal, March/April 2006, 62(2), pp.47-68
Gosh J. (2011) „Implications of regulating commodity derivatives markets in the USA and EU‟. PSL Quarterly
Review, vol.64 no.258, 287-304
Hamilton J.D. and Wu J.C. (2012) „Effects of index-fund investing on commodity futures prices‟, Working Paper, University of Chicago Booth School of Business, Available at:
http://dss.ucsd.edu/~jhamilto/commodity_index.pdf (Accessed June 2012)
Hernandez M., Torero M. (2010) „Examining the dynamic relationship between spot and futures prices of
agricultural commodities‟. Ifpri discussion paper No.988
17
Iatp (2011) „Excessive speculation in agriculture commodities‟. Available at http://www.iatp.org
Irwin S.H, Sanders D.R., Merrin R.P. (2009) „A speculative bubble in commodity futures prices? Cross-
sectional evidence‟, in Proceedings of the NCCC-134 Conference on Applied Commodity Price Analysis,
Forecasting, and Market Risk Management
Keynes J.M. ([1936] 1973) „The general theory of employment, interest and money‟. Macmillan, London
Kindleberger, C. (1978) „Manias, Panics and Crashes‟, Macmillan, London
Masters M.W. and White A.K. (2008) „The accidental hunt brothers: how institutional investors are driving up
food and energy prices‟. Available at http://accidentalhuntbrothers.com/ahbreports.zip (Accessed September
2012)
Singleton K. J. (2011) „Investor flows and the 2008 Boom/Bust in oil prices‟, Working Paper, Stanford
University, Available at: ssrn.com/abstract=1793449 (Accessed June 2012)
Tang K., Xiong W. (2010), „Index investment and financialization of commodities‟. NBER Working Paper
No.16325
Unctad (2011) „Price formation in financialized commodity markets'. Available at
http://www.unctad.org/en/docs/gds20111_en.pdf (Accessed June 2012)