9 the receiving environment social characteristics of … · 9 the receiving environment – social...
TRANSCRIPT

ENVIRONMENTAL RESOURCES MANAGEMENT YARA DALLOL BV
9-1
9 THE RECEIVING ENVIRONMENT – SOCIAL CHARACTERISTICS OF THE
PROJECT AREA
9.1 INTRODUCTION AND BACKGROUND
To determine the social receiving environment ERM has conducted a series of
detailed social studies including:
Socio-economic assessment including Focus Group Discussions (FGDs) and Key Informant Interviews (KII);
Health data collection and assessment;
Cultural heritage survey and assessment; and
Visual and landscape assessment.
This Chapter of the report provides a demographic, cultural and economic
overview of the Project Area and also describes the physical infrastructure and
services available in the Social Study Area. The purpose of collecting this
information is to provide baseline data for conducting the impact assessment
and to monitor and measure changes against the potential future changes to
the Social Study Area due to the presence of the Project.
Ethiopia is located in the Horn of Africa and it is bordered by Eritrea to the
north and northeast, Djibouti and Somalia to the east and southeast, Sudan
and South Sudan to the west, and Kenya to the south; as shown in Chapter 5.
It is the second most populous country in Africa (after Nigeria which has a
population of approximately 179 million people); with a population of
97 million people (1) across a total area of 1.1 million.
As is previously mentioned, the Social Study Area is located in the Afar
National Regional State (ANRS), which is in the north-east of Ethiopia. The
ANRS region borders Eritrea to the north and northeast, Djibouti in the east,
Somali National Regional State in the southeast, Oromiya National Regional
State in the south, Amhara National Regional State and Tigray National
Regional State in the west, as shown in Chapter 5. The ANRS is divided into
five administrative zones (i.e., Zones); which are further subdivided into
29 Woredas (district municipalities) and 401 rural and 28 urban Kebeles (local
municipalities).
9.1.1 Social Areas of Influence (AoI) – Social Study Area
The Area of Influence (AoI) can be defined as the area likely to be affected by
the proposed Project activities during the pre-construction, construction
operations and closure / decommissioning phases. This area has been defined
based on the IFC definition and also includes:
(1) http://data.worldbank.org/indicator/SP.POP.TOTL

ENVIRONMENTAL RESOURCES MANAGEMENT YARA DALLOL BV
9-2
The primary Project site(s) and related facilities that the Project Proponent develops or controls (e.g., pipelines, access roads, and disposal areas, construction camps) and the additional areas in which aspects of the environment could conceivably experience significant impacts.
Associated facilities that are not developed and funded as part of the proposed Project, but are essential for the Project and without which the Project cannot proceed, and the associated additional areas in which aspects of the environment could conceivably experience significant impacts.
Areas potentially affected by cumulative impacts resulting from other potential or known developments at the time of the ESIA, further planned phases of the Project or any other existing circumstances.
Areas potentially affected by impacts from predictable (but unplanned) developments as a result of the proposed Project (i.e., induced activities), occurring at a later stage or at a different location.
The social areas of influence are shown in Figure 9.1; this area takes into
consideration the socio-economic characteristics of the population within the
Social Study Area.

ENVIRONMENTAL RESOURCES MANAGEMENT YARA DALLOL BV
9-3
Figure 9.1 Project Areas of Influence

ENVIRONMENTAL RESOURCES MANAGEMENT YARA DALLOL BV
9-4
9.2 STUDY METHOD AND LIMITATIONS
The baseline draws on a range of primary data (collected for the purpose of
the proposed Project) and publically available secondary data from various
sources. The primary data used in this section of the report was collected
predominantly through a series of semi-structured, qualitative focus group
discussions and Key Informant Interviews (KIIs). Focus Group Discussions
(FGDs) were conducted with community elders, men, women and Woreda,
Zonal, as well as Kebele leaders and officials at Woreda, Zonal and Regional
levels; while key informant interviews were undertaken with healthcare
professionals. Ad hoc conversations and observation also formed a core
component of data gathered and used in this section. In addition, feedback
received through the Scoping phase public consultation process for the Project
has been used to inform this baseline.
In order to close any potential data gaps arising due to the absence of House
Hold Surveys (HHS), FGDs and KIIs were designed specifically to gather both
qualitative and some quantitative data on specific topics relating to potential
socio-economic vulnerability in the Social Study Area, such as gender and
livelihoods. Broadly the FGDs and KIIs covered the following topics:
Demographic description;
Local administrative structures and governance;
Local economy and livelihoods;
Education and health services; and
Local utilities and infrastructure.
Table 9.1 below provides the rationale for the use of specific data collection
methods.
Table 9.1 Data Collection Method, Relevance and Target Audiences
Data Collection
Methods
Justification for Method Used Target Audience
Key Informant
Interviews (KIIs) / One-
to-one interviews
Provides detailed information through
two-way communication.
Interviews are by invitation only, so it
is easier to predict and prepare for the
types of issues that are likely to be
raised.
Allows issues to be verified, tested
and solutions developed.
Woreda officials
Kebele leaders
Medical professionals
Focus Group
Discussions (FGDs)
Allows issues to be verified, tested
and solutions developed.
Allows for more in-depth discussion
and analysis of issues.
Allows for the active participation of
specific individuals or groups that
may be unable to contribute in more
open formats.
Allows for better management of
discussions on controversial or highly
emotive topics.
Elders, Men, Women
(in-depth knowledge of
the socio-economic
characteristics of the
community).

ENVIRONMENTAL RESOURCES MANAGEMENT YARA DALLOL BV
9-5
Data Collection
Methods
Justification for Method Used Target Audience
Ad hoc meeting Allows issues to be verified, tested
and solutions developed.
Any community member
Observation - Greater population and
landscape of the Study
Area
No detailed HHSs were undertaken due to time availability, geographical
extent and accessibility of the communities in the Social Study Area, but also
due to the availability of sufficient secondary data pertaining to the Social
Study Area.
The villages consulted were selected based on the:
Proximity of the village to the Project Area.
Gathering and usage of natural resources located on the proposed Project
Site.
Villages that house the local government leaders (kebele leaders) (refer to
Section 9.3.1).
Levels of vulnerability (as defined by the International Finance
Corporation [IFC]) to access to infrastructure, services, employment,
livelihoods, poverty, health, education, and gender.
The villages and government authorities engaged are shown in Table 9.2
below.
Table 9.2 Stakeholders Engaged from 28April to 7 May 2014
Date Village/ Gov. Leaders Type of Engagement
28 April
2014
Bada Admeruk FGDs: women, elders and men
Bada Admeruk Kebele leaders
KIIs: Health Care Practitioner
Local guide (to show the team areas
used to collect various natural resources)
29 April 2014 Bada Ermile FGDs: women, elders and men
Bada Ermile Kebele leaders (for health,
education, finance, agriculture, and
others)
KIIs: Health Care Practitioner
30 April 2014 Abaa/ Kulili
(Elifan Kebele)
FGD: women and men
KII: Elder
01 May 2014 Dallol Woreda FGD: Woreda Leaders (for health,
education, finance, agriculture, and
others)
03 May 2014 Asagosso
Baheita Kebele
FGDs: women, elders and men
Asabuya FGDs: women, elders and men

ENVIRONMENTAL RESOURCES MANAGEMENT YARA DALLOL BV
9-6
Date Village/ Gov. Leaders Type of Engagement
05 May 2014 Musley FGDs: women
KII: local man, and elder (woman)
06 May Mororo KII: local household
Hamad Ela KII: local business woman and man
07 May 2014 Zonal Government FGD/KII: Zone 2 Officials for health,
education, finance, agriculture, and
others
Secondary data sources used included publicly available electronic data as
well as hard copy data collected from various government offices. The types
of secondary data used included:
Reports from the Ethiopian Central Statistics Agency;
National Population and Household Census (2007);
Reports from the African Health Observatory;
Ethiopian Demographic Health Survey 2011;
Previous ESIAs/ EIAs undertaken in the area; and
Various internet sources.
Limitations
The limitations to the Social Study were related to time constrains and
accessibility of certain sections of the Social Study Area. These limitations are
outlined in Table 9.3 below, along with proposed follow-up actions.
Table 9.3 Limitations and Proposed Follow-up Actions
Limitation(s) Follow-up Action(s)
Respondents tend naturally to exaggerate their
personal situation(s) when being interviewed.
This can compromise the quality of data
collected during one-to-one interviews as well
as FGDs.
Continued testing and ground-truthing of the
socio-economic characteristics of the Project
Area before proceeding with development.
Not all areas of importance for the use of
natural resources were mapped as part of the
study as our guides were not familiar with
some of these locations.
Prior to the commencement of construction
activities, there is a need to work with village
elders and try to locate all these areas.
The majority of the secondary data used in the
report is outdated, especially information from
the 2007 Population and Household Census.
Update relevant sections of the baseline as up
to date information becomes available from
relevant government offices in order to keep
abreast of the socio-economic changes in the
country.
9.2.2 Structure of the Chapter
This Chapter will present the socio-economic and health characteristics of the
receiving environment and is structured as follows:
Political, Governance and Administrative Structure
Demographic Profile

ENVIRONMENTAL RESOURCES MANAGEMENT YARA DALLOL BV
9-7
Health Care Services
Education System
Economic and Livelihood Activities
Utilisation and Dependency on Natural Resources
Vulnerable/ Marginalised Groups
Access to Public Infrastructure and Services
Cultural Heritage
Landscape and Visual
9.3 POLITICAL, GOVERNANCE AND ADMINISTRATIVE STRUCTURE
Ethiopia has a federal system of government which was established in the
early 1990s, in accordance with the Charter of the Transitional Government (a
national charter that functioned as a transitional constitution), adopted in
1991. Prior to this, the country was ruled by monarchs until 1974, when the
Provisional Military Administrative Council (known locally as the Derg)
overthrew Ethiopia’s last monarch, Emperor Haile Selassie. The Derg
established a one-party communist state fronted by Colonel Mengistu Haile
Mariam. In 1991 Mengistu was ousted by the military and a coalition of rebel
groups, known as the Ethiopian People’s Revolutionary Democratic Front
(EPRDF). The EPRDF assumed state power and still continues to govern the
country. It developed the constitution in 1995 which established the Federal
Democratic Republic of Ethiopia (FDRE) with a pluralist political system. The
country is headed by a Constitutional President, currently Mulatu Teshome
Wirtu and the government is headed by an Executive Prime Minister
(Hailemariam Desalegn at the time of writing), who is elected by parliament.
Parliament is divided into two houses; the House of People’s Representatives
and the House of the Federation. The structure of government at a Federal
level is illustrated in Figure 9.2 below.

ENVIRONMENTAL RESOURCES MANAGEMENT YARA DALLOL BV
9-8
Figure 9.2 Government Structure
9.3.1 Administrative Structure
The change from monarchy rule to a federal government system resulted in
the decentralisation of power and administration. As is mentioned
previously, Ethiopia is now divided into nine National Regional States and
two city administrations. Each state is drawn along ethno-linguistic lines and
is endowed with a degree of self–rule. Each state is headed by a state
president which is elected by the state council. These states are further
divided into 103 Zones (sub-regions), 800 Woredas (districts), and 15,000
Kebeles (the lowest administrative units). Furthermore, the changes in the
government system resulted in the two largest pastoral societies, the ANRS
and Somali National Regional State, which have their own regional
governments. Figure 9.3 shows the four government administrative levels in
Ethiopia and their functions.

ENVIRONMENTAL RESOURCES MANAGEMENT YARA DALLOL BV
9-9
Figure 9.3 Administrative Government Structure in Ethiopia
Zone administrations act as mediators between the regional state offices and
the Woredas. They are active administrative institutions that oversee the
function and activities of the Woredas by co-ordinating development
activities, providing public services and technical assistance. Zonal
governance structures vary; in some states zones elect councils, which also
form executive committees, in others, no such councils exist and zonal
executive committee members are appointed by the Regional Council.
Woredas are responsible for planning and implementing development
activities and social programmes within their areas. They oversee the Kebeles
that come under their jurisdiction. Each Woreda has a council and an
executive committee; the council consists of elected representatives from the
Kebele and the committee consists of approximately 12 members, namely
bureau sector chiefs (1).
Kebeles are the lowest government administration units. Each Kebele
Administration (KA) has an elected leadership which includes a Council, a
Cabinet and advisors. The latter is composed of a chairperson, an executive
committee and a social justice committee. Kebeles act as mediators between
local government authorities and local villages and are charged with:
Mobilising village members for communal work, such as the construction
of roads or waterworks.
Communicating government programs and policies to village members.
Presenting village requests to formal government institutions (e.g. district
administration).
(1) Yilmaz and Venugopal, 2008

ENVIRONMENTAL RESOURCES MANAGEMENT YARA DALLOL BV
9-10
In the ANRS, enlisting the support of clan or traditional leaders to
recognise the Afar Ada (customary law).
9.3.2 Traditional Governance Structure
In the local area and across the ANRS, traditional governance structures remain a strong and respected parallel administrative system. Traditionally, the Afar society is structured along the lines of sultanates; tribes, clans, lineages and families. The various sultanates located across Djibouti, Ethiopia and Eritrea have generally been recognised as centres of political and spiritual leadership. Whilst the powers of traditional leaders are reported to have declined in recent years, they still hold sway, especially at the local level. Local community members report that it is clan leaders and elders that provide the strongest and most effective leadership structures at the village level, and the majority of Afar community members will defer to their elders for any important matters. In Afar society the clan is the most important political and social unit. A clan is formed by an extended group of families, and serves as a nucleus for administration and cooperation to conduct social activities among clan members. The clan is also the lowest social unit which can hold communal property rights over land and other natural resources. Clan leadership is composed of a three tiered system composed of clan leaders described in Table 9.4 below. Grading of clans and lineages as young/small/junior (hundah) and elder/bigger/senior (kaddah) is typical amongst the Afar. Different roles are allocated to each lineage: a senior lineage of a clan provides political leadership while a junior one provides ritual leadership or leadership of the sanction-executing unit (fimaa). Typically members of the council of elders (daar-idola) and members of fimaa are recruited from all lineages of a clan.
Table 9.4 Clan Leadership, Roles and Responsibilities
Afar Traditional Leaders Roles and Responsibilities
Clan leader (makabans) The makabans is the external representative of the clan and interacts on behalf of the group with the government administrations and other clans. He is also the arbiter of intraclan disputes.
Council of elders or daar-edola The council of elders or daar-edola are the second most powerful leaders in a clan, and function as the judges of the internal affairs of a clan. They are often elected to their post due to their characteristics of wisdom, impartiality and an ability to make peace. They also act as the chief authority in marriage arrangements and negotiate dowries.
Sanction-executing unit (fimaa/finna) The sanction-executing unit (fimaa/finna) is a multi-
purpose institution whose size and number often varies
between clans. The fimaa leaders carry out basic village
tasks including the execution of sanctions passed by clan
leaders, the supervision of more junior fimaa members
and, in collaboration with clan elders, help to maintain
good relations within the clan.
Despite pressure from the central government, the traditional Afar social and political organisation is still effective at the local level and continues to play a

ENVIRONMENTAL RESOURCES MANAGEMENT YARA DALLOL BV
9-11
strong role in governing Afar social, economic and political life. The traditional system often overlaps with the formal administrative system, both formally and informally with clan leaders and village elders commonly represented on the Kebele board.
9.3.3 Women and Governance
The Afar people are a patriarchal society, with leadership roles largely assigned to men and women generally confined to primary care or domestic tasks such as childcare, cooking and fetching water. Access to land and physical possessions are maintained and controlled by the men; in the event of a marital separation, the man acquires both land and possessions. From previous studies conducted in the broader Social Study Area, women claimed that men control the allocation of resources, with the patriarchal system of inheritance perpetuating this phenomenon, even in the event of death. Whilst land is owned by the village (as opposed to by the individual) plots of land are titled to men as opposed to women and it is men (often elders) who decide how it is used, e.g., for construction or farming purposes. A widowed woman is potentially able to inherit the family property for the wellbeing of her children only if she agrees to remain unmarried. However the closest male relative to the deceased (son or brother) is still able to make decisions concerning her resources and physical possessions. Men are recognised as the chief income generators, and a woman’s dependence on a man is widely recognised in the Social Study Area.
9.3.4 Land Tenure and Ownership
In Ethiopia all land belongs to the State; whilst land can be leased to private individuals, they cannot own it. The Constitution provides for equal access, use, transfer and administration over land. It grants access to agricultural land for rural residents, and allows all inhabitants to utilise the land for farming. Farmers and pastoralists are granted lifetime ‘holding rights’ giving them rights to the land except for its sale and mortgage. Land tends to be governed by common property regimes in pastoral areas. In the ANRS, whilst land tends to be allocated by the Kebele, it is administered at the clan level. Furthermore, each clan customarily manages it resources collectively. Afar traditional institutions allow for two types of resource users: clan
members with primary rights (Waamo) and neighbouring pastoralists who
have secondary rights (Isso) (1). Waamo defines exclusive and in alienable
rights of a member of a specific Afar clan or lineage. Waamo rights bestow a
given clan or lineage with primary rights to a specified territory, whereas Isso
defines secondary inalienable rights which are granted to non-members. As
well as imposing certain restrictions on to holders, Isso (literally meaning
‘lease’) are limited in scope and in time. For example, right holders’ are
prohibited from cutting down certain trees and are only entitled to a defined
grazing land for a specified time period.
In the Social Study Area, whilst all land is allocated by the Kebele leaders, informal land tenure systems also hold a powerful position within the
(1) Hundie, 2008

ENVIRONMENTAL RESOURCES MANAGEMENT YARA DALLOL BV
9-12
villages. For example, only the Afar can hold land in the area; visiting or resident highlanders can only rent it. The majority of the Afar in the Social Study Area reported that they owned their houses (94.7 percent) in addition to holding the land they live on.
9.4 DEMOGRAPHIC PROFILE
This Section provides a description of the demographic characteristics of the
federal, regional and local population. The demographic characteristics
described below include population size and growth, age and gender
distribution, ethnicity and language, religion, population migration and
trends.
9.4.1 Federal Level
The population of Ethiopia has grown by an estimated 314 percent since 1950;
the reasons for continued high population growth are unclear (1). The current
(2014) average growth rate of the population is estimated at 2.9 percent
annually. It is predicted that the Ethiopian population will reach the
100 million mark by 2020. The gender distribution of the population is
approximately a 50/50 percent split; with an estimated ≥64 percent of the
population under the age of 25 years. Children form 44 percent of this group,
while the middle-aged and elderly are forming an estimated seven percent.
This is a feature typical of developing countries; demonstrating younger
populations due to high birth rates, limited family planning and poor access to
health infrastructure. Figure 9.4 shows the population size, growth and age
and gender distribution.
Figure 9.4 Population Size, Growth, Age and Gender Distribution of Ethiopia
Source: World Bank, CIA, and Population Census 2007
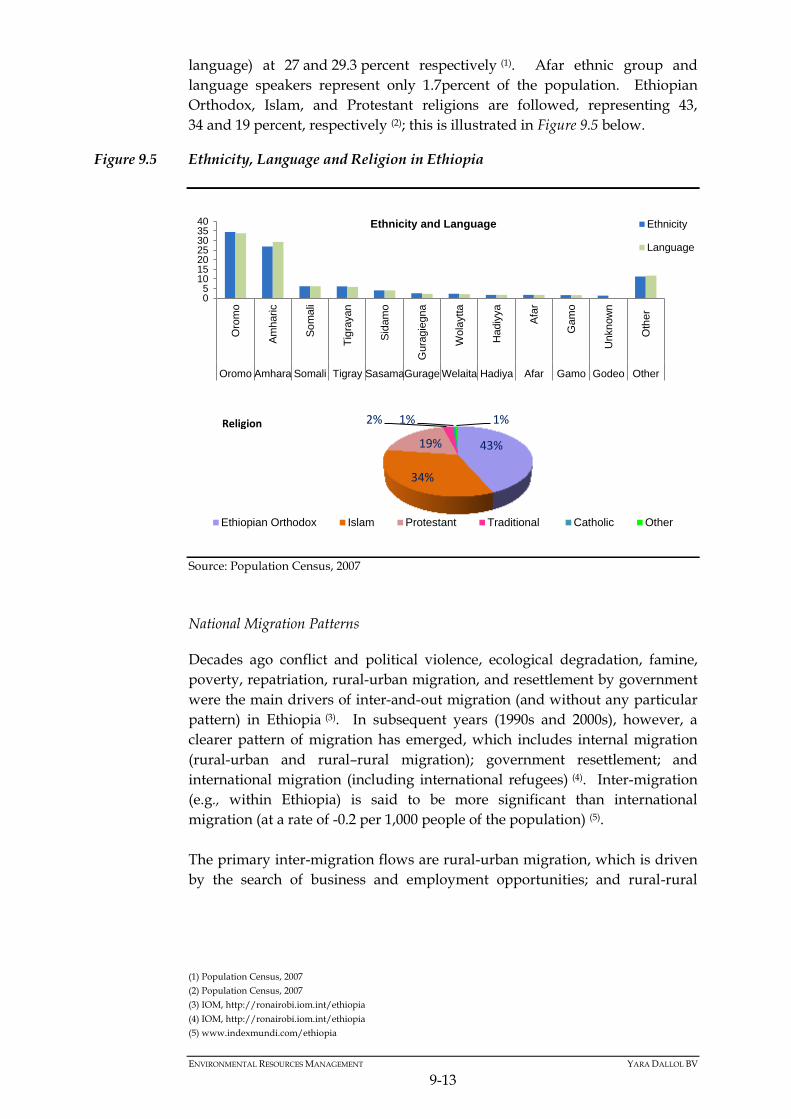
The Oromo ethnic group and language are the most dominant in the country
at 34.5 and 33 percent respectively; followed by Amhara and Amharic (official
(1) www.worldbank.com
86
87
88
89
90
91
92
93
94
95
96
Population Size and Growth in 3 years
2012 2013
2014 2.6% Increase
3.92% Increase
10 0 10
Under 1
5-9
15-19
25-30
35-39
45-49
55-59
65-69
75+
Population (%)
Ag
e g
rou
p
Population by Age and Gender
Male
Female
ENVIRONMENTAL RESOURCES MANAGEMENT YARA DALLOL BV
9-13
language) at 27 and 29.3 percent respectively (1). Afar ethnic group and
language speakers represent only 1.7percent of the population. Ethiopian
Orthodox, Islam, and Protestant religions are followed, representing 43,
34 and 19 percent, respectively (2); this is illustrated in Figure 9.5 below.
Figure 9.5 Ethnicity, Language and Religion in Ethiopia
Source: Population Census, 2007
National Migration Patterns
Decades ago conflict and political violence, ecological degradation, famine,
poverty, repatriation, rural-urban migration, and resettlement by government
were the main drivers of inter-and-out migration (and without any particular
pattern) in Ethiopia (3). In subsequent years (1990s and 2000s), however, a
clearer pattern of migration has emerged, which includes internal migration
(rural-urban and rural–rural migration); government resettlement; and
international migration (including international refugees) (4). Inter-migration
(e.g., within Ethiopia) is said to be more significant than international
migration (at a rate of -0.2 per 1,000 people of the population) (5).
The primary inter-migration flows are rural-urban migration, which is driven
by the search of business and employment opportunities; and rural-rural
(1) Population Census, 2007 (2) Population Census, 2007 (3) IOM, http://ronairobi.iom.int/ethiopia (4) IOM, http://ronairobi.iom.int/ethiopia (5) www.indexmundi.com/ethiopia
05
10152025303540
Oro
mo
Am
haric
So
mali
Tig
rayan
Sid
am
o
Gura
gie
gna
Wola
ytta
Hadiy
ya
Afa
r
Gam
o
Unknow
n
Oth
er
Oromo Amhara Somali Tigray SasamaGurage Welaita Hadiya Afar Gamo Godeo Other
Ethnicity
Language
Ethnicity and Language
43%
34%
19%
2% 1% 1%
Ethiopian Orthodox Islam Protestant Traditional Catholic Other
Religion
ENVIRONMENTAL RESOURCES MANAGEMENT YARA DALLOL BV
9-14
migration, which can be an adaptation strategy to poor agricultural and living
conditions. (1).
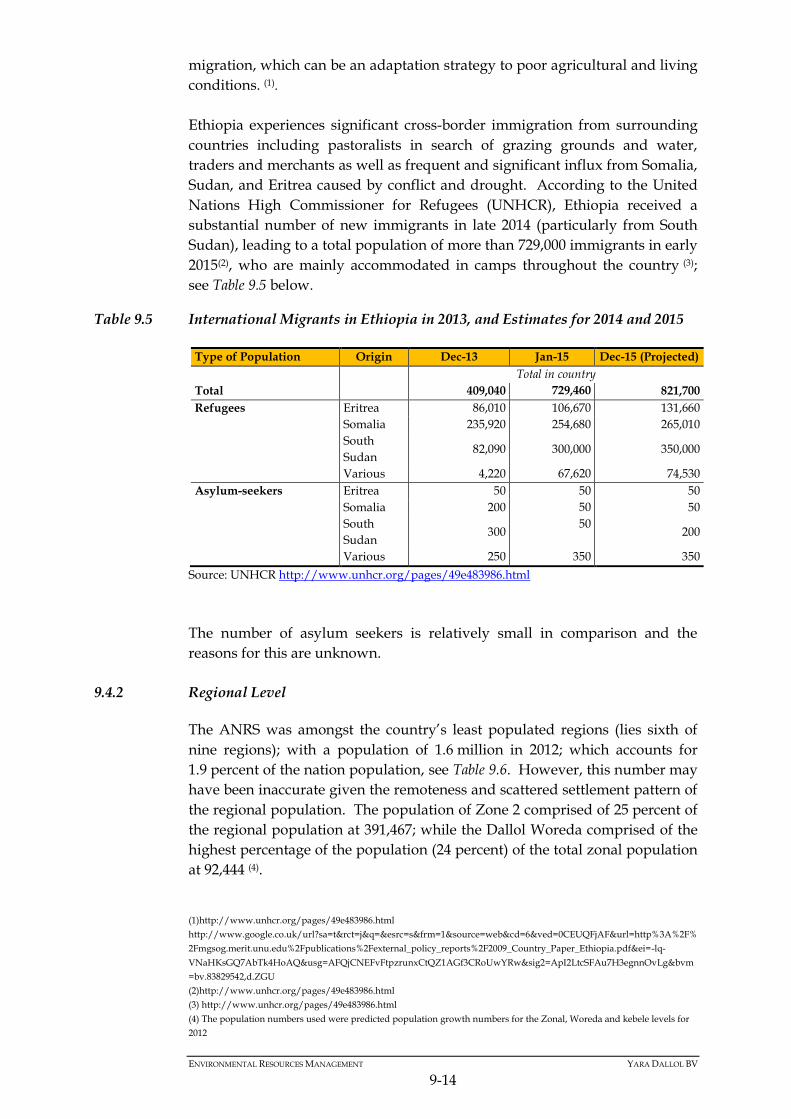
Ethiopia experiences significant cross-border immigration from surrounding
countries including pastoralists in search of grazing grounds and water,
traders and merchants as well as frequent and significant influx from Somalia,
Sudan, and Eritrea caused by conflict and drought. According to the United
Nations High Commissioner for Refugees (UNHCR), Ethiopia received a
substantial number of new immigrants in late 2014 (particularly from South
Sudan), leading to a total population of more than 729,000 immigrants in early
2015(2), who are mainly accommodated in camps throughout the country (3);
see Table 9.5 below.
Table 9.5 International Migrants in Ethiopia in 2013, and Estimates for 2014 and 2015
Type of Population Origin Dec-13 Jan-15 Dec-15 (Projected)
Total in country
Total 409,040 729,460 821,700
Refugees Eritrea 86,010 106,670 131,660
Somalia 235,920 254,680 265,010
South
Sudan 82,090 300,000 350,000
Various 4,220 67,620 74,530
Asylum-seekers Eritrea 50 50 50
Somalia 200 50 50
South
Sudan 300
50 200
Various 250 350 350
Source: UNHCR http://www.unhcr.org/pages/49e483986.html
The number of asylum seekers is relatively small in comparison and the
reasons for this are unknown.
9.4.2 Regional Level
The ANRS was amongst the country’s least populated regions (lies sixth of
nine regions); with a population of 1.6 million in 2012; which accounts for
1.9 percent of the nation population, see Table 9.6. However, this number may
have been inaccurate given the remoteness and scattered settlement pattern of
the regional population. The population of Zone 2 comprised of 25 percent of
the regional population at 391,467; while the Dallol Woreda comprised of the
highest percentage of the population (24 percent) of the total zonal population
at 92,444 (4).
(1)http://www.unhcr.org/pages/49e483986.html
http://www.google.co.uk/url?sa=t&rct=j&q=&esrc=s&frm=1&source=web&cd=6&ved=0CEUQFjAF&url=http%3A%2F%
2Fmgsog.merit.unu.edu%2Fpublications%2Fexternal_policy_reports%2F2009_Country_Paper_Ethiopia.pdf&ei=-lq-
VNaHKsGQ7AbTk4HoAQ&usg=AFQjCNEFvFtpzrunxCtQZ1AGf3CRoUwYRw&sig2=ApI2LtcSFAu7H3egnnOvLg&bvm
=bv.83829542,d.ZGU (2)http://www.unhcr.org/pages/49e483986.html (3) http://www.unhcr.org/pages/49e483986.html (4) The population numbers used were predicted population growth numbers for the Zonal, Woreda and kebele levels for
2012

ENVIRONMENTAL RESOURCES MANAGEMENT YARA DALLOL BV
9-15
Table 9.6 Population Size and Distribution: Regional, Zone, Woreda, and Kebeles
Area Population Size
Afar National Regional State 1,602,995
Zone 2 391,467 (25%)
Dallol Woreda 92, 444 (6%)
Project Affected Kebeles: (Adkuwa, Alefan
Kulili, Bada Ermile, Bada Admeruk)
22,938
Sources: Source: http://www.geohive.com/cntry/ethiopia.aspx (accessed on May 14, 2014)
The population of the Dallol Woreda is likely to have increased further with
the presence of the military, and people moving into the area in search of
employment and business opportunities associated with the mining activities
that occur across the Woreda.
The regional population is said to have an annual population growth rate of
2.1 percent which is 0.8 percent below the national growth rate (1). The
average household size for the region was 5.7 people/household; with the
rural and urban households averaging 6.1 and 3.9 people/household
respectively. The average of gender distribution of the population is 50/50 for
the region, zone 2 and Woreda; as indicated in Table 9.7 below.
Table 9.7 Population Characteristics the Afar National Regional State
Afar National
Regional State
Zone 2 Dallol Woreda
Population growth
rate (% per annum)
2.1 2.2 -
Urban population (%
of population)
18 13 8
%age of population
below age of 15 (%)
45 43 48.
Gender Split in % Male: 50 Female: 50 Male: 56 Female: 44 Male: 56 Female: 44
Sources: World Bank, 2010 and Population Census, 2007
Table 9.7 further indicates that majority of the population in the ANRS
(82 percent) resides in rural areas and only 18 percent in urban areas (2). Only
eight percent of the population reside in urban areas at the Woreda level. The
population across the region was young in 2007 (during the census) with
young children and youths forming 45 percent of the population; with the
young population at Woreda level slightly higher than that of the region (by
three percent). The young population can be attributed to the early age of
marriage amongst the population, which subsequently results in early
pregnancies, as well as a general lack of knowledge and availability of
contraceptives.
(1) Population Census Commission, 2007 (2) Population Census Commission, 2007

ENVIRONMENTAL RESOURCES MANAGEMENT YARA DALLOL BV
9-16
The predominant ethnic group in the ANRS are the Afar people (90 percent)
followed by Amhara, Arogba and Tigray, with smaller numbers (less than
one percent) of Oromo, Welaita and Hadiya (1). The Afarigna language is
widely spoken in the region. The most common religion in the region is Islam
averaging 96 percent as indicated in Figure 9.6 (2).
Figure 9.6 Religion: Afar National Regional State, Zone 2, and Woreda
Source: The 2007 Population and Housing Census of Ethiopia: Statistical Report for Afar
Regional Migration Patterns
Inter-migration is high within the region since an estimated 80 percent of the
population of the ANRS are transhumant –pastoralists and migrate in search
of grazing areas for their livestock within the regional boundaries (3). Other
Afar people migrate out of the region or other parts of the region for trade
purposes, and in search of business and employment opportunities. The
region and more specifically Zone 2 also have high levels of in-migrants from
neighbouring countries (Somalia and Eritrea) and from the highlands of
Ethiopia.
Zone 2 is the centre of the salt trade, potentially resulting in the higher
presence of Amhara and Tigrean groups (traditionally involved in the
artisanal salt mining industry). In addition the Ethiopia – Eritrea war has
resulted in the displacement of people along the border including Eritreans
who are predominantly from the Tigrean ethnic group. Zone 2 is aligned to
the north-eastern Eritrean border potentially allowing for easy access from
Eritrean Tigreans into Ethiopia.
The non-Afars are often involved in a variety of activities including small-
scale trade, local government jobs and construction. In-migration of non-Afar
groups has been particularly well documented in the southern parts of the
region where large commercial farms have been established. For instance, the
Dallol Woreda is reported to contain an estimated 15,000 refugees at present
(1) Source: CSA, “The 2007 Population and Housing Census of Ethiopia: Statistical Report for Afar. 2) Population Census Commission, 2007 (3) The 2007 Population and Housing Census of Ethiopia: Statistical Report for Afar
0
10
20
30
40
50
60
70
80
90
100
Orthodox Muslim Protestant Traditional Catholic
Afar Region
Zone 2
Dallol Woreda

ENVIRONMENTAL RESOURCES MANAGEMENT YARA DALLOL BV
9-17
(2014) (1). It should be noted that specific data was not available and estimates
by officials have been relied upon.
9.4.3 Village Level
In the Social Study Area, the population size in various settlements varies
from 8,968 at its highest and 1,757 at its lowest as indicated in Table 9.8 below.
The population of the Social Study Area is dominated by youths, young
children and middle aged people with fewer elderly (mostly in their 70s).
Table 9.8 Population Size and Distribution of Villages/ Kebeles Consulted in the Social
Study Area
Kebele /Town Population Gender Distribution No. of Households
No. Housing Units
Male Female
Adkuwa (Rural Kebele) 8, 968 5,282 3,686 1,258 1,239
Adkuwa Village 1,757 1,050 707 371 334
Simbilali 3,725 2,023 1,702 6,77 670
Alefan-Kulili 3,314 1,840 1,474 509 506
Bheieta 3,405 1,835 1,570 455 426
Bada Admeruk 3,730 2,079 1,651 581 570
Bada Ermile 6,926 3,878 3,048 988 973
Source: Focus Group Discussions, 28 April to 7 May 2014
The population of the Social Study Area is mainly of Afar ethnicity and speak
Afarigna language; with a few people who speak Amharic (specifically the in-
migrant population; trans-located government officials, the Afar that have
received some schooling and those who have worked elsewhere outside the
region). Islam is the main religion followed by the population.
The population is male dominated (64 percent) and 36 percent female. Even
though the male population is higher than the female population, there are
fewer men residing permanently in the villages, as they often migrate to other
areas within the broader Social Study Area, region and Woreda in search of
grazing and economic opportunities. Often the elderly men are found
residing alongside young boys and youths as well as community leaders/ or
Kebele leaders.
Migration Patterns in the Social Study Area
Similarly to the pattern of regional migration, the population of the Social
Study Area tend to migrate in search of pastures and collection of non-timber
forest products (NTFPs) i.e., palm leaves as well as trade opportunities. Due
to the desert conditions (including drought) in the Social Study Area and to
livelihoods that are dependent on agricultural activities (mainly livestock
rearing), the male population tends to migrate in search of better pastures.
(1) Pers Comm, May 2014

ENVIRONMENTAL RESOURCES MANAGEMENT YARA DALLOL BV
9-18
Some of the areas known for their grazing in the Social Study Area are
Hamah, Bada, Berketi and Dodom; (refer to Figure 9.17 on Page 9-47). These
are close to the villages of Musley, Asabuya, Bada Ermile and Bada, which are
located further within a 10km radius of the Project Area. Men will travel up to
50km to reach these various pastures and will stay in these areas for four to
six months at a time or until the pastures cannot sustain their livestock. They
will then move on to other area or track back to their own villages especially
once they have received word that the pastures there have recovered.
The local population also travels outside the Ethiopian boarder and into
Eritrea to purchase and sell goods. In Bada Ermile and Bada Admeruk people
reported that they used to travel to Eritrea to sell livestock and some goods
but this has decreased due to the conflict between the countries.
In-migration to the Social Study Area is reportedly low consisting of mainly
traders and salt miners. In other parts of the broader Social Study Area, in-
migration has increased with the start of mining exploration activities of
Allana Potash Corp., G&B and Yara Dallol BV, due to the employment
opportunities presented by the road construction by the Defence Construction
Engineering (DCE). The economic activities associated with the presence of
these companies and the military has resulted in an increased migration of
both men and women into the area.
9.5 HEALTH CARE SERVICES
This Section provides a description of the Federal, Regional, and Local health
characteristics for the Social Study Area. This includes an analysis of the
current health context and prevalent diseases, as well as a discussion of the
standard and availability of health infrastructure across the Federal, Regional
and Local levels.
9.5.1 Federal Level
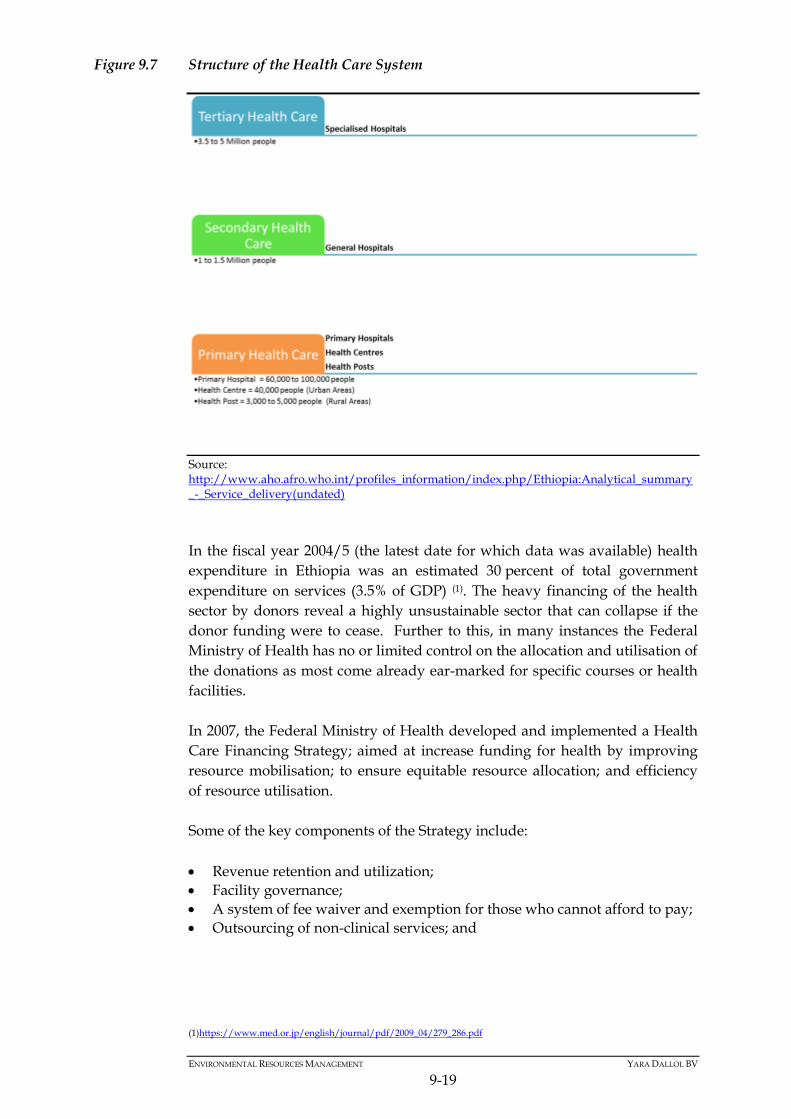
The health care system in Ethiopia comprises of a three-tiered structure
namely tertiary, secondary and primary health care services as shown in
Figure 9.7.
ENVIRONMENTAL RESOURCES MANAGEMENT YARA DALLOL BV
9-19
Figure 9.7 Structure of the Health Care System
Source: http://www.aho.afro.who.int/profiles_information/index.php/Ethiopia:Analytical_summary_-_Service_delivery(undated)
In the fiscal year 2004/5 (the latest date for which data was available) health
expenditure in Ethiopia was an estimated 30 percent of total government
expenditure on services (3.5% of GDP) (1). The heavy financing of the health
sector by donors reveal a highly unsustainable sector that can collapse if the
donor funding were to cease. Further to this, in many instances the Federal
Ministry of Health has no or limited control on the allocation and utilisation of
the donations as most come already ear-marked for specific courses or health
facilities.
In 2007, the Federal Ministry of Health developed and implemented a Health
Care Financing Strategy; aimed at increase funding for health by improving
resource mobilisation; to ensure equitable resource allocation; and efficiency
of resource utilisation.
Some of the key components of the Strategy include:
Revenue retention and utilization;
Facility governance;
A system of fee waiver and exemption for those who cannot afford to pay;
Outsourcing of non-clinical services; and
(1)https://www.med.or.jp/english/journal/pdf/2009_04/279_286.pdf

ENVIRONMENTAL RESOURCES MANAGEMENT YARA DALLOL BV
9-20
Establishing a private sector to strengthen the supply and delivery of
quality health services (1).
The Federal Ministry of Health is envisioning that the implementation of the
strategy will result in effective utilisation of the funds by the various public
health programmes implemented, and also allows for regular monitoring and
evaluation.
The health care system in Ethiopia has a shortfall in available health workforce
with a ratio of 0.7 health workers per 1,000 people, which is low compared
with the WHO recommendations of 2.3 health workers/1,000 people. The
greatest shortfall is for physicians, whose numbers show a decreasing trend
over past years and are now 1: 42,706 people; this is among the lowest ratio in
sub-Saharan Africa (2). In rural and remote areas, 83 percent of the population
is underserved by health workers (3).
Health indicators for the country are provided in Table 9.9 below and reveal a
population with a life expectancy of 60 years, and a male population with a
short lifespan compared to its female counterparts at 57 and 62 years,
respectively. Furthermore, the country has a significantly higher birth rate of
39 births/1,000 people than the death rate of nine deaths / 1,000 people (4); this
could provide an explanation for the rapid increase in the Ethiopian
population growth rate.
(1) http://www.aho.afro.who.int/profiles_information/index.php/Ethiopia:Analytical_summary_-
_Health_financing_system#cite_note-eight-2 (2) WHO: Africa Health Observatory (3) Ibid. (4) WHO: Africa Health Observatory

ENVIRONMENTAL RESOURCES MANAGEMENT YARA DALLOL BV
9-21
Table 9.9 Health Profile of the Ethiopian Population
Health Indicators Units / Percentages
Birth rate 37.66 births/1,000 population (2014 est.)
Death rate 8.52 deaths/1,000 population (2014 est.)
Infant mortality rate Total: 55.77 deaths/1,000 live births
Male: 63.77 deaths/1,000 live births
Female: 47.53 deaths/1,000 live births (2014 est.)
Total fertility rate 5.23 children born/woman (2014 est.)
Life expectancy at birth total population: 60.75 years
Male: 58.43 years
Female: 63.15 years (2014 est.)
Contraceptive prevalence rate 28.6% (2010/11)
HIV/AIDS - adult prevalence rate 1.3% (2012 est.)
HIV/AIDS - people living with
HIV/AIDS
758,600 (2012 est.)
HIV/AIDS - deaths 47,200 (2012 est.)
Access to improved water source Urban: 96.8% of population
Rural: 42.1% of population
Total: 51.5% of population (2012 est.)
Access to improved sanitation facility Urban: 27.4% of population
Rural: 22.8% of population
Total: 23.6% of population (2012 est.)
Maternal mortality rate 350 deaths/100,000 live births (2010)
Children under the age of 5 years
underweight
29.2% (2011)
Health expenditures 4.7% of GDP (2011)
Physicians density 0.03 physicians/1,000 population (2009)
Hospital bed density 6.3 beds/1,000 population (2011)
Source: http://www.indexmundi.com/ethiopia/demographics_profile.html
Ethiopia is characterised by a predominantly rural and impoverished
population with limited access to safe water, housing, sanitation, food and
health care. The disease burden (responsible for 74 percent of deaths and
81 percent of disability adjusted life years lost per year) is dominated by
malaria, prenatal and maternal death, acute respiratory infection, nutrition
deficiency, diarrhoea and HIV/AIDS (1). As indicated in Figure 9.8,
communicable diseases are the main cause of mortality in the country
(1) http:/ / www. aho. afro. who. int/ profiles_information/ images/ d/ d5/ Ethiopia-Statistical_Factsheet. pdf

ENVIRONMENTAL RESOURCES MANAGEMENT YARA DALLOL BV
9-22
(70 percent) followed by non-communicable diseases (19 percent) and injuries
led to an estimated eleven percent of deaths.
Figure 9.8 Diseases that have resulted in Mortality in Ethiopia
Source: Ethiopia: Health Profile (undated) http://www.who.int/gho/countries/eth.pdf?ua=1
The limited number of health institutions, inefficient distribution of medical
supplies and disparity between rural and urban areas, due to severe under-
funding of the health sector, make access to health-care services very difficult
even for preventable diseases (1).
9.5.2 Regional Level
Regionally, health services and infrastructure are also relatively
underdeveloped, i.e., of 116 hospitals in the country four are within the
Region (approximately three percent); furthermore of 14,192 health posts
countrywide only 251 are within the Region, accounting for approximately
1.7 percent (2). This is approximately in line with the percentage of the national
population living in the ANRS. Table 9.10 below shows the distribution of the
health care infrastructure and personnel at Federal, Regional and Woreda
levels.
Table 9.10 Healthcare Services and Infrastructure in the Afar National Regional State
Health Services & Infrastructure Federal Regional Dallol Woreda
Hospitals 116 4 -
Health Centres 2,142 28 5
Health Posts 14,192 251 15
Healthcare Professionals
Physicians (general practitioners
and specialists)
1,421 15 -
Health Officers 3,096 29 1
Nurses (Diploma and BSc holders) 26,423 185 22
Pharmacy Professionals 3,624 63 2
Medical Laboratory Professionals 3,672 40 3
(1)http:/ / www. aho. afro. who. int/ profiles_information/ images/ d/ d5/ Ethiopia-Statistical_Factsheet. pdf (2) Afar Regional Bureau of Health and Ministry of Health, 2011
0
10
20
30
40
50
60
70
80
Communicable Diseases Non-communicableDiseases
Injuries

ENVIRONMENTAL RESOURCES MANAGEMENT YARA DALLOL BV
9-23
Health Services & Infrastructure Federal Regional Dallol Woreda
Community Health Workers/
Health Extension Workers (HEW)
30,995 572 36
Source: Afar Regional Bureau of Health and Ministry of Health, (2011)
Common illnesses found at Woreda level are:
Malaria (especially during the rainy season);
Upper Respiratory Infection (URI) due to dust;
Diarrhoea due to the consumption of un-purified water;
TB (reasons unclear);
Problems linked to the consumption of un-purified water;
Urinary tract /bladder Infection due to unsafe drinking water;
Kidney illnesses due to limited water consumption;
Sun stroke; and
Eye disease due to dust.
Based on interviews with health officials (1) in the Woreda, an estimated
20 percent of the Woreda population has HIV/AIDS; however, they noted that
the prevalence numbers were declining. The figure of 20 percent does
however seem exaggerated and according to the USAID (July 2008), the level
of HIV/AIDS in the ANRS is approximately 2%. No information is available
on the provision of anti-retroviral drugs being given to the infected.
9.5.3 Local Level
Access to health care services in the Social Study Area is low due to lack of
health care facilities and medicines. Of the villages visited, Bada had access to
health centre and a health post, while the remainder of the villages had no
formal health facilities or only access to a health post (refer to Table 9.11).
Villagers with no health facilities tend to go to the Adukua Kebele for medical
care.
Table 9.11 Access to Health care Facilities in the Social Study Area
Village/ Kebele Health Centres Health Posts
Bada Admeruk X X
Bada Ermile - X
Elifanti Abaa/ Kulili - X
Asabuya - -
Musley - -
Asagosaa - X
Loko Oguda - -
All health care facilities in the Social Study Area have medical professionals
(i.e, nurses); however, these professionals cannot provide the services needed
due to a lack of medication and supplies and capacity shortages. This is
exacerbated by the lack of electricity for refrigeration of perishable medicines.
(1) Pers Comm, May 2014
ENVIRONMENTAL RESOURCES MANAGEMENT YARA DALLOL BV
9-24
The main service that the health professionals are able to provide daily is
primary care in the form of first aid and the vaccination of children. The
vaccines are sent by the Federal Ministry of Health using refrigerated trucks to
ensure their viability. Once the health workers have received the vaccines,
they must be administered within 12 hours or will become unsafe for use.
All seriously ill people are referred to a hospital in Mekele. There are four
ambulances across the Woreda; but they often do not have fuel and as such
people have to make their own arrangements for the transportation of the sick
to Mekele. This is difficult given the lack of public transportation services and
low private vehicle ownership in the area. During in-field baseline data
collection, local communities close to the Project Area reported that Yara
Dallol BV has been assisting them with the transportation of gravely ill people
to Mekele.
Water-borne diseases are the most dominant diseases in the Social Study Area,
especially diarrhoea due to a lack of potable water, reportedly followed by
kidney related illnesses and urinary tract infections. Health workers hold
frequent campaigns promoting free water treatment methods (such as boiling
of water before consumption), but people often do not follow advice given
and suffer from water borne diseases.
Other health risks are linked to the lack of sanitation facilities and people
using open spaces to relieve themselves, and in doing so contaminate surface
water sources. During diarrhoea outbreaks, the health workers distribute
agari (a liquid/ or powdery water purification drug) to households. Kidney
illnesses along with urinary tract infections are reported to be caused by
dehydration due to the heat and shortage of water in the area.
The lack of electricity and medication was reported as being the main
challenge facing health care service provision in the Social Study Area.
During baseline data collection communities reported that the lack of potable
water and sanitation facilities is the main cause of illnesses and deaths.
No cases of HIV/AIDS were reported by the local population; suggesting that
the prevalence of the diseases is not formally recognised or recorded.
9.6 EDUCATION SYSTEM
The Ethiopian education system consists of four cycles; two cycles of primary
and two cycles of secondary schooling (refer to Figure 9.9).

ENVIRONMENTAL RESOURCES MANAGEMENT YARA DALLOL BV
9-25
Figure 9.9 Ethiopian Education System
Source: http://shelbycearley.files.wordpress.com/2010/06/education-in-ethiopia.pdf

ENVIRONMENTAL RESOURCES MANAGEMENT YARA DALLOL BV
9-26
As indicated in Figure 9.9, the education system comprises of eight years of
primary education subdivided into two cycles of basic primary (Grade one to
four) and general education (Grade five to eight). Secondary education also
comprises of two cycles, general secondary education (Grade nine and ten)
and preparatory secondary education (Grade 11 and 12). When pupils
complete second cycle of primary education they are required to take the
Eighth Grade National Examination.
Subsequent to attaining their Primary School Leaving Certification
Examination (PSLCE); pupils can either continue onto secondary education
cycles or enrol for a junior level Technical and Vocational Education and
Training (TVET). Those who choose to attend TVET can seek employment
once they attain their TVET certification. The second cycle of a secondary
education entails a further four years of schooling with those who complete
grade nine and ten attaining the Ethiopian General Secondary Education
Certificate Examination (EGSECE); if able to complete Grade 11 and 12 pupils
can sit for the Ethiopian Higher Education Entrance Examination (1).
Key indicators of education status at a national level are shown in the Table
9.12. These show an increase in education expenditure to 5.5 percent of total
expenditure in 2010 (an increase from the 4 percent in 2004) (2). School
enrolment has increased from 68.5 percent to 82 percent in both primary and
secondary schooling levels and the government is predicting 100 percent
enrolment in primary school at the end of 2014/2015 (3).
Table 9.12 Key National Education Indicators
Indicator Value
Enrolment rate % (2011) 82
Education expenditure (% of GDP) (2005 – 2010) 5.5
Pupil-teacher ratio, primary (2010) 54
Pupil-teacher ratio, secondary (2010) 43
Literacy rate, adult total (% of people ages 15 and above) (4) (2008) 29.8
Source: World Bank, Databank, 2011
Literacy levels of the Ethiopian population are low with an estimated
89 percent having no schooling and/ or have attained some primary
schooling; as illustrated in Figure 9.10 (5). Of this total, 45 percent of the
population has no schooling; while for others (44 percent) have some primary
education. As expected, the urban population are more literate compared to
the rural population (78.6 and 49.1 percent) respectively. Furthermore, only
0.1 percent completed secondary school in rural areas compared to 3.2 percent
in urban areas (6).
(1) Ministry of Education, 2012 (2) World Bank, Databank, 2011 (3) World Bank, Databank, 2011 (4) Expressed as a %age - the number of children enrolled in primary school who belong to the age group that officially
corresponds to primary schooling, divided by the total population of the same age group. (5) Central Statistics Agency, 2011 (6) The Central Statistics Agency, 2011

ENVIRONMENTAL RESOURCES MANAGEMENT YARA DALLOL BV
9-27
Figure 9.10 Highest Level of Schooling Attended or Completed in Ethiopia
Source: Central Statistics Agency, 2011
9.6.1 Regional Level
Regionally an estimated 61.3 percent of the total population has not received
any education; with an estimated 69.3 percent of those without an education
being females and 53.4 percent male (1). This can be attributed mainly to the
pastoralist and nomadic lifestyle of the Afar people, since this a key
influencing factor in preventing children from attending school (refer to Table
9.13). Other barriers to school enrolment in rural areas include family
disapproval, marriage, lack of schooling facilities, poverty, and domestic /
farming / herding duties.
Table 9.13 Literacy Levels of the ANRS Population
Indicator Percentage
No schooling 61.3
Some schooling (primary and secondary) 38.7
Female
Literacy rate 38.4
Illiteracy amongst females compared to males 69.3
Some primary education (female) 25
Completed primary education (female) 1.6
Completed secondary education (female) 0.3
Male
Literacy rate 52.5
Illiteracy amongst males compared to females 53.4
Some primary education (male) 35.3
Completed primary education (male) 3.4
Completed secondary education (male) 1.2
Source: Final Report: Demographic Health Survey, 2011
(1) Central Statistics Agency, 2011
45% 44%
3% 4% 1%
3%
0%
5%
10%
15%
20%
25%
30%
35%
40%
45%
50%
No education Some primary Completedprimary
Some secondary Completedsecondary
Tertiaryeducation

ENVIRONMENTAL RESOURCES MANAGEMENT YARA DALLOL BV
9-28
For the 2014 school year, there are 7,500 pupils registered at the various
schools in the Woreda (1). Of these, 69 percent are males and 31 percent
females. The Woreda has a total of 47 schools of which 49 percent are 1st Cycle
Primary Schools, and 42 percent 2nd Cycle Primary Schools and two percent 1st
and 2nd Cycle Secondary Schools (2). There are 250 teachers divided amongst
the various school levels, resulting in a teacher-pupil ratio of 1:30. The low
teacher-pupil ratio is caused by low attendance of schooling in pastoralist
communities such as that of the Woreda.
9.6.2 Village Level
Like in many pastoralist communities in the world, the general levels of
education in the Social Study Area are low, even by rural standards. This is
especially significant amongst the women; with an estimated 95 percent being
illiterate in the Social Study Area. The shortage of schools across the Social
Study Area, and the traditional/ cultural beliefs that educated women are
unmarriageable also contribute to this, along with the amount of domestic
work that is expected of a girl child.
There is a severe lack of schools across the Social Study Area; and where they
are present, they only provide primary education and rarely secondary
education. Bada Ermile and Bada Ademruk have schools; while Elifan Aba/
Kulili access is approximately one kilometre away from village. Table 9.14
shows the availability of schools in the Social Study Area
Table 9.14 Surveyed Villages and Schools in their Area
Village 1st Cycle 2nd Cycle 1st Cycle 2nd Cycle Distance from
Village to School
Primary Education Secondary Education
Bada Admeruk 1 1 - - 500 m
Bada Ermile 1 1 - - 50 m to 500 m
Elifanti Abaa/ Kulili 1 - - - 1-1.5 km radius
Asabuya No schools, children attend school in Bada/ Baheita -
Musley No schools, children attend school in Bada/ Baheita -
Asagosaa 1 - - - 1 km
Loko Oguda No schools, children attend school in Bada/ Baheita -
The shortage of schools and the resultant distances that pupils have to travel
to reach school has resulted in many children not attending school.
Furthermore, the combination of household chores including collection of
water and fuel wood, preparing the fields for cropping, and livestock grazing
are regarded as more important for the household than children attending
school.
Vocational training centres and other institutions of higher learning are not
found in the Woreda, its Kebeles or Social Study Area. For a person to obtain
(1) Pers Comms, May 2014 (2) Zone-2 Administration Office, May 2014

ENVIRONMENTAL RESOURCES MANAGEMENT YARA DALLOL BV
9-29
higher education they need to relocate to Semera, Mekele, or Addis Ababa;
this requires financial support which many families cannot afford to give to
their children.
Figure 9.11 Typical School Building in the Social Study Area
The schooling system in the Social Study Area is also impacted by:
A shortage of classrooms resulting in some pupils being taught outside or
under the trees.
A shortage of learning materials (textbooks, chalkboards, pens/pencils,
exercise books.
Budgetary shortfalls.
Shortage of qualified school teachers.
High teacher turnover due to the harsh conditions in the area.
9.7 ECONOMIC AND LIVELIHOOD ACTIVITIES
This Section describes the economic and livelihood activities at Federal,
Regional and Local levels.

ENVIRONMENTAL RESOURCES MANAGEMENT YARA DALLOL BV
9-30
9.7.1 Federal Level
Ethiopia’s strong economic performance continued for the tenth consecutive
year, with real GDP growth estimated at 9.7 percent in 2012/13 (fiscal year) (1).
As in preceding years, the economic growth was broad-based with all the
economic sectors contributing to the growth. Sectorial contributions to the
GDP are shown in Table 9.15.
Table 9.15 Sectorial Contribution to the GDP: 2012/2013 Fiscal Year
Sectors Contribution in Percentages
Agriculture, hunting, forestry, fishing 43
of which fishing 0.1
Mining 1.3
Manufacturing 3.9
Electricity, gas and water 1
Construction 4.8
Wholesale and retail trade, hotels and restaurants 18.8
of which hotels and restaurants 2.9
Transport, storage and communication 5.3
Finance, real estate and business services 9.8
Public administration, education, health and social
work, community, social and personal services
3.4
Other services 5.7
Source: African Economic Outlook: Ethiopia 2014
Agriculture, hunting, forestry, fishing sector continued to be the backbone of
the Ethiopian economy, contributing 43 percent to GDP. In the same fiscal
year (2012/13), total crop cultivated land expanded by 0.3 million ha, and the
yield per hectare also increased to 1.8 tons (2). The growth in the sector was
boosted by:
Good weather in the cereal growing areas;
Enhanced government support services to smallholders;
Improvement in yields; and
Expansion in the area under cultivation (3).
Regardless of the improvements in yields, agricultural productivity is still
very low, partly due to limited use of chemical fertilisers and improved
farming practices. Furthermore the rise in population growth rates have
contributed to a decline in farm size as some of the land originally used for
agricultural purposes is now being used for settlements. As a result an
estimated 4.5 million people remain dependent on food relief such as PSNP.
(1) African Economic Outlook: Ethiopia, 2014 (2)African Economic Outlook: Ethiopia, 2014 (3) Africa Economy Outlook Ethiopia 2014

ENVIRONMENTAL RESOURCES MANAGEMENT YARA DALLOL BV
9-31
9.7.2 Regional Level
Like the rest of the country, the ANRS is reliant on the agricultural sector for
livelihoods; specifically livestock production at 90 percent. Livestock keeping
in the region is mainly for subsistence purposes and it is only sold when
needed. According to the local authorities, the production of livestock is
decreasing in the region especially in Zones 1, 2, and 4 due to recurring
drought and land degradation. Livestock produced include camels, goats,
sheep and cattle; but of these camels and goats are the most resilient to the
harsh climatic conditions of the region. Zonally the proportion of goats was
higher at 43 percent, followed by sheep at 24 percent, cattle at 17 percent and
camels at 13.5 percent (1).
In the southern Zones of the ANRS, along the Awash and Mille River basins,
people engage in agro-pastoralism (migrating to and fro from these areas to
grow crops). These areas are marked by large scale crop farming, owned by
the state or by individuals. Some of the crops grown in the area include
cotton, sorghum and vegetables.
Livelihoods in Dallol Woreda are similar to those undertaken at regional level,
and consist of livestock production and small scale crop production. The
quantity of livestock found in the Woreda is indicated in Table 9.16 below.
Table 9.16 Summary of Livestock Population in Dallol Woreda, 2009
Woreda Livestock Types and Number Total
Dallol Goats Sheep Cattle Camels Equines Poultry
13,081 17,600 41,783 32,804 1,106 - 106,374
Source: BOFED, 2009: Afar Regional Atlas 2. June 2009
Livestock keeping also forms a significant part of the daily sustenance of
households through meat and milk products. While livestock products (viz.
skin hides and butter produced from the milk) serve as a source of income for
households. The crops produced are consumed or used to barter with
neighbours for other household items.
Crop production serves as the secondary livelihood activity in the Woreda.
Crops grown in the area comprise of sorghum and maize. As depicted in
Table 9.17, Kebeles such as Bada Admeruk, Bada Ermile, Leasgedi, Alefan-
Kulili, Garsat, Sebiba, Adkuwa (rural) and Asegara are agro-pastoral
communities. They combine livestock keeping with crop production systems
as strategy to overcome consequences of repeated droughts and degradation
of natural pasture. Furthermore, these Kebeles have access to somewhat
sustainable water sources which allow them to grow crops.
(1) BOFED, 2009: Afar Regional Atlas 2. June 2009

ENVIRONMENTAL RESOURCES MANAGEMENT YARA DALLOL BV
9-32
Table 9.17 Livestock and Crop Production by Kebeles in the Dallol Woreda
Kebele Production System of the Kebele
Pure-Pastoralism Agro-pastoralism
Iynedeb X
Leasgedi X
Ma’awo X
Sebiba X
Berih X
Adiaro X
Asegara X
Adkuwa (Rural Kebele) X
Simbilali X
Alefan-Kulili X
Bheyeta X
Garsat X
Bada Admeruk X
Bada Ermile X
Source: Dallol Woreda Administration Office, May 2014
9.7.3 Local level
Livelihoods in the Social Study Area comprise mainly of agricultural activities; with livestock keeping as the primary economic activity and crop production as a secondary activity along with trading. These livelihoods activities are described in detail below. Livestock Production
The population of the Social Study Area are pastoralists who keep livestock
for subsistence and income generation. The most common livestock kept are
goats, sheep, cattle, donkeys and camels as ranked by the interviewees. The
majority of households in the area keep goats as they are able to survive the
harsh climatic conditions of the area. Those residing in close proximity to
permanent water sources such as Bada Admeruk and Bada Ermile also keep
cattle (which have a low tolerance for heat) and a very low number of
households also keep sheep, donkeys and camels.
It was reported during stakeholder engagement events that approximately ten
years previously a household was perceived to have wealth in the Social
Study Area in terms of the number of camels a household owned; however,
the price of camels has increased and trade has decreased significantly, as
such people can no longer afford to purchase camels as they used to.
Currently, a household that owns more than ten goats is regarded as rich;
while a household with a large variant of livestock is regarded as very
wealthy.
Livestock slaughter for household sustenance is not common; livestock are slaughtered when they have visitors, weddings, traditional ceremonies or when the household wants to purchase clothing and food items. Households tend to rely heavily on livestock products especially milk, which is said to be consumed at all meal-times. Due to a shortage of markets in the broader
ENVIRONMENTAL RESOURCES MANAGEMENT YARA DALLOL BV
9-33
Social Study Area, the majority of people sell their livestock in Adukua Town (approximately two to three days walk depending on the location of the farmers’ village to the market). The selling price of various livestock is indicated in Table 9.18 below. Camels reportedly fetch the highest price at the markets, followed by cattle.
Table 9.18 Livestock Prices
Type of livestock Current Price Perceived Good Price (1) ETB USD ETB USD
Camel
Male 7,000 350 15,000 750
Female 8,000 400 15,000 750
Cattle
Male 3,000 150 6,000 300
Female 4,000 200 5,000 250
Goat
Male 1,500 75 2,000 100
Female 600 30 1,000 50
Source: Pers. Comms, May 2014
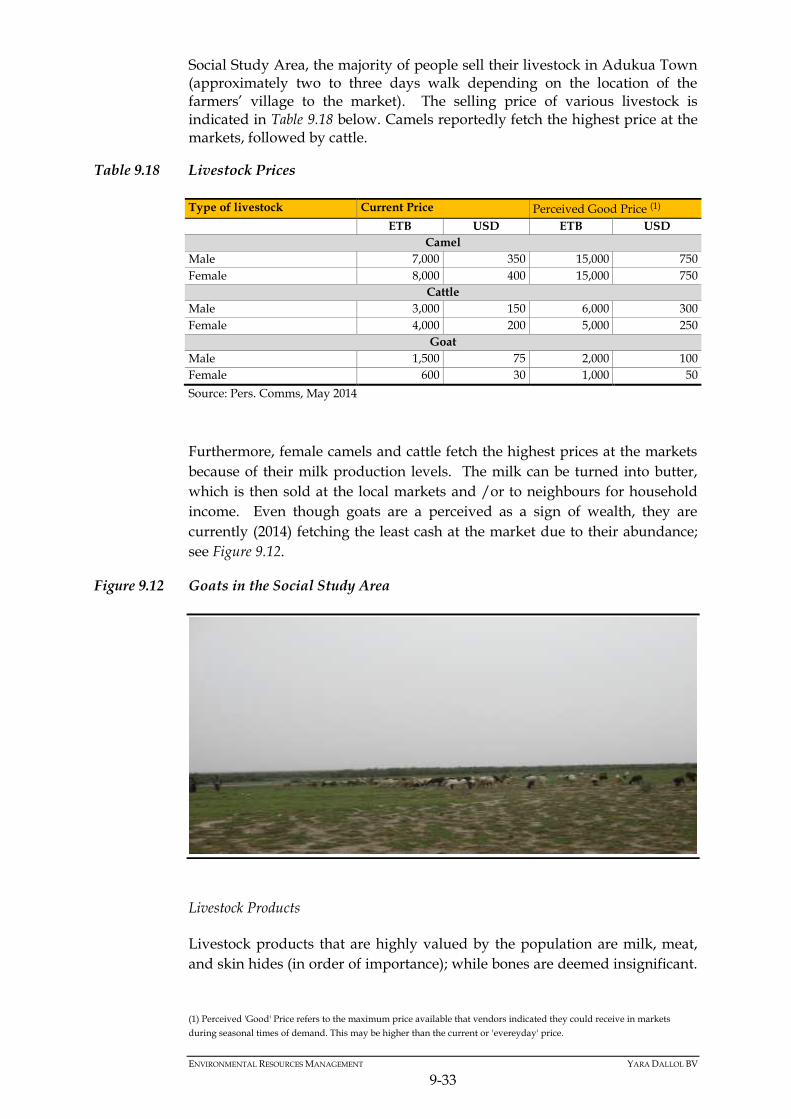
Furthermore, female camels and cattle fetch the highest prices at the markets
because of their milk production levels. The milk can be turned into butter,
which is then sold at the local markets and /or to neighbours for household
income. Even though goats are a perceived as a sign of wealth, they are
currently (2014) fetching the least cash at the market due to their abundance;
see Figure 9.12.
Figure 9.12 Goats in the Social Study Area
Livestock Products
Livestock products that are highly valued by the population are milk, meat,
and skin hides (in order of importance); while bones are deemed insignificant.
(1) Perceived 'Good' Price refers to the maximum price available that vendors indicated they could receive in markets
during seasonal times of demand. This may be higher than the current or 'evereyday' price.

ENVIRONMENTAL RESOURCES MANAGEMENT YARA DALLOL BV
9-34
Milk produced by livestock is consumed by the household or turned into
butter which is then sold. Meat is never sold; rather, it is consumed by the
household and sometimes shared with the neighbours. Skin hides are used to
make mats, strings for beds, furniture and sari (water carrying containers) or
coda (milk containers). The various prices and uses of skin hides are
summarised in Table 9.19.
Table 9.19 Sale and Uses of Livestock Skin
Livestock Type Price Uses
Goat ETB 15 (USD 0.75) Mats and Sari/ Coda
Sheep ETB 20 (USD 1) Mats and gifts
Camel Not for sale Discarded
Cattle Not for sale Mats, strings, and other
Source: Pers. Comms, May 2014
Grazing/ Pastures
For the past three years there has been a significant decline in graze due to a
lack of rain; which has also increased the amount of time men and young boys
spend away from home in search of better pastures. Commonly used pastures
in the Social Study Area include areas in and around Adukua, Bahare, Bada/
Musley and Balakia Mountain. The type of livestock grazed in each of the
above areas is indicated in Table 9.20 below.
Table 9.20 Livestock Grazing Areas
Grazing Area Types of Livestock Graze in Area
Adukua Goats, sheep, camels
Bahare Cattle only
Bada/ Musley Cattle only
Balakia Mountain Goats, sheep, camel
Source: Pers. Comms, May 2014
Other prominent grazing areas in the Social Study Area and/ or used by the
population are shown in Figure 9.17. People residing in Musley, Bada
Admeruk and Ermile tend not to migrate to feed their livestock as they have
adequate pastures. Travelling to the various grazing areas can take a day or
two depending on the herdsmen’s place of origin and the location of pastures.
An elder always accompanies the herdsmen to pastures, so as to negotiate
access to pastures with the local villagers. Depending on the availability of the
graze, herdsmen can stay in one location for a maximum of six months. The
herdsmen are always housed by the host villagers near to where they are
grazing their livestock, including relatives. Livestock are also fed sorghum
stocks after harvest.
Crop Production
Sorghum and maize are the main crops grown in the Social Study Area. All
crop production is for the household consumption and only excess is sold
ENVIRONMENTAL RESOURCES MANAGEMENT YARA DALLOL BV
9-35
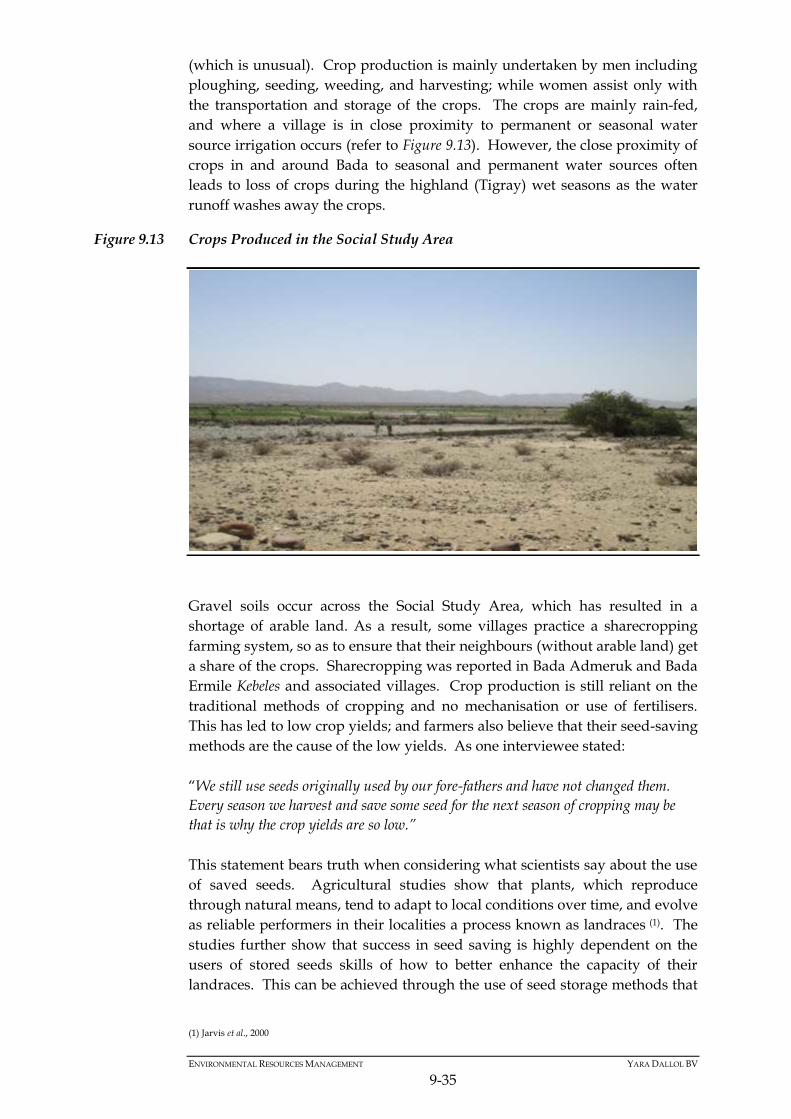
(which is unusual). Crop production is mainly undertaken by men including
ploughing, seeding, weeding, and harvesting; while women assist only with
the transportation and storage of the crops. The crops are mainly rain-fed,
and where a village is in close proximity to permanent or seasonal water
source irrigation occurs (refer to Figure 9.13). However, the close proximity of
crops in and around Bada to seasonal and permanent water sources often
leads to loss of crops during the highland (Tigray) wet seasons as the water
runoff washes away the crops.
Figure 9.13 Crops Produced in the Social Study Area
Gravel soils occur across the Social Study Area, which has resulted in a
shortage of arable land. As a result, some villages practice a sharecropping
farming system, so as to ensure that their neighbours (without arable land) get
a share of the crops. Sharecropping was reported in Bada Admeruk and Bada
Ermile Kebeles and associated villages. Crop production is still reliant on the
traditional methods of cropping and no mechanisation or use of fertilisers.
This has led to low crop yields; and farmers also believe that their seed-saving
methods are the cause of the low yields. As one interviewee stated:
“We still use seeds originally used by our fore-fathers and have not changed them.
Every season we harvest and save some seed for the next season of cropping may be
that is why the crop yields are so low.”
This statement bears truth when considering what scientists say about the use
of saved seeds. Agricultural studies show that plants, which reproduce
through natural means, tend to adapt to local conditions over time, and evolve
as reliable performers in their localities a process known as landraces (1). The
studies further show that success in seed saving is highly dependent on the
users of stored seeds skills of how to better enhance the capacity of their
landraces. This can be achieved through the use of seed storage methods that
(1) Jarvis et al., 2000

ENVIRONMENTAL RESOURCES MANAGEMENT YARA DALLOL BV
9-36
maintain viability of the seeds (viz. open pollination) (1) and detection of
conditions that will maximise germination and detecting the presence of
diseases that are seed-borne, so that these can be eliminated (2).
Land preparation for cropping begins in July and actual ploughing in August
(the wet season when the ground is saturated). According to the locals, a
100 ha of agricultural land can produce six X 50kg bags of sorghum. Maize is
often sold for ETB300 (USD 15)/ 50kg. According to the locals, there are no
agricultural extensions or NGOs operating in the area. Sometimes
government officials from the Zonal and Woreda levels visit the area but it is
reported that they do not bring any assistance for the villages.
Salt Mining
Artisanal salt mining occurs across the Social Study Area and it is undertaken
by both men and women to varying degrees and scales. The women tend to
collect salt for household consumption; while men collect salt to generate an
income. All interviewees residing in villages in or close to the Project Area
ranked salt mining as an important livelihood activity for income generation
(salt is freely available and easily accessed), as well as a culturally valued asset
for the Afar people. Salt collection occurs in various places across the Social
Study Area, and in varying quantities (refer to Section 9.8).
Artisanal salt mining in the broader Social Study Area is based on the salt flats
located north of Lake Assale (refer to Figure 9.14). Salt is created from the
annual patterns of water flow from the hyper-saline Lake Assale. The salt
mining season extends between September and July, and is dependent on the
retreat of the water from Lake Assale. During the wet season (July – end
August), the high temperatures on the salt pan (50 to 60°C) makes salt mining
impossible. Literature sources and local people in the area reference a variety
of dates from which the artisanal salt mining and trade began; however, it is
widely acknowledged that it is an activity that spans several centuries,
geographic locations and ethnic groups.
(1) Open pollination is pollination by insects, birds, wind, or other natural mechanisms. (2) Jarvis et al., 2000

ENVIRONMENTAL RESOURCES MANAGEMENT YARA DALLOL BV
9-37
Figure 9.14 The Artisanal Salt Trade at Assale
People are involved in the salt trade work for a varying number of months,
with salt cutters and diggers working for approximately the same amount of
time). A salt cutters time ranged between two to 10 months, and a salt diggers
time ranged between two to nine months. Salt transporters (via camel) are
involved in the salt trade for an average of three months of the year, and are
the only group to work in the salt trade one month of the year.
When the duration spent working in the salt trade is compared to income
received from involvement there is a direct correlation; transporters were
recorded to have the lowest income, and cutters the highest. Amongst those
involved in artisanal salt mining, the salt diggers earn the least income in a
good month (USD 56); in turn the salt transporters earn the most income
approximately USD 250. In contrast, on a bad month, salt transporters earn
the least income approximately USD 14; while the salt cutters earn the
approximately USD 100; as indicated in Table 9.21.
Table 9.21 Income Generated by Salt Miners
Month Salt Cutter Salt Digger Salt Transporter
Good ETB 4,000 (USD 200) ETB 1,134 (USD 56) ETB 5,000 (USD 250)
Bad ETB 2,000 (USD 100) ETB 623 (USD 31) ETB 286 (USD 14)
Source: Pers. Comms; April/May 2014
ENVIRONMENTAL RESOURCES MANAGEMENT YARA DALLOL BV
9-38
Salt Mining Process
The salt mining process is a well-established practice with systematically
defined labour division and elaborated job structures. There are at least four
steps of work done by different groups in harmony until the salt blocks reach
the Berahale collection station.
A group of two to three men work on hewing the layer of salt crust from the
surface, a process known as Fekolo. Workers who work on Fekolo are called
Deo’dina in Afar. In the initial process of lifting salt layer from the surface, the
Fekolo use axel and two pairs of stick called Feiena. When the salt surface is hit
with the Feiena stick and if it makes a sound which signals that the salt layer is
detached from the bottom it can easily be hewn. They split the salt layer at the
fracture line (Kirkir) and insert the Feiena stick in to the opening to pill it
upward. The Feiena workers pill-out as many salt layers as possible in a day
and make them ready for the next process of shaping the irregularly shaped
salt layers into rectangular blocks.
The activity of chiselling and shaping rectangular salt blocks is called Tsereba
and the workers known as Khedli in Afar or Eyel’e in Tigrigna languages. This
is a very sophisticated and delicate work that needs talent and experience and
informal rules mean it can only be carried out by Afars. The salt blocks are
shaped by using a special chisel, called Godma. Only the Afar men are allowed
to shape the salt blocks and no other ethnic groups. Key informants told that
in the past, highlanders also used to work as Tsereba/Eyele; but it has recently
become the sole activity of the Afar men only. It is unclear how this change
came about, but it is thought that it signifies a sense ownership of the salt
resource to the local Afar men; so that they will have authority to determine
the size and value of the salt blocks.
The people who will finally take the salt loaded on animal back to Berahale
are referred to as Arho, of which the majority are from Edaga Hamus and
Adigrat areas in the Tigray highlands, and sometimes from as far as the Raya
and Weldia areas. The Arho transport the salt blocks up to the town of
Berahale. The salt is transported by camel caravan (as shown in Figure 9.15).
These camel caravans follow a route along the Sabah River valley, which is the
shortest route to Berahale. The journey to Berahale often begins at midday
and arrives at the first station on the river side village of Sabha at around
10pm. There, the Arho and their animals rest until 10am the next day and then
continue with their journey to Berahale.

ENVIRONMENTAL RESOURCES MANAGEMENT YARA DALLOL BV
9-39
Figure 9.15 Camel Caravans
Upon arrival in Berahale, salt is recorded and sold at the Salt Selling
Associations warehouse. Salt is then stored at the warehouse until it is
transported out of Berahale by truck to other regions of Ethiopia. According
to some locals, a block of Gereweyna (smaller block of salt) is sold ETB 11 to12
(USD 0.50 to 0.60) in Berahale and ETB 25 to 30 (USD 1.25 to 1.50) in Mekele;
while a block of Golo’o (bigger block of salt) is sold ETB 15 to 17 (USD 0.75 to
0.85) in Berahale and ETB 35 to 40 (USD 1.75 to 2.0) in Mekele. In addition, the
blocks of Gereweyna and Golo’o are further resized in to equal halves prior to
selling at the Agulae and Mekele markets.
No salt associations exist in the broader Social Study Area; however, in the
neighbouring Berahale Woreda there is a salt association. However, the
Berahale Salt Association caters for only its own people and no outsiders.
Protection of the Artisanal Salt Trade
Recent developments in the greater Social Study Area from other exploration
companies have caused some changes to the accessibility of the salt flats. This
includes a road and drill pad that has been constructed, and has the potential
to encourage vehicles to travel all the way to the edge of the salt mining area.
Transportation of salt by vehicles has been rejected by several groups as the
services (such as food, accommodation etc.) provided by the villages situated
along the salt transportation routes would be lost, the operation of the Arho
would cease and there is a risk that trucks would pass straight through
Berahale without stopping, rendering the Selling Association redundant.
According to local people, previous attempts to introduce semi-mechanised
salt mining systems, such as pumping saline water from the lake to
evaporation ponds were fiercely rejected by both the local villages and local
government, and the activities were stopped. Maintaining the use of donkeys
and camels for transport to and from the salt plains appears to be a conscious
decision by the Afar people and the Tigray transporters as a means to

ENVIRONMENTAL RESOURCES MANAGEMENT YARA DALLOL BV
9-40
maintain control over the traditional salt industry. There appears to be
awareness that many Afar do not have the knowledge, capital, experience or
maintenance skills to recruit a fleet of trucks to transport the salt, and
mechanised transport would mean that they would be removed from the
economic chain. In addition, the use of camels maintains tourist interest in the
area and increases income for small shops, hotels and bars. Further self-
protection measures include the ‘salt mining rules’ that explicitly state that
Ethiopians of other ethnic groups are prohibited from the salt cutting
activities, and the rejection of attempts to mechanise the local salt production.
Trade and Markets
There are no formal or informal markets in the Social Study Area; however,
informal trading occurs in many of the larger villages (viz. Hamad Ela and
Berahale). The traders often sell household food items or own and run
coffeehouses/restaurants. According to the FGDs the majority of traders in
the area are from the highlands including the Mekele, Tigray and Somali.
Traders purchase their food items from Mekele and transport it to the villages
by trucks. The closest market to the Social Study Area as identified by the
local population is in Hamad Ela and Bada; people will walk for two to three
days (depending on the location of their village to the town) to sell their
produce and/ or to purchase food items and clothing.
Hamad Ela has approximately four to five prominent shops that sell a range of
products including wheat, coffee, tea and some vegetables, the latter
commonly perish due to the lack of fridges in Hamad Ela. A considerable
portion of clothes, shoes and perfumes are also imported from towns along
the Ethiopian border with Djibouti and the Tigray region. In addition to the
local shops women from the highlands operate tea / or coffee shops with salt
trade workers and the military as common customers.
Men in Bada Admeruk and Ermile reported that they used to trade across the
border in Eritrea but the conflict between the two countries it is no longer
undertaken. However, in the women’s FGDs, they reported that men and
youths cannot cross the border to Eritrea anymore, but women, the elderly
and young children still cross the border to purchase some food items or to
collect lost livestock. The apparent contradiction in the reports about trading
in Eritrea, may be caused by fears of reprimand should either governments
hear that people are still crossing the border.
Livelihoods Ranking by Gender
There are distinct gender divisions within the livelihood roles of men and
women in the Social Study Area. Men are involved in salt mining, fetching
fire wood and some were reported to work for companies in the area as
labourers and guards. During FGDs women reported they were typically
involved in palm eungwa collecting and the creation of woven palm products
including woven palm mats selen. In some villages women are also involved
in small scale trade and the (small scale) salt mining industry. From
ENVIRONMENTAL RESOURCES MANAGEMENT YARA DALLOL BV
9-41
discussions in the field it was reported that women tend to work longer hours
than men (with women working up to 13 hours a day in comparison to an
average of seven hours for men).
Moreover, men ranked artisanal salt mining most important from an income
generating perspective; while women ranked livestock as most important for
income generation. There was broad agreement that livestock are a key
source of financial capital, and generate considerably higher cash income than
other activities. Livestock were also viewed as the only form of savings
available for many households. Women have more involvement with
livestock rearing activities compared to artisanal salt mining, which may
explain the relative importance they give to livestock rearing and therefore the
higher ranking.
9.7.4 Employment and Unemployment and Skills Levels
Formal employment levels in the Social Study Area are significantly low, with
the majority of the population engaged in subsistence livelihoods activities; as
discussed in Section 9.7. Prior to the commencement of mining activities in the
area, government services were the only source of formal employment (health
care, education and administrative services). The presence of mining activities
has; however, slightly expanded the range of potential employers;
nevertheless, the lack of education and skills has meant that the local people
can only secure temporary unskilled positions with the mines. The current
road construction activities, have also afforded the local population (men and
women) temporary employment opportunities.
9.7.5 Household Income and Expenditure
In general, household income levels are very low in the Social Study Area.
This is due to the population’s dependence on subsistence livelihoods. The
local Afar households in the Social Study Area derive the majority of their
income solely from livestock keeping, palm collection (specifically for
women), artisanal salt mining, and for those who are civil servants from the
government. In turn, the highlanders living in the area often derive their
income from their businesses including prostitution. The monthly household
income varies from ETB 0 to ETB 300 (USD 0.0 to 15) on a bad month and ETB
600 (USD 30) plus on a good month (excluding business owners and civil
servants).
The household income is used to purchase food items i.e., coffee, tea, sugar,
rice, pasta, spices, oil and wheat. Clothing for young women forms a
significant part of the Afar household expenditure as it is believed that a well-
dressed young woman will attract a suitable husband.
The lack of employment and business opportunities in the Study Area,
combined with the reliance on unproductive pastoralist livelihoods, and the
harsh climatic conditions result in low levels of household income.
Furthermore, as the average household income is low, none of it is allocated

ENVIRONMENTAL RESOURCES MANAGEMENT YARA DALLOL BV
9-42
towards savings, which leaves the household vulnerable to non-routine events
or unplanned costs.
9.7.6 Poverty
As mentioned previously, Ethiopia has high levels of poverty, mainly due to
the over reliance on rain-fed agriculture sector. The agricultural sector is
estimated to make up 45 percent of the country’s Gross Domestic Product
(GDP) and ensures the livelihoods of 80 to 85 percent of the population (1).
Changes in the rainfall pattern or worldwide prices for coffee affects the
incomes of an estimated 30 to 40 million people and can mean hunger for
10 to 15 million people (2). Chronic food insecurity is a noticeable feature of
rural Ethiopia in any year, irrespective of the presence of unusual climatic or
economic shocks. The major causes of food insecurity in Ethiopia include land
degradation, recurrent drought, poor and inadequate management of risk
(associated with natural disasters), population pressure, and subsistence
agricultural practices dominated by rain-fed farming and characterized by low
inputs and low outputs (3).
Over the course of the last decade, Ethiopia has received an average of
700,000 MT of food aid annually. Across the country, the predictable (chronic)
and unpredictable (acute or transitory) needs of the Ethiopian population
have largely been met through various emergency relief programmes (4). In
turn, they have saved millions of lives and continue to do so; it has, however,
failed to protect the population’s livelihoods and assets (such as schools,
clinics, roads and others).
As a result of the above, the Productive Safety Net Program (PSNP) was
introduced by the Government in 2005; and has since become one of the
largest safety net programs in the world. The objectives of PSNP are:
To provide transfers to the chronically food insecure population in a way
that prevents asset depletion at the household level; and
To creates productive assets at the community level.
Originally, the beneficiaries of the PSNP comprised of households identified
in the 262 food insecure Woredas across eight regions (5). In 2006 and 2007, the
programme was expanded to include the ANRS and Somali National Regional
(1)http://web.worldbank.org/WBSITE/EXTERNAL/COUNTRIES/AFRICAEXT/0,,contentMDK:21072837~menuPK:1804
110~pagePK:146736~piPK:146830~theSitePK:258644,00.html (2)http://web.worldbank.org/WBSITE/EXTERNAL/COUNTRIES/AFRICAEXT/0,,contentMDK:21072837~menuPK:1804
110~pagePK:146736~piPK:146830~theSitePK:258644,00.html (3)http://web.worldbank.org/WBSITE/EXTERNAL/COUNTRIES/AFRICAEXT/0,,contentMDK:21072837~menuPK:1804
110~pagePK:146736~piPK:146830~theSitePK:258644,00.html (4)http://web.worldbank.org/WBSITE/EXTERNAL/COUNTRIES/AFRICAEXT/0,,contentMDK:21072837~menuPK:1804
110~pagePK:146736~piPK:146830~theSitePK:258644,00.html (5)http://web.worldbank.org/WBSITE/EXTERNAL/COUNTRIES/AFRICAEXT/0,,contentMDK:21072837~menuPK:1804
110~pagePK:146736~piPK:146830~theSitePK:258644,00.html

ENVIRONMENTAL RESOURCES MANAGEMENT YARA DALLOL BV
9-43
State, respectively. The program is currently (2014) providing food aid to an
estimated 319 Woredas.
The program is divided into two components, namely sub-projects and direct-
support. These are explained below:
Sub-projects – each benefiting community has to annually identify priorities with the aim that a selected sub-project will contribute to community’s well-being, i.e., construction of a health posts, veterinary clinics, schools, and other public infrastructure that is lacking in the community. These communities receive food supplies (mainly wheat) for six months of the year whilst they are engaged in the public-works projects.
Direct Support Program – this is aimed at households that are described as labour-poor and cannot participate in public works associated with the sub-project program. These include households with no economically active persons. These families receive food from PSNP throughout the year.
The entire population of the Social Study Area falls under the PSNP; and an
estimated 95 percent is on the sub-projects program and the remaining five
percent on the Direct Support program. In all villages visited, when people
were asked about their livelihoods activities, their responses were similar:
“…Safety Net is how we survive as there are no employment opportunities in the
area…”
Moreover, the Dallol Woreda official; stated that there are always people
surviving on PSNP or Emergency Aid in the Woreda.
Such statements reveal a high dependence of people on the PSNP food
supplies, and begs the question of whether people will be able to survive in
the area in the absence of the program.
The interviewees noted that the food supplies provided as part of PSNP were
inadequate and unsustainable as they receive food supplies when they are
working on PSNP related projects only. Furthermore, the participants stated
that they did not see the correlation between the construction of community
infrastructure and the right to food security. As one participant puts it:
“… having good infrastructure is not going to ensure food security for my household
so I don’t understand why we have to undertake such projects…”
9.8 UTILISATION AND DEPENDENCY ON NATURAL RESOURCES
Natural resources are fundamental to the survival and livelihood of the
majority of people in rural Ethiopia. The most commonly exploited of these
are timber products (i.e., wood) due to the shortage of electrical power across

ENVIRONMENTAL RESOURCES MANAGEMENT YARA DALLOL BV
9-44
the country, water and land which is used for settlements and agricultural
activities.
9.8.1 Collection and Processing of Palm Leaves
The collection and processing of palm leaves in the Social Study Area is a key
livelihood activity undertaken by the local women. The local name for the
palm is engwa (scientifically known as hyphaene thebaica). The palm trees are
not widespread and tend to grow along the muddy liminal areas of the salt
flats.
The collection and processing of palm leaves is a traditional day-to-day
activity and occupies a significant portion of an Afar woman’s day. In the
Social Study Area women prefer to collect their own palm leaves instead of
purchasing them from the Adukua market or Hamad Ela. For instance
women from Elifan Abaa travel on foot for up to five days with young
children to collect palm leaves in the Musley area. They stated that it was the
most cost effective way of getting the palm leaves. Aside from its economic
benefits, the collection and processing of palm leaves also serves as a means
for women to sit together and socialise. Visiting relatives from areas where
there are palm resources, often bring palm leaves for their kin.
Women collect the leaves in early hours of the morning before the sun gets too
hot. They either carry the palm leaves on their backs or use donkeys to
transport it for them. Once they reach home, the women dry the palm leaves
in the sun as part of processing and individual fronds are separated using a
small wooden instrument. The individual strands are then braided together
and arranged into thin strips which are then sown together to assemble larger
palm mats locally known as selen. Palm fibres are also processed into a variety
of other products including baskets, ropes and brooms. Selen is mostly used
in the construction of the Afar dome shaped houses or as insulation inside the
houses. Women also purchase dyes to design a variety of patterns on their
palm leave products, as shown in Figure 9.16.

ENVIRONMENTAL RESOURCES MANAGEMENT YARA DALLOL BV
9-45
Figure 9.16 Palm Products
Men play three important roles when it comes to palm products, namely -
Transportation of palm to the village on their return from pastures in
villages close to palm resources;
Production of beds using the palm ropes produced by women; and
Assisting women with the sale of palm products in the markets.
Some women do not collect palm leaves for their own uses, but in order to sell
it at the market in Adekua or Hamad Ela. The dry palm fronds cost between
ETB 70 and 120 (USD 3.5 to 6) depending on the quantity required. Palm
products that generate the most income are beds ETB 1,000 (USD 50); coloured
selen ETB 400 (USD 20), and rope ETB 70 to 100 (USD 3.5 to 5). On average,
the sale of palm products generates an income of ETB 250 (USD 12.5) in a
good month and ETB 100 (USD 5) in a bad month for the household.
9.8.2 Water Resources
Due to its lack of availability, water is a highly valued natural resource in the
Social Study Area. Women and children walk for hours to collect household
water daily. All the water found in the area is said to be run-off water from
the highlands as the area receives little to no rain. See important water
sources as reported by the households in Section 9.10 (Public Infrastructure and
Services).

ENVIRONMENTAL RESOURCES MANAGEMENT YARA DALLOL BV
9-46
9.8.3 Grazing Areas
As previously mentioned, livestock keeping is the main subsistence livelihood
of the population which gives importance to areas that provide adequate
grazing for livestock. Important grazing areas as identified by the surveys are
shown in Figure 9.17.
9.8.4 Salt Mining
Salt as discussed in Section 9.7.3 is also an important natural resource for the
local communities as it provides a constant source of household income.
Important salt collection areas are shown in Figure 9.17. It should be noted
that the salt collection shown to the northwest of the North Musley
Concession is not the main area referred to later in this section for traditional
salt mining. This area was referred to during stakeholder engagement events
as an area where powdered salt can be collected at a small scale, and is
reported to be utilised by a small number of people. This area is not a critical
resource for the salt mining and serves as a source of subsistence salt.

ENVIRONMENTAL RESOURCES MANAGEMENT YARA DALLOL BV
9-47
Figure 9.17 Important Natural Resources Collection Areas in the broader Social Study Area

ENVIRONMENTAL RESOURCES MANAGEMENT YARA DALLOL BV
9-48
9.8.5 Collection of Wood/ Fuel Wood
A limited number of large trees are found in the broader Social Study Area
and mainly along certain sections of the dry river beds and banks. Wood is
not only used as a source of energy for the household but it is used in the
construction of houses and some household furniture, i.e., beds and tables
(refer to Figure 9.18). Both women and men spend hours collecting fuel wood
across the Social Study Area. Based on observations, the population of the
area has developed ways of preserving the local wood supply, and instead of
uprooting and cutting down trees whenever they need fuel wood, they tend to
harvest naturally dried tree branches. Even when they harvest wood for
furniture or the construction of houses, people take only what they need and
do not uproot any trees.
Figure 9.18 Wood Products
9.9 VULNERABLE/ MARGINALISED GROUPS
Vulnerable or disadvantaged groups are defined by IFC as – individuals or
groups who could experience adverse impacts from a proposed project more severely
than others based on their vulnerable or disadvantaged status. This status may stem
from an individual's or group's race, colour, sex, language, religion, political
or other opinion, national or social origin, property, birth or other status. In
addition other factors should be considered such as gender, ethnicity, culture,
sickness, physical or mental disability, poverty or economic disadvantage, and
dependence on unique natural resources (1).
Based on the definition above, the entire population of the Social Study Area
can be considered as vulnerable due to their economic disadvantages,
dependence on natural resources, health status and gender.
The population of the Social Study Area resides in a remote and very poorly
serviced location (including a lack of health care, schools, waste collection and
(1) IFC Glossary of Terms, http://www1.ifc.org/wps/wcm/connect/corp_ext_content/ifc_external_corporate_site/home

ENVIRONMENTAL RESOURCES MANAGEMENT YARA DALLOL BV
9-49
sanitation facilities). Furthermore, there is a severe shortage of potable water
in the area which has led to:
School children attending school for only two to three hours a day;
Women walking for three to four hours to and from water collection points;
Livestock deaths; and
Men migrating back and forth from their homes in order to keep their livestock hydrated.
Access to health care facilities is limited, and where they are present, the
facilities do not have medicines. Health facilities cannot stock pile certain
medicines due to the lack of electricity and extreme heat. This means the
populations’ health status is poor making them more vulnerable (further
details in Section 9.5).
Large areas of the land in the Social Study Area consist of gravel and boulder
plains with little arable soil available; and where soils occur they are often
covered by salt. As such, there is limited land available for growing crops
(further details in Section 9.10).
The economy of the population depends upon subsistence livelihoods
activities such as livestock keeping and growing of sorghum. However,
ongoing drought and poor soil quality have led to significant shortages of
food supplies, leading to the population relying on Productive Safety Net
Program (PSNP) and emergency aid for half of the year.
This leaves the population highly vulnerable to diseases and to high mortality
rates.
Gender and age vulnerability also occurs in the Social Study Area. This is
described below.
9.9.1 Women
Ethiopia is traditionally a patriarchal society and women maintain a
subordinate position. Cultural attitudes perceive women as docile,
submissive, patient, and tolerant of monotonous work and violence. The
vulnerability of women is related to their lack of education; while some
women receive some primary education many have no schooling. This is
partially due to the belief that an educated woman cannot attract a suitable
man.
In Afar society, women can be inherited at the death of her husband by the
deceased’s brother; and a husband can also inherit his deceased wife’s sister.
Polygamy is a common practice in the Afar region – men may receive
permission to marry up to four wives, but with preconditions. Elder women
may be divorced by their husbands who then marry younger girls leaving
older women alone. The accepted belief that only a male child has the right of

ENVIRONMENTAL RESOURCES MANAGEMENT YARA DALLOL BV
9-50
inheritance of his family’s has led to fewer women owning their own land.
Women do not hold any position of power until they are elderly and/ or if
they are considered to have some wisdom.
Table 9.22 presents the different daily activities of men and women in the
Social Study Area. These activities vary according to commonly accepted
gender roles of the communities. Women in the area spend most of the
dealing with household activities, which include the collection of water and
preparation of meals. According to this calendar, women have less time
socialising with other women. In turn, men spend most of their time working
on the crop fields /or herding livestock and socialising.
Table 9.22 Daily Calendar for Women and Men in the Social Study Area
Activities Time
Women Men
Preparing for pray/ praying time/ Solat 5:00-6:00 AM 5:00 am -6:00 AM
Preparing breakfast & eating 6:00-7:00 AM 6:00-7:00 AM
Fetching of water &firewood 7:00am-12:00 PM
Working in the field - 7:00am -12:00 PM
Lunch preparation 12:00- 1:00 PM -
Social gathering - 12:00- 1:00 PM
Praying (Solat), Lunch eating & making palm mat 1:00- 3:00 PM -
Praying (Solat), Lunch eating & rest - 1:00- 3:00 PM
Fetching water 3:00-4:00 PM -
Baking bread, preparing dinner, preparing beds
for sleep
3:00-4:00 PM -
Chatting with friends, eating dinner - 3:00-7:00 PM
Washing dishes & making mat until gets dark and
sleep
7:00-10:00 PM -
Source: Pers. Comms, April/May 2014
Table 9.23 shows the division of household activities/ labour.
Table 9.23 Profile of Division of Labour among Family Members in the Social Study
Area
Men Women Boys Girls
Household Activity
Water fetching - √ - √
Collecting of fuel wood √ - - -
Grinding √ -- - -
House cleaning - √ - √
Washing - √ - -
Child caring - √ - √
Looking after the family well-being - √ - -
House construction √ √ - -
Livestock and Crop Production
Agriculture
Ploughing √ - √ -
Seeding √ - - -
Weeding √ - √ -
Harvesting √ - √ -
Transporting √ √ √ √
Storage √ √ - -

ENVIRONMENTAL RESOURCES MANAGEMENT YARA DALLOL BV
9-51
Men Women Boys Girls
Livestock Herding(large) √ - - -
Livestock Herding (small) √ √ √ √
Income Generating Activities
Selling salt √ √ - -
Selling palm leaves - √ - -
Selling palm mats √ - √ -
Fire wood selling √ - - -
Community Management
Social obligations √ - - -
Development meeting √ - - -
Source: Pers. Comms, April/May 2014
9.9.2 Female Children
There are three specific factors that render young girls vulnerable in Afar
society, namely lack of education, the practice of genital circumcision and
early age of marriage. It is estimated that 72 percent of the Afar women have
undergone infibulation circumcision. This occurs between the ages of seven to
nine; and in some areas it is carried out within the first few days after birth.
This practice can leave the girls with severe pain and trauma, shock,
haemorrhage, sepsis, urine retention, ulceration of the genital region, and
urinary infection, among other complications.
In addition, Afar girls are generally married at about 12 to 15 years old and
the husband can be as old as 60 or 70 and already married. The girls have
little or no choice of a husband once selected for arranged marriage.
9.9.3 Elderly
The elderly within the village are less likely to receive an income and are
reliant upon other members of a household. Thus their ability to adapt to
potential changes in their environment is reduced. Within this group it is
important to differentiate between men and women as women are identified
to be more vulnerable than men. Elder men within the village play a
prominent role in traditional institutions and village level decision making.
9.9.4 Children and Youth
The general lack of schooling in the Social Study Area as well as the lack of
secondary schooling facilities, means that children and youth do not have
many alternatives other than continue with pastoralism. This is likely to
diminish a young person’s ability to secure formal employment in the future
and can result in continued dependency on aid programs for survival.
Table 9.24 provides a vulnerability matrix; this presents analysis of the above
vulnerability factors to illustrate how baseline conditions can affect access to
different forms of capital for sensitive receptors.

ENVIRONMENTAL RESOURCES MANAGEMENT YARA DALLOL BV
9-52
Table 9.24 Vulnerability Matrix
Capital Specific Considerations Assessing Vulnerability of Receptors Vulnerable Receptors Context and Location of Vulnerable
Physical Capital Education Facilities
Health Care Facilities
Transport Facilities
Recreation Facilities
Household Goods and Equipment
Minimal access to services and infrastructure due
to factors such as cost, distance or quality of
services
Provision of key services and infrastructure is poor
Men, women, children, youths and
elderly
Minimal access to services including health care and education facilities,
roads and public transportation.
People have to travel on foot great distances to access most services
including markets.
Household assets are minimal due to a migratory lifestyle of the population.
Social Capital Strong social networks and connectedness
Rights / ability to participate in decision
making
Ability to participate in orthodox economic
and social systems
Restrictions on rights and ability to participate
freely in governance
Subject to marginalisation and discrimination
Subject to violence/ abuse
Girl child and women Minimal participation of women in making household decisions
General lack of women participation in leadership roles.
Women are viewed as inferior to men and men’s needs are seen as more
important to that of women.
Young girls are subjected to female circumcision, early marriages and no
schooling.
Women do not control or participate much in household finance issues.
Minimal ability to participate in orthodox governance and decision making
systems.
Restrictions on rights of association, ability to participate freely in
governance.
Human Capital Knowledge and skills
Access to and level of education
Ability to Provide Leadership
Health and Nutritional Status
Frequent incidence/ high prevalence of health
conditions
High rates of maternal/child mortality
Low life expectancy
Poor food security
Presence of vector borne diseases
Women, men, children , youths
and elderly
In particular:
Women and children
Poor soil quality, outdated methods of growing crops, and a lack of water
result in low crop yield.
High dependency on food aid for the majority of the year through the
SupportNet programme.
Lack of education, skills and employment opportunities is significantly high.
Poor health status and low immunity to diseases, illness and incidents
including malaria, malnutrition and birth complications.
Limited access to contraceptives and family planning.
High maternal and child mortality linked to the shortage of health facilities
and poor living conditions.
Diarrhoea and malaria are some of the key health issues that face the area
due to poor environmental health conditions.
Economic Capital Diversity of livelihoods
Productivity of livelihood
Access to savings and support networks
Adequate level of income generation
Access to loans and credit
Reliance on one unsustainable principal livelihood
Principal livelihoods are relatively unproductive
and/or highly seasonal
Low levels of income levels relative to expenditure
Low ability to pay for food, key services, resources
and infrastructure
Limited access to savings, loans, banking, and
financial support systems
Women, men, youths and elderly
In particular:
Households dependent on crop
production
Reliance on agricultural activities (crops and livestock) in a desert has left
the population highly vulnerable especially during the dry seasons or when
there is drought.
Income levels are significantly low across the area due to a lack of economic
opportunities as well low education levels of the population.
There are no savings, loan, or banking services in the area.

ENVIRONMENTAL RESOURCES MANAGEMENT YARA DALLOL BV
9-53
Capital Specific Considerations Assessing Vulnerability of Receptors Vulnerable Receptors Context and Location of Vulnerable
Natural Capital Water
Non-Timber Forest Products
Land
Timber
Pasture
Heavily dependent on a particular resource, with
few alternatives available
Resource shortages are frequent and serious
Low availability of alternatives for a number of
important ecosystems services
Pre-existing exposure to environmental pollution
or contamination
Women, men, youths and elderly
In particular:
Children and women
Drought is a frequent phenomenon in the area; resulting in a constant water
shortages.
Water shortages result in women walking long distances in order to reach
viable sources.
School hours have been shortened (three hours a day) due to a shortage of
water.
Soil quality is poor and characterised by gravel soils.
Pastures for the livestock are limited and often result in conflict between the
various herdsmen.

ENVIRONMENTAL RESOURCES MANAGEMENT YARA DALLOL BV
9-54
9.10 ACCESS TO PUBLIC INFRASTRUCTURE AND SERVICES
This Section provides the description of access to, and availability of, public
services and infrastructure in the country, region and Social Study Area.
Services discussed include access to water and sanitation, sources of
energy/power, waste management services, transportation infrastructure and
services, and access to telecommunications.
9.10.1 Access to Potable Water
Access to safe drinking water is very low in Ethiopia, with approximately
49 percent of the population having access to safe drinking water in 2011 (1).
The lack of access to safe drinking water and general poor hygiene practices
continues to result in diarrheal disease; which is the number one cause of
under-five mortality in Ethiopia (2). USAID states that agricultural activities
are the largest consumer of water in Ethiopia (93 percent) from both surface
and underground water resources. Water abstraction for agriculture;
however, represent only four percent of the overall country’s available
renewable water resources (3). The rapid population growth and continued
variations in rainfall pattern and distribution has led to the country
experiencing extreme water scarcity, degraded water quality and chronic food
insecurity.
Overall, an estimated 51 percent of the population has access to improved
water sources which include piped water into dwellings/ yard /plot,
communal tap/standpipe, borehole, protected well/ spring, rainwater or
bottled water; however, in some rural areas these improved water sources are
saline meaning people do not consume it. Furthermore, Table 9.25 estimates
that 93 percent of the urban population has access to improved water sources
compared to 42 percent of the rural population. The remaining rural
population (58 percent) relies on non-improved water sources such as
unprotected well/ springs, tanker truck/cart with small tank, surface water
(river/lake/pond/stream dam), and other sources classified as unprotected.
Table 9.25 Water Sources, Collection and Treatment in Ethiopia
Characteristic Population in Percentages
Urban Rural Total
Source of Water
Improved source 92.8 41.6 50.8
Non-improved source 7.2 58.4 49.2
Time to Obtain Water (round trip)
Water on premises 49 1.4 10
Less than 30 minutes 29.1 34.8 33.8
30 minutes or longer 21.4 63.6 56
Don't know/missing 0.4 0.3 0.3
Person who Usually Collects Water
(1) http://www.usaid.gov/ethiopia/water-and-sanitation (2) www.USAID.gov/ethiopia (3) The Ethiopian water resources are estimated to have an annual renewable annual range of 13.5 to 28 billion m³
(underground water), of which only about 2.6 billion m³ are currently exploitable.

ENVIRONMENTAL RESOURCES MANAGEMENT YARA DALLOL BV
9-55
Characteristic Population in Percentages
Water on premises 49 1.4 10
Adult woman 35.3 69.3 63.1
Adult man 6.6 5.8 5.9
Female child under 15 years old 5.3 17.6 15.4
Male child under 15 years old 2.8 5.2 4.8
Other 0.9 0.7 0.7
Water treatment Prior to Drinking
No Water Treatment Used 86.3 91.1 90.2
Uses Water Treatment 12.9 8.3 9.1
Source: Ethiopia Demographic and Health Survey, 2011
With reference to Table 9.25, adult women and young girls are solely
responsible for collecting water (at 69.3 and 17.5 percent respectively) in
households where there is no piped water source in the dwelling/yard/plot.
This is witnessed mainly in rural areas; while in urban areas only 35.3 percent
of adult women collect water, with some men (6.6 percent) and young girls
(5.3 percent) assist with the collection of water. The collection of water tends
to take longer in the rural areas compared to the urban areas. Women in the
rural areas walk for 30 minutes or longer to and from a water collection point
(63.6 percent) with only a limited number whose return trip to a water
collection point is less than 30 minutes (34.8 percent).
A significantly large percentage of the population does not treat its water
before consumption in both rural and urban areas at an estimated 90.2 percent
overall (and 91.1 and 86.3 percent respectively). It is unclear why people do
not treat their water before consumption, but this may be linked to the lack of
financial resources to purchase the necessary treatment or energy (fuel wood)
to boil the water before consumption.
Majority of the ANRS is desert, which receives an annual average
precipitation of 150mm. In general, the water supply rate is extremely low,
and women and children spend considerable energy in securing water.
The population of the Social Study Area relies on various sources of water, of
which are located within a two to ten kilometre radius of their villages. The
driest months in the area are May to August where temperatures rise to the 50
degrees Celsius and above. The water sources include springs, wells, rivers
and boreholes that pump water into tanks. The majority of the water sources
in the Social Study Area are saline and the population tends not to consume it.
The presence of the military (ENDF) in the area has also created a new water
provider for the local people. The military provide some villages located
along the road with water, which the military pumps from an underground
aquifer and purifies for its own consumption, but also provides it to the locals
in need. The various water sources across villages in the Social Study Area are
shown in Figure 9.19.

ENVIRONMENTAL RESOURCES MANAGEMENT YARA DALLOL BV
9-56
Figure 9.19 Some Water Sources in Social Study Area
Bada water tanks
Spring at Musley
Regale/Bada River
Bada animal drinking pond
9.10.2 Access to and Availability of Energy Sources
The type of household energy source used in Ethiopia is dependent on the
location of the household, i.e., rural or urban area. The common energy
sources in the country are fuel wood (85 percent), followed by agri-residue (1)
(seven percent), petroleum (six percent) (refer to Table 9.26). Access to
electricity is low at an estimated ten percent of the population with the
majority of those with electricity residing in urban areas (85.2 percent) and
only 4.8 percent in rural areas (in 2011). In urban areas, people also use
charcoal (29.9 percent) and kerosene (10.1 percent (2)) as alternative sources of
energy; while those located in the rural areas tend to use charcoal and dung (3).
Table 9.26 Energy Sources and Consumers
Sources of Energy
Fuelwood 85 %
Agri-residue 7 %
Petroleum 6 %
Electricity 2 %
Consumers of Energy
Households 89 %
(1) Agri-residue -cuttings from crops which can be used as manure or to make a fire (2) Central Statistics Agency, 2005 (3) Dung - livestock droppings

ENVIRONMENTAL RESOURCES MANAGEMENT YARA DALLOL BV
9-57
Transportation 6 %
Services 3.6 %
Agriculture 0.9 %
Industry 0.5 %
Source: Population Census Commission, 2008 and Central Statistics Agency (2011)
Moreover, Table 9.26 illustrates that the main consumer of energy in the
country are households (89 percent) followed by services (3.6 percent) and
transportation (6.1 percent) (1). Fuel wood is consumed by 77 percent of the
population. Fuel wood also serves as the main source of energy for household
cooking for both rural and urban households (86 and 46 percent)
respectively (2). The high dependency on fuel wood and charcoal can be
attributed to the lack of electricity infrastructure.
The Government’s Universal Access Electricity Program, is an arm of the Plan
for Accelerated Sustained Development to End Poverty (PASDEP). This
programme aims to increase electricity access to households particularly in
rural areas. Between 2000 and 2005 the proportion of households with access
to electricity in urban and rural areas rose by ten percent and 1.5 percent (3)
respectively. These figures, however, illustrate the continued rural-urban
disparity in provision of and access to basic services in the country.
At regional, zonal levels and Social Study Area, access to electricity is low
even in government establishments such as schools and health centres and
posts. All households in the Social Study area reported that they did not have
access to electricity and relied on fuel wood for household cooking with some
shop owners using diesel generators.
9.10.3 Waste Management
There is limited secondary information related to the extent of waste
management services across Ethiopia; many research papers on waste
management have focused on Addis Ababa as a case study. It is clear, though
that waste collection is an issue of growing concern in the country. Across the
country people with limited or no access to waste collection services tend to
dispose of the waste along the roadsides and in the open fields. In areas
where there is some access to such services, they are plagued by irregular or
unreliable collections.
In addition, access to improved sanitation facilities in the country is estimated
at 24 percent (4). Approximately eight percent of the rural population has
access to improved sanitation facilities and 29 percent (5) in urban areas, with
the remaining 63 percent still using open spaces/field for sanitation.
(1) Population Census Commission, 2008 and Central Statistics Agency (2011) (2) Population Census Commission, 2008 and Central Statistics Agency (2011) (3) Population Census Commission, 2008 and Central Statistics Agency (2011) (4) http://data.worldbank.org/indicator/SH.STA.ACSN (5) Community based assessment on household management of waste and hygiene practices in Kersa Woreda, Eastern
Ethiopia, 2010.

ENVIRONMENTAL RESOURCES MANAGEMENT YARA DALLOL BV
9-58
Similarly to conditions at a Federal level, the ANRS lacks solid waste and
sanitation facilities. It is estimated that 91 percent of households use the bush
/ and open field. Zonally, almost the entire population uses the bush/ open
field for sanitary purposes (97 percent).
In the Social Study Area, there are no sanitation or/ solid waste disposal and
collection facilities. People use the open spaces for sanitary purposes.
Diarrhoeal illnesses are high in the area because of the improper management
of waste. This is significantly high during the rainy season when all the dirt is
washed into the rivers from which people collect water for domestic use. The
health officials reported that diarrhoea cases increase significantly during the
wet season due to the flooding and to all types of wastes being washed into
the water sources.
9.10.4 Transportation Infrastructure and Services
This Subsection discusses road, rail and public transportation.
Surface Transport Infrastructure (Road, and Rail)
The road network in Ethiopia is less developed as compared with some of
Ethiopia’s neighbouring countries; however, the Government has committed
to investing approximately three percent of its GDP to road network
infrastructure (1). The current length and surface of trunk road infrastructure
is basic and currently adequate in connecting the various regions and the
capital city to the coast. In 2010, an estimated 88 percent of the road network
was paved - mainly trunk roads. Of the unpaved roads 60 percent were
considered as being in good or fair condition (refer to Figure 9.20).
(1) http://eneken.ieej.or.jp/data/4496.pdf

ENVIRONMENTAL RESOURCES MANAGEMENT YARA DALLOL BV
9-59
Figure 9.20 Typical Roads in Ethiopia
One of the challenges facing the Government with respect to road
infrastructure is the need to increase access to the rural areas. For instance, in
2010, approximately 90 percent of Ethiopian population lived more than two
kilometres of an all-weather road and this represents a high degree of
isolation; given that over 76 percent of the country’s population resides in
rural areas.
Ethiopia has a limited railway services corridor between Addis Ababa and
Dire Dawa to/and the Port of Djibouti; however, the Addis Ababa to Dire
Dawa section of the railway is currently not operational. In 2010 the
Government began negotiations and reached an agreement with the
governments of China and India to finance the rehabilitation and expansion of
the country’s railway network (1). The Government has since rehabilitated the
section of the railway servicing the stretch between Dire Dawa and the Port of
Djibouti and it is now fully functional.
Future plans include the construction of 5,000 km long railway network
connecting Addis Ababa to various locations including Mekele. The project
will be undertaken in two phases over a five year period and it is expected to
create an estimated 300,000 construction jobs and cost US$336 million
annually. The railway network will be able to handle approximately
(1) Ethiopia: Government Signs $1.5 Billion New Railway Study MOU, http://allafrica.com/stories/201001190639.html
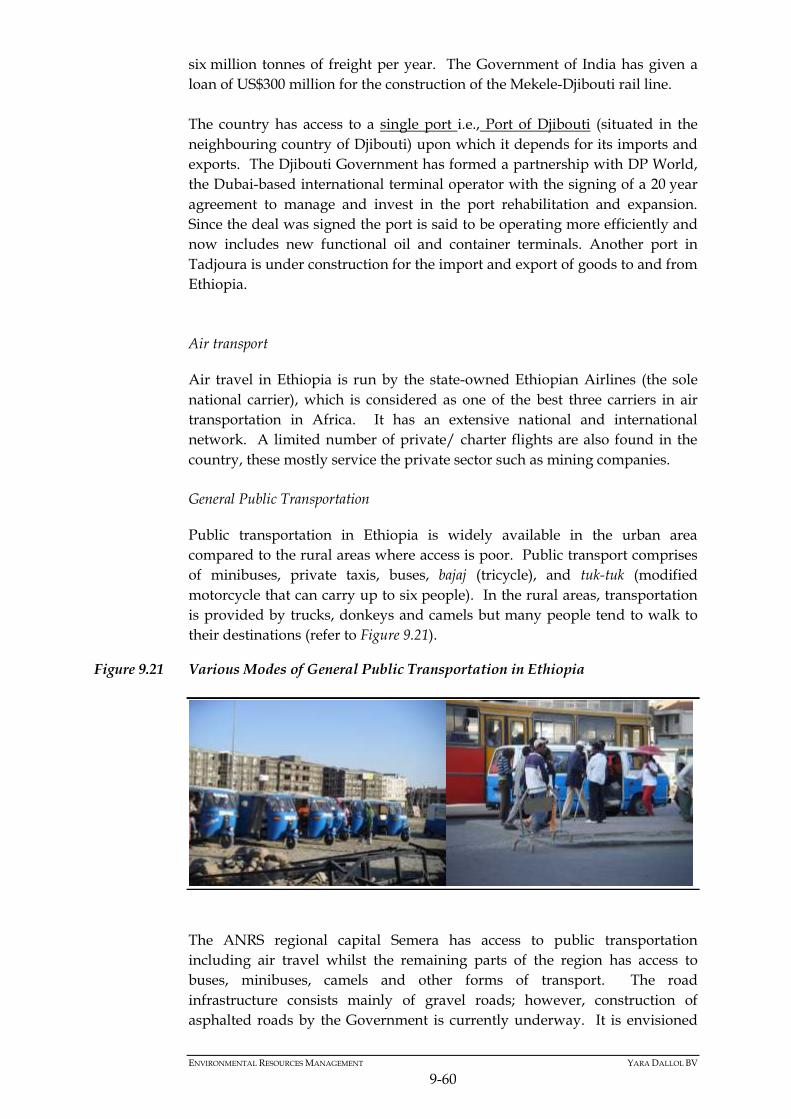
ENVIRONMENTAL RESOURCES MANAGEMENT YARA DALLOL BV
9-60
six million tonnes of freight per year. The Government of India has given a
loan of US$300 million for the construction of the Mekele-Djibouti rail line.
The country has access to a single port i.e., Port of Djibouti (situated in the
neighbouring country of Djibouti) upon which it depends for its imports and
exports. The Djibouti Government has formed a partnership with DP World,
the Dubai-based international terminal operator with the signing of a 20 year
agreement to manage and invest in the port rehabilitation and expansion.
Since the deal was signed the port is said to be operating more efficiently and
now includes new functional oil and container terminals. Another port in
Tadjoura is under construction for the import and export of goods to and from
Ethiopia.
Air transport
Air travel in Ethiopia is run by the state-owned Ethiopian Airlines (the sole
national carrier), which is considered as one of the best three carriers in air
transportation in Africa. It has an extensive national and international
network. A limited number of private/ charter flights are also found in the
country, these mostly service the private sector such as mining companies.
General Public Transportation
Public transportation in Ethiopia is widely available in the urban area
compared to the rural areas where access is poor. Public transport comprises
of minibuses, private taxis, buses, bajaj (tricycle), and tuk-tuk (modified
motorcycle that can carry up to six people). In the rural areas, transportation
is provided by trucks, donkeys and camels but many people tend to walk to
their destinations (refer to Figure 9.21).
Figure 9.21 Various Modes of General Public Transportation in Ethiopia
The ANRS regional capital Semera has access to public transportation
including air travel whilst the remaining parts of the region has access to
buses, minibuses, camels and other forms of transport. The road
infrastructure consists mainly of gravel roads; however, construction of
asphalted roads by the Government is currently underway. It is envisioned

ENVIRONMENTAL RESOURCES MANAGEMENT YARA DALLOL BV
9-61
that this will increase the availability of public transport in the regional and
zonal levels.
Approximately four years ago, there were no asphalt roads in the Social Study
Area; however, the presence of the mining companies has resulted in the
several kilometres of asphalt roads being constructed, leading into the area.
The majority of the roads to the villages are gravel, and impassable in certain
sections during both the dry and wet seasons.
Public transportation in the Social Study Area is scarce. Most people walk to
their destinations or use donkeys or camels. Some hitch rides on trucks
belonging to the highlanders. Those who trade in Adukua can walk for up to
three to five days to reach the markets so they can sell their livestock or salt
(refer to Figure 9.22).
Figure 9.22 Camel Carrying Fuel Wood in the Social Study Area
Telecommunication Services
Ethiopia has a telecommunications monopoly namely Ethio Telecom, a state-
owned company for both mobile and fixed-line services. An estimated
25 percent of the Ethiopian population is said to have access to mobile phones
while only 2.5 percent has access to internet (1). In 2011, Ethio Telecom stated
that it was operating 854,000 landlines, which is approximately one landline
(1)http://www.economist.com/news/middle-east-and-africa/21584037-government-expands-mobile-phone-network-
tightens-its-grip-out-reach (Aug, 2013)

ENVIRONMENTAL RESOURCES MANAGEMENT YARA DALLOL BV
9-62
per 100 people in the country (1). In 2011, it was estimated that only
0.2 percent of the rural population has access to mobile phones, which can be
attributed to a lack of appropriate infrastructure (electricity to charge, and
availability of mobile phone towers).
Similarly to the national level, at a regional and zonal level people do not have
fixed-line services and rely on their mobile phones to receive and make phone
calls. For instance, whilst visiting Zone 2 government officials, ERM observed
that the authorities used mobile phones to call each other for the meetings and
to access some of the data that the consultants had requested.
Until recently, there were no fixed-lines or mobile phone services in the Social
Study Area, but the presence of the mining exploration activities has resulted
in a mobile phone towers being installed in Hamad Ela and Bada. The service
is however poor, and sometimes disrupted for days.
Overall, the lack of infrastructure and service development in the Social Study
Area can be attributed to the impermanent and scattered nature of its
settlements and with no formal settlement pattern. Sometimes, what is
referred to as a village consists of only three or four households, which have
moved from their main village to settle elsewhere within the broader area.
For this reason, when the Government installs new infrastructure, it tends to
focus on large settlement. Those who have moved away from the large
settlements therefore tend to miss out on access to key services.
9.11 CULTURAL HERITAGE
This Section describes the national, regional, and local cultural heritage context
for the proposed Project. The national cultural context presents information on
the prehistory and history of Ethiopia while the regional context focuses on
the northern portion of the Afar Depression, commonly known as the
“Danakil Depression.” The local cultural heritage context presents the results
of the cultural heritage baseline surveys of the Project Area. The local context
provides a description of known and potential cultural heritage sites (both
living cultural heritage and archaeological sites) in the Project Area.
9.11.1 National Cultural Context
Ethiopia’s cultural heritage resources are very diverse. Numerous early
hominid and Palaeolithic discoveries attest to the region’s role in the process
of human evolution and mankind’s expansion out of Africa, while Ethiopian
states have been active participants in the flow of goods and ideas between
Europa, Asia, and Africa. For millennia, this interaction – coupled with
Ethiopia’s diverse cultural makeup – has led to the development of numerous
unique expressions of governance, architecture, and culture whose remains
(1) http://www.infoasaid.org/guide/ethiopia/telecommunications-overview#sthash.rGoFqcuW.dpuf

ENVIRONMENTAL RESOURCES MANAGEMENT YARA DALLOL BV
9-63
can still be seen in the modern day. A summary of the relevant periods and
important aspects of each is provided in Table 9.27.
Table 9.27 Timeline of Ethiopian Prehistory and History
Period Dates Description
Human Origins 5 to 3
MYA
Evolution of early hominids including Ardipithecus,
Australopithecus anamensis, and Australopithecus afarensis. Their
remains have been discovered in the following locations:
Middle Awash Valley and Northern Afar, Ethiopia. Early
hominids evolved in Ethiopia during the late Pliocene.
Early Stone Age 1 to 3
MYA
Appearance of Oldowan tools associated with members of the
genus Homo. Homo erectus remains have been discovered in the
Middle Awash Valley and Northern Afar regions of Ethiopia as
well as the Bay of Zula in Eritrea. Development of Oldowan
and Acheulian tool technology
Middle Stone Age 1 MYA to
40,000 BC
Appearance of fully modern humans (Homo sapiens sapiens).
Fossils and dense scatters of Middle Stone Age tools have been
found at: Mai Ba'ati in northern Afar and Agherri in the
Danakil Depression.
Late Stone Age 40,000 to
1,000 BC
Late Stone Age artefacts and small settlements from this period
have been found at Buri Paleolake and the Bay of Zula,
southern Eritrea.
Pre-Aksumite
Civilization/
Ethiopian Bronze
Age
1,000 BC
to AD 100
Rise of socio-political complexity and early states, including the
Kingdom of Daamat and important site of Yeha in northeast
Ethiopia. Evidence of independent domestication of barley in
Ethiopia.
The Aksumite
Empire/Ethiopian
Classical Period
AD 100 to
1,000
Rise and fall of the Aksumite Empire, the first Christian state.,
Expansion of regional and long distance trade, mineral
extraction in the Horn of Africa, and the development of
monumental architecture. Domestication of coffee.
Ethiopian
Medieval Period
AD 1,000
to 19th
century
Period of violence and war punctuated by periods of isolation
from the outside world. Founding of the Zagwe Dynasty and
the carving of the rock-cut churches of Lalibela. Revival of the
Solomonic Dynasty and founding of the city of Gondar.
Ethiopian-Adal War.
Modern Period
19th
century to
present
Emperor Menelik II secures throne in 1889. Italian invasions in
the 19th and 20th centuries. Serious droughts and famines.
Communist takeover of the government in 1970s. Formation of
Eritrean state, Border conflicts with Eritrea (including 1998-
2000 Ethiopian Eritrean War and signing of a peace agreement).
Subsequent growth and stability. Earliest documented
commercial salt and potash mining in the Danakil Depression.
Human Origins (4.2 to 2.6 Million Years Ago [MYA])
Ethiopia’s Awash River valley, located in the southern Afar Depression (well
away from the Yara Dallol BV Project Area), contains the remains of several
early hominid species believed to be ancestral to modern humans, including
Australopithecus (Au.) anamensis, Au. africanus, and Au. afarensis. The most
famous discovery from the Awash Valley is the 3.2 million year old
Australopithecus skeleton “AL 288-1,” better known as Lucy, discovered near
the town of Gona in 1974 (1) . “AL 333,” a 3.2 million year old site consisting of
(1) Johanson et al., 1982

ENVIRONMENTAL RESOURCES MANAGEMENT YARA DALLOL BV
9-64
a mass grave containing thirteen Au. afarensis individuals has also been found
in the Awash Valley.
Early, Middle, and Late Stone Ages (2.6 MYA to 1,000 B.C.)
The world’s oldest stone artefacts, dating 2.6 to 1.5 MYA, have been excavated
at the Ethiopian site of Gona. The Gona site has provided significant
information concerning the earliest tool-using hominid populations, the
technological development of stone tool production and use, as well as the
evolution of early cultural patterns (1). Numerous other Stone Age sites can be
found across the Great Rift Valley from Kenya to Eritrea, including the Early
to Late Stone Age site of Mai Ba’ati near the north-eastern Ethiopian city of
Mekele, and the Middle to Late Stone Age site of Agherri in the eastern
Danakil Depression. (2).
Aside from stone tools, genetic plant evidence obtained from Late Stone Age
archaeological sites in Ethiopia suggests that early cultivated barley did not
diffuse to northeast Africa from the Middle East as previously thought,
suggesting independent domestication of the crop within the Horn of
Africa (3).
Pre-Aksumite Civilization (1000 B.C. to A.D. 100)
Near the end of the Late Stone Age, groups of Semitic peoples from the
Arabian Peninsula began moving into the Horn of Africa. The interaction
between the native Cushitic peoples and these migrants, coupled with a shift
from highly mobile to settled societies, is widely believed to have fostered
more complex forms of socio-political organization. The early stages of
increasing cultural complexity in Ethiopia developed hand-in-hand with those
in the Arabian Peninsula and the seafaring economic networks of the Red Sea.
Early Egyptian texts mention a kingdom known as Daamat, which represents
the first written reference to Ethiopia, although the nature and extent of the
kingdom remains little researched (4). The most important archaeological site
dating to the Pre-Abyssinian period is the city site of Yeha, located about
100km east of Aksum.
Aksum Period (A.D. 100 to 1000)
The Kingdom of Aksum (or Axum), also known as the Aksumite Empire, was
a highly developed civilization most widely known today for its impressive
local architectural traditions. Emerging from a blend of native Ethiopian and
Arabian traditions, the Kingdom of Aksum used its proximity to the Red Sea
trade networks to become a major regional power, eventually controlling
portions of both the Sudan and Arabia. At the height of its power in the 4th
century AD, Aksum became the first major empire to convert to Christianity.
(1) Semaw, 2000 (2) Aerts et al., 2010 (3) Orabi et al., 2007 (4) Fattovich, 2009

ENVIRONMENTAL RESOURCES MANAGEMENT YARA DALLOL BV
9-65
In the 7th century; however, Aksum lost control of its Red Sea ports to Arab
traders and soon fell into steep decline.
Extensive regional and overseas exchange networks were the source of the
Aksumite Empire’s power. These trade networks reached as far abroad as the
Mediterranean Sea and China. Exported goods included agricultural products,
salt, gold, iron, ivory and livestock. The 1st century AD Greco-Roman text
Periplus Maris Erythraei (“Circumnavigation of the Red Sea”), states that
precious metals, Egyptian clothing, wine from Laodicea and olive oil from
Italy were imported at the Aksumite port of Adulis (central Eritrea). Aksumite
exports included ivory from the Sudanese Nile Valley, gold from
southwestern Ethiopia, and salt from the Danakil Depression (1). The coffee
bean was first domesticated in the Ethiopian highlands around the 6th century
AD, and its later discovery by Arab traders in the 13th century led to its global
trading.
Ethiopian Medieval Period (A.D. 1000 to 1800)
The centuries following the collapse of the Aksumite Empire are known as the
Ethiopian Medieval Period, and are characterised by the interaction – often
violent – between the Christian kingdoms of highland Ethiopia and a series of
outside forces. Emerging from the remnants of Aksum, the Christian Zagwe
dynasty ruled over much of modern Ethiopia and Eritrea during the 12th and
13th centuries AD. The rock-hewn churches at the Zagwe capital of Lalibela are
some of best known structures dating from this period.
The Zagwe were succeeded by the Solomonic dynasty, who ruled Ethiopia
until 1974. For centuries, the Solomonic emperors ruled from traveling royal
camps until the Emperor Fasilidas established a permanent capital at Gondar
in 1635. The city served as the capital through 17th century, and its public and
private architecture – most notably Fasil Ghebbi, the imperial residence –
display a variety of foreign influences, including Hindu, Arabic, and
European Baroque elements.
Increasing Arab control of the regional trade networks and the consolidation
of imperial Ethiopian power in the highlands during the Medieval Period also
encouraged the spread of Islam across the Horn of Africa. Nomadic groups
like the Somali and Afar present in the arid lands east of the Ethiopian Plateau
established numerous small Islamic trading states, and in the early 15th
century, the Adal Sultanate rose to power in the Afar Depression. Over the
next century, the Sultanate engaged in intense warfare with the Ethiopian
Empire as each sought to expand its territory.
The first sustained direct relations between Ethiopia and Europe began in the
early 16th century in response to the Ethiopian-Adal War, when the
Portuguese aided the Ethiopians against the Adal Sultanate and their Ottoman
Turk allies in one of the first proxy wars between the two European powers.
(1) Sernicola and Philippson, 2011

ENVIRONMENTAL RESOURCES MANAGEMENT YARA DALLOL BV
9-66
Following an attempt by the Portuguese-supported Jesuit order to convert the
population to Roman Catholicism from Ethiopian Christianity during the mid-
17th century, however, the Emperor Fasilides expelled all Europeans from the
kingdom and embarked on a policy of isolation.
Modern Period (A.D. 1800 to Present)
Beginning in the second half of the 17th century and continuing until the mid-
19th century, the Ethiopian Empire, weakened by internal divisions and war,
remained isolated from much of the Western world. This tumultuous period
ended when the Emperor Menelik II secured the throne in 1889 and began a
process of territorial expansion and political centralization that marked the
beginning of the modern Ethiopian state. In 1890, Italian colonial aspirations
in the Horn of Africa led to the founding of the Colonia Eritrea along the Red
Sea. Following their 1895 defeat in the First Italo-Ethiopian War, the Italians
successfully invaded Ethiopia in 1935 and occupied the country until 1941.
Following the Second World War, the Ethiopian Empire was re-established
under the rule of Haile Selassie, who began a campaign of modernization. The
annexation of Eritrea in 1962, however, marked the start of the 30 year-long
Eritrean War of Independence; and increasing internal discontent in the early
1970s led to a socialist coup d’etat in 1974. The rule of the Ethiopian one-party
state (known popularly as “the Derg”) was defined by violence and
corruption, and popular dissatisfaction was further exacerbated by periodic
droughts and famine, the worst occurring between 1984 and 1985.1
The Derg regime collapsed in the late 1980s, and following a series of
provisional governments, the modern states of Eritrea and Ethiopia were
formed in 1993 and 1995, respectively. Disputes about the exact border
between the two nations resulted in the Eritrean-Ethiopian War from 1998 to
2000 (2). On 18 June 2000 both countries agreed to a comprehensive peace
agreement and binding arbitration of their disputes under the Algiers
Agreement. Stemming in part from the country’s long history, several regional
organizations are based in Addis Ababa, including the African Union and the
offices of various Non-Governmental Organisations (NGOs).
9.11.2 Regional Cultural Context
The unique landscape of the Danakil Depression has been a part of the Horn
of Africa’s prehistoric and historic-era cultural development over the last 4.2
million years. A lack of research in the Danakil; however, has limited the
understanding of the processes and details of this involvement. The baseline
information presented focuses on the Danakil Depression’s archaeological
past and the culture of the local Afar people.
Located at the northern edge of Ethiopia’s Afar Depression (the terminus of
the East African Great Rift Valley), the Danakil Depression was part of an
important migration route out of Africa for both modern humans and earlier
(1) Clay and Holcomb, 1986 (2) Tesfay, 2000
ENVIRONMENTAL RESOURCES MANAGEMENT YARA DALLOL BV
9-67
hominids throughout the late Pliocene, Pleistocene, and early Holocene
periods. Evidence for Late Stone Age occupations in the adjacent southern
Awash River Valley and in the Eritrean portions of the Danakil suggest an
extensive occupation of the area. A series of significant Stone Age sites have
been identified in the southern Buri Peninsula, Eritrea. These sites are
composed of numerous dense clusters of circular stone constructions with
associated artefacts dating from the Early Stone Age through the Late Stone
Age (1,2). Sites with similar interior structures have been preliminarily
identified by ERM in other portions of the Danakil Depression.
Key to any interpretation of potential archaeological sites in the Danakil
Depression is an understanding of the local climate over the last 50,000 years.
Palaeo-environmental data suggest that prior to 32,000 years ago the Horn of
Africa possessed a more humid climate resulting in denser vegetation cover
during the Late Pleistocene and Early Holocene. Some areas – including the
Danakil – were partially covered by paleo-extensions of the Red Sea (Bonatti et
al. 1971). A trend towards increasing aridity coupled with cultural
developments like the intensification of agricultural activity and increasing
demographic pressure from the Late Holocene through the mid–first
millennium AD directly contributed to the processes of environmental
degradation and declining population throughout the Afar Depression by the
late first millennium AD. These historic changes in the local environment
mean that areas that seem nearly uninhabitable today may have had springs,
streams, lakes or even paleo-sea shores that would have been attractive
locations for prehistoric populations.
Despite the Afar region’s aridity, the Danakil Depression has served as an
important trading link between the Red Sea ports and the highland Ethiopian
kingdoms since at least the Aksumite period of the 1st millennium BC. Records
indicate that Aksumite caravans exploited the natural salt plains of the
northern Danakil and interacted with the local nomadic groups, possibly
including ancestors of the modern Afar people. Islam spread through these
trade networks during the latter half of the 1st millennium AD, leading to the
creation of a series of Muslim trading sultanates throughout the entirety of the
Afar Depression during the 2nd millennium AD.
With the exception of the Adal Sultanate of the 15th and 16th centuries AD,
which challenged the primacy of the Ethiopian Empire, and the modern Afar
Sultanate (also known as the “Aussa” or “Awsa Sultanate”), which nominally
commands the loyalty of the modern Afar groups found throughout the
region, very little is known about the cultural history of the Danakil
Depression during the 2nd millennium AD.
Rare historical accounts of European expeditions into the Danakil offer
variable information. An account of the 1625 expedition of the Jesuit Jeronimo
(1) Lightfoot, 1996
(2) Beyin and Shea, 2007 (3) Beyin and Shea, 2011

ENVIRONMENTAL RESOURCES MANAGEMENT YARA DALLOL BV
9-68
Lobo, (1) provide little information about the region’s cultural heritage, instead
focusing on a detailed description of the natural landscape. In 1810 a Mr.
Coffin, assistant to the British official Henry Salt, travelled through the
Danakil en route from Amphillla Bay on the Red Sea to Chelicut, Ethiopia. In
1928, the British explorer L.M. Nesbitt led a small expedition through the
Danakil Depression from south to north, traveling over 800 miles during a
period of three and a half months (Figure 9.23 and Figure 9.24; Cooke 1867;
Nesbitt 1928, 1930a, b, & c). These accounts provide information on the
cultural and economic activities practiced in the region during the 19th and
early 20th centuries, including the creation of palm frond products and salt
mining, which are still carried out by modern Afar populations. Nesbitt’s
account specifically documents salt mining at sites near Fia and Lake Assale,
as well as the associated centuries-old tensions between various ethnic groups
competing over this important natural resource.
Figure 9.23 Nesbitt’s 1928 Route through the Danakil Depression
(4) Smith, 2011

ENVIRONMENTAL RESOURCES MANAGEMENT YARA DALLOL BV
9-69
Figure 9.24 Tomb Sketches from Nesbit’s Travel Journal
Industrial-scale exploitation of the Danakil Depression’s salt deposits dates to
the early 1900s, when Italian prospectors from Eritrea established the
Compagnia Mineraria Coloniale to extract potash and sulphur at Mount Dallol
between 1916 and 1929 (Nesbitt 1930c; Geological Survey of Ethiopia 2010).
Potash mining at Dallol was restarted by the US-based Parsons Company
between 1958 and 1968. Abandoned mining camps from both periods can be
found throughout the Project Area, including near the crater of Mount Dallol
and along the main roads (Figure 9.25).
Figure 9.25 Mining Camp Ruins in the Danakil Depression
9.11.3 Local Cultural context (Project Area)
The Cultural Heritage Study Area was initially defined with two
considerations in mind (see Figure 9.26). The first consideration was to make
sure that the Study Area covered all proposed Project components and
concession areas, many of which extend into the Dallol salt flats to the east.
The second consideration was to make sure that the Cultural Heritage Study
Area covered all cultural anomalies identified through desktop analysis of

ENVIRONMENTAL RESOURCES MANAGEMENT YARA DALLOL BV
9-70
satellite imagery. Of course, the imagery analysis covered the proposed
Project components, but it also extended to the west into the foothills of the
Ethiopian Plateau. The reason for this western extension was twofold: 1) to
investigate the potential for Paleolithic archaeological sites that existed at
elevations above sea level before the Danakil Depression was cut off from the
Red Sea about 20,000 years ago, and 2) to provide a better local context for the
types of cultural sites within the greater Project Area. Accordingly, the initial
Study Area was defined as such. However, once in the field, ERM learned of
an important concentration of sites further to the north of the defined Study
Area. It was decided to visit these more northern sites as well and so the Study
Area was extended to the north.

ENVIRONMENTAL RESOURCES MANAGEMENT YARA DALLOL BV
9-71
Figure 9.26 Cultural Heritage Study Area

ENVIRONMENTAL RESOURCES MANAGEMENT YARA DALLOL BV
9-72
9.11.4 Cultural Heritage Baseline
ERM’s cultural heritage baseline assessment was carried out in three stages
over a period of nine months. An initial scoping visit was carried out in
October 2013 with the objective of assessing the Project Area and determining
the most effective course of action for the follow-on and more detailed field
survey. An extensive desktop analysis programme was subsequently carried
out in order to inform and guide the follow-on field survey in April 2014. The
results of these stages have been examined and used to generate the
recommendations that follow.
Desktop Results: Literature Review and Satellite Imagery Analysis
The desktop analysis carried out by ERM was comprised of two tasks – a
literature review and a remote sensing survey. The literature review
consulted a large number of academic, professional, and historical texts in
order to determine the history of previous archaeological studies in the Project
Area, and identify the types of cultural resources that might be present.
Archaeological resources within the Horn of Africa date from the Palaeolithic
to the modern era, and include the remains of early hominids, pre-state
complex societies, local kingdoms, and medieval empires. Within the Horn of
Africa, the geological formation known as the Afar Depression extends across
Ethiopia, Eritrea, and Djibouti. The Project Area is located in a northern region
of the Afar known as the Danakil. The importance of the northern Afar in
Palaeolithic times can be tied in part to its position at the northern extent of
the Great African Rift Valley, an important natural corridor through which
early hominids migrated out of Africa.(1) For example, a one-million-year-old
hominid cranium was recently discovered at Buia between the Bay of Zula
and Mount Dallol.(2) The presence of Early and Middle Stone Age tools dating
between 2.6 million years ago and 10000 BC are documented along the
adjacent mountain slopes and alluvial fans to the east and west of the Project
Area.(3)
Evidence of Late Stone Age occupations in the northern Afar and adjacent
parts of Eritrea dating between 10000 and 1000 BC suggest the climatic
conditions at that time were more humid. A number of Late Stone Age site
complexes have been identified on the shores of Eritrea’s Buri Paleolake and
the Bay of Zula. The Buri Paleolake sites are comprised of large, dense clusters
of various types of stone cairns.(4) Larger stone cairns of a similar style are
known to exist within the Afar, including the Danakil Depression.
The subsequent remote sensing survey used publically available, high
resolution satellite imagery, which included the following sources: Google
Maps, Bing Maps, World Imagery, NASA Blue Marble and USGS Earth
(1) Abate et al., 2010 (2) Abate et al., 1998 (3) Roubet, 1970 (4) Lightfoot, 1996

ENVIRONMENTAL RESOURCES MANAGEMENT YARA DALLOL BV
9-73
Explorer. In addition to the publically available imagery, the Project also
provided high resolution commercial imagery (GeoEye) covering the
landscape around the Project Area. The goal of the desktop analysis was to
visually identify archaeological anomalies within the Cultural Heritage Study
Area in order to guide the subsequent archaeological field survey. In order to
accomplish this, a 1:2500 grid was set up over the area. Imagery within each
grid box was thoroughly examined for evidence of cultural heritage
anomalies. In total, 76 archaeological anomalies were identified through the
desktop remote sensing analysis (see Figure 9.27).

ENVIRONMENTAL RESOURCES MANAGEMENT YARA DALLOL BV
9-74
Figure 9.27 Cultural Heritage Anomalies Identified During Remote Sensing Analysis

ENVIRONMENTAL RESOURCES MANAGEMENT YARA DALLOL BV
9-75
Baseline Field Survey Results
Guided by the results of the desktop review, ERM carried out a field survey
within the Project Area. The objective of this phase of the study was to
ground-truth the potential archaeological anomalies that were identified
during the desktop remote sensing analysis. Ground-truthing was undertaken
by field walking to the locations of the anomalies to assess and verify if they
were indeed true archaeological sites. In addition, the locations of any
previously unidentified archaeological sites encountered during the survey
were also recorded. The ERM field survey recorded the key data - the location,
age, function, size, and sensitivity - of all positively-identified archaeological
sites. In total, 78 sites were identified in such manner. In the case of those
remotely sensed anomalies determined not to be true archaeological sites (i.e.
a natural pile of stones), this negative identification was noted, although no
additional information was recorded. Also, in several cases, anomalies
identified during the remote sensing effort were situated in inaccessible
locations (i.e. on top of bluffs or far from passable roads) and were therefor
not visited due to health and safety concerns (see Figure 9.28).
ERM investigations identified six different categories of tangible cultural
heritage resources within the Project Area. A description of each category is
provided below, along with photos of the resources and the relative frequency
of the identified resources by category. Annex E (Part II of the ESIA) provides a
complete list of recorded archaeological sites found during the ERM cultural
heritage survey of the Project Area.

ENVIRONMENTAL RESOURCES MANAGEMENT YARA DALLOL BV
9-76
Figure 9.28 Overview of Field Results from Cultural Heritage Survey

ENVIRONMENTAL RESOURCES MANAGEMENT YARA DALLOL BV
9-77
Isolated Cairns
The term cairn refers to a man-made pile or stack of stones. A cairn may serve
as a grave, religious structure, storage area, or landscape marker. Cairns can
be found either in groups or as isolated features. The most common type of
isolated cairn found in the Project Area is the conical cairn (refer to Figure
9.29). The function of the conical cairns is not fully understood, but the most
likely scenario is that they are grave markers. However, without more
intensive investigations a degree of uncertainty will remain concerning the
functions of cairn structures.
Nevertheless, there are some aspects about these cairn structures that are
known. Based on evidence collected by ERM, it can be conservatively stated
that these cairns are more than 100 years of age and, in some circumstances,
are likely very much older. The first indication comes from the travel accounts
of the British explorer L.M. Nesbitt, who led a small expedition across the Afar
in 1928(1). The Nesbitt expedition documented hundreds of large cairn
complexes along their route between Afdera and Mount Dallol. At the time,
local peoples mentioned that these structures were built by an ancient
population that left the area long ago. Nesbitt’s accounts (which describe the
cairns as “graves”) are the only published description of these archaeological
sites. Additionally, during this survey (and during a different ERM survey
carried in 2012 within the southern Danakil) diagnostic Late Stone Age
obsidian tools were recorded around several conical cairns. If these stone tools
are indeed associated with the original use of the cairns, this suggests that at
least some of the encountered cairns could be between 5,500 and 4,000 years
old.
Figure 9.29 Isolated Cairn Types Found in Project Area
Cairn Clusters
Cairn clusters or complexes can be characterised as a grouping of multiple
cairns; the density of individual cairns within a cluster can vary. Cairn clusters
are quite common in the western half of the Project Area, and are sometimes
(1) Nesbitt, 1929
Isolated Conical Cairns
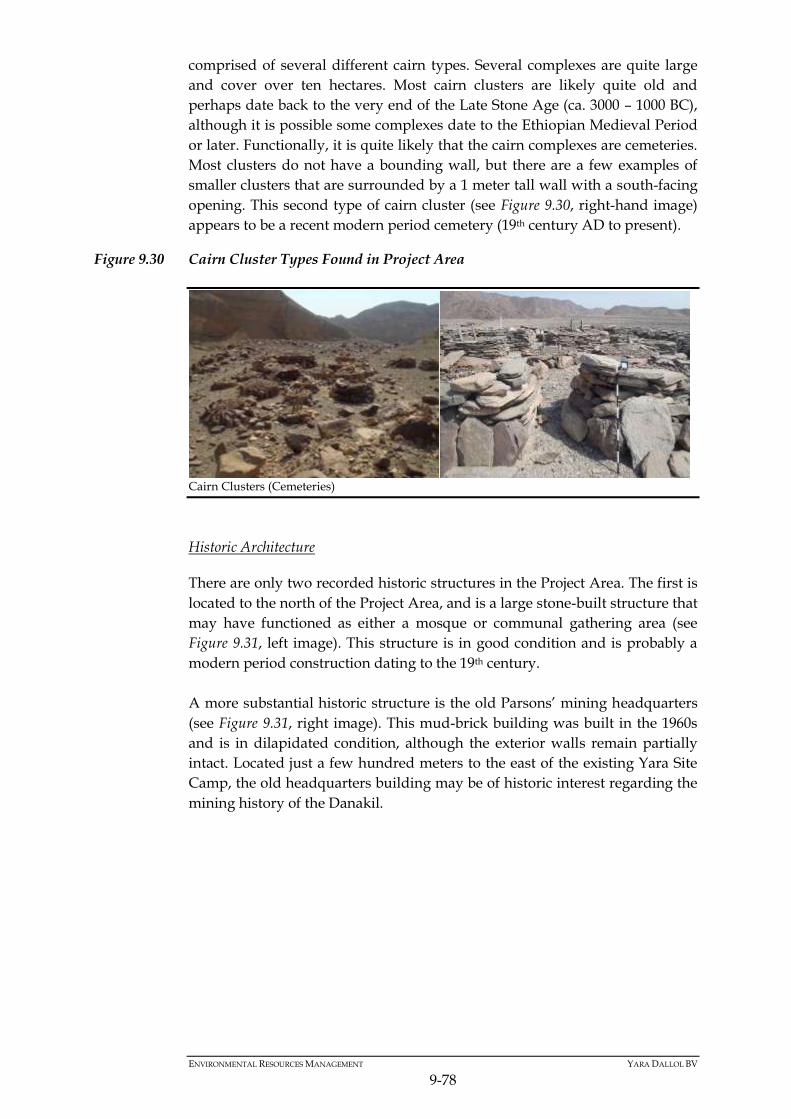
ENVIRONMENTAL RESOURCES MANAGEMENT YARA DALLOL BV
9-78
comprised of several different cairn types. Several complexes are quite large
and cover over ten hectares. Most cairn clusters are likely quite old and
perhaps date back to the very end of the Late Stone Age (ca. 3000 – 1000 BC),
although it is possible some complexes date to the Ethiopian Medieval Period
or later. Functionally, it is quite likely that the cairn complexes are cemeteries.
Most clusters do not have a bounding wall, but there are a few examples of
smaller clusters that are surrounded by a 1 meter tall wall with a south-facing
opening. This second type of cairn cluster (see Figure 9.30, right-hand image)
appears to be a recent modern period cemetery (19th century AD to present).
Figure 9.30 Cairn Cluster Types Found in Project Area
Cairn Clusters (Cemeteries)
Historic Architecture
There are only two recorded historic structures in the Project Area. The first is
located to the north of the Project Area, and is a large stone-built structure that
may have functioned as either a mosque or communal gathering area (see
Figure 9.31, left image). This structure is in good condition and is probably a
modern period construction dating to the 19th century.
A more substantial historic structure is the old Parsons’ mining headquarters
(see Figure 9.31, right image). This mud-brick building was built in the 1960s
and is in dilapidated condition, although the exterior walls remain partially
intact. Located just a few hundred meters to the east of the existing Yara Site
Camp, the old headquarters building may be of historic interest regarding the
mining history of the Danakil.

ENVIRONMENTAL RESOURCES MANAGEMENT YARA DALLOL BV
9-79
Figure 9.31 Historic Architecture Found in the Project Area
Historic Architecture
Military Structures
A current Ethiopian military base is located adjacent to the Yara Site Camp,
and dozens of military shooting blinds surround the military base (refer to
Figure 9.32). These structures are recently built and are of very low sensitivity.
Additional military structures are not common within the greater Project
Area.
Figure 9.32 Military Structures Found in the Project Area
Military Shooting Blind
Rock Shelters
Many rock shelters (shallow caves – refer to Figure 9.33) are located in the far
western reaches of the Project Area within the deep gullies leading into the
foothills of the Ethiopian Plateau. Rock shelters are known to have been
favoured habitation areas for early hominids throughout the Great African
Rift Valley; however, because the Danakil was covered by the Red Sea until
around 20,000 years ago, only those rock shelters that are at elevations above
sea level could be considered as potential locations for early hominid shelters.
The ERM survey team identified one rock shelter within the Project Area at an
elevation above modern sea level. However, it would be necessary to conduct

ENVIRONMENTAL RESOURCES MANAGEMENT YARA DALLOL BV
9-80
test excavations here in order to investigate if early hominid remains or
artefacts are present.
Figure 9.33 Rock Shelter Found in Project Area
Rock Shelter (Above Sea Level)
Abandoned Settlements
The most common type of site recorded in the Project Area was abandoned
settlements. These sites often come in the form of expansive clusters of dense
stone circles, and tend to be located in the western half of the Project Area.
These stone circles most likely formed the base of thatched dome tents, which
are still in common use by the local Afar people today. The abandoned
settlement sites appear to range in date from the very recent past up to 3,500
years old. This assessment is based upon the analysis of numerous artefacts
that were recorded at many of these settlements, including ceramics, obsidian
stone tools, cowrie shells (see Figure 9.34, bottom left image) and amethyst
beads (see Figure 9.34, bottom right image). Based on this information, these
abandoned settlements have been identified as some of the more sensitive
archaeological resources in the region as they have the most potential to
provide insight into how the ancient populations of the Danakil lived.

ENVIRONMENTAL RESOURCES MANAGEMENT YARA DALLOL BV
9-81
Figure 9.34 Abandoned Settlements and Associated Artefacts Found in Project Area
Abandoned Settlements and Associated Artefacts
Specialized Activity Areas Found in the Project Area
A specialized activity area is defined as a location where a specific type of
activity took place. For example, one of the more important specialized
activity areas discovered in the Project Area was a stone-built animal trap (see
Figure 9.35). A stick and rope trigger would have held a worked slab of stone
suspended above the entrance to the interior space. When an animal triggered
the trap, the worked stone would fall and trap the animal within. The ERM
cultural team’s guide claimed that the local population used to build these
types of traps until fairly recently, suggesting that this example could date to
the 19th century AD. Other specialized activity areas recorded included:
storage areas, small seasonal dams, and animal pens, all of which are of low
cultural sensitivity.

ENVIRONMENTAL RESOURCES MANAGEMENT YARA DALLOL BV
9-82
Figure 9.35 Specialized Activity Area in the Project Area
Stone-built Animal Trap
Cultural Heritage Baseline Study Limitations and Gaps
The study limitations and gaps for the cultural heritage study include:
Uncertainty of Site Function/Age - There is a lack of background knowledge about the ancient cairn complexes found within the Project Area. Because these resources are a relatively recent discovery in the archaeology of eastern Africa, the function and age of these cairn complexes are not yet fully understood. Without a history of field research and publications documenting archaeological excavations and scientific dating results, any assessment of the ancient cairn complexes remains a preliminary evaluation based upon the experience of the Cultural Heritage experts involved with this study. It is important to note that this gap only applies to the ancient cairn complexes, and there are many other types of tangible archaeological resources which can be assessed with a greater level of confidence.
Sites present but not Identified by the Relatively Rapid Assessment Method Used - There remains the possibility that additional surface archaeological resources exist that were not recorded by either the satellite remote sensing or the field survey. This uncertainty is a consequence of the relatively quick pace of the survey within the Cultural Heritage Study Area. There is also the potential to encounter subsurface archaeological resources; however, this would not be revealed prior to subsurface archaeological investigations or intrusive Project construction activities.
Both of these gaps are common for rapid reconnaissance of a previously
unexplored area. The gaps will be further addressed by the mitigation
measures presented in Chapter 11.

ENVIRONMENTAL RESOURCES MANAGEMENT YARA DALLOL BV
9-83
9.12 VISUAL AND LANDSCAPE
9.12.1 Visual and Landscape Study Area
A Zone of Theoretical Visibility (ZTV) was produced based on the
approximate worse case height of the larger elements of the proposed Project
(30m for the Processing Plant and 30m for the Tailings Management Area
[TMA]). Due to the flat topography in the Project Area, the ZTVs (see Figure
9.36 and Figure 9.37) suggested widespread visibility. However the ZTV is
based on a bare earth model and does not take into account vegetation,
buildings or environmental conditions like haze and reflection, which
effectively screen or reduce visibility to and from the site. Therefore the
geographic extent of the area where landscape and visual baseline data was
collected (i.e. the Visual and Landscape Study Area) was up to 12 km from the
boundary of the Project Area. At distances greater than 12km it is considered
unlikely that the proposed Project will be seen even though the landscape is
flat and devoid of any vegetation. This is due to a combination of factors such
as the dust, haze and poor visibility conditions which are common in the
Project Area and surrounds due to the extreme heat in the baseline
environment. The Project Area is located within the Danakil Depression which
experiences an extremely hot and arid climate and is commonly known as the
hottest place (hottest average temperature) on earth (this is discussed in detail
in Chapter 8). The lowlands of the Danakil Depression are characterised by
desert conditions with monthly mean temperatures varying from 24.40C
during the wet season (June to September) to 46.70C in the dry season
(October to May).
The Project Area is flat open land largely devoid of vegetation, other than
scattered patches of low desert scrub. The Project Area and surrounds do not
have any statutory designations with respect to planning or landscape and
visual aspects. It is understood that while Development Plans for the wider
region are in the process of being prepared, these are strategic and generic and
are not specific to landscape and visual matters. There are currently no land
use plans in place within the site or in surrounding areas.

ENVIRONMENTAL RESOURCES MANAGEMENT YARA DALLOL B
9-84
Figure 9.36 Processing Plant Zone of Theoretical Visibility with a Height of 30 Metres

ENVIRONMENTAL RESOURCES MANAGEMENT YARA DALLOL B
9-85
Figure 9.37 TMA Zone of Theoretical Visibility with an Eventual Height of 30 Metres
ENVIRONMENTAL RESOURCES MANAGEMENT YARA DALLOL BV
9-86
9.12.2 Baseline
Landscape Characteristics in the Wider Region
As is previously mentioned, the Project Area is situated in the Danakil
Depression and is dominated by extensive lowland salt plains and other
evaporate deposits (altitude – 120 m below sea level). To the west folded,
faulted and tectonically deformed volcanic and sedimentary rocks form a rift
escarpment. On the downside (east) of the escarpment alluvial fan deposits
and foothills form a transition to the lower salt plains to the east. To the far
east and west, relief peaks of highland plateaus are visible from the Project
site. On the north eastern edge of the depression, maritime hills border a hot,
arid, and treeless strip of land sixteen to eighty kilometres wide. These coastal
hills drain inland into saline lakes, from which commercial salt is extracted.
The Project Area and Immediate Surroundings Profile
The Project Area is located almost entirely within flat open salt plains with a
small area of alluvial fan and foothills landscape to the west. There are no
settlements located directly within the Project Area although a number of
villages are located in the surrounding area to the west, including Musley and
Asabuya. Mount Dallol, a volcano/hydrothermal field around 60m high, lies
immediately to the south east of the Crescent concession area.
The immediate surroundings to the Project Area are:
Open clear salt plains to the north, east and south;
Gently rising rocky alluvial fans and foothills to the west featuring
scattered small villages; and
Mount Dallol immediately to the east.
Almost all of the land in the Project Area is open with sparse vegetation. The
salt plains are largely devoid of vegetation cover with only a strip of scrub
vegetation to the west, whereas the alluvial fans contain scattered areas of
desert scrub.
From the social baseline data collection conducted in April 2014 it can be
stated that infrastructure and basic services such as sanitation, water,
electricity, telecommunication, police and emergency services are largely
absent in the communities surveyed. There are limited dirt roads linking
settlements like Musley and Asabuya and these are generally used for salt
trade and tourism purposes. There is also a new asphalt road connecting
Dallol with the main Mekele-Adrigrat road to the south. There are no
substantial physical developments in the immediate and wider area indicating
signs of expansion or growth; however, small scale exploratory drilling has
been undertaken immediately north, east and south of the Project Area since
2011 (refer to cumulative impact assessment in Chapter 12).

ENVIRONMENTAL RESOURCES MANAGEMENT YARA DALLOL BV
9-87
In essence the area’s sense of place is derived mainly from its ‘arid desert
setting’ with only a few scattered settlements. The landscape character areas
within the Project Area and surrounds are briefly described in Table 9.28 and
have been illustrated in Figure 9.38.
Table 9.28 Landscape Character Areas
Landscape Character Area Description Sensitivity
Open arid salt plains Land to the north, east and south of the Project
site comprises flat open salt plains largely
devoid of vegetation. The area contains little
development, although evidence of small-scale
exploratory mining is visible in places to the
north of the Project area. The area is also not
designated and there are few settlements, no
cultural heritage assets and no recognised
tourist attractions. This type of landscape forms
the majority of the Project Area.
Given that the
area is open,
desolate with no
vegetation, the
sensitivity is
considered to be
low.
Mount Dallol A hydrothermal field in a salt pan containing
hot brine springs, sulphur formations and salt
column formations. It is an important site for
tourists and internationally known for its multi-
coloured salt deposits, hot springs and
miniature geysers. It is amongst the lowest
volcanoes on land in one of the lowest
elevations on earth (approximately 116 m below
sea level).
Given that the
area is visited by
tourists and has
spectacular
characteristic
views of the
surrounding salt
deposits, the
sensitivity is
considered to be
high.
Gently rising alluvial fans
and foothills
Land to the west of the Project area comprises
open rocky alluvial fan deposits forming a
transition between the mountainous rift
escarpment to the west and the flat salt plains to
the east. The gently rising topography produces
a sense of elevation over the salt plains. The
gravels and rocks support patches of low desert
scrub and thorny plants which gives the
landscape a rough texture. The area contains a
number of scattered nomadic villages, including
Musley and Asabuya, which contain vernacular
dwellings made of sticks and mud and
generally have low- average build quality.
These organic settlements are purely functional
and have little or no aesthetic elements within
their design.
The area is not
designated and
has an open,
desolate
character;
however, due to
the presence of
settlement the
overall
sensitivity of the
area is
considered to be
medium.

ENVIRONMENTAL RESOURCES MANAGEMENT YARA DALLOL BV
9-88
Figure 9.38 Landscape Character Areas in the Project Area and Surrounds

ENVIRONMENTAL RESOURCES MANAGEMENT YARA DALLOL BV
9-89
9.12.3 Existing Views and Visual Environment
With the assistance of surveys, ZTVs (refer to Figure 9.36 and Figure 9.37) and
aerial photography, viewpoints across the Project Area and surrounds have
been selected to represent the range of views and types of viewers likely to be
affected by the proposed Project. These are described in Table 9.29 below and
illustrated as “VP” in Figure 9.36 and Figure 9.37.
Table 9.29 Selected Viewpoints
VP No. VP Location VP Description Sensitivity
1 View from Ashe Ale
(similar views will be
available from Lake
Assale) (approximately
12km to the south of the
Project Area)
View north west across the flat,
open expansive salt plains. Dust
and haze obscure visibility on
the salt plains in the distance.
The rift escarpment forms the
backdrop above this.
Considering the small
number of residents (and
small number of tourists)
and the nomadic nature
of the settlement the
overall sensitivity is
considered to be medium.
2 View from tarmac road
near the military camp
and Yara Dallol BV
Project Camp
(approximately 250m to
the west of the Project
Area) (similar views
available from the
military camp)
View east across open rocky
ground featuring low desert
scrub. The existing military
camp and Yara Dallol BV
Project Camp are visible in the
middle ground. Mount Dallol is
visible in the background but
partially obscured by haze and
dust.
Considering the small
number of road users
(and residents/workers)
the overall sensitivity is
considered to be low
3 View from Mount Dallol
(approximately 2.5km to
the southeast of the
Project Area)
View northwest from the
summit of Mount Dallol
featuring rocky salt formations.
Salt stack deposits in the
foreground provide intermittent
screening to the flat open salt
plains in the middle ground of
view. The existing military
camp and Yara Dallol BV
Project Camp are visible in the
left of the middle ground,
although haze and dust slightly
obscure views. The rift
escarpment forms the backdrop
to the view.
Considering the
topographical elevation
in relation to the Project
site, the small number of
tourists and the fact that
visitors’ attention is
focused on the geological
deposits nearby, the
overall sensitivity is
considered to be medium.
4 View from Musley
village (approximately
3.3km to the west of the
Project Area )
A slightly elevated view east
across the rocky alluvial fans.
The flat salt plains are visible in
the distance although haze and
dust obscures visibility.
Considering
topographical elevation
in relation to the Project
site, the small number of
residents and the
nomadic nature of the
settlement, the overall
sensitivity is considered
to be medium.
5 View from Asabuya
village
(approximately 7 km to
the northwest of the
Project Area)
A slightly elevated view
southeast over the open
expansive flat salt plains.
Considering the small
number of residents and
nomadic nature of
settlement the overall
sensitivity is considered
to be medium.

ENVIRONMENTAL RESOURCES MANAGEMENT YARA DALLOL BV
9-90
There are no designated views or views of international/national/local
importance within the Project Area and surrounds. However, views of the
salt deposits from Mount Dallol are renowned for the spectacular displays of
salt and sulphur deposits and views over the surrounding salt plains.
9.13 SOCIO-ENVIRONMENTAL SENSITIVITIES
Chapter 8 presents the sensitivity of the Project Area of influence from an
ecological perspective. Figure 9.39 presents the aforementioned biological
sensitivities together with the following social sensitivities discussed in this
Chapter:
The presence of villages;
Cultural heritage sites;
Key grazing areas; and
Key tourist features (viz. Mount Dallol).
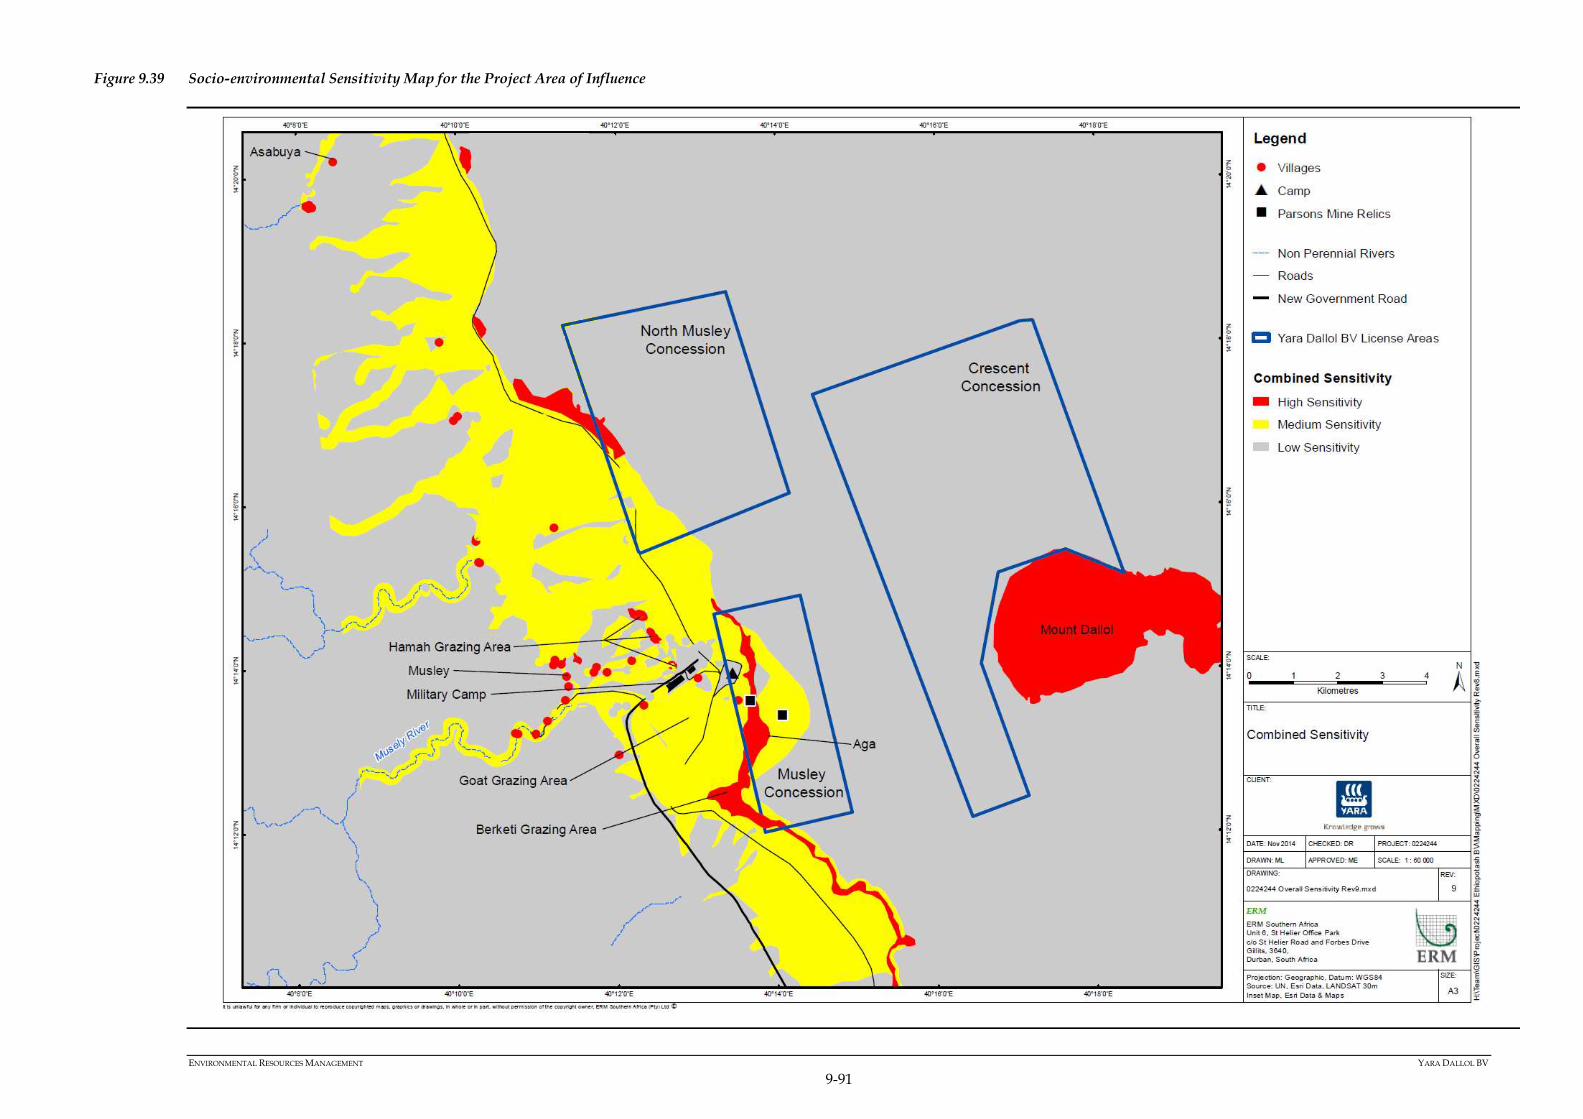
ENVIRONMENTAL RESOURCES MANAGEMENT YARA DALLOL BV
9-91
Figure 9.39 Socio-environmental Sensitivity Map for the Project Area of Influence

ENVIRONMENTAL RESOURCES MANAGEMENT YARA DALLOL BV
9-92
9.13.1 Socio-environmental Sensitivity Description
The Presence of Villages
All villages in the Project Area of influence are considered to be Highly
Sensitive, as members of the village are classified as being sensitive to
activities associated with the proposed Project. A study specific buffer of 200m
has been placed around all villages. This buffer area is also characterised as
having a critical to high sensitivity.
Cultural Heritage Sites
The cultural heritage baseline surveys identified a total of 78 cultural heritage
sites within the Cultural Heritage Study Area. Each site was assigned a
sensitivity value based on the criteria detailed in Table 9.30:
Table 9.30 Cultural Heritage Site Sensitivity Characteristics
Cultural Heritage
Site Sensitivity
Defining Characteristic(s)
Low Site is not specifically protected under local, national, or international laws
or treaties; Site can be moved to another location or replaced by a similar
site, or is of a type that is common in surrounding region; site has limited
or no cultural value to local, national or international stakeholders; and/or
site has limited scientific value or similar information can be obtained at
numerous sites. Replicable cultural heritage.
Medium Site is specifically or generically protected by local or national laws but
laws all for mitigated impacts; Site can be moved or replaced, or data and
artefacts recovered in consultation with stakeholders; Site has considerable
cultural value for local and/or national stakeholders; and/or site has
substantial scientific value but similar information can be obtained at a
limited number of other sites. Non-replicable cultural heritage.
High Site is protected by local, national, and international laws or treaties; site
cannot be moved or replaced without major loss of cultural value; legal
status specifically prohibits direct impacts or encroachment on site and/or
protection zone; Site has substantial value to local, national, and
international stakeholders; and/or site has exceptional scientific value and
similar site types are rare or non-existent. Critical cultural heritage.
Grazing Areas
Key grazing areas (Sagan, Hamah, Aga and Berketi) in the Project Area of
influence are considered to be Highly Sensitive. Livestock keeping is the
main subsistence livelihood of the population in the Project Area, which gives
importance to areas that provide adequate grazing for livestock.
Key Tourist Features
The key tourist feature in the Project Area of influence is Mount Dallol. This
feature was delineated through digitisation of the visual perimeter of the
feature. Furthermore, a 200m buffer has been placed around the digitised
perimeter. Mount Dallol and its associated buffer have been considered to be
Highly Sensitive.

ENVIRONMENTAL RESOURCES MANAGEMENT YARA DALLOL BV
9-93
9.13.2 Application of the Socio-environmental Sensitivity Assessment
The socio-environmental map is created as a tool to guide the spatial
development of activities/infrastructure in a manner that minimises impacts
to both the social and biophysical environments. The following simple
approaches should be followed for the planning of activities/infrastructure:
Activities/infrastructure should be directed wherever possible towards
the Low Sensitivity areas.
Activities/infrastructure that infringes areas classified as being Highly to
Moderately Sensitive should strive to reduce the impacts on these areas
that resulted in the sensitivity rating.
Activities/infrastructure are to be planned and implemented in a manner
that sustains the key values of Highly Sensitive areas.
Activities/infrastructure should not infringe areas classified as being
Highly Sensitive. Only where no feasible alternatives exist should any
impacts be allowed on these habitats, and in such cases additional
precautionary measures should be taken that reduce the impacts
specifically on the biodiversity and ecosystem values for which these
habitats have been classified as Sensitive or Highly Sensitive.

