7. paleolatitude of the southern kerguelen plateau inferred from the
TRANSCRIPT

Wise, S. W., Jr., Schlich, R., et al., 1992Proceedings of the Ocean Drilling Program, Scientific Results, Vol. 120
7. PALEOLATITUDE OF THE SOUTHERN KERGUELEN PLATEAU INFERRED FROM THEPALEOMAGNETIC STUDY OF UPPER CRETACEOUS BASALTS1
Hiroo Inokuchi2 and Franz Heider3
ABSTRACT
Paleomagnetic measurements were performed on 106 basalt samples collected from Holes 747C, 748C, 749C, and750B. Basalt samples were recovered from the southern portion of the Kerguelen Plateau and the transitional zonebetween the northern and southern plateau in the south central Indian Ocean. The ages of basalts range from 100to 115 Ma. In addition to the preliminary shipboard measurements (Schlich, Wise, et al., 1989), characteristicinclinations of the magnetization were obtained using mainly stepwise thermal demagnetization of the samples.Reliable paleomagnetic results were obtained from three sites (Sites 747, 748, and 749). The paleomagneticinclinations of Sites 747, 748, and 749 are -51°, -63°, and -62°, respectively. The considerable differences betweenthe paleomagnetic and present inclinations of about 70° at Sites 747, 748, and 749 indicate that displacement in thedirection of the geomagnetic meridian has taken place since formation of the basalt. Shallower paleomagneticinclinations than the present inclinations at each site imply a southward movement of the sites with respect to thegeomagnetic pole. By comparing the apparent polar wander path of Antarctica with the virtual geomagnetic pole(VGP) of the Southern Kerguelen Plateau, we have concluded that no major tectonic movement has taken placebetween the Kerguelen Plateau and Antarctica since formation of the basalt (i.e., 100-115 Ma). The angulardispersion of the VGP for the Kerguelen Plateau is calculated as 17°.
INTRODUCTION
The Kerguelen Plateau is a broad topographic high in thesouth central Indian Ocean. The plateau stretches approximately2300 km between 46°S and 64°S from the Antarctic continentalmargin in a northwest-trending direction. The feature is between200 and 600 km wide and stands 2-4 km above the adjacentoceanic basins (Schlich, Wise, et al., 1989, pp. 7-23). This largeplateau is considered to be important for the study of the historyof the Indian Ocean. One of the objectives of Ocean DrillingProgram (ODP) Leg 120 was to study the tectonic history of theKerguelen Plateau. Determining the paleolatitude of the plateauprovides one key to solve the tectonic history.
The Kerguelen Plateau has been divided into two distinctdomains (Schlich, 1975; Houtz et al., 1977). Basalt sampleswere recovered from the southern portion of the plateau (Sites748, 749, and 750) and the transitional zone between thenorthern and southern plateaus (Site 747). The ages of thebasalts are 100 m.y. (Site 748) and between 80 and 115 m.y.(Sites 747, 749, and 750), as determined radiometrically withthe K/Ar method (Whitechurch et al., this volume) or between100 and 115 m.y. for the four sites, as concluded frompaleontologic data (Schlich, Wise, et al., 1989, p. 23, fig. 4).The paleomagnetic results from these Cretaceous rocks arepresented in this paper. The rock magnetic properties of theserocks are reported by Heider et al. (this volume).
Preliminary paleomagnetic results from basement rockswere obtained during Leg 120 (Schlich, Wise, et al., 1989).Shipboard measurements were conducted on two to nine
1 Wise, S. W., Jr., Schlich, R., et al., 1992. Proc. ODP, Sci. Results, 120:College Station, TX (Ocean Drilling Program).
2 Department of Earth Sciences, Faculty of Science, Kobe University,Kobe 657, Japan (current address: Marine Biological Station, Faculty ofScience, Kobe University, Iwaya 2746, Awaji, Tsuna, Hyogo 656-24, Japan).
Geophysics Laboratory, Department of Physics, University of Toronto,Toronto, Ontario, M5S 1A7, Canada (current address: Institut für Allgemeineund Angewandte Geophysik, Ludwig-Maximilians-Universitàt, Theresien-strasse 41, 8000 München 2, Federal Republic of Germany).
samples for the different sites. Progressive alternating field(AF) demagnetization was mainly used on board the ship. Thepurpose of the land-based study was to increase the number ofmeasurements obtained after thermal demagnetization. Morereliable paleomagnetic latitude data from the Late Cretaceousbasement rocks of the Kerguelen Plateau will be presentedsynthesizing the shore-based and shipboard paleomagneticmeasurements. These paleolatitudes will be discussed in rela-tion to the paleoposition of Antarctica.
SAMPLES AND MEASUREMENTSPaleomagnetic studies were performed on 106 basalt sam-
ples collected from Holes 747C, 748C, 749C, and 750B. Site747 (54°48.7'S, 76°47.6'E; water depth, 1697 m) lies in thetransition zone between the northern and southern parts of theKerguelen Plateau. The basement rocks that form approxi-mately 15 separate basalt units were recovered between 296.6and 350.5 m below seafloor (mbsf) and were named Unit V(Schlich, Wise, et al., 1989, pp. 89-156). We collected 31samples from 13 flow units. Site 748 (58°26.5'S, 78°58.9'E;water depth, 1290 m) is located on the Southern KerguelenPlateau in the western part of the Raggatt Basin, east of theBanzare Bank (Schlich, Wise, et al., 1989, pp. 157-235).Seven samples were collected from the basalt flows recoveredbetween 898.8 and 902.2 mbsf (Subunit IVA). Site 749(58°43.0'S, 76°24.5'E; water depth, 1069.5 m) is located on thewestern flank of the Banzare Bank on the Southern KerguelenPlateau. The 23.1 m of recovered basalt consist of five flowsand one dyke between 202 and 249.5 mbsf (Unit III; Schlich,Wise, et al., 1989, pp. 237-275). We collected 37 samples fromthe 5 flows. Site 750 (57°35.5'S, 81°14.4'E; water depth, 2030.5m) is located on the Southern Kerguelen Plateau in the easternpart of the Raggatt Basin, west of the Labuan Basin. At leastfour basalt flows (Unit V) were recovered between 675.5 and709.7 mbsf (Schlich, Wise, et al., 1989, pp. 277-337), and 33specimens were sampled for paleomagnetic measurements.
All basalt samples were taken from the sampling half of thecore, and cylindrical samples (2.5 cm in diameter and 2 cm inheight) were cut. Before drilling the specimen, an arrow
89

H. INOKUCHI, F. HEIDER
pointing in the upcore direction was marked with a diamondpen.
Paleomagnetic measurements were conducted on JOIDESResolution and at Kobe University. Remanent magnetizationswere measured with a spinner magnetometer. During thecruise, 8, 2, 7, and 6 samples from Sites 747, 748, 749, and 750,respectively, were stepwise AF demagnetized up to 80 mT, oruntil the intensity of magnetization had been reduced to 5% ofthe original intensity. One sample from each site (Samples120-747C-12R-4, 3-5 cm; 120-748C-79R-6, 50-52 cm; 120-749C-16R-6, 84-86 cm; and 120-750B-15R-4, 126-128 cm)was thermally demagnetized up to 600°C on the ship. In mostcases, results from AF and thermal demagnetization agreewell at each site. Stepwise thermal demagnetization up to theCurie temperature was chosen for the remaining samples forthe shore-based measurements.
The inclination of the characteristic magnetization of asample was determined from a straight line that passesthrough three or more data points and the origin on anorthogonal vector plot (Zijderveld diagram; Zijderveld, 1967).The declinations of all samples are arbitrary because thebasement cores were recovered with a rotary core barrel(RCB) corer. Therefore, the cores were unoriented withrespect to azimuth. Inclination, intensity of natural remanentmagnetization (NRM), and the temperature or AF intervalthat was used for determination of the characteristic directionare shown in Table 1.
The mean inclination of each flow and each site wasdetermined using the characteristic inclinations of the samplesand the mean inclinations of the flows, respectively. Forcalculating the mean inclination of each flow or site, specialstatistics had to be used because the rocks had only inclinationvalues. The algorithm developed by Kono (1980) was em-ployed in the computation of mean inclinations and 95%confidence limits (095). From the mean inclination of each site,the equivalent magnetic paleolatitude was calculated underthe assumption of an axial geocentric dipole field.
RESULTS AND DISCUSSION
Site 747Eight samples were AF demagnetized, and 23 samples
were thermally demagnetized. There are two types of inten-sity decay curves during stepwise thermal demagnetization.Sample 120-747C-12R-4, 27-29 cm, has two magnetic phases(Fig. 1). Stable inclinations of this sample were obtained froma rather high-temperature component (i.e., 500°-560°C; Fig. 1).Sample 120-747C-15R-3, 127-129 cm, has little indication of asecond magnetic phase, and its stable component is obtainedfrom a rather wide temperature interval (i.e., 200°-560°C; Fig.2). Characteristic inclinations from all samples with both typesof intensity decay curves were taken for the calculation ofmean inclination. The high-temperature component (Fig. 1)suggests the presence of a low-Ti titanomagnetite. Low-Tititanomagnetites with exsolved ilmenite lamellae and/or low-temperature oxidized titanomaghemite were found from rockmagnetic investigations of the basalts from Site 747 (Heider etal., this volume). The median destructive fields (MDF) foreight samples using AF demagnetization range from 11 to 32mT.
All samples from Site 747 have a stable component ofremanence during both stepwise thermal and AF demagnetiza-tion. The rather high MDFs and the existence of the magnetitewith ilmenite lamellae formed by high-temperature oxidationsuggests that characteristic inclinations at this site are fromprimary magnetization acquired at the age of the basalt flow
Table 1. Paleomagnetic results of basalts from the Ker-guelen Plateau (Sites 747, 748, 749, and 750).
Core, section,interval (cm)
120-747C-
11R-1, 42-44
Inc. (°)
-57
Mo(A/m)
2.91
Demag range(degrees or mT)
AF 3-25
11R-2, 19-2111R-2, 94-9511R-2, 136-13811R-3, 28-3011R-3, 94-96
ean N = 5
12R-1, 47-49
12R-2, 61-6312R-2, 99-10112R-2, 126-12812R-3, 84-8612R-3, 137-13912R-4, 3-5
-48-50-52-43-55
-50
-59
-52-52-54-54-53-54
2.555.061.793.103.42
«95
8.62
0.630.290.232.873.202.71
THAFAFAFA F
= 5.5°
TH
THTHTHTHTHAF
450-5605-60
10-255-20
15-50
k = 195
500-560
200-530400-560200-500100-570200-560
5-15
Mean N = 6
12R-4, 27-29
13R-1, 2-413R-1, 27-2913R-1, 98-100
Mean N = 3
13R-3, 35-37
14R-1, 38-4014R-1, 113-115
Mean N = 2
15R-1, 32-3415R-1, 71-73
Mean N =2
15R-2, 86-8815R-2, 131-133
Mean N = 2
15R-3, 127-12915R-4, 53-55
Mean N = 2
16R-2, 74-7616R-2, 98-100
Mean N = 2
16R-4, 61-6316R-5, 13-1516R-5, 46-48
Mean N = 3
120-748C-
-53
-49
-46-53-53
-51
-41
-18-42
-31
-40-38
-71-71
-46-62
-46-52
-37-38-38
-38
«95 =3.40
2.902.442.23
«952.70
5.491.89
1.421.43
-39
4.792.16
-71
1.832.68
-55
1.201.35
-49
2.120.941.02
1.0°
TH
THTHTH
7.3°
TH
THTH
AFTH
AFTH
THTH
THTH
THTHTH
1.0°
k = 4043
200-560
300-560350-500200-600
k = 286
400-600
100-560500-600
20-80350-560
20-80200-560
200-560450-530
300-560200-530
100-530450-600400-600
k = 14704
79R-6, 22-2479R-6, 50-5279R-6, 73-7579R-6, 121-12379R-7, 3-579R-7, 45-4679R-CC, 15-17
-61-68-63-70-62-68-62
11.3017.9615.0010.3516.509.698.89
THTHTHAFTHAFTH
400-560400-500400-530
10-20400-500
15-35400-530
Mean N = 7 -65Mean N = 5 -63
(only thermal demagnetization)
«95«95
3.5°3.1°
120-749C-
k = 295k = 596
12R-1, 135-13712R-2, 15-1712R-2, 82-8412R-2, 99-10112R-3, 55-57
-62-62-66-69-63
3.204.057.314.246.51
THTHTHAFTH
200-600100-560400-600
5-50400-600
Mean N =5 -65 = 3.5° k = 473
90

SOUTHERN KERGUELEN PLATEAU PALEOLATITUDES
Table 1 (continued).
Core, section,interval (cm)
12R-4, 7-912R-4, 134-13612R-5, 3-512R-5, 41-4312R-5, 45-47
Mean N = 5
15R-1, 44-4615R-1, 121-12315R-2, 27-2915R-2, 85-8715R-2, 130-13015R-3, 19-2115R-4, 13-1515R-4, 87-8915R-5, 73-75
Mean N = 8
15R-5, 140-14215R-6, 57-5915R-6, 113-11515R-6, 124-12615R-7, 3-516R-1, 24-26
Mean N = 6
16R-1, 139-14116R-2, 134-13616R-3, 134-13616R-4, 132-13416R-5, 32-3416R-5, 111-11316R-5, 119-12116R-6, 9-1116R-6, 84-8616R-6, 107-10916R-7, 18-2016R-7, 61-63
Mean N = 12
120-750B-
15R-1, 62-6415R-2, 62-6415R-2, 78-8015R-2, 101-10315R-3, 83-8515R-3, 98-10015R-4, 25-2715R-4, 57-5915R-4, 126-12815R-5, 22-2415R-5, 114-11615R-6, 80-8215R-7, 17-1916R-1, 31-3316R-1, 140-14216R-2, 13-1516R-2, 129-13116R-3, 68-7016R-3, 134-13616R-4, 56-5816R-4, 77-7916R-4, 98-10016R-5, 130-13216R-6, 16-1816R-6, 110-11216R-7, 44-4616R-7, 104-10616R-8, 29-3116R-8, 34-36
Mean N = 19
17R-1, 49-5117R-2, 86-8817R-2, 105-10717R-3, 9-11
Inc. (°)
-63-62-66-68-69
-66
-64-52-58-40-58-63-59-60—
-58
-60-58-63-58-60-63
-60
-61-62-63-62-63-65-64-64-65-64-62-65
-63
-70-74-76-74-75-76-78-77-78
•
-69-71
-73-73-72-77
-72-70-70-71
-74
-71-69
-66
Mo
(A/m)
2.351.9410.903.832.77
«95
1.073.324.0812.704.143.185.604.411.31
«95
12.504.3813.105.467.2012.70
«95
6.762.628.5411.1010.103.6312.9013.9012.277.538.889.24
«95
3.441.410.760.901.381.330.991.291.701.852.452.201.572.552.742.463.443.382.212.622.840.832.113.094.775.697.158.032.77
«95
2.252.952.172.95
Demag range(degrees or mT)
THTHTHTHAF
= 53.7°
THAFTHTHTHTHTHTHAF
= 8.0°
THTHTHAFTHTH
= 52.4°
THTHTHTHTHAFTHTHTHAFTHTH
= 1.0°
THTHAFTHTHTHTHTHTHTHTHTHTHTHTHTHTHTHAFTHTHAFTHTHTHTHTHTHAF
= 1.7°
AFAFTHTH
400-600400-600450-530450-560
5-30
k = 5435
200-50015-40
300-560450-530450-530200-530200-530200-530
k = 549
400-530400-560100-53020-50
200-500200-530
k = 5789
200-560200-600200-530400-560200-56030-50
100-600200-56060-59020-60
200-560200-560
k = 1890
200-560200-560
10-40200-560200-560300-560200-560200-56060-540
200-450250-400
20-30200-500200-450
5-15
200-500200-500200-530
5-50
k = 410
5-205-20
400-560
Table 1 (continued)
Core, section,interval (cm)
Mean N = 3
Inc. 0
-69
Mo
(A/m)
«95
Demag range(degrees or mT)
4.5° k = 759
Note: Inc. = characteristic inclination determined from stepwisedemagnetization; Mo = NRM intensity; demag = demagneti-zation by either alternating field (AF) or thermal (TH) methodswas used; range = characteristic inclination is determinedfrom the component in this range during demagnetization. Thethick horizontal lines represent boundaries between basaltflows. The mean inclination of each flow with 95% confidencelimit (095) and precision parameter k were calculated usingKono's (1980) statistics and represented below the thin line.
formation. Marshall and Cox (1972) and Johnson and Merrill(1974) have reported that remanent magnetizations do notchange their directions much during both single-phase oxidationand low- temperature oxidation on the ocean floor. The NRMdirections can be considered useful for Paleomagnetism if thehigh-temperature oxidation happened before the basalt flowscooled. However, the magnetic directions are not very stableduring thermal demagnetization at temperatures below 300°C.Characteristic inclinations from the same flow agree well witheach other, as shown in Table 1. The mean inclination of eachflow and the 95% confidence limits are shown in Table 1. Themean inclination of 13 flows at Site 747 is -51°, with an error of7.3° at the 95% confidence limit. An inclination of -51° isequivalent to a magnetic paleolatitude of 32°S and is significantlydifferent from the present inclination of -71°.
Site 748Two samples were AF demagnetized, and five samples
were thermally demagnetized at Site 748. All samples showthe two magnetic phases in the stepwise thermal demagneti-zation. Sample 120-748C-79R-7, 3-5 cm, is shown as arepresentative example in Figure 3. Stable inclinations forthese samples were obtained from the temperature intervalabove 400°C. Characteristic inclinations for all thermallydemagnetized samples have unblocking temperatures above400°C. The intensity ratio of high- to low-temperature phasesat Site 748 is relatively small compared with the ratio deter-mined for Site 747. This agrees with the dominant magneticcarrier being titanomaghemite, as found from the rock mag-netic investigation (Heider et al., this volume). The MDFs ofthe two AF demagnetized samples are 8 and 13 mT.
All samples from Site 748 have a stable component ofremanence during both stepwise thermal demagnetizationabove 400°C and AF demagnetization. The magnetization ofthe samples from this site is considered unstable because ofthe low MDFs and the low-intensity percentage of the highertemperature component. Only the high-temperature phasemay have a primary component acquired at the age of thebasalt flow formation because the magnetic directions are notvery stable during thermal demagnetization below 400°C.Characteristic inclinations obtained from AF demagnetizationare slightly steeper than those obtainted from thermal demag-netization, as shown in Table 1. The characteristic inclinationvalues (69°) after AF demagnetization are quite close to thepresent field inclination (-73°).
The mean inclination calculated from five inclination val-ues obtained by thermal demagnetization will be considered inthe following. The low MDFs and the present field direction inSamples 120-748C-79R-6, 121-123 cm, and -79R-7, 45-46 cm,indicate a secondary overprint that cannot be removed by AFdemagnetization. Samples were taken from only one flow atthis site. The short-term secular variation of the Earth's
91

H. INOKUCHI, F. HEIDER
-Y,Up
100 200 300 400Temp.(°C)
500 600
Figure 1. Thermal demagnetization of Sample 120-747C-12R-4, 27-29cm. Two magnetic phases are shown in the intensity decay curve.Change in direction is shown in an equal area projection (left) and inorthogonal vector projections (right). Solid and open circles representhorizontal (X and Y) and vertical (upward-downward and X) compo-nents of magnetization, respectively. Declinations are arbitrary. Nor-malized intensity decay is plotted vs. temperature of thermal demag-netization (below).
magnetic field is not averaged out in paleomagnetic data froma small number of rock units, and such data are not repre-sentative of the long-term dipole field. The mean inclination ofthis flow will be treated as the characteristic inclination of Site748. The mean inclination from thermal demagnetization ofthe flow is -63°, with an error of 3.1° at the 95% confidencelevel. An inclination of -63° is equivalent to a magneticpaleolatitude of 45°S and is shallower than the present incli-nation of -73°.
Site 749Seven samples were AF demagnetized, and 30 samples
were thermally demagnetized at Site 749. Two types ofintensity decay curves during thermal demagnetization can berecognized similar to Site 747. Examples of a demagnetizationcurve with two magnetic phases (Sample 120-749C-12R-4,134-136 cm) and one with one magnetic phase (Sample120-749C-16R-5, 119-121 cm) are shown in Figures 4 and 5,respectively. The high-temperature phase may correspond tothe magnetization of a Ti-poor titanomagnetite with ilmenitelamellae, and the low-temperature phase may correspond totitanomaghemite. Low-Ti titanomagnetite/maghemite grainswith ilmenite lamellae crosscutting the grains were noted frommicroscopic observations, cell edge determinations, and Curietemperature measurements (Heider et al., this volume). TheMDFs of eight samples range from 10 to 18 mT.
Except for one sample, all remaining samples from Site 749have a stable remanent component during stepwise thermal orAF demagnetization. Sample 120-749C-15R-5, 73-75 cm, hadan unstable direction, and its inclination changed considerably
-Y,Up
Y -x|—i—h
Y,Down
J/Jo 1.0
100 200 300 400 500 600Temp.(°C)
Figure 2. Thermal demagnetization of Sample 120-747C-15R-3, 127-129 cm. One magnetic phase is shown in the intensity decay curve andmagnetization is stable. For an explanation of the diagrams, seeFigure 1.
•Y.Up
-Y Y -X
Y.Down
J/Jo 1.0
0 100 200 300 400 500 600Temp.(°C)
Figure 3. Thermal demagnetization of Sample 120-748C-79R-7, 3-5cm. Two magnetic phases are shown in the intensity decay curve andstable magnetization is obtained from the high-temperature compo-nent.
92
SOUTHERN KERGUELEN PLATEAU PALEOLATITUDES
-Y,Up -Y,Up
|Y -X | — I — I — ^
Y.Down
J/Jo 1.0 J/Jo 1.0
100 200 300 400 500 600Temp.(°C)
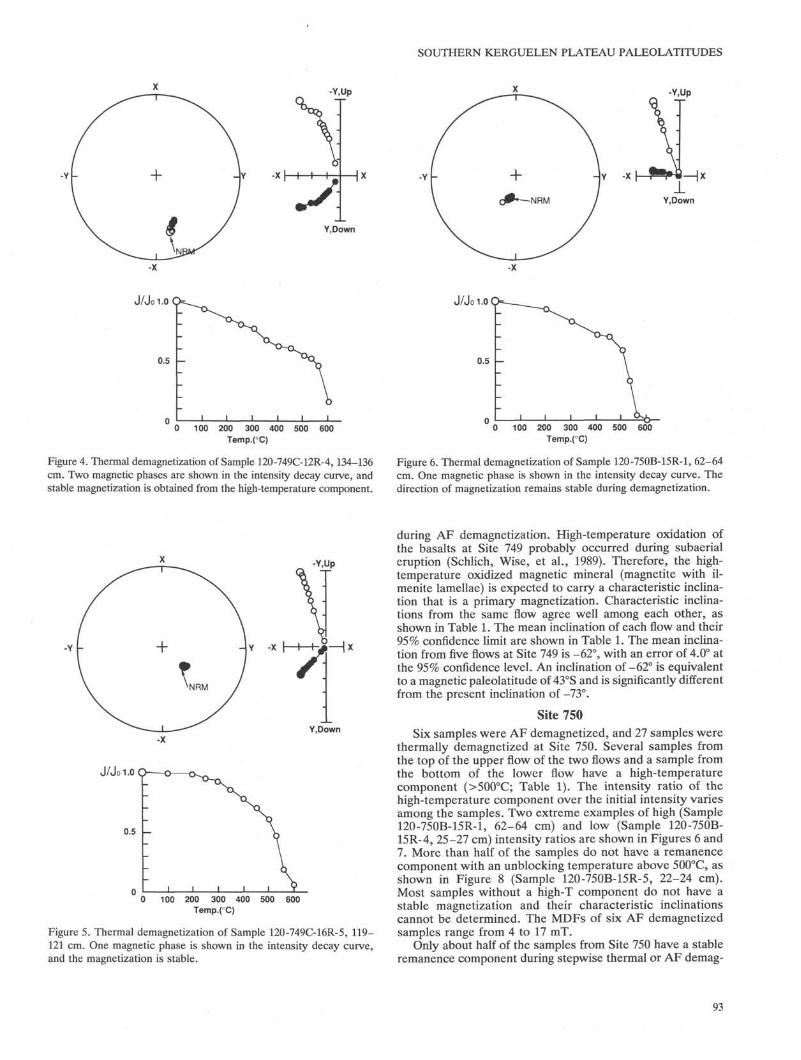
Figure 4. Thermal demagnetization of Sample 120-749C-12R-4, 134-136cm. Two magnetic phases are shown in the intensity decay curve, andstable magnetization is obtained from the high-temperature component.
100 200 300 400Temp.(°C)
500 600
Figure 6. Thermal demagnetization of Sample 120-750B-15R-1, 62-64cm. One magnetic phase is shown in the intensity decay curve. Thedirection of magnetization remains stable during demagnetization.
-Y
-Y,Up
Y -X
Y.Down
J/Jo 1.0
100 200 300 400 500 600Temp.(°C)
Figure 5. Thermal demagnetization of Sample 120-749C-16R-5, 119-121 cm. One magnetic phase is shown in the intensity decay curve,and the magnetization is stable.
during AF demagnetization. High-temperature oxidation ofthe basalts at Site 749 probably occurred during subaerialeruption (Schlich, Wise, et al., 1989). Therefore, the high-temperature oxidized magnetic mineral (magnetite with il-menite lamellae) is expected to carry a characteristic inclina-tion that is a primary magnetization. Characteristic inclina-tions from the same flow agree well among each other, asshown in Table 1. The mean inclination of each flow and their95% confidence limit are shown in Table 1. The mean inclina-tion from five flows at Site 749 is -62°, with an error of 4.0° atthe 95% confidence level. An inclination of -62° is equivalentto a magnetic paleolatitude of 43°S and is significantly differentfrom the present inclination of -73°.
Site 750Six samples were AF demagnetized, and 27 samples were
thermally demagnetized at Site 750. Several samples fromthe top of the upper flow of the two flows and a sample fromthe bottom of the lower flow have a high-temperaturecomponent (>500°C; Table 1). The intensity ratio of thehigh-temperature component over the initial intensity variesamong the samples. Two extreme examples of high (Sample120-750B-15R-1, 62-64 cm) and low (Sample 120-750B-15R-4, 25-27 cm) intensity ratios are shown in Figures 6 and7. More than half of the samples do not have a remanencecomponent with an unblocking temperature above 500°C, asshown in Figure 8 (Sample 120-750B-15R-5, 22-24 cm).Most samples without a high-T component do not have astable magnetization and their characteristic inclinationscannot be determined. The MDFs of six AF demagnetizedsamples range from 4 to 17 mT.
Only about half of the samples from Site 750 have a stableremanence component during stepwise thermal or AF demag-
93

H. INOKUCHI, F. HEIDER
-Y,Up
Y.Down
-Y,Up
J/Jo 1.0
100 200 300 400Temp.(°C)
500 600
Figure 7. Thermal demagnetization of Sample 120-750B-15R-4, 25-27cm. Two magnetic phases are shown in the intensity decay curve. Thestable component of magnetization is obtained from the high-temper-ature part of the decay.
J/Jo 1.0
100 200 300 400 500 600Temp.(°C)
Figure 8. Thermal demagnetization of Sample 120-750B-15R-5, 22-24cm. No high-temperature components were observed. The magneti-zation is unstable.
netization. Characteristic inclinations from the same flowagree well among each other, as shown in Table 1. The meaninclinations of the two flows are -74° and -69°, and their 95%confidence limits are 1.7° and 4.5°, respectively (Table 1). Themean inclination of Site 750 is calculated to be -71°. Aninclination of -71° is equivalent to a magnetic paleolatitude of55°S and coincides within the error limits with the presentinclination of -72° for Site 750 assuming a geocentric axialdipole.
The similarity of the paleomagnetic inclination and thepresent magnetic inclination at Site 750 strongly suggest apresent field oveΦrint caused by thermo-viscous or chemicalmagnetization. Low MDFs and the fact that approximatelyhalf of the samples have no stable remanent componentsuggest that the magnetizations of the samples from Site 750are not reliable. Therefore, the results from this site will not beincluded in the further discussion of paleomagnetic directions.
DISCUSSION
The paleomagnetic results of the basalt samples from Site747 through 750 of Leg 120 are summarized in Table 2. Themean values of the characteristic inclinations at each site arecompared with the present inclinations, assuming a geocentricaxial dipole. The paleolatitudes of the four sites are shown inrelation to their present geographic latitudes.
Considerable differences between the paleomagnetic andpresent inclinations of Sites 747, 748, and 749 indicate thatdisplacement in the direction of the geomagnetic meridian hastaken place since formation of the basalt. Shallower paleo-magnetic inclinations than the present inclinations at each sitesuggest southward movement of the sites.
One can detect tectonic movements between two tectonicblocks by comparing the apparent polar wander path (APWP)
Table 2. Summary of the paleomagnetic resultsof Sites 747, 748, 749, and 750.
Site
NInc (pm)(°)"95 (°)kInc (pr)(°)Paleolatitude (°S)Present latitude (°S)Inc (Ant)
aUpper Tertiaryb100MaaJurassic
Inc (Aus)a
80 Ma100 Ma120 Ma
Inc (Ind)c
80 Ma100 Ma120 Ma
Inc (Afr)c
80 Ma100 Ma120 Ma
747
13-51
7.332
-713255
-64-61-41
-69-68-57
-72-69-74
-81-82-88
748
1-63
-734558
-67-64-46
-71-70-59
-71-68-74
-82-82-89
749
5-62
4.0353-73
4359
-67-64-45
-71-69-58
-70-68-73
-82-83-90
750
2-71
-7255
58
Notes: N = number of flows; Inc (pm) = paleomag-netic mean inclination for each site; 095 = 95%confidence limit; k = precision parameter; Inc (pr)= present inclination in an axial dipole field.Paleolatitude was calculated from Inc (pm). Ex-pected inclinations at each site from the APWPsfor adjacent continents.
aAPWPs from McElhinny (1973).bAPWPs from Idnurm (1985).cAPWPs from Piper (1987).
94

SOUTHERN KERGUELEN PLATEAU PALEOLATITUDES
90W90E
Figure 9. Positions (solid circles) of Sites 747, 748, and 749, and circlesfor their VGPs are shown in the equal angle projection. APWPs forAntarctica (ANT) during Upper Tertiary (UT) and Jurassic (J) (McEl-hinny, 1973) and at 100 Ma (Idnurm, 1985) (open circle), Australia(AUS), India (IND) and Africa (AF) between 120 and 80 Ma (Piper,1987) (open squares). VGPs for the Kerguelen Plateau fall on theAPWP for Antarctica at about 100 Ma.
of one block (e.g., Antarctica) with the virtual geomagneticpole (VGP) of the second block (e.g., Kerguelen Plateau).Unfortunately, only inclination data are available at the Ker-guelen Plateau. The lack of declination data allows us torecord only the drawing of circles for VGP positions, asshown in Figure 9. The APWPs of neighboring continents(i.e., Antarctica, Australia, India, and Africa) are plotted inFigure 9. The APWP for East Antarctica is only available forthe upper Tertiary, Jurassic, and Cambro-Ordovician (McEl-hinny, 1973) and for a bias-corrected pole path from the LateCretaceous to the present (Idnurm, 1985). The APWPs forAustralia, India, and Africa are summarized by Piper (1987).
If no tectonic movement has taken place between theSouthern Kerguelen Plateau (represented to a first approxi-mation by Sites 747, 748, and 749) and one of the adjacentcontinents, then the VGP of the three sites should fall on theVGP of one of the continents at about 100 Ma. The age ofbasalts range from 100 to 115 Ma (Schlich, Wise, et al., 1989,pp. 73-85, Fig. 4). The VGP circle of Site 747 intersects theAPWP of Antarctica between the upper Tertiary and theJurassic. The VGP circles of Sites 748 and 749 intersect theAPWP of Antarctica in the same interval (Fig. 9). The VGPcircles of Site 748 and 749 coincide with the bias-correctedVGP for Antarctica at 100 Ma, and they intersect the Austra-lian APWP between 100 and 120 Ma.
Another way to detect tectonic displacements between twoblocks is shown below using numerical values. By comparinginclinations obtained from poles on the APWP of one of theadjacent continents with the paleomagnetic inclinations forSites 747, 748, and 749, one can detect the displacementsbetween the two blocks in the direction of the magneticmeridian. Based on the continental APWPs, inclinations thatthe continental rocks would be expected to have at thepositions of the three sites can be calculated. These "imagi-nary" inclinations of the continents at Sites 747, 748, and 749are shown in Table 2 at around 100 Ma. The paleomagnetic
inclination (-51°) of Site 747 falls between the two inclinationsexpected for Antarctica in the Jurassic (-41°) and the upperTertiary (-64°). The paleomagnetic inclinations of Sites 748and 749 (-63° and -62°, respectively) fall between the twoin-clinations expected for Antarctica in the Jurassic (-46° and-45°) and the upper Tertiary (-67° and -67°). Equally well, thepaleomagnetic inclinations of Sites 748 and 749 lie between the"virtual" inclination, which are expected for the AustralianPlate for 120 and 100 Ma. The paleomagnetic inclinations forSites 747, 748, and 749 do not agree with the virtual inclina-tions of Africa and India.
The first implication for the tectonic displacement is that nomajor latitudinal movement has taken place between theSouthern Kerguelen Plateau and Antarctica and/or the South-ern Kerguelen Plateau and Australia as shown in Figure 9 andTable 2. However, longitudinal movement cannot be detectedfrom paleomagnetic data, and seafloor spreading is directedalmost in longitudinal direction between the Southern Ker-guelen Plateau and Australia along the Southeast Indian Ridgestarting in the Eocene (Le Pichon and Heirtzler, 1968). Thesuggestion that the Southern Kerguelen Plateau and Australiadid not move with respect to each other is not realistictherefore. Many authors (e.g., Royer and Sandwell, 1989;Veevers et al., 1985; Schlich, 1975, 1982; Liu et al., 1983;Cande and Mutter, 1982; Norton and Sclater, 1979; Weisseland Hayes, 1972; McKenzie and Sclater, 1971) have recon-structed the tectonic history of the Indian Ocean using platetectonic theory. Their results did not permit any tectonicmovement between the Kerguelen Plateau and the adjacentplates, except for the Antarctic Plate.
Finally, we conclude that no major tectonic movement hastaken place between the Kerguelen Plateau and Antarcticasince formation of the basalt (i.e., 100-115 Ma). For instance,the tectonic history reconstructed by Royer and Sandwell(1989) did not show major movement between the SouthernKerguelen Plateau and Antarctica. A more detailed polarwander path for Antarctica will help to refine the understand-ing of the relation between the Southern Kerguelen Plateauand Antarctica.
The intermediate paleolatitudes (32°, 45°, and 43°) for Sites747, 748, and 749 suggest a southward motion of the SouthernKerguelen Plateau since the formation of the basalts. Inaddition to this major tectonic motion, there is possible furtherinformation that can be extracted from paleolatitudes (Table2). If one subtracts the present latitudinal difference (3° or 4°)between Sites 747 and 748 or Sites 747 and 749 from theirdifference in paleolatitudes, one obtains a net difference inlatitude of 10° or 8°. There are three possible explanations forthis 10° or 8° difference.
The first possibility is that the paleolatitudes from Sites 747and 748 or 747 and 749 are either similar or the same, whichcannot be excluded based on the 95% confidence limit of theinclinations (Table 2). The second possible explanation could bedipping reflectors (see Schlich, Wise, et al., 1989, "SeismicStratigraphy" section, "Site 747" chapter). Based on multichan-nel seismic reflection data, M. Coffin (pers. comm., 1990)estimates the dip of the layering within the basement at Site 747as at least 10° to the north and almost flat at Sites 748, 749, and750. If the basalt layers at Site 747 dip to the north at about 10°because of tilting after deposition of the basement, the paleolat-itudinal difference between the two groups of sites could beexplained. Models of volcanic passive margin formation (Hinz,1981; Mutter et al., 1982) suggest that the dip is acquired after therocks are emplaced and have passed through the Curie temper-ature. This implies little (5°) or no tectonic displacement follow-ing emplacement of the basalt at Sites 747, 748, and 749. Thethird possibility is that Site 747 and the southern sites (Sites 748
95

H. INOKUCHI, F. HEIDER
and 749) belong to different tectonic blocks. Latitudinal displace-ment between Sites 747 and 749 are approximately 450 km, andthe Central Kerguelen Plateau (Site 747) may have moved in anorth-south direction with respect to the Southern KerguelenPlateau (Sites 748 and 749). Plate reconstructions for the region(Coffin and Royer, this volume) could account for some, but notall of the difference. According to the Coffin and Royer model,Site 747 was on the Australian Plate between 110 and 43 Ma.During the same interval, Sites 748 and 749 were on the Antarc-tic Plate. Latitudinal displacement between Sites 747 and 748/749was considered to be on the order of a few hundred kilometers.
Short-term variations in the geomagnetic field involvedirectional changes, called secular variation. The angulardispersion of the geomagnetic field over long periods of timerepresents the aspect of geomagnetic secular variation mostaccessible to paleomagnetic measurements. From Site 747, 13paleomagnetic directions were obtained. A sample of 13 isconsidered to be too small to calculate the angular dispersion.
In our study, incomplete paleomagnetic data (i.e., onlyinclination data are available) are not suitable for the calcula-tion of angular dispersion. Unfortunately, it is very difficult toobtain paleomagnetic data on paleosecular variation duringthe Late Cretaceous in a high southern latitude locality likeSite 747. Therefore, the angular dispersion data of Site 747 isimportant.
The precision parameter k from the 13 field inclinations wascalculated using Kono's (1980) statistics. According to equa-tions 6, 9, and 10 in McElhinny and Merrill (1975), the angulardispersion SF for the VGP is calculated as 16.6°. The upperand lower 95% confidence limits for SF are calculated as 22.4°and 13.2° from Cox (1969). The VGP angular dispersion of16.6° agrees with the mean paleosecular variation of the last 5m.y. at 30° magnetic latitude (McElhinny and Merrill, 1975).The paleosecular variation during the Late Cretaceous isalmost the same as that of the Holocene age (Piper, 1987).Thus, we concluded that SF = 16.6° for the Late Cretaceouson the Kerguelen Plateau is reasonable number, although thenumber of flows studied at Site 747 is rather small.
CONCLUSIONReliable paleomagnetic inclinations were obtained from
Sites 747, 748, and 749 as -51°, -63°, and -62°, respectively.The unstable magnetizations of the rocks from Site 750 wereconsidered unreliable. We obtained two magnetic phases inthe intensity decay curves during stepwise thermal demagne-tization at Sites 747, 748, 749, and 750. The high-temperaturemagnetic component was generally rather stable and is carriedby a high-temperature oxidized magnetic phase (Ti-poor tita-nomagnetite with ilmenite lamellae).
Considerable differences between the paleomagnetic andpresent inclinations of Sites 747, 748, and 749 suggest thatdisplacement in the direction of the geomagnetic meridian hastaken place since formation of the basalt. Shallower paleomag-netic inclinations than the present inclinations at each sitesuggest a southward movement of the sites with respect to thegeomagnetic pole. By comparing the APWPs for adjacent con-tinents with the VGP circles of the Southern Kerguelen Plateau,we suggest that no major latitudinal tectonic movement hastaken place between the Southern Kerguelen Plateau and Ant-arctica since the formation of the basalts (i.e., 100-115 Ma).
ACKNOWLEDGMENTSDiscussions with Millard Coffin and his comments to the
paper were highly appreciated. Critical reviews by N. Opdykeand R. Van Der Voo are also appreciated. We thank theOcean Research Institute, the University of Tokyo, and theOcean Drilling Program for the opportunities to participate onLeg 120.
REFERENCESCande, S. C , and Mutter, J. C , 1982. A revised identification of the
oldest sea-floor spreading anomalies between Australia and Ant-arctica. Earth Planet. Sci. Lett., 58:151-160.
Cox, A., 1969. Confidence limits for the precision parameter K.Geophys. J. E. Astron. Soc, 18:545-549.
Hinz, K., 1981. A hypothesis on terrestrial catastrophes-wedges ofvery thick oceanward dipping layers beneath passive continentalmargins-their origin and paleoenvironmental significance. Geol.Jahrb., E22:3-28.
Houtz, R. E., Hayes, D. E., and Markl, R. G., 1977. KerguelenPlateau bathymetry, sediment distribution and crustal structure.Mar. Geol., 25:95-130.
Idnurm, M., 1985. Late Mesozoic and Cenozoic Paleomagnetism ofAustralia-Ill. Bias-corrected pole paths for Australia, Antarcticaand India. Geophys. J. R. Astron. Soc, 86:277-287.
Johnson, H. P., and Merrill, R. T., 1974. Low temperature oxidationof a single-domain magnetite. / . Geophys. Res., 79:5533-5534.
Kono, M., 1980. Statistics of paleomagnetic inclination data. / .Geophys. Res., 85:3878-3882.
Le Pichon, X., and Heirtzler, J. R., 1968. Magnetic anomalies in theIndian Ocean and sea floor spreading. J. Geophys. Res., 73:2101-2117.
Liu, C. S., Curray, J. R., and McDonald, J. M., 1983. New con-straints on the tectonic evolution of the eastern Indian Ocean.Earth Planet. Sci. Lett., 65:331-342.
McElhinny, M. W., 1973. Paleomagnetism and Plate Tectonics:Cambridge (Cambridge Univ. Press).
McElhinny, M. W., and Merrill, R. T., 1975. Geomagnetic secularvariation over the past 5 m.y. Rev. Geophys. Space Phys.,13:687-708.
Mckenzie, D. P., and Sclater, J. G., 1971. The evolution for the EarlyCretaceous breakup of Gondwanaland off southwestern Australia.Mar. Geol., 26:41-48.
Marshall, M., and Cox, A., 1972. Magnetic changes in pillow basaltsdue to seafloor weathering. / . Geophys. Res., 77:6459-6469.
Mutter, J. C , Talwani, M., and Stoffa, P. L., 1982. Origin ofseaward-dipping reflectors in oceanic crust off the Norwegianmargin by "subaerial sea-floor spreading." Geology, 10:353-357.
Norton, I. O., and Sclater, J. G., 1979. A model for the evolution ofthe Indian Ocean and the breakup of Gondwanaland. J. Geophys.Res., 84:6803-6830.
Piper, J.D.A., 1987. Paleomagnetism and the Continental Crust:Milton Keynes (Open Univ. Press).
Royer, J. Y., and Sandwell, D. T., 1989. Evolution of the easternIndian Ocean since the Late Cretaceous: constraints from GEO-SAT altimetry. / . Geophys. Res., 94:13,755-13,782.
Schlich, R., 1975. Structure et age de Pocean Indien occidental. Mem.Hors-Ser. Soc. Geol. Fr., 6:1-103.
, 1982. The Indian Ocean, aseismic ridges, spreading centersand basins. In Nairn, A. E., and Stehli, F. G. (Eds.), The IndianOcean (Vol. 6): The Ocean Basins and Margins: New York(Plenum), 55-147.
Schlich, R., Wise, S. W., Jr, et al., 1989. Proc. ODP, InitRepts., 120:College Station, TX (Ocean Drilling Program).
Veevers, J. J., Tayton, J. W., Johnson, B. D., and Hansen, L., 1985.Magnetic expression of the continent-ocean boundary between thewestern margin of Australia and the eastern Indian Ocean. / .Geophys., 56:106-120.
Weissel, J. K., and Hayes, D. E., 1972. Magnetic anomalies in thesoutheast Indian Ocean. In Hayes, D. E. (Ed.), Antarctic Ocean-ology (Vol. II): The Australian-New Zealand Sector. Antarct.Res. Ser., 19:165-196.
Zijderveld, J.D.A., 1967. A.C. demagnetization of rocks: analysis ofresults. In Collinson, D. W., Creer, K. M., and Runcorn, S. K.(Eds.), Methods in Paleomagnetism: Amsterdam (Elsevier).
Date of initial receipt: 20 February 1990Date of acceptance: 28 November 1990Ms 120B129
96