the effect of the kerguelen plateau on the ocean...
TRANSCRIPT

The Effect of the Kerguelen Plateau on the Ocean Circulation
JINBO WANG,a MATTHEW R. MAZLOFF, AND SARAH T. GILLE
Scripps Institution of Oceanography, University of California, San Diego, La Jolla, California
(Manuscript received 6 November 2015, in final form 19 August 2016)
ABSTRACT
The Kerguelen Plateau is a major topographic feature in the Southern Ocean. Located in the Indian sector
and spanning nearly 2000 km in the meridional direction from the polar to the subantarctic region, it deflects
the eastward-flowing Antarctic Circumpolar Current and influences the physical circulation and bio-
geochemistry of the Southern Ocean. The Kerguelen Plateau is known to govern the local dynamics, but its
impact on the large-scale ocean circulation has not been explored. By comparing global ocean numerical
simulationswith andwithout theKerguelen Plateau, this study identifies twomajorKerguelen Plateau effects:
1) The plateau supports a local pressure field that pushes the Antarctic Circumpolar Current northward. This
process reduces the warm-water transport from the Indian to the Atlantic Ocean. 2) The plateau-generated
pressure field shields theWeddell Gyre from the influence of the warmer subantarctic and subtropical waters.
The first effect influences the strength of theAntarctic Circumpolar Current and the Agulhas leakage, both of
which are important elements in the global thermohaline circulation. The second effect results in a zonally
asymmetric response of the subpolar gyres to Southern Hemisphere wind forcing.
1. Introduction
Gill and Bryan (1971, p. 685) asked, ‘‘What would
happen to the world’s ocean circulation if the Drake
Passage were closed?’’ By conducting a series of nu-
merical simulations with differing bathymetries, they
showed that closing Drake Passage (DP) not only led to
the disappearance of theAntarctic Circumpolar Current
(ACC) but also had a profound impact on the global-
scale circulation and on intermediate water formation in
the region. While the Drake Passage allows the ACC to
exist, the Kerguelen Plateau (KP), one of the biggest
ocean ridges in the SouthernOcean, alters and steers the
ACC. The KP deflects the northern ACC front, that is,
the Subantarctic Front (SAF), equatorward toward the
energetic, warm, and saline Agulhas Return Current
and adjacent subtropical front. The confluence of these
currents leads to instabilities and the presence of high
mesoscale eddy energy downstream of the plateau,
which subsequently results in intense mixing and bi-
ological productivity (Gille 1997; Jayne and Marotzke
2002; Fu 2009; Lu and Speer 2010; Sallée et al. 2011;
Waterman et al. 2013; Gille et al. 2014; Rosso et al.
2014). Even with these circulation patterns, it is unclear,
however, whether there exists a Kerguelen Plateau ef-
fect as important as the Drake Passage effect with re-
spect to the global ocean properties.
As a major bathymetric feature of the Southern
Ocean, the KP is located in the southern Indian Ocean
at about 758E (Fig. 1). It extends more than 2200km
from 468 to 648S in a tilted northwest–southeast di-
rection and separates the Weddell–Enderby Basin to its
west and the Australian–Antarctic Basin to its east. The
Fawn Trough at about 568S splits the plateau into two
parts, the northern and southern Kerguelen Plateau.
The southernKPwas formed about 80–110million years
ago, while the northern KP was formed in the Cenozoic
period (65 million years ago to present; Frey et al. 2000).
In comparison, Drake Passage was formed about 17–
50 million years ago (Livermore et al. 2005), and the
opening of the Tasman Seaway is dated to 35.5–30million
years ago (Barker et al. 2007). The Kerguelen Islands
and the Heard/McDonald Islands are located on the
a Current affiliation: Jet Propulsion Laboratory, California In-
stitute of Technology, Pasadena, California.
Corresponding author address: Jinbo Wang, 4800 Oak Grove
Dr., Pasadena, CA 91109.
E-mail: [email protected]
NOVEMBER 2016 WANG ET AL . 3385
DOI: 10.1175/JPO-D-15-0216.1
� 2016 American Meteorological Society

northern Kerguelen Plateau, which is surrounded by the
Del Cano Rise, the Crozet Plateau, and the Conrad Rise
to its west and by the Kerguelen–Amsterdam Passage to
its north. To the west of the Fawn Trough lies the Elan
Bank with a sill depth shallower than 2000m. The
Princess Elizabeth Trough lies between the southern
Kerguelen Plateau and the Antarctic coast. Prydz Bay,
located at 758E to the southwest of the Princess Eliz-
abeth Trough, is a formation region of Antarctic Bottom
Water (AABW; Meijers et al. 2010; Wong et al. 1998;
Ohshima et al. 2013). The complex bathymetric configu-
ration around the KP results in complicated bathymetry–
flow interactions.
To understand bathymetry–flow interaction, it has
been a common practice to conduct a sensitivity test by
modifying ocean bathymetry in a model (e.g., Gill and
Bryan 1971; Lee et al. 2002). Here, we follow the ap-
proach of Gill and Bryan (1971) on the effect of the
Drake Passage and ask what would happen to the world’s
ocean if the Kerguelen Plateau were removed? The me-
ridional meandering of the ACC would certainly be re-
duced due to the absence of blocking by the plateau, but
would the rest of the ocean circulation also be affected?
In this paper, the effect of KP on the global ocean
circulation is studied using a set of numerical global ocean
simulations with andwithout the plateau. Based solely on
the coarse-resolution simulation in this study, we show
that KP has two important impacts on the global ocean
circulation. First, the upstream pressure field supported
by the plateau results in a reduction in the Agulhas
leakage. Second, the pressure field diverts the SAF
northward, generating a stagnant region upstream of the
plateau and reducing the cross-frontal exchange between
the subtropics and theWeddell Sea. The rest of the paper
is organized as follows: The Kerguelen Plateau and the
surrounding general ocean circulation are described in
section 2. Section 3 discusses the numerical model setup.
Results are presented in section 4. Discussion and con-
clusions are presented in section 5.
2. The effect of Kerguelen Plateau
a. Steering effect on the ACC
The KP lies at the same latitude as Drake Passage and
strongly steers the eastward-flowing ACC (Gille 1994;
Davis 2005; LaCasce and Isachsen 2010). The main
transport of the ACC is carried by three fronts, the SAF,
the Polar Front (PF), and the Southern ACC Front
(SACCF), and these are packed within a 78 latitude spanat 308E. The SAF bends northward and flows through
the Kerguelen–Amsterdam Passage. The SACCF is
deflected southward through the Princess Elizabeth
Trough (Fig. 1). The position of the PF is highly variable.
Because of the blocking by the Kerguelen Plateau, the
wedgelike envelope of the ACC between the SAF and
the SACCF is widest at 758E. Themeridional shift of the
mean ACC fronts form standing meanders strongly af-
fecting the ACC momentum and tracer budgets.
Recent studies using high-quality synoptic hydrogra-
phy and satellite data show inconsistent frontal positions
(Fig. 1). For example, Dong et al. (2006) showed evi-
dence that the surface expression of the PF goes through
the Kerguelen–Amsterdam passage, while Sparrow
et al. (1996) noted that the PF is composed of a single
frontal jet at 308E but splits into two branches as the
surface and subsurface temperature, and salinity prop-
erties are no longer consistent. Sparrow et al. (1996)
suggested that the surface PF goes through the Fawn
Trough, while Park et al. (2009) identified the current in
Fawn Trough as the SACCF. The discrepancies in the
FIG. 1. The ocean bathymetry near the Kerguelen Plateau and the position of three ACC fronts.
The ACC fronts identified by Orsi et al. (1995) are shown in red lines, that is, the SAF, PF, and
SACCF. The abbreviations of topographic features are the Northern Kerguelen Plateau (NKP),
Southern Kerguelen Plateau (SKP), Del Cano Rise (DCR), Conrad Rise (CR), Elan Bank (EB),
Fawn Trough (FT), Australian–Antarctic Basin (AAB), and Princess Elizabeth Trough (PET).
3386 JOURNAL OF PHYS ICAL OCEANOGRAPHY VOLUME 46

literature are partially due to inconsistencies in the defi-
nition of the front, as dynamical fields such as sea surface
height (SSH) and tracer fields show different frontal po-
sitions, but they are also due to the highly fluctuating na-
ture of the fronts in this bathymetrically complex region.
Previous studies indicate that the existence of the
Kerguelen Plateau leads to a complex regional ACC
structure (e.g., Sparrow et al. 1996; Park et al. 2009; Rosso
et al. 2015), but its impacts on the basin- and global-scale
ocean circulation remain unclear.
b. Influence on ACC dynamics
The wind-driven acceleration of the ACC can only be
balanced by bottom form stress because bottom friction
and lateral Reynolds stress are too weak to balance the
surface wind stress without generating unrealistically
strong flow (Toggweiler and Samuels 1995;Marshall and
Radko 2003; Munk and Palmen 1951; Gille 1997). The
form stress by four major ridges, the Scotia Arc, the
Kerguelen Plateau, the Macquarie Ridge, the South
Pacific Ridge, and South America is suggested to bal-
ance the zonal wind stress in theDrake Passage latitudes
(Masich et al. 2015). Eddy interfacial form stress trans-
fers surface momentum downward to depths where
bottom form stress can have an impact. This balance is
related to the horizontal eddy buoyancy flux through the
thermal wind relation. The eddy effect slumps the tilted
isopycnals, counteracts the continual acceleration of the
zonal flow by the wind, and sets the vertical structure of
the ACC (Johnson and Bryden 1989).
The local enhancement of eddy kinetic energy by to-
pography has been emphasized to be crucial in setting
ACC properties. Bathymetric steering can raise or
slump ACC fronts to alter the flow instability properties
and subsequently eddy generation and destruction.
Enhanced eddy kinetic energy in the lee of topographic
obstacles has long been observed (Gille 1997; Lu and
Speer 2010; Sallée et al. 2011; Thompson and Sallée2012) and theorized (MacCready and Rhines 2001). The
enhanced eddy activities result in hot spots of mass,
momentum, potential vorticity, heat, and tracer trans-
port. Williams et al. (2007) drew an analogy between the
storm tracks in the atmosphere and the ACC, noting
that topographic effects lead to along-stream variations
in eddy potential vorticity fluxes, which can decelerate
or accelerate the mean flow. Based on a similar view,
Thompson and Naveira Garabato (2014) put forward a
theory for the equilibration of the ACC in which the
structure of the standing meanders, rather than intensity
of transient baroclinic instabilities, governs the ACC
response to wind forcing and changes.
These topographically enhanced standing meanders
result from arrested Rossby waves and enable rapid
downward moment transfer and bottom stress. The
study by Thompson andNaveiraGarabato (2014) points
to the necessity of understanding the ACC from a lo-
calized view, recognizing zonal variations, rather than
from a zonally averaged framework. The Kerguelen
Plateau has a clear impact on localized standing and
transient eddies, which in turn influence the entire ocean
ACC properties.
Even though a growing body of evidence has dem-
onstrated the importance of topographic control on
ACC dynamics and Southern Ocean circulation,
many questions still remain regarding the specific role
of the Kerguelen Plateau. Here, we use a simplified
numerical model to explicitly test the response of
the Southern Ocean and the World Ocean to the
Kerguelen Plateau.
3. Methodology
The complex nature of ocean dynamics makes direct
evaluation of the large-scale effect of a specific regional
seamount difficult. Here, we evaluate the effect of the
KP on the large-scale ocean circulation by comparing
simulations with and without the KP. The two simula-
tions are carried out using two nearly identical config-
urations of the MITgcm (Marshall et al. 1997) that
differ only in the bathymetry used for the KP region.
The ETOPO5 5-min world bathymetry from 808S to
808N without the Arctic Ocean is binned to 18 3 18resolution for the control run (CTRL). The perturbed
case (noKP) has the same bathymetry as CTRL but
with a flattened KP. To flatten KP, we set the ocean
floor to 4700m for all model grids within the domain
(538–358S, 608–878E), then apply 58 3 58 two-
dimensional Gaussian smoothing only near the KP to
remove the induced, steep topographic slope.
Figure 2 shows the bathymetry of CTRL and noKP.
We do not claim that the noKP bathymetry corresponds
to a specific geological period. The altered seafloor is
intended to help us gain physical understanding of the
influence of KP on the ocean circulation.
The two simulations have the same surface forcing.
The wind stress is based on Trenberth et al. (1989) cli-
matology. The model is initialized with Levitus clima-
tology (Levitus and Boyer 1994). The SST and sea
surface salinity (SSS) are relaxed to the seasonal Levitus
climatology to provide the surface forcing. The re-
laxation time scale is 2 months for temperature and
6 months for salinity.
We spin up the ocean by progressively increasing
resolution for both CTRL and noKP cases. The model is
first run for 1000 yr with 48 3 48 resolution in the hori-
zontal and 15 levels in the vertical. The run continues
NOVEMBER 2016 WANG ET AL . 3387

with a 28 3 28 resolution for another 200 yr, followed
by a 18 3 18 resolution with 25 vertical levels for an-
other 1020 yr. The last 20 yr are used in the following
analyses. In addition, we investigate the adjustment
problem by adding back the Kerguelen Plateau to the
noKP case starting from the end of the 1020 yr 18 3 18simulation and running for another 20 yr. The hori-
zontal viscosities are 53 105, 23 105, and 53 103m2 s21
for the 48 3 48, 28 3 28, and 18 3 18 simulations, re-
spectively. The model employs the K-profile parame-
terization (KPP) for vertical mixing (Large et al. 1994)
and fixed Gent–McWilliams (GM)/Redi eddy param-
eterization (Redi 1982; Gent and McWilliams 1990)
for isopycnal eddy mixing. In the 18 3 18 run, the
constant GM background diffusivity is 1 3 103m2 s21.
A Laplacian diffusivity of 2 3 103m2 s21 is also used.
The vertical Laplacian diffusivity (1 3 1024m2 s21)
and viscosity (1 3 1023m2 s21) are fixed for the three
different-resolution simulations. The model is in an
equilibrated state in terms of kinetic energy but still
drifts in temperature and salinity fields. However, these
drifts (1025 8Cyr21 for temperature and 1027 psu yr21
for salinity) are very slow compared to the changes due
to the KP, which are O(1021) 8C for temperature and
O(1022) psu for salinity.
In the CTRL run, the zonal transport across theDrake
Passage is 93.1 Sv (1 Sv [ 106m3 s21), which is smaller
than the observed 137Sv (Cunningham et al. 2003). The
Agulhas Current across 328S is 264Sv, comparable to
the observed value of 270Sv in Bryden et al. (2005).
The Agulhas leakage is 232.3 Sv; much larger than the
observed 215Sv (Richardson 2007), but comparable
to 232Sv in a 1/28-resolution model (van Sebille et al.
2009) and 243 Sv in a typical 18 CCSM4 simulation
(Weijer et al. 2012). We do not aim to have the coarse-
resolution simulation produce realistic values for the
transport but instead focus on the changes brought by
the change in KP topography.
4. Results
Differences exist both locally in the Southern Ocean
and in the global ocean between the CTRLand noKP. In
this section, we first discuss the KP effect on the
Southern Ocean circulation and then we examine the
effect on global thermohaline circulation.
a. Effect on the Southern Ocean circulation
Without the steering by the KP, the ACC becomes
more zonal in the Indian sector. The shift of the ACC
FIG. 2. The south Indian Ocean bathymetry used in (top) CTRL and (bottom) noKP.
3388 JOURNAL OF PHYS ICAL OCEANOGRAPHY VOLUME 46

and the consequent influence on the circulation are
clearly shown in zonal transport and streamfunction
(Fig. 3). Here, the barotropic streamfunction is defined
as C5�yU, where U5DyÐ h2H
u dz (Dy is the meridi-
onal length of the model grid) is the vertically in-
tegrated zonal transport per grid box, h is the surface
height, 2H is the depth of the ocean bottom, and u is
the zonal velocity. The boundary condition C 5 0 is
given along the Antarctic boundary. Upon reaching the
KP, the ACC fronts diverge (Fig. 3d). A significant
portion of the transport is carried by the SAF around
the northern tip of the northern Kerguelen Plateau,
where the SAF intensifies and narrows. Without the
KP, the streamfunction becomes more zonal (Fig. 3e),
meaning that streamfunction contours that diverge in
CTRL now remain parallel toward the KP longitude. This
leaves a north–south dipole in the streamfunction differ-
ence field (Fig. 3f). The dipole is anticyclonic to the north
and cyclonic to the south. This alsomeans that theWeddell
Gyre expands northward and the Indian Subtropical Gyre
expands southward. The expansion of the two gyres sig-
nificantly impacts the global thermohaline circulation as
described in the next section.
The adjustment of the pressure field also leads to
downstream differences in the zonal transport
(Figs. 3a,b,c). Although broader and more laminar in
this coarsely resolved model than observed in the real
ocean, the ACC still shows segmented zonal jets in-
duced by irregular bottom topography. The velocity
fields in the two cases appear to agree well at the large
scale (Figs. 3a,b) but differ significantly in the prox-
imity of the KP (Fig. 3c). Without the KP, the zonal
transport upstream of the KP shows a clear, positive
change at the KP latitude sandwiched between two
strips of negative change (Fig. 3c), meaning that the
ACC is stronger at the KP latitude, the Agulhas Return
Current (ARC) is weaker, and the westward boundary
current along the Antarctic continent is stronger. Ve-
locity changes are noticeable in Southern Ocean regions
outside the Indian sector as well. One significant region is
Drake Passage, where, in the noKP case, the zonal velocity
is stronger and the ACC transport through the DP is
96.5Sv, greater by about 3.5% (Fig. 4b). This change ex-
ceeds the interannual variability of the through DP trans-
port and is statistically significant.
The changes in the Southern Ocean circulation are
to a large extent vertically coherent. Figure 4 shows the
latitude–depth section along 508E of the zonal velocity
difference between two cases (noKP2 CTRL). A zonal
average of 408–508E gives the same structure. The dif-
ferences in the zonal velocity are surface intensified but
extend deep, especially in the high-latitude regions
where stratification is weak.
b. Influence on form stress
Both in this study and in previous studies based on
scaling (Johnson and Bryden 1989) and numerical
simulations (Killworth and Nanneh 1994; Gille 1997;
Ivchenko et al. 1996; Stevens and Ivchenko 1997), the
domain-integrated momentum balance in the South-
ern Ocean is between the momentum input by the
surface wind and the momentum sink by the bottom
form stress imposed by the pressure difference across
submarine ridges.
Since the advection of momentum and the Coriolis
terms do not contribute to the total balance, and the
FIG. 3. (left) The vertically integrated zonal transport per grid box defined as U5DyÐ h2H
udz in (a) CTRL,
(b) noKP, and (c) their difference noKP2 CTRL, where Dy is the meridional length of the model grid. (right) The
barotropic streamfunction defined asC5�yU, withC5 0 along the Antarctic continent in (d) CTRL, (e) noKP,
and (f) their difference noKP 2 CTRL. All panels have units of Sv.
NOVEMBER 2016 WANG ET AL . 3389

other terms are small, we focus our analysis on the dif-
ferences in bottom form stress between the CTRL and
noKP cases.
The vertically and zonally integrated zonal momen-
tum balance is approximately
0’
þ ðh2H
21
r0
›p
›xdz dx1
þt x
r0
, (1)
where the overbar represents the time mean, H is the
ocean depth, h is the sea surface height, r0 is the refer-
ence density, p is themean hydrostatic pressure, t x is the
zonal wind stress, andÞ
is the zonal integration.
The integrated zonal momentum input by surface
wind between 808 and 308S is 8.0 3 1012N in both the
CTRL and noKP cases. The bottom form stress in-
tegrated over the same domain is 7.83 1012N in CTRL
and 7.93 1012N in noKP, accounting formore than 97%
of the total momentum input. The form stress increase in
noKP is due to the decrease in bottom friction because
of the flattening of the KP.
There are several ways of calculating the bottom form
stress. After neglecting the contribution of atmospheric
loading, which is usually negligible, the left-hand side of
(2) consists of two components:
þ ðh2H
21
r0
›p
›xdz dx52
þx
›
›x
ð02H
pdz dx1
þx
pb
›H
›xdx ,
(2)
where pb is the bottom pressure. The first term on the
right-hand side represents the net stress due to the
pressure gradient across landmasses. The second term
represents the bottom form stress. Here, we adopt the
algorithm of Masich et al. (2015) treating both the
landmasses and submerged seamounts as ‘‘ridges’’ and
directly calculating the left-hand side without dis-
tinguishing the two components. The pressure gradient
at a discretized model grid point (x, y, z) is calculated as
›p
›x(x, y, z)5
Dpb
Dx5
pb(y, z j x
E)2 p
b(y, z j x
W)
xE2 x
W
, (3)
where xE and xW are the eastern and western sides of an
ocean ridge that encloses the model grid point (x, y, z);
pb(y, z j xE) and pb(y, z j xW) are the bottom pressure at
FIG. 4. (a) The depth–latitude section of the zonal velocity difference (noKP 2 CTRL) along
508E. (b) The vertical profile of the mean zonal velocity at the entrance of the DP at 678W.
3390 JOURNAL OF PHYS ICAL OCEANOGRAPHY VOLUME 46
the two ridge walls. The east–west pressure difference
across a ridge is distributed uniformly inside the ridge.
We choose this uniform pressure distribution within
land for visualization purposes (see Fig. 2 of Masich
et al. 2015). The values can be regarded as momentum
transfer of ocean currents into the solid earth. This
quantity is visually patchy for each level, but its full-
depth vertical integration yields a smoother field. The
vertical integration of (3) is referred to as total bottom
form stress and shown in Fig. 5. As shown by Masich
et al. (2015), this method reduces the numerical noise
brought by calculating the gradient of H. The budget in
(1) can be accurately closed.
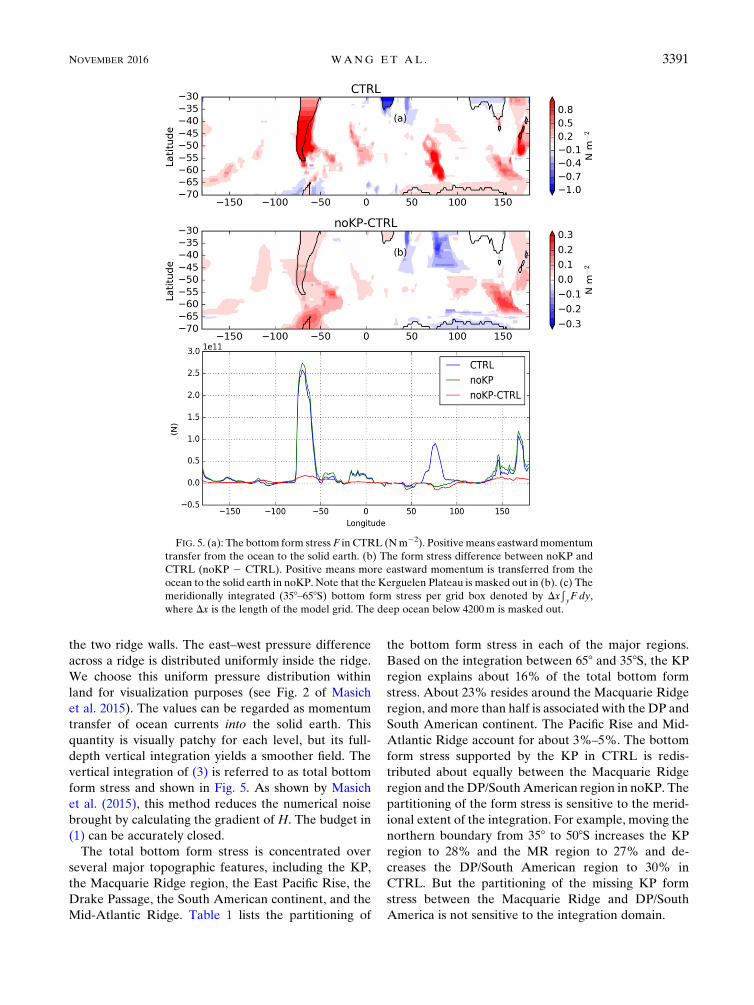
The total bottom form stress is concentrated over
several major topographic features, including the KP,
the Macquarie Ridge region, the East Pacific Rise, the
Drake Passage, the South American continent, and the
Mid-Atlantic Ridge. Table 1 lists the partitioning of
the bottom form stress in each of the major regions.
Based on the integration between 658 and 358S, the KP
region explains about 16% of the total bottom form
stress. About 23% resides around the Macquarie Ridge
region, and more than half is associated with the DP and
South American continent. The Pacific Rise and Mid-
Atlantic Ridge account for about 3%–5%. The bottom
form stress supported by the KP in CTRL is redis-
tributed about equally between the Macquarie Ridge
region and theDP/South American region in noKP. The
partitioning of the form stress is sensitive to the merid-
ional extent of the integration. For example, moving the
northern boundary from 358 to 508S increases the KP
region to 28% and the MR region to 27% and de-
creases the DP/South American region to 30% in
CTRL. But the partitioning of the missing KP form
stress between the Macquarie Ridge and DP/South
America is not sensitive to the integration domain.
FIG. 5. (a): The bottom form stress F in CTRL (Nm22). Positive means eastwardmomentum
transfer from the ocean to the solid earth. (b) The form stress difference between noKP and
CTRL (noKP 2 CTRL). Positive means more eastward momentum is transferred from the
ocean to the solid earth in noKP. Note that the Kerguelen Plateau is masked out in (b). (c) The
meridionally integrated (358–658S) bottom form stress per grid box denoted by DxÐyF dy,
where Dx is the length of the model grid. The deep ocean below 4200m is masked out.
NOVEMBER 2016 WANG ET AL . 3391

The ACC transport through DP is not directly linked
to how the form stress is distributed. We conduct an
additional experiment to study the transient behavior of
the bottom form stress by adding the KP back to the
noKP case. After adding back the KP bathymetry, the
bottom form stress is quickly redistributed in less than
50 days followed by a clear seasonal cycle, while the
ACC transport through DP changes slowly at a rate of
about 0.5 Sv decade21 (figure not shown). The quick
response is associated with fast barotropic response
(Straub 1993) and is demonstrated clearly in the ideal-
ized channelmodel byWard andHogg (2011). TheACC
transport is linked to the baroclinic structure and is
influenced by meridional buoyancy transport, including
eddy fluxes (Allison et al. 2011), which are parameter-
ized by GM in our model.
In summary, the KP accounts for more than 16% of
the removal of the zonal momentum injected by wind,
but the same momentum balance can be achieved
without the existence of the KP. Without KP, the KP
bottom form stress is about equally redistributed to the
Macquarie Ridge and the DP/South American conti-
nent. The total bottom form stress is barely affected.
The bottom form stress adjusts to the topographic
change through a fast barotropic adjustment in less than
50 days, but theACC transport responds to the Southern
Ocean thermohaline adjustment, which takes several
decades in this diffusive simulation.
c. Effect on global thermohaline circulation
Because of the differences in the circulation, there
exist differences in the global ocean thermohaline
structure between the CTRL and noKP.
In the Southern Ocean, without the KP, the upper
ocean (0–1000m) to the west of KP becomes warmer
and saltier (Figs. 6a,c). The warm, saline sea surface
anomaly extends upstream to the Atlantic Ocean,
reaching as far as the Brazil–Malvinas Confluence. The
upper southeast Indian Ocean east of KP becomes
colder and fresher. The fresh anomaly influences the
north Indian Ocean and also propagates into the South
Atlantic through the Agulhas leakage. The surface res-
toration is faster for the temperature (2months) than for
the salinity (6 months). As a result, the cold anomaly
initiated near the KP is more confined to the source
region than the fresh anomaly. The upper Pacific Ocean
becomes warmer and saltier except in the Amundsen
Sea, where cold and fresh anomalies are present.
The differences in the regional circulation in the upper
ocean (Fig. 3) explain the thermohaline differences;
a weaker and southward-shifted subtropical front and
Agulhas return current decrease the heat and salt trans-
port to the northeast of the KP (Fig. 6) and increases heat
and salt transport to the southwest. The reduction of the
TABLE 1. The percentage of form stress explained by the KP
region (508, 1208E), Macquiere Ridge (MR) region (1208E, 208W),
South Pacific (208, 908W), DP region (908, 308W), and South
Atlantic/Indian (508E, 308W). The regional partitioning is based on
the integration between 658 and 358S. Changing the northern
boundary to 508S increases the percentage of the KP and MR to
28% and 27%, respectively, and reduces the percentage of the DP
to 30% in CTRL.
Case/region KP MR Pacific DP Atlantic/Indian
CTRL 16 23 3 53 5
noKP 1 30 3 60 6
FIG. 6. The (a),(b) temperature (8C) and (c),(d) salinity (psu) differences between CTRL and noKP (noKP2CTRL)
for the (top) upper (0–1000m) and (bottom) deep ocean average below 1000m.
3392 JOURNAL OF PHYS ICAL OCEANOGRAPHY VOLUME 46

southward deflection of the flow passing the northern
edge of the KP at 808E and the excess northward trans-
port east of KP (Fig. 4d) further introduce cold and fresh
anomalies downstream of the KP (Figs. 6a,c).
For the global ocean, in the noKP case, the North
Atlantic, far from the KP, becomes warmer and saltier
throughout the water column. These changes may have
an impact on abyssal ocean circulation and global cli-
mate due to the crucial role of the North Atlantic in the
climate system.
A depth–latitude section of the anomaly field shows
that the warm anomaly appears both in the upper cell of
the meridional overturning circulation near 1000m and
in the lower cell, that is, in the deep Weddell Gyre near
4000m and near 2500m in the North Atlantic (Fig. 7).
These temperature and salinity changes may be in-
duced by the changes in the Atlantic meridional over-
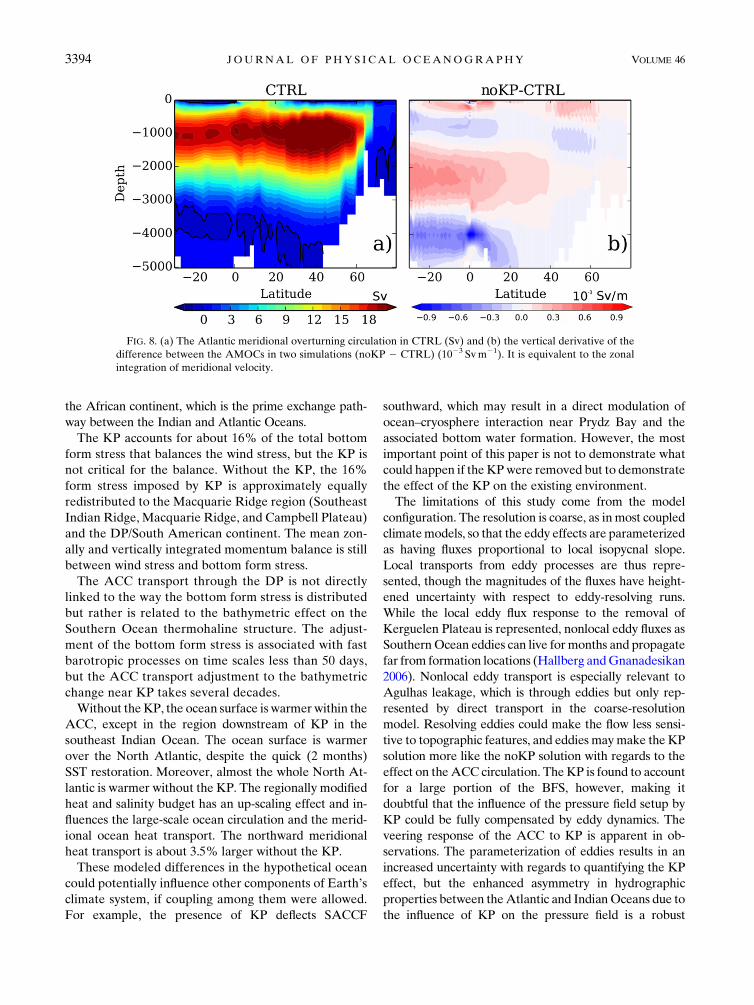
turning circulation (AMOC; Fig. 8). The CTRL run
reproduces an AMOC with a reasonable depth and
strength (Fig. 8a). We take the vertical derivative of the
AMOC streamfunction to get the meridional volume
transport per meter (Sverdrups per meter), which is
equivalent to the zonal integration of meridional ve-
locity. Figure 8b shows the difference between CTRL
and noKP. Without KP, the northward transport in the
upper cell becomes shallower, that is, the flow in the
upper 500m becomes faster and the flow between 500
and 1000m becomes slower. The southward flow around
2000m carrying the North Atlantic Deep Water
(NADW) has a positive anomaly, meaning that the
transport becomes weaker. Similarly, the deep north-
ward flow carrying AABW has negative anomaly,
meaning the deep export of AABW also becomes
weaker. In our proposed mechanism, all these changes
in the AMOC begin with the changes in the Indian–
Atlantic exchanges through the passage of the Agulhas
leakage due to the remote influence by the KP.
After considering all the results of the coarse-
resolution model, we propose the following hypothe-
sis of the KP effect. Without the KP, the ACC in the
Indian sector becomesmore zonal and shifts southward
(Figs. 3d,e). This southward shift of ACC fronts leads
to the southward shift of the subtropical front and
Agulhas Return Current, which results in more trans-
port of Indian water to the Atlantic through Agulhas
leakage (Figs. 3c, 4a). The increased Agulhas leakage
induces a warm anomaly over the whole upper Atlantic
Ocean (Fig. 6a). The induced warm anomaly over the
North Atlantic can further reduce the production of
the NADW and causes a slowdown of the southward
transport of NADW around 2000m deep (Fig. 8b). The
northward veering of the northern ACC fronts can
shield Weddell from the influence of the Indian Ocean.
Without the KP, the deep Weddell becomes warmer
and salter due to the influence of the Indian water
(Figs. 6b,d, 7), resulting in less AABWoutflow (Fig. 8b).
Because of the flattening of the KP, the Atlantic me-
ridional heat transport increases by 3.5% (figure not
shown). A caveat is that the hypothesis is based on the
coarse-resolution simulation. The ‘‘gate keeper’’ ef-
fect of the subtropical front and South Atlantic
Current at the Agulhas leakage may not be valid in
high-resolution simulations or reality (Loveday et al.
2014; Durgadoo et al. 2013). Our ocean-only simula-
tion does not fully evaluate the significance of this
effect to the climate system, but this could be tested
in a coupled model.
5. Discussion and conclusions
The KP is located in a sensitive region where the topo-
graphically induced regional circulation forces an up-
stream change in the Subtropical Front, Agulhas Return
Current, and further, the Agulhas leakage to the south of
FIG. 7. The depth–latitude sections of (a) temperature (8C) and (b) salinity (psu) differences between CTRL and
noKP (noKP 2 CTRL) along 258W in the Atlantic.
NOVEMBER 2016 WANG ET AL . 3393
the African continent, which is the prime exchange path-
way between the Indian and Atlantic Oceans.
The KP accounts for about 16% of the total bottom
form stress that balances the wind stress, but the KP is
not critical for the balance. Without the KP, the 16%
form stress imposed by KP is approximately equally
redistributed to the Macquarie Ridge region (Southeast
Indian Ridge, Macquarie Ridge, and Campbell Plateau)
and the DP/South American continent. The mean zon-
ally and vertically integrated momentum balance is still
between wind stress and bottom form stress.
The ACC transport through the DP is not directly
linked to the way the bottom form stress is distributed
but rather is related to the bathymetric effect on the
Southern Ocean thermohaline structure. The adjust-
ment of the bottom form stress is associated with fast
barotropic processes on time scales less than 50 days,
but the ACC transport adjustment to the bathymetric
change near KP takes several decades.
Without theKP, the ocean surface is warmerwithin the
ACC, except in the region downstream of KP in the
southeast Indian Ocean. The ocean surface is warmer
over the North Atlantic, despite the quick (2 months)
SST restoration. Moreover, almost the whole North At-
lantic is warmer without the KP. The regionally modified
heat and salinity budget has an up-scaling effect and in-
fluences the large-scale ocean circulation and the merid-
ional ocean heat transport. The northward meridional
heat transport is about 3.5% larger without the KP.
These modeled differences in the hypothetical ocean
could potentially influence other components of Earth’s
climate system, if coupling among them were allowed.
For example, the presence of KP deflects SACCF
southward, which may result in a direct modulation of
ocean–cryosphere interaction near Prydz Bay and the
associated bottom water formation. However, the most
important point of this paper is not to demonstrate what
could happen if the KPwere removed but to demonstrate
the effect of the KP on the existing environment.
The limitations of this study come from the model
configuration. The resolution is coarse, as inmost coupled
climatemodels, so that the eddy effects are parameterized
as having fluxes proportional to local isopycnal slope.
Local transports from eddy processes are thus repre-
sented, though the magnitudes of the fluxes have height-
ened uncertainty with respect to eddy-resolving runs.
While the local eddy flux response to the removal of
Kerguelen Plateau is represented, nonlocal eddy fluxes as
SouthernOcean eddies can live formonths and propagate
far from formation locations (Hallberg andGnanadesikan
2006). Nonlocal eddy transport is especially relevant to
Agulhas leakage, which is through eddies but only rep-
resented by direct transport in the coarse-resolution
model. Resolving eddies could make the flow less sensi-
tive to topographic features, and eddies maymake the KP
solution more like the noKP solution with regards to the
effect on theACC circulation. TheKP is found to account
for a large portion of the BFS, however, making it
doubtful that the influence of the pressure field setup by
KP could be fully compensated by eddy dynamics. The
veering response of the ACC to KP is apparent in ob-
servations. The parameterization of eddies results in an
increased uncertainty with regards to quantifying the KP
effect, but the enhanced asymmetry in hydrographic
properties between theAtlantic and IndianOceans due to
the influence of KP on the pressure field is a robust
FIG. 8. (a) The Atlantic meridional overturning circulation in CTRL (Sv) and (b) the vertical derivative of the
difference between the AMOCs in two simulations (noKP 2 CTRL) (1023 Svm21). It is equivalent to the zonal
integration of meridional velocity.
3394 JOURNAL OF PHYS ICAL OCEANOGRAPHY VOLUME 46

feature. There is no coupling with the atmosphere or
cryosphere. Although the results of this study are physi-
cally sound, further research with a more realistic climate
model configuration would be worth pursuing.
Acknowledgments. Wang, Mazloff, and Gille are sup-
ported byNSFOCE-1234473 and PLR-1425989.We thank
JessicaMasich, LynneTalley,AndyHogg, PaolaCessi,Wei
Liu, and two anonymous reviewers for their comments.
REFERENCES
Allison, L. C., H. L. Johnson, and D. P. Marshall, 2011: Spin-up
and adjustment of the Antarctic Circumpolar Current and
global pycnocline. J. Mar. Res., 69, 167–189, doi:10.1357/
002224011798765330.
Barker, P., B. Diekmann, and C. Escutia, 2007: Onset of Cenozoic
Antarctic glaciation.Deep-Sea Res., 54, 2293–2307, doi:10.1016/
j.dsr2.2007.07.027.
Bryden, H. L., L. M. Beal, and L. M. Duncan, 2005: Structure and
transport of the Agulhas Current and TTS temporal variabil-
ity. J. Oceanogr., 61, 479–492, doi:10.1007/s10872-005-0057-8.
Cunningham, S., S. Alderson, B. King, and M. Brandon, 2003:
Transport and variability of the Antarctic Circumpolar Current
in Drake Passage. J. Geophys. Res., 108, 8084, doi:10.1029/
2001JC001147.
Davis, R. E., 2005: Intermediate-depth circulation of the Indian
and South Pacific Oceans measured by autonomous floats.
J. Phys. Oceanogr., 35, 683–707, doi:10.1175/JPO2702.1.
Dong, S., J. Sprintall, and S. T. Gille, 2006: Location of the Ant-
arctic polar front from AMSR-E satellite sea surface tem-
perature measurements. J. Phys. Oceanogr., 36, 2075–2089,
doi:10.1175/JPO2973.1.
Durgadoo, J. V., B. R. Loveday, C. J. C. Reason, P. Penven, and
A. Biastoch, 2013: Agulhas leakage predominantly responds
to the SouthernHemisphere westerlies. J. Phys.Oceanogr., 43,
2113–2131, doi:10.1175/JPO-D-13-047.1.
Frey, F., and Coauthors, 2000: Origin and evolution of a submarine
large igneous province: The Kerguelen Plateau and Broken
Ridge, southern Indian Ocean. Earth Planet. Sci. Lett., 176,
73–89, doi:10.1016/S0012-821X(99)00315-5.
Fu, L.-L., 2009: Pattern and velocity of propagation of the global ocean
eddy variability. J. Geophys. Res., 114, C11017, doi:10.1029/
2009JC005349.
Gent, P. R., and J. C. McWilliams, 1990: Isopycnal mixing in ocean
circulation models. J. Phys. Oceanogr., 20, 150–155, doi:10.1175/
1520-0485(1990)020,0150:IMIOCM.2.0.CO;2.
Gill, A., and K. Bryan, 1971: Effects of geometry on the circulation
of a three-dimensional Southern-Hemisphere ocean model.
Deep-Sea Res. Oceanogr. Abstr., 18, 685–721, doi:10.1016/
0011-7471(71)90086-6.
Gille, S. T., 1994: Mean sea surface height of the Antarctic Cir-
cumpolar Current fromGeosat data: Method and application.
J. Geophys. Res., 99, 18 255–18 273, doi:10.1029/94JC01172.
——, 1997: The SouthernOcean momentum balance: Evidence for
topographic effects from numerical model output and altim-
eter data. J. Phys. Oceanogr., 27, 2219–2232, doi:10.1175/
1520-0485(1997)027,2219:TSOMBE.2.0.CO;2.
——, M. M. Carranza, R. Cambra, and R. Morrow, 2014: Wind-
induced upwelling in the Kerguelen Plateau region.Biogeosci.
Discuss., 11, 8373–8397, doi:10.5194/bgd-11-8373-2014.
Hallberg, R., and A. Gnanadesikan, 2006: The role of eddies in
determining the structure and response of the wind-driven
Southern Hemisphere overturning: Results from the Model-
ing Eddies in the Southern Ocean (MESO) project. J. Phys.
Oceanogr., 36, 2232–2252, doi:10.1175/JPO2980.1.
Ivchenko, V. O., K. J. Richards, and D. P. Stevens, 1996: The dy-
namics of the Antarctic Circumpolar Current. J. Phys. Oce-
anogr., 26, 753–774, doi:10.1175/1520-0485(1996)026,0753:
TDOTAC.2.0.CO;2.
Jayne, S. R., and J. Marotzke, 2002: The oceanic eddy heat
transport. J. Phys. Oceanogr., 32, 3328–3345, doi:10.1175/
1520-0485(2002)032,3328:TOEHT.2.0.CO;2.
Johnson,G. C., andH. L. Bryden, 1989:On the size of theAntarctic
Circumpolar Current.Deep-Sea Res.,A36, 39–53, doi:10.1016/
0198-0149(89)90017-4.
Killworth, P. D., and M. M. Nanneh, 1994: Isopycnal momentum
budget of the Antarctic Circumpolar Current in the Fine Res-
olution Antarctic Model. J. Phys. Oceanogr., 24, 1201–1223,
doi:10.1175/1520-0485(1994)024,1201:IMBOTA.2.0.CO;2.
LaCasce, J.H., and P. Isachsen, 2010: The linearmodels of theACC.
Prog. Oceanogr., 84, 139–157, doi:10.1016/j.pocean.2009.11.002.
Large, W. G., J. C. Mcwilliams, and S. C. Doney, 1994: Oceanic
vertical mixing: A review and a model with a nonlocal boundary
layer parameterization. Rev. Geophys., 32, 363–403, doi:10.1029/
94RG01872.
Lee, T., I. Fukumori, D. Menemenlis, Z. Xing, and L. Fu, 2002:
Effects of the Indonesian Throughflow on the Pacific and In-
dian Oceans. J. Phys. Oceanogr., 32, 1404–1429, doi:10.1175/
1520-0485(2002)032,1404:EOTITO.2.0.CO;2.
Levitus, S., and T. P. Boyer, 1994: Temperature. Vol. 4, World
Ocean Atlas 1994, NOAA Atlas NESDIS 4, 117 pp.
Livermore, R., A. Nankivell, G. Eagles, and P. Morris, 2005: Pa-
leogene opening of Drake Passage. Earth Planet. Sci. Lett.,
236, 459–470, doi:10.1016/j.epsl.2005.03.027.Loveday, B. R., J. V. Durgadoo, C. J. C. Reason, A. Biastoch, and
P. Penven, 2014: Decoupling of the Agulhas leakage from the
Agulhas Current. J. Phys. Oceanogr., 44, 1776–1797, doi:10.1175/
JPO-D-13-093.1.
Lu, J., and K. Speer, 2010: Topography, jets, and eddy mixing in
the Southern Ocean. J. Mar. Res., 68, 479–502, doi:10.1357/
002224010794657227.
MacCready, P., and P. B. Rhines, 2001: Meridional transport
across a zonal channel: Topographic localization. J. Phys. Oce-
anogr., 31, 1427–1439, doi:10.1175/1520-0485(2001)031,1427:
MTAAZC.2.0.CO;2.
Marshall, J., and T. Radko, 2003: Residual-mean solutions for the
Antarctic Circumpolar Current and its associated overturning
circulation. J. Phys. Oceanogr., 33, 2341–2354, doi:10.1175/
1520-0485(2003)033,2341:RSFTAC.2.0.CO;2.
——, C. Hill, L. Perelman, and A. Adcroft, 1997: Hydrostatic,
quasi-hydrostatic, and nonhydrostatic ocean modeling.
J. Geophys. Res., 102, 5733–5752, doi:10.1029/96JC02776.
Masich, J., T. K. Chereskin, and M. R. Mazloff, 2015: Topographic
form stress in the Southern Ocean state estimate. J. Geophys.
Res. Oceans, 120, 7919–7933, doi:10.1002/2015JC011143.
Meijers, A. J. S., A. Klocker, N. Bindoff, G. Williams, and
S. Marsland, 2010: The circulation and water masses of
the Antarctic shelf and continental slope between 30 and
808E. Deep-Sea Res. II, 57, 723–737, doi:10.1016/
j.dsr2.2009.04.019.
Munk, W., and E. Palmen, 1951: Note on the dynamics of the
Antarctic Circumpolar Current. Tellus, 3A, 53–55, doi:10.1111/
j.2153-3490.1951.tb00776.x.
NOVEMBER 2016 WANG ET AL . 3395

Ohshima, K. I., and Coauthors, 2013: Antarctic Bottom Water
production by intense sea-ice formation in the Cape Darnley
polynya. Nat. Geosci., 6, 235–240, doi:10.1038/ngeo1738.
Orsi, A. H., T. Whitworth III, and W. D. Nowlin Jr., 1995: On the me-
ridional extent and fronts of the Antarctic Circumpolar Current.
Deep-Sea Res. I, 42, 641–673, doi:10.1016/0967-0637(95)00021-W.
Park, Y.-H., F. Vivier, F. Roquet, and E. Kestenare, 2009: Direct
observations of theACC transport across theKerguelen Plateau.
Geophys. Res. Lett., 36, L18603, doi:10.1029/2009GL039617.
Redi, M. H., 1982: Oceanic isopycnal mixing by coordinate
rotation. J. Phys. Oceanogr., 12, 1154–1158, doi:10.1175/
1520-0485(1982)012,1154:OIMBCR.2.0.CO;2.
Richardson, P. L., 2007: Agulhas leakage into the Atlantic esti-
mated with subsurface floats and surface drifters. Deep-Sea
Res. I, 54, 1361–1389, doi:10.1016/j.dsr.2007.04.010.Rosso, I., A. M. Hogg, P. G. Strutton, A. E. Kiss, R. Matear,
A. Klocker, and E. van Sebille, 2014: Vertical transport in
the ocean due to sub-mesoscale structures: Impacts in the
Kerguelen region. Ocean Modell., 80, 10–23, doi:10.1016/j.ocemod.2014.05.001.
——, ——, A. E. Kiss, and B. Gayen, 2015: Topographic influence
on submesoscale dynamics in the Southern Ocean. Geophys.
Res. Lett., 42, 1139–1147, doi:10.1002/2014GL062720.
Sallée, J., K. Speer, and S.Rintoul, 2011:Mean-flow and topographic
control on surface eddy-mixing in the Southern Ocean. J. Mar.
Res., 69, 753–777, doi:10.1357/002224011799849408.Sparrow, M. D., K. J. Heywood, J. Brown, and D. P. Stevens, 1996:
Current structure of the south Indian Ocean. J. Geophys. Res.,
101, 6377–6391, doi:10.1029/95JC03750.
Stevens, D. P., and V. O. Ivchenko, 1997: The zonal momentum
balance in an eddy-resolving general-circulation model of the
Southern Ocean. Quart. J. Roy. Meteor. Soc., 123, 929–951,
doi:10.1002/qj.49712354008.
Straub, D. N., 1993: On the transport and angular momentum
balance of channel models of the Antarctic Circumpolar
Current. J. Phys. Oceanogr., 23, 776–782, doi:10.1175/
1520-0485(1993)023,0776:OTTAAM.2.0.CO;2.
Thompson, A. F., and J.-B. Sallée, 2012: Jets and topography: Jet
transitions and the impact on transport in the Antarctic
Circumpolar Current. J. Phys. Oceanogr., 42, 956–972,
doi:10.1175/JPO-D-11-0135.1.
——, and A. C. Naveira Garabato, 2014: Equilibration of the
Antarctic Circumpolar Current by standingmeanders. J. Phys.
Oceanogr., 44, 1811–1828, doi:10.1175/JPO-D-13-0163.1.
Toggweiler, J., and B. Samuels, 1995: Effect of Drake Passage on
the global thermohaline circulation.Deep-Sea Res. I, 42, 477–
500, doi:10.1016/0967-0637(95)00012-U.
Trenberth, K. E., J. G.Olson, andW.G. Large, 1989: A global ocean
wind stress climatology based on ECMWF analyses. Climate
and Global Dynamics Division, National Center for Atmo-
spheric Research Tech. Note NCAR/TN-3881STR, 98 pp.
van Sebille, E., P. J. van Leeuwen, A. Biastoch, C. Barron, and
W. P. M. de Ruijter, 2009: Lagrangian validation of numer-
ical drifter trajectories using drifting buoys: Application to
the Agulhas system.OceanModell., 29, 269–276, doi:10.1016/
j.ocemod.2009.05.005.
Ward, M., and A. Hogg, 2011: Establishment of momentum bal-
ance by form stress in a wind-driven channel. Ocean Modell.,
40, 133–146, doi:10.1016/j.ocemod.2011.08.004.
Waterman, S., A. C. Naveira Garabato, and K. L. Polzin, 2013:
Internal waves and turbulence in the Antarctic Circumpo-
lar Current. J. Phys. Oceanogr., 43, 259–282, doi:10.1175/
JPO-D-11-0194.1.
Weijer,W., andCoauthors, 2012: The SouthernOcean and its climate in
CCSM4. J. Climate, 25, 2652–2675, doi:10.1175/JCLI-D-11-00302.1.
Williams, R. G., C. Wilson, and C. W. Hughes, 2007: Ocean and
atmosphere storm tracks: The role of eddy vorticity forcing.
J. Phys. Oceanogr., 37, 2267–2289, doi:10.1175/JPO3120.1.
Wong, A. P. S., N. L. Bindoff, and A. Forbes, 1998: Ocean-ice shelf
interaction and possible bottomwater formation in Prydz Bay,
Antarctica. Ocean, Ice, and Atmosphere: Interactions at the
Antarctic Continental Margin, S. S. Jacobs and R. F. Weiss,
Eds., Antarctic Research Series, Vol. 75, Amer. Geophys.
Union, 173–187, doi:10.1029/AR075p0173.
3396 JOURNAL OF PHYS ICAL OCEANOGRAPHY VOLUME 46