7 november 2017 - ksu · 2017. 11. 8. · some slides adapted from qsr international guide to use...
TRANSCRIPT
7 November 2017
Some slides adapted from QSR International guide to use Nvivo and IS workbook of
introduction to use NVivo

Outline:
Introduction
NVivo interface orientation
Creating a new project
Organizing your sources
Importing sources
Coding text sources with Nodes
Visualizing nodes and sources
Word count, word tree and word
cloud query
Exporting simple reports
Analysis

What is Nvivo ?
It is a software tool produced by QSR international for storing,
organizing and querying non-numerical or un-structured data
(Qualitative research).

Qualitative Data Analysis Process
Coding Categories Themes Theory

NVivo interface orientation

Creating a new project
File menu
New
Give name to your project and save it in your computer

Organizing your sources
Select sources
(in navigation pane)
Right click on Internals
Select new folder
Name the folder (Interviews, Audio, Pictures,…..etc)

Organizing your sources
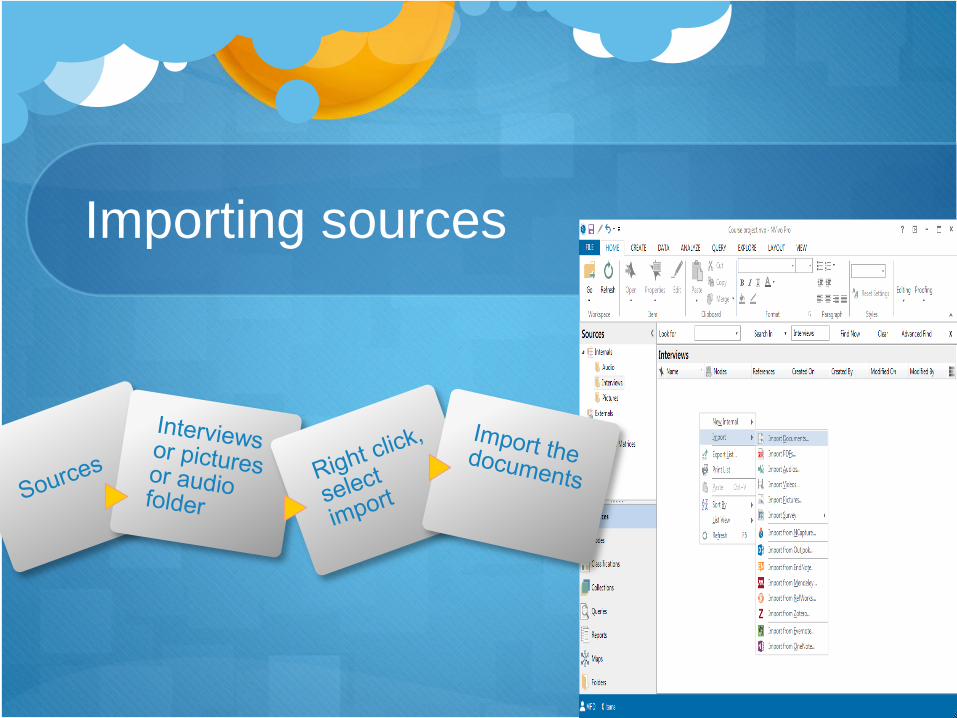
Importing sources
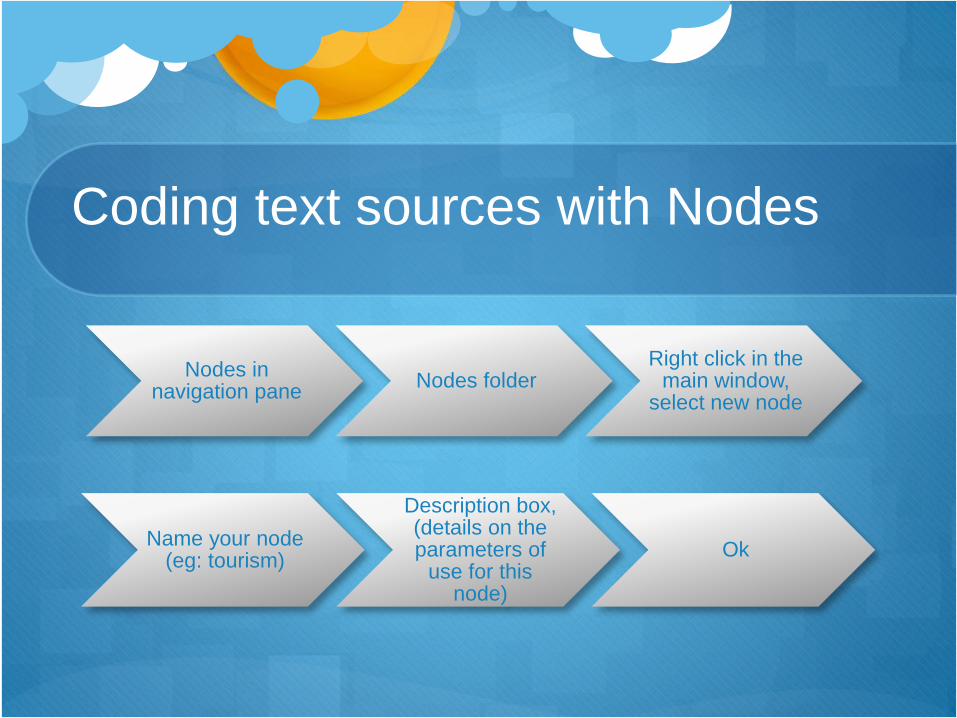
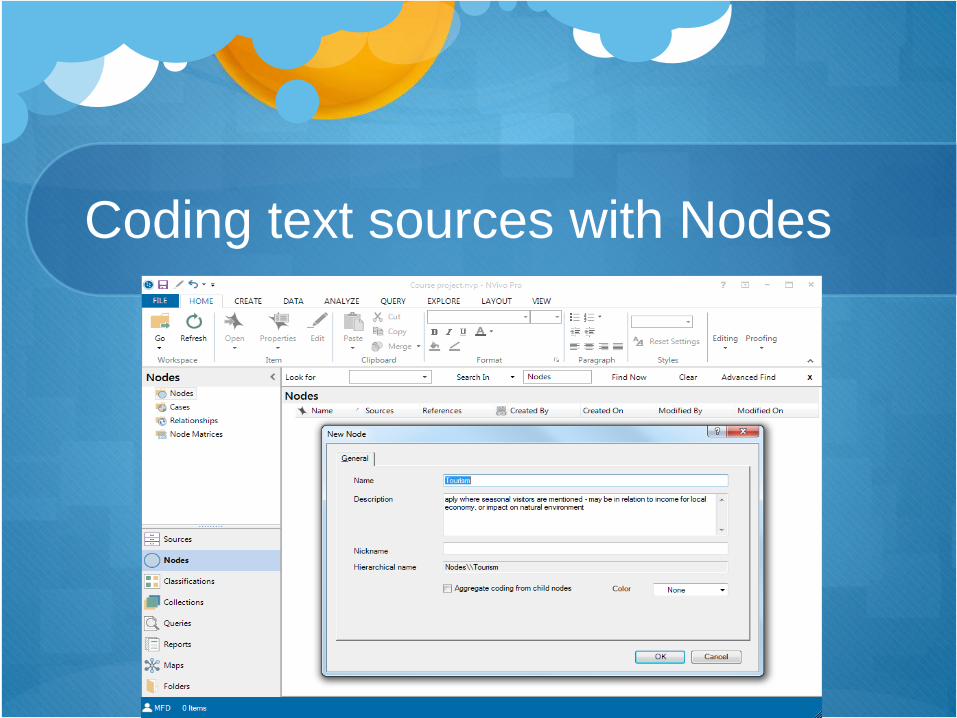
Coding text sources with Nodes
Nodes in navigation pane
Nodes folderRight click in the
main window, select new node
Name your node (eg: tourism)
Description box, (details on the parameters of
use for this node)
Ok
Coding text sources with Nodes

sources
Interviews folder
Open one interview document
Click on nodes button
(nodes list with source appear in detail pane)
Highlight relevant text and then drag and drop in
appropriate node

Auto-coding
It will code your data based on eg: interview
question.
Take care that not all information related to the node
will be presented by participant under one question.

Visualizing nodes and sources
View tab
Select Highlight and coding
stripes (in coding section)

Create a node report
Double click in selected node
Or right click on the node within the list…select
open

Remove code
Select the code
Right click
Un code
Right click on relevant coding strip
Un code
OR

Node hierarchies (sub nodes)
Select nodes button in
navigation pane
Click on the node to highlight it
Then click, drag and drop onto another node
Left click on the node to select the
sub-node
Right click and select copy
Move mouse over blank area at the bottom of nodes list and right click and select paste

Coding image, Video and Audio
sources
Usually used in documentary projects.

Visualizing nodes and sources
Visualization: is to generate a graph of nodes
associated with a particular source.
These created models may give you a new insights on
your data.

A. Visualizing nodes of one source
Sources, select interview that
coded
Explore tab, select Explore
Diagram
Save (right click over graph and select Export
diagram)

B. Visualizing codes between two
sources or nodes
Explore tab, select
Comparison Diagram
Select compare sources, then
select two sources.
Click Ok

Word frequency, word cloud and
word tree query
It help you to see unexpected associations in transcripts.
It help you to see contexts of use of particular words that
could give insight for analysis.
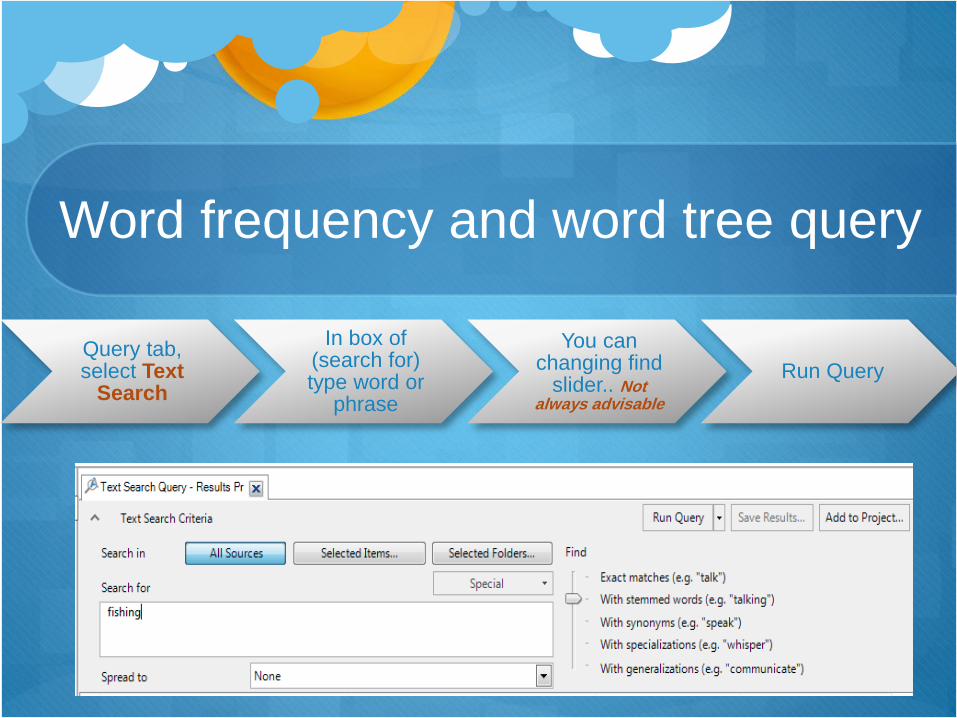
Word frequency and word tree query
Query tab, select Text
Search
In box of (search for) type word or
phrase
You can changing find
slider.. Not always advisable
Run Query

Word tree query

Word frequency and word cloud
Query tab, select word frequency
In box of (search for) type word or
phrase
You can changing find
slider.. Not always advisable
Run Query

Word cloud query

Exporting simple reports
1. Exporting coded extracts
Click on Nodes button
(in navigation pane)
Right click on one of the nodes
Select Export, then Export Node
Select Entire Content, then Ok
Documents on the computer and open the
new report.

Exporting simple reports
2. Exporting sources with their codes
Select sources
(in navigation pane)
Right click on one interview and open
Right click over detail view and select print
Select in the print options coding stripes
has print on same page

Connecting participant demographics
to their interview
Create Case
classification
Write participants on name area of
the box appear
Ok
Classification Case
classificationRight click on participants
Choose new attributes
Write eg: gender
Click on ValueWrite male and
femaleOk

Continue
Source Highlight all interviews
Right click and choose create
as
Create as a case
Classification Case
classificationDouble click on
participants
Assign gender for each
participant

Analysis based on attributes
Query Matrix coding
Choose columns and rows
ok, then add
Run


Further Resources QSR video tutorials: http://www.qsrinternational.com/support_tutorials.aspx
Follow QSR on twitter for information about free training seminars, updates and tips: @QSRInt
Mantra practical on research data management (data files are in NVivo 9): http://datalib.edina.ac.uk/mantra/softwarepracticals.html
Bazeley, P. Resources for qualitative data analysis and users of NVivo http://www.researchsupport.com.au/ (website with freely available resources)
Bazeley, P. and Jackson, K. (2013). Doing qualitative data analysis with NVivo. 2nd Ed. London: SAGE.
LinkedIn NVivo Users Group – good source of advice from experienced users. Free, but requires a LinkedIn account and application to join the grouhttps://www.linkedin.com/groups/NVivo-Users-Group-145388/about
Learn Nvivo: the basics [video tutorial course]. Lynda. Released 23 Nov 2016. (uses the basic NVivo 11 Starter version) https://www.lynda.com/NVivo-tutorials/Learn-NVivo-Basics/530082-2.html?org=ed.ac.uk