525_unorganised manufacturing sector in india-employment, assets and borrowings
TRANSCRIPT
Report No. 525(62/2.2/2)
Unorganised Manufacturing Sector In India - Employment, Assets and Borrowings
NSS 62nd Round (July 2005-June 2006)
National Sample Survey Organisation
Ministry of Statistics and Programme Implementation Government of India
January 2008

Report No. 525(62/2.2/2) PREFACE
National Sample Survey Organisation (NSSO) conducted an integrated survey of households and unorganised manufacturing enterprises in the 62nd round of NSS during July 2005 - June 2006. The subjects covered were household consumer expenditure, employment and unemployment and certain characteristics of unorganised manufacturing enterprises. The present report is the second one in a series of three reports being brought out based on the survey on unorganised manufacturing enterprises. The first report contained information on various operational characteristics of enterprises like location of enterprise, nature of operation, maintenance of accounts etc. in detail. The present report provides information on employment, assets & borrowings of unorganised manufacturing enterprises at all India level for different industry groups and at the level of States / UTs for all the industry groups taken together. Chapter One of the report is introductory. Chapter Two deals with concepts and definitions. Chapter Three of the report gives the summary of the findings. Detailed tables based on the survey are given in Appendix A. The sample design and estimation procedure are given in Appendix B. Facsimile of schedule canvassed during the survey is given in Appendix C.
Survey Design and Research Division of NSSO developed the sample design and survey instruments and also prepared the report. The Field Operations Division of NSSO carried out the fieldwork and the Data Processing Division of NSSO handled the data processing and tabulation work. The Coordination and Publication Division of NSSO coordinated various activities pertaining to the survey.
I am grateful to the Chairman and Members of the then Governing Council of NSSO and also the Chairman and Members of the Steering Committee and Working Group for the NSS 62nd round for their technical guidance at various stages of survey work. I convey my special thanks to Chairman and members of the National Statistical Commission and also to the Editor of the report for their valuable advice in finalizing the report. I am grateful to all Officers and Staff Members of this Ministry who were associated with the survey for their contribution. Special thanks are also due to the informants who provided the requisite information during data collection in the survey.
I hope this report will be useful to planners, policy makers and researchers. Comments and suggestions for improvement will be most welcome.
New Delhi January, 2008
(S.K.Sinha) Director General & Chief Executive Officer
National Sample Survey Organisation

NSS Report No. 525: Unorganised Manufacturing sector in India, 2005-06: Employment, Assets and Borrowings. i
Contents Page List of Tables i Highlights i i Chapter One Introduction 1 - 7 Chapter Two Concepts and Definitions 8 - 13 Chapter Three Summary of Findings 14 - 40 Appendix A Detailed Tables A 1 – A 226Appendix B Coverage, Sample Design and
Estimation Procedure B 1 – B 16
Appendix C Facsimile of Schedule 2.2 C 1- C 8
Appendix A Table no. Table description Page
1 Number of first stage units allotted and surveyed by State/UT
A 1
2 Number of workers engaged in enterprises by nature of employment and gender for each industry and for each States/UTs
A 2-A 25
3 Number of workers by type of worker and gender for each industry and for each States/UTs
A 26-A 49
4 Number of workers by enterprise type for each industry and for each States/UTs
A 50-A 64
5 Annual emoluments (in Rs.) per hired worker by enterprise type for each industry and for each States/UTs
A 65-A 70
6 Market value (in Rs) of fixed assets as on date of survey per enterprise (owned and hired) by type of asset for each industry and for each States/UTs
A 71-A 118
7 Net additions to fixed assets during the reference year (in Rs) and annual rent payable per enterprise by type of asset for each industry and for each States/UTs
A 119-A 154
8 Fixed assets and outstanding loans per enterprise (in Rs.) as on date of survey for each industry and for each States/UTs
A 155-A 178
9 Outstanding loans on the last date of the reference year (in Rs.) and annual interest payable per enterprise (in Rs.) by source agency of loan for each industry and for each States/UTs
A 179-A 226
®É.|É.ºÉ. ÉÊ®{ÉÉä]Ç ºÉÆ. 525: £ÉÉ®iÉ àÉå +ɺÉÆMÉÉÊ~iÉ ÉÊ´ÉÉÊxÉàÉÉÇhÉ FÉäjÉBÉE, 2005-06 : ®ÉäVÉMÉÉ®, {ÉÉÊ®ºÉà{ÉÉÊkɪÉÉÆ +ÉÉè® jÉ@hÉ
(i)
£ÉÉ®iÉ àÉå +ɺÉÆMÉÉÊ~iÉ ÉÊ´ÉÉÊxÉàÉÉÇhÉ FÉäjÉBÉE - ®ÉäVÉMÉÉ®, {ÉÉÊ®ºÉà{ÉÉÊkɪÉÉÆ +ÉÉè® jÉ@hÉ (VÉÖãÉÉ<Ç 2005 - VÉÚxÉ 2006)
àÉÖJªÉ {ÉÉÊ®hÉÉàÉ (ªÉc ºÉ´ÉæFÉhÉ 4798 OÉÉàÉÉå +ÉÉè® 5125 xÉMÉ®ÉÒªÉ JÉÆbÉå àÉå ÉÊBÉEªÉÉ MɪÉÉ * ºÉàɺiÉ £ÉÉ®iÉ àÉå BÉÖEãÉ ÉÊàÉãÉÉBÉE® 82897 =tÉàÉÉå BÉEÉ ºÉ´ÉæFÉhÉ ÉÊBÉEªÉÉ MɪÉÉ *)
o ªÉc +ÉÉBÉEÉÊãÉiÉ ÉÊBÉEªÉÉ MɪÉÉ cè ÉÊBÉE 2005-06 BÉEä nÉè®ÉxÉ +ɺÉÆMÉÉÊ~iÉ ÉÊ´ÉÉÊxÉàÉÉÇhÉ =tÉàÉÉå àÉå BÉÖEãÉ 36442799 (OÉÉàÉÉÒhÉ-23458286; xÉMÉ®ÉÒªÉ 12984514) BÉEÉàÉMÉÉ® BÉEɪÉÇ®iÉ lÉä *
o £ÉÉ®iÉ àÉå +ɺÉÆMÉÉÊ~iÉ ÉÊ´ÉÉÊxÉàÉÉÇhÉ =tÉàÉÉå BÉEä BÉEÉàÉMÉÉ®Éå BÉEÉÒ +ÉÉBÉEÉÊãÉiÉ ºÉÆJªÉÉ àÉå ºÉä {ÉÉζSÉàÉ ¤ÉÆMÉÉãÉ BÉEÉ ÉÊcººÉÉ (15±) ºÉ´ÉÉæSSÉ lÉÉ *
o ÉÊBÉE®ÉªÉä BÉEä BÉEÉàÉMÉÉ® BÉÖEãÉ BÉEÉàÉMÉÉ®Éå BÉEÉ 24± ¤ÉxÉÉiÉä lÉä *
o BÉÖEãÉ BÉEÉàÉMÉÉ®Éå BÉEÉ ãÉMÉ£ÉMÉ 82± {ÉÚhÉÇBÉEÉÉÊãÉBÉE BÉEÉàÉMÉÉ® lÉä *
o BÉÖEãÉ BÉEÉàÉMÉÉ®Éå BÉEÉ ãÉMÉ£ÉMÉ 38± àÉÉÊcãÉÉ BÉEÉàÉMÉÉ® lÉä *
o +ɺÉÆMÉÉÊ~iÉ ÉÊ´ÉÉÊxÉàÉÉÇhÉ =tÉàÉÉå àÉå ºÉ£ÉÉÒ BÉEɪÉÇ®iÉ º´ÉÉÉÊàɪÉÉå àÉå ºÉä ãÉMÉ£ÉMÉ 39± àÉÉÊcãÉɪÉå lÉÉÓ *
o ®ÉVªÉ ºiÉ® {É®, àÉÉÊhÉ{ÉÖ® BÉEä àÉÉÊcãÉÉ BÉEÉàÉMÉÉ®Éå BÉEÉ |ÉÉÊiɶÉiÉ (74.4±) ºÉ´ÉÉæSSÉ lÉÉ *
o º´ÉÉÉÊàÉi´ÉÉvÉÉÒxÉ +ÉSÉãÉ {ÉÉÊ®ºÉà{ÉÉÊkɪÉÉå BÉEÉ àÉÚãªÉ âó. 58166 |ÉÉÊiÉ =tÉàÉ {ÉɪÉÉ MɪÉÉ *
o +ÉSÉãÉ {ÉÉÊ®ºÉà{ÉÉÊkɪÉÉå (º´ÉÉÉÊàÉi´ÉÉvÉÉÒxÉ+ÉÊBÉE®ÉªÉä BÉEÉÒ) BÉEÉ àÉÚãªÉ âó. 83780 |ÉÉÊiÉ =tÉàÉ {ÉɪÉÉ MɪÉÉ *
o º´ÉÉÉÊàÉi´ÉÉvÉÉÒxÉ BÉÖEãÉ +ÉSÉãÉ {ÉÉÊ®ºÉà{ÉÉÊkɪÉÉå àÉå ‘£ÉÚÉÊàÉ +ÉÉè® £É´ÉxÉ’ BÉEÉ ÉÊcººÉÉ (70±) |ÉàÉÖJÉ lÉÉ *
o ÉÊBÉE®ÉªÉä BÉEÉÒ BÉÖEãÉ +ÉSÉãÉ {ÉÉÊ®ºÉà{ÉÉÊkɪÉÉå àÉå ‘£ÉÚÉÊàÉ +ÉÉè® £É´ÉxÉ’ BÉEÉ ÉÊcººÉÉ (98±) |ÉàÉÖJÉ lÉÉ *
o ‘£ÉÚÉÊàÉ +ÉÉè® £É´ÉxÉ’ BÉEä +ÉãÉÉ´Éä, º´ÉÉÉÊàÉi´ÉÉvÉÉÒxÉ +ÉSÉãÉ {ÉÉÊ®ºÉà{ÉÉÊkɪÉÉå àÉå +ÉMÉãÉÉ àÉci´É{ÉÚhÉÇ ÉÊcººÉÉ ‘ºÉƪÉÆjÉ +ÉÉè® àɶÉÉÒxÉ®ÉÒ’ (21±) BÉEÉ lÉÉ *
o ¤ÉBÉEɪÉä jÉ@hÉ BÉEÉ àÉÚãªÉ âó. 12548 |ÉÉÊiÉ =tÉàÉ lÉÉ *
o 2005-06 BÉEä nÉè®ÉxÉ +ɺÉÆMÉÉÊ~iÉ ÉÊ´ÉÉÊxÉàÉÉÇhÉ =tÉàÉÉå BÉEÉä jÉ@hÉ näxÉä ´ÉÉãÉÉå àÉå BÉEäxpÉÒªÉ +ÉÉè® ®ÉVªÉ ºiÉ®ÉÒªÉ ÉÊàɪÉÉnÉÒ jÉ@hÉnɪÉÉÒ ºÉƺlÉÉ, ¤ÉéBÉE +ÉÉè® +ÉxªÉ ºÉÉäºÉÉ<ÉÊ]ªÉÉå BÉEÉ |ÉÉÊiɶÉiÉ (49±) ºÉ´ÉÉæSSÉ lÉÉ *
o jÉ@hÉ näxÉä ´ÉÉãÉÉÒ ºÉ£ÉÉÒ AVÉåÉʺɪÉÉå àÉå ¤ÉBÉEɪÉä jÉ@hÉ BÉEä |ÉÉÊiɶÉiÉ BÉEä °ô{É àÉå ¤ªÉÉVÉ ºÉÉcÚBÉEÉ®Éå BÉEä ÉÊãÉA =SSÉiÉàÉ (27±) lÉÉ *

NSS Report No. 525: Unorganised manufacturing sector in India, 2005-06: Employment, Assets and Borrowings ii
Unorganised manufacturing sector in India- Employment, Assets and Borrowings (July 2005-June 2006)
Highlights (The survey was conducted in 4798 villages and 5125 urban blocks. A total of 82897 enterprises were surveyed all over India.)
• A total of 36442799(rural-23458286; urban-12984514) workers were estimated to be working in unorganised manufacturing enterprises during 2005-06.
• West Bengal had the highest share (15%) of estimated number of workers of
unorganised manufacturing enterprises in India.
• Hired workers constituted 24% of total workers. • About 82% of total workers were full-time workers.
• About 38% of total workers were female workers.
• About 39% of all working owners in unorganised manufacturing enterprises were
females.
• At the state level, Manipur had the highest percentage of (74.4%) of female workers.
• Per enterprise value of fixed assets owned is Rs.58166.
• Per enterprise value of fixed assets (owned+ hired) is Rs.83780.
• ‘Land & Building’ had the dominant (70%) share of total fixed assets owned.
• ‘Land & Building’ had the dominant (98%) share of total fixed assets hired.
• Apart from ‘land and building’, ‘plant and machinery’ (21%) had the next
significant share in the total fixed assets owned.
• Per enterprise value of outstanding loan is Rs.12548.
• Central and state level term lending institution, banks and other societies provided the highest percentage (49%) of loans to unorganised manufacturing enterprises during 2005-06.
• Interest as a percentage of outstanding loan was the highest (27%) for
moneylenders among all agencies providing loan.

NSS Report No. 525: Unorganised manufacturing sector in India, 2005-06: Employment, Assets and Borrowings 1
Chapter One
Introduction
1.1 Brief history
1.1.1 An all-India survey on unorganised manufacturing enterprises was carried out by the National Sample Survey Organisation (NSSO) as a part of the 62nd round of National Sample Survey (NSS) during July 2005 – June 2006. The other subjects of enquiry, which formed part of this round, were annual surveys on household consumer expenditure and employment-unemployment.
1.1.2 Manufacturing sector is one of the important sectors of industry in the Indian economy. As per the latest available National Accounts Statistics1, during 2006-07, the manufacturing sector had a share of about 16% in the GDP at factor cost. For the purpose of data collection, manufacturing sector has been broadly sub-divided into two categories i.e. organised and unorganised. While data for organised manufacturing sector are collected through Annual Survey of Industries (ASI), the same for unorganised manufacturing sector are collected periodically through sample surveys as follow-up surveys of Economic Censuses (EC). The unorganised manufacturing sector has roughly about one-third share in the total contribution by the manufacturing sector in the GDP. 1.1.3 Recognizing the importance of the unorganised manufacturing sector in terms of its share in GDP as well as in total employment, NSS has taken up this subject in many of its rounds. That way collection of data on unorganised manufacture has a long history in the NSS. In fact, the very first round of NSS had small-scale manufacturing and handicrafts as one of its subjects of enquiry. Thereafter, data on small-scale manufacture were collected also in the NSS rounds 3-10, 14, 23 and 29. These surveys used the list of villages from Population Census and list of census enumeration blocks, or lists of Urban Frame Survey (UFS) blocks of NSSO subject to their availability, as the sampling frame for selection of villages / urban blocks. 1.1.4 A review of the surveys conducted by NSSO in the initial rounds mentioned above indicated that a better sampling frame was necessary to generate more accurate statistics of the unorganised sector. The need for auxiliary information on areas of concentration of enterprises for stratification purpose was strongly felt for developing more efficient sampling designs. This demand ultimately culminated in the conduct of periodic Economic Censuses (EC), which provided the frame for the follow-up surveys on non-agricultural enterprises including those engaged in unorganised manufacturing. 1.1.5 With the launching of the EC in 1977 (five ECs have been conducted so far), the follow-up surveys of EC on unorganised manufacturing generally used the village and block level information on number of enterprises/workers as per the EC for selection of villages and urban blocks in the follow-up surveys. The approach of data collection from 1 Press Note, 31st May 2007, Central Statistical Organisation
NSS Report No. 525: Unorganised manufacturing sector in India, 2005-06: Employment, Assets and Borrowings 2
enterprises was also changed from the ‘household approach’ used earlier (i.e. prior to the launching of EC) to the ‘site approach’ whenever such sites existed. So far NSS has conducted six follow-up surveys of EC through rounds 33rd (1978-79), 40th (1984-85), 45th (1989-90), 51st (1994-95), 56th (2000-01), and 62nd (2005-06) with unorganised manufacture as the main subject of enquiry. In the 62nd round of NSS, area frame thrown up by the latest EC (1998) was however used only partially because the frame was considered to be old. However, for 27 cities having a population of one million or more (as per Census 2001) which are likely to have a substantial share in the total number of unorganised manufacturing enterprises in the country, a decision was taken to make use of the list of urban blocks giving count of number of enterprises/workers at the block level as per EC 1998 as the sampling frame for stratification and selection of urban blocks. For the remaining towns/cities, latest lists of UFS blocks were used as the sampling frame2. In case of rural areas, list of villages (or panchayat wards in case of Kerala) of Census 2001 served as the sampling frame for selection of villages as the first-stage units (FSUs). 1.2 Scope of the survey and sample design in brief
1.2.1 The term ‘unorganised manufacturing’ under the coverage of 62nd round basically referred to all manufacturing enterprises, which were not under the coverage of ASI. All government and public sector undertakings were also outside the coverage of the survey. In terms of National Industrial Classification (NIC) 2004 codes, the 62nd round survey on unorganised manufacture covered the NIC 2-digit codes 15-37. In addition, enterprises engaged in cotton ginning, cleaning and baling (NIC 2004 code 01405) were also covered under the survey (see Table 0 at the end of this chapter for the NIC codes under coverage along with their descriptions). It is to be noted that only those manufacturing enterprises, which operated for at least 30 days (15 days for seasonal enterprises) during the last 365 days preceding the date of survey, were eligible for survey.
1.2.2 The survey covered the whole of the Indian Union except (i) Leh and Kargil districts of Jammu & Kashmir, (ii) interior village of Nagaland situated beyond five kilometres of bus route and (iii) villages of Andaman and Nicobar Islands which remain inaccessible throughout the year. All the sample FSUs of the districts Poonch and Rajouri of the state of Jammu and Kashmir became casualty. Thus, the estimates for Jammu and Kashmir as well as for all-India do not include these areas.
1.2.3 As stated earlier, the fieldwork for the 62nd round was carried out during July 2005 to June 2006. The entire survey period was divided into four sub-rounds of three months each. In each of these sub-rounds, equal number of sample villages/urban blocks was allotted for survey with a view to ensuring uniform spread of fieldwork over the entire survey period. All efforts were made to complete the fieldwork in a sample village/block during the sub-round period to which it was allotted.
2 It is to be noted that UFS blocks do not provide information on number of enterprises/workers at the UFS block level. But information on whether any UFS block of the town/city is located in ‘industrial area’, ‘bazar/business area’, etc. is available. This information was utilized for stratification/selection of sample UFS blocks (see Appendix B for details).

NSS Report No. 525: Unorganised manufacturing sector in India, 2005-06: Employment, Assets and Borrowings 3
1.2.4 One salient feature of the sample design adopted during the 62nd round was the use of list frame in order to capture sufficient number of relatively ‘bigger’ manufacturing units under the coverage of the survey. It was presumed that even within the unorganised manufacturing sector, there would be some very ‘big’ non-ASI manufacturing units whose contribution to gross value added was expected to be substantial. Thus, with a view to improving the overall estimate of gross value added per worker, total number of workers, total input, total output, etc., a dual frame approach was considered appropriate for sampling purposes. A list of 8,000 big non-ASI manufacturing enterprises3 for the urban sector only was prepared as per the data of the census of manufacturing enterprises conducted by Development Commissioner of Small Scale Industries (DCSSI) in 2003. This list served as the list frame. All these units in the list frame were considered for survey without resorting to any sampling. For the coverage of all other unorganised manufacturing enterprises in the universe (i.e. other than 8,000 enterprises featuring in the list frame), an area frame approach was followed for sampling units in stages. It is worthwhile to mention that this dual frame approach was experimented for the first time in the 62nd round.
1.2.5 In the area frame approach, the list of all the villages (panchayat wards in case of Kerala) / urban blocks of the country served as the sampling frame of FSUs (also see paragraph 1.1.5). The first stage units (FSUs) were villages (panchayat wards in case of Kerala) in the rural sector and urban blocks in the urban sector. The ultimate stage units were unorganised manufacturing enterprises in both the sectors. However, in case of large FSUs requiring hamlet-group (hg) / sub-block (sb) formation, one intermediate stage in the sampling involved the selection of two hg’s / sb’s from each FSU out of a minimum of three hg’s/sb’s formed in the FSU. Of these two selected hg’s/sb’s, one was selected with probability ‘1’ (termed as segment 1) and another one (termed as segment 2) was selected from among the remaining hg’s/sb’s of the FSU at random. The hg/sb selected with certainty (i.e. segment 1) was the hg/sb having maximum number of directory manufacturing establishments (DMEs) (or with maximum number of non-directory manufacturing establishments (NDMEs) if there was no DME, or with maximum number of own account manufacturing enterprises (OAMEs) if there was no DME/NDME, or with maximum population if there was no DME/NDME/OAME4 in the entire FSU). Smaller FSUs without any hg/sb formation were identified/categorized as segment 1 for the purpose of survey (segment 2 does not exist for such FSUs). As regards the first stage stratification, two basic strata were formed within each district of a State/UT: rural stratum comprising all rural areas of the district and urban stratum consisting of all urban areas of the district. However, each city with a population of one million or more as per Census 2001 was invariably treated as a separate stratum by itself. For details of stratification, sub-stratification and selection of sample FSUs, reference may be made to Appendix-B of this Report.
1.2.6 For each of segments 1 and 2 of the selected sample FSUs, a frame of eligible manufacturing enterprises was prepared by the field investigators by visiting each and 3 For definition of such ‘big’ enterprises, refer to Appendix-B of this report. 4see Chapter Two for definitions of DME, NDME and OAME.
NSS Report No. 525: Unorganised manufacturing sector in India, 2005-06: Employment, Assets and Borrowings 4
every house/household within the selected geographical area. While doing so, if any enterprise of the list frame was encountered, care was taken not to list it again within segment 1 or 2 as a part of the area sample / area frame to guard against duplication of enterprises between the two types of frames. Listing and sampling of enterprises in the area frame was independent for each of segments 1 and 2. In this context, it may be mentioned that for each selected FSU of rural sub-strata 1 and 2 only5 (see Appendix B for composition of these two sub-strata), segment 9 was also carved out within the FSU, which comprised top 10 big non-ASI registered SSI manufacturing units6 located within the boundaries of the entire FSU. The list of such units for selected FSUs was made available to the field investigators in order to facilitate formation of segment 9. Respective frames of segments 1 and 2 in these FSUs excluded the units listed under segment 9. 1.2.7 All the eligible enterprises listed under each of segments 1, 2 and 9 were stratified into 2 broad second-stage strata by enterprise type i.e. OAME & NDME/DME. Each of these two broad second-stage strata was further divided into 3 broad manufacturing groups (BMG) i.e. BMG 1, BMG 2 and BMG 3. BMG 1 comprised eligible enterprises belonging to NIC codes 15 and 20. BMG 2 consisted of eligible enterprises belonging to NIC Codes 23, 27, 30-35 and 01405 while all other eligible enterprises belonging to the rest of the NIC codes under coverage formed BMG 3. Thus within a segment for any given sample FSU, six ultimate second-stage strata were formed by jointly considering the broad second-stage strata and BMG. A total of 12 manufacturing enterprises – two from each ultimate second-stage stratum – were selected for detailed enquiry. In case of shortfall of enterprises in the frame of any particular second-stage stratum, compensation was made by selecting additional samples from other second-stage strata so that a total of 12 enterprises were selected from each FSU for detailed enquiry.
1.2.8 Design-based estimates of aggregates for any selected survey characteristic were obtained separately for list frame and area frame. Finally these two sets of estimates were added to get the pooled aggregate estimate for the combined frame. In this report, discussion will be focused on the pooled estimate based on two types of frames used in the survey. 1.3 Items of information and method of data collection
1.3.1 Schedule 2.2 was designed for collection of data from the manufacturing enterprises. The schedule was organized into 15 blocks. The format of the schedule is placed as Appendix C of the report. The items of information collected through different blocks of the schedule included the following:
• Particulars of operation and background information of the enterprise • Principal operating expenses • Other operating expenses • Principal receipts
5 Rural sub-strata 1 and 2 consisted of villages having ‘big’ non-ASI registered SSI manufacturing units as per the DCSSI’s census/survey in 2003. 6 See Appendix B for details including definition for bigness.

NSS Report No. 525: Unorganised manufacturing sector in India, 2005-06: Employment, Assets and Borrowings 5
• Other receipts • Gross value added • Employment particulars • Compensation to workers • Fixed assets owned and hired • Loan outstanding
1.3.2 The above items of information from any enterprise were collected either from books of accounts of the sample enterprises or through oral enquiry depending upon whether the enterprises maintained books of accounts or not. Reference periods used for various items of information are discussed in Chapter Two. 1.4 Sample size and its limitation
1.4.1 Out of 8,000 enterprises selected from the list frame, data could be collected from only 2,260 enterprises (for state/UT wise distribution of allotted and surveyed numbers of enterprises as per the list frame, reference may be made to columns 8 and 9 of Table 1 of Appendix A). Thus a large percentage (72%) of the list frame enterprises were not surveyed. Among these enterprises the majority (around 70%) belonged to the category of “Government/public sector undertaking/ASI units”, which were not under the coverage of 62nd round. Another 18% of the enterprises were found to be either non-operative or not traceable. In the area frame, 80,637 enterprises (42,050 from rural India and 38,587 from urban India) spread over 4,798 villages and 5,125 urban blocks across the country were surveyed. It is worthwhile to mention here that even though a large percentage of list frame enterprises were not surveyed, theoretically the surveyed enterprises netted through the list frame and area frame represented the whole universe of the unorganised manufacturing sector. The estimation procedure developed for the purpose (see Appendix B) also ensured this. The estimation procedure developed for the purpose (see Appendix B) also ensured this. As regards segment 9, it was formed only in substrata 1& 2 of rural sector. At all-India level, 462 villages were allotted to sub-stratum 1 and 856 villages to sub-stratum 2. For sub-stratum 2, eight villages became casualty. Only in 241 villages (52% of surveyed villages) of sub-stratum 1 and 549 villages (65% of surveyed villages) of sub-stratum 2, an eligible enterprise was available for survey in segment 9, although for each of such allotted FSUs, a list of at least a few enterprises was made available to field offices for survey through segment 9. For FSUs where at least one eligible enterprise was available in segment 9, at all-India level 1,659 segment 9 enterprises were listed out of which data could be collected from 1,377 enterprises. 1.4.2 Thus, altogether a total of 82,897 unorganised manufacturing enterprises considering both list frame and area frame were surveyed. In the appendix tables, although estimates are presented at disaggregated level i.e. sector (rural/urban/combined) x enterprise type (OAME/NDME/DME/All) by NIC code (for all-India) or by state/UT, sample size at the ultimate level of disaggregation may sometimes be very small. The users are advised to look at the related sample size while using the survey results particularly at the disaggregated level.

NSS Report No. 525: Unorganised manufacturing sector in India, 2005-06: Employment, Assets and Borrowings 6
1.5 Plan of release of reports 1.5.1 There are three reports based on the data collected through the survey on unorganised manufacturing enterprises. The first report mainly dealt with various operational characteristics of the enterprises. The present one is the second in the series. This report primarily deals with employment details, annual emoluments per hired worker, fixed capital and borrowings of the unorganised manufacturing and repairing enterprises in India during 2005-06. The last one is on details of input, output and value added by the unorganised manufacturing sector. 1.6 Layout of the present report 1.6.1 The report contains three Chapters (including the present introductory one) and three Appendices. Chapter two deals with the concepts and definitions of various terms used in the survey on unorganised manufacturing. Chapter three discusses the main findings of the survey based on the data collected through central sample i.e. data collected by the field staff of NSSO. Detailed tables are presented in Appendix A. The sample design and estimation procedure are given in Appendix B. A facsimile of the schedule of enquiry used in the survey is given in Appendix C.

NSS Report No. 525: Unorganised manufacturing sector in India, 2005-06: Employment, Assets and Borrowings 7
Table 0: Description of manufacturing activities under the survey coverage of NSS 62nd round
Division Description 01405 Cotton ginning, cleaning and baling
15 Manufacture of Food Products and Beverages 16 Manufacture of Tobacco Products 17 Manufacture of Textiles 18 Manufacture of Wearing Apparel; Dressing and Dyeing of Fur 19 Tanning and Dressing of Leather; Manufacture of Luggage, Handbags,
Saddlery, Harness and Footwear 20 Manufacture of Wood and Products of Wood and Cork, Except
Furniture; Manufacture of Articles of Straw and Plating Materials 21 Manufacture of Paper and Paper Products 22 Publishing, Printing and Reproduction of Recorded Media 23 Manufacture of Coke, Refined Petroleum Products and Nuclear Fuel 24 Manufacture of Chemicals and Chemical Products 25 Manufacture of Rubber and Plastics Products 26 Manufacture of Other Non-Metallic Mineral Products 27 Manufacture of Basic Metals 28 Manufacture of Fabricated Metal Products, Except Machinery and Equipment 29 Manufacture of Machinery and Equipment Not Elsewhere Classified. 30 Manufacture of Office, Accounting and Computing Machinery 31 Manufacture of Electrical Machinery and Apparatus Not Elsewhere Classified. 32 Manufacture of Radio, Television and Communication Equipment and Apparatus 33 Manufacture of Medical, Precision and Optical Instruments, Watches and Clocks 34 Manufacture of Motor Vehicles, Trailers and Semi-Trailers 35 Manufacture of Other Transport Equipment 36 Manufacture of Furniture; Manufacturing Not Elsewhere Classified. 37 Recycling

NSS Report No. 525: Unorganised manufacturing sector in India, 2005-06: Employment, Assets and Borrowings 8
Chapter Two
Concepts and Definitions 2.1 Enterprise: An enterprise is an undertaking engaged in the production and / or distribution of some goods and / or services meant mainly for the purpose of sale, whether fully or partly. An enterprise may be owned and operated by a single household or by several households jointly on a partnership basis, or by an institutional body. 2.2 Manufacturing Enterprise: A manufacturing enterprise is a unit engaged in the physical or chemical transformation of materials, substances or components into new products. It covers units working for other concerns on materials supplied by them. Also included are units primarily engaged in maintenance and repair of industrial, commercial and similar machinery & equipment, which are, in general, classified in the same class of manufacturing as those specialising in manufacturing the goods. 2.3 Unorganised Manufacturing Enterprise: The unorganised manufacturing sector for the present survey consists of following types of enterprises: (i) All manufacturing enterprises except those registered under section 2m(i) and
2m(ii) of Factories Act, 1948 and Bidi and Cigar Workers (conditions of employment) Act, 1966.
(ii) All manufacturing enterprises except those run by Government (Central Government, State Governments, Local Bodies) / Public Sector Enterprises.
2.4 Household Enterprise: A household enterprise is one which is run by one or more members of a household or run jointly by two or more households on partnership basis irrespective of whether the enterprise is located in the premises of the household(s) or not. In other words, all proprietary and partnership enterprises are household enterprises. 2.5 Non-household Enterprise: Non-household enterprises are those which are institutional i.e. owned and run by the public sector (Central or State Government, local self-governments, local bodies, government undertakings, etc.), corporate sector, co-operative societies, other type of societies, institutions, associations, trusts, etc. Non-household enterprises covered under public sector were not included in the current survey. 2.6 Own-account Enterprise: An enterprise, which is run without any hired worker employed on a fairly regular basis 7, is termed as an own account enterprise. If such an enterprise is engaged in manufacturing and/or repairing activities, it is termed as Own Account Manufacturing Enterprise (OAME). 2.7 Establishment: An enterprise which is employing at least one hired worker on a fairly regular basis is termed as establishment. Paid or unpaid apprentices, paid household
7 "fairly regular basis" means the major part of the period when operation(s) of an enterprise are carried out during a reference period.
NSS Report No. 525: Unorganised manufacturing sector in India, 2005-06: Employment, Assets and Borrowings 9
member/servant/resident worker in an enterprise are considered hired workers. Establishments have further been categorised into two types: non-directory and directory. 2.8 Non-directory Establishment: An establishment employing less than six workers (household and hired workers taken together) is termed non-directory establishment. If such an establishment is engaged in manufacturing activities, it is termed Non-Directory Manufacturing Establishment (NDME). 2.9 Directory Establishment: A directory establishment is one which has employed six or more workers (household and hired workers taken together). If such an establishment is engaged in manufacturing activities, it is termed Directory Manufacturing Establishment (DME). 2.10 Perennial Enterprise: Enterprises, which usually operate more or less regularly throughout the year, are called perennial enterprises. 2.11 Seasonal Enterprise: Seasonal enterprises are those which are usually run during a particular season or fixed months of a year. 2.12 Casual Enterprise: Casual enterprises are those which operate occasionally (may be disjoint periods of time throughout the year) but total number of days operated in the last 365 days is 30 days or more. 2.13 Reference Period: The reference period for recording details of various items depended primarily on whether the enterprise under survey could provide information from their books of accounts, or they could provide information orally. Case 1: Enterprises that provided information by recollection 2.13.1 Here, three kinds of reference periods were used to collect data in different blocks of the schedule viz. reference month, reference year and last date of the reference month. 2.13.2 Reference Month: This reference period was used to collect data on various receipts and expenses as well as value added, employment, emoluments, rent and interest payments for the enterprises providing oral information.
For perennial and casual enterprises, ‘Reference Month’ referred to the last 30 days (preceding the date of survey) irrespective of the number of days of operation. For seasonal enterprises, consider the following two cases-
• Case 1: Working continuously for 30 days or more (including scheduled holidays) in the current season: - ‘Reference Month’ referred to the last 30 days (preceding the date of survey).
• Case 2: Worked for less than 30 days in the current season: - ‘Reference Month’ referred to an average month in the last working season.

NSS Report No. 525: Unorganised manufacturing sector in India, 2005-06: Employment, Assets and Borrowings 10
If an enterprise was unable to provide information for the last 30 days, but could provide it for the latest completed calendar month, this calendar month was considered as ‘Reference Month’.
2.13.3 ‘Reference Year’: For items like net additions to fixed assets owned, number of months operated, number of other economic activities pursued etc., data were collected for the entire ‘Reference Year’. It was last 365 days preceding the date of survey, if ‘reference month’ of that enterprise was ‘last 30 days’. For the enterprises where ‘reference month’ was ‘last calendar month’, ‘reference year’ was last 12 calendar months taken together. For seasonal enterprises of case 2 above (i.e., seasonal enterprises which had operated for less than 30 days during the current season), ‘Reference Year’ was a continuous period of 365 days starting from the first day of the corresponding working season. 2.13.4 ‘Last date of the reference month’: For some of the items like value of fixed assets, amount of loan outstanding, etc., the reference period used was as follows: It was last date of the ‘Reference Month’, which was the same as the last date of the ‘Reference Year’. However, opening stock of semi-finished goods manufactured, opening stock of goods traded were collected for the beginning of the first day of the ‘Reference Month’. Case 2: Enterprises provided data from their books of accounts 2.13.5 In this case, two kinds of reference periods were used to collect data in different blocks of the schedule, ‘Reference Year’ and ‘last date of the reference year’.
2.13.6 Reference Year: This was the last completed accounting year of the enterprise under survey. Various receipts, expenses, value added as well as employment, emoluments, rent, interest, net additions to fixed assets owned, for the enterprises were recorded for the last completed accounting year. 2.13.7 ‘as on first/ last date of reference year’: For some of the items like value of fixed assets, amount of loan outstanding, etc., this reference period was used. It was last date of the ‘Reference Year’. For items like opening stock of semi-finished goods manufactured, opening stock of goods traded, the beginning of the first date of the reference year was the point of reference 2.14 Worker: A worker is defined as one who participates either full time or part time in the activity of the enterprise. The worker may serve the enterprise in any capacity - primary or supervisory. He/she may or may not receive wages / salaries in return to his / her work incidental to or connected with the enterprise activity. A worker need not mean that the same person is working continuously; it only refers to a position. Persons working for less than or equal to half of the normal working hours of the enterprise on a fairly regular basis are considered as part time workers. Full time workers are those who work for more than half of the period of normal working hours of the enterprise on a fairly regular basis. Two part-time workers in an enterprise are counted as 2 and not 1.

NSS Report No. 525: Unorganised manufacturing sector in India, 2005-06: Employment, Assets and Borrowings 11
2.15 Working Owner: The owner who personally works in the proprietary or partnership enterprises on a fairly regular basis is called working owner. In fact, in most of the own-account enterprises the owner himself/ herself manages all activities of the enterprise without the help of anyone (on a fairly regular basis). In the case of partnership enterprises, if only one partner or some of the partners or all the partners work in the enterprise on a fairly regular basis then they are considered as ‘working owners’. 2.16 Hired Worker: A hired worker is a person employed directly or through any agency on payment of regular wage / salary in cash or kind. Apprentices, paid or unpaid, are treated as hired workers. Paid household workers, servants and resident workers of the enterprise are also considered as hired workers. 2.17 Other Worker / Helper: This includes all persons belonging to the household of the proprietor or households of the partners who are working in or for the enterprise without regular salary or wages. Persons working as exchange labourer in the enterprise without salary or wages are covered in this category. All unpaid household workers / helpers who are associated with the activities of the enterprise during the reference month are considered in this category. 2.18 Mixed Activity: There are enterprises that carry out a number of activities simultaneously. For example, a bakery may also sell cold drinks, a rice mill may sell sugar, a factory may run a hospital in its premises, etc. Each such activity was treated as a separate enterprise if information for them was separately available. If the accounts were not separable then the data pertained to the enterprise as a whole and the enterprise was classified as having mixed activities and the activities of such enterprises are a mixture of NIC’s. The activities may be mixed at any level of NIC, but for the present survey an enterprise was considered to have mixed activities if its activities were different at 2-digit level of NIC-2004.The appropriate NIC in such cases was determined on the basis of major activity. Major activity refers to the activity which yielded maximum income/turnover/employment. The above criteria were applied in the given order, i.e., income first, then turnover and then employment, to determine the major activity. 2.19 Multiple Activity: Since many of the entrepreneurs belonging to the unorganised sector operate at small or marginal levels, the phenomenon of carrying out more than one activity simultaneously or at different points of time is quite prevalent. If the activities were carried out at one point of time at the same location and the information was not separately available, then it was taken as “mixed activity”. Carrying out of more than one economic activity by the entrepreneur during the reference year is called multiple activities. It differs from mixed activities in the sense that former is with respect to the entrepreneur whereas the latter is with respect to the enterprise. However, an entrepreneur of a manufacturing enterprise manufacturing woollen garments before winter and cotton clothes before summer will not be considered as carrying out multiple activities. Some examples of multiple activities are: i) a person carrying out agricultural activity at sowing / harvesting season and doing carpentry at the same time or at other times, ii) a lady working as regular wage / salary earner and also running a tailoring shop

NSS Report No. 525: Unorganised manufacturing sector in India, 2005-06: Employment, Assets and Borrowings 12
in the evening, etc iii) A household servant is making paper envelopes in free time, iv) An agricultural worker engaged in handicraft making during non-harvesting season of the year. 2.20 Working on Contract: The enterprises in the unorganised sector are mainly small units. In many cases, the enterprises are seen to be working as per orders from a bigger unit. In such cases, certain conditions are put on the servicing unit by the contractor or master unit. Conditions may pertain to sale of products, supply of raw materials, mode of payment etc. In many cases, the contractor specifies the design of the product to the servicing unit e.g. garment manufacturing, shoe manufacturing etc. If the surveyed enterprise had undertaken any work on contract during the reference year, it was considered as ‘enterprises working on contract’. 2.21 Fixed Assets: Assets held for the purpose of producing or providing goods or services and not for resale in the normal course of entrepreneurial activities are classified as fixed assets. These cover all goods, new or used, that have a normal economic life of more than one year from the date of purchase. 2.22 Land and Building: Land means the land on which the enterprise is accommodated together with the surrounding area, which is used for the enterprise. This also includes improvement to land. However, if only a portion of the land belonging to the residence of a household is utilised for the enterprise, only that portion of the land is considered as capital assets for the enterprise. Land owned with permanent heritable possession with or without right to transfer the title comes under this category. Land held on long-term lease, say, 30 years or more, is also treated as land owned. Building is the structure, where activities of the enterprise are undertaken. This also includes all other structures like shed, house, portions of a house or other structure, building under construction and other conveniences in which the activities of the enterprise are carried out. This also includes other constructions such as passage, wall, water tank, sewerage, tube-well, etc. 2.23 Plant and Machinery: Plant generally means an assembly of machinery / equipment / devices installed for the operation of entrepreneurial activities. Machinery means an implement or mechanical device used in the entrepreneurial activities. These are assets of durable nature and can be easily identified. 2.24 Transport Equipment: All vehicles, power-driven or man / animal-driven, used for transporting persons, goods and materials by the enterprise in connection with its activity are covered in this category. Animals, if used for drawing vehicles or carrying loads, will be treated as part of transport equipment. 2.25 Tools and Other Fixed Assets: Tools refer to small loose implements, generally held in hand for operation and having normal life of more than one year. Other fixed assets refer to other durable equipment which are used for the entrepreneurial activity either directly or indirectly. These include furniture, fixtures, laboratory equipment, office equipment etc. Livestock used in oil-mill is also covered under this category.
NSS Report No. 525: Unorganised manufacturing sector in India, 2005-06: Employment, Assets and Borrowings 13
2.26 Net additions to fixed assets during the last 365 days: Net addition to fixed assets was obtained by subtracting depletion of assets from the additions made during the last 365 days. Addition to the fixed assets could be made through purchase (new or used) or through own construction. Improvements on land, new construction of building, shed, structure, as well as assets produced on own account during the last 365 days were considered as additions to the fixed assets. Depletion of assets was obtained by considering the assets sold and discarded during the last 365 days. The value of assets disposed of in any manner other than sale, were treated as value of assets discarded. Besides obsolescence (gone out of use) of an asset, this included loss due to theft, damage, accident etc. 2.27 Loan: Any borrowing in cash or kind to be repaid in cash or kind is treated as loan. Loans taken for the purpose of utilising the same in the entrepreneurial activities of an enterprise were considered as loan even if such loans were used for other purposes. On the other hand, loans taken for other purposes but ultimately used in the enterprise were excluded. 2.28 Operating Expenses: The total of values of raw materials, electricity, fuel, lubricants and auxiliary materials consumed; cost of maintenance, services purchased and other expenses incurred during the reference period by an enterprise was considered as ‘operating expenses’. 2.29 Receipts: The sale value of products and by-products manufactured by an enterprise together with the value of services rendered to other concerns and other receipts incidental to entrepreneurial activities are considered as ‘total receipts’. 2.30 Gross Value Added: Gross value added is taken as additional value created by the process of production of an enterprise to the economy. Gross value added is calculated by deducting ‘total operating expenses’ from the total value of ‘total receipts’ during the reference period.

NSS Report No. 525: Unorganised manufacturing sector in India, 2005-06: Employment, Assets and Borrowings 14
Chapter Three
Summary of findings 3.1 Introduction: This report, the second in the series of three reports from the survey, focuses mainly on employment, fixed capital and borrowings of the unorganised manufacturing and repairing enterprises in India during 2005-06. The first report dealing with operational characteristics of enterprises also covered employment particulars but these are discussed here in more detailed categorisation. 3.1.1 This chapter contains a summary of the results. Detailed tables are given in Appendix A for rural and urban areas and for both areas combined at all India and State / UT levels and by different types of industries. These tables give information relating to Own Account Manufacturing Enterprises (OAMEs), Non-Directory Manufacturing Establishments (NDMEs), Directory Manufacturing Establishments (DMEs) as well as on all types of enterprises taken together. In some cases, the figures for totals and proportions presented in detailed tables may vary marginally due to rounding off. The figures presented in this report are based on ‘central sample’ i.e. data collected by the field staff of National Sample Survey Organisation. 3.1.2 A few important characteristics as estimated in this round as well as the preceding two rounds i.e.56th (2000-01) & 51st (1994-95) have been presented in this report to show the extent of change over the different survey periods. Although, the coverage of manufacturing and repairing enterprises differed to some extent in the three rounds, they are unlikely to bring any serious distortion in comparing estimates of rates and proportions presented in this report. However, the difference in coverage is summarised below: 3.1.3 Coverage of manufacturing and repairing enterprises in 62nd round & 56th round identical except that “While-you-wait” services under printing of textiles (NIC-98 code 1712) and engraving of metals (NIC-98 code 2892) now classified in NIC-2004 under repair of personal and household goods (NIC-2004 code 52609) were covered in 56th round but not in 62nd round. Some examples of “While-you-wait” services are: i) Households giving new/ old clothes to a shop for block printing, embroidery, etc. ii) shop-owners writing name-plates, etc. on metal, iii) Boutique shops purchasing sarees and doing art-work either themselves or through outsourcing before sale, etc. 3.1.4 Coverage of manufacturing and repairing enterprises in 56th round & 51st round differed in respect of the following activities: a) activities covered in 51st round but not in 56th round:
Repair and maintenance of computers and computer based systems (NIC 1987 or NIC 87 code 3941), ii) Repair of office, computing and accounting machinery other than
NSS Report No. 525: Unorganised Manufacturing Sector in India, 2005-06: Employment, Assets and Borrowings 15
computers and computer based systems (NIC 87 code 3942), iii) Repair of heavy motor vehicles (NIC 87 code 398), iv) Repair of household electrical appliances (NIC 87 code 971), v) Repair of TV, VCR, radio, transistor, tape-recorder and other electronic appliances (NIC 87 code 972), vi) Repair of watches, clocks and jewellery (NIC 87 code 973), vii) Repair of motor vehicles and motor cycles except trucks, lorry and other heavy vehicles (NIC 87 code 974), viii) Repair of bicycles and cycle rickshaws (NIC 87 code 975) and ix) Repair enterprises not elsewhere classified (NIC 87 code 979).
b) Cotton ginning, cleaning and baling (NIC 98 code 01405) was covered in 56th round but not in 51st round. 3.1.5 All the above-mentioned repairing activities were categorised under ‘Services sector (DIV. 50-93)’ in NIC 1998 & NIC 2004, which were respectively followed in 56th round and 62nd round. It may be mentioned that both in 56th round and 62nd round, the survey on unorganised manufacturing enterprises covered only industries belonging to NIC Divisions 15-37 as well as NIC code 01405. 3.1.6 So if we now compare the coverage of 51st round and 62nd round, it is apparent that the above repairing activities were covered in 51st round but not in 62nd round. Also Cotton ginning, cleaning and baling (NIC 2004 code 01405) was covered in 62nd round but not in 51st round. It may be mentioned that repairing activities other than those mentioned above, which were included in NIC 2004 Div. 15 to 37, were covered in 62nd round and also those repairing activities barring the above mentioned ones, which were included in NIC 1998 Div. 15 to 37, were covered in 56th round. 3.2 Number of first stage units surveyed: In the 62nd round survey, a total of 9923 first stage units were surveyed in the central sample, of which 4798 were villages and 5125 UFS blocks). Statement 1 gives the distribution of the number of sample villages and blocks allotted for survey and actually surveyed in different states. 3.3 Number of enterprises surveyed: Before looking into the various characteristics of the enterprises estimated from the survey, it is worthwhile to know the number of enterprises surveyed in the 62nd round. Statement 2 gives information on the number of enterprises surveyed state-wise for rural, urban and both sectors combined for the country. A total of 82897 (including 2260 list frame enterprises located in urban areas) enterprises were surveyed all over India. About 51% of these enterprises were in rural India and the remaining 49% were in urban India. List frame enterprises constituted only 5.5% of urban enterprises surveyed, the rest 94.5% being area frame enterprises. Maximum number of enterprises (both list frame and area frame enterprises) surveyed was in Uttar Pradesh (9.95%) followed by West Bengal (7.97%), Tamil Nadu (7.95%), Andhra Pradesh (7.93%) and Maharashtra (7.76%). However, the highest percentage of list frame enterprises surveyed was in Maharashtra (21.1%) followed by Uttar Pradesh (10.9%), Haryana (9.8%), Rajasthan (8.7%), Tamil Nadu (8.6%). 3.3.1 While discussing the results and graphs the term ‘major States’ are mentioned in some places. These ‘major States’ and their names in abbreviated forms (in brackets) are: Andhra Pradesh (AP), Assam (ASM), Bihar (BHR), Gujarat (GUJ), Haryana (HAR), Jammu and Kashmir (J&K), Karnataka (KTK), Kerala (KER), Madhya Pradesh (MP), Maharashtra (MAH), Orissa (ORS), Punjab (PUN), Rajasthan (RAJ), Tamil Nadu (TN), Uttar Pradesh (UP), West Bengal (WB), Jharkhand (JRK), Chhatisgarh (CTG) and Uttaranchal (UTC).

NSS Report No. 525: Unorganised Manufacturing Sector in India, 2005-06: Employment, Assets and Borrowings 16
Statement 1: Number of first stage units (villages/UFS blocks) allotted and surveyed by State / UT
area-frame villages/blocks
rural urban rural + urban State/ UT allotted surveyed allotted surveyed allotted surveyed
(1) (2) (3) (4) (5) (6) (7) Andhra Pradesh 376 376 296 296 672 672 Arunachal Pradesh 71 71 24 24 95 95 Assam 238 238 112 111 350 349 Bihar 303 303 200 200 503 503 Chhatisgarh 72 71 64 64 136 135 Delhi 12 12 76 76 88 88 Goa 16 16 24 24 40 40 Gujarat 161 161 256 256 417 417 Haryana 112 112 96 96 208 208 Himachal Pradesh 145 137 72 71 217 208 Jammu & Kashmir 152 115 200 180 352 295 Jharkhand 160 160 144 144 304 304 Karnataka 195 195 204 204 399 399 Kerala 283 280 160 159 443 439 Madhya Pradesh 217 217 296 295 513 512 Maharashtra 238 238 560 560 798 798 Manipur 56 56 64 64 120 120 Meghalaya 57 57 40 40 97 97 Mizoram 39 39 64 64 103 103 Nagaland 47 47 32 32 79 79 Orissa 229 229 148 148 377 377 Punjab 136 136 216 216 352 352 Rajasthan 237 237 284 284 521 521 Sikkim 38 38 22 22 60 60 Tamil Nadu 304 304 368 368 672 672 Tripura 103 103 80 80 183 183 Uttaranchal 57 57 40 39 97 96 Uttar Pradesh 385 385 576 576 961 961 West Bengal 336 336 352 352 688 688 A & N Islands 32 32 16 16 48 48 Chandigarh 4 4 16 16 20 20 D & N Haveli 8 8 8 8 16 16 Daman & Diu 8 8 8 8 16 16 Lakshadweep 4 4 16 16 20 20 Pondicherry 16 16 16 16 32 32 all-India 4847 4798 5150 5125 9997 9923
See Appendix Table 1

NSS Report No. 525: Unorganised Manufacturing Sector in India, 2005-06: Employment, Assets and Borrowings 17
Statement 2: Number of enterprises surveyed by State / UT
number of enterprises surveyed urban State/UT rural
list frame area frame allrural + urban
(1) (2) (3) (4) (5) (6) Andhra Pradesh 3876 46 2661 2707 6583 Arunachal Pradesh 76 1 25 26 102 Assam 2084 13 818 831 2915 Bihar 2468 2 1355 1357 3825 Chhatisgarh 528 21 328 349 877 0 Delhi 71 110 377 487 558 Goa 147 2 112 114 261 Gujarat 1350 27 2135 2162 3512 Haryana 1118 222 829 1051 2169 Himachal Pradesh 1011 14 478 492 1503 0 Jammu & Kashmir 1083 39 1409 1448 2531 Jharkhand 975 4 799 803 1778 Karnataka 1770 73 1593 1666 3436 Kerala 2682 46 1408 1454 4136 Madhya Pradesh 1641 115 2023 2138 3779 0 Maharashtra 1963 477 4000 4477 6440 Manipur 443 0 719 719 1162 Meghalaya 388 3 153 156 544 Mizoram 223 1 229 230 453 Nagaland 425 0 268 268 693 0 Orissa 2190 23 1079 1102 3292 Punjab 1130 173 1722 1895 3025 Rajasthan 2032 196 2254 2450 4482 Sikkim 164 0 98 98 262 Tamilnadu 3198 195 3208 3403 6601 0 Tripura 1067 0 539 539 1606 Uttaranchal 377 5 178 183 560 Uttar Pradesh 3378 248 4619 4867 8245 West Bengal 3620 177 2813 2990 6610 A & N Islands 181 0 38 38 219 0 Chandigarh 38 13 7 20 58 Dadra & Nagar Haveli 69 5 45 50 119 Daman & Diu 77 0 80 80 157 Lakshadweep 30 1 52 53 83 Pondicherry 177 8 136 144 321 all-India 42050 2260 38587 40847 82897 See Appendix Tables 1 & 2 for more detail. 3.4 Estimated number of enterprises: Statement 3 gives the estimated number of unorganised manufacturing enterprises categorised by enterprise types for rural, urban, combined sectors of each State / UT. In the total enterprises, rural India had a share of 71% while urban India had 29% share.

NSS Report No. 525: Unorganised Manufacturing Sector in India, 2005-06: Employment, Assets and Borrowings 18
Statement 3: Estimated number of enterprises in different States/UTs, separately by sector and type of enterprise
estimated number of enterprises Rural Urban Rural + Urban State / UT
OAME NDME DME all OAME NDME DME all OAME NDME DME all (1) (2) (3) (4) (5) (6) (7) (8) (9) (10) (11) (12) (13)
Andhra Pradesh 998813 45316 41113 1085242 363988 69642 14366 447997 1362802 114958 55479 1533239Arunachal Pradesh 304 226 11 541 223 84 11 318 527 310 22 859Assam 306157 24581 2268 333006 21984 13647 2143 37774 328142 38228 4411 370781Bihar 639312 23138 929 663379 87057 20269 1692 109018 726369 43407 2621 772397Chhatisgarh 169729 1549 1332 172610 23967 8083 2821 34871 193695 9632 4153 207481 Delhi 767 1810 1062 3639 17127 45890 30979 93997 17894 47700 32041 97636Goa 3200 888 458 4546 3053 2170 539 5762 6252 3059 997 10308Gujarat 276152 14538 10064 300753 246382 54198 53024 353605 522534 68736 63088 654358Haryana 102113 14267 3306 119687 60448 38319 11656 110423 162561 52586 14963 230110Himachal Pradesh 92900 6763 774 100437 4249 2163 593 7005 97149 8927 1367 107442 Jammu & Kashmir 132883 6501 1083 140468 25700 5973 1272 32944 158583 12474 2355 173412Jharkhand 522684 16622 944 540250 34243 10207 1248 45698 556927 26829 2192 585948Karnataka 580125 32323 50764 663211 228452 48749 21349 298549 808576 81071 72113 961761Kerala 374908 98679 19191 492777 119772 35062 11080 165914 494680 133741 30271 658692Madhya Pradesh 541814 13146 9502 564463 253319 31921 4857 290097 795133 45067 14359 854559 Maharashtra 499406 39967 16795 556168 341781 134658 93855 570294 841187 174625 110650 1126462Manipur 34388 1288 121 35797 14629 1864 228 16721 49017 3152 349 52518Meghalaya 26803 6579 1131 34513 1027 1268 179 2474 27830 7847 1310 36987Mizoram 3078 196 18 3291 1123 624 63 1810 4201 820 80 5101Nagaland 6842 319 6 7167 1912 758 68 2739 8754 1078 75 9906 Orissa 843862 23583 3432 870877 69199 13748 3406 86352 913061 37330 6838 957229Punjab 135428 13610 1170 150208 87811 44532 10686 143029 223239 58142 11856 293237Rajasthan 371194 23428 6253 400875 181806 38180 15609 235595 553000 61608 21862 636470Sikkim 3260 397 26 3684 206 186 28 420 3466 583 54 4103Tamilnadu 720436 88273 41644 850353 467652 117692 46236 631580 1188088 205965 87880 1481933 Tripura 33235 5400 265 38900 3857 2357 256 6470 37093 7756 521 45370Uttaranchal 44403 7371 2167 53940 7877 6535 735 15146 52280 13906 2902 69087Uttar Pradesh 1577716 100935 25865 1704516 455329 157969 41561 654859 2033045 258904 67426 2359375West Bengal 2061369 131237 31162 2223768 373178 114609 41238 529025 2434547 245846 72400 2752793A & N Islands 1283 488 101 1872 147 222 75 444 1429 710 177 2316 Chandigarh 567 154 31 753 457 148 15 621 1024 303 46 1373D & N Haveli 506 247 44 797 68 98 6 172 574 345 50 969Daman & Diu 852 133 479 1464 960 188 28 1175 1812 320 507 2639Lakshadweep 204 48 3 255 115 23 4 142 320 71 7 397Pondicherry 2026 1270 762 4058 5090 2975 1448 9513 7116 4245 2210 13572all-India 11108720 745269 274277 12128266 3504186 1025013 413355 4942554 14612907 1770282 687632 17070820
See Appendix Table 2 for more detail.

NSS Report No. 525: Unorganised Manufacturing Sector in India, 2005-06: Employment, Assets and Borrowings 19
3.5 Statement 3A gives the estimated number of OAMEs and establishments (NDME & DME) separately for rural, urban and combined sectors of the country. As expected, OAMEs dominated the unorganised manufacturing enterprises in rural, urban and combined sectors of the country. Chart 1 gives the percentage of OAMEs,NDMEs and DMEs in total number of enterprises. The share of OAMEs is about 86%, the remaining 14% being establishments. The share of NDMEs and DMEs were respectively 10% and 4% in total number of enterprises.
Statement 3A: Estimated number of enterprises categorised by enterprise type and sector at all-India level
estimated number of enterprises enterprise type rural urban all-India
OAME 11108720 3504186 14612907 Establishments
• NDME 745269 1025013 1770282 • DME 274277 413355 687632 • Total 1019546 1438368 2457914
All 12128266 4942554 17070820
Chart 1:Percentages of OAMEs, NDMEs & DMEs in total number of enterprises
86%
10%4%
OAMENDMEDME
NSS Report No. 525: Unorganised Manufacturing Sector in India, 2005-06: Employment, Assets and Borrowings 20
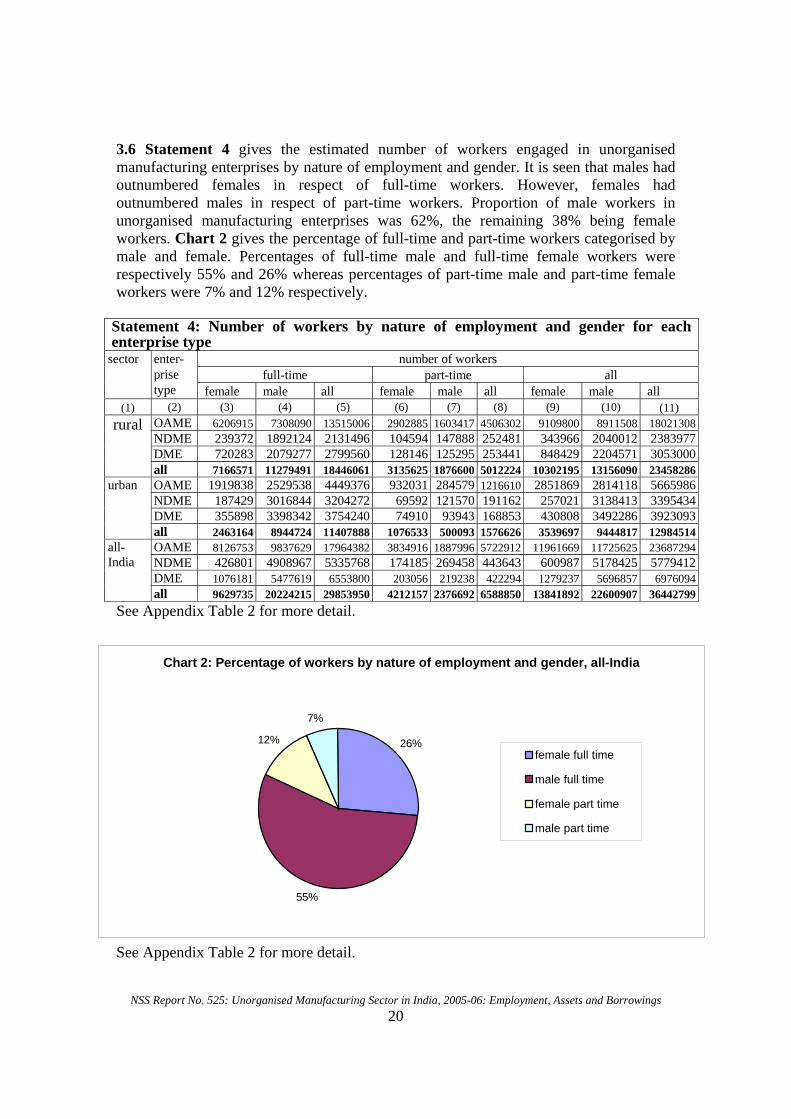
3.6 Statement 4 gives the estimated number of workers engaged in unorganised manufacturing enterprises by nature of employment and gender. It is seen that males had outnumbered females in respect of full-time workers. However, females had outnumbered males in respect of part-time workers. Proportion of male workers in unorganised manufacturing enterprises was 62%, the remaining 38% being female workers. Chart 2 gives the percentage of full-time and part-time workers categorised by male and female. Percentages of full-time male and full-time female workers were respectively 55% and 26% whereas percentages of part-time male and part-time female workers were 7% and 12% respectively.
Statement 4: Number of workers by nature of employment and gender for each enterprise type
number of workers full-time part-time all
sector enter-prise type female male all female male all female male all
(1) (2) (3) (4) (5) (6) (7) (8) (9) (10) (11) OAME 6206915 7308090 13515006 2902885 1603417 4506302 9109800 8911508 18021308NDME 239372 1892124 2131496 104594 147888 252481 343966 2040012 2383977DME 720283 2079277 2799560 128146 125295 253441 848429 2204571 3053000
rural
all 7166571 11279491 18446061 3135625 1876600 5012224 10302195 13156090 23458286OAME 1919838 2529538 4449376 932031 284579 1216610 2851869 2814118 5665986NDME 187429 3016844 3204272 69592 121570 191162 257021 3138413 3395434DME 355898 3398342 3754240 74910 93943 168853 430808 3492286 3923093
urban
all 2463164 8944724 11407888 1076533 500093 1576626 3539697 9444817 12984514OAME 8126753 9837629 17964382 3834916 1887996 5722912 11961669 11725625 23687294NDME 426801 4908967 5335768 174185 269458 443643 600987 5178425 5779412DME 1076181 5477619 6553800 203056 219238 422294 1279237 5696857 6976094
all-India
all 9629735 20224215 29853950 4212157 2376692 6588850 13841892 22600907 36442799See Appendix Table 2 for more detail.
See Appendix Table 2 for more detail.
Chart 2: Percentage of workers by nature of employment and gender, all-India
26%
55%
12%
7%
female full time
male full time
female part time
male part time
NSS Report No. 525: Unorganised Manufacturing Sector in India, 2005-06: Employment, Assets and Borrowings 21
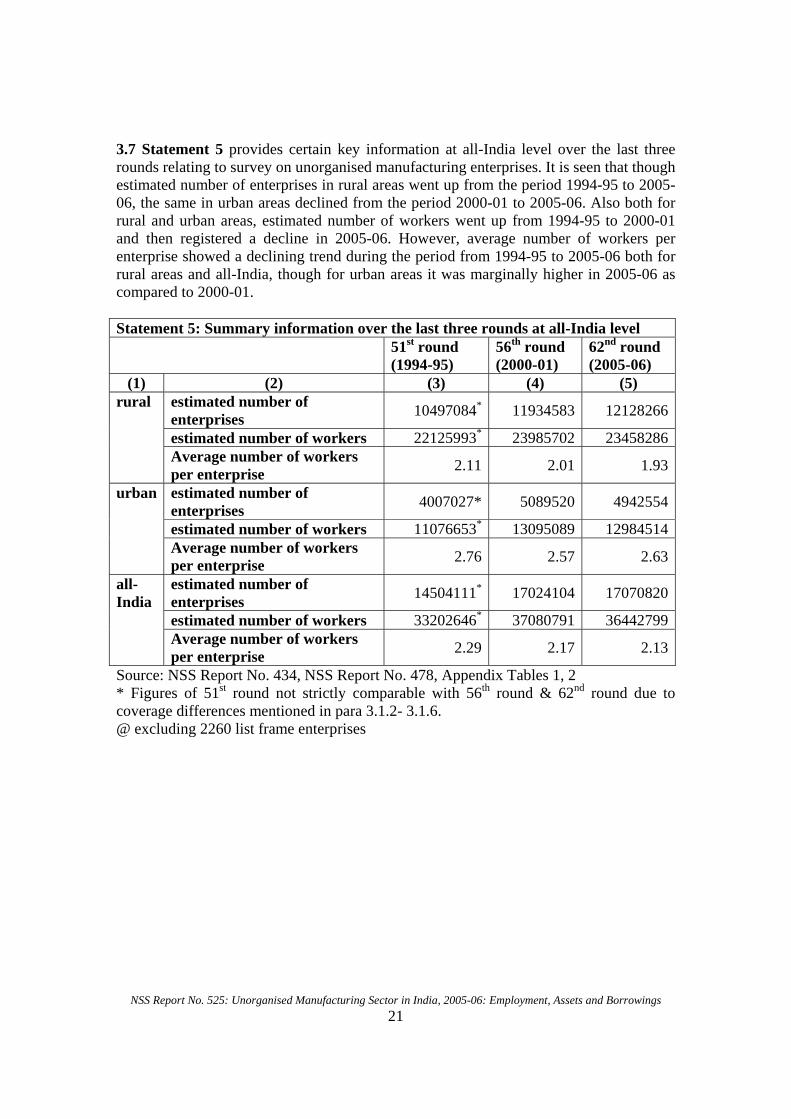
3.7 Statement 5 provides certain key information at all-India level over the last three rounds relating to survey on unorganised manufacturing enterprises. It is seen that though estimated number of enterprises in rural areas went up from the period 1994-95 to 2005-06, the same in urban areas declined from the period 2000-01 to 2005-06. Also both for rural and urban areas, estimated number of workers went up from 1994-95 to 2000-01 and then registered a decline in 2005-06. However, average number of workers per enterprise showed a declining trend during the period from 1994-95 to 2005-06 both for rural areas and all-India, though for urban areas it was marginally higher in 2005-06 as compared to 2000-01. Statement 5: Summary information over the last three rounds at all-India level 51st round
(1994-95) 56th round (2000-01)
62nd round (2005-06)
(1) (2) (3) (4) (5) estimated number of enterprises 10497084* 11934583 12128266
estimated number of workers 22125993* 23985702 23458286
rural
Average number of workers per enterprise 2.11 2.01 1.93
estimated number of enterprises 4007027* 5089520 4942554
estimated number of workers 11076653* 13095089 12984514
urban
Average number of workers per enterprise 2.76 2.57 2.63
estimated number of enterprises 14504111* 17024104 17070820
estimated number of workers 33202646* 37080791 36442799
all-India
Average number of workers per enterprise 2.29 2.17 2.13
Source: NSS Report No. 434, NSS Report No. 478, Appendix Tables 1, 2 * Figures of 51st round not strictly comparable with 56th round & 62nd round due to coverage differences mentioned in para 3.1.2- 3.1.6. @ excluding 2260 list frame enterprises

NSS Report No. 525: Unorganised Manufacturing Sector in India, 2005-06: Employment, Assets and Borrowings 22
3.8 Statement 5A gives the estimated number of workers in descending order in States / Uts. It is seen that West Bengal had the highest share (15%) of workers in unorganised manufacturing enterprises of the country closely followed by Uttar Pradesh (14%). About 55% of all workers were concentrated in five states of West Bengal, Uttar Pradesh, Tamil Nadu, Andhra Pradesh, Maharashtra. Here OAMEs had significantly contributed to total number of workers in the top state West Bengal, its percentage being 72%. In contrast, Uttar Pradesh, which had more number of workers in establishments than West Bengal, had lower number of workers in OAMEs. However, Maharashtra had highest share (13%) of total number of workers of all the establishments of all states.
Statement 5A: Estimated number of workers in descending order in different States/UT,
estimated number of workers State/UT
OAME Establishment All (in
descending order)
% share
West Bengal 3980082 1513751 5493833 15.08Uttar Pradesh 3744877 1543024 5287901 14.51Tamil Nadu 1760313 1609206 3369519 9.25Andhra Pradesh 2003229 935716 2938945 8.06Maharashtra 1235091 1666326 2901417 7.96Orissa 1836331 187210 2023541 5.55Karnataka 1107479 866890 1974369 5.42Gujarat 845248 1006884 1852132 5.08Madhya Pradesh 1437477 303169 1740646 4.78Bihar 1311718 141355 1453073 3.99Kerala 673565 717441 1391006 3.82Rajasthan 797748 497587 1295335 3.55Jharkhand 840208 109137 949345 2.61Assam 472123 160358 632481 1.74Punjab 313818 286992 600810 1.65Haryana 234038 309986 544024 1.49Chhattisgarh 376669 81697 458366 1.26Delhi 26478 430730 457208 1.25Jammu & Kashmir 260614 58255 318869 0.87Himachal Pradesh 125522 39911 165433 0.45Uttaranchal 80353 67485 147838 0.41Tripura 55272 89588 144860 0.40Meghalaya 49894 40543 90437 0.25Manipur 67836 13534 81370 0.22Pondicherry 10009 34700 44709 0.12Goa 8903 19584 28487 0.08Nagaland 12925 3382 16307 0.04Mizoram 6037 3410 9447 0.03Daman & Diu 2239 6311 8550 0.02Sikkim 5218 2408 7626 0.02A & N Islands 2466 3571 6037 0.02Arunachal Pradesh 1081 2220 3301 0.01Chandigarh 1217 1382 2599 0.01D & N Haveli 724 1540 2264 0.01Lakshadweep 491 221 712 0all-India 23687294 12755505 36442799 100
See Appendix Table 3 for more detail.

NSS Report No. 525: Unorganised Manufacturing Sector in India, 2005-06: Employment, Assets and Borrowings 23
3.9 Statement 6 gives the estimated number of workers by type of worker. It is seen that 64% of all workers in unorganised manufacturing enterprises in the country were in rural areas and the remaining 36% workers belonged to urban areas. Share of hired workers in total number of workers in rural India, urban India and all-india were 16%, 40%, & 24% respectively. Statement 7 presents the estimated number of workers and hired workers as revealed in the last three surveys. It is seen from the statement that share of hired workers showed an increasing trend from 1994-95 to 2005-06 for all sectors i.e. rural, urban and all-India. It is seen from Statement 7A that five states had a share of more than 50% of all workers in unorganised manufacturing enterprises in all the three survey periods. The rankings of top five states in terms of number of workers had remained the same in 2000-01 and 2005-06. The presence of Orissa in place of Maharashtra in 1994-95 appears to be an aberration.
Statement 6: Number of workers by type of worker separately for rural, urban and combined sectors.
number of workers Sector working owners (in ’00)
hired workers (in ’00)
other workers (in ’00)
total workers (in ’00)
(1) (2) (3) (4) (5) rural 132856 37083 64644 234583 urban 54304 51564 23977 129845 all-India 187160 88647 88620 364428
See Appendix Table 3 for more detail.
Statement 7: Estimated total number of workers and hired workers and percentage of hired workers separately for rural, urban and combined sectors.
number of workers Sector total number of workers
(in ’00) hired workers
(in ’00) % of hired workers
(1) (2) (3) (4) rural
51st (1994-95) 221260 26551 12 56th (2000-01) 239857 33995 14 62nd (2005-06) 234583 37083 16
urban 51st (1994-95) 110766 40984 37 56th (2000-01) 130951 49465 38 62nd (2005-06) 129845 51564 40
all-India 51st (1994-95) 332025 67535 20 56th (2000-01) 370808 83459 23 62nd (2005-06) 364428 88647 24
Source: Appendix Table 3, NSS Report No.479, and NSS Report No.434
Statement 7A: Share of top five states in total number of workers in the last three rounds at all-India level
51st round (1994-95) 56th round (2000-01) 62nd round (2005-06) U.P 17.87 W.B 15.82 W.B 15.08 W.B 13.19 U.P 14.57 U.P 14.51
Orissa 9.32 T.N 9.28 T.N 9.25 T.N 8.69 A.P 8.89 A.P 8.06 A.P 7.68 MAH 8.02 MAH 7.96
Share of top five states in total number of workers
Total 56.75 Total 56.58 Total 54.86

NSS Report No. 525: Unorganised Manufacturing Sector in India, 2005-06: Employment, Assets and Borrowings 24
3.10 Statement 7B presents the total number of workers and percentage of worker categorised by nature of employment over the last three rounds. It reveals that share of full-time workers in total employment had gradually gone down from 89% to 82% and share of part-time workers in total employment had correspondingly gone up 11% to 18% in the period from 1994-95 to 2005-06. 3.11 Statement 7C presents the total number of workers categorised by type of workers and percentage of worker over the last two rounds. Here the comparison is restricted to 62nd and 56th rounds because in 51st round workers were not categorised in the same manner. It reveals that proportion of working owners, hired workers and other workers in total employment had remained constant in 2000-01 and 2005-06. Roughly, half of all workers were working owners while the remaining half were equally distributed between hired workers and ‘other workers’ i.e. unpaid family members and helpers. Statement 7B: Total number of workers categorised by nature of employment and percentage of workers by nature of employment over the last three rounds
Full-time workers Part-time workers Total workers NSS round number (in
’00) % to total workers
number (in ’00)
% to total workers
number (in ’00)
% to total workers
51st round (1994-95) 295942 89 36079 11 332021 10056th round (2000-01) 312541 84 58267 16 370808 10062nd round (2005-06) 298540 82 65889 18 364428 100
Source: Appendix Table 2, NSS Report No.479, and NSS Report No.433 Statement 7C: Total number of workers categorised by type of worker and percentage of workers by type of worker over the last two rounds
Working owners Hired workers Other workers Total workers NSS round number
(in ’00)% to total workers
number (in ’00)
% to total workers
number (in ’00)
% to total workers
number (in ’00)
% to total workers
56th round (2000-01) 199667 53 83459 23 87682 24 370808 10062nd round (2005-06) 187160 52 88647 24 88620 24 364428 100
51st round not compared because of different categorisation of type of workers. Source: Appendix Table 3, NSS Report No.479

NSS Report No. 525: Unorganised Manufacturing Sector in India, 2005-06: Employment, Assets and Borrowings 25
3.12 Percentage of workers by gender: Statement 8 gives the proportion of workers by gender in different industries separately for rural, urban and combined sector. At all India level, ‘manufacture of food products and beverages (Ind. Div. 15)’ had engaged the highest number of workers. Nearly 38 % of all workers were females with corresponding figures of 44 % in rural areas and 27 % in urban areas. Manufacture of tobacco products (Ind. Div. 16) had the highest proportion (76 %) of female workers followed by manufacture of chemicals and chemical products (Ind. Div. 24) (70 %) at the all-India level. In rural areas, Manufacture of Paper and Paper Products (Ind. Div. 21) had the highest proportion of female workers (82 %) whereas in urban areas Manufacture of tobacco products (Ind. Div. 16) had the highest proportion of female workers (75 %). Statement 8: Percentage of workers by gender in different industries and sector
percentage of workers by gender
rural urban all-India industry (NIC 2004)
Total no. of
workers % of
female % of male
Total no. of
workers% of
female % of male
Total no. of
workers % of
female % of male
(1) (2) (3) (4) (5) (6) (7) (8) (9) (10) 01405 12697 46.7 53.3 6972 10.4 89.6 19669 33.8 66.2
15 4963717 30.6 69.4 1382051 24.3 75.7 6345768 29.3 70.7 16 3421026 76.0 24.0 777490 74.7 25.3 4198516 75.7 24.3 17 3778731 55.8 44.2 2563813 34.8 65.2 6342544 47.3 52.7 18 2585780 46.5 53.5 2344051 36.1 63.9 4929831 41.6 58.4
19 92817 9.8 90.2 380781 11.3 88.7 473598 11.0 89.0 20 3525690 39.3 60.7 533384 18.7 81.3 4059074 36.6 63.4 21 185930 82.2 17.8 168289 41.6 58.4 354218 62.9 37.1 22 54036 15.7 84.3 356749 13.7 86.3 410785 14.0 86.0 23 18309 12.2 87.8 3821 5.4 94.6 22130 11.0 89.0
24 599357 72.4 27.6 264628 63.7 36.3 863984 69.7 30.3 25 86216 36.0 64.0 191104 18.6 81.4 277320 24.0 76.0 26 1963516 29.4 70.6 372592 24.0 76.0 2336108 28.6 71.4 27 33845 6.4 93.6 79015 5.5 94.5 112860 5.7 94.3 28 710893 8.4 91.6 947326 3.9 96.1 1658219 5.8 94.2
29 128634 6.3 93.7 451681 3.9 96.1 580315 4.5 95.5 30 57 0.0 100.0 10070 10.5 89.5 10128 10.4 89.6 31 88900 11.0 89.0 180219 8.9 91.1 269118 9.6 90.4 32 7814 16.3 83.7 15753 8.1 91.9 23567 10.8 89.2 33 5398 0.2 99.8 27403 9.0 91.0 32801 7.6 92.4
34 49041 0.8 99.2 43007 5.3 94.7 92049 2.9 97.1 35 12660 14.2 85.8 97885 3.2 96.8 110546 4.5 95.5 36 1129671 16.0 84.0 1775662 13.5 86.5 2905333 14.4 85.6 37 3548 24.6 75.4 10769 34.7 65.3 14317 32.2 67.8 all 23458286 43.9 56.1 12984514 27.3 72.7 36442799 38.0 62.0
For description of industries please see Table 0 at page 7. See Appendix table 2 for more detail.

NSS Report No. 525: Unorganised Manufacturing Sector in India, 2005-06: Employment, Assets and Borrowings 26
3.13 Statement 9 gives estimated total workers and percentage of female workers in different industries in the last two surveys. It is seen that at all-India level employment in unorganised manufacturing enterprises dropped by nearly 2%. Also employment dropped by 7 % from nearly 68 lakhs in 2000-01 to nearly 63 lakhs in 2005-06 in ‘manufacture of food products and beverages (Ind. Div. 15)’, which engaged the highest number of workers in the two survey periods. ‘Manufacture of wood and products of wood and cork, except furniture and manufacture of articles of straw and plating materials (Ind. Div. 20)’ also recorded a significant fall (22%) in employment from nearly 52 lakhs in 2000-01 to nearly 40 lakhs in 2005-06. It may be mentioned that high percentage increase in employment in the particular industry ‘Manufacture of office, accounting and computing machinery (Ind. Div. 30)’ is due to the fact that rural employment in the industry was almost nil in both survey periods (vide Report 479 and Statement 8) but employment rose sharply in urban areas from nearly 1,000 to 10,000. However, percentage of female workers registered a significant increase from 69% to 76% in ‘manufacture of tobacco products (Ind. Div. 16)’, which had the highest proportion of female workers, in both survey periods. At all-India level, proportion of female employees increased from 34% in 2000-01 to 38% in 2005-06. Statement 9: Estimated total workers and percentage of female workers in different industries in the last two surveys.
all-India Total number of workers (in ’00)
Percentage of female workers Industry (NIC 2004) 56th round
(2000-01) 62nd round (2005-06)
% change from 2000-01
to 2005-06 56th round (2000-01)
62nd round (2005-06)
01405 132 197 49.01 34.7 33.8 15 68420 63458 -7.25 27.3 29.3 16 34088 41985 23.17 69.3 75.7 17 61813 63425 2.61 43.2 47.3 18 45730 49298 7.80 31.1 41.6 19 3991 4736 18.67 10.4 11.0 20 52217 40591 -22.27 34.0 36.6 21 2519 3542 40.62 38.8 62.9 22 4801 4108 -14.44 9.1 14.0 23 220 221 0.59 10.6 11.0 24 5679 8640 52.14 52.6 69.7 25 3334 2773 -16.82 21.3 24.0 26 30503 23361 -23.41 34.2 28.6 27 1322 1129 -14.63 3.7 5.7 28 15858 16582 4.57 7.8 5.8 29 4920 5803 17.95 4.8 4.5 30 10 101 912.80 13.8 10.4 31 2540 2691 5.95 16.7 9.6 32 412 236 -42.80 16.0 10.8 33 317 328 3.47 7.1 7.6 34 1072 920 -14.13 2.6 2.9 35 639 1105 73.00 2.9 4.5 36 29903 29053 -2.84 19.5 14.4 37 369 143 -61.20 14.1 32.2 all 370808 364428 -1.72 33.7 38.0
Source: NSS Report no. 479, Statement 8

NSS Report No. 525: Unorganised Manufacturing Sector in India, 2005-06: Employment, Assets and Borrowings 27
3.14 Statement 10 gives the proportion of workers by gender in different States/ Uts separately for rural, urban and combined sector. Among the major states, Andhra Pradesh (51.6 %) had the highest proportion of female workers followed by Karnataka (51.1 %), Kerala (50.2%) &Tamil Nadu (48.9 %), Orissa (47.2%). In rural areas, top five major states having the highest proportion of female workers were Tamil Nadu (56.2 %), Andhra Pradesh (55.7 %), Karnataka (54.5 %) & West Bengal (53.1 %) Kerala (51.2%). In urban areas, top five major states having the highest proportion of female workers were Kerala(47.6%), Karnataka(44.6%) & Andhra Pradesh (42.7 %), Tamil Nadu (40.7%) & Madhya pradesh(38.3%). Statement 10: Percentage of workers by gender in different States/ UTs
Percentage of workers by gender rural urban rural +urban State /
UT Total no. of workers
% of female
% of male
Total no. of workers
% of female
% of male
Total no. of workers
% of female
% of male
(1) (2) (3) (4) (5) (6) (7) (8) (9) (10) Andhra Pradesh 2026591 55.7 44.3 912354 42.7 57.3 2938945 51.6 48.4
Arunachal Pradesh 2299 4.2 95.8 1002 18.3 81.8 3301 8.5 91.5 Assam 535424 37.4 62.6 97057 20.6 79.4 632481 34.8 65.2 Bihar 1205694 32.2 67.8 247379 28.6 71.4 1453073 31.6 68.4 Chhattisgarh 367408 27.7 72.3 90958 19.7 80.3 458366 26.1 73.9 Delhi 16426 6.0 94.0 440783 5.2 94.8 457208 5.3 94.7 Goa 13227 18.4 81.6 15260 25.7 74.3 28487 22.3 77.7 Gujarat 663699 25.2 74.8 1188434 16.4 83.6 1852132 19.5 80.5 Haryana 224349 21.6 78.4 319674 9.3 90.7 544024 14.4 85.6 Himachal Pradesh 146389 30.8 69.2 19044 15.2 84.8 165433 29.0 71.0 Jammu &Kashmir 252259 23.4 76.6 66610 25.0 75.0 318869 23.7 76.3 Jharkhand 843256 43.9 56.1 106089 16.8 83.2 949345 40.9 59.1 Karnataka 1294035 54.5 45.5 680334 44.6 55.4 1974369 51.1 48.9 Kerala 1008614 51.2 48.8 382393 47.6 52.4 1391006 50.2 49.8 Madhya Pradesh 1117202 37.3 62.7 623444 38.3 61.7 1740646 37.7 62.3 Maharashtra 1005229 32.9 67.1 1896188 16.9 83.1 2901417 22.4 77.6 Manipur 52991 76.9 23.1 28379 69.7 30.3 81370 74.4 25.6 Meghalaya 83285 35.2 64.8 7151 21.8 78.2 90437 34.1 65.9 Mizoram 4949 12.4 87.6 4498 34.4 65.6 9447 22.9 77.1 Nagaland 10939 48.8 51.2 5369 29.6 70.4 16307 42.5 57.5 Orissa 1826362 48.8 51.2 197179 32.1 67.9 2023541 47.2 52.8 Punjab 232288 45.8 54.2 368521 16.9 83.1 600810 28.1 71.9 Rajasthan 726405 22.5 77.5 568930 27.9 72.1 1295335 24.9 75.1 Sikkim 6406 22.4 77.6 1219 8.4 91.6 7626 20.1 79.8 Tamil Nadu 1783321 56.2 43.8 1586199 40.7 59.3 3369519 48.9 51.1 Tripura 131651 20.0 80.0 13209 19.0 81.0 144860 19.9 80.1 Uttaranchal 108194 8.1 91.9 39645 10.1 89.9 147838 8.7 91.3 Uttar Pradesh 3564111 37.0 63.0 1723790 21.3 78.7 5287901 31.9 68.1 West Bengal 4176111 53.1 46.9 1317722 28.2 71.8 5493833 47.1 52.9 A & N Islands 4390 26.5 73.5 1648 12.2 87.8 6037 22.6 77.4 Chandigarh 1468 17.2 82.8 1131 31.8 68.2 2599 23.6 76.4 D & N Haveli 1605 27.8 72.2 659 4.7 95.3 2264 21.0 79.0 Daman & Diu 6401 10.9 89.1 2149 49.4 50.6 8550 20.6 79.4 Lakshadweep 416 29.8 70.2 296 29.4 70.3 712 29.8 70.2 Pondicherry 14893 40.5 59.5 29816 24.6 75.4 44709 29.9 70.1 all-India 23458286 43.9 56.1 12984514 27.3 72.7 36442799 38.0 62.0 See Appendix Table 2 for more detail.

NSS Report No. 525: Unorganised Manufacturing Sector in India, 2005-06: Employment, Assets and Borrowings 28
3.15 Statement 11 gives the percentage distribution of workers by gender in different categories of workers, viz, working owner, hired worker and other worker considering all types of enterprises for all sectors combined. At all India level, 39 % of the working owners were female. About 59 % of the unpaid household workers / helpers and exchange labourers working for the enterprise without regular salary or wages, referred to as other workers, were found to be female whereas the proportion of hired female workers (15%) was much lower than for the other two categories of workers. The highest proportion of female working owners (83.9%) was found in Manipur followed by Karnataka(57.6%), Kerala(57.4%) and Andhra Pradesh (52.0%). Highest proportion of female hired workers among all State / UT s was noticed in Kerala (36.6%).
Statement 11: Percentage of workers by gender in different categories of workers by States/ UTs
Percentage of different types of worker by gender working owner hired worker other worker
State / UT Total no.
of workers
% of female
% of male
Total no. of
workers
% of female
% of male
Total no. of workers
% of female
% of male
(1) (2) (3) (4) (5) (6) (7) (8) (9) (10) Andhra Pradesh 1640947 52.0 48.0 623113 31.5 68.5 674885 69.4 30.6
Arunachal Pradesh 1006 11.2 88.7 1972 6 94 324 15.1 84.9 Assam 377268 31.4 68.6 102107 14.1 85.9 153106 57.2 42.8 Bihar 899960 20.6 79.4 80332 9.3 90.7 472781 56.3 43.7 Chhattisgarh 228465 9.7 90.3 57465 12.5 87.5 172436 52.5 47.5 Delhi 114785 12.2 87.8 323921 2.1 97.9 18502 17.9 82.1 Goa 13241 25.3 74.7 13035 15.1 84.9 2210 47.4 52.6 Gujarat 769046 25.4 74.6 803346 3.4 96.6 279741 49.8 50.2 Haryana 265912 19.1 80.9 208329 4.8 95.2 69783 24.8 75.2 Himachal Pradesh 122676 31.1 68.9 26270 9.4 90.6 16487 44.4 55.6 Jammu &Kashmir 197576 24.2 75.8 36092 4.4 95.6 85202 30.7 69.3 Jharkhand 629214 37.9 62.1 69027 5.6 94.4 251105 58 42 Karnataka 982857 57.6 42.4 603424 35.1 64.9 388088 59.5 40.5 Kerala 748587 57.4 42.6 490636 36.6 63.4 151783 59 41 Madhya Pradesh 922331 25.1 74.9 197718 8.5 91.5 620596 65.6 34.4 Maharashtra 1204326 31.6 68.4 1263905 6.5 93.5 433186 43.4 56.6 Manipur 55894 83.9 16.1 9463 9 91 16014 79.9 20.1 Meghalaya 44624 37.9 62.1 28954 23 77 16858 43.2 56.8 Mizoram 6396 21.3 78.7 2308 29 71 743 17.9 82.1 Nagaland 10607 45.2 54.8 2024 6.7 93.3 3677 54.5 45.5 Orissa 1073405 31.7 68.3 134014 20.0 80.0 816121 72 28 Punjab 335829 39 61 189300 3.4 96.6 75681 41.3 58.7 Rajasthan 703555 28 72 369867 5.9 94.1 221913 46.6 53.4 Sikkim 4881 19.2 80.8 1549 12.2 87.8 1196 34.3 65.7 Tamil Nadu 1544956 51.8 48.2 1111781 29.6 70.4 712783 72.4 27.6 Tripura 69143 21.4 78.6 43868 14 86 31849 24.6 75.4 Uttaranchal 78402 7.9 92.1 39210 2.2 97.8 30227 19.1 80.9 Uttar Pradesh 2740221 32.9 67.1 980567 4.8 95.2 1567113 47.1 52.9 West Bengal 2906631 49.7 50.3 1016765 10.4 89.6 1570437 66.1 33.9 A & N Islands 2339 13 87 2494 15.2 84.8 1204 56.9 43.1 Chandigarh 1665 32.1 67.9 823 1.1 99.0 111 62.2 37.8 D & N Haveli 1075 33.6 66.5 1087 2.5 97.6 101 88.1 11.9 Daman & Diu 3349 44 56 4615 0 100 586 49.3 50.9 Lakshadweep 419 22 78 135 3 97 157 73.9 26.1 Pondicherry 14445 30.7 69.3 25206 28.9 71.1 5058 32.5 67.4 all-India 18716034 38.9 61.1 8864723 15.0 85.0 8862043 58.9 41.1 See Appendix Table 3 for more detail.

NSS Report No. 525: Unorganised Manufacturing Sector in India, 2005-06: Employment, Assets and Borrowings 29
3.16 Statement 12 gives annual emoluments per hired worker by enterprise type for each industry. It revealed that for all NDMEs and DMEs combined, ‘manufacture of basic metals (Ind. Div. 27)’had the highest annual emoluments per hired worker for rural areas. For urban areas, ‘manufacture of machinery and equipment n.e.c. (Ind. Div. 29)’ paid the highest emoluments per hired worker for all NDMEs and DMEs combined. At the all-India level also,‘manufacture of machinery and equipment n.e.c. (Ind. Div. 29)’ paid the highest emoluments per hired worker for all NDMEs and DMEs combined. In general, DMEs paid more emoluments per hired worker than NDMEs. However, the difference was very significant for ‘ manufacture of tobacco products (Ind. Div. 16)’.
Statement 12: Annual emoluments (in Rs.) per hired worker by enterprise type for each industry
all-IndiaAnnual emoluments (Rs.) per hired worker
rural urban all-India industry
(NIC 2004) NDME DME NDME
+DME NDME DME NDME +DME NDME DME NDME+
DME
(1) (2) (3) (4) (5) (6) (7) (8) (9) (10) 01405 10597 24207 23100 20250 31261 25202 18746 26195 24035
15 14337 15382 15093 22234 26923 24282 17986 17716 1781416 12142 72415 45963 8580 44747 26756 10589 61918 3817117 16444 18598 17746 22983 28711 27289 19865 25525 2381718 15107 20912 15966 20478 31297 25634 18688 30392 23362
19 16528 17746 17527 22598 25071 24117 22181 23793 2321720 19668 27511 22269 24188 31845 27152 21811 29827 2469021 8256 17885 15929 23865 30979 27756 21982 26941 2498522 17513 26811 24074 23160 43757 35443 22577 41086 3389123 20552 34954 28435 13413 23580 21221 19846 32329 27164
24 19836 15351 15686 21440 32541 31122 20627 21345 2127725 24562 29275 27514 31729 34545 33515 29869 33212 3198226 24296 24239 24245 25491 25643 25590 24814 24421 2447527 20941 74087 55236 23428 40767 35341 22721 49014 4050128 24424 31552 26139 26680 70366 51266 26033 66869 46541
29 22062 37328 28822 31154 55398 47974 30103 54605 4669030 - - - 17493 44421 42136 17493 44421 4213631 13048 152665 45427 25757 31936 29257 21822 43280 3252532 27591 46933 45369 22007 29668 28422 23094 35673 3396333 24563 28890 24990 32332 50644 42793 29617 49725 39169
34 26968 31693 31409 26060 39939 34730 26216 34495 3285835 17337 31552 26325 33628 28110 29175 31881 28272 2900636 22370 27516 25293 24316 30346 28303 23644 29605 2742337 22503 30898 29018 28401 21563 22723 26343 24130 24540all 17957 21404 20233 23860 35974 31302 21576 29635 26682
For description of industries please see Table 0 at page 7. See Appendix Table 5 for more detail.

NSS Report No. 525: Unorganised Manufacturing Sector in India, 2005-06: Employment, Assets and Borrowings 30
3.17 Statement 13 gives annual emoluments per hired worker by enterprise type for each state. It reveals that among the major states, Chhatisgarh followed by Haryana had the highest annual emoluments per hired worker for rural areas for all NDMEs and DMEs combined and correspondingly for urban areas, Maharashtra followed by Gujarat paid the highest emoluments per hired worker. For both sectors combined also, Maharashtra paid the highest emoluments per hired worker among the major states for all NDMEs and DMEs combined.
Statement 13: Annual emoluments (in Rs.) per hired worker by enterprise type for each State/UTs
Annual emoluments (Rs) per hired worker rural urban rural +urban
State/UT NDME DME NDME
+DME NDME DME NDME +DME NDME DME NDME+
DME
(1) (2) (3) (4) (5) (6) (7) (8) (9) (10) Andhra Pradesh 18404 10253 11747 17594 21254 19089 17910 12402 14147 Arunachal Pradesh 36156 12091 18147 30072 32943 31418 34251 14576 20504 Assam 17573 18981 18059 16213 13482 15145 17046 16588 16879 Bihar 8985 14698 9925 18321 17706 18176 14050 16657 14586 Chhattisgarh 14836 41075 37667 22369 23406 22868 21046 34114 29671 Delhi 26876 107618 81629 27124 32888 31004 27114 35812 32972 Goa 31855 43887 40471 24244 30576 27324 26572 37764 33156 Gujarat 17485 25188 24244 29701 35319 34332 27810 33105 32233 Haryana 29840 35210 33049 29181 37737 33199 29329 36910 33157 Himachal Pradesh 23708 29785 26513 27651 42951 36240 24913 35007 29925 Jammu & Kashmir 26881 30418 28365 29124 44804 36457 27991 38236 32545 Jharkhand 18785 19410 18922 19157 21460 20423 18958 21034 19826 Karnataka 18561 14836 15329 25770 31993 29368 23295 19732 20590 Kerala 25532 26197 25847 24994 31010 28398 25389 27844 26621 Madhya Pradesh 24155 18327 19859 11853 32246 18542 15177 22780 19182 Maharashtra 22194 34454 30641 30956 38418 36415 29410 37830 35514 Manipur 20127 47429 31444 25486 26247 25754 23219 36592 28303 Meghalaya 22788 28136 25854 27644 26305 27189 23713 27985 26031 Mizoram 26005 38419 27870 31493 17918 26677 30689 18991 26815 Nagaland 18993 19120 18997 29048 35989 30782 26300 35341 28117 Orissa 9827 23430 16703 18190 17878 18018 12756 21240 17194 Punjab 17767 37849 24009 25184 36900 30107 23852 37014 29159 Rajasthan 21299 28534 26992 28951 32289 30943 26411 30210 29028 Sikkim 30972 40733 35089 24293 24857 24443 28431 37024 31618 Tamil Nadu 18348 22014 20842 22897 29219 26765 21034 25735 24058 Tripura 6114 41313 22500 14644 27721 18102 7404 40382 21996 Uttaranchal 21408 34860 27395 19570 17292 18859 20562 29140 23914 Uttar Pradesh 13234 18546 16902 20932 67220 44099 18337 41366 31837 West Bengal 13209 21146 17068 18950 27526 23867 15918 24714 20592 A & N Islands 36694 38990 37815 40209 43947 42169 38188 41274 39744 Chandigarh 36112 35431 35788 12580 64608 34166 22932 49978 34924 D & N Haveli 21702 35106 27070 28646 11564 18223 23701 23653 23678 Daman & Diu 26121 39144 38306 25458 63016 36297 25794 39774 38144 Lakshadweep 28771 59143 37870 56636 46595 53679 42285 53133 45508 Pondicherry 29203 29843 29643 30708 28315 29312 30296 28882 29422 all-India 17957 21404 20233 23860 35974 31302 21576 29635 26682
See Appendix Table 5 for more detail.

NSS Report No. 525: Unorganised Manufacturing Sector in India, 2005-06: Employment, Assets and Borrowings 31
3.18 Fixed assets: Fixed assets mean assets of an enterprise in the form of land, building, other construction, plant & machinery, transport equipment, tools and other fixed assets (new or used) that have a normal economic life of more than one year from the date of acquisition, i.e., through outright purchase/hire purchase/loan/ mortgage and / or construction. Only the assets which were held by the enterprise for the purpose of producing goods or providing services and not held for resale in the normal course of business were considered. 3.19 Statement 14 presents the estimated value of total fixed assets owned per enterprise and total fixed assets hired per enterprise for different enterprise types. At all India level, the estimated market value of owned assets per enterprise was estimated as Rs.58166 and that of hired assets was Rs.25614. The market value of owned assets per enterprise in rural areas was about 27% of that in the urban areas. In rural areas hired assets constituted about 15% of total assets used by unorganised manufacturing enterprises. In urban areas, however, about 38% of total assets used was hired assets. At all India level, hired assets had a share of 30% of total assets used in unorganised manufacturing enterprises. 3.20 Statement 15 presents the estimated value by enterprise types of total fixed assets owned per enterprise over the last three survey periods. All value figures are at current prices. It is seen that percentage growth of fixed assets owned per enterprise were the highest for DMEs followed by NDMEs and OAMEs both for the period from 2000-01 to 2005-06 and also the period from 1994-95 to 2000-01. Statement 14: Market value (Rs.) of fixed assets per enterprise during 2004-05 by
enterprise type Value of fixed assets per enterprise
rural urban all-India enterprise type
owned hired owned hired owned hired (1) (2) (3) (4) (5) (6) (7)
OAME 19222 2480 41839 25863 24646 8088NDME 103132 37691 187870 139094 152196 96405DME 399359 51683 614061 324736 528423 215823all 32975 5757 119980 74341 58166 25614 See Appendix Table 6 for more detail. Statement 15: Per enterprise market value (Rs.) of fixed assets owned by enterprise types in the last three survey periods. enterprise type
51st round (1994-95)
56th round (2000-01)
62nd round (2005-06)
% change from
51st to 56th
% change from
56th to 62nd (1) (2) (3) (4) (5) (6)
OAME 11512 19342 24646 68 27 NDME 65027 114445 152196 76 33 DME 201545 378014 528423 87 40 all 25990 42535 58166 64 37 See Appendix Table 6, NSS Report No.479, and NSS Report No.435.

NSS Report No. 525: Unorganised Manufacturing Sector in India, 2005-06: Employment, Assets and Borrowings 32
3.21 Statement 16 gives the percentage distribution of estimated market value of fixed assets per enterprise as on date of survey by type of assets for enterprise type. It reveals that ‘land and building’ was the major constituent of fixed assets used in unorganised manufacturing enterprises. It covered about 70% of total owned assets of all enterprises and 98% of hired assets of the same. Besides ‘land and building’, ‘plant and machinery’ (21%) was the only item having noteworthy share in the total fixed assets owned and this holds good for enterprises in both rural and urban areas. All remaining fixed assets including ‘software and hardware’ constituted 9% of total owned fixed assets of all enterprises. 3.22 Statement 17 gives the percentage share of different items of owned fixed assets over the last three rounds. It is seen that while proportionate share of ‘land and building’ had shown an increasing trend over the three survey periods, share of ‘plant and machinery’ had shown a declining trend. Statement 16: Percentage distribution of per enterprise estimated market value of owned and hired
fixed assets as on date of survey by type of assets for enterprise type
for fixed assets on date of survey percentage to total owned percentage to total hired
Enter-prise type land and
building plant and
mach-inery
Trans-port equip-ment
tools and all other fixed assets
all land and building
plant and machinery
Trans-port equip-ment
tools and all
other fixed assets
all
(1) (2) (3) (4) (5) (6) (7) (8) (9) (10) (11) rural
OAME 78.6 16.2 1.6 3.7 100.0 96.9 3.0 0.0 0.1 100.0 NDME 66.6 25.4 3.7 4.3 100.0 98.2 1.6 0.1 0.1 100.0 DME 51.7 35.6 8.3 4.4 100.0 92.5 7.2 0.2 0.1 100.0 all 68.9 23.3 3.8 4.0 100.0 96.5 3.3 0.1 0.1 100.0
urban OAME 84.1 10.5 1.7 3.7 100.0 99.1 0.8 0.0 0.1 100.0 NDME 72.6 17.7 5.1 4.6 100.0 98.9 1.1 0.0 0.0 100.0 DME 60.7 27.6 7.1 4.6 100.0 96.9 2.9 0.1 0.1 100.0 all 70.3 20.2 5.1 4.4 100.0 98.2 1.7 0.0 0.1 100.0
all-India OAME 80.8 13.9 1.6 3.7 100.0 98.6 1.3 0.0 0.1 100.0 NDME 70.9 19.9 4.7 4.5 100.0 98.8 1.1 0.0 0.0 100.0 DME 58.0 30.0 7.5 4.5 100.0 96.5 3.4 0.1 0.1 100.0 all 69.8 21.4 4.6 4.2 100.0 97.9 1.9 0.0 0.1 100.0 See Appendix Table 6 for more detail. Statement 17 : Percentage distribution of estimated per enterprise market value of owned fixed
assets as on date of survey by type of assets over the last three survey periods NSS round land and
building plant and
machinery Transport equipment
tools and all other
all
51st (1994-95) 64.5 25.4 3.3 6.8 100.0 56th (2000-01) 68.5 22.9 4.1 4.5 100.0 62nd (2005-06) 69.8 21.4 4.6 4.2 100.0 Source: Appendix Table 6, NSS Report No.479, and NSS Report No.435.

NSS Report No. 525: Unorganised Manufacturing Sector in India, 2005-06: Employment, Assets and Borrowings 33
3.23 Statement 18 gives per enterprise fixed assets owned, net addition to fixed assets industry-wise in descending order. It reveals that ‘manufacture of other transport equipment’ (Ind. Div. 35) had highest fixed assets owned per enterprise. However, Manufacture of Medical, Precision and Optical Instruments, Watches and Clocks’ (Ind. Div. 33) had the highest percentage (19%) of ‘net addition to owned fixed assets’ per enterprise to ‘total fixed assets owned’ per enterprise.
Statement 18: Industry-wise per enterprise fixed assets owned, net addition to fixed assets owned and percentages of net addition to fixed assets owned. Industry division (NIC 2004)
fixed assets owned (in descending order) as on the date of survey (Rs.)
net addition to owned fixed assets during last 365 days (Rs.)
Col. 4= (Col. 3÷Col.2) x
100
(1) (2) (3) (4)35 567863 32653 5.7527 441197 37358 8.4734 348694 50157 14.3822 304578 29931 9.8330 301109 27109 9.0025 299323 23063 7.7133 279204 53348 19.1132 270518 15199 5.6229 260432 15511 5.9623 254066 3916 1.54
01405 180666 2851 1.5837 155635 8761 5.6328 134744 3972 2.9531 123257 3754 3.0526 84450 2737 3.2415 82759 2437 2.9436 80843 3657 4.5217 64392 1230 1.9119 63352 2703 4.2721 52946 1759 3.3224 52456 1347 2.5718 30686 605 1.9720 25320 410 1.6216 10176 14 0.14all 58166 1989 3.42
For description of industries please see Table 0 at page 7. See Appendix Tables 6 & 7 for more detail.

NSS Report No. 525: Unorganised Manufacturing Sector in India, 2005-06: Employment, Assets and Borrowings 34
3.24 Statement 19 gives per enterprise fixed assets owned and net addition to fixed assets state-wise in descending order. It reveals that among the major states Haryana had the highest fixed assets owned per enterprise. However, Uttaranchal had the highest ‘net addition to owned fixed assets’ per enterprise among major states. It had the highest percentage (12%) of ‘net addition to owned fixed assets’ per enterprise to ‘total fixed assets owned’ per enterprise.
Statement 19: State-wise fixed assets owned, net addition to fixed assets owned and percentages of net addition to fixed assets owned.
State/UT
fixed assets owned per enterprise (in descending order) as on the date of survey (Rs.)
net addition to fixed assets owned per enterprise during last 365 days (Rs.)
Col. 4= (Col. 3÷Col.2) x 100
(1) (2) (3) (4)Delhi 297509 3036 1.02 Haryana 269852 11399 4.22 Goa 256677 46173 17.99 Pondicherry 185577 12946 6.98 Daman & Diu 184307 68 0.04 Chandigarh 174218 6724 3.86 Punjab 147312 3350 2.27 Maharashtra 122566 5977 4.88 Gujarat 115165 2629 2.28 Mizoram 110708 542 0.49 Uttaranchal 109933 13278 12.08 A & N Islands 104737 4282 4.09 Arunachal Pradesh 92489 2133 2.31 D & N Haveli 80150 2083 2.60 Jammu & Kashmir 78662 548 0.70 Kerala 78119 3413 4.37 Tamil Nadu 74794 2736 3.66 Chhattisgarh 73472 6404 8.72 Himachal Pradesh 72047 2290 3.18 Rajasthan 70882 649 0.92 Karnataka 61207 2040 3.33 Lakshadweep 51312 628 1.22 Uttar Pradesh 48798 1601 3.28 Nagaland 43965 234 0.53 Sikkim 39414 647 1.64 Andhra Pradesh 37596 1678 4.46 Manipur 34511 255 0.74 Madhya Pradesh 33414 496 1.48 Meghalaya 33374 71 0.21 Bihar 27215 234 0.86 West Bengal 25134 725 2.88 Tripura 23519 582 2.47 Assam 22719 860 3.79 Jharkhand 16522 80 0.48 Orissa 14040 313 2.23 all-India 58166 1989 3.42
See Appendix Tables 6 & 7 for more detail.

NSS Report No. 525: Unorganised Manufacturing Sector in India, 2005-06: Employment, Assets and Borrowings 35
3.25 Statement 20 gives outstanding loan per enterprise as on the last date of the reference year by State/Uts in descending order. It is seen that among the major states Maharashtra had the highest outstanding loan per enterprise followed by Haryana, Kerala Chhattisgarh, Uttaranchal. However, lowest outstanding loan was reported from Bihar followed by Jharkhand , Assam, Orissa, Andhra Pradesh. Statement 20: Outstanding loans per enterprise (in Rs.) as on last date of reference year for State/UTs
Outstanding loans per enterprise State/UTs
rural urban rural + urban (in descending order)
Goa 131489 38430 79470 Maharashtra 11018 144850 78773 Chandigarh 10200 127802 63347 D & N Haveli 280 347709 61887 Haryana 41526 69371 54888 Pondicherry 110688 12262 41693 Delhi 52274 40933 41356 Kerala 30260 44051 33734 A & N Islands 25504 10643 22655 Chhattisgarh 20737 19617 20549 Uttaranchal 19451 10137 17409 Punjab 6126 29066 17315 Gujarat 2603 28804 16762 Lakshadweep 2683 35132 14268 Arunachal Pradesh 10499 17555 13111 Rajasthan 6036 22001 11946 Himachal Pradesh 7262 64451 10991 Tamil Nadu 5226 12180 8189 Jammu & Kashmir 2033 25861 6560 Uttar Pradesh 1473 15690 5419 Madhya Pradesh 1819 11698 5173 Karnataka 2468 9467 4641 West Bengal 2447 11201 4129 Andhra Pradesh 2415 6101 3492 Sikkim 3014 5526 3271 Orissa 998 10808 1883 Nagaland 1713 1695 1708 Tripura 1362 2599 1538 Assam 790 6457 1367 Mizoram 1567 440 1167 Manipur 160 1882 709 Meghalaya 177 7793 686 Jharkhand 195 4062 497 Bihar 177 1160 316 Daman & Diu 43 167 98 all-India 4634 31966 12548 See Appendix Table 8 for more detail.

NSS Report No. 525: Unorganised Manufacturing Sector in India, 2005-06: Employment, Assets and Borrowings 36
3.26 Charts 3 & 4 give comparative pictures of outstanding loan per enterprise (Rs.’000) in 56th round and 62nd round. It is seen that Bihar had the lowest outstanding loan per enterprise followed by Jharkhand in both 2000-01 and 2005-06. However, top two states having the highest outstanding loan per enterprise were Maharashtra & Kerala in 2000-01 and Maharashtra & Haryana in 2005-06.
Chart 3: Estimated outstanding loan per enterprise (Rs ’000) in major States (2000-01)
0
2
4
6
8
10
12
14
16
BHRJR
KORS
ASM WBUTC AP MP
CTGJ &
K RAJ UPKTK
ALL TNHAR
GUJPUN
KERMAH
State
outs
tand
ing
loan
per
ent
erpr
ise
(Rs.
000)
Source: NSS Report No. 477 and Statement 20.
Chart 4: Estimated outstanding loan per enterprise(Rs.'000) in major States ( 2005-06)
0
10
20
30
40
50
60
70
80
90
BHR JRK ASM ORS AP WB KTK MP UP J& K TN RAJ GUJ PUN UTC CTG KER HAR MAH
State
Out
stan
ding
loan
per
ent
erpr
ise
(Rs.
'000
)

NSS Report No. 525: Unorganised Manufacturing Sector in India, 2005-06: Employment, Assets and Borrowings 37
3.27 Statement 21 gives the percentage share of outstanding loan per enterprise by source of loan separately for each enterprise type and sector. Here ‘other institutional agencies’ include agencies like Khadi and Village Industries Commission (KVIC), Life Insurance Corporation (LIC), Chit Funds etc. not covered under column 2. It is seen from Statement 21 that mainly central and state level term lending institution, banks and other societies provided loans to unorganised manufacturing enterprises. About 49% of total loan of all enterprises was provided by the above-mentioned agencies. Moneylenders had significant share of loan advanced to OAMEs in respect of rural, urban and combined sectors, the percentages being respectively 26%, 12% & 18%. For OAMEs, borrowings made from friends and relatives were also noteworthy. In respect of rural, urban and combined sectors, these percentages were 18%, 11% and 14% respectively. Also, the agency ‘others’ not covered under cols. 2 to 7 disbursed loans significantly in urban areas. At all-India level, DMEs (59%) availed of higher credit facilities from government financial agencies than NDMEs (28%) & OAMEs (39%). Statement 21: Percentage distribution of outstanding loan per enterprise by source of
loan by enterprise type separately for each sector and for all sector combined
agency from which loan is taken Ent. type
central and state level term
lending institution,
banks and other societies
other institutional
agencies
money lenders
business partner
supplier / contractor
friends and
relatives
others all
(1) (2) (3) (4) (5) (6) (7) (8) (9) rural
OAME 45.3 3.5 25.6 0.2 3.0 18.5 4.1 100.0NDME 69.9 7.8 8.1 0.7 2.9 10.1 0.4 100.0DME 56.0 19.9 7.7 6.5 1.3 5.9 2.7 100.0all 57.3 15.9 9.8 4.7 1.8 8.1 2.5 100.0
urban OAME 33.7 4.2 11.6 1.3 2.1 11.5 35.8 100.0NDME 19.8 1.9 4.1 0.5 1.2 6.3 66.2 100.0DME 60.5 4.4 10.2 4.3 2.3 7.7 10.6 100.0all 45.9 3.6 8.3 2.9 1.9 7.5 29.9 100.0
all-India OAME 38.6 3.8 17.5 0.8 2.4 14.5 22.4 100.0NDME 28.1 2.8 4.8 0.5 1.5 6.9 55.3 100.0DME 59.2 8.8 9.5 4.9 2.0 7.2 8.4 100.0all 48.9 6.8 8.7 3.4 1.9 7.6 22.7 100.0See Appendix Table 9 for more detail.

NSS Report No. 525: Unorganised Manufacturing Sector in India, 2005-06: Employment, Assets and Borrowings 38
3.28 Statement 22 shows percentage of annual interest payable on loan amount per enterprise by each source agency of loan. Interest was the highest for moneylenders i.e. moneylenders charged more interest on loan advanced than central and state level term lending institution, banks and other societies. It can be seen from Statement 21 that highest outstanding loan advanced was from central and state level term lending institution, banks and other societies but its percentage of interest payable to total outstanding loan per enterprise was less than that of moneylenders. It may be mentioned here that high percentage values recorded for certain industry x agency of loan combination were due to the fact that outstanding loan as on the last date of the reference year could be sometimes smaller than annual interest payable during the reference period. Statement 22: ‘Annual interest payable as a percentage of loan amount outstanding’ per enterprise by agency of loan and industry for all sector combined
agency from which loan is taken
industry (NIC 2004)
central and state level term
lending institution,
banks and other societies
other institutional
agencies
money lenders
business partner
supplier / contractor
friends and
relatives
others all
01405 39.0 4.7 49.0 14.9 0.8 X 0.0 35.0 15 18.5 6.9 41.4 15.9 10.3 X 21.2 16.9 16 73.1 0.0 33.3 15.0 0.0 X 0.0 37.7 17 12.9 8.9 19.9 21.3 19.3 X 14.3 12.3 18 12.9 30.7 16.8 13.5 36.4 X 8.7 12.8 19 10.5 98.0 40.8 6.2 16.7 X 8.8 15.5 20 22.7 39.8 24.2 8.1 6.1 X 21.7 21.1 21 16.1 42.5 14.9 7.5 7.0 X 6.9 10.5 22 12.2 12.5 14.7 7.3 2.8 X 7.4 9.8 23 11.4 0.0 91.2 9.2 0.0 X 74.0 22.8 24 13.0 62.3 26.6 10.0 3.4 X 12.3 16.4 25 12.5 13.6 19.7 7.6 4.5 X 7.9 10.1 26 21.8 13.9 27.0 10.0 21.0 X 11.1 18.8 27 12.4 67.7 16.2 5.9 4.6 X 16.5 19.6 28 34.8 15.5 28.9 10.0 3.2 X 9.7 26.7 29 18.1 8.5 25.8 27.7 0.5 X 10.1 13.7 30 7.2 5.1 2.7 0.0 0.0 X 22.0 7.1 31 13.1 13.5 17.4 9.9 6.2 X 10.0 9.9 32 4.0 22.7 19.9 0.0 0.0 X 7.8 5.1 33 16.6 12.4 8.9 8.5 2.1 X 6.4 13.4 34 18.6 9.0 31.2 9.9 102.7 X 6.8 17.9 35 15.8 17.4 11.7 11.0 0.3 X 6.4 12.5 36 10.6 18.0 35.4 17.5 1.6 X 11.0 11.1 37 12.8 33.0 19.7 0.0 8.7 X 12.6 13.4 all 16.8 14.9 26.7 13.2 7.2 X 11.2 14.7
For description of industries please see Table 0 at page 7. See Appendix Table 9 for more detail.

NSS Report No. 525: Unorganised Manufacturing Sector in India, 2005-06: Employment, Assets and Borrowings 39
3.29 Statement 23 shows comparative percentages of annual interest payable on loan amount per enterprise by each source agency of loan in the last two survey periods. It reveals that moneylenders charged highest interest rates on loans advanced not only in 2005-06 (29%) but also in 2000-01 (26%). Also the interest rates charged by moneylenders were significantly higher than other agencies both in 2005-06 and 2000-01. However, for most of the agencies annual interest receivable as a percentage of outstanding loans registered a fall in 2005-06 when compared with 2000-01. Statement 23: ‘Annual interest payable as a percentage of loan amount
outstanding’ per enterprise by agency of loan for all sector combined over last two rounds.
agency from which loan is taken
NSS round
central and state level
term lending institution, banks and
other societies
other institutional
agencies
money lenders
business partner
supplier / contractor
friends and
relatives
others all
56th round (2000-01) 15.9 15.8 25.5 14.0 8.6 X 19.5 16.562nd round (2005-06) 16.8 14.9 26.7 13.2 7.2 X 11.2 14.751st round not compared because of non-availability of data of interest component.

NSS Report No. 525: Unorganised Manufacturing Sector in India, 2005-06: Employment, Assets and Borrowings 40
3.30 Statement 24 presents the all-India estimates of important characteristics at a glance. Statement 24: Important characteristics (all-India) over the last three rounds at a glance. 51st round
(1994-95) 56th round (2000-01)
62nd round (2005-06)
Estimated number of enterprises 14504111 17024104 17070820
Estimated number of workers 33202646 37080791 36442799
Average number of workers per enterprise 2.29 2.17 2.13
Percentage of hired workers 20 23 24
Percentage of full-time workers 89 84 82
Percentage share of females in total number of workers
31.1 33.7 38.0
Manipur 75.2 Manipur 74.2 Manipur 74.4 Kerala 42.3 Kerala 48.8 Andhra Pradesh 51.6 Lakshadweep 35.8 Tamil Nadu 44.1 Karnataka 51.1 Tamil Nadu 35.7 Orissa 43.9 Kerala 50.2
Top five states according to share of female workers in the respective states
Karnataka 31.6 Karnataka 43.8 Tamil Nadu 48.9 Value (Rs.) of fixed assets owned per enterprise
• OAME • NDME • DME • Combined
• 11512 • 65027 • 201545 • 25990
• 19342 • 114445 • 378014 • 42535
• 24646 • 152196 • 528423 • 58166
Outstanding loan (Rs.) per enterprise
• OAME • NDME • DME • Combined
• 419 • 5647 • 50012 • 3233
• 548 • 9548 • 96170 • 5087
• 1023 • 34440 • 201101 • 12548
Source: NSS Report No. 433, NSS Report No. 435, NSS Report No. 479

Appendix A Detailed Tables

Appendix A
NSS Report No. 525: Unorganised Manufacturing sector in India, 2005-06: Employment, Assets and Borrowings. A - 1
Table 1: Number of first stage units allotted and surveyed for each State/UT
area-frame villages/blocks rural urban rural + urban
list-frame enterprises (urban only) State/ UT
allotted surveyed allotted surveyed allotted surveyed allotted surveyed(1) (2) (3) (4) (5) (6) (7) (8) (9)
Andhra Pradesh 376 376 296 296 672 672 355 46Arunachal Pradesh 71 71 24 24 95 95 1 1Assam 238 238 112 111 350 349 36 13Bihar 303 303 200 200 503 503 20 2Chhatisgarh 72 71 64 64 136 135 74 21 Delhi 12 12 76 76 88 88 365 110Goa 16 16 24 24 40 40 13 2Gujarat 161 161 256 256 417 417 128 27Haryana 112 112 96 96 208 208 660 222Himachal Pradesh 145 137 72 71 217 208 24 14 Jammu & Kashmir 152 115 200 180 352 295 67 39Jharkhand 160 160 144 144 304 304 14 4Karnataka 195 195 204 204 399 399 403 73Kerala 283 280 160 159 443 439 154 46Madhya Pradesh 217 217 296 295 513 512 272 115 Maharashtra 238 238 560 560 798 798 1346 477Manipur 56 56 64 64 120 120 1 0Meghalaya 57 57 40 40 97 97 7 3Mizoram 39 39 64 64 103 103 1 1Nagaland 47 47 32 32 79 79 17 0 Orissa 229 229 148 148 377 377 85 23Punjab 136 136 216 216 352 352 941 173Rajasthan 237 237 284 284 521 521 491 196Sikkim 38 38 22 22 60 60 1 0Tamil Nadu 304 304 368 368 672 672 1006 195 Tripura 103 103 80 80 183 183 0 0Uttaranchal 57 57 40 39 97 96 43 5Uttar Pradesh 385 385 576 576 961 961 983 248West Bengal 336 336 352 352 688 688 390 177A & N Islands 32 32 16 16 48 48 1 0 Chandigarh 4 4 16 16 20 20 53 13D & N Haveli 8 8 8 8 16 16 15 5Daman & Diu 8 8 8 8 16 16 0 0Lakshadweep 4 4 16 16 20 20 1 1Pondicherry 16 16 16 16 32 32 32 8all-India 4847 4798 5150 5125 9997 9923 8000 2260

Appendix A
NSS Report No. 525: Unorganised Manufacturing sector in India, 2005-06: Employment, Assets and Borrowings. A - 2
Table 2: Number of workers by nature of employment and gender for each industry Rural OAME all-India
number of workers full time part time all
number of enterprises
industry (NIC 2004) female male all female male all female male all estimated sample (1) (2) (3) (4) (5) (6) (7) (8) (9) (10) (11) (12)
01405 1082 2556 3638 4027 598 4625 5109 3154 8263 6063 39 15 630859 1697670 2328529 455465 532115 987580 1086324 2229785 3316109 1777603 6309 16 2130912 667596 2798508 454618 133189 587807 2585530 800785 3386315 2336177 1594 17 1068175 847302 1915478 726988 160697 887685 1795164 1007999 2803163 1589000 2970 18 704961 931633 1636594 434943 140443 575385 1139904 1072076 2211979 1815185 7508
19 1173 35188 36361 1289 6917 8205 2461 42105 44567 32729 160 20 935205 1567914 2503119 432793 315847 748640 1367998 1883761 3251759 1836581 4965 21 133178 9654 142832 12663 4075 16739 145842 13729 159571 102294 122 22 1774 8383 10157 1281 2436 3717 3055 10819 13874 9750 114 23 367 3723 4090 582 1660 2242 949 5383 6332 2455 29
24 276525 18023 294549 89079 30430 119509 365604 48453 414058 279805 360 25 11149 11836 22985 4638 3242 7880 15788 15078 30865 15074 81 26 220412 597431 817844 169557 97588 267145 389969 695019 1084988 458791 2011 27 89 10925 11014 559 521 1081 649 11446 12095 9608 64 28 19760 354304 374064 35113 77838 112951 54873 432142 487014 302545 1578
29 2995 70882 73877 4474 16007 20481 7469 86889 94359 58709 380 30 0 57 57 0 0 0 0 57 57 57 1 31 397 45013 45409 34 9162 9196 430 54174 54605 43847 301 32 0 1379 1379 0 0 0 0 1379 1379 1379 9 33 0 202 202 0 0 0 0 202 202 110 4
34 0 660 660 64 495 559 64 1156 1220 651 11 35 0 6287 6287 413 100 513 413 6388 6800 4482 28 36 67901 419267 487168 74101 70056 144157 142002 489323 631325 425621 2422 37 0 205 205 205 0 205 205 205 410 205 1 all 6206915 7308090 13515006 2902885 1603417 4506302 9109800 8911508 18021308 11108720 31061

Appendix A
NSS Report No. 525: Unorganised Manufacturing sector in India, 2005-06: Employment, Assets and Borrowings. A - 3
Table 2: Number of workers by nature of employment and gender for each industry Rural NDME all-India
number of workers full time part time all
number of enterprises
industry (NIC 2004) female male all female male all female male all estimated sample (1) (2) (3) (4) (5) (6) (7) (8) (9) (10) (11) (12)
01405 0 410 410 0 130 130 0 540 540 233 5 15 36828 469800 506628 25823 70852 96676 62652 540652 603304 185605 1576 16 6131 11010 17142 970 829 1799 7101 11840 18940 5199 50 17 111044 315753 426798 49071 11894 60965 160115 327648 487763 129161 547 18 33662 276752 310415 13036 12300 25336 46699 289052 335751 124596 1110
19 498 9570 10068 55 523 578 553 10093 10647 3164 34 20 4185 189757 193941 1398 12289 13686 5582 202045 207628 70010 674 21 430 215 644 4728 1556 6285 5158 1771 6929 1736 15 22 4083 10897 14979 967 398 1366 5050 11295 16345 5897 84 23 1 4162 4163 22 1619 1640 23 5781 5803 1756 15
24 3299 12222 15521 1081 119 1200 4380 12340 16721 3943 89 25 4948 17575 22523 708 1800 2508 5656 19375 25031 7104 89 26 18435 92442 110877 3238 7343 10580 21673 99785 121458 32220 366 27 0 8467 8467 394 89 484 394 8557 8951 2598 46 28 3175 173466 176641 611 7421 8032 3786 180887 184674 62155 685
29 2 21846 21848 83 385 469 85 22231 22317 8017 139 30 - - - - - - - - - - 0 31 8445 18072 26517 43 1283 1326 8488 19355 27843 7903 110 32 0 832 832 0 76 76 0 909 909 252 2 33 0 4712 4712 0 0 0 0 4712 4712 1153 3
34 1 4228 4229 0 1 1 1 4229 4230 1319 30 35 0 2533 2533 108 128 236 108 2661 2769 1062 33 36 3783 246916 250699 2257 16850 19107 6040 263766 269806 89891 1028 37 421 487 908 0 0 0 421 487 908 293 8 all 239372 1892124 2131496 104594 147888 252481 343966 2040012 2383977 745269 6738

Appendix A
NSS Report No. 525: Unorganised Manufacturing sector in India, 2005-06: Employment, Assets and Borrowings. A - 4
Table 2: Number of workers by nature of employment and gender for each industry Rural DME all-India
number of workers full time part time all
number of enterprises
industry (NIC 2004) female male all female male all female male all estimated sample (1) (2) (3) (4) (5) (6) (7) (8) (9) (10) (11) (12)
01405 702 2957 3660 121 113 234 823 3070 3894 284 19 15 313251 610758 924010 59099 61195 120294 372351 671953 1044304 112057 772 16 6147 8795 14942 693 136 829 6840 8931 15771 1277 25 17 114998 330966 445963 36431 5411 41842 151428 336377 487805 47378 460 18 14880 19632 34512 448 3089 3537 15328 22722 38050 3780 63
19 5278 25104 30382 820 6402 7222 6098 31506 37604 2462 23 20 12713 51125 63838 338 2127 2465 13052 53252 66303 7962 200 21 1667 17485 19152 259 20 278 1925 17504 19430 2262 47 22 302 23296 23598 70 149 219 373 23445 23818 1943 28 23 902 4112 5014 362 798 1160 1264 4910 6174 638 20
24 61821 101944 163764 2144 2670 4814 63964 104614 168578 13570 270 25 8823 18778 27601 786 1933 2718 9608 20711 30319 3215 150 26 147885 557580 705464 18233 33373 51606 166118 590952 757070 45046 1472 27 1025 11455 12480 92 227 319 1117 11682 12799 1315 76 28 976 36805 37781 118 1306 1425 1094 38111 39205 5078 222
29 501 11308 11809 65 84 150 567 11392 11959 1493 61 30 - - - - - - - - - - 0 31 701 5450 6151 115 186 301 817 5636 6452 726 49 32 1063 4251 5315 213 0 213 1276 4251 5527 458 2 33 12 473 485 0 0 0 12 473 485 66 8
34 12 43177 43189 295 108 403 308 43285 43592 4420 32 35 1250 1708 2958 28 105 133 1278 1813 3091 137 21 36 25126 190138 215264 7416 5861 13276 32542 195998 228540 18546 226 37 248 1980 2228 0 3 3 248 1983 2231 164 5 all 720283 2079277 2799560 128146 125295 253441 848429 2204571 3053000 274277 4251

Appendix A
NSS Report No. 525: Unorganised Manufacturing sector in India, 2005-06: Employment, Assets and Borrowings. A - 5
Table 2: Number of workers by nature of employment and gender for each industry Rural all enterprise type all-India
number of workers full time part time all
number of enterprises
industry (NIC 2004) female male all female male all female male all estimated sample (1) (2) (3) (4) (5) (6) (7) (8) (9) (10) (11) (12)
01405 1784 5924 7708 4148 841 4989 5932 6765 12697 6580 63 15 980939 2778228 3759167 540387 664163 1204550 1521327 3442391 4963717 2075265 8657 16 2143190 687402 2830592 456280 134154 590435 2599470 821556 3421026 2342653 1669 17 1294217 1494021 2788238 812490 178003 990493 2106707 1672024 3778731 1765539 3977 18 753503 1228018 1981521 448427 155832 604259 1201930 1383850 2585780 1943561 8681
19 6948 69863 76811 2164 13842 16005 9112 83705 92817 38355 217 20 952103 1808795 2760898 434529 330263 764792 1386632 2139058 3525690 1914554 5839 21 135275 27353 162628 17650 5651 23302 152925 33005 185930 106292 184 22 6159 42576 48735 2318 2983 5302 8477 45559 54036 17590 226 23 1270 11997 13267 966 4076 5042 2236 16073 18309 4849 64
24 341645 132188 473834 92303 33219 125523 433949 165408 599357 297318 719 25 24920 48189 73109 6132 6975 13107 31052 55164 86216 25394 320 26 386732 1247453 1634185 191028 138303 329331 577760 1385756 1963516 536056 3849 27 1115 30847 31962 1045 838 1883 2160 31685 33845 13520 186 28 23911 564575 588486 35842 86566 122408 59753 651140 710893 369778 2485
29 3499 104036 107535 4623 16477 21100 8121 120513 128634 68219 580 30 0 57 57 0 0 0 0 57 57 57 1 31 9543 68534 78077 192 10631 10822 9735 79165 88900 52476 460 32 1063 6462 7525 213 76 289 1276 6538 7814 2088 13 33 12 5386 5398 0 0 0 12 5386 5398 1330 15
34 13 48065 48078 359 604 963 372 48669 49041 6390 73 35 1250 10528 11778 548 334 882 1798 10862 12660 5681 82 36 96810 856321 953130 83774 92767 176541 180583 949088 1129671 534059 3676 37 669 2672 3341 205 3 208 874 2675 3548 662 14 all 7166571 11279491 18446061 3135625 1876600 5012224 10302195 13156090 23458286 12128266 42050

Appendix A
NSS Report No. 525: Unorganised Manufacturing sector in India, 2005-06: Employment, Assets and Borrowings. A - 6
Table 2: Number of workers by nature of employment and gender for each industry Urban OAME all-India
number of workers full time part time all
number of enterprises
industry (NIC 2004) female male all female male all female male all estimated sample (1) (2) (3) (4) (5) (6) (7) (8) (9) (10) (11) (12)
01405 641 2276 2917 29 143 172 671 2419 3089 1671 33 15 128484 343192 471676 101472 51656 153128 229956 394848 624804 346262 3111 16 468119 131666 599785 103432 48845 152277 571551 180512 752062 468361 1244 17 428649 424740 853389 236094 21312 257407 664744 446053 1110796 587131 2772 18 477541 524532 1002074 262826 56826 319652 740367 581358 1321725 1020685 7703
19 8933 89387 98319 23259 2059 25319 32192 91446 123638 58191 331 20 58485 165034 223519 31445 19288 50733 89930 184322 274253 159382 1330 21 39621 21148 60769 18617 6891 25508 58238 28039 86277 45637 340 22 10267 54626 64894 7290 7743 15033 17557 62369 79926 44652 478 23 178 1434 1612 0 0 0 178 1434 1612 656 6
24 120575 11495 132069 24701 3138 27839 145276 14633 159909 105788 400 25 6484 15904 22388 3372 1583 4955 9856 17487 27343 15190 142 26 36955 78359 115314 24274 14657 38931 61229 93016 154245 68437 681 27 1897 12015 13913 526 1379 1905 2423 13395 15818 9380 137 28 6244 132021 138265 7597 10446 18043 13842 142467 156308 84071 874
29 2083 57006 59089 2205 2628 4833 4288 59634 63922 37355 395 30 0 98 98 0 0 0 0 98 98 98 1 31 5512 34533 40045 2080 4424 6504 7593 38957 46549 27359 373 32 0 1042 1042 76 0 76 76 1042 1118 921 16 33 405 5087 5492 0 209 209 405 5296 5701 3796 43
34 0 1649 1649 0 0 0 0 1649 1649 907 15 35 758 5649 6406 681 136 817 1439 5784 7224 5018 65 36 117653 413890 531543 82054 31068 113122 199707 444958 644665 411325 3481 37 352 2755 3107 0 148 148 352 2904 3256 1913 13 all 1919838 2529538 4449376 932031 284579 1216610 2851869 2814118 5665986 3504186 23984

Appendix A
NSS Report No. 525: Unorganised Manufacturing sector in India, 2005-06: Employment, Assets and Borrowings. A - 7
Table 2: Number of workers by nature of employment and gender for each industry Urban NDME all-India
number of workers full time part time all
number of enterprises
industry (NIC 2004) female male all female male all female male all estimated sample (1) (2) (3) (4) (5) (6) (7) (8) (9) (10) (11) (12)
01405 0 2439 2439 35 27 62 35 2466 2502 783 13 15 34655 405846 440500 13849 29653 43502 48504 435499 484002 149611 1816 16 4324 6264 10588 3714 1144 4858 8038 7408 15446 6093 27 17 47703 374322 422025 20665 10654 31319 68368 384976 453344 115782 770 18 49415 524452 573866 11737 21758 33495 61152 546209 607361 201087 2461
19 940 114192 115132 623 2220 2842 1563 116412 117975 31626 232 20 3825 162553 166378 487 5531 6018 4312 168084 172396 53423 612 21 2458 38524 40982 489 912 1401 2947 39436 42383 11199 99 22 9441 113422 122863 1830 7080 8909 11270 120502 131772 39961 573 23 0 574 574 0 0 0 0 574 574 185 3
24 3006 12984 15990 634 403 1038 3640 13388 17028 5039 84 25 5569 57029 62598 2984 3186 6170 8553 60215 68768 18807 201 26 4580 78446 83025 1933 3789 5722 6513 82235 88748 24866 263 27 613 23075 23688 297 279 577 910 23354 24264 7454 124 28 6187 384599 390786 1193 11564 12757 7380 396164 403543 122074 1219
29 975 142920 143895 3594 3977 7570 4569 146897 151465 44052 429 30 0 1344 1344 0 0 0 0 1344 1344 533 6 31 932 67033 67964 679 1386 2065 1611 68418 70030 23638 325 32 258 2765 3022 0 0 0 258 2765 3022 1032 14 33 569 10217 10786 157 93 250 725 10310 11036 3263 41
34 688 17821 18509 24 393 417 713 18213 18926 5459 75 35 74 18988 19062 0 276 276 74 19264 19338 5015 87 36 11211 455417 466627 4563 17189 21752 15773 472606 488379 153350 1834 37 9 1618 1627 105 57 162 114 1675 1789 684 14 all 187429 3016844 3204272 69592 121570 191162 257021 3138413 3395434 1025013 11322
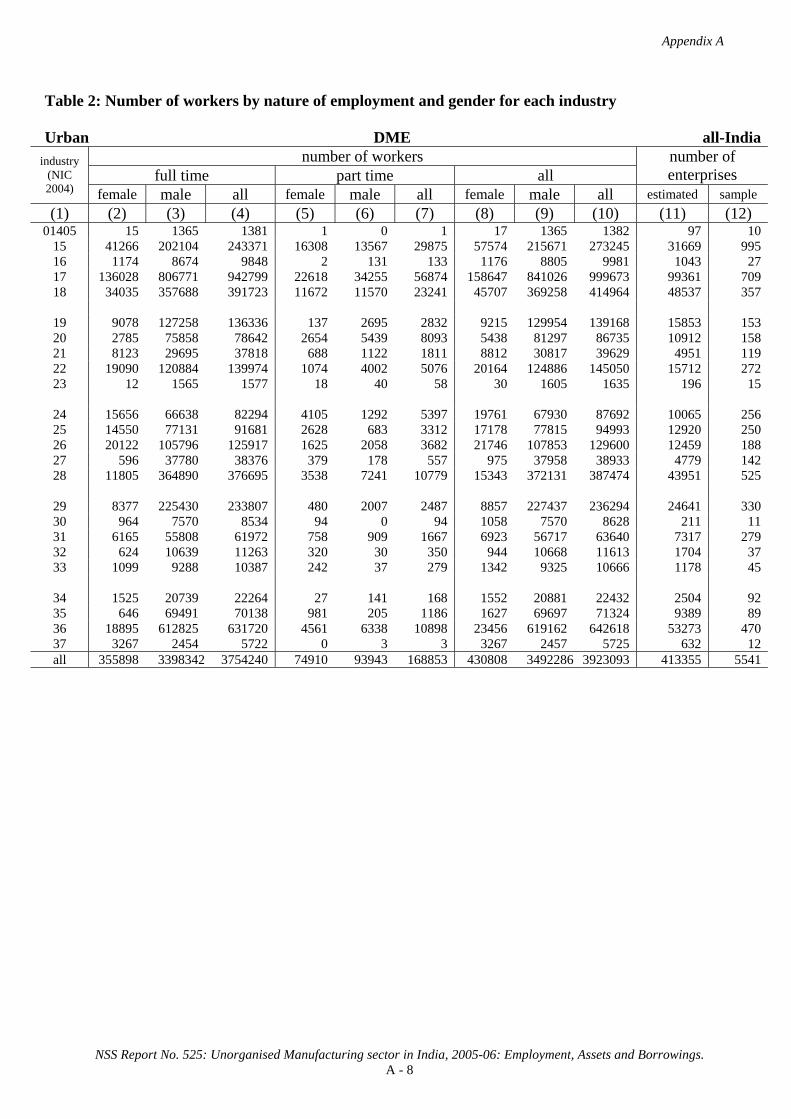
Appendix A
NSS Report No. 525: Unorganised Manufacturing sector in India, 2005-06: Employment, Assets and Borrowings. A - 8
Table 2: Number of workers by nature of employment and gender for each industry Urban DME all-India
number of workers full time part time all
number of enterprises
industry (NIC 2004) female male all female male all female male all estimated sample (1) (2) (3) (4) (5) (6) (7) (8) (9) (10) (11) (12)
01405 15 1365 1381 1 0 1 17 1365 1382 97 10 15 41266 202104 243371 16308 13567 29875 57574 215671 273245 31669 995 16 1174 8674 9848 2 131 133 1176 8805 9981 1043 27 17 136028 806771 942799 22618 34255 56874 158647 841026 999673 99361 709 18 34035 357688 391723 11672 11570 23241 45707 369258 414964 48537 357
19 9078 127258 136336 137 2695 2832 9215 129954 139168 15853 153 20 2785 75858 78642 2654 5439 8093 5438 81297 86735 10912 158 21 8123 29695 37818 688 1122 1811 8812 30817 39629 4951 119 22 19090 120884 139974 1074 4002 5076 20164 124886 145050 15712 272 23 12 1565 1577 18 40 58 30 1605 1635 196 15
24 15656 66638 82294 4105 1292 5397 19761 67930 87692 10065 256 25 14550 77131 91681 2628 683 3312 17178 77815 94993 12920 250 26 20122 105796 125917 1625 2058 3682 21746 107853 129600 12459 188 27 596 37780 38376 379 178 557 975 37958 38933 4779 142 28 11805 364890 376695 3538 7241 10779 15343 372131 387474 43951 525
29 8377 225430 233807 480 2007 2487 8857 227437 236294 24641 330 30 964 7570 8534 94 0 94 1058 7570 8628 211 11 31 6165 55808 61972 758 909 1667 6923 56717 63640 7317 279 32 624 10639 11263 320 30 350 944 10668 11613 1704 37 33 1099 9288 10387 242 37 279 1342 9325 10666 1178 45
34 1525 20739 22264 27 141 168 1552 20881 22432 2504 92 35 646 69491 70138 981 205 1186 1627 69697 71324 9389 89 36 18895 612825 631720 4561 6338 10898 23456 619162 642618 53273 470 37 3267 2454 5722 0 3 3 3267 2457 5725 632 12 all 355898 3398342 3754240 74910 93943 168853 430808 3492286 3923093 413355 5541

Appendix A
NSS Report No. 525: Unorganised Manufacturing sector in India, 2005-06: Employment, Assets and Borrowings. A - 9
Table 2: Number of workers by nature of employment and gender for each industry Urban all enterprise type all-India
number of workers full time part time all
number of enterprises
industry (NIC 2004) female male all female male all female male all estimated sample (1) (2) (3) (4) (5) (6) (7) (8) (9) (10) (11) (12)
01405 657 6080 6737 66 170 236 722 6250 6972 2551 56 15 204405 951142 1155547 131628 94875 226504 336033 1046018 1382051 527542 5922 16 473617 146604 620221 107148 50121 157269 580765 196725 777490 475497 1298 17 612380 1605833 2218213 279378 66221 345600 891758 1672054 2563813 802274 4251 18 560991 1406672 1967663 286235 90153 376388 847226 1496825 2344051 1270308 10521
19 18951 330837 349788 24018 6975 30993 42969 337812 380781 105669 716 20 65095 403445 468540 34586 30258 64844 99681 433704 533384 223716 2100 21 50202 89367 139568 19795 8925 28720 69997 98292 168289 61787 558 22 38798 288932 327731 10193 18825 29018 48992 307757 356749 100324 1323 23 190 3573 3763 18 40 58 208 3613 3821 1037 24
24 139237 91117 230354 29440 4834 34274 168677 95951 264628 120892 740 25 26603 150065 176667 8985 5452 14437 35587 155517 191104 46917 593 26 61656 262601 324257 27832 20503 48335 89488 283104 372592 105762 1132 27 3106 72870 75976 1202 1837 3038 4308 74707 79015 21613 403 28 24237 881510 905746 12328 29251 41579 36565 910761 947326 250097 2618
29 11435 425356 436791 6279 8611 14890 17714 433967 451681 106048 1154 30 964 9013 9976 94 0 94 1058 9013 10070 842 18 31 12609 157373 169982 3518 6719 10237 16126 164092 180219 58314 977 32 882 14446 15328 396 30 425 1278 14475 15753 3656 67 33 2073 24593 26665 399 339 737 2472 24931 27403 8237 129
34 2213 40209 42422 51 534 585 2265 40743 43007 8870 182 35 1478 94128 95606 1662 617 2279 3140 94745 97885 19421 241 36 147759 1482131 1629890 91177 54595 145772 238936 1536726 1775662 617948 5785 37 3628 6828 10456 105 208 313 3733 7036 10769 3229 39 all 2463164 8944724 11407888 1076533 500093 1576626 3539697 9444817 12984514 4942554 40847
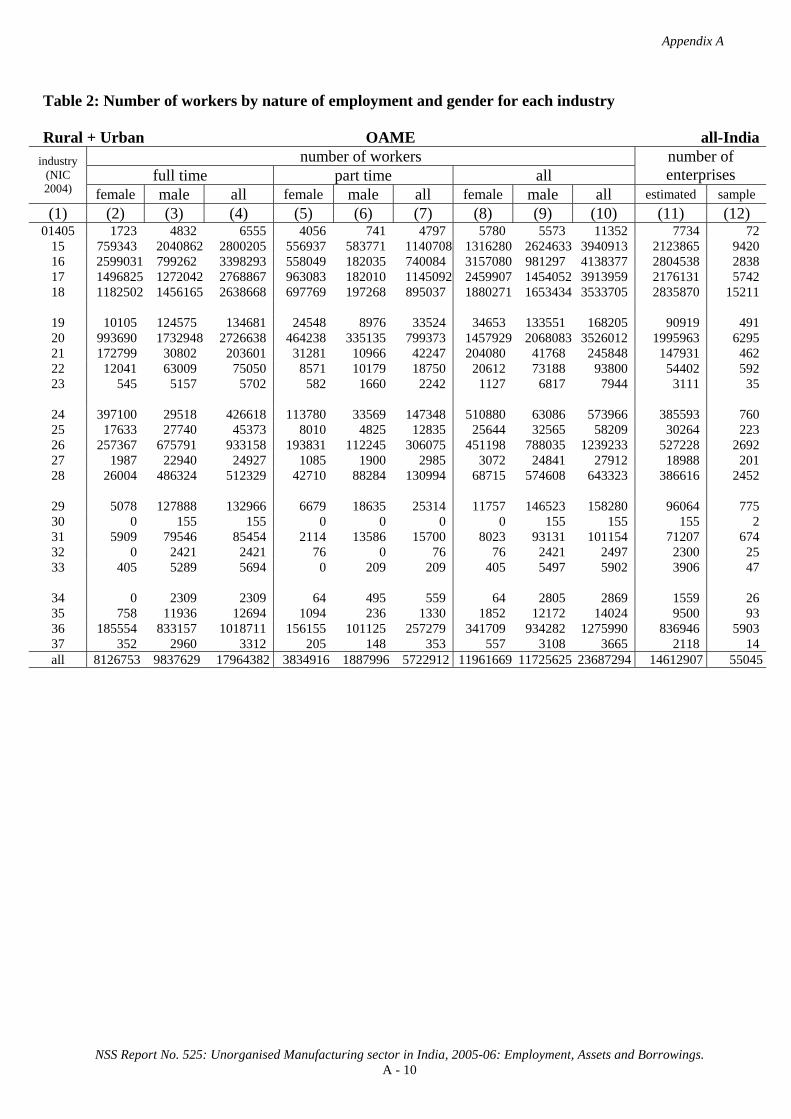
Appendix A
NSS Report No. 525: Unorganised Manufacturing sector in India, 2005-06: Employment, Assets and Borrowings. A - 10
Table 2: Number of workers by nature of employment and gender for each industry Rural + Urban OAME all-India
number of workers full time part time all
number of enterprises
industry (NIC 2004) female male all female male all female male all estimated sample (1) (2) (3) (4) (5) (6) (7) (8) (9) (10) (11) (12)
01405 1723 4832 6555 4056 741 4797 5780 5573 11352 7734 72 15 759343 2040862 2800205 556937 583771 1140708 1316280 2624633 3940913 2123865 9420 16 2599031 799262 3398293 558049 182035 740084 3157080 981297 4138377 2804538 2838 17 1496825 1272042 2768867 963083 182010 1145092 2459907 1454052 3913959 2176131 5742 18 1182502 1456165 2638668 697769 197268 895037 1880271 1653434 3533705 2835870 15211
19 10105 124575 134681 24548 8976 33524 34653 133551 168205 90919 491 20 993690 1732948 2726638 464238 335135 799373 1457929 2068083 3526012 1995963 6295 21 172799 30802 203601 31281 10966 42247 204080 41768 245848 147931 462 22 12041 63009 75050 8571 10179 18750 20612 73188 93800 54402 592 23 545 5157 5702 582 1660 2242 1127 6817 7944 3111 35
24 397100 29518 426618 113780 33569 147348 510880 63086 573966 385593 760 25 17633 27740 45373 8010 4825 12835 25644 32565 58209 30264 223 26 257367 675791 933158 193831 112245 306075 451198 788035 1239233 527228 2692 27 1987 22940 24927 1085 1900 2985 3072 24841 27912 18988 201 28 26004 486324 512329 42710 88284 130994 68715 574608 643323 386616 2452
29 5078 127888 132966 6679 18635 25314 11757 146523 158280 96064 775 30 0 155 155 0 0 0 0 155 155 155 2 31 5909 79546 85454 2114 13586 15700 8023 93131 101154 71207 674 32 0 2421 2421 76 0 76 76 2421 2497 2300 25 33 405 5289 5694 0 209 209 405 5497 5902 3906 47
34 0 2309 2309 64 495 559 64 2805 2869 1559 26 35 758 11936 12694 1094 236 1330 1852 12172 14024 9500 93 36 185554 833157 1018711 156155 101125 257279 341709 934282 1275990 836946 5903 37 352 2960 3312 205 148 353 557 3108 3665 2118 14 all 8126753 9837629 17964382 3834916 1887996 5722912 11961669 11725625 23687294 14612907 55045

Appendix A
NSS Report No. 525: Unorganised Manufacturing sector in India, 2005-06: Employment, Assets and Borrowings. A - 11
Table 2: Number of workers by nature of employment and gender for each industry Rural + Urban NDME all-India
number of workers full time part time all
number of enterprises
industry (NIC 2004) female male all female male all female male all estimated sample (1) (2) (3) (4) (5) (6) (7) (8) (9) (10) (11) (12)
01405 0 2850 2850 35 157 192 35 3006 3042 1017 18 15 71483 875645 947128 39672 100505 140178 111155 976151 1087306 335216 3392 16 10455 17274 27730 4684 1974 6657 15139 19248 34387 11292 77 17 158747 690075 848823 69736 22548 92285 228484 712624 941107 244943 1317 18 83077 801204 884281 24774 34058 58831 107851 835262 943112 325683 3571
19 1438 123763 125200 678 2743 3421 2116 126505 128621 34790 266 20 8010 352310 360320 1885 17820 19704 9895 370129 380024 123433 1286 21 2887 38739 41626 5217 2469 7686 8105 41207 49312 12935 114 22 13523 124319 137842 2797 7478 10275 16320 131797 148117 45858 657 23 1 4736 4737 22 1619 1640 23 6355 6377 1941 18
24 6305 25206 31511 1715 522 2237 8020 25728 33748 8982 173 25 10517 74604 85121 3692 4986 8678 14209 79590 93799 25911 290 26 23015 170888 193903 5171 11132 16303 28186 182020 210205 57086 629 27 613 31542 32155 692 369 1061 1305 31911 33216 10051 170 28 9362 558065 567427 1804 18986 20789 11166 577051 588217 184229 1904
29 977 164766 165743 3677 4362 8039 4654 169128 173782 52069 568 30 0 1344 1344 0 0 0 0 1344 1344 533 6 31 9377 85105 94481 722 2669 3391 10099 87773 97872 31540 435 32 258 3597 3855 0 76 76 258 3673 3931 1284 16 33 569 14929 15498 157 93 250 725 15023 15748 4416 44
34 689 22048 22738 24 394 418 714 22442 23156 6777 105 35 74 21521 21595 108 404 512 182 21925 22107 6077 120 36 14994 702333 717327 6819 34039 40858 21813 736372 758185 243241 2862 37 430 2105 2535 105 57 162 535 2162 2697 977 22 all 426801 4908967 5335768 174185 269458 443643 600987 5178425 5779412 1770282 18060

Appendix A
NSS Report No. 525: Unorganised Manufacturing sector in India, 2005-06: Employment, Assets and Borrowings. A - 12
Table 2: Number of workers by nature of employment and gender for each industry Rural + Urban DME all-India
number of workers full time part time all
number of enterprises
industry (NIC 2004) female male all female male all female male all estimated sample (1) (2) (3) (4) (5) (6) (7) (8) (9) (10) (11) (12)
01405 718 4322 5040 122 113 236 840 4436 5276 381 29 15 354518 812863 1167381 75407 74762 150169 429925 887625 1317549 143726 1767 16 7320 17470 24790 695 267 962 8016 17737 25752 2320 52 17 251026 1137736 1388762 59049 39666 98716 310075 1177403 1487478 146739 1169 18 48915 377320 426235 12120 14659 26779 61035 391979 453014 52316 420
19 14356 152362 166718 956 9097 10054 15312 161460 176772 18315 176 20 15498 126982 142480 2992 7566 10558 18490 134549 153038 18874 358 21 9790 47180 56970 947 1142 2089 10737 48321 59058 7213 166 22 19393 144180 163573 1144 4151 5295 20537 148331 168868 17655 300 23 914 5677 6591 380 837 1218 1294 6514 7809 834 35
24 77477 168581 246059 6248 3963 10211 83726 172544 256270 23635 526 25 23372 95910 119282 3414 2616 6030 26786 98526 125312 16135 400 26 168006 663375 831381 19858 35430 55288 187864 698806 886670 57506 1660 27 1621 49234 50856 470 405 876 2092 49640 51731 6094 218 28 12781 401695 414476 3656 8547 12203 16437 410242 426679 49029 747
29 8878 236739 245617 546 2091 2636 9424 238829 248253 26135 391 30 964 7570 8534 94 0 94 1058 7570 8628 211 11 31 6866 61258 68124 873 1095 1968 7739 62353 70092 8043 328 32 1688 14890 16578 533 30 562 2220 14920 17140 2162 39 33 1111 9761 10872 242 37 279 1354 9797 11151 1244 53
34 1537 63916 65453 322 249 571 1859 64165 66025 6924 124 35 1896 71199 73096 1009 310 1319 2905 71510 74415 9525 110 36 44021 802962 846983 11976 12198 24175 55997 815160 871158 71819 696 37 3515 4434 7950 0 6 6 3515 4440 7955 796 17 all 1076181 5477619 6553800 203056 219238 422294 1279237 5696857 6976094 687632 9792

Appendix A
NSS Report No. 525: Unorganised Manufacturing sector in India, 2005-06: Employment, Assets and Borrowings. A - 13
Table 2: Number of workers by nature of employment and gender for each industry Rural + Urban all enterprise type all-India
number of workers full time part time all
number of enterprises
industry (NIC 2004) female male all female male all female male all estimated sample (1) (2) (3) (4) (5) (6) (7) (8) (9) (10) (11) (12)
01405 2441 12004 14445 4214 1011 5225 6655 13015 19669 9131 119 15 1185344 3729370 4914714 672016 759038 1431054 1857360 4488408 6345768 2602807 14579 16 2616807 834006 3450813 563428 184275 747703 3180235 1018281 4198516 2818150 2967 17 1906597 3099854 5006452 1091868 244224 1336093 2998466 3344078 6342544 2567813 8228 18 1314494 2634690 3949184 734662 245985 980647 2049156 2880675 4929831 3213869 19202
19 25899 400700 426599 26182 20816 46998 52081 421516 473598 144025 933 20 1017198 2212240 3229438 469115 360521 829636 1486313 2572761 4059074 2138270 7939 21 185477 116720 302197 37445 14577 52022 222922 131297 354218 168080 742 22 44957 331508 376465 12512 21808 34320 57469 353316 410785 117915 1549 23 1460 15570 17030 984 4116 5100 2444 19686 22130 5886 88
24 480882 223305 704187 121743 38053 159797 602626 261358 863984 418210 1459 25 51522 198254 249776 15117 12427 27544 66639 210681 277320 72311 913 26 448388 1510054 1958442 218860 158807 377666 667248 1668860 2336108 641819 4981 27 4221 103717 107938 2247 2675 4922 6468 106392 112860 35133 589 28 48148 1446084 1494232 48170 115817 163987 96318 1561901 1658219 619875 5103
29 14933 529393 544326 10902 25088 35989 25835 554480 580315 174268 1734 30 964 9070 10034 94 0 94 1058 9070 10128 899 19 31 22152 225908 248059 3710 17349 21059 25861 243257 269118 110790 1437 32 1945 20908 22853 608 106 714 2554 21014 23567 5745 80 33 2085 29979 32064 399 339 737 2484 30317 32801 9567 144
34 2227 88274 90500 410 1138 1549 2637 89412 92049 15260 255 35 2728 104656 107384 2211 950 3161 4939 105607 110546 25102 323 36 244569 2338452 2583021 174950 147362 322313 419519 2485814 2905333 1152007 9461 37 4297 9500 13796 310 211 521 4606 9711 14317 3892 53 all 9629735 20224215 29853950 4212157 2376692 6588850 13841892 22600907 36442799 17070820 82897

Appendix A
NSS Report No. 525: Unorganised Manufacturing sector in India, 2005-06: Employment, Assets and Borrowings. A - 14
Table 2: Number of workers by nature of employment and gender for each State/UTs Rural OAME
number of workers full time part time all
number of enterprises State/UT
female male all female male all female male all estimated sample(1) (2) (3) (4) (5) (6) (7) (8) (9) (10) (11) (12)
Andhra Pradesh 724282 483062 1207345 182034 44824 226858 906316 527886 1434202 998813 2959 Arunachal Pradesh 2 419 421 0 104 104 2 524 526 304 36 Assam 123496 174783 298278 65399 75265 140664 188895 250047 438942 306157 1780 Bihar 287968 617066 905034 95625 139188 234813 383593 756254 1139847 639312 2195 Chhattisgarh 47541 184048 231589 48736 57360 106096 96278 241407 337685 169729 392 Delhi 282 644 926 0 0 0 282 644 926 767 16 Goa 535 2896 3430 799 630 1429 1333 3526 4859 3200 70 Gujarat 79495 247546 327041 75581 55950 131531 155076 303495 458571 276152 1043 Haryana 18553 86977 105531 24661 7979 32640 43215 94956 138171 102113 637 Himachal Pradesh 27421 60838 88259 14940 16159 31099 42361 76997 119358 92900 732 Jammu & Kashmir 46993 158849 205842 10727 7467 18194 57720 166316 224036 132883 878 Jharkhand 290656 362617 653274 78090 58945 137035 368747 421562 790309 522684 863 Karnataka 469021 235732 704753 48836 26347 75183 517856 262079 779936 580125 1424 Kerala 214030 131996 346026 131016 27169 158186 345046 159165 504212 374908 1653 Madhya Pradesh 247763 502022 749785 147407 76374 223781 395170 578395 973566 541814 1328
Maharashtra 136942 312995 449937 150577 11506
7 265645 287519 428062 715581 499406 1587 Manipur 36357 4960 41317 4153 1581 5734 40510 6541 47051 34388 388 Meghalaya 7497 15568 23065 14054 11236 25291 21551 26804 48356 26803 249 Mizoram 400 1974 2374 190 1836 2026 590 3810 4400 3078 181 Nagaland 2637 2014 4651 2549 2856 5404 5185 4870 10055 6842 394 Orissa 532009 561791 1093800 341594 277629 619223 873603 839420 1713023 843862 1917 Punjab 76161 74212 150374 28452 3678 32130 104613 77890 182503 135428 902 Rajasthan 98407 312654 411061 42692 44545 87238 141099 357199 498298 371194 1250 Sikkim 403 2614 3017 763 1058 1822 1166 3672 4839 3260 135 Tamil Nadu 655161 270168 925329 68571 28660 97231 723731 298828 1022559 720436 1896 Tripura 15669 27749 43417 4886 2042 6928 20555 29790 50345 33235 672 Uttaranchal 4261 42933 47194 4146 15535 19681 8407 58468 66875 44403 253 Uttar Pradesh 647887 1362494 2010381 616892 258667 875559 1264779 1621160 2885939 1577716 2541 West Bengal 1413000 1063522 2476522 698176 244279 942455 2111175 1307801 3418977 2061369 2423 A & N Islands 107 710 818 545 860 1405 652 1571 2222 1283 108 Chandigarh 244 463 707 0 53 53 244 516 760 567 15 D & N Haveli 306 225 530 83 6 89 389 231 620 506 19 Daman & Diu 20 324 344 547 18 565 567 342 909 852 37 Lakshadweep 124 163 287 0 7 7 124 170 294 204 20 Pondicherry 1286 1062 2348 164 42 206 1450 1104 2554 2026 68
all-India 6206915 7308090 13515006 2902885 1603417 4506302 9109800 8911508 18021308 11108720 31061

Appendix A
NSS Report No. 525: Unorganised Manufacturing sector in India, 2005-06: Employment, Assets and Borrowings. A - 15
Table 2: Number of workers by nature of employment and gender for each State/UTs Rural NDME
number of workers full time part time all
number of enterprises State/UT
female male all female male all female male all estimated sample(1) (2) (3) (4) (5) (6) (7) (8) (9) (10) (11) (12)
Andhra Pradesh 20145 111958 132103 9458 8228 17686 29603 120187 149790 45316 523 Arunachal Pradesh 7 578 585 0 59 59 7 636 643 226 37 Assam 5870 57693 63563 1243 7218 8461 7113 64911 72024 24581 273 Bihar 3798 38637 42435 196 16045 16241 3993 54682 58676 23138 220 Chhattisgarh 59 4838 4897 50 212 262 109 5051 5159 1549 54 Delhi 177 5684 5861 0 0 0 177 5684 5861 1810 28 Goa 114 2650 2764 4 73 77 118 2724 2842 888 32 Gujarat 367 34494 34862 1034 2568 3602 1401 37062 38464 14538 134 Haryana 550 38705 39255 45 273 318 595 38978 39573 14267 206 Himachal Pradesh 751 15107 15859 283 1840 2123 1035 16947 17981 6763 161 Jammu & Kashmir 830 16454 17284 19 1682 1701 849 18136 18985 6501 157 Jharkhand 11 43678 43689 226 589 816 237 44267 44504 16622 90 Karnataka 10216 80437 90653 4654 6697 11351 14870 87134 102004 32323 192 Kerala 73179 193961 267140 18223 24515 42738 91402 218476 309879 98679 827 Madhya Pradesh 8249 39623 47873 376 1079 1455 8625 40702 49328 13146 98 Maharashtra 4073 96744 100818 7355 8163 15518 11428 104908 116335 39967 192 Manipur 157 3725 3882 53 148 201 211 3872 4083 1288 45 Meghalaya 1127 14250 15377 512 2919 3431 1639 17170 18809 6579 106 Mizoram 11 344 355 11 129 140 22 473 494 196 39 Nagaland 50 618 667 100 95 195 150 712 862 319 28 Orissa 4245 47907 52152 4484 10464 14948 8729 58371 67100 23583 166 Punjab 880 34394 35274 635 1425 2060 1514 35819 37334 13610 172 Rajasthan 2771 63984 66755 4208 3161 7369 6979 67145 74124 23428 295 Sikkim 73 1002 1076 0 8 8 73 1010 1083 397 21 Tamil Nadu 59714 228148 287862 31185 5700 36885 90900 233848 324747 88273 690 Tripura 265 61912 62177 101 695 796 366 62608 62974 5400 347 Uttaranchal 100 20946 21046 199 719 918 299 21665 21964 7371 94 Uttar Pradesh 5809 267270 273079 5117 9844 14960 10926 277114 288039 100935 545 West Bengal 35130 360417 395547 14577 32651 47228 49708 393068 442775 131237 783 A & N Islands 64 989 1053 124 142 265 187 1131 1318 488 60 Chandigarh 5 478 484 0 0 0 5 478 484 154 13 D & N Haveli 44 533 576 0 90 90 44 623 667 247 31 Daman & Diu 0 414 414 0 2 2 0 416 416 133 20 Lakshadweep 0 99 99 0 0 0 0 99 99 48 8 Pondicherry 531 3450 3981 122 455 577 653 3905 4558 1270 51
all-India 239372 1892124 2131496 104594 147888 252481 343966 2040012 2383977 745269 6738

Appendix A
NSS Report No. 525: Unorganised Manufacturing sector in India, 2005-06: Employment, Assets and Borrowings. A - 16
Table 2: Number of workers by nature of employment and gender for each State/UTs Rural DME
number of workers full time part time all
number of enterprises State/UT
female male all female male all female male all estimated sample(1) (2) (3) (4) (5) (6) (7) (8) (9) (10) (11) (12)
Andhra Pradesh 181043 237127 418170 10957 13472 24429 192000 250599 442598 41113 394 Arunachal Pradesh 88 1042 1130 0 0 0 88 1042 1130 11 3 Assam 2801 18874 21675 1543 1240 2783 4343 20115 24458 2268 31 Bihar 782 5596 6378 0 794 794 782 6390 7172 929 53 Chhattisgarh 5109 18793 23902 381 281 661 5490 19074 24564 1332 82 Delhi 316 8563 8879 216 543 759 532 9107 9638 1062 27 Goa 913 4501 5414 76 36 112 989 4537 5526 458 45 Gujarat 10642 151560 162203 460 4001 4461 11102 155562 166664 10064 173 Haryana 3798 41524 45322 916 368 1283 4714 41891 46605 3306 275 Himachal Pradesh 1473 5480 6953 249 1848 2097 1722 7328 9049 774 118 Jammu & Kashmir 343 8604 8947 21 270 291 364 8874 9238 1083 48 Jharkhand 1074 7261 8336 6 101 107 1080 7362 8443 944 22 Karnataka 125369 194779 320147 47772 44176 91948 173141 238954 412095 50764 154 Kerala 75262 106175 181437 5137 7949 13086 80400 114123 194523 19191 202 Madhya Pradesh 12355 68924 81279 693 12336 13029 13048 81260 94308 9502 215 Maharashtra 29387 138893 168280 2179 2854 5033 31565 141747 173312 16795 184 Manipur 36 1755 1790 15 51 66 51 1806 1857 121 10 Meghalaya 175 6829 7004 5923 3193 9117 6098 10022 16121 1131 33 Mizoram 3 51 54 1 0 1 4 51 55 18 3 Nagaland 5 16 21 0 0 0 5 16 21 6 3 Orissa 9105 36340 45444 200 594 794 9305 36934 46239 3432 107 Punjab 213 10499 10712 29 1710 1739 242 12209 12451 1170 56 Rajasthan 8239 138296 146535 7229 218 7448 15468 138514 153982 6253 487 Sikkim 154 256 410 39 35 74 194 291 484 26 8 Tamil Nadu 178008 245409 423417 8937 3661 12597 186944 249069 436014 41644 612 Tripura 5372 12929 18301 9 23 32 5381 12952 18333 265 48 Uttaranchal 58 19006 19063 37 254 291 94 19260 19354 2167 30 Uttar Pradesh 32847 337294 370141 10227 9764 19992 43074 347058 390132 25865 292 West Bengal 31313 243826 275139 24486 14734 39221 55799 258560 314359 31162 414 A & N Islands 216 387 604 110 136 245 326 523 849 101 13 Chandigarh 4 221 224 0 0 0 4 221 224 31 10 D & N Haveli 14 293 306 0 13 13 14 305 319 44 19 Daman & Diu 131 4492 4623 0 453 453 131 4944 5076 479 20 Lakshadweep 0 24 24 0 0 0 0 24 24 3 2 Pondicherry 3636 3661 7296 298 186 484 3934 3847 7781 762 58
all-India 720283 2079277 2799560 128146 125295 253441 848429 2204571 3053000 274277 4251

Appendix A
NSS Report No. 525: Unorganised Manufacturing sector in India, 2005-06: Employment, Assets and Borrowings. A - 17
Table 2: Number of workers by nature of employment and gender for each State/UTs Rural all enterprise type
number of workers full time part time all
number of enterprises State/UT
female male all female male all female male all estimated sample(1) (2) (3) (4) (5) (6) (7) (8) (9) (10) (11) (12)
Andhra Pradesh 925471 832147 1757618 202449 66524 268973 1127919 898671 2026591 1085242 3876 Arunachal Pradesh 97 2039 2136 0 163 163 97 2202 2299 541 76 Assam 132166 251350 383517 68185 83722 151908 200351 335073 535424 333006 2084 Bihar 292548 661299 953847 95821 156027 251848 388368 817326 1205694 663379 2468 Chhattisgarh 52709 207679 260389 49167 57852 107019 101876 265532 367408 172610 528 Delhi 775 14891 15666 216 543 759 991 15435 16426 3639 71 Goa 1562 10047 11609 878 740 1618 2440 10787 13227 4546 147 Gujarat 90505 433600 524105 77074 62519 139593 167579 496119 663699 300753 1350 Haryana 22901 167207 190107 25622 8620 34242 48523 175826 224349 119687 1118 Himachal Pradesh 29646 81425 111071 15472 19846 35318 45118 101271 146389 100437 1011 Jammu & Kashmir 48167 183906 232073 10766 9420 20186 58934 193326 252259 140468 1083 Jharkhand 291742 413556 705298 78323 59635 137958 370064 473192 843256 540250 975 Karnataka 604605 510948 1115552 101262 77220 178482 705867 588168 1294035 663211 1770 Kerala 362472 432132 794604 154376 59633 214010 516848 491765 1008614 492777 2682 Madhya Pradesh 268368 610569 878937 148477 89788 238265 416844 700358 1117202 564463 1641 Maharashtra 170401 548633 719034 160111 126084 286195 330512 674717 1005229 556168 1963 Manipur 36550 10439 46989 4222 1780 6002 40772 12219 52991 35797 443 Meghalaya 8799 36648 45446 20490 17349 37839 29289 53997 83285 34513 388 Mizoram 414 2369 2783 202 1965 2167 616 4334 4949 3291 223 Nagaland 2691 2648 5339 2649 2950 5599 5340 5598 10939 7167 425 Orissa 545359 646038 1191397 346278 288688 634966 891637 934726 1826362 870877 2190 Punjab 77255 119105 196359 29115 6814 35929 106370 125918 232288 150208 1130 Rajasthan 109417 514934 624351 54129 47925 102054 163546 562859 726405 400875 2032 Sikkim 631 3872 4503 803 1101 1904 1433 4973 6406 3684 164 Tamil Nadu 892883 743725 1636608 108693 38020 146713 1001575 781745 1783321 850353 3198 Tripura 21305 102590 123895 4996 2760 7756 26301 105350 131651 38900 1067 Uttaranchal 4418 82885 87304 4382 16508 20890 8800 99393 108194 53940 377 Uttar Pradesh 686543 1967058 2653600 632236 278275 910510 1318779 2245332 3564111 1704516 3378 West Bengal 1479443 1667765 3147208 737239 291664 1028904 2216682 1959429 4176111 2223768 3620 A & N Islands 387 2087 2474 778 1137 1915 1165 3225 4390 1872 181 Chandigarh 253 1162 1415 0 53 53 253 1215 1468 753 38 D & N Haveli 363 1050 1413 83 109 192 446 1159 1605 797 69 Daman & Diu 151 5230 5381 547 473 1020 698 5703 6401 1464 77 Lakshadweep 124 285 410 0 7 7 124 292 416 255 30 Pondicherry 5453 8173 13626 584 683 1267 6037 8856 14893 4058 177
all-India 7166571 11279491 18446061 3135625 1876600 5012224 10302195 13156090 23458286 12128266 42050

Appendix A
NSS Report No. 525: Unorganised Manufacturing sector in India, 2005-06: Employment, Assets and Borrowings. A - 18
Table 2: Number of workers by nature of employment and gender for each State/UTs Urban OAME
number of workers full time part time all
number of enterprises State/UT
female male all female male all female male all estimated sample(1) (2) (3) (4) (5) (6) (7) (8) (9) (10) (11) (12)
Andhra Pradesh 250039 206869 456908 83183 28935 112118 333222 235804 569027 363988 1849 Arunachal Pradesh 135 333 468 0 88 88 135 420 556 223 14 Assam 6944 19807 26751 3637 2792 6429 10581 22599 33180 21984 471 Bihar 46081 89851 135931 20325 15615 35940 66406 105466 171871 87057 962 Chhattisgarh 9770 21256 31026 4185 3773 7958 13955 25029 38984 23967 215 Delhi 5088 15485 20573 4601 377 4979 9689 15862 25551 17127 67 Goa 828 2246 3074 635 335 971 1463 2581 4044 3053 48 Gujarat 70662 202359 273021 98366 15290 113656 169028 217649 386677 246382 1271 Haryana 11149 72180 83329 8116 4422 12538 19264 76603 95867 60448 400 Himachal Pradesh 1406 3981 5387 524 254 778 1929 4235 6164 4249 276 Jammu & Kashmir 10704 20420 31124 4060 1394 5453 14763 21814 36578 25700 1011 Jharkhand 9496 32086 41582 5020 3297 8317 14517 35383 49899 34243 548 Karnataka 190978 96313 287291 32000 8252 40253 222978 104565 327544 228452 1046 Kerala 61270 44405 105675 56343 7335 63678 117613 51740 169353 119772 789 Madhya Pradesh 163622 184668 348290 65716 49905 115621 229338 234573 463911 253319 1565 Maharashtra 127144 241503 368647 117043 33820 150863 244186 275323 519510 341781 2227 Manipur 16507 2046 18552 2124 108 2233 18631 2154 20785 14629 559 Meghalaya 335 870 1204 164 169 334 499 1039 1538 1027 69 Mizoram 546 781 1327 69 242 311 615 1023 1638 1123 129 Nagaland 1061 921 1981 440 449 889 1500 1369 2870 1912 191 Orissa 33439 58389 91828 19745 11735 31480 53184 70124 123308 69199 791 Punjab 36148 75868 112015 17020 2280 19300 53167 78148 131315 87811 941 Rajasthan 74974 140995 215970 71797 11683 83480 146771 152679 299450 181806 1576 Sikkim 39 304 343 22 14 36 61 318 379 206 45 Tamil Nadu 378579 274033 652612 70917 14226 85142 449495 288259 737754 467652 1948 Tripura 1132 3131 4263 555 109 664 1687 3240 4927 3857 277 Uttaranchal 1443 9296 10739 960 1779 2739 2403 11075 13478 7877 82 Uttar Pradesh 201311 485553 686864 132004 40069 172074 333315 525622 858937 455329 2883 West Bengal 206554 218908 425461 110635 25009 135644 317189 243917 561106 373178 1520 A & N Islands 77 78 155 69 20 89 145 98 243 147 15 Chandigarh 354 103 457 0 0 0 354 103 457 457 5 D & N Haveli 23 78 101 3 0 3 26 78 104 68 19 Daman & Diu 72 297 369 858 103 961 930 400 1330 960 56 Lakshadweep 41 114 155 37 5 42 78 119 197 115 42 Pondicherry 1890 4014 5904 857 694 1551 2748 4707 7455 5090 77
all-India 1919838 2529538 4449376 932031 284579 1216610 2851869 2814118 5665986 3504186 23984

Appendix A
NSS Report No. 525: Unorganised Manufacturing sector in India, 2005-06: Employment, Assets and Borrowings. A - 19
Table 2: Number of workers by nature of employment and gender for each State/UTs Urban NDME
number of workers full time part time all
number of enterprises State/UT
female male all female male all female male all estimated sample(1) (2) (3) (4) (5) (6) (7) (8) (9) (10) (11) (12)
Andhra Pradesh 30075 183979 214053 5175 8158 13333 35250 192137 227387 69642 680 Arunachal Pradesh 9 230 240 9 24 32 18 254 272 84 10 Assam 2272 35561 37833 2193 2364 4557 4465 37925 42390 13647 317 Bihar 1272 57216 58488 458 2444 2902 1730 59660 61390 20269 352 Chhattisgarh 2559 26409 28968 21 1489 1511 2581 27898 30479 8083 87 Delhi 4797 154517 159315 2492 337 2829 7290 154854 162144 45890 191 Goa 1180 4870 6051 186 259 445 1367 5129 6495 2170 49 Gujarat 3362 178140 181502 3022 6061 9083 6385 184200 190585 54198 526 Haryana 1662 127715 129377 1742 2415 4157 3404 130131 133534 38319 339 Himachal Pradesh 468 5892 6360 56 331 388 524 6223 6747 2163 161 Jammu & Kashmir 765 16325 17090 448 414 863 1213 16739 17953 5973 354 Jharkhand 639 28808 29447 129 1597 1727 769 30405 31174 10207 223 Karnataka 9635 140723 150358 3658 7432 11090 13293 148155 161448 48749 411 Kerala 18746 73770 92516 7568 9279 16847 26314 83048 109363 35062 471 Madhya Pradesh 5785 104440 110225 939 3544 4482 6724 107983 114707 31921 384 Maharashtra 20764 416341 437104 7204 18481 25685 27967 434822 462789 134658 1149 Manipur 827 4413 5240 0 137 137 827 4550 5377 1864 136 Meghalaya 700 2831 3530 180 268 448 880 3098 3978 1268 71 Mizoram 435 1242 1677 35 275 310 470 1517 1987 624 89 Nagaland 42 1764 1806 4 146 150 46 1910 1956 758 66 Orissa 2187 34407 36594 300 2800 3100 2487 37207 39695 13748 231 Punjab 4664 140850 145513 1209 2991 4200 5872 143841 149714 44532 639 Rajasthan 2562 119625 122187 1244 5836 7080 3806 125461 129267 38180 544 Sikkim 28 514 543 14 68 82 42 582 624 186 43 Tamil Nadu 50309 313167 363475 12730 11066 23795 63038 324232 387271 117692 925 Tripura 467 5793 6260 138 136 274 605 5929 6534 2357 233 Uttaranchal 1159 15780 16939 445 2439 2884 1604 18219 19823 6535 88 Uttar Pradesh 7871 465643 473514 10059 17102 27161 17930 482745 500675 157969 1423 West Bengal 11283 344472 355755 7886 13295 21181 19169 357767 376936 114609 1004 A & N Islands 56 638 694 0 65 65 56 703 758 222 17 Chandigarh 0 451 451 0 0 0 0 451 451 148 3 D & N Haveli 0 273 273 0 10 10 0 283 283 98 26 Daman & Diu 26 492 519 0 26 26 26 519 546 188 22 Lakshadweep 3 64 67 3 3 5 5 67 72 23 9 Pondicherry 821 9486 10307 44 279 323 865 9765 10630 2975 49
all-India 187429 3016844 3204272 69592 121570 191162 257021 3138413 3395434 1025013 11322

Appendix A
NSS Report No. 525: Unorganised Manufacturing sector in India, 2005-06: Employment, Assets and Borrowings. A - 20
Table 2: Number of workers by nature of employment and gender for each State/UTs Urban DME
number of workers full time part time all
number of enterprises State/UT
female male all female male all female male all estimated sample(1) (2) (3) (4) (5) (6) (7) (8) (9) (10) (11) (12)
Andhra Pradesh 18145 92518 110663 3013 2265 5278 21158 94783 115941 14366 178 Arunachal Pradesh 10 124 134 20 21 41 30 145 175 11 2 Assam 1513 15741 17254 3432 800 4232 4945 16541 21486 2143 43 Bihar 1444 11124 12568 1117 433 1550 2561 11557 14118 1692 43 Chhattisgarh 1346 19750 21096 55 345 400 1401 20094 21495 2821 47 Delhi 3814 246726 250541 2308 238 2547 6122 246965 253087 30979 229 Goa 1057 3518 4575 36 109 145 1093 3627 4720 539 17 Gujarat 13859 576282 590141 5222 15809 21031 19081 592090 611172 53024 365 Haryana 4272 83024 87296 2669 307 2977 6941 83331 90273 11656 312 Himachal Pradesh 228 4994 5222 212 699 911 440 5692 6133 593 55 Jammu & Kashmir 603 11157 11760 63 257 319 666 11414 12080 1272 83 Jharkhand 2365 22466 24831 122 63 185 2488 22528 25016 1248 32 Karnataka 61556 119088 180644 5373 5325 10698 66930 124413 191342 21349 209 Kerala 30247 62136 92383 7931 3363 11294 38178 65499 103677 11080 194 Madhya Pradesh 1886 39575 41461 876 2489 3364 2762 42064 44825 4857 189 Maharashtra 43272 854099 897371 4783 11735 16518 48055 865834 913889 93855 1101 Manipur 335 1882 2217 0 0 0 335 1882 2217 228 24 Meghalaya 182 1358 1540 0 95 95 182 1453 1635 179 16 Mizoram 458 383 841 7 26 32 465 408 873 63 12 Nagaland 6 369 375 38 130 168 44 499 543 68 11 Orissa 5824 25214 31038 1719 1419 3138 7543 26633 34176 3406 80 Punjab 3097 83346 86443 315 735 1050 3412 84081 87493 10686 315 Rajasthan 1075 130740 131815 7261 1138 8399 8336 131878 140214 15609 330 Sikkim 0 203 203 0 14 14 0 216 216 28 10 Tamil Nadu 124088 320610 444699 8277 8199 16476 132365 328809 461174 46236 530 Tripura 188 1515 1703 26 19 45 214 1533 1748 256 29 Uttaranchal 2 5833 5835 0 508 508 2 6341 6343 735 13 Uttar Pradesh 10165 332085 342250 6167 15760 21927 16332 347846 364178 41561 561 West Bengal 21968 323395 345363 12918 21400 34318 34886 344794 379680 41238 466 A & N Islands 0 646 646 0 0 0 0 646 646 75 6 Chandigarh 6 215 221 0 1 1 6 216 223 15 12 D & N Haveli 5 268 272 0 0 0 5 268 272 6 5 Daman & Diu 106 168 274 0 0 0 106 168 274 28 2 Lakshadweep 4 23 27 0 0 0 4 23 27 4 2 Pondicherry 2768 7769 10538 950 243 1193 3718 8012 11730 1448 18
all-India 355898 3398342 3754240 74910 93943 168853 430808 3492286 3923093 413355 5541
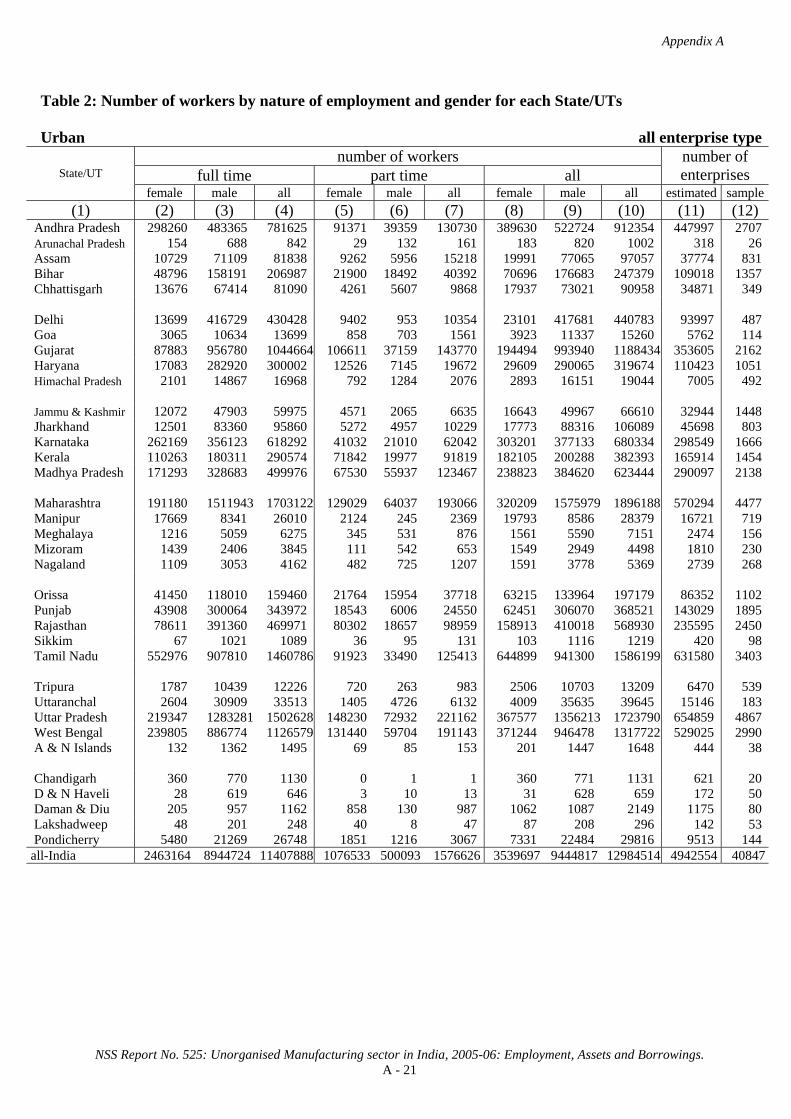
Appendix A
NSS Report No. 525: Unorganised Manufacturing sector in India, 2005-06: Employment, Assets and Borrowings. A - 21
Table 2: Number of workers by nature of employment and gender for each State/UTs Urban all enterprise type
number of workers full time part time all
number of enterprises State/UT
female male all female male all female male all estimated sample(1) (2) (3) (4) (5) (6) (7) (8) (9) (10) (11) (12)
Andhra Pradesh 298260 483365 781625 91371 39359 130730 389630 522724 912354 447997 2707 Arunachal Pradesh 154 688 842 29 132 161 183 820 1002 318 26 Assam 10729 71109 81838 9262 5956 15218 19991 77065 97057 37774 831 Bihar 48796 158191 206987 21900 18492 40392 70696 176683 247379 109018 1357 Chhattisgarh 13676 67414 81090 4261 5607 9868 17937 73021 90958 34871 349 Delhi 13699 416729 430428 9402 953 10354 23101 417681 440783 93997 487 Goa 3065 10634 13699 858 703 1561 3923 11337 15260 5762 114 Gujarat 87883 956780 1044664 106611 37159 143770 194494 993940 1188434 353605 2162 Haryana 17083 282920 300002 12526 7145 19672 29609 290065 319674 110423 1051 Himachal Pradesh 2101 14867 16968 792 1284 2076 2893 16151 19044 7005 492 Jammu & Kashmir 12072 47903 59975 4571 2065 6635 16643 49967 66610 32944 1448 Jharkhand 12501 83360 95860 5272 4957 10229 17773 88316 106089 45698 803 Karnataka 262169 356123 618292 41032 21010 62042 303201 377133 680334 298549 1666 Kerala 110263 180311 290574 71842 19977 91819 182105 200288 382393 165914 1454 Madhya Pradesh 171293 328683 499976 67530 55937 123467 238823 384620 623444 290097 2138 Maharashtra 191180 1511943 1703122 129029 64037 193066 320209 1575979 1896188 570294 4477 Manipur 17669 8341 26010 2124 245 2369 19793 8586 28379 16721 719 Meghalaya 1216 5059 6275 345 531 876 1561 5590 7151 2474 156 Mizoram 1439 2406 3845 111 542 653 1549 2949 4498 1810 230 Nagaland 1109 3053 4162 482 725 1207 1591 3778 5369 2739 268 Orissa 41450 118010 159460 21764 15954 37718 63215 133964 197179 86352 1102 Punjab 43908 300064 343972 18543 6006 24550 62451 306070 368521 143029 1895 Rajasthan 78611 391360 469971 80302 18657 98959 158913 410018 568930 235595 2450 Sikkim 67 1021 1089 36 95 131 103 1116 1219 420 98 Tamil Nadu 552976 907810 1460786 91923 33490 125413 644899 941300 1586199 631580 3403 Tripura 1787 10439 12226 720 263 983 2506 10703 13209 6470 539 Uttaranchal 2604 30909 33513 1405 4726 6132 4009 35635 39645 15146 183 Uttar Pradesh 219347 1283281 1502628 148230 72932 221162 367577 1356213 1723790 654859 4867 West Bengal 239805 886774 1126579 131440 59704 191143 371244 946478 1317722 529025 2990 A & N Islands 132 1362 1495 69 85 153 201 1447 1648 444 38 Chandigarh 360 770 1130 0 1 1 360 771 1131 621 20 D & N Haveli 28 619 646 3 10 13 31 628 659 172 50 Daman & Diu 205 957 1162 858 130 987 1062 1087 2149 1175 80 Lakshadweep 48 201 248 40 8 47 87 208 296 142 53 Pondicherry 5480 21269 26748 1851 1216 3067 7331 22484 29816 9513 144
all-India 2463164 8944724 11407888 1076533 500093 1576626 3539697 9444817 12984514 4942554 40847
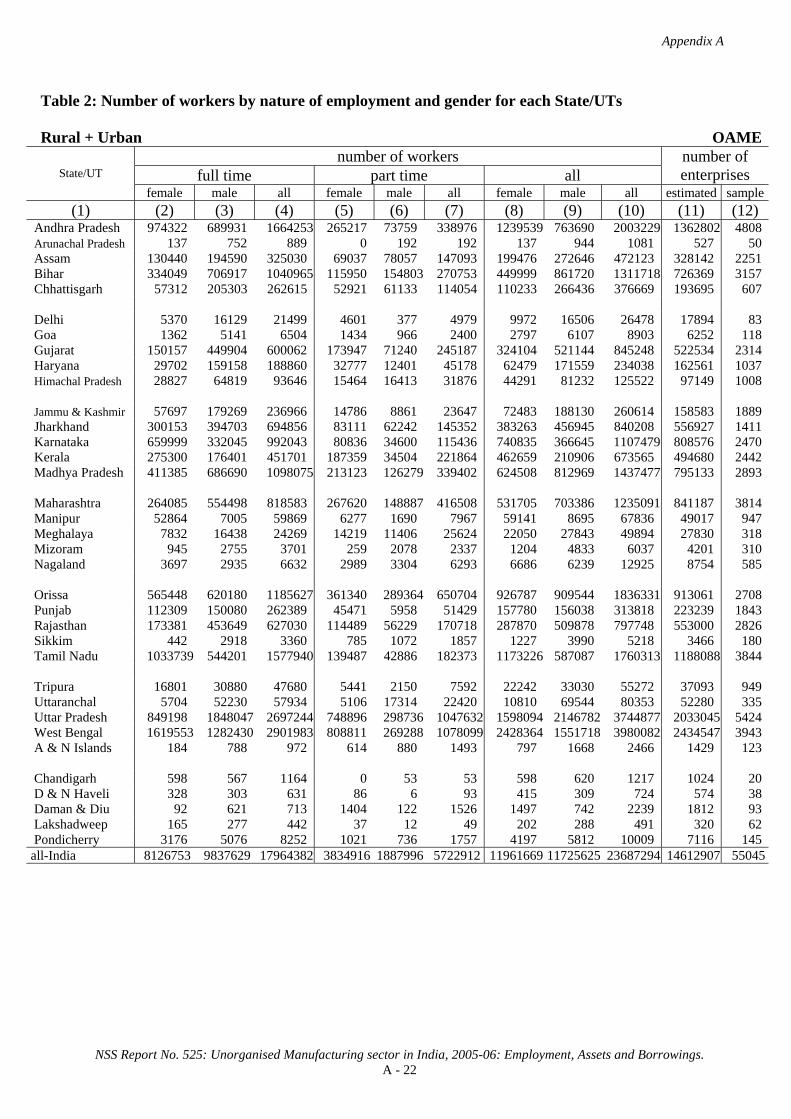
Appendix A
NSS Report No. 525: Unorganised Manufacturing sector in India, 2005-06: Employment, Assets and Borrowings. A - 22
Table 2: Number of workers by nature of employment and gender for each State/UTs Rural + Urban OAME
number of workers full time part time all
number of enterprises State/UT
female male all female male all female male all estimated sample(1) (2) (3) (4) (5) (6) (7) (8) (9) (10) (11) (12)
Andhra Pradesh 974322 689931 1664253 265217 73759 338976 1239539 763690 2003229 1362802 4808 Arunachal Pradesh 137 752 889 0 192 192 137 944 1081 527 50 Assam 130440 194590 325030 69037 78057 147093 199476 272646 472123 328142 2251 Bihar 334049 706917 1040965 115950 154803 270753 449999 861720 1311718 726369 3157 Chhattisgarh 57312 205303 262615 52921 61133 114054 110233 266436 376669 193695 607 Delhi 5370 16129 21499 4601 377 4979 9972 16506 26478 17894 83 Goa 1362 5141 6504 1434 966 2400 2797 6107 8903 6252 118 Gujarat 150157 449904 600062 173947 71240 245187 324104 521144 845248 522534 2314 Haryana 29702 159158 188860 32777 12401 45178 62479 171559 234038 162561 1037 Himachal Pradesh 28827 64819 93646 15464 16413 31876 44291 81232 125522 97149 1008 Jammu & Kashmir 57697 179269 236966 14786 8861 23647 72483 188130 260614 158583 1889 Jharkhand 300153 394703 694856 83111 62242 145352 383263 456945 840208 556927 1411 Karnataka 659999 332045 992043 80836 34600 115436 740835 366645 1107479 808576 2470 Kerala 275300 176401 451701 187359 34504 221864 462659 210906 673565 494680 2442 Madhya Pradesh 411385 686690 1098075 213123 126279 339402 624508 812969 1437477 795133 2893 Maharashtra 264085 554498 818583 267620 148887 416508 531705 703386 1235091 841187 3814 Manipur 52864 7005 59869 6277 1690 7967 59141 8695 67836 49017 947 Meghalaya 7832 16438 24269 14219 11406 25624 22050 27843 49894 27830 318 Mizoram 945 2755 3701 259 2078 2337 1204 4833 6037 4201 310 Nagaland 3697 2935 6632 2989 3304 6293 6686 6239 12925 8754 585 Orissa 565448 620180 1185627 361340 289364 650704 926787 909544 1836331 913061 2708 Punjab 112309 150080 262389 45471 5958 51429 157780 156038 313818 223239 1843 Rajasthan 173381 453649 627030 114489 56229 170718 287870 509878 797748 553000 2826 Sikkim 442 2918 3360 785 1072 1857 1227 3990 5218 3466 180 Tamil Nadu 1033739 544201 1577940 139487 42886 182373 1173226 587087 1760313 1188088 3844 Tripura 16801 30880 47680 5441 2150 7592 22242 33030 55272 37093 949 Uttaranchal 5704 52230 57934 5106 17314 22420 10810 69544 80353 52280 335 Uttar Pradesh 849198 1848047 2697244 748896 298736 1047632 1598094 2146782 3744877 2033045 5424 West Bengal 1619553 1282430 2901983 808811 269288 1078099 2428364 1551718 3980082 2434547 3943 A & N Islands 184 788 972 614 880 1493 797 1668 2466 1429 123 Chandigarh 598 567 1164 0 53 53 598 620 1217 1024 20 D & N Haveli 328 303 631 86 6 93 415 309 724 574 38 Daman & Diu 92 621 713 1404 122 1526 1497 742 2239 1812 93 Lakshadweep 165 277 442 37 12 49 202 288 491 320 62 Pondicherry 3176 5076 8252 1021 736 1757 4197 5812 10009 7116 145
all-India 8126753 9837629 17964382 3834916 1887996 5722912 11961669 11725625 23687294 14612907 55045

Appendix A
NSS Report No. 525: Unorganised Manufacturing sector in India, 2005-06: Employment, Assets and Borrowings. A - 23
Table 2: Number of workers by nature of employment and gender for each State/UTs Rural + Urban NDME
number of workers full time part time all
number of enterprises State/UT
female male all female male all female male all estimated sample(1) (2) (3) (4) (5) (6) (7) (8) (9) (10) (11) (12)
Andhra Pradesh 50220 295937 346157 14633 16386 31020 64853 312323 377177 114958 1203 Arunachal Pradesh 16 808 824 9 82 91 25 890 915 310 47 Assam 8142 93255 101396 3436 9582 13018 11578 102836 114414 38228 590 Bihar 5069 95854 100923 654 18488 19142 5723 114342 120065 43407 572 Chhattisgarh 2618 31247 33866 71 1702 1772 2689 32949 35638 9632 141 Delhi 4974 160202 165176 2492 337 2829 7466 160538 168005 47700 219 Goa 1295 7521 8815 190 332 522 1485 7852 9337 3059 81 Gujarat 3730 212634 216364 4056 8629 12685 7786 221263 229049 68736 660 Haryana 2212 166421 168632 1787 2688 4476 3999 169109 173108 52586 545 Himachal Pradesh 1219 20999 22218 339 2171 2510 1558 23170 24729 8927 322 Jammu & Kashmir 1595 32779 34374 467 2096 2564 2062 34875 36937 12474 511 Jharkhand 650 72486 73136 356 2187 2542 1006 74673 75678 26829 313 Karnataka 19850 221160 241010 8312 14130 22442 28163 235289 263452 81071 603 Kerala 91926 267731 359657 25791 33794 59585 117717 301525 419241 133741 1298 Madhya Pradesh 14035 144063 158098 1314 4623 5937 15349 148686 164035 45067 482 Maharashtra 24837 513085 537922 14558 26644 41203 39395 539730 579125 174625 1341 Manipur 984 8138 9122 53 284 338 1038 8422 9460 3152 181 Meghalaya 1827 17081 18908 692 3187 3879 2519 20268 22787 7847 177 Mizoram 446 1586 2032 46 404 450 491 1990 2482 820 128 Nagaland 92 2381 2473 105 241 345 197 2622 2819 1078 94 Orissa 6432 82314 88747 4784 13264 18048 11216 95579 106795 37330 397 Punjab 5543 175244 180787 1843 4417 6260 7387 179660 187047 58142 811 Rajasthan 5333 183609 188942 5452 8997 14449 10785 192606 203391 61608 839 Sikkim 102 1516 1618 14 76 89 116 1592 1708 583 64 Tamil Nadu 110023 541315 651338 43915 16765 60680 153938 558080 712018 205965 1615 Tripura 731 67706 68437 240 831 1071 971 68537 69508 7756 580 Uttaranchal 1259 36726 37985 644 3159 3802 1903 39885 41787 13906 182 Uttar Pradesh 13680 732913 746593 15175 26946 42121 28855 759859 788714 258904 1968 West Bengal 46413 704888 751301 22463 45946 68409 68877 750834 819711 245846 1787 A & N Islands 119 1628 1747 124 206 330 243 1834 2077 710 77 Chandigarh 5 929 935 0 0 0 5 929 935 303 16 D & N Haveli 44 806 849 0 100 100 44 906 949 345 57 Daman & Diu 26 907 933 0 28 28 26 935 962 320 42 Lakshadweep 3 163 165 3 3 5 5 165 170 71 17 Pondicherry 1352 12936 14288 166 734 900 1518 13670 15188 4245 100
all-India 426801 4908967 5335768 174185 269458 443643 600987 5178425 5779412 1770282 18060

Appendix A
NSS Report No. 525: Unorganised Manufacturing sector in India, 2005-06: Employment, Assets and Borrowings. A - 24
Table 2: Number of workers by nature of employment and gender for each State/UTs Rural + Urban DME
number of workers full time part time all
number of enterprises State/UT
female male all female male all female male all estimated sample(1) (2) (3) (4) (5) (6) (7) (8) (9) (10) (11) (12)
Andhra Pradesh 199188 329644 528833 13969 15737 29707 213158 345382 558540 55479 572 Arunachal Pradesh 98 1166 1264 20 21 41 118 1187 1305 22 5 Assam 4314 34615 38929 4975 2040 7015 9289 36655 45944 4411 74 Bihar 2226 16720 18946 1117 1227 2344 3343 17947 21290 2621 96 Chhattisgarh 6455 38543 44998 436 625 1061 6891 39168 46059 4153 129 Delhi 4130 255290 259420 2524 782 3306 6654 256071 262726 32041 256 Goa 1970 8019 9989 112 146 257 2082 8164 10246 997 62 Gujarat 24501 727842 752343 5682 19810 25492 30183 747652 777835 63088 538 Haryana 8070 124548 132618 3585 675 4260 11655 125223 136878 14963 587 Himachal Pradesh 1701 10474 12174 461 2546 3008 2162 13020 15182 1367 173 Jammu & Kashmir 947 19761 20708 84 527 611 1030 20288 21318 2355 131 Jharkhand 3440 29727 33167 128 164 292 3568 29891 33459 2192 54 Karnataka 186925 313867 500791 53145 49501 102646 240070 363367 603438 72113 363 Kerala 105509 168311 273820 13068 11312 24380 118577 179623 298200 30271 396 Madhya Pradesh 14241 108500 122741 1569 14824 16393 15810 123324 139134 14359 404 Maharashtra 72659 992992 1065651 6962 14589 21551 79621 1007581 1087201 110650 1285 Manipur 371 3636 4007 15 51 66 386 3687 4074 349 34 Meghalaya 357 8187 8544 5923 3288 9212 6280 11475 17756 1310 49 Mizoram 462 434 895 8 26 33 469 459 928 80 15 Nagaland 11 385 396 38 130 168 49 515 564 75 14 Orissa 14929 61554 76483 1919 2013 3932 16848 63567 80415 6838 187 Punjab 3310 93845 97155 344 2445 2789 3654 96290 99944 11856 371 Rajasthan 9314 269036 278350 14490 1356 15847 23804 270392 294196 21862 817 Sikkim 154 459 613 39 48 88 194 507 701 54 18 Tamil Nadu 302096 566019 868115 17214 11859 29073 319310 577878 897188 87880 1142 Tripura 5560 14443 20003 35 42 77 5595 14486 20080 521 77 Uttaranchal 60 24838 24898 37 763 799 97 25601 25697 2902 43 Uttar Pradesh 43012 669379 712391 16394 25525 41919 59406 694904 754310 67426 853 West Bengal 53281 567220 620501 37404 36134 73539 90685 603355 694040 72400 880 A & N Islands 216 1034 1250 110 136 245 326 1169 1495 177 19 Chandigarh 10 436 446 0 1 1 10 437 447 46 22 D & N Haveli 18 560 578 0 13 13 18 573 591 50 24 Daman & Diu 237 4660 4897 0 453 453 237 5112 5350 507 22 Lakshadweep 4 47 51 0 0 0 4 47 51 7 4 Pondicherry 6404 11430 17834 1248 429 1677 7652 11859 19511 2210 76
all-India 1076181 5477619 6553800 203056 219238 422294 1279237 5696857 6976094 687632 9792

Appendix A
NSS Report No. 525: Unorganised Manufacturing sector in India, 2005-06: Employment, Assets and Borrowings. A - 25
Table 2: Number of workers by nature of employment and gender for each State/UTs Rural + Urban all enterprise type
number of workers full time part time all
number of enterprises State/UT
female male all female male all female male all estimated sample(1) (2) (3) (4) (5) (6) (7) (8) (9) (10) (11) (12)
Andhra Pradesh 1223730 1315512 2539242 293819 105883 399703 1517550 1421395 2938945 1533239 6583 Arunachal Pradesh 251 2726 2977 29 295 324 280 3021 3301 859 102 Assam 142896 322460 465355 77447 89678 167126 220343 412138 632481 370781 2915 Bihar 341344 819490 1160834 117721 174519 292239 459065 994009 1453073 772397 3825 Chhattisgarh 66385 275093 341479 53428 63459 116887 119813 338553 458366 207481 877 Delhi 14474 431620 446094 9618 1496 11114 24092 433116 457208 97636 558 Goa 4627 20681 25308 1736 1443 3179 6363 22124 28487 10308 261 Gujarat 178388 1390380 1568769 183685 99678 283363 362073 1490059 1852132 654358 3512 Haryana 39984 450126 490110 38149 15765 53914 78133 465891 544024 230110 2169 Himachal Pradesh 31747 96292 128039 16264 21130 37394 48011 117422 165433 107442 1503 Jammu & Kashmir 60239 231809 292048 15337 11485 26821 75576 243293 318869 173412 2531 Jharkhand 304242 496916 801158 83595 64592 148187 387837 561508 949345 585948 1778 Karnataka 866774 867071 1733845 142294 98230 240524 1009068 965301 1974369 961761 3436 Kerala 472735 612443 1085178 226218 79610 305829 698953 692053 1391006 658692 4136 Madhya Pradesh 439661 939253 1378913 216007 145725 361732 655668 1084978 1740646 854559 3779 Maharashtra 361581 2060575 2422156 289140 190121 479261 650721 2250696 2901417 1126462 6440 Manipur 54219 18780 72999 6346 2025 8371 60565 20805 81370 52518 1162 Meghalaya 10015 41706 51722 20834 17880 38715 30850 59587 90437 36987 544 Mizoram 1852 4775 6628 313 2507 2820 2165 7282 9447 5101 453 Nagaland 3800 5701 9501 3131 3675 6806 6931 9376 16307 9906 693 Orissa 586809 764048 1350857 368042 304642 672684 954851 1068690 2023541 957229 3292 Punjab 121162 419169 540331 47659 12820 60479 168821 431989 600810 293237 3025 Rajasthan 188028 906294 1094322 134431 66582 201013 322459 972876 1295335 636470 4482 Sikkim 698 4893 5591 838 1196 2034 1536 6089 7626 4103 262 Tamil Nadu 1445858 1651535 3097393 200616 71510 272126 1646474 1723045 3369519 1481933 6601 Tripura 23092 113029 136121 5716 3024 8740 28808 116053 144860 45370 1606 Uttaranchal 7023 113794 120817 5787 21235 27022 12810 135029 147838 69087 560 Uttar Pradesh 905889 3250339 4156229 780466 351206 1131672 1686356 3601545 5287901 2359375 8245 West Bengal 1719248 2554539 4273786 868679 351368 1220047 2587926 2905907 5493833 2752793 6610 A & N Islands 519 3450 3969 847 1222 2069 1366 4671 6037 2316 219 Chandigarh 613 1932 2545 0 54 54 613 1986 2599 1373 58 D & N Haveli 390 1669 2059 86 119 205 476 1788 2264 969 119 Daman & Diu 356 6187 6543 1404 603 2007 1760 6790 8550 2639 157 Lakshadweep 172 486 658 40 14 54 212 500 712 397 83 Pondicherry 10933 29442 40374 2435 1899 4334 13368 31341 44709 13572 321
all-India 9629735 20224215 29853950 4212157 2376692 6588850 13841892 22600907 36442799 17070820 82897

Appendix A
NSS Report No. 525: Unorganised Manufacturing Sector in India, 2005-06: Employment, Assets and Borrowings. A - 26
Table 3: Number of workers by type of worker and gender for each industry Rural OAME all-India
number of workers working owners hired workers other workers total workers
industry (NIC 2004) female male all female male all female male all female male all
sample number
of workers
(1) (2) (3) (4) (5) (6) (7) (8) (9) (10) (11) (12) (13) (14) 01405 3721 2866 6587 0 0 0 1388 288 1676 5109 3154 8263 64
15 466019 1569887 2035906 247 5970 6216 620058 653929 1273987 1086324 2229785 3316109 10701 16 1834455 658866 2493321 0 0 0 751075 141919 892995 2585530 800785 3386315 2328 17 1002043 740272 1742315 113 218 330 793008 267509 1060517 1795164 1007999 2803163 4836 18 894020 954238 1848258 797 2541 3339 245086 115296 360383 1139904 1072076 2211979 9227
19 1611 34006 35617 0 2 2 850 8097 8947 2461 42105 44567 239 20 545651 1478020 2023671 6503 1284 7787 815844 404456 1220301 1367998 1883761 3251759 7828 21 95249 9558 104806 0 0 0 50593 4172 54764 145842 13729 159571 220 22 2199 8981 11180 0 134 134 855 1704 2559 3055 10819 13874 176 23 136 2339 2475 0 0 0 813 3043 3856 949 5383 6332 64
24 292025 42206 334231 395 2494 2889 73184 3753 76938 365604 48453 414058 719 25 6313 8764 15077 0 467 467 9474 5846 15321 15788 15078 30865 142 26 86196 471373 557569 874 1984 2858 302899 221663 524562 389969 695019 1084988 5290 27 126 9579 9705 0 0 0 522 1867 2389 649 11446 12095 116 28 7742 320867 328610 35 1603 1638 47095 109672 156767 54873 432142 487014 2496
29 2988 59944 62932 0 7 7 4481 26938 31419 7469 86889 94359 611 30 0 57 57 0 0 0 0 0 0 0 57 57 1 31 140 47542 47682 0 2 2 290 6631 6921 430 54174 54605 389 32 0 1379 1379 0 0 0 0 0 0 0 1379 1379 9 33 0 151 151 0 0 0 0 50 50 0 202 202 6
34 0 716 716 0 0 0 64 440 504 64 1156 1220 20 35 369 5058 5427 0 0 0 43 1330 1373 413 6388 6800 46 36 75480 379262 454742 360 661 1021 66162 109400 175562 142002 489323 631325 3596 37 0 205 205 0 0 0 205 0 205 205 205 410 2 all 5316484 6806137 12122621 9324 17367 26691 3783992 2088003 5871995 9109800 8911508 18021308 49126

Appendix A
NSS Report No. 525: Unorganised Manufacturing Sector in India, 2005-06: Employment, Assets and Borrowings. A - 27
Table 3: Number of workers by type of worker and gender for each industry Rural NDME all-India
number of workers working owners hired workers other workers total workers
industry (NIC 2004) female male all female male all female male all female male all
sample number of workers
(1) (2) (3) (4) (5) (6) (7) (8) (9) (10) (11) (12) (13) (14) 01405 0 268 268 0 272 272 0 0 0 0 540 540 15
15 11597 203947 215544 29112 272421 301533 21943 64284 86227 62652 540652 603304 12685 16 221 4992 5214 5757 4562 10319 1122 2285 3408 7101 11840 18940 166 17 21057 111828 132885 48958 188398 237356 90100 27422 117522 160115 327648 487763 1927 18 12666 116212 128878 26279 156386 182665 7753 16455 24208 46699 289052 335751 2990
19 189 3462 3650 243 5056 5300 121 1576 1697 553 10093 10647 112 20 805 72390 73195 3695 108343 112038 1082 21312 22395 5582 202045 207628 2121 21 1564 119 1683 3484 79 3564 110 1572 1682 5158 1771 6929 65 22 783 5221 6004 3816 5141 8956 451 934 1385 5050 11295 16345 266 23 22 1939 1960 0 3544 3544 1 298 299 23 5781 5803 54
24 251 4582 4833 2832 7354 10186 1298 405 1703 4380 12340 16721 355 25 355 7201 7556 3716 10973 14689 1585 1201 2786 5656 19375 25031 340 26 2544 31016 33560 8454 59996 68450 10675 8773 19448 21673 99785 121458 1444 27 49 2585 2634 0 5750 5750 346 222 568 394 8557 8951 160 28 1171 61858 63029 1684 95690 97374 931 23340 24271 3786 180887 184674 2185
29 3 9105 9108 1 11720 11721 82 1406 1488 85 22231 22317 460 30 - - - - - - - - - - - - 0 31 257 8446 8703 8231 8988 17219 0 1921 1921 8488 19355 27843 334 32 0 481 481 0 428 428 0 0 0 0 909 909 8 33 0 1153 1153 0 3559 3559 0 0 0 0 4712 4712 12
34 1 1758 1759 0 2306 2306 0 164 164 1 4229 4230 107 35 36 1030 1066 72 1487 1559 0 144 144 108 2661 2769 108 36 1752 95051 96803 2497 148899 151395 1791 19817 21608 6040 263766 269806 3008 37 0 237 237 421 137 557 0 113 113 421 487 908 33 all 55321 744881 800202 149252 1101487 1250739 139392 193644 333036 343966 2040012 2383977 28955

Appendix A
NSS Report No. 525: Unorganised Manufacturing Sector in India, 2005-06: Employment, Assets and Borrowings. A - 28
Table 3: Number of workers by type of worker and gender for each industry Rural DME all-India
number of workers working owners hired workers other workers total workers
industry (NIC 2004) female male all female male all female male all female male all
sample number of workers
(1) (2) (3) (4) (5) (6) (7) (8) (9) (10) (11) (12) (13) (14) 01405 7 511 517 781 2289 3070 36 271 307 823 3070 3894 346
15 5073 145154 150227 325950 466039 791990 41328 60760 102088 372351 671953 1044304 9207 16 150 1286 1436 5856 7337 13194 833 308 1141 6840 8931 15771 296 17 10474 56753 67226 104317 258557 362874 36637 21067 57705 151428 336377 487805 5676 18 610 3603 4214 14333 17414 31747 385 1705 2089 15328 22722 38050 748
19 859 2716 3575 3703 20467 24170 1535 8323 9858 6098 31506 37604 312 20 290 8595 8885 12304 43299 55603 458 1358 1816 13052 53252 66303 1753 21 53 2463 2516 1871 12110 13981 2 2931 2933 1925 17504 19430 535 22 25 2044 2068 299 21177 21475 50 225 274 373 23445 23818 218 23 66 682 748 933 3353 4286 266 875 1141 1264 4910 6174 220
24 1462 18946 20408 60561 65656 126216 1942 20012 21954 63964 104614 168578 3056 25 966 3410 4376 8229 16398 24627 413 903 1316 9608 20711 30319 1524 26 3487 54846 58333 151173 505855 657028 11458 30252 41710 166118 590952 757070 25940 27 87 1956 2043 1027 9433 10460 2 293 295 1117 11682 12799 949 28 109 5616 5725 890 29968 30858 95 2528 2622 1094 38111 39205 1873
29 85 1832 1917 108 9205 9314 373 355 728 567 11392 11959 578 30 - - - - - - - - - - - - 0 31 178 654 832 631 4568 5199 8 414 422 817 5636 6452 565 32 213 458 671 1063 3793 4857 0 0 0 1276 4251 5527 24 33 2 64 66 10 379 389 0 29 29 12 473 485 76
34 55 4480 4534 181 35766 35947 72 3039 3111 308 43285 43592 292 35 28 137 165 1250 1431 2681 0 245 245 1278 1813 3091 394 36 328 21666 21994 30335 168668 199003 1879 5664 7543 32542 195998 228540 2619 37 0 295 295 248 1685 1933 0 3 3 248 1983 2231 80 all 24605 338165 362770 726053 1704847 2430900 97772 161559 259330 848429 2204571 3053000 57281
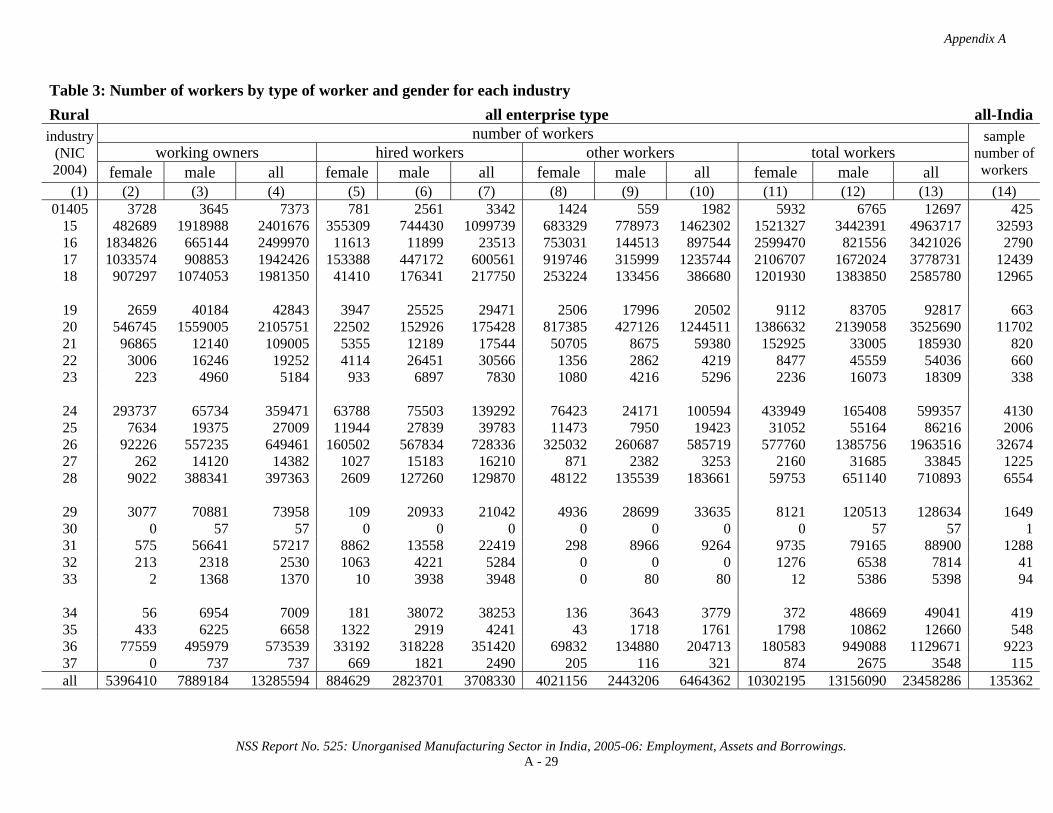
Appendix A
NSS Report No. 525: Unorganised Manufacturing Sector in India, 2005-06: Employment, Assets and Borrowings. A - 29
Table 3: Number of workers by type of worker and gender for each industry Rural all enterprise type all-India
number of workers working owners hired workers other workers total workers
industry (NIC 2004) female male all female male all female male all female male all
sample number of workers
(1) (2) (3) (4) (5) (6) (7) (8) (9) (10) (11) (12) (13) (14) 01405 3728 3645 7373 781 2561 3342 1424 559 1982 5932 6765 12697 425
15 482689 1918988 2401676 355309 744430 1099739 683329 778973 1462302 1521327 3442391 4963717 32593 16 1834826 665144 2499970 11613 11899 23513 753031 144513 897544 2599470 821556 3421026 2790 17 1033574 908853 1942426 153388 447172 600561 919746 315999 1235744 2106707 1672024 3778731 12439 18 907297 1074053 1981350 41410 176341 217750 253224 133456 386680 1201930 1383850 2585780 12965
19 2659 40184 42843 3947 25525 29471 2506 17996 20502 9112 83705 92817 663 20 546745 1559005 2105751 22502 152926 175428 817385 427126 1244511 1386632 2139058 3525690 11702 21 96865 12140 109005 5355 12189 17544 50705 8675 59380 152925 33005 185930 820 22 3006 16246 19252 4114 26451 30566 1356 2862 4219 8477 45559 54036 660 23 223 4960 5184 933 6897 7830 1080 4216 5296 2236 16073 18309 338
24 293737 65734 359471 63788 75503 139292 76423 24171 100594 433949 165408 599357 4130 25 7634 19375 27009 11944 27839 39783 11473 7950 19423 31052 55164 86216 2006 26 92226 557235 649461 160502 567834 728336 325032 260687 585719 577760 1385756 1963516 32674 27 262 14120 14382 1027 15183 16210 871 2382 3253 2160 31685 33845 1225 28 9022 388341 397363 2609 127260 129870 48122 135539 183661 59753 651140 710893 6554
29 3077 70881 73958 109 20933 21042 4936 28699 33635 8121 120513 128634 1649 30 0 57 57 0 0 0 0 0 0 0 57 57 1 31 575 56641 57217 8862 13558 22419 298 8966 9264 9735 79165 88900 1288 32 213 2318 2530 1063 4221 5284 0 0 0 1276 6538 7814 41 33 2 1368 1370 10 3938 3948 0 80 80 12 5386 5398 94
34 56 6954 7009 181 38072 38253 136 3643 3779 372 48669 49041 419 35 433 6225 6658 1322 2919 4241 43 1718 1761 1798 10862 12660 548 36 77559 495979 573539 33192 318228 351420 69832 134880 204713 180583 949088 1129671 9223 37 0 737 737 669 1821 2490 205 116 321 874 2675 3548 115 all 5396410 7889184 13285594 884629 2823701 3708330 4021156 2443206 6464362 10302195 13156090 23458286 135362
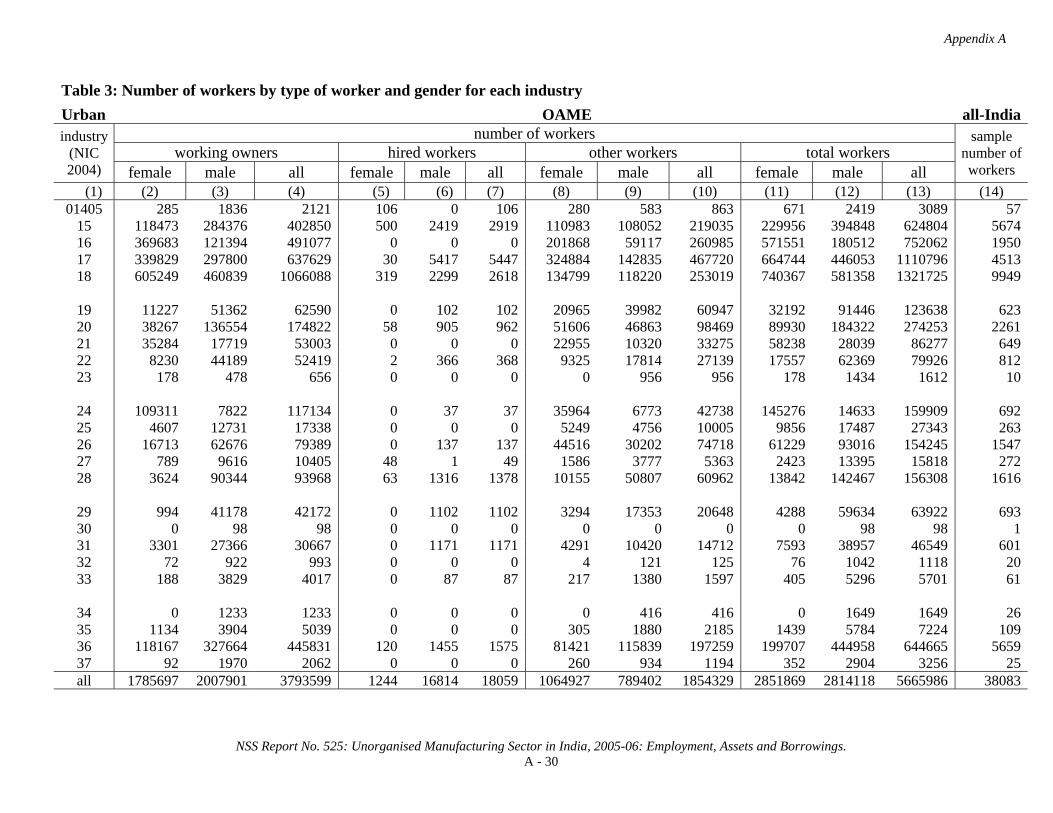
Appendix A
NSS Report No. 525: Unorganised Manufacturing Sector in India, 2005-06: Employment, Assets and Borrowings. A - 30
Table 3: Number of workers by type of worker and gender for each industry Urban OAME all-India
number of workers working owners hired workers other workers total workers
industry (NIC 2004) female male all female male all female male all female male all
sample number of workers
(1) (2) (3) (4) (5) (6) (7) (8) (9) (10) (11) (12) (13) (14) 01405 285 1836 2121 106 0 106 280 583 863 671 2419 3089 57
15 118473 284376 402850 500 2419 2919 110983 108052 219035 229956 394848 624804 5674 16 369683 121394 491077 0 0 0 201868 59117 260985 571551 180512 752062 1950 17 339829 297800 637629 30 5417 5447 324884 142835 467720 664744 446053 1110796 4513 18 605249 460839 1066088 319 2299 2618 134799 118220 253019 740367 581358 1321725 9949
19 11227 51362 62590 0 102 102 20965 39982 60947 32192 91446 123638 623 20 38267 136554 174822 58 905 962 51606 46863 98469 89930 184322 274253 2261 21 35284 17719 53003 0 0 0 22955 10320 33275 58238 28039 86277 649 22 8230 44189 52419 2 366 368 9325 17814 27139 17557 62369 79926 812 23 178 478 656 0 0 0 0 956 956 178 1434 1612 10
24 109311 7822 117134 0 37 37 35964 6773 42738 145276 14633 159909 692 25 4607 12731 17338 0 0 0 5249 4756 10005 9856 17487 27343 263 26 16713 62676 79389 0 137 137 44516 30202 74718 61229 93016 154245 1547 27 789 9616 10405 48 1 49 1586 3777 5363 2423 13395 15818 272 28 3624 90344 93968 63 1316 1378 10155 50807 60962 13842 142467 156308 1616
29 994 41178 42172 0 1102 1102 3294 17353 20648 4288 59634 63922 693 30 0 98 98 0 0 0 0 0 0 0 98 98 1 31 3301 27366 30667 0 1171 1171 4291 10420 14712 7593 38957 46549 601 32 72 922 993 0 0 0 4 121 125 76 1042 1118 20 33 188 3829 4017 0 87 87 217 1380 1597 405 5296 5701 61
34 0 1233 1233 0 0 0 0 416 416 0 1649 1649 26 35 1134 3904 5039 0 0 0 305 1880 2185 1439 5784 7224 109 36 118167 327664 445831 120 1455 1575 81421 115839 197259 199707 444958 644665 5659 37 92 1970 2062 0 0 0 260 934 1194 352 2904 3256 25 all 1785697 2007901 3793599 1244 16814 18059 1064927 789402 1854329 2851869 2814118 5665986 38083

Appendix A
NSS Report No. 525: Unorganised Manufacturing Sector in India, 2005-06: Employment, Assets and Borrowings. A - 31
Table 3: Number of workers by type of worker and gender for each industry Urban NDME all-India
number of workers working owners hired workers other workers total workers
industry (NIC 2004) female male all female male all female male all female male all
sample number of workers
(1) (2) (3) (4) (5) (6) (7) (8) (9) (10) (11) (12) (13) (14) 01405 0 949 949 11 1463 1474 24 54 78 35 2466 2502 42
15 14015 155426 169441 21520 237574 259093 12968 42499 55468 48504 435499 484002 5764 16 3886 3339 7226 3915 4069 7984 237 0 237 8038 7408 15446 89 17 7615 114739 122354 23658 236731 260388 37096 33506 70602 68368 384976 453344 2942 18 20722 187744 208466 33000 332441 365441 7429 26025 33454 61152 546209 607361 7485
19 69 36788 36857 1091 70744 71835 403 8879 9282 1563 116412 117975 804 20 1666 56011 57677 2125 98900 101025 521 13173 13694 4312 168084 172396 2012 21 751 13531 14283 1801 24167 25968 395 1738 2132 2947 39436 42383 384 22 2940 41771 44711 7235 70467 77702 1095 8264 9358 11270 120502 131772 1871 23 0 185 185 0 389 389 0 0 0 0 574 574 13
24 587 5193 5779 2334 7572 9906 719 622 1342 3640 13388 17028 302 25 991 18693 19683 4935 36992 41926 2628 4531 7158 8553 60215 68768 759 26 1023 25347 26370 3275 49124 52399 2215 7764 9979 6513 82235 88748 933 27 175 7939 8114 397 14086 14483 338 1330 1667 910 23354 24264 430 28 2114 128385 130499 3922 238181 242103 1343 29598 30941 7380 396164 403543 4026
29 1981 47249 49230 2416 87244 89660 171 12404 12575 4569 146897 151465 1438 30 0 533 533 0 777 777 0 35 35 0 1344 1344 19 31 313 28170 28483 984 37397 38380 314 2852 3166 1611 68418 70030 1041 32 49 1157 1206 209 1561 1770 0 46 46 258 2765 3022 62 33 26 3450 3476 219 6406 6624 481 454 935 725 10310 11036 146
34 26 5744 5770 638 10476 11114 48 1994 2042 713 18213 18926 268 35 74 5563 5637 0 12982 12982 0 718 718 74 19264 19338 333 36 4115 160499 164613 8337 278858 287195 3322 33249 36571 15773 472606 488379 5723 37 1 720 721 106 934 1041 6 21 27 114 1675 1789 49 all 63140 1049125 1112264 122127 1859532 1981660 71754 229756 301510 257021 3138413 3395434 36935

Appendix A
NSS Report No. 525: Unorganised Manufacturing Sector in India, 2005-06: Employment, Assets and Borrowings. A - 32
Table 3: Number of workers by type of worker and gender for each industry Urban DME all-India
number of workers working owners hired workers other workers total workers
industry (NIC 2004) female male all female male all female male all female male all
sample number of workers
(1) (2) (3) (4) (5) (6) (7) (8) (9) (10) (11) (12) (13) (14) 01405 1 130 131 15 1189 1205 0 46 46 17 1365 1382 137
15 3985 43357 47342 47665 153185 200850 5924 19129 25053 57574 215671 273245 11315 16 2 1454 1456 994 7072 8066 180 280 459 1176 8805 9981 480 17 10994 114825 125819 106639 682153 788792 41014 44048 85062 158647 841026 999673 8720 18 4514 54683 59197 37392 295263 332655 3801 19312 23113 45707 369258 414964 4938
19 2382 15892 18274 6108 108338 114446 725 5724 6449 9215 129954 139168 1946 20 1260 14402 15663 3774 60030 63804 404 6865 7269 5438 81297 86735 2719 21 792 4800 5593 7814 23545 31358 206 2472 2678 8812 30817 39629 1492 22 2638 22126 24764 16285 98509 114794 1241 4252 5492 20164 124886 145050 3256 23 0 280 280 12 1274 1286 18 50 68 30 1605 1635 198
24 885 12983 13869 16700 50862 67563 2176 4084 6260 19761 67930 87692 3294 25 4034 12411 16445 10137 62540 72677 3007 2864 5871 17178 77815 94993 3247 26 2086 13389 15475 16812 81050 97862 2848 13415 16264 21746 107853 129600 2526 27 326 5171 5497 371 31428 31799 278 1359 1637 975 37958 38933 1818 28 3896 50212 54107 10699 300933 311632 749 20986 21735 15343 372131 387474 6229
29 769 26917 27686 7787 195346 203133 301 5174 5475 8857 227437 236294 6504 30 20 137 158 943 7433 8377 94 0 94 1058 7570 8628 215 31 1067 8751 9817 5752 44377 50129 104 3590 3694 6923 56717 63640 3564 32 280 1645 1924 622 8486 9108 43 538 581 944 10668 11613 476 33 300 1437 1737 1042 7784 8826 0 103 103 1342 9325 10666 651
34 146 3413 3559 1406 17092 18498 0 375 375 1552 20881 22432 1134 35 246 9541 9787 1380 52886 54266 1 7270 7271 1627 69697 71324 905 36 2735 62633 65368 18975 541481 560456 1746 15048 16794 23456 619162 642618 5424 37 0 631 631 3267 1827 5094 0 0 0 3267 2457 5725 131 all 43357 481220 524577 322591 2834083 3156674 64859 176983 241842 430808 3492286 3923093 71319

Appendix A
NSS Report No. 525: Unorganised Manufacturing Sector in India, 2005-06: Employment, Assets and Borrowings. A - 33
Table 3: Number of workers by type of worker and gender for each industry Urban all enterprise type all-India
number of workers working owners hired workers other workers total workers
industry (NIC 2004) female male all female male all female male all female male all
sample number
of workers
(1) (2) (3) (4) (5) (6) (7) (8) (9) (10) (11) (12) (13) (14) 01405 286 2915 3201 132 2652 2784 305 683 988 722 6250 6972 236
15 136474 483159 619633 69685 393178 462863 129875 169681 299556 336033 1046018 1382051 22753 16 373571 126187 499759 4909 11141 16050 202284 59397 261681 580765 196725 777490 2519 17 358438 527364 885802 130326 924301 1054627 402994 220390 623384 891758 1672054 2563813 16175 18 630485 703265 1333750 70711 630003 700714 146029 163557 309586 847226 1496825 2344051 22372
19 13678 104042 117720 7198 179184 186383 22093 54585 76678 42969 337812 380781 3373 20 41194 206968 248161 5956 159835 165791 52531 66901 119432 99681 433704 533384 6992 21 36827 36050 72878 9614 47712 57326 23555 14530 38085 69997 98292 168289 2525 22 13809 108086 121894 23523 169342 192864 11660 30330 41990 48992 307757 356749 5939 23 178 944 1122 12 1663 1675 18 1006 1024 208 3613 3821 221
24 110783 25999 136782 19034 58472 77506 38859 11480 50340 168677 95951 264628 4288 25 9632 43835 53466 15072 99532 114603 10884 12151 23035 35587 155517 191104 4269 26 19822 101412 121234 20087 130311 150398 49579 51381 100961 89488 283104 372592 5006 27 1289 22727 24016 816 45515 46331 2202 6465 8667 4308 74707 79015 2520 28 9634 268941 278575 14684 540429 555113 12247 101391 113638 36565 910761 947326 11871
29 3744 115344 119088 10203 283692 293895 3766 34931 38698 17714 433967 451681 8635 30 20 768 788 943 8210 9153 94 35 129 1058 9013 10070 235 31 4681 64286 68967 6736 82944 89680 4710 16862 21572 16126 164092 180219 5206 32 400 3724 4124 830 10048 10878 47 704 751 1278 14475 15753 558 33 514 8716 9230 1260 14277 15537 697 1938 2636 2472 24931 27403 858
34 172 10390 10562 2044 27568 29612 48 2785 2834 2265 40743 43007 1428 35 1454 19008 20462 1380 65869 67249 306 9868 10174 3140 94745 97885 1347 36 125016 550796 675812 27431 821794 849226 86488 164135 250624 238936 1536726 1775662 16806 37 93 3321 3414 3374 2761 6134 266 954 1221 3733 7036 10769 205 all 1892195 3538246 5430440 445963 4710429 5156392 1201539 1196142 2397681 3539697 9444817 12984514 146337

Appendix A
NSS Report No. 525: Unorganised Manufacturing Sector in India, 2005-06: Employment, Assets and Borrowings. A - 34
Table 3: Number of workers by type of worker and gender for each industry Rural + Urban OAME all-India
number of workers working owners hired workers other workers total workers
industry (NIC 2004) female male all female male all female male all female male all
sample number of workers
(1) (2) (3) (4) (5) (6) (7) (8) (9) (10) (11) (12) (13) (14) 01405 4006 4702 8708 106 0 106 1668 871 2539 5780 5573 11352 121
15 584492 1854263 2438756 746 8389 9135 731041 761981 1493022 1316280 2624633 3940913 16375 16 2204137 780260 2984397 0 0 0 952943 201036 1153980 3157080 981297 4138377 4278 17 1341872 1038073 2379944 142 5635 5777 1117893 410344 1528237 2459907 1454052 3913959 9349 18 1499269 1415077 2914346 1117 4840 5957 379885 233517 613402 1880271 1653434 3533705 19176
19 12839 85368 98207 0 104 104 21815 48079 69894 34653 133551 168205 862 20 583918 1614574 2198492 6560 2189 8749 867450 451320 1318770 1457929 2068083 3526012 10089 21 130533 27276 157809 0 0 0 73548 14492 88039 204080 41768 245848 869 22 10429 53170 63600 2 500 502 10181 19518 29699 20612 73188 93800 988 23 314 2818 3132 0 0 0 813 3999 4813 1127 6817 7944 74
24 401336 50028 451364 395 2532 2927 109149 10527 119675 510880 63086 573966 1411 25 10920 21495 32416 0 467 467 14723 10602 25326 25644 32565 58209 405 26 102908 534049 636958 874 2121 2996 347415 251865 599280 451198 788035 1239233 6837 27 915 19195 20111 48 1 49 2108 5644 7752 3072 24841 27912 388 28 11367 411211 422578 98 2918 3016 57250 160479 217729 68715 574608 643323 4112
29 3982 101122 105104 0 1110 1110 7775 44291 52066 11757 146523 158280 1304 30 0 155 155 0 0 0 0 0 0 0 155 155 2 31 3442 74907 78349 0 1173 1173 4581 17051 21632 8023 93131 101154 990 32 72 2300 2372 0 0 0 4 121 125 76 2421 2497 29 33 188 3980 4168 0 87 87 217 1431 1647 405 5497 5902 67
34 0 1949 1949 0 0 0 64 856 920 64 2805 2869 46 35 1504 8962 10466 0 0 0 348 3210 3558 1852 12172 14024 155 36 193647 706927 900573 480 2116 2596 147582 225239 372821 341709 934282 1275990 9255 37 92 2175 2267 0 0 0 465 934 1399 557 3108 3665 27 all 7102181 8814039 15916220 10569 34181 44750 4848919 2877406 7726324 11961669 11725625 23687294 87209

Appendix A
NSS Report No. 525: Unorganised Manufacturing Sector in India, 2005-06: Employment, Assets and Borrowings. A - 35
Table 3: Number of workers by type of worker and gender for each industry Rural + Urban NDME all-India
number of workers working owners hired workers other workers total workers
industry (NIC 2004) female male all female male all female male all female male all
sample number
of workers
(1) (2) (3) (4) (5) (6) (7) (8) (9) (10) (11) (12) (13) (14) 01405 0 1218 1218 11 1735 1746 24 54 78 35 3006 3042 57
15 25612 359373 384985 50632 509994 560627 34911 106783 141695 111155 976151 1087306 18449 16 4108 8332 12439 9672 8631 18303 1359 2285 3644 15139 19248 34387 255 17 28672 226567 255239 72616 425128 497744 127196 60929 188124 228484 712624 941107 4869 18 33389 303955 337344 59279 488826 548106 15182 42480 57662 107851 835262 943112 10475
19 257 40250 40507 1334 75800 77135 524 10455 10979 2116 126505 128621 916 20 2471 128401 130872 5820 207243 213063 1603 34485 36088 9895 370129 380024 4133 21 2315 13651 15966 5285 24246 29531 505 3310 3815 8105 41207 49312 449 22 3723 46992 50715 11051 75608 86659 1546 9197 10743 16320 131797 148117 2137 23 22 2124 2145 0 3933 3933 1 298 299 23 6355 6377 67
24 837 9775 10612 5166 14926 20092 2017 1027 3044 8020 25728 33748 657 25 1346 25894 27239 8650 47965 56615 4213 5731 9945 14209 79590 93799 1099 26 3567 56363 59930 11729 109119 120849 12890 16537 29427 28186 182020 210205 2377 27 223 10524 10748 397 19835 20233 684 1552 2236 1305 31911 33216 590 28 3285 190243 193528 5606 333870 339477 2275 52937 55212 11166 577051 588217 6211
29 1984 56354 58338 2417 98964 101381 253 13810 14063 4654 169128 173782 1898 30 0 533 533 0 777 777 0 35 35 0 1344 1344 19 31 570 36616 37186 9214 46385 55599 314 4773 5088 10099 87773 97872 1375 32 49 1638 1687 209 1989 2198 0 46 46 258 3673 3931 70 33 26 4603 4629 219 9965 10183 481 454 935 725 15023 15748 158
34 27 7502 7529 638 12782 13420 48 2158 2206 714 22442 23156 375 35 110 6593 6703 72 14470 14542 0 862 862 182 21925 22107 441 36 5867 255550 261416 10833 427756 438590 5113 53066 58179 21813 736372 758185 8731 37 1 957 959 527 1071 1598 6 134 140 535 2162 2697 82 all 118461 1794006 1912466 271380 2961019 3232399 211146 423400 634546 600987 5178425 5779412 65890

Appendix A
NSS Report No. 525: Unorganised Manufacturing Sector in India, 2005-06: Employment, Assets and Borrowings. A - 36
Table 3: Number of workers by type of worker and gender for each industry Rural + Urban DME all-India
number of workers working owners hired workers other workers total workers
industry (NIC 2004) female male all female male all female male all female male all
sample number of workers
(1) (2) (3) (4) (5) (6) (7) (8) (9) (10) (11) (12) (13) (14) 01405 8 640 648 796 3478 4275 36 317 353 840 4436 5276 483
15 9058 188511 197569 373615 619224 992840 47251 79889 127141 429925 887625 1317549 20522 16 153 2740 2892 6850 14410 21260 1013 587 1600 8016 17737 25752 776 17 21468 171578 193046 210956 940710 1151666 77651 65115 142766 310075 1177403 1487478 14396 18 5124 58286 63410 51725 312677 364402 4185 21016 25202 61035 391979 453014 5686
19 3241 18608 21849 9811 128805 138616 2260 14047 16307 15312 161460 176772 2258 20 1550 22998 24547 16078 103329 119406 862 8222 9085 18490 134549 153038 4472 21 845 7263 8108 9684 35655 45339 208 5403 5611 10737 48321 59058 2027 22 2663 24169 26832 16584 119685 136269 1290 4476 5767 20537 148331 168868 3474 23 66 963 1028 945 4627 5572 284 925 1209 1294 6514 7809 418
24 2347 31929 34277 77261 116518 193779 4117 24097 28214 83726 172544 256270 6350 25 5000 15821 20821 18366 78938 97304 3421 3767 7188 26786 98526 125312 4771 26 5573 68235 73807 167985 586904 754889 14306 43667 57973 187864 698806 886670 28466 27 413 7127 7540 1398 40861 42259 280 1652 1932 2092 49640 51731 2767 28 4005 55828 59832 11589 330901 342490 843 23514 24357 16437 410242 426679 8102
29 855 28749 29603 7895 204552 212447 674 5529 6203 9424 238829 248253 7082 30 20 137 158 943 7433 8377 94 0 94 1058 7570 8628 215 31 1244 9404 10649 6383 48945 55327 112 4004 4116 7739 62353 70092 4129 32 492 2102 2595 1685 12280 13965 43 538 581 2220 14920 17140 500 33 302 1501 1803 1051 8164 9215 0 133 133 1354 9797 11151 727
34 200 7893 8094 1587 52858 54445 72 3414 3486 1859 64165 66025 1426 35 273 9678 9952 2630 54317 56948 1 7514 7516 2905 71510 74415 1299 36 3062 84299 87361 49310 710150 759460 3625 20712 24337 55997 815160 871158 8043 37 0 926 926 3515 3511 7026 0 3 3 3515 4440 7955 211 all 67962 819385 887347 1048644 4538930 5587574 162631 338541 501172 1279237 5696857 6976094 128600

Appendix A
NSS Report No. 525: Unorganised Manufacturing Sector in India, 2005-06: Employment, Assets and Borrowings. A - 37
Table 3: Number of workers by type of worker and gender for each industry Rural + Urban all enterprise type all-India
number of workers working owners hired workers other workers total workers
industry (NIC 2004) female male all female male all female male all female male all
sample number of workers
(1) (2) (3) (4) (5) (6) (7) (8) (9) (10) (11) (12) (13) (14) 01405 4014 6559 10573 913 5213 6126 1728 1242 2970 6655 13015 19669 661
15 619162 2402147 3021309 424994 1137608 1562601 813204 948654 1761857 1857360 4488408 6345768 55346 16 2208398 791332 2999729 16522 23041 39563 955315 203909 1159224 3180235 1018281 4198516 5309 17 1392012 1436217 2828229 283715 1371473 1655188 1322740 536388 1859128 2998466 3344078 6342544 28614 18 1537782 1777318 3315100 112121 806343 918464 399253 297013 696266 2049156 2880675 4929831 35337
19 16337 144226 160563 11145 204709 215854 24599 72581 97180 52081 421516 473598 4036 20 587939 1765973 2353912 28458 312761 341219 869916 494027 1363943 1486313 2572761 4059074 18694 21 133693 48191 181883 14969 59901 74870 74260 23205 97465 222922 131297 354218 3345 22 16815 124332 141147 27637 195793 223430 13017 33192 46209 57469 353316 410785 6599 23 401 5904 6305 945 8560 9505 1098 5222 6320 2444 19686 22130 559
24 404520 91732 496253 82823 133975 216798 115283 35651 150934 602626 261358 863984 8418 25 17266 63210 80476 27016 127370 154386 22357 20101 42458 66639 210681 277320 6275 26 112048 658647 770695 180589 698145 878733 374612 312069 686680 667248 1668860 2336108 37680 27 1552 36847 38399 1844 60697 62541 3072 8848 11920 6468 106392 112860 3745 28 18656 657282 675938 17293 667689 684983 60368 236930 297299 96318 1561901 1658219 18425
29 6821 186225 193046 10312 304625 314937 8702 63630 72332 25835 554480 580315 10284 30 20 825 846 943 8210 9153 94 35 129 1058 9070 10128 236 31 5256 120927 126184 15597 96502 112099 5008 25828 30836 25861 243257 269118 6494 32 613 6041 6654 1894 14269 16162 47 704 751 2554 21014 23567 599 33 516 10084 10600 1270 18216 19485 697 2018 2715 2484 30317 32801 952
34 227 17344 17571 2226 65640 67865 184 6428 6613 2637 89412 92049 1847 35 1887 25233 27121 2702 68787 71490 349 11586 11935 4939 105607 110546 1895 36 202575 1046776 1249351 60623 1140022 1200646 156321 299016 455336 419519 2485814 2905333 26029 37 93 4058 4151 4042 4582 8624 471 1071 1541 4606 9711 14317 320 all 7288604 11427430 18716034 1330592 7534130 8864723 5222695 3639347 8862043 13841892 22600907 36442799 281699

Appendix A
NSS Report No. 525: Unorganised Manufacturing Sector in India, 2005-06: Employment, Assets and Borrowings. A - 38
Table 3: Number of workers by type of worker and gender for each State/UT Rural OAME
number of workers working owners hired workers other workers total workers State/UT
female male all female male all female male all female male all
sample number of workers
(1) (2) (3) (4) (5) (6) (7) (8) (9) (10) (11) (12) (13) (14) Andhra Pradesh 626146 444200 1070346 519 280 799 279651 83406 363057 906316 527886 1434202 4402 Arunachal Pradesh 1 308 309 0 119 119 1 97 98 2 524 526 62 Assam 107921 199310 307231 51 434 485 80923 50303 131226 188895 250047 438942 2638 Bihar 159424 593045 752469 188 1846 2034 223981 161363 385344 383593 756254 1139847 3870 Chhattisgarh 12809 176121 188930 0 0 0 83469 65286 148755 96278 241407 337685 699
Delhi 282 509 791 0 0 0 0 135 135 282 644 926 18 Goa 1167 3376 4542 0 0 0 167 150 317 1333 3526 4859 118 Gujarat 79002 255982 334984 0 0 0 76075 47513 123588 155076 303495 458571 1621 Haryana 32637 80096 112733 0 2 2 10577 14858 25436 43215 94956 138171 895 Himachal Pradesh 35824 69478 105302 0 0 0 6537 7519 14056 42361 76997 119358 942
Jammu & Kashmir 35215 115132 150347 0 0 0 22505 51184 73689 57720 166316 224036 1870 Jharkhand 225837 330162 555999 0 282 282 142910 91118 234028 368747 421562 790309 1440 Karnataka 400475 186922 587397 0 123 123 117381 75035 192416 517856 262079 779936 2054 Kerala 300216 133552 433768 454 1175 1629 44376 24438 68814 345046 159165 504212 2357 Madhya Pradesh 100850 471247 572096 0 3 3 294321 107146 401466 395170 578395 973566 2354
Maharashtra 183301 338837 522138 0 638 638 104218 88587 192805 287519 428062 715581 2293 Manipur 31282 4502 35784 110 105 215 9119 1934 11053 40510 6541 47051 538 Meghalaya 15303 18253 33556 0 2 2 6248 8549 14797 21551 26804 48356 447 Mizoram 521 3337 3858 30 54 84 39 419 458 590 3810 4400 251 Nagaland 3572 3592 7165 0 45 45 1613 1232 2845 5185 4870 10055 585
Orissa 319657 637632 957289 911 1424 2335 553035 200364 753399 873603 839420 1713023 3573 Punjab 83275 67080 150355 0 108 108 21338 10702 32040 104613 77890 182503 1209 Rajasthan 101218 300252 401470 0 656 656 39881 56291 96172 141099 357199 498298 1810 Sikkim 784 3009 3793 5 0 5 378 663 1041 1166 3672 4839 202 Tamil Nadu 512120 225381 737501 0 0 0 211612 73447 285059 723731 298828 1022559 2733
Tripura 13223 24494 37717 72 270 342 7260 5026 12286 20555 29790 50345 991 Uttaranchal 4070 42301 46370 0 0 0 4337 16168 20505 8407 58468 66875 376 Uttar Pradesh 727088 1129005 1856093 674 7604 8278 537016 484552 1021568 1264779 1621160 2885939 4485 West Bengal 1201076 945628 2146704 6310 2159 8469 903790 360014 1263804 2111175 1307801 3418977 3906 A & N Islands 103 1179 1283 0 36 36 549 355 903 652 1571 2222 170
Chandigarh 175 510 685 0 0 0 69 6 75 244 516 760 24 D & N Haveli 299 231 530 0 0 0 89 0 89 389 231 620 24 Daman & Diu 551 301 852 0 0 0 16 41 57 567 342 909 46 Lakshadweep 43 161 204 0 0 0 81 8 90 124 170 294 28 Pondicherry 1018 1012 2029 0 0 0 432 93 524 1450 1104 2554 95 all-India 5316484 6806137 12122621 9324 17367 26691 3783992 2088003 5871995 9109800 8911508 18021308 49126

Appendix A
NSS Report No. 525: Unorganised Manufacturing Sector in India, 2005-06: Employment, Assets and Borrowings. A - 39
Table 3: Number of workers by type of worker and gender for each State/UT Rural NDME
number of workers working owners hired workers other workers total workers State/UT
female male all female male all female male all female male all
sample number of workers
(1) (2) (3) (4) (5) (6) (7) (8) (9) (10) (11) (12) (13) (14) Andhra Pradesh 4461 41556 46017 9132 67665 76798 16010 10965 26975 29603 120187 149790 1747 Arunachal Pradesh 2 256 258 0 373 373 5 7 12 7 636 643 119 Assam 1976 23381 25356 4397 34951 39348 741 6579 7319 7113 64911 72024 785 Bihar 81 24787 24868 3679 24708 28386 234 5188 5422 3993 54682 58676 656 Chhattisgarh 37 1342 1379 22 3409 3431 49 299 349 109 5051 5159 172
Delhi 177 1633 1810 0 4051 4051 0 0 0 177 5684 5861 103 Goa 87 886 973 27 1615 1642 4 223 227 118 2724 2842 118 Gujarat 166 14536 14702 157 20319 20476 1078 2208 3286 1401 37062 38464 434 Haryana 453 14160 14613 65 23116 23181 77 1703 1780 595 38978 39573 632 Himachal Pradesh 504 7300 7804 348 8836 9184 182 811 993 1035 16947 17981 445
Jammu & Kashmir 362 7376 7737 461 9667 10128 27 1093 1120 849 18136 18985 511 Jharkhand 164 16641 16805 0 21209 21209 74 6417 6491 237 44267 44504 253 Karnataka 2855 29885 32740 4619 45254 49874 7395 11994 19390 14870 87134 102004 584 Kerala 23498 78786 102283 56967 122017 178984 10937 17674 28612 91402 218476 309879 2583 Madhya Pradesh 368 13111 13480 1123 23944 25067 7134 3647 10781 8625 40702 49328 350
Maharashtra 3409 37714 41123 3263 57769 61032 4756 9425 14181 11428 104908 116335 640 Manipur 126 1467 1593 79 2326 2404 6 80 86 211 3872 4083 148 Meghalaya 633 6278 6911 572 10149 10721 434 743 1177 1639 17170 18809 317 Mizoram 15 256 270 7 206 213 0 11 11 22 473 494 112 Nagaland 66 290 356 64 360 424 20 61 82 150 712 862 79
Orissa 21 19643 19664 8131 32571 40702 577 6157 6734 8729 58371 67100 533 Punjab 581 15102 15683 885 19369 20255 48 1348 1396 1514 35819 37334 484 Rajasthan 173 26579 26752 2526 35557 38083 4281 5009 9290 6979 67145 74124 982 Sikkim 73 394 467 0 601 601 0 16 16 73 1010 1083 56 Tamil Nadu 2818 87844 90662 23174 139140 162314 64908 6863 71771 90900 233848 324747 2286
Tripura 124 24146 24270 176 20380 20556 66 18081 18148 366 62608 62974 8901 Uttaranchal 149 7929 8078 150 12738 12888 0 998 998 299 21665 21964 258 Uttar Pradesh 3556 108598 112154 434 134488 134922 6935 34028 40963 10926 277114 288039 1657 West Bengal 8071 130780 138851 28359 220872 249231 13277 41416 54693 49708 393068 442775 2420 A & N Islands 52 427 478 81 620 701 54 84 139 187 1131 1318 179
Chandigarh 3 268 271 3 199 202 0 11 11 5 478 484 45 D & N Haveli 34 230 265 9 393 402 0 0 0 44 623 667 107 Daman & Diu 0 134 134 0 273 273 0 9 9 0 416 416 68 Lakshadweep 0 48 48 0 49 49 0 1 1 0 99 99 18 Pondicherry 227 1120 1347 343 2293 2635 83 493 576 653 3905 4558 173 all-India 55321 744881 800202 149252 1101487 1250739 139392 193644 333036 343966 2040012 2383977 28955
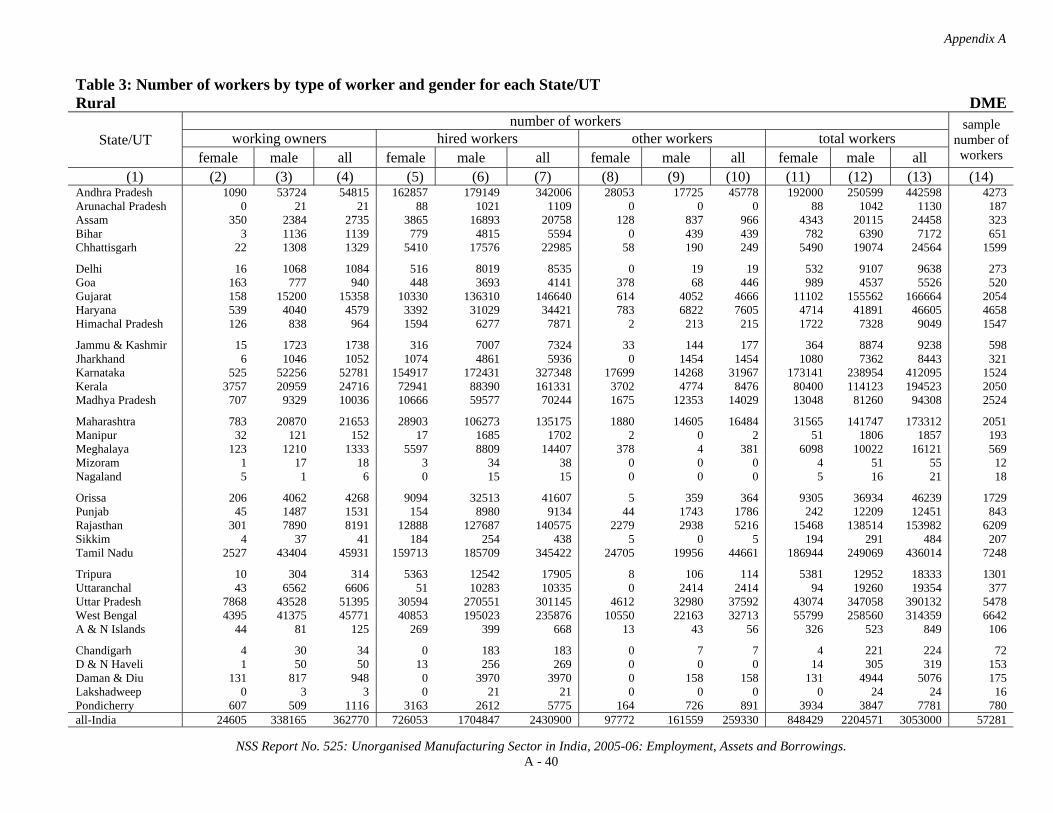
Appendix A
NSS Report No. 525: Unorganised Manufacturing Sector in India, 2005-06: Employment, Assets and Borrowings. A - 40
Table 3: Number of workers by type of worker and gender for each State/UT Rural DME
number of workers working owners hired workers other workers total workers State/UT
female male all female male all female male all female male all
sample number of workers
(1) (2) (3) (4) (5) (6) (7) (8) (9) (10) (11) (12) (13) (14) Andhra Pradesh 1090 53724 54815 162857 179149 342006 28053 17725 45778 192000 250599 442598 4273 Arunachal Pradesh 0 21 21 88 1021 1109 0 0 0 88 1042 1130 187 Assam 350 2384 2735 3865 16893 20758 128 837 966 4343 20115 24458 323 Bihar 3 1136 1139 779 4815 5594 0 439 439 782 6390 7172 651 Chhattisgarh 22 1308 1329 5410 17576 22985 58 190 249 5490 19074 24564 1599
Delhi 16 1068 1084 516 8019 8535 0 19 19 532 9107 9638 273 Goa 163 777 940 448 3693 4141 378 68 446 989 4537 5526 520 Gujarat 158 15200 15358 10330 136310 146640 614 4052 4666 11102 155562 166664 2054 Haryana 539 4040 4579 3392 31029 34421 783 6822 7605 4714 41891 46605 4658 Himachal Pradesh 126 838 964 1594 6277 7871 2 213 215 1722 7328 9049 1547
Jammu & Kashmir 15 1723 1738 316 7007 7324 33 144 177 364 8874 9238 598 Jharkhand 6 1046 1052 1074 4861 5936 0 1454 1454 1080 7362 8443 321 Karnataka 525 52256 52781 154917 172431 327348 17699 14268 31967 173141 238954 412095 1524 Kerala 3757 20959 24716 72941 88390 161331 3702 4774 8476 80400 114123 194523 2050 Madhya Pradesh 707 9329 10036 10666 59577 70244 1675 12353 14029 13048 81260 94308 2524
Maharashtra 783 20870 21653 28903 106273 135175 1880 14605 16484 31565 141747 173312 2051 Manipur 32 121 152 17 1685 1702 2 0 2 51 1806 1857 193 Meghalaya 123 1210 1333 5597 8809 14407 378 4 381 6098 10022 16121 569 Mizoram 1 17 18 3 34 38 0 0 0 4 51 55 12 Nagaland 5 1 6 0 15 15 0 0 0 5 16 21 18
Orissa 206 4062 4268 9094 32513 41607 5 359 364 9305 36934 46239 1729 Punjab 45 1487 1531 154 8980 9134 44 1743 1786 242 12209 12451 843 Rajasthan 301 7890 8191 12888 127687 140575 2279 2938 5216 15468 138514 153982 6209 Sikkim 4 37 41 184 254 438 5 0 5 194 291 484 207 Tamil Nadu 2527 43404 45931 159713 185709 345422 24705 19956 44661 186944 249069 436014 7248
Tripura 10 304 314 5363 12542 17905 8 106 114 5381 12952 18333 1301 Uttaranchal 43 6562 6606 51 10283 10335 0 2414 2414 94 19260 19354 377 Uttar Pradesh 7868 43528 51395 30594 270551 301145 4612 32980 37592 43074 347058 390132 5478 West Bengal 4395 41375 45771 40853 195023 235876 10550 22163 32713 55799 258560 314359 6642 A & N Islands 44 81 125 269 399 668 13 43 56 326 523 849 106
Chandigarh 4 30 34 0 183 183 0 7 7 4 221 224 72 D & N Haveli 1 50 50 13 256 269 0 0 0 14 305 319 153 Daman & Diu 131 817 948 0 3970 3970 0 158 158 131 4944 5076 175 Lakshadweep 0 3 3 0 21 21 0 0 0 0 24 24 16 Pondicherry 607 509 1116 3163 2612 5775 164 726 891 3934 3847 7781 780 all-India 24605 338165 362770 726053 1704847 2430900 97772 161559 259330 848429 2204571 3053000 57281

Appendix A
NSS Report No. 525: Unorganised Manufacturing Sector in India, 2005-06: Employment, Assets and Borrowings. A - 41
Table 3: Number of workers by type of worker and gender for each State/UT Rural all enterprise type
number of workers working owners hired workers other workers total workers State/UT
female male all female male all female male all female male all
sample number of workers
(1) (2) (3) (4) (5) (6) (7) (8) (9) (10) (11) (12) (13) (14) Andhra Pradesh 631696 539481 1171177 172508 247095 419603 323715 112096 435811 1127919 898671 2026591 10422 Arunachal Pradesh 3 585 588 88 1513 1601 6 104 110 97 2202 2299 368 Assam 110247 225074 335322 8312 52279 60591 81792 57719 139511 200351 335073 535424 3746 Bihar 159508 618967 778476 4646 31369 36014 224214 166990 391205 388368 817326 1205694 5177 Chhattisgarh 12868 178771 191639 5432 20985 26416 83577 65776 149353 101876 265532 367408 2470
Delhi 475 3210 3685 516 12070 12586 0 155 155 991 15435 16426 394 Goa 1417 5038 6455 475 5308 5783 548 441 989 2440 10787 13227 756 Gujarat 79325 285717 365043 10487 156629 167116 77767 53773 131540 167579 496119 663699 4109 Haryana 33629 98296 131924 3457 54147 57604 11438 23383 34821 48523 175826 224349 6185 Himachal Pradesh 36454 77615 114070 1942 15113 17055 6722 8542 15264 45118 101271 146389 2934
Jammu & Kashmir 35592 124231 159823 777 16674 17451 22565 52421 74986 58934 193326 252259 2979 Jharkhand 226006 347849 573856 1074 26353 27427 142984 98989 241973 370064 473192 843256 2014 Karnataka 403855 269063 672918 159537 217808 377344 142475 101297 243772 705867 588168 1294035 4162 Kerala 327470 233297 560767 130363 211582 341945 59015 46886 105902 516848 491765 1008614 6990 Madhya Pradesh 101925 493687 595612 11790 83525 95314 303130 123146 426276 416844 700358 1117202 5228
Maharashtra 187493 397421 584914 32165 164680 196846 110854 112616 223469 330512 674717 1005229 4984 Manipur 31439 6089 37528 206 4115 4322 9126 2014 11140 40772 12219 52991 879 Meghalaya 16059 25741 41800 6169 18961 25130 7060 9295 16355 29289 53997 83285 1333 Mizoram 536 3609 4146 41 294 335 39 430 469 616 4334 4949 375 Nagaland 3644 3884 7527 64 421 484 1633 1294 2927 5340 5598 10939 682
Orissa 319884 661337 981221 18136 66508 84644 553617 206880 760497 891637 934726 1826362 5835 Punjab 83901 83669 167569 1040 28457 29497 21429 13793 35222 106370 125918 232288 2536 Rajasthan 101692 334721 436413 15414 163900 179314 46441 64238 110678 163546 562859 726405 9001 Sikkim 861 3439 4301 189 855 1044 383 679 1062 1433 4973 6406 465 Tamil Nadu 517465 356629 874094 182887 324849 507736 301224 100267 401491 1001575 781745 1783321 12267
Tripura 13356 48944 62300 5611 33193 38804 7334 23213 30547 26301 105350 131651 11193 Uttaranchal 4262 56792 61053 201 23021 23223 4337 19580 23918 8800 99393 108194 1011 Uttar Pradesh 738512 1281131 2019643 31703 412642 444345 548564 551559 1100123 1318779 2245332 3564111 11620 West Bengal 1213542 1117784 2331326 75523 418053 493576 927617 423593 1351210 2216682 1959429 4176111 12968 A & N Islands 199 1687 1886 350 1055 1405 616 482 1098 1165 3225 4390 455
Chandigarh 181 809 990 3 382 385 69 25 93 253 1215 1468 141 D & N Haveli 335 511 845 22 649 670 89 0 89 446 1159 1605 284 Daman & Diu 682 1252 1935 0 4243 4243 16 208 224 698 5703 6401 289 Lakshadweep 43 213 255 0 70 70 81 10 91 124 292 416 62 Pondicherry 1852 2640 4492 3505 4905 8410 679 1312 1991 6037 8856 14893 1048 all-India 5396410 7889184 13285594 884629 2823701 3708330 4021156 2443206 6464362 10302195 13156090 23458286 135362

Appendix A
NSS Report No. 525: Unorganised Manufacturing Sector in India, 2005-06: Employment, Assets and Borrowings. A - 42
Table 3: Number of workers by type of worker and gender for each State/UT Urban OAME
number of workers working owners hired workers other workers total workers State/UT
female male all female male all female male all female male all
sample number of workers
(1) (2) (3) (4) (5) (6) (7) (8) (9) (10) (11) (12) (13) (14) Andhra Pradesh 214907 162674 377580 106 65 171 118209 73066 191275 333222 235804 569027 2803 Arunachal Pradesh 101 200 301 0 51 51 34 170 203 135 420 556 36 Assam 6690 18033 24723 29 587 616 3862 3979 7841 10581 22599 33180 683 Bihar 25270 72283 97553 48 159 207 41088 33024 74112 66406 105466 171871 1804 Chhattisgarh 8246 17114 25360 0 0 0 5709 7915 13623 13955 25029 38984 345
Delhi 8146 13795 21942 0 0 0 1543 2067 3610 9689 15862 25551 102 Goa 1174 2176 3349 0 0 0 290 405 695 1463 2581 4044 70 Gujarat 110004 164880 274884 0 0 0 59024 52769 111793 169028 217649 386677 2018 Haryana 14631 58398 73028 0 14 14 4634 18192 22825 19264 76603 95867 606 Himachal Pradesh 1470 3961 5431 0 0 0 460 274 734 1929 4235 6164 391
Jammu & Kashmir 11720 16830 28551 0 0 0 3043 4984 8027 14763 21814 36578 1438 Jharkhand 11894 30235 42130 0 507 507 2623 4640 7263 14517 35383 49899 849 Karnataka 157678 73902 231580 0 0 0 65300 30664 95964 222978 104565 327544 1547 Kerala 94234 43843 138077 168 182 349 23211 7715 30926 117613 51740 169353 1106 Madhya Pradesh 127764 157314 285079 106 1536 1641 101468 75723 177191 229338 234573 463911 2696
Maharashtra 174493 186829 361322 200 5416 5616 69493 83079 152572 244186 275323 519510 3440 Manipur 14982 1260 16241 74 4 78 3575 891 4465 18631 2154 20785 732 Meghalaya 356 919 1275 0 0 0 143 119 263 499 1039 1538 119 Mizoram 564 915 1479 18 32 50 33 76 108 615 1023 1638 198 Nagaland 1133 1030 2162 13 24 37 355 316 670 1500 1369 2870 290
Orissa 19289 54967 74256 227 108 334 33669 15049 48718 53184 70124 123308 1369 Punjab 44165 58608 102772 0 205 205 9002 19335 28337 53167 78148 131315 1395 Rajasthan 91600 113238 204838 0 542 542 55171 38899 94070 146771 152679 299450 2660 Sikkim 34 250 284 0 2 2 27 66 93 61 318 379 81 Tamil Nadu 267267 220671 487937 0 1086 1086 182229 66502 248731 449495 288259 737754 2762
Tripura 1341 2748 4089 2 82 84 344 410 754 1687 3240 4927 369 Uttaranchal 1197 7742 8939 0 0 0 1206 3333 4539 2403 11075 13478 138 Uttar Pradesh 157076 341060 498136 157 4979 5136 176082 179583 355665 333315 525622 858937 5480 West Bengal 215098 177934 393032 96 1235 1331 101995 64747 166742 317189 243917 561106 2239 A & N Islands 77 79 156 0 0 0 69 18 87 145 98 243 25
Chandigarh 354 103 457 0 0 0 0 0 0 354 103 457 5 D & N Haveli 26 78 104 0 0 0 0 0 0 26 78 104 30 Daman & Diu 657 318 975 0 0 0 273 82 355 930 400 1330 78 Lakshadweep 44 90 133 0 0 0 35 29 64 78 119 197 72 Pondicherry 2017 3426 5443 0 0 0 730 1281 2012 2748 4707 7455 107 all-India 1785697 2007901 3793599 1244 16814 18059 1064927 789402 1854329 2851869 2814118 5665986 38083

Appendix A
NSS Report No. 525: Unorganised Manufacturing Sector in India, 2005-06: Employment, Assets and Borrowings. A - 43
Table 3: Number of workers by type of worker and gender for each State/UT Urban NDME
number of workers working owners hired workers other workers total workers State/UT
female male all female male all female male all female male all
sample number of workers
(1) (2) (3) (4) (5) (6) (7) (8) (9) (10) (11) (12) (13) (14) Andhra Pradesh 5170 70159 75329 11351 108927 120278 18729 13051 31780 35250 192137 227387 2229 Arunachal Pradesh 9 84 93 0 170 170 9 0 9 18 254 272 32 Assam 980 13107 14088 3043 21867 24910 441 2951 3392 4465 37925 42390 963 Bihar 530 21468 21998 607 33059 33666 593 5133 5726 1730 59660 61390 1091 Chhattisgarh 758 7707 8465 1261 14844 16105 562 5347 5909 2581 27898 30479 325
Delhi 2429 51309 53737 3094 98639 101733 1767 4906 6674 7290 154854 162144 677 Goa 609 1901 2509 634 3091 3725 124 137 261 1367 5129 6495 151 Gujarat 1868 59579 61447 3629 108192 111821 888 16429 17317 6385 184200 190585 1793 Haryana 1842 43341 45183 542 79397 79939 1020 7392 8412 3404 130131 133534 1180 Himachal Pradesh 204 2176 2380 242 3800 4042 77 248 325 524 6223 6747 491
Jammu & Kashmir 426 6520 6946 611 9312 9923 177 908 1085 1213 16739 17953 1082 Jharkhand 299 10985 11283 470 18043 18512 0 1378 1378 769 30405 31174 692 Karnataka 2208 47284 49491 7457 87926 95384 3628 12945 16573 13293 148155 161448 1337 Kerala 6226 30143 36369 16649 47753 64402 3440 5152 8591 26314 83048 109363 1453 Madhya Pradesh 1498 32030 33529 3243 64468 67711 1982 11485 13468 6724 107983 114707 1248
Maharashtra 9230 136263 145493 14355 270512 284867 4382 28047 32429 27967 434822 462789 4009 Manipur 412 1470 1882 416 2863 3279 0 217 217 827 4550 5377 394 Meghalaya 461 889 1349 370 2154 2525 49 56 104 880 3098 3978 225 Mizoram 148 460 608 287 954 1241 35 104 139 470 1517 1987 278 Nagaland 12 758 770 33 1094 1127 2 57 59 46 1910 1956 189
Orissa 794 12698 13492 1420 20518 21938 273 3991 4264 2487 37207 39695 697 Punjab 2275 47704 49980 2821 89716 92537 776 6421 7197 5872 143841 149714 2201 Rajasthan 1554 40616 42170 747 75872 76619 1505 8973 10478 3806 125461 129267 1804 Sikkim 42 187 230 0 369 369 0 26 26 42 582 624 148 Tamil Nadu 10372 113633 124005 36367 197624 233991 16299 12975 29274 63038 324232 387271 3025
Tripura 98 2350 2449 381 3282 3664 125 297 422 605 5929 6534 673 Uttaranchal 696 6615 7312 676 10321 10997 231 1283 1514 1604 18219 19823 268 Uttar Pradesh 4711 167218 171928 5168 260113 265281 8051 55415 63466 17930 482745 500675 4622 West Bengal 7013 116844 123857 5803 216854 222658 6352 24069 30421 19169 357767 376936 3260 A & N Islands 28 194 222 28 490 518 0 18 18 56 703 758 56
Chandigarh 0 195 195 0 257 257 0 0 0 0 451 451 14 D & N Haveli 0 120 120 0 162 162 0 0 0 0 283 283 76 Daman & Diu 26 252 279 0 265 265 0 2 2 26 519 546 64 Lakshadweep 5 18 23 0 46 46 0 3 3 5 67 72 28 Pondicherry 206 2846 3053 422 6576 6998 237 342 579 865 9765 10630 160 all-India 63140 1049125 1112264 122127 1859532 1981660 71754 229756 301510 257021 3138413 3395434 36935
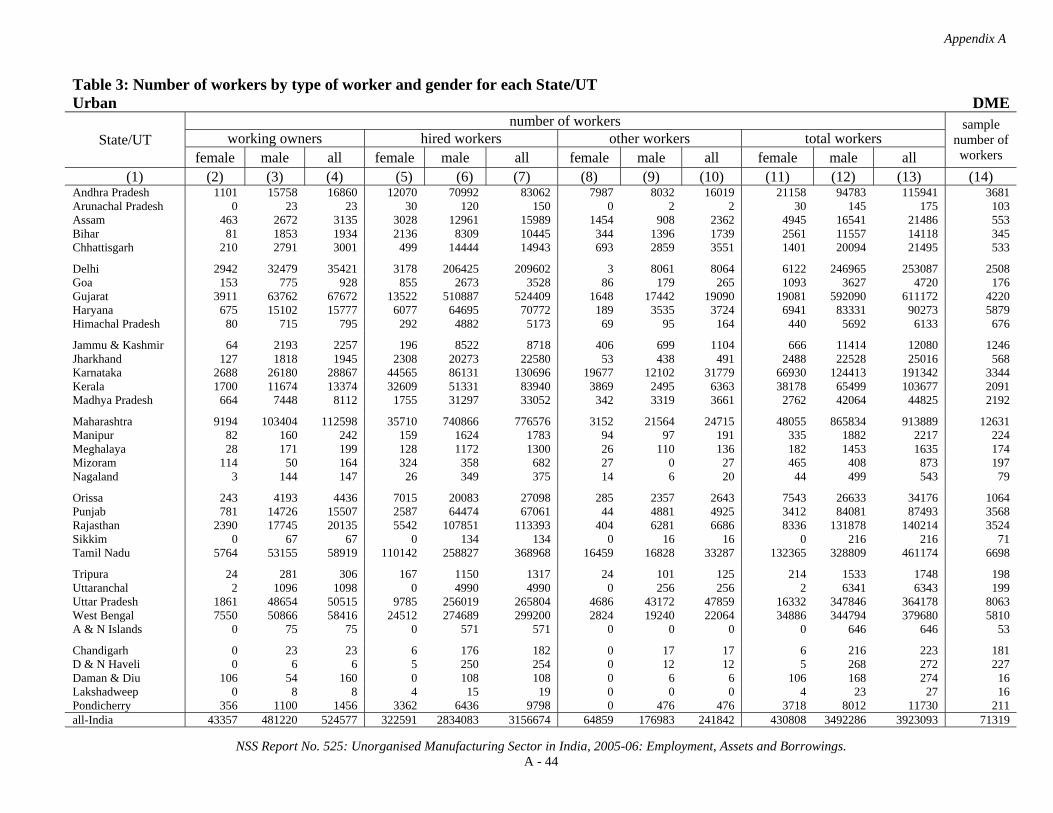
Appendix A
NSS Report No. 525: Unorganised Manufacturing Sector in India, 2005-06: Employment, Assets and Borrowings. A - 44
Table 3: Number of workers by type of worker and gender for each State/UT Urban DME
number of workers working owners hired workers other workers total workers State/UT
female male all female male all female male all female male all
sample number of workers
(1) (2) (3) (4) (5) (6) (7) (8) (9) (10) (11) (12) (13) (14) Andhra Pradesh 1101 15758 16860 12070 70992 83062 7987 8032 16019 21158 94783 115941 3681 Arunachal Pradesh 0 23 23 30 120 150 0 2 2 30 145 175 103 Assam 463 2672 3135 3028 12961 15989 1454 908 2362 4945 16541 21486 553 Bihar 81 1853 1934 2136 8309 10445 344 1396 1739 2561 11557 14118 345 Chhattisgarh 210 2791 3001 499 14444 14943 693 2859 3551 1401 20094 21495 533
Delhi 2942 32479 35421 3178 206425 209602 3 8061 8064 6122 246965 253087 2508 Goa 153 775 928 855 2673 3528 86 179 265 1093 3627 4720 176 Gujarat 3911 63762 67672 13522 510887 524409 1648 17442 19090 19081 592090 611172 4220 Haryana 675 15102 15777 6077 64695 70772 189 3535 3724 6941 83331 90273 5879 Himachal Pradesh 80 715 795 292 4882 5173 69 95 164 440 5692 6133 676
Jammu & Kashmir 64 2193 2257 196 8522 8718 406 699 1104 666 11414 12080 1246 Jharkhand 127 1818 1945 2308 20273 22580 53 438 491 2488 22528 25016 568 Karnataka 2688 26180 28867 44565 86131 130696 19677 12102 31779 66930 124413 191342 3344 Kerala 1700 11674 13374 32609 51331 83940 3869 2495 6363 38178 65499 103677 2091 Madhya Pradesh 664 7448 8112 1755 31297 33052 342 3319 3661 2762 42064 44825 2192
Maharashtra 9194 103404 112598 35710 740866 776576 3152 21564 24715 48055 865834 913889 12631 Manipur 82 160 242 159 1624 1783 94 97 191 335 1882 2217 224 Meghalaya 28 171 199 128 1172 1300 26 110 136 182 1453 1635 174 Mizoram 114 50 164 324 358 682 27 0 27 465 408 873 197 Nagaland 3 144 147 26 349 375 14 6 20 44 499 543 79
Orissa 243 4193 4436 7015 20083 27098 285 2357 2643 7543 26633 34176 1064 Punjab 781 14726 15507 2587 64474 67061 44 4881 4925 3412 84081 87493 3568 Rajasthan 2390 17745 20135 5542 107851 113393 404 6281 6686 8336 131878 140214 3524 Sikkim 0 67 67 0 134 134 0 16 16 0 216 216 71 Tamil Nadu 5764 53155 58919 110142 258827 368968 16459 16828 33287 132365 328809 461174 6698
Tripura 24 281 306 167 1150 1317 24 101 125 214 1533 1748 198 Uttaranchal 2 1096 1098 0 4990 4990 0 256 256 2 6341 6343 199 Uttar Pradesh 1861 48654 50515 9785 256019 265804 4686 43172 47859 16332 347846 364178 8063 West Bengal 7550 50866 58416 24512 274689 299200 2824 19240 22064 34886 344794 379680 5810 A & N Islands 0 75 75 0 571 571 0 0 0 0 646 646 53
Chandigarh 0 23 23 6 176 182 0 17 17 6 216 223 181 D & N Haveli 0 6 6 5 250 254 0 12 12 5 268 272 227 Daman & Diu 106 54 160 0 108 108 0 6 6 106 168 274 16 Lakshadweep 0 8 8 4 15 19 0 0 0 4 23 27 16 Pondicherry 356 1100 1456 3362 6436 9798 0 476 476 3718 8012 11730 211 all-India 43357 481220 524577 322591 2834083 3156674 64859 176983 241842 430808 3492286 3923093 71319
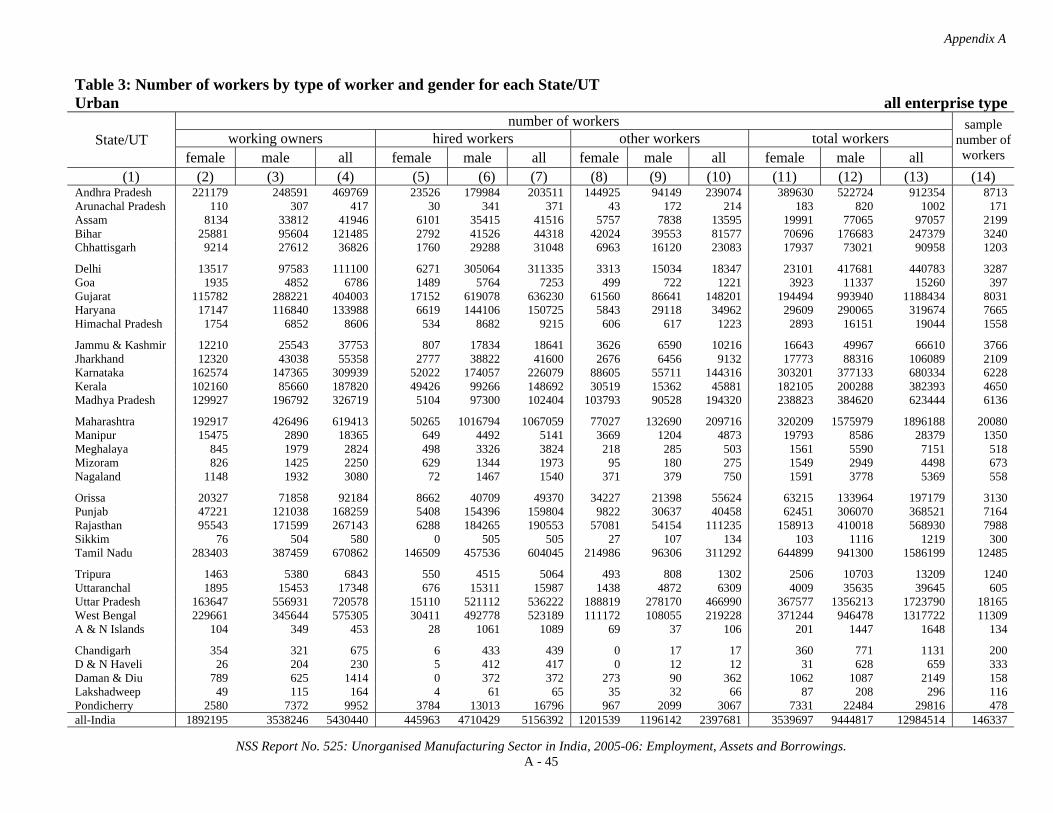
Appendix A
NSS Report No. 525: Unorganised Manufacturing Sector in India, 2005-06: Employment, Assets and Borrowings. A - 45
Table 3: Number of workers by type of worker and gender for each State/UT Urban all enterprise type
number of workers working owners hired workers other workers total workers State/UT
female male all female male all female male all female male all
sample number of workers
(1) (2) (3) (4) (5) (6) (7) (8) (9) (10) (11) (12) (13) (14) Andhra Pradesh 221179 248591 469769 23526 179984 203511 144925 94149 239074 389630 522724 912354 8713 Arunachal Pradesh 110 307 417 30 341 371 43 172 214 183 820 1002 171 Assam 8134 33812 41946 6101 35415 41516 5757 7838 13595 19991 77065 97057 2199 Bihar 25881 95604 121485 2792 41526 44318 42024 39553 81577 70696 176683 247379 3240 Chhattisgarh 9214 27612 36826 1760 29288 31048 6963 16120 23083 17937 73021 90958 1203
Delhi 13517 97583 111100 6271 305064 311335 3313 15034 18347 23101 417681 440783 3287 Goa 1935 4852 6786 1489 5764 7253 499 722 1221 3923 11337 15260 397 Gujarat 115782 288221 404003 17152 619078 636230 61560 86641 148201 194494 993940 1188434 8031 Haryana 17147 116840 133988 6619 144106 150725 5843 29118 34962 29609 290065 319674 7665 Himachal Pradesh 1754 6852 8606 534 8682 9215 606 617 1223 2893 16151 19044 1558
Jammu & Kashmir 12210 25543 37753 807 17834 18641 3626 6590 10216 16643 49967 66610 3766 Jharkhand 12320 43038 55358 2777 38822 41600 2676 6456 9132 17773 88316 106089 2109 Karnataka 162574 147365 309939 52022 174057 226079 88605 55711 144316 303201 377133 680334 6228 Kerala 102160 85660 187820 49426 99266 148692 30519 15362 45881 182105 200288 382393 4650 Madhya Pradesh 129927 196792 326719 5104 97300 102404 103793 90528 194320 238823 384620 623444 6136
Maharashtra 192917 426496 619413 50265 1016794 1067059 77027 132690 209716 320209 1575979 1896188 20080 Manipur 15475 2890 18365 649 4492 5141 3669 1204 4873 19793 8586 28379 1350 Meghalaya 845 1979 2824 498 3326 3824 218 285 503 1561 5590 7151 518 Mizoram 826 1425 2250 629 1344 1973 95 180 275 1549 2949 4498 673 Nagaland 1148 1932 3080 72 1467 1540 371 379 750 1591 3778 5369 558
Orissa 20327 71858 92184 8662 40709 49370 34227 21398 55624 63215 133964 197179 3130 Punjab 47221 121038 168259 5408 154396 159804 9822 30637 40458 62451 306070 368521 7164 Rajasthan 95543 171599 267143 6288 184265 190553 57081 54154 111235 158913 410018 568930 7988 Sikkim 76 504 580 0 505 505 27 107 134 103 1116 1219 300 Tamil Nadu 283403 387459 670862 146509 457536 604045 214986 96306 311292 644899 941300 1586199 12485
Tripura 1463 5380 6843 550 4515 5064 493 808 1302 2506 10703 13209 1240 Uttaranchal 1895 15453 17348 676 15311 15987 1438 4872 6309 4009 35635 39645 605 Uttar Pradesh 163647 556931 720578 15110 521112 536222 188819 278170 466990 367577 1356213 1723790 18165 West Bengal 229661 345644 575305 30411 492778 523189 111172 108055 219228 371244 946478 1317722 11309 A & N Islands 104 349 453 28 1061 1089 69 37 106 201 1447 1648 134
Chandigarh 354 321 675 6 433 439 0 17 17 360 771 1131 200 D & N Haveli 26 204 230 5 412 417 0 12 12 31 628 659 333 Daman & Diu 789 625 1414 0 372 372 273 90 362 1062 1087 2149 158 Lakshadweep 49 115 164 4 61 65 35 32 66 87 208 296 116 Pondicherry 2580 7372 9952 3784 13013 16796 967 2099 3067 7331 22484 29816 478 all-India 1892195 3538246 5430440 445963 4710429 5156392 1201539 1196142 2397681 3539697 9444817 12984514 146337

Appendix A
NSS Report No. 525: Unorganised Manufacturing Sector in India, 2005-06: Employment, Assets and Borrowings. A - 46
Table 3: Number of workers by type of worker and gender for each State/UT Rural + Urban OAME
number of workers working owners hired workers other workers total workers State/UT
female male all female male all female male all female male all
sample number
of workers
(1) (2) (3) (4) (5) (6) (7) (8) (9) (10) (11) (12) (13) (14) Andhra Pradesh 841052 606874 1447926 625 345 970 397861 156471 554332 1239539 763690 2003229 7205 Arunachal Pradesh 102 508 611 0 170 170 35 266 301 137 944 1081 98 Assam 114612 217342 331954 80 1021 1102 84785 54283 139067 199476 272646 472123 3321 Bihar 184694 665328 850022 236 2005 2241 265069 194387 459456 449999 861720 1311718 5674 Chhattisgarh 21055 193235 214290 0 0 0 89178 73201 162379 110233 266436 376669 1044
Delhi 8429 14304 22733 0 0 0 1543 2202 3745 9972 16506 26478 120 Goa 2340 5551 7892 0 0 0 456 555 1012 2797 6107 8903 188 Gujarat 189006 420862 609868 0 0 0 135099 100282 235381 324104 521144 845248 3639 Haryana 47268 138494 185761 0 16 16 15211 33050 48261 62479 171559 234038 1501 Himachal Pradesh 37294 73439 110733 0 0 0 6997 7793 14790 44291 81232 125522 1333
Jammu & Kashmir 46935 131963 178898 0 0 0 25548 56167 81716 72483 188130 260614 3308 Jharkhand 237731 360397 598128 0 789 789 145533 95758 241291 383263 456945 840208 2289 Karnataka 558153 260824 818977 0 123 123 182681 105698 288380 740835 366645 1107479 3601 Kerala 394450 177395 571845 622 1357 1979 67587 32154 99741 462659 210906 673565 3463 Madhya Pradesh 228614 628561 857175 106 1539 1644 395789 182869 578657 624508 812969 1437477 5050
Maharashtra 357794 525666 883460 200 6054 6254 173711 171666 345377 531705 703386 1235091 5733 Manipur 46263 5762 52025 184 109 293 12693 2825 15518 59141 8695 67836 1270 Meghalaya 15659 19173 34832 0 2 2 6391 8669 15060 22050 27843 49894 566 Mizoram 1085 4252 5337 49 86 135 71 495 566 1204 4833 6037 449 Nagaland 4705 4622 9327 13 69 82 1967 1548 3516 6686 6239 12925 875
Orissa 338946 692599 1031545 1138 1532 2669 586703 215413 802117 926787 909544 1836331 4942 Punjab 127440 125688 253128 0 314 314 30340 30037 60377 157780 156038 313818 2604 Rajasthan 192817 413490 606307 0 1198 1198 95053 95190 190243 287870 509878 797748 4470 Sikkim 818 3259 4077 5 2 7 405 729 1133 1227 3990 5218 283 Tamil Nadu 779386 446052 1225438 0 1086 1086 393840 139949 533790 1173226 587087 1760313 5495
Tripura 14564 27242 41806 74 352 426 7604 5436 13040 22242 33030 55272 1360 Uttaranchal 5266 50043 55309 0 0 0 5544 19501 25045 10810 69544 80353 514 Uttar Pradesh 884165 1470064 2354229 831 12583 13415 713098 664135 1377233 1598094 2146782 3744877 9965 West Bengal 1416173 1123563 2539736 6406 3394 9800 1005785 424761 1430546 2428364 1551718 3980082 6145 A & N Islands 180 1259 1439 0 36 36 617 373 991 797 1668 2466 195
Chandigarh 529 614 1143 0 0 0 69 6 75 598 620 1217 29 D & N Haveli 325 309 634 0 0 0 89 0 89 415 309 724 54 Daman & Diu 1208 619 1827 0 0 0 289 124 412 1497 742 2239 124 Lakshadweep 86 251 337 0 0 0 116 37 153 202 288 491 100 Pondicherry 3035 4438 7473 0 0 0 1162 1374 2536 4197 5812 10009 202 all-India 7102181 8814039 15916220 10569 34181 44750 4848919 2877406 7726324 11961669 11725625 23687294 87209
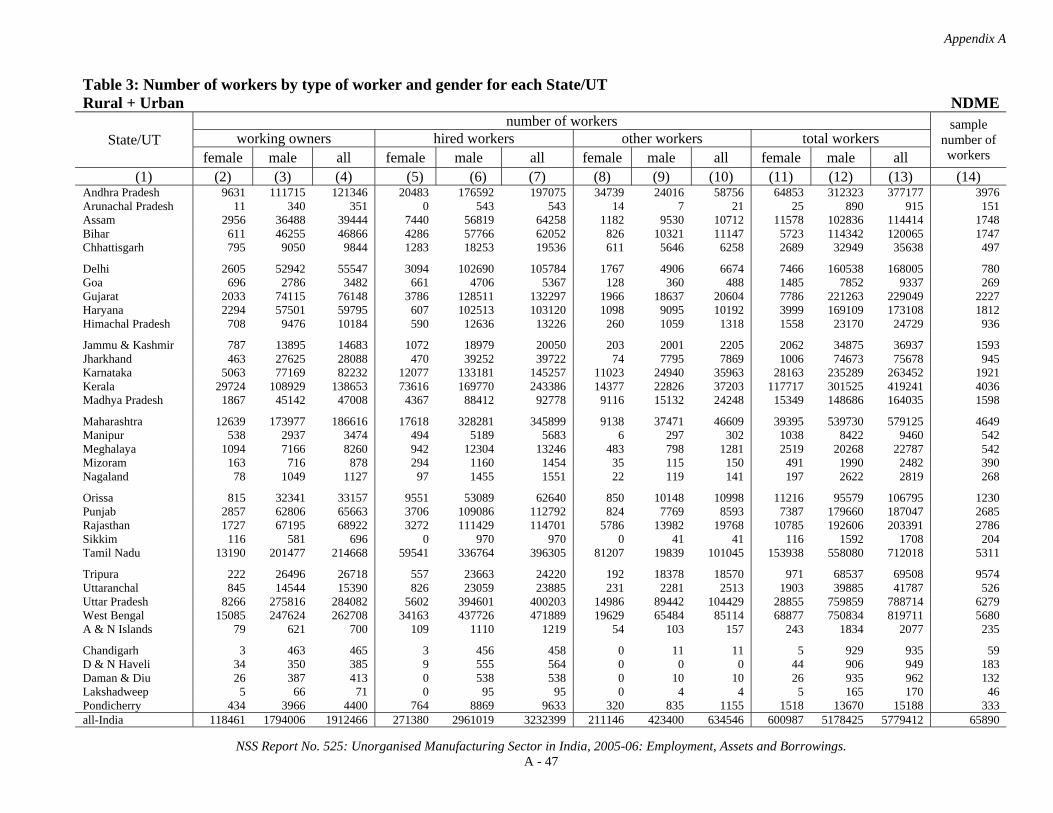
Appendix A
NSS Report No. 525: Unorganised Manufacturing Sector in India, 2005-06: Employment, Assets and Borrowings. A - 47
Table 3: Number of workers by type of worker and gender for each State/UT Rural + Urban NDME
number of workers working owners hired workers other workers total workers State/UT
female male all female male all female male all female male all
sample number of workers
(1) (2) (3) (4) (5) (6) (7) (8) (9) (10) (11) (12) (13) (14) Andhra Pradesh 9631 111715 121346 20483 176592 197075 34739 24016 58756 64853 312323 377177 3976 Arunachal Pradesh 11 340 351 0 543 543 14 7 21 25 890 915 151 Assam 2956 36488 39444 7440 56819 64258 1182 9530 10712 11578 102836 114414 1748 Bihar 611 46255 46866 4286 57766 62052 826 10321 11147 5723 114342 120065 1747 Chhattisgarh 795 9050 9844 1283 18253 19536 611 5646 6258 2689 32949 35638 497
Delhi 2605 52942 55547 3094 102690 105784 1767 4906 6674 7466 160538 168005 780 Goa 696 2786 3482 661 4706 5367 128 360 488 1485 7852 9337 269 Gujarat 2033 74115 76148 3786 128511 132297 1966 18637 20604 7786 221263 229049 2227 Haryana 2294 57501 59795 607 102513 103120 1098 9095 10192 3999 169109 173108 1812 Himachal Pradesh 708 9476 10184 590 12636 13226 260 1059 1318 1558 23170 24729 936
Jammu & Kashmir 787 13895 14683 1072 18979 20050 203 2001 2205 2062 34875 36937 1593 Jharkhand 463 27625 28088 470 39252 39722 74 7795 7869 1006 74673 75678 945 Karnataka 5063 77169 82232 12077 133181 145257 11023 24940 35963 28163 235289 263452 1921 Kerala 29724 108929 138653 73616 169770 243386 14377 22826 37203 117717 301525 419241 4036 Madhya Pradesh 1867 45142 47008 4367 88412 92778 9116 15132 24248 15349 148686 164035 1598
Maharashtra 12639 173977 186616 17618 328281 345899 9138 37471 46609 39395 539730 579125 4649 Manipur 538 2937 3474 494 5189 5683 6 297 302 1038 8422 9460 542 Meghalaya 1094 7166 8260 942 12304 13246 483 798 1281 2519 20268 22787 542 Mizoram 163 716 878 294 1160 1454 35 115 150 491 1990 2482 390 Nagaland 78 1049 1127 97 1455 1551 22 119 141 197 2622 2819 268
Orissa 815 32341 33157 9551 53089 62640 850 10148 10998 11216 95579 106795 1230 Punjab 2857 62806 65663 3706 109086 112792 824 7769 8593 7387 179660 187047 2685 Rajasthan 1727 67195 68922 3272 111429 114701 5786 13982 19768 10785 192606 203391 2786 Sikkim 116 581 696 0 970 970 0 41 41 116 1592 1708 204 Tamil Nadu 13190 201477 214668 59541 336764 396305 81207 19839 101045 153938 558080 712018 5311
Tripura 222 26496 26718 557 23663 24220 192 18378 18570 971 68537 69508 9574 Uttaranchal 845 14544 15390 826 23059 23885 231 2281 2513 1903 39885 41787 526 Uttar Pradesh 8266 275816 284082 5602 394601 400203 14986 89442 104429 28855 759859 788714 6279 West Bengal 15085 247624 262708 34163 437726 471889 19629 65484 85114 68877 750834 819711 5680 A & N Islands 79 621 700 109 1110 1219 54 103 157 243 1834 2077 235
Chandigarh 3 463 465 3 456 458 0 11 11 5 929 935 59 D & N Haveli 34 350 385 9 555 564 0 0 0 44 906 949 183 Daman & Diu 26 387 413 0 538 538 0 10 10 26 935 962 132 Lakshadweep 5 66 71 0 95 95 0 4 4 5 165 170 46 Pondicherry 434 3966 4400 764 8869 9633 320 835 1155 1518 13670 15188 333 all-India 118461 1794006 1912466 271380 2961019 3232399 211146 423400 634546 600987 5178425 5779412 65890

Appendix A
NSS Report No. 525: Unorganised Manufacturing Sector in India, 2005-06: Employment, Assets and Borrowings. A - 48
Table 3: Number of workers by type of worker and gender for each State/UT Rural + Urban DME
number of workers working owners hired workers other workers total workers State/UT
female male all female male all female male all female male all
sample number
of workers
(1) (2) (3) (4) (5) (6) (7) (8) (9) (10) (11) (12) (13) (14) Andhra Pradesh 2191 69483 71674 174926 250142 425068 36040 25757 61797 213158 345382 558540 7954 Arunachal Pradesh 0 44 44 118 1141 1259 0 2 2 118 1187 1305 290 Assam 814 5056 5870 6893 29854 36747 1582 1745 3327 9289 36655 45944 876 Bihar 84 2989 3073 2915 13124 16039 344 1835 2178 3343 17947 21290 996 Chhattisgarh 231 4099 4330 5909 32020 37929 751 3049 3800 6891 39168 46059 2132
Delhi 2958 33547 36505 3693 214444 218137 3 8080 8083 6654 256071 262726 2781 Goa 316 1552 1867 1303 6366 7669 464 247 710 2082 8164 10246 696 Gujarat 4069 78961 83030 23852 647196 671049 2262 21494 23757 30183 747652 777835 6274 Haryana 1214 19142 20355 9469 95725 105193 973 10357 11329 11655 125223 136878 10537 Himachal Pradesh 206 1553 1759 1886 11159 13044 71 308 379 2162 13020 15182 2223
Jammu & Kashmir 79 3916 3995 512 15530 16042 439 842 1282 1030 20288 21318 1844 Jharkhand 133 2864 2997 3382 25134 28516 53 1892 1945 3568 29891 33459 889 Karnataka 3212 78436 81648 199482 258562 458044 37376 26370 63746 240070 363367 603438 4868 Kerala 5457 32633 38090 105550 139721 245271 7570 7269 14839 118577 179623 298200 4141 Madhya Pradesh 1371 16777 18148 12421 90874 103296 2018 15673 17690 15810 123324 139134 4716
Maharashtra 9977 124274 134251 64613 847139 911751 5031 36168 41200 79621 1007581 1087201 14682 Manipur 114 281 395 177 3309 3486 96 97 193 386 3687 4074 417 Meghalaya 151 1381 1532 5725 9981 15706 404 114 518 6280 11475 17756 743 Mizoram 115 67 181 327 393 720 27 0 27 469 459 928 209 Nagaland 8 145 153 26 364 390 14 6 20 49 515 564 97
Orissa 449 8255 8704 16109 52596 68705 290 2716 3007 16848 63567 80415 2793 Punjab 826 16213 17038 2741 73454 76195 87 6624 6711 3654 96290 99944 4411 Rajasthan 2691 25635 28326 18430 235538 253968 2683 9219 11902 23804 270392 294196 9733 Sikkim 4 104 107 184 388 572 5 16 21 194 507 701 278 Tamil Nadu 8291 96559 104850 269855 444536 714390 41163 36784 77948 319310 577878 897188 13946
Tripura 34 585 619 5529 13693 19222 32 207 239 5595 14486 20080 1499 Uttaranchal 45 7658 7704 51 15273 15324 0 2669 2669 97 25601 25697 576 Uttar Pradesh 9729 92182 101910 40379 526570 566949 9299 76152 85451 59406 694904 754310 13541 West Bengal 11945 92241 104186 65365 469711 535076 13375 41402 54777 90685 603355 694040 12452 A & N Islands 44 156 200 269 970 1239 13 43 56 326 1169 1495 159
Chandigarh 4 54 57 6 359 365 0 25 25 10 437 447 253 D & N Haveli 1 56 56 18 505 523 0 12 12 18 573 591 380 Daman & Diu 237 871 1109 0 4077 4077 0 164 164 237 5112 5350 191 Lakshadweep 0 11 11 4 36 40 0 0 0 4 47 51 32 Pondicherry 963 1608 2572 6525 9048 15573 164 1202 1367 7652 11859 19511 991 all-India 67962 819385 887347 1048644 4538930 5587574 162631 338541 501172 1279237 5696857 6976094 128600

Appendix A
NSS Report No. 525: Unorganised Manufacturing Sector in India, 2005-06: Employment, Assets and Borrowings. A - 49
Table 3: Number of workers by type of worker and gender for each State/UT Rural + Urban all enterprise type
number of workers working owners hired workers other workers total workers State/UT
female male all female male all female male all female male all
sample number
of workers
(1) (2) (3) (4) (5) (6) (7) (8) (9) (10) (11) (12) (13) (14) Andhra Pradesh 852875 788071 1640947 196034 427079 623113 468640 206245 674885 1517550 1421395 2938945 19135 Arunachal Pradesh 113 892 1006 118 1854 1972 49 275 324 280 3021 3301 539 Assam 118381 258886 377268 14413 87694 102107 87549 65558 153106 220343 412138 632481 5945 Bihar 185389 714572 899960 7437 72895 80332 266238 206543 472781 459065 994009 1453073 8417 Chhattisgarh 22081 206383 228465 7192 50273 57465 90540 81896 172436 119813 338553 458366 3673
Delhi 13992 100793 114785 6787 317134 323921 3313 15189 18502 24092 433116 457208 3681 Goa 3352 9890 13241 1964 11072 13035 1048 1162 2210 6363 22124 28487 1153 Gujarat 195108 573938 769046 27638 775707 803346 139327 140414 279741 362073 1490059 1852132 12140 Haryana 50776 215136 265912 10076 198253 208329 17281 52501 69783 78133 465891 544024 13850 Himachal Pradesh 38208 84468 122676 2476 23795 26270 7327 9160 16487 48011 117422 165433 4492
Jammu & Kashmir 47802 149774 197576 1584 34508 36092 26191 59011 85202 75576 243293 318869 6745 Jharkhand 238327 390887 629214 3852 65176 69027 145659 105445 251105 387837 561508 949345 4123 Karnataka 566429 416428 982857 211559 391865 603424 231080 157008 388088 1009068 965301 1974369 10390 Kerala 429630 318957 748587 179788 310848 490636 89535 62248 151783 698953 692053 1391006 11640 Madhya Pradesh 231852 690480 922331 16893 180825 197718 406922 213674 620596 655668 1084978 1740646 11364
Maharashtra 380410 823917 1204326 82431 1181474 1263905 187880 245305 433186 650721 2250696 2901417 25064 Manipur 46914 8979 55894 855 8607 9463 12795 3218 16014 60565 20805 81370 2229 Meghalaya 16904 27720 44624 6668 22286 28954 7278 9581 16858 30850 59587 90437 1851 Mizoram 1362 5034 6396 670 1638 2308 133 610 743 2165 7282 9447 1048 Nagaland 4791 5816 10607 136 1888 2024 2004 1673 3677 6931 9376 16307 1240
Orissa 340211 733195 1073405 26798 107217 134014 587843 228278 816121 954851 1068690 2023541 8965 Punjab 131122 204706 335829 6447 182853 189300 31251 44430 75681 168821 431989 600810 9700 Rajasthan 197235 506320 703555 21702 348165 369867 103522 118391 221913 322459 972876 1295335 16989 Sikkim 937 3944 4881 189 1360 1549 410 786 1196 1536 6089 7626 765 Tamil Nadu 800868 744088 1544956 329396 782385 1111781 516210 196573 712783 1646474 1723045 3369519 24752
Tripura 14820 54324 69143 6160 37708 43868 7828 24021 31849 28808 116053 144860 12433 Uttaranchal 6157 72245 78402 877 38332 39210 5775 24452 30227 12810 135029 147838 1616 Uttar Pradesh 902159 1838062 2740221 46813 933754 980567 737383 829730 1567113 1686356 3601545 5287901 29785 West Bengal 1443203 1463428 2906631 105934 910831 1016765 1038789 531648 1570437 2587926 2905907 5493833 24277 A & N Islands 304 2036 2339 378 2116 2494 685 519 1204 1366 4671 6037 589
Chandigarh 535 1130 1665 9 815 823 69 42 111 613 1986 2599 341 D & N Haveli 361 715 1075 27 1061 1087 89 12 101 476 1788 2264 617 Daman & Diu 1472 1877 3349 0 4615 4615 289 298 586 1760 6790 8550 447 Lakshadweep 92 328 419 4 131 135 116 41 157 212 500 712 178 Pondicherry 4433 10012 14445 7289 17918 25206 1646 3411 5058 13368 31341 44709 1526 all-India 7288604 11427430 18716034 1330592 7534130 8864723 5222695 3639347 8862043 13841892 22600907 36442799 281699

Appendix A
NSS Report No. 525: Unorganised Manufacturing sector in India, 2005-06: Employment, Assets and Borrowings. A - 50
Table 4: Number of workers by enterprise type for each industry
Rural all enterprise type all-India number of enterprises industry
(NIC 2004)
estimated number of workers
percent share of workers in
different industries
sample number of workers
estimated sample
(1) (2) (3) (4) (5) (6) 01405 12697 0.05 425 6580 63
15 4963717 21.16 32593 2075265 8657 16 3421026 14.58 2790 2342653 1669 17 3778731 16.11 12439 1765539 3977 18 2585780 11.02 12965 1943561 8681
19 92817 0.40 663 38355 217 20 3525690 15.03 11702 1914554 5839 21 185930 0.79 820 106292 184 22 54036 0.23 660 17590 226 23 18309 0.08 338 4849 64
24 599357 2.55 4130 297318 719 25 86216 0.37 2006 25394 320 26 1963516 8.37 32674 536056 3849 27 33845 0.14 1225 13520 186 28 710893 3.03 6554 369778 2485
29 128634 0.55 1649 68219 580 30 57 0.00 1 57 1 31 88900 0.38 1288 52476 460 32 7814 0.03 41 2088 13 33 5398 0.02 94 1330 15
34 49041 0.21 419 6390 73 35 12660 0.05 548 5681 82 36 1129671 4.82 9223 534059 3676 37 3548 0.02 115 662 14 all 23458286 100.00 135362 12128266 42050

Appendix A
NSS Report No. 525: Unorganised Manufacturing sector in India, 2005-06: Employment, Assets and Borrowings. A - 51
Table 4: Number of workers by enterprise type for each industry
Urban all enterprise type all-India number of enterprises industry
(NIC 2004)
estimated number of workers
percent share of workers in
different industries
sample number of workers
estimated sample
(1) (2) (3) (4) (5) (6) 01405 6972 0.05 236 2551 56
15 1382051 10.64 22753 527542 5922 16 777490 5.99 2519 475497 1298 17 2563813 19.75 16175 802274 4251 18 2344051 18.05 22372 1270308 10521
19 380781 2.93 3373 105669 716 20 533384 4.11 6992 223716 2100 21 168289 1.30 2525 61787 558 22 356749 2.75 5939 100324 1323 23 3821 0.03 221 1037 24
24 264628 2.04 4288 120892 740 25 191104 1.47 4269 46917 593 26 372592 2.87 5006 105762 1132 27 79015 0.61 2520 21613 403 28 947326 7.30 11871 250097 2618
29 451681 3.48 8635 106048 1154 30 10070 0.08 235 842 18 31 180219 1.39 5206 58314 977 32 15753 0.12 558 3656 67 33 27403 0.21 858 8237 129
34 43007 0.33 1428 8870 182 35 97885 0.75 1347 19421 241 36 1775662 13.68 16806 617948 5785 37 10769 0.08 205 3229 39 all 12984514 100.00 146337 4942554 40847

Appendix A
NSS Report No. 525: Unorganised Manufacturing sector in India, 2005-06: Employment, Assets and Borrowings. A - 52
Table 4: Number of workers by enterprise type for each industry
Rural+Urban all enterprise type all-India number of enterprises industry
(NIC 2004)
estimated number of workers
percent share of workers in
different industries
sample number of workers
estimated sample
(1) (2) (3) (4) (5) (6) 01405 19669 0.05 661 9131 119
15 6345768 17.41 55346 2602807 14579 16 4198516 11.52 5309 2818150 2967 17 6342544 17.40 28614 2567813 8228 18 4929831 13.53 35337 3213869 19202
19 473598 1.30 4036 144025 933 20 4059074 11.14 18694 2138270 7939 21 354218 0.97 3345 168080 742 22 410785 1.13 6599 117915 1549 23 22130 0.06 559 5886 88
24 863984 2.37 8418 418210 1459 25 277320 0.76 6275 72311 913 26 2336108 6.41 37680 641819 4981 27 112860 0.31 3745 35133 589 28 1658219 4.55 18425 619875 5103
29 580315 1.59 10284 174268 1734 30 10128 0.03 236 899 19 31 269118 0.74 6494 110790 1437 32 23567 0.06 599 5745 80 33 32801 0.09 952 9567 144
34 92049 0.25 1847 15260 255 35 110546 0.30 1895 25102 323 36 2905333 7.97 26029 1152007 9461 37 14317 0.04 320 3892 53 all 36442799 100.00 281699 17070820 82897

Appendix A
NSS Report No. 525: Unorganised Manufacturing sector in India, 2005-06: Employment, Assets and Borrowings. A - 53
Table 4: Number of workers by enterprise type for each State/ UTs
Rural OAMEnumber of enterprises State/ UT
estimated number of workers
percent share of workers in
different states
sample number of workers
estimated sample (1) (2) (3) (4) (5) (6)
Andhra Pradesh 1434202 7.96 4402 998813 2959Arunachal Pradesh 526 0.00 62 304 36Assam 438942 2.44 2638 306157 1780Bihar 1139847 6.32 3870 639312 2195Chhattisgarh 337685 1.87 699 169729 392 Delhi 926 0.01 18 767 16Goa 4859 0.03 118 3200 70Gujarat 458571 2.54 1621 276152 1043Haryana 138171 0.77 895 102113 637Himachal Pradesh 119358 0.66 942 92900 732 Jammu & Kashmir 224036 1.24 1870 132883 878Jharkhand 790309 4.39 1440 522684 863Karnataka 779936 4.33 2054 580125 1424Kerala 504212 2.80 2357 374908 1653Madhya Pradesh 973566 5.40 2354 541814 1328 Maharashtra 715581 3.97 2293 499406 1587Manipur 47051 0.26 538 34388 388Meghalaya 48356 0.27 447 26803 249Mizoram 4400 0.02 251 3078 181Nagaland 10055 0.06 585 6842 394 Orissa 1713023 9.51 3573 843862 1917Punjab 182503 1.01 1209 135428 902Rajasthan 498298 2.77 1810 371194 1250Sikkim 4839 0.03 202 3260 135Tamil Nadu 1022559 5.67 2733 720436 1896 Tripura 50345 0.28 991 33235 672Uttaranchal 66875 0.37 376 44403 253Uttar Pradesh 2885939 16.01 4485 1577716 2541West Bengal 3418977 18.97 3906 2061369 2423A & N Islands 2222 0.01 170 1283 108 Chandigarh 760 0.00 24 567 15D & N Haveli 620 0.00 24 506 19Daman & Diu 909 0.01 46 852 37Lakshadweep 294 0.00 28 204 20Pondicherry 2554 0.01 95 2026 68all-India 18021308 100.00 49126 11108720 31061

Appendix A
NSS Report No. 525: Unorganised Manufacturing sector in India, 2005-06: Employment, Assets and Borrowings. A - 54
Table 4: Number of workers by enterprise type for each State/ UTs
Rural NDMEnumber of enterprises State/ UT
estimated number of workers
percent share of workers in
different states
sample number of workers
estimated sample (1) (2) (3) (4) (5) (6)
Andhra Pradesh 149790 6.28 1747 45316 523Arunachal Pradesh 643 0.03 119 226 37Assam 72024 3.02 785 24581 273Bihar 58676 2.46 656 23138 220Chhattisgarh 5159 0.22 172 1549 54 Delhi 5861 0.25 103 1810 28Goa 2842 0.12 118 888 32Gujarat 38464 1.61 434 14538 134Haryana 39573 1.66 632 14267 206Himachal Pradesh 17981 0.75 445 6763 161 Jammu & Kashmir 18985 0.80 511 6501 157Jharkhand 44504 1.87 253 16622 90Karnataka 102004 4.28 584 32323 192Kerala 309879 13.00 2583 98679 827Madhya Pradesh 49328 2.07 350 13146 98 Maharashtra 116335 4.88 640 39967 192Manipur 4083 0.17 148 1288 45Meghalaya 18809 0.79 317 6579 106Mizoram 494 0.02 112 196 39Nagaland 862 0.04 79 319 28 Orissa 67100 2.81 533 23583 166Punjab 37334 1.57 484 13610 172Rajasthan 74124 3.11 982 23428 295Sikkim 1083 0.05 56 397 21Tamil Nadu 324747 13.62 2286 88273 690 Tripura 62974 2.64 8901 5400 347Uttaranchal 21964 0.92 258 7371 94Uttar Pradesh 288039 12.08 1657 100935 545West Bengal 442775 18.57 2420 131237 783A & N Islands 1318 0.06 179 488 60 Chandigarh 484 0.02 45 154 13D & N Haveli 667 0.03 107 247 31Daman & Diu 416 0.02 68 133 20Lakshadweep 99 0.00 18 48 8Pondicherry 4558 0.19 173 1270 51all-India 2383977 100.00 28955 745269 6738

Appendix A
NSS Report No. 525: Unorganised Manufacturing sector in India, 2005-06: Employment, Assets and Borrowings. A - 55
Table 4: Number of workers by enterprise type for each State/ UTs
Rural DMEnumber of enterprises State/ UT
estimated number of workers
percent share of workers in
different states
sample number of workers
estimated sample (1) (2) (3) (4) (5) (6)
Andhra Pradesh 442598 14.50 4273 41113 394Arunachal Pradesh 1130 0.04 187 11 3Assam 24458 0.80 323 2268 31Bihar 7172 0.23 651 929 53Chhattisgarh 24564 0.80 1599 1332 82 Delhi 9638 0.32 273 1062 27Goa 5526 0.18 520 458 45Gujarat 166664 5.46 2054 10064 173Haryana 46605 1.53 4658 3306 275Himachal Pradesh 9049 0.30 1547 774 118 Jammu & Kashmir 9238 0.30 598 1083 48Jharkhand 8443 0.28 321 944 22Karnataka 412095 13.50 1524 50764 154Kerala 194523 6.37 2050 19191 202Madhya Pradesh 94308 3.09 2524 9502 215 Maharashtra 173312 5.68 2051 16795 184Manipur 1857 0.06 193 121 10Meghalaya 16121 0.53 569 1131 33Mizoram 55 0.00 12 18 3Nagaland 21 0.00 18 6 3 Orissa 46239 1.51 1729 3432 107Punjab 12451 0.41 843 1170 56Rajasthan 153982 5.04 6209 6253 487Sikkim 484 0.02 207 26 8Tamil Nadu 436014 14.28 7248 41644 612 Tripura 18333 0.60 1301 265 48Uttaranchal 19354 0.63 377 2167 30Uttar Pradesh 390132 12.78 5478 25865 292West Bengal 314359 10.30 6642 31162 414A & N Islands 849 0.03 106 101 13 Chandigarh 224 0.01 72 31 10D & N Haveli 319 0.01 153 44 19Daman & Diu 5076 0.17 175 479 20Lakshadweep 24 0.00 16 3 2Pondicherry 7781 0.25 780 762 58all-India 3053000 100.00 57281 274277 4251
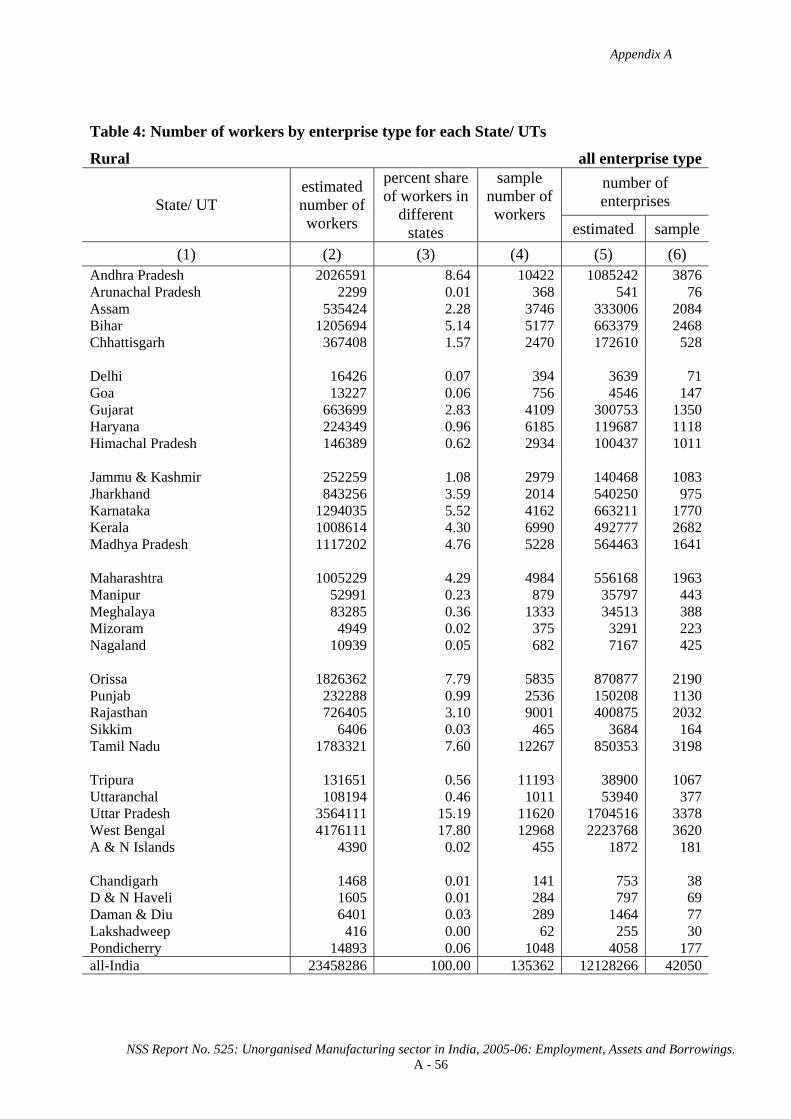
Appendix A
NSS Report No. 525: Unorganised Manufacturing sector in India, 2005-06: Employment, Assets and Borrowings. A - 56
Table 4: Number of workers by enterprise type for each State/ UTs
Rural all enterprise typenumber of enterprises State/ UT
estimated number of workers
percent share of workers in
different states
sample number of workers
estimated sample (1) (2) (3) (4) (5) (6)
Andhra Pradesh 2026591 8.64 10422 1085242 3876Arunachal Pradesh 2299 0.01 368 541 76Assam 535424 2.28 3746 333006 2084Bihar 1205694 5.14 5177 663379 2468Chhattisgarh 367408 1.57 2470 172610 528 Delhi 16426 0.07 394 3639 71Goa 13227 0.06 756 4546 147Gujarat 663699 2.83 4109 300753 1350Haryana 224349 0.96 6185 119687 1118Himachal Pradesh 146389 0.62 2934 100437 1011 Jammu & Kashmir 252259 1.08 2979 140468 1083Jharkhand 843256 3.59 2014 540250 975Karnataka 1294035 5.52 4162 663211 1770Kerala 1008614 4.30 6990 492777 2682Madhya Pradesh 1117202 4.76 5228 564463 1641 Maharashtra 1005229 4.29 4984 556168 1963Manipur 52991 0.23 879 35797 443Meghalaya 83285 0.36 1333 34513 388Mizoram 4949 0.02 375 3291 223Nagaland 10939 0.05 682 7167 425 Orissa 1826362 7.79 5835 870877 2190Punjab 232288 0.99 2536 150208 1130Rajasthan 726405 3.10 9001 400875 2032Sikkim 6406 0.03 465 3684 164Tamil Nadu 1783321 7.60 12267 850353 3198 Tripura 131651 0.56 11193 38900 1067Uttaranchal 108194 0.46 1011 53940 377Uttar Pradesh 3564111 15.19 11620 1704516 3378West Bengal 4176111 17.80 12968 2223768 3620A & N Islands 4390 0.02 455 1872 181 Chandigarh 1468 0.01 141 753 38D & N Haveli 1605 0.01 284 797 69Daman & Diu 6401 0.03 289 1464 77Lakshadweep 416 0.00 62 255 30Pondicherry 14893 0.06 1048 4058 177all-India 23458286 100.00 135362 12128266 42050

Appendix A
NSS Report No. 525: Unorganised Manufacturing sector in India, 2005-06: Employment, Assets and Borrowings. A - 57
Table 4: Number of workers by enterprise type for each State/ UTs
Urban OAMEnumber of enterprises State/ UT
estimated number of workers
percent share of workers in
different states
sample number of workers
estimated sample (1) (2) (3) (4) (5) (6)
Andhra Pradesh 569027 10.04 2803 363988 1849Arunachal Pradesh 556 0.01 36 223 14Assam 33180 0.59 683 21984 471Bihar 171871 3.03 1804 87057 962Chhattisgarh 38984 0.69 345 23967 215 Delhi 25551 0.45 102 17127 67Goa 4044 0.07 70 3053 48Gujarat 386677 6.82 2018 246382 1271Haryana 95867 1.69 606 60448 400Himachal Pradesh 6164 0.11 391 4249 276 Jammu & Kashmir 36578 0.65 1438 25700 1011Jharkhand 49899 0.88 849 34243 548Karnataka 327544 5.78 1547 228452 1046Kerala 169353 2.99 1106 119772 789Madhya Pradesh 463911 8.19 2696 253319 1565 Maharashtra 519510 9.17 3440 341781 2227Manipur 20785 0.37 732 14629 559Meghalaya 1538 0.03 119 1027 69Mizoram 1638 0.03 198 1123 129Nagaland 2870 0.05 290 1912 191 Orissa 123308 2.18 1369 69199 791Punjab 131315 2.32 1395 87811 941Rajasthan 299450 5.29 2660 181806 1576Sikkim 379 0.01 81 206 45Tamil Nadu 737754 13.02 2762 467652 1948 Tripura 4927 0.09 369 3857 277Uttaranchal 13478 0.24 138 7877 82Uttar Pradesh 858937 15.16 5480 455329 2883West Bengal 561106 9.90 2239 373178 1520A & N Islands 243 0.00 25 147 15 Chandigarh 457 0.01 5 457 5D & N Haveli 104 0.00 30 68 19Daman & Diu 1330 0.02 78 960 56Lakshadweep 197 0.00 72 115 42Pondicherry 7455 0.13 107 5090 77all-India 5665986 100.00 38083 3504186 23984

Appendix A
NSS Report No. 525: Unorganised Manufacturing sector in India, 2005-06: Employment, Assets and Borrowings. A - 58
Table 4: Number of workers by enterprise type for each State/ UTs
Urban NDMEnumber of enterprises State/ UT
estimated number of workers
percent share of workers in
different states
sample number of workers
estimated sample (1) (2) (3) (4) (5) (6)
Andhra Pradesh 227387 6.70 2229 69642 680Arunachal Pradesh 272 0.01 32 84 10Assam 42390 1.25 963 13647 317Bihar 61390 1.81 1091 20269 352Chhattisgarh 30479 0.90 325 8083 87 Delhi 162144 4.78 677 45890 191Goa 6495 0.19 151 2170 49Gujarat 190585 5.61 1793 54198 526Haryana 133534 3.93 1180 38319 339Himachal Pradesh 6747 0.20 491 2163 161 Jammu & Kashmir 17953 0.53 1082 5973 354Jharkhand 31174 0.92 692 10207 223Karnataka 161448 4.75 1337 48749 411Kerala 109363 3.22 1453 35062 471Madhya Pradesh 114707 3.38 1248 31921 384 Maharashtra 462789 13.63 4009 134658 1149Manipur 5377 0.16 394 1864 136Meghalaya 3978 0.12 225 1268 71Mizoram 1987 0.06 278 624 89Nagaland 1956 0.06 189 758 66 Orissa 39695 1.17 697 13748 231Punjab 149714 4.41 2201 44532 639Rajasthan 129267 3.81 1804 38180 544Sikkim 624 0.02 148 186 43Tamil Nadu 387271 11.41 3025 117692 925 Tripura 6534 0.19 673 2357 233Uttaranchal 19823 0.58 268 6535 88Uttar Pradesh 500675 14.75 4622 157969 1423West Bengal 376936 11.10 3260 114609 1004A & N Islands 758 0.02 56 222 17 Chandigarh 451 0.01 14 148 3D & N Haveli 283 0.01 76 98 26Daman & Diu 546 0.02 64 188 22Lakshadweep 72 0.00 28 23 9Pondicherry 10630 0.31 160 2975 49all-India 3395434 100.00 36935 1025013 11322
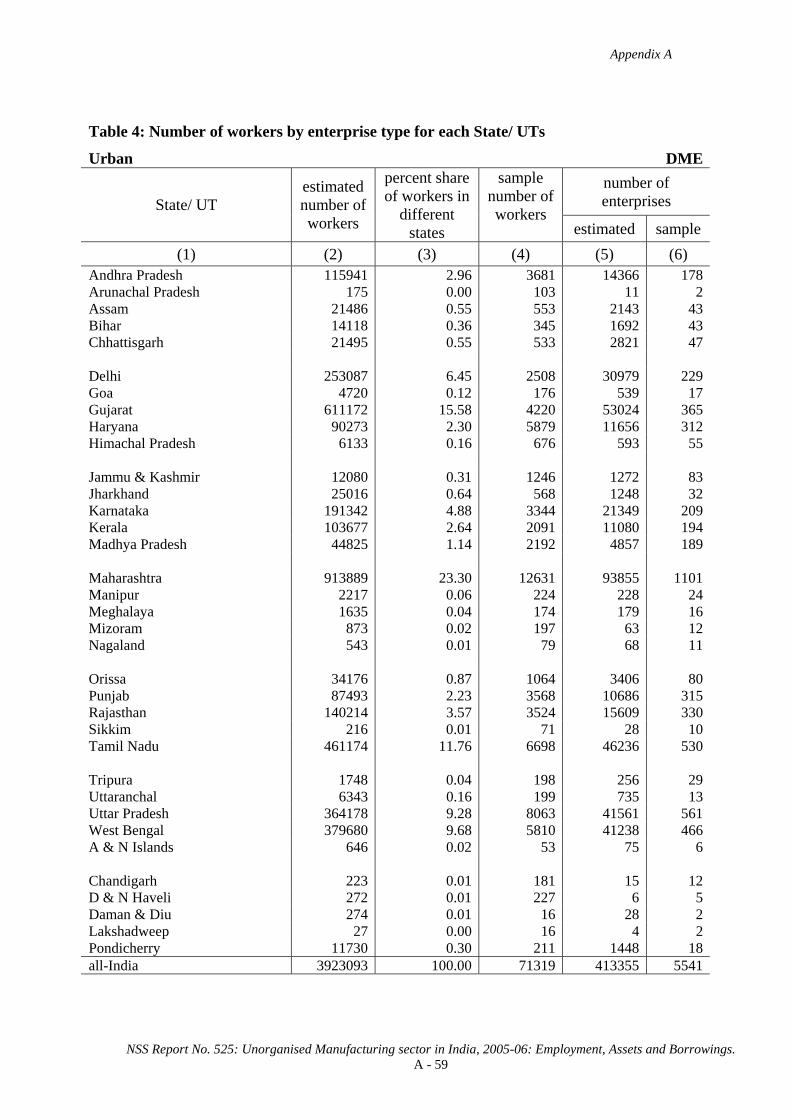
Appendix A
NSS Report No. 525: Unorganised Manufacturing sector in India, 2005-06: Employment, Assets and Borrowings. A - 59
Table 4: Number of workers by enterprise type for each State/ UTs
Urban DMEnumber of enterprises State/ UT
estimated number of workers
percent share of workers in
different states
sample number of workers
estimated sample (1) (2) (3) (4) (5) (6)
Andhra Pradesh 115941 2.96 3681 14366 178Arunachal Pradesh 175 0.00 103 11 2Assam 21486 0.55 553 2143 43Bihar 14118 0.36 345 1692 43Chhattisgarh 21495 0.55 533 2821 47 Delhi 253087 6.45 2508 30979 229Goa 4720 0.12 176 539 17Gujarat 611172 15.58 4220 53024 365Haryana 90273 2.30 5879 11656 312Himachal Pradesh 6133 0.16 676 593 55 Jammu & Kashmir 12080 0.31 1246 1272 83Jharkhand 25016 0.64 568 1248 32Karnataka 191342 4.88 3344 21349 209Kerala 103677 2.64 2091 11080 194Madhya Pradesh 44825 1.14 2192 4857 189 Maharashtra 913889 23.30 12631 93855 1101Manipur 2217 0.06 224 228 24Meghalaya 1635 0.04 174 179 16Mizoram 873 0.02 197 63 12Nagaland 543 0.01 79 68 11 Orissa 34176 0.87 1064 3406 80Punjab 87493 2.23 3568 10686 315Rajasthan 140214 3.57 3524 15609 330Sikkim 216 0.01 71 28 10Tamil Nadu 461174 11.76 6698 46236 530 Tripura 1748 0.04 198 256 29Uttaranchal 6343 0.16 199 735 13Uttar Pradesh 364178 9.28 8063 41561 561West Bengal 379680 9.68 5810 41238 466A & N Islands 646 0.02 53 75 6 Chandigarh 223 0.01 181 15 12D & N Haveli 272 0.01 227 6 5Daman & Diu 274 0.01 16 28 2Lakshadweep 27 0.00 16 4 2Pondicherry 11730 0.30 211 1448 18all-India 3923093 100.00 71319 413355 5541

Appendix A
NSS Report No. 525: Unorganised Manufacturing sector in India, 2005-06: Employment, Assets and Borrowings. A - 60
Table 4: Number of workers by enterprise type for each State/ UTs
Urban all enterprise typenumber of enterprises State/ UT
estimated number of workers
percent share of workers in
different states
sample number of workers
estimated sample (1) (2) (3) (4) (5) (6)
Andhra Pradesh 912354 7.03 8713 447997 2707Arunachal Pradesh 1002 0.01 171 318 26Assam 97057 0.75 2199 37774 831Bihar 247379 1.91 3240 109018 1357Chhattisgarh 90958 0.70 1203 34871 349 Delhi 440783 3.39 3287 93997 487Goa 15260 0.12 397 5762 114Gujarat 1188434 9.15 8031 353605 2162Haryana 319674 2.46 7665 110423 1051Himachal Pradesh 19044 0.15 1558 7005 492 Jammu & Kashmir 66610 0.51 3766 32944 1448Jharkhand 106089 0.82 2109 45698 803Karnataka 680334 5.24 6228 298549 1666Kerala 382393 2.94 4650 165914 1454Madhya Pradesh 623444 4.80 6136 290097 2138 Maharashtra 1896188 14.60 20080 570294 4477Manipur 28379 0.22 1350 16721 719Meghalaya 7151 0.06 518 2474 156Mizoram 4498 0.03 673 1810 230Nagaland 5369 0.04 558 2739 268 Orissa 197179 1.52 3130 86352 1102Punjab 368521 2.84 7164 143029 1895Rajasthan 568930 4.38 7988 235595 2450Sikkim 1219 0.01 300 420 98Tamil Nadu 1586199 12.22 12485 631580 3403 Tripura 13209 0.10 1240 6470 539Uttaranchal 39645 0.31 605 15146 183Uttar Pradesh 1723790 13.28 18165 654859 4867West Bengal 1317722 10.15 11309 529025 2990A & N Islands 1648 0.01 134 444 38 Chandigarh 1131 0.01 200 621 20D & N Haveli 659 0.01 333 172 50Daman & Diu 2149 0.02 158 1175 80Lakshadweep 296 0.00 116 142 53Pondicherry 29816 0.23 478 9513 144all-India 12984514 100.00 146337 4942554 40847

Appendix A
NSS Report No. 525: Unorganised Manufacturing sector in India, 2005-06: Employment, Assets and Borrowings. A - 61
Table 4: Number of workers by enterprise type for each State/ UTs
Rural+Urban OAMEnumber of enterprises State/ UT
estimated number of workers
percent share of workers in
different states
sample number of workers
estimated sample (1) (2) (3) (4) (5) (6)
Andhra Pradesh 2003229 8.46 7205 1362802 4808Arunachal Pradesh 1081 0.00 98 527 50Assam 472123 1.99 3321 328142 2251Bihar 1311718 5.54 5674 726369 3157Chhattisgarh 376669 1.59 1044 193695 607 Delhi 26478 0.11 120 17894 83Goa 8903 0.04 188 6252 118Gujarat 845248 3.57 3639 522534 2314Haryana 234038 0.99 1501 162561 1037Himachal Pradesh 125522 0.53 1333 97149 1008 Jammu & Kashmir 260614 1.10 3308 158583 1889Jharkhand 840208 3.55 2289 556927 1411Karnataka 1107479 4.68 3601 808576 2470Kerala 673565 2.84 3463 494680 2442Madhya Pradesh 1437477 6.07 5050 795133 2893 Maharashtra 1235091 5.21 5733 841187 3814Manipur 67836 0.29 1270 49017 947Meghalaya 49894 0.21 566 27830 318Mizoram 6037 0.03 449 4201 310Nagaland 12925 0.05 875 8754 585 Orissa 1836331 7.75 4942 913061 2708Punjab 313818 1.32 2604 223239 1843Rajasthan 797748 3.37 4470 553000 2826Sikkim 5218 0.02 283 3466 180Tamil Nadu 1760313 7.43 5495 1188088 3844 Tripura 55272 0.23 1360 37093 949Uttaranchal 80353 0.34 514 52280 335Uttar Pradesh 3744877 15.81 9965 2033045 5424West Bengal 3980082 16.80 6145 2434547 3943A & N Islands 2466 0.01 195 1429 123 Chandigarh 1217 0.01 29 1024 20D & N Haveli 724 0.00 54 574 38Daman & Diu 2239 0.01 124 1812 93Lakshadweep 491 0.00 100 320 62Pondicherry 10009 0.04 202 7116 145all-India 23687294 100.00 87209 14612907 55045

Appendix A
NSS Report No. 525: Unorganised Manufacturing sector in India, 2005-06: Employment, Assets and Borrowings. A - 62
Table 4: Number of workers by enterprise type for each State/ UTs
Rural+Urban NDMEnumber of enterprises State/ UT
estimated number of workers
percent share of workers in
different states
sample number of workers
estimated sample (1) (2) (3) (4) (5) (6)
Andhra Pradesh 377177 6.53 3976 114958 1203Arunachal Pradesh 915 0.02 151 310 47Assam 114414 1.98 1748 38228 590Bihar 120065 2.08 1747 43407 572Chhattisgarh 35638 0.62 497 9632 141 Delhi 168005 2.91 780 47700 219Goa 9337 0.16 269 3059 81Gujarat 229049 3.96 2227 68736 660Haryana 173108 3.00 1812 52586 545Himachal Pradesh 24729 0.43 936 8927 322 Jammu & Kashmir 36937 0.64 1593 12474 511Jharkhand 75678 1.31 945 26829 313Karnataka 263452 4.56 1921 81071 603Kerala 419241 7.25 4036 133741 1298Madhya Pradesh 164035 2.84 1598 45067 482 Maharashtra 579125 10.02 4649 174625 1341Manipur 9460 0.16 542 3152 181Meghalaya 22787 0.39 542 7847 177Mizoram 2482 0.04 390 820 128Nagaland 2819 0.05 268 1078 94 Orissa 106795 1.85 1230 37330 397Punjab 187047 3.24 2685 58142 811Rajasthan 203391 3.52 2786 61608 839Sikkim 1708 0.03 204 583 64Tamil Nadu 712018 12.32 5311 205965 1615 Tripura 69508 1.20 9574 7756 580Uttaranchal 41787 0.72 526 13906 182Uttar Pradesh 788714 13.65 6279 258904 1968West Bengal 819711 14.18 5680 245846 1787A & N Islands 2077 0.04 235 710 77 Chandigarh 935 0.02 59 303 16D & N Haveli 949 0.02 183 345 57Daman & Diu 962 0.02 132 320 42Lakshadweep 170 0.00 46 71 17Pondicherry 15188 0.26 333 4245 100all-India 5779412 100.00 65890 1770282 18060
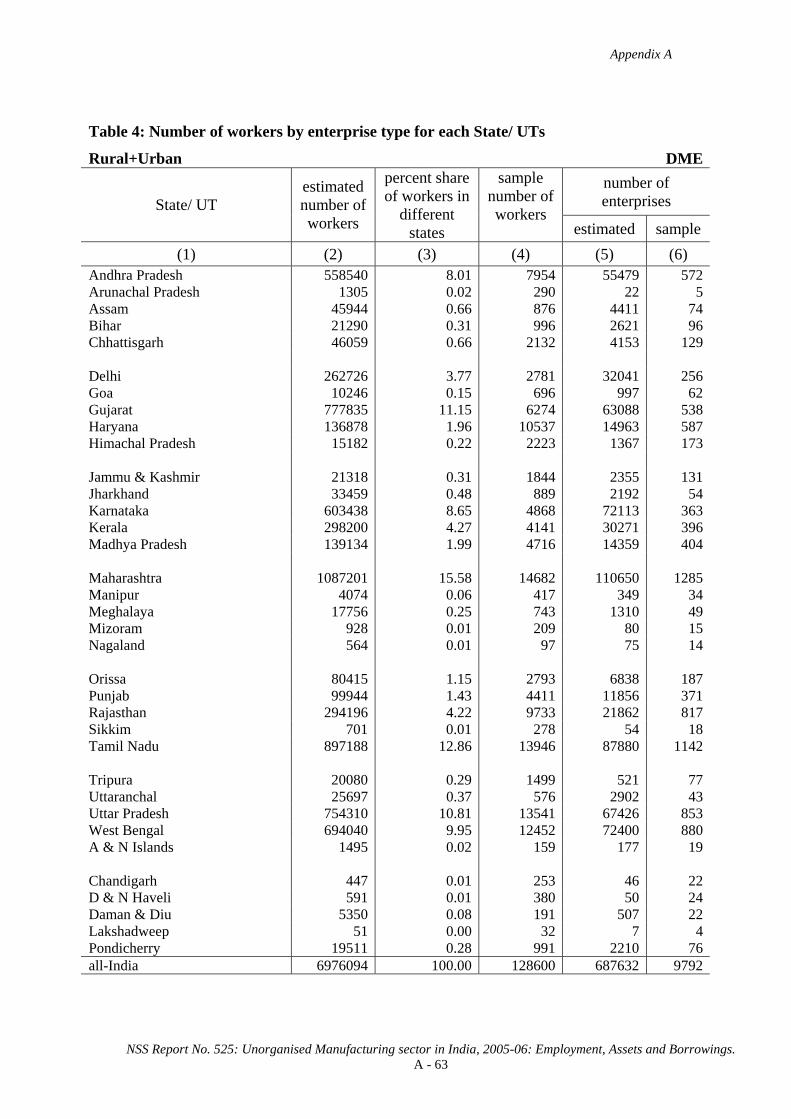
Appendix A
NSS Report No. 525: Unorganised Manufacturing sector in India, 2005-06: Employment, Assets and Borrowings. A - 63
Table 4: Number of workers by enterprise type for each State/ UTs
Rural+Urban DMEnumber of enterprises State/ UT
estimated number of workers
percent share of workers in
different states
sample number of workers
estimated sample (1) (2) (3) (4) (5) (6)
Andhra Pradesh 558540 8.01 7954 55479 572Arunachal Pradesh 1305 0.02 290 22 5Assam 45944 0.66 876 4411 74Bihar 21290 0.31 996 2621 96Chhattisgarh 46059 0.66 2132 4153 129 Delhi 262726 3.77 2781 32041 256Goa 10246 0.15 696 997 62Gujarat 777835 11.15 6274 63088 538Haryana 136878 1.96 10537 14963 587Himachal Pradesh 15182 0.22 2223 1367 173 Jammu & Kashmir 21318 0.31 1844 2355 131Jharkhand 33459 0.48 889 2192 54Karnataka 603438 8.65 4868 72113 363Kerala 298200 4.27 4141 30271 396Madhya Pradesh 139134 1.99 4716 14359 404 Maharashtra 1087201 15.58 14682 110650 1285Manipur 4074 0.06 417 349 34Meghalaya 17756 0.25 743 1310 49Mizoram 928 0.01 209 80 15Nagaland 564 0.01 97 75 14 Orissa 80415 1.15 2793 6838 187Punjab 99944 1.43 4411 11856 371Rajasthan 294196 4.22 9733 21862 817Sikkim 701 0.01 278 54 18Tamil Nadu 897188 12.86 13946 87880 1142 Tripura 20080 0.29 1499 521 77Uttaranchal 25697 0.37 576 2902 43Uttar Pradesh 754310 10.81 13541 67426 853West Bengal 694040 9.95 12452 72400 880A & N Islands 1495 0.02 159 177 19 Chandigarh 447 0.01 253 46 22D & N Haveli 591 0.01 380 50 24Daman & Diu 5350 0.08 191 507 22Lakshadweep 51 0.00 32 7 4Pondicherry 19511 0.28 991 2210 76all-India 6976094 100.00 128600 687632 9792

Appendix A
NSS Report No. 525: Unorganised Manufacturing sector in India, 2005-06: Employment, Assets and Borrowings. A - 64
Table 4: Number of workers by enterprise type for each State/ UTs
Rural+Urban all enterprise typenumber of enterprises State/ UT
estimated number of workers
percent share of workers in
different states
sample number of workers
estimated sample (1) (2) (3) (4) (5) (6)
Andhra Pradesh 2938945 8.06 19135 1533239 6583Arunachal Pradesh 3301 0.01 539 859 102Assam 632481 1.74 5945 370781 2915Bihar 1453073 3.99 8417 772397 3825Chhattisgarh 458366 1.26 3673 207481 877 Delhi 457208 1.25 3681 97636 558Goa 28487 0.08 1153 10308 261Gujarat 1852132 5.08 12140 654358 3512Haryana 544024 1.49 13850 230110 2169Himachal Pradesh 165433 0.45 4492 107442 1503 Jammu & Kashmir 318869 0.87 6745 173412 2531Jharkhand 949345 2.61 4123 585948 1778Karnataka 1974369 5.42 10390 961761 3436Kerala 1391006 3.82 11640 658692 4136Madhya Pradesh 1740646 4.78 11364 854559 3779 Maharashtra 2901417 7.96 25064 1126462 6440Manipur 81370 0.22 2229 52518 1162Meghalaya 90437 0.25 1851 36987 544Mizoram 9447 0.03 1048 5101 453Nagaland 16307 0.04 1240 9906 693 Orissa 2023541 5.55 8965 957229 3292Punjab 600810 1.65 9700 293237 3025Rajasthan 1295335 3.55 16989 636470 4482Sikkim 7626 0.02 765 4103 262Tamil Nadu 3369519 9.25 24752 1481933 6601 Tripura 144860 0.40 12433 45370 1606Uttaranchal 147838 0.41 1616 69087 560Uttar Pradesh 5287901 14.51 29785 2359375 8245West Bengal 5493833 15.08 24277 2752793 6610A & N Islands 6037 0.02 589 2316 219 Chandigarh 2599 0.01 341 1373 58D & N Haveli 2264 0.01 617 969 119Daman & Diu 8550 0.02 447 2639 157Lakshadweep 712 0.00 178 397 83Pondicherry 44709 0.12 1526 13572 321all-India 36442799 100.00 281699 17070820 82897
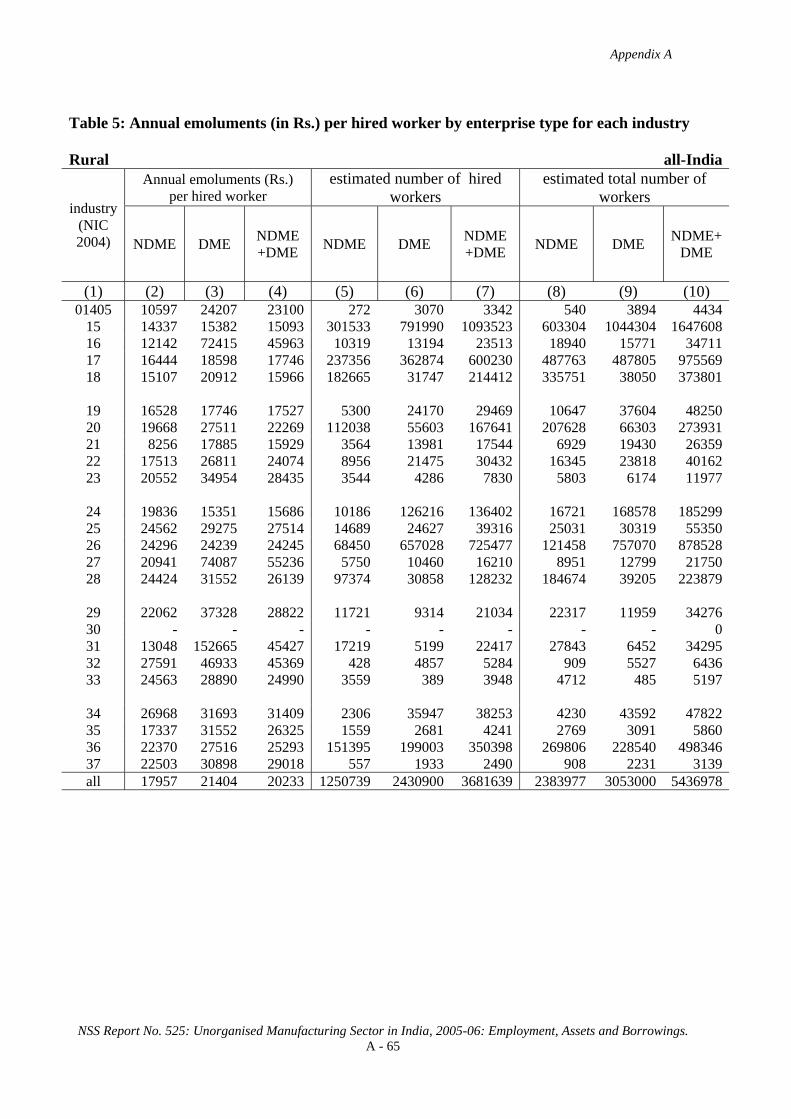
Appendix A
NSS Report No. 525: Unorganised Manufacturing Sector in India, 2005-06: Employment, Assets and Borrowings. A - 65
Table 5: Annual emoluments (in Rs.) per hired worker by enterprise type for each industry Rural all-India
Annual emoluments (Rs.) per hired worker
estimated number of hired workers
estimated total number of workers
industry (NIC 2004) NDME DME NDME
+DME NDME DME NDME +DME NDME DME NDME+
DME
(1) (2) (3) (4) (5) (6) (7) (8) (9) (10) 01405 10597 24207 23100 272 3070 3342 540 3894 4434
15 14337 15382 15093 301533 791990 1093523 603304 1044304 164760816 12142 72415 45963 10319 13194 23513 18940 15771 3471117 16444 18598 17746 237356 362874 600230 487763 487805 97556918 15107 20912 15966 182665 31747 214412 335751 38050 373801
19 16528 17746 17527 5300 24170 29469 10647 37604 4825020 19668 27511 22269 112038 55603 167641 207628 66303 27393121 8256 17885 15929 3564 13981 17544 6929 19430 2635922 17513 26811 24074 8956 21475 30432 16345 23818 4016223 20552 34954 28435 3544 4286 7830 5803 6174 11977
24 19836 15351 15686 10186 126216 136402 16721 168578 18529925 24562 29275 27514 14689 24627 39316 25031 30319 5535026 24296 24239 24245 68450 657028 725477 121458 757070 87852827 20941 74087 55236 5750 10460 16210 8951 12799 2175028 24424 31552 26139 97374 30858 128232 184674 39205 223879
29 22062 37328 28822 11721 9314 21034 22317 11959 3427630 - - - - - - - - 031 13048 152665 45427 17219 5199 22417 27843 6452 3429532 27591 46933 45369 428 4857 5284 909 5527 643633 24563 28890 24990 3559 389 3948 4712 485 5197
34 26968 31693 31409 2306 35947 38253 4230 43592 4782235 17337 31552 26325 1559 2681 4241 2769 3091 586036 22370 27516 25293 151395 199003 350398 269806 228540 49834637 22503 30898 29018 557 1933 2490 908 2231 3139all 17957 21404 20233 1250739 2430900 3681639 2383977 3053000 5436978

Appendix A
NSS Report No. 525: Unorganised Manufacturing Sector in India, 2005-06: Employment, Assets and Borrowings. A - 66
Table 5: Annual emoluments (in Rs.) per hired worker by enterprise type for each industry Urban all-India
Annual emoluments (Rs.) per hired worker
estimated number of hired workers
estimated total number of workers
industry (NIC 2004) NDME DME NDME
+DME NDME DME NDME +DME NDME DME NDME+
DME
(1) (2) (3) (4) (5) (6) (7) (8) (9) (10) 01405 20250 31261 25202 1474 1205 2678 2502 1382 3883
15 22234 26923 24282 259093 200850 459944 484002 273245 75724816 8580 44747 26756 7984 8066 16050 15446 9981 2542817 22983 28711 27289 260388 788792 1049180 453344 999673 145301718 20478 31297 25634 365441 332655 698096 607361 414964 1022326
19 22598 25071 24117 71835 114446 186281 117975 139168 25714320 24188 31845 27152 101025 63804 164829 172396 86735 25913221 23865 30979 27756 25968 31358 57326 42383 39629 8201122 23160 43757 35443 77702 114794 192496 131772 145050 27682323 13413 23580 21221 389 1286 1675 574 1635 2208
24 21440 32541 31122 9906 67563 77469 17028 87692 10471925 31729 34545 33515 41926 72677 114603 68768 94993 16376126 25491 25643 25590 52399 97862 150260 88748 129600 21834727 23428 40767 35341 14483 31799 46282 24264 38933 6319728 26680 70366 51266 242103 311632 553735 403543 387474 791017
29 31154 55398 47974 89660 203133 292793 151465 236294 38775930 17493 44421 42136 777 8377 9153 1344 8628 997231 25757 31936 29257 38380 50129 88509 70030 63640 13366932 22007 29668 28422 1770 9108 10878 3022 11613 1463533 32332 50644 42793 6624 8826 15450 11036 10666 21702
34 26060 39939 34730 11114 18498 29612 18926 22432 4135935 33628 28110 29175 12982 54266 67249 19338 71324 9066236 24316 30346 28303 287195 560456 847651 488379 642618 113099737 28401 21563 22723 1041 5094 6134 1789 5725 7513all 23860 35974 31302 1981660 3156674 5138334 3395434 3923093 7318527

Appendix A
NSS Report No. 525: Unorganised Manufacturing Sector in India, 2005-06: Employment, Assets and Borrowings. A - 67
Table 5: Annual emoluments (in Rs.) per hired worker by enterprise type for each industry Rural+Urban all-India
Annual emoluments (Rs.) per hired worker
estimated number of hired workers
estimated total number of workers
industry (NIC 2004) NDME DME NDME
+DME NDME DME NDME +DME NDME DME NDME+
DME
(1) (2) (3) (4) (5) (6) (7) (8) (9) (10) 01405 18746 26195 24035 1746 4275 6020 3042 5276 8317
15 17986 17716 17814 560627 992840 1553466 1087306 1317549 240485516 10589 61918 38171 18303 21260 39563 34387 25752 6013917 19865 25525 23817 497744 1151666 1649410 941107 1487478 242858518 18688 30392 23362 548106 364402 912508 943112 453014 1396126
19 22181 23793 23217 77135 138616 215750 128621 176772 30539320 21811 29827 24690 213063 119406 332470 380024 153038 53306221 21982 26941 24985 29531 45339 74870 49312 59058 10837022 22577 41086 33891 86659 136269 222928 148117 168868 31698523 19846 32329 27164 3933 5572 9505 6377 7809 14186
24 20627 21345 21277 20092 193779 213871 33748 256270 29001825 29869 33212 31982 56615 97304 153919 93799 125312 21911126 24814 24421 24475 120849 754889 875738 210205 886670 109687527 22721 49014 40501 20233 42259 62491 33216 51731 8494728 26033 66869 46541 339477 342490 681967 588217 426679 1014896
29 30103 54605 46690 101381 212447 313828 173782 248253 42203530 17493 44421 42136 777 8377 9153 1344 8628 997231 21822 43280 32525 55599 55327 110926 97872 70092 16796432 23094 35673 33963 2198 13965 16162 3931 17140 2107133 29617 49725 39169 10183 9215 19398 15748 11151 26899
34 26216 34495 32858 13420 54445 67865 23156 66025 8918035 31881 28272 29006 14542 56948 71490 22107 74415 9652236 23644 29605 27423 438590 759460 1198049 758185 871158 162934337 26343 24130 24540 1598 7026 8624 2697 7955 10652all 21576 29635 26682 3232399 5587574 8819973 5779412 6976094 12755505
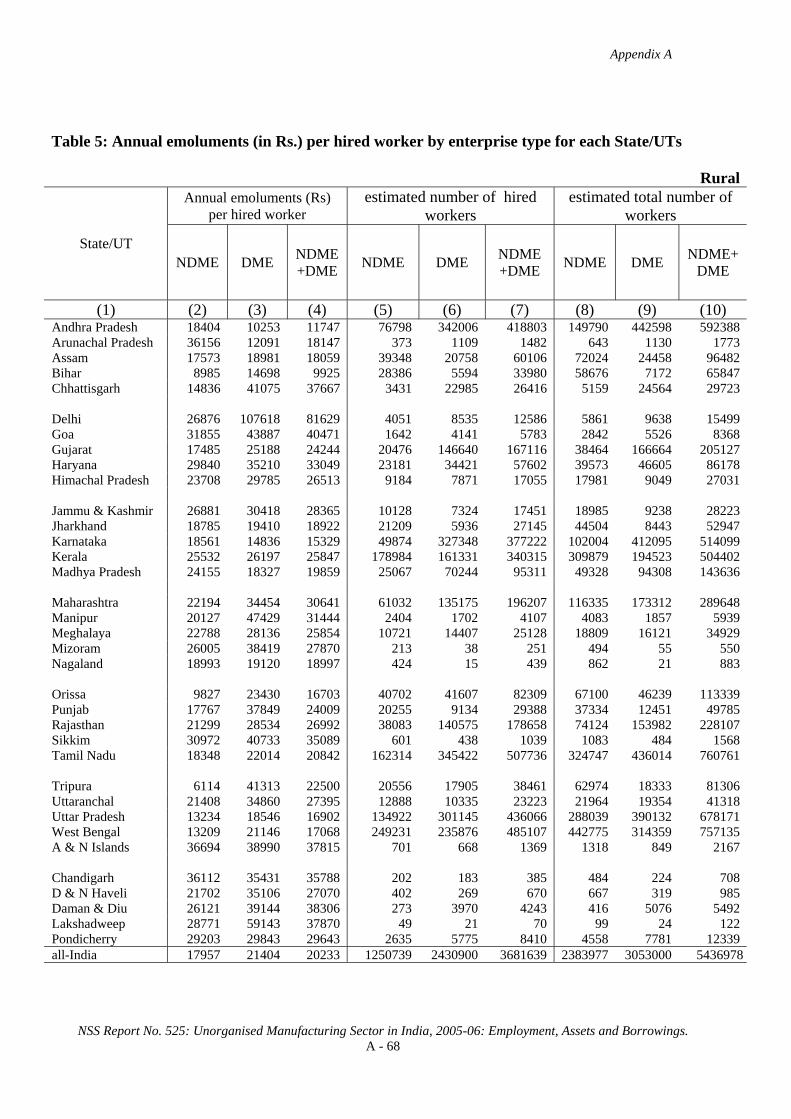
Appendix A
NSS Report No. 525: Unorganised Manufacturing Sector in India, 2005-06: Employment, Assets and Borrowings. A - 68
Table 5: Annual emoluments (in Rs.) per hired worker by enterprise type for each State/UTs
RuralAnnual emoluments (Rs)
per hired worker estimated number of hired
workers estimated total number of
workers
State/UT NDME DME NDME
+DME NDME DME NDME +DME NDME DME NDME+
DME
(1) (2) (3) (4) (5) (6) (7) (8) (9) (10) Andhra Pradesh 18404 10253 11747 76798 342006 418803 149790 442598 592388 Arunachal Pradesh 36156 12091 18147 373 1109 1482 643 1130 1773 Assam 17573 18981 18059 39348 20758 60106 72024 24458 96482 Bihar 8985 14698 9925 28386 5594 33980 58676 7172 65847 Chhattisgarh 14836 41075 37667 3431 22985 26416 5159 24564 29723 Delhi 26876 107618 81629 4051 8535 12586 5861 9638 15499 Goa 31855 43887 40471 1642 4141 5783 2842 5526 8368 Gujarat 17485 25188 24244 20476 146640 167116 38464 166664 205127 Haryana 29840 35210 33049 23181 34421 57602 39573 46605 86178 Himachal Pradesh 23708 29785 26513 9184 7871 17055 17981 9049 27031 Jammu & Kashmir 26881 30418 28365 10128 7324 17451 18985 9238 28223 Jharkhand 18785 19410 18922 21209 5936 27145 44504 8443 52947 Karnataka 18561 14836 15329 49874 327348 377222 102004 412095 514099 Kerala 25532 26197 25847 178984 161331 340315 309879 194523 504402 Madhya Pradesh 24155 18327 19859 25067 70244 95311 49328 94308 143636 Maharashtra 22194 34454 30641 61032 135175 196207 116335 173312 289648 Manipur 20127 47429 31444 2404 1702 4107 4083 1857 5939 Meghalaya 22788 28136 25854 10721 14407 25128 18809 16121 34929 Mizoram 26005 38419 27870 213 38 251 494 55 550 Nagaland 18993 19120 18997 424 15 439 862 21 883 Orissa 9827 23430 16703 40702 41607 82309 67100 46239 113339 Punjab 17767 37849 24009 20255 9134 29388 37334 12451 49785 Rajasthan 21299 28534 26992 38083 140575 178658 74124 153982 228107 Sikkim 30972 40733 35089 601 438 1039 1083 484 1568 Tamil Nadu 18348 22014 20842 162314 345422 507736 324747 436014 760761 Tripura 6114 41313 22500 20556 17905 38461 62974 18333 81306 Uttaranchal 21408 34860 27395 12888 10335 23223 21964 19354 41318 Uttar Pradesh 13234 18546 16902 134922 301145 436066 288039 390132 678171 West Bengal 13209 21146 17068 249231 235876 485107 442775 314359 757135 A & N Islands 36694 38990 37815 701 668 1369 1318 849 2167 Chandigarh 36112 35431 35788 202 183 385 484 224 708 D & N Haveli 21702 35106 27070 402 269 670 667 319 985 Daman & Diu 26121 39144 38306 273 3970 4243 416 5076 5492 Lakshadweep 28771 59143 37870 49 21 70 99 24 122 Pondicherry 29203 29843 29643 2635 5775 8410 4558 7781 12339 all-India 17957 21404 20233 1250739 2430900 3681639 2383977 3053000 5436978
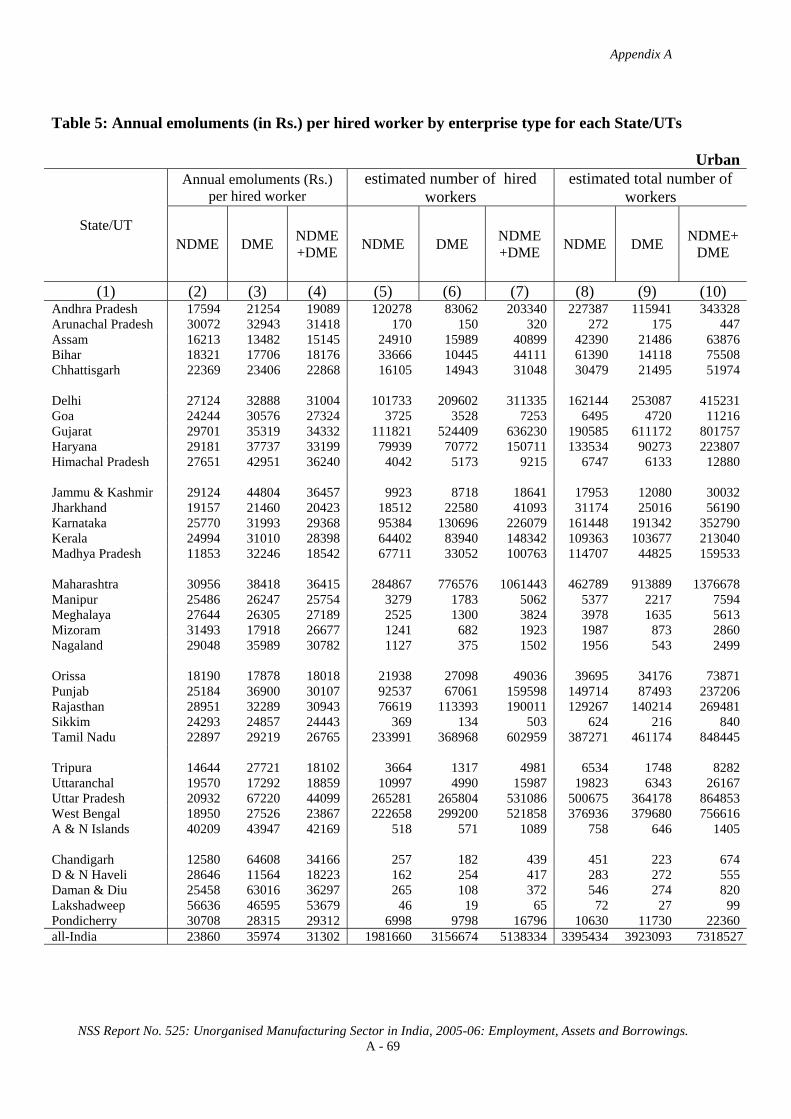
Appendix A
NSS Report No. 525: Unorganised Manufacturing Sector in India, 2005-06: Employment, Assets and Borrowings. A - 69
Table 5: Annual emoluments (in Rs.) per hired worker by enterprise type for each State/UTs
UrbanAnnual emoluments (Rs.)
per hired worker estimated number of hired
workers estimated total number of
workers
State/UT NDME DME NDME
+DME NDME DME NDME +DME NDME DME NDME+
DME
(1) (2) (3) (4) (5) (6) (7) (8) (9) (10) Andhra Pradesh 17594 21254 19089 120278 83062 203340 227387 115941 343328 Arunachal Pradesh 30072 32943 31418 170 150 320 272 175 447 Assam 16213 13482 15145 24910 15989 40899 42390 21486 63876 Bihar 18321 17706 18176 33666 10445 44111 61390 14118 75508 Chhattisgarh 22369 23406 22868 16105 14943 31048 30479 21495 51974 Delhi 27124 32888 31004 101733 209602 311335 162144 253087 415231 Goa 24244 30576 27324 3725 3528 7253 6495 4720 11216 Gujarat 29701 35319 34332 111821 524409 636230 190585 611172 801757 Haryana 29181 37737 33199 79939 70772 150711 133534 90273 223807 Himachal Pradesh 27651 42951 36240 4042 5173 9215 6747 6133 12880 Jammu & Kashmir 29124 44804 36457 9923 8718 18641 17953 12080 30032 Jharkhand 19157 21460 20423 18512 22580 41093 31174 25016 56190 Karnataka 25770 31993 29368 95384 130696 226079 161448 191342 352790 Kerala 24994 31010 28398 64402 83940 148342 109363 103677 213040 Madhya Pradesh 11853 32246 18542 67711 33052 100763 114707 44825 159533 Maharashtra 30956 38418 36415 284867 776576 1061443 462789 913889 1376678 Manipur 25486 26247 25754 3279 1783 5062 5377 2217 7594 Meghalaya 27644 26305 27189 2525 1300 3824 3978 1635 5613 Mizoram 31493 17918 26677 1241 682 1923 1987 873 2860 Nagaland 29048 35989 30782 1127 375 1502 1956 543 2499 Orissa 18190 17878 18018 21938 27098 49036 39695 34176 73871 Punjab 25184 36900 30107 92537 67061 159598 149714 87493 237206 Rajasthan 28951 32289 30943 76619 113393 190011 129267 140214 269481 Sikkim 24293 24857 24443 369 134 503 624 216 840 Tamil Nadu 22897 29219 26765 233991 368968 602959 387271 461174 848445 Tripura 14644 27721 18102 3664 1317 4981 6534 1748 8282 Uttaranchal 19570 17292 18859 10997 4990 15987 19823 6343 26167 Uttar Pradesh 20932 67220 44099 265281 265804 531086 500675 364178 864853 West Bengal 18950 27526 23867 222658 299200 521858 376936 379680 756616 A & N Islands 40209 43947 42169 518 571 1089 758 646 1405 Chandigarh 12580 64608 34166 257 182 439 451 223 674 D & N Haveli 28646 11564 18223 162 254 417 283 272 555 Daman & Diu 25458 63016 36297 265 108 372 546 274 820 Lakshadweep 56636 46595 53679 46 19 65 72 27 99 Pondicherry 30708 28315 29312 6998 9798 16796 10630 11730 22360 all-India 23860 35974 31302 1981660 3156674 5138334 3395434 3923093 7318527

Appendix A
NSS Report No. 525: Unorganised Manufacturing Sector in India, 2005-06: Employment, Assets and Borrowings. A - 70
Table 5: Annual emoluments (in Rs.) per hired worker by enterprise type for each State/UTs
Rural+UrbanAnnual emoluments (Rs.)
per hired worker estimated number of hired
workers estimated total number of
workers
State/UT NDME DME NDME
+DME NDME DME NDME +DME NDME DME NDME+
DME
(1) (2) (3) (4) (5) (6) (7) (8) (9) (10) Andhra Pradesh 17910 12402 14147 197075 425068 622143 377177 558540 935716 Arunachal Pradesh 34251 14576 20504 543 1259 1802 915 1305 2220 Assam 17046 16588 16879 64258 36747 101005 114414 45944 160358 Bihar 14050 16657 14586 62052 16039 78091 120065 21290 141355 Chhattisgarh 21046 34114 29671 19536 37929 57465 35638 46059 81697 Delhi 27114 35812 32972 105784 218137 323921 168005 262726 430730 Goa 26572 37764 33156 5367 7669 13035 9337 10246 19583 Gujarat 27810 33105 32233 132297 671049 803346 229049 777835 1006884 Haryana 29329 36910 33157 103120 105193 208314 173108 136878 309986 Himachal Pradesh 24913 35007 29925 13226 13044 26270 24729 15182 39911 Jammu & Kashmir 27991 38236 32545 20050 16042 36092 36937 21318 58256 Jharkhand 18958 21034 19826 39722 28516 68238 75678 33459 109137 Karnataka 23295 19732 20590 145257 458044 603301 263452 603438 866889 Kerala 25389 27844 26621 243386 245271 488657 419241 298200 717442 Madhya Pradesh 15177 22780 19182 92778 103296 196074 164035 139134 303169 Maharashtra 29410 37830 35514 345899 911751 1257650 579125 1087201 1666326 Manipur 23219 36592 28303 5683 3486 9169 9460 4074 13534 Meghalaya 23713 27985 26031 13246 15706 28952 22787 17756 40543 Mizoram 30689 18991 26815 1454 720 2173 2482 928 3410 Nagaland 26300 35341 28117 1551 390 1941 2819 564 3383 Orissa 12756 21240 17194 62640 68705 131345 106795 80415 187210 Punjab 23852 37014 29159 112792 76195 188987 187047 99944 286992 Rajasthan 26411 30210 29028 114701 253968 368669 203391 294196 497588 Sikkim 28431 37024 31618 970 572 1542 1708 701 2408 Tamil Nadu 21034 25735 24058 396305 714390 1110695 712018 897188 1609206 Tripura 7404 40382 21996 24220 19222 43442 69508 20080 89588 Uttaranchal 20562 29140 23914 23885 15324 39210 41787 25697 67485 Uttar Pradesh 18337 41366 31837 400203 566949 967152 788714 754310 1543024 West Bengal 15918 24714 20592 471889 535076 1006965 819711 694040 1513751 A & N Islands 38188 41274 39744 1219 1239 2458 2077 1495 3572 Chandigarh 22932 49978 34924 458 365 823 935 447 1382 D & N Haveli 23701 23653 23678 564 523 1087 949 591 1541 Daman & Diu 25794 39774 38144 538 4077 4615 962 5350 6311 Lakshadweep 42285 53133 45508 95 40 135 170 51 221 Pondicherry 30296 28882 29422 9633 15573 25206 15188 19511 34700 all-India 21576 29635 26682 3232399 5587574 8819973 5779412 6976094 12755505

Appendix A
NSS Report No. 525: Unorganised Manufacturing Sector in India, 2005-06: Employment, Assets and Borrowings. A - 71
Table 6: Market value of fixed assets per enterprise (in Rs) as on last date of reference year by type of
asset for each industry Rural OAME all-India
market value (in Rs ) of fixed assets per enterprise as on date of survey owned hired
industry (NIC 2004)
land
and
bu
ildin
g
plan
t and
m
achi
nery
trans
port
equi
pmen
t
softw
are
and
hard
war
e
tool
s and
ot
her f
ixed
as
sets
tota
l
land
and
bu
ildin
g
plan
t an
d m
achi
nery
trans
port
equi
pmen
t
softw
are
and
hard
war
e to
ols a
nd
othe
r fix
ed
asse
ts
to
tal
(1) (2) (3) (4) (5) (6) (7) (8) (9) (10) (11) (12) (13) 01405 13134 3544 179 0 206 17063 4074 403 0 0 0 4477
15 27327 12159 725 1 1422 41633 2435 130 2 0 7 2574 16 7112 1 15 0 90 7218 87 0 0 0 0 87 17 16702 2009 87 3 389 19191 433 296 0 0 5 734 18 17596 2676 193 1 685 21152 4714 20 0 0 1 4735
19 16120 371 49 15 1794 18349 9022 38 0 0 1 9061 20 8299 772 247 3 634 9956 941 2 0 0 1 944 21 3521 201 17 0 130 3870 11625 0 0 0 0 11625 22 12285 13289 1355 1648 4033 32610 47809 961 0 0 43 48813 23 14976 702 8 0 2017 17703 385 0 0 0 0 385
24 16399 200 27 0 129 16755 3350 1 0 0 1 3352 25 17341 5675 450 0 789 24255 1515 0 0 0 46 1562 26 14264 1442 635 6 592 16939 2367 55 1 0 5 2427 27 19523 2349 193 1 6035 28099 20984 19 0 0 0 21003 28 15775 3606 351 0 1411 21142 4813 32 0 0 8 4853
29 23802 4910 716 1 1986 31415 9280 403 0 0 0 9682 30 80000 0 0 11000 1500 92500 0 0 0 0 0 0 31 18829 2596 2262 4 3055 26747 29389 9 0 0 3 29401 32 77560 1265 417 3 6470 85715 352 0 0 0 0 352 33 530279 106676 118941 7310 12332 775537 28439 0 0 0 0 28439
34 19831 14420 1531 0 3751 39534 25293 3935 0 0 0 29229 35 18057 7190 78 0 2328 27653 22878 0 0 0 0 22878 36 20792 2118 1070 0 2226 26207 8330 31 1 0 7 8370 37 20000 0 500 0 1000 21500 0 0 0 0 0 0 all 15099 3110 298 3 712 19222 2402 75 0 0 3 2480

Appendix A
NSS Report No. 525: Unorganised Manufacturing Sector in India, 2005-06: Employment, Assets and Borrowings. A - 72
Table 6: (continued) Market value of fixed assets per enterprise (in Rs) as on last date of
reference year by type of asset for each industry Rural OAME all-India
market value (in Rs ) of fixed assets per enterprise as on date of survey owned + hired
number of enterprises industry
(NIC 2004) land and
building plant and
machinery
transport equip-ment
software and
hardware
tools and other fixed
assets total estimated sample
(1) (14) (15) (16) (17) (18) (19) (20) (21) 01405 17208 3947 179 0 206 21540 6063 39
15 29762 12289 727 1 1429 44207 1777603 6309 16 7199 1 15 0 90 7305 2336177 1594 17 17135 2305 88 3 394 19926 1589000 2970 18 22310 2696 193 1 686 25886 1815185 7508
19 25142 409 49 15 1795 27410 32729 160 20 9241 774 247 3 635 10900 1836581 4965 21 15146 201 17 0 130 15494 102294 122 22 60095 14250 1355 1648 4076 81423 9750 114 23 15360 702 8 0 2017 18088 2455 29
24 19749 202 27 0 130 20107 279805 360 25 18856 5675 450 0 836 25817 15074 81 26 16631 1497 636 6 597 19366 458791 2011 27 40507 2367 193 1 6035 49102 9608 64 28 20588 3638 351 0 1419 25996 302545 1578
29 33082 5313 716 1 1986 41097 58709 380 30 80000 0 0 11000 1500 92500 57 1 31 48218 2605 2262 4 3058 56147 43847 301 32 77912 1265 417 3 6470 86066 1379 9 33 558718 106676 118941 7310 12332 803975 110 4
34 45125 18356 1531 0 3751 68763 651 11 35 40935 7190 78 0 2328 50531 4482 28 36 29122 2149 1072 0 2233 34577 425621 2422 37 20000 0 500 0 1000 21500 205 1 all 17502 3184 298 3 715 21702 11108720 31061
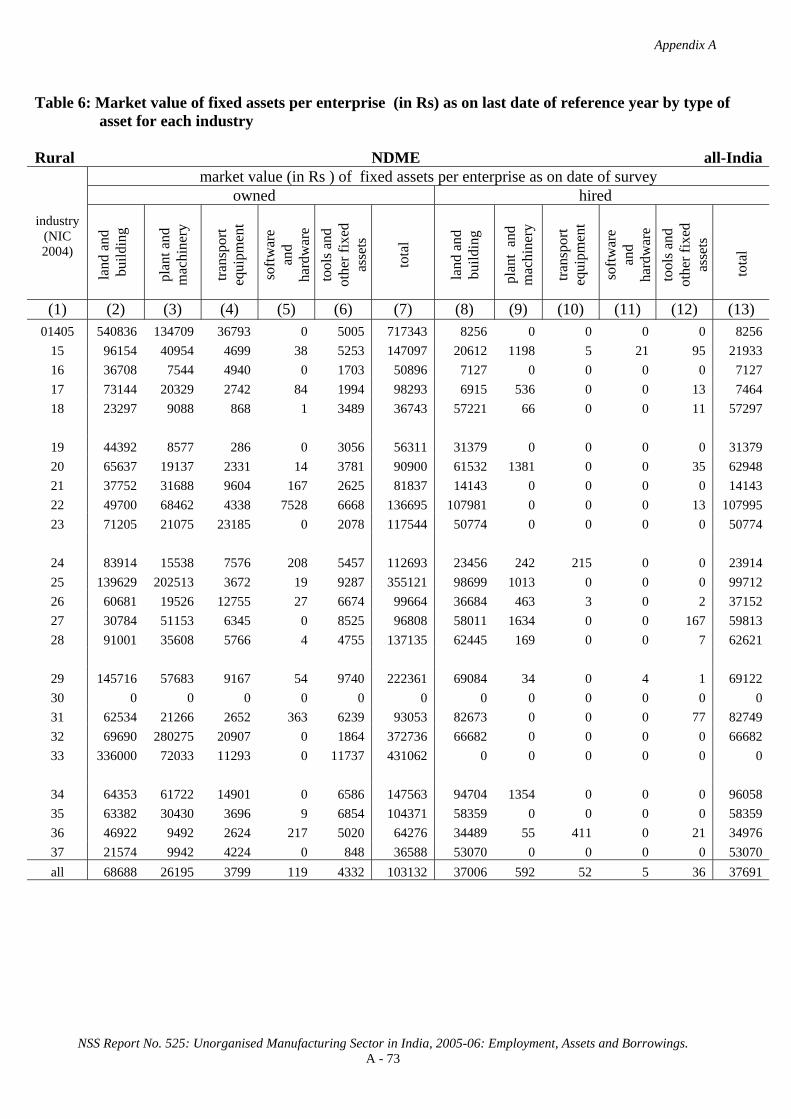
Appendix A
NSS Report No. 525: Unorganised Manufacturing Sector in India, 2005-06: Employment, Assets and Borrowings. A - 73
Table 6: Market value of fixed assets per enterprise (in Rs) as on last date of reference year by type of
asset for each industry Rural NDME all-India
market value (in Rs ) of fixed assets per enterprise as on date of survey owned hired
industry (NIC 2004)
land
and
bu
ildin
g
plan
t and
m
achi
nery
trans
port
equi
pmen
t
softw
are
and
hard
war
e to
ols a
nd
othe
r fix
ed
asse
ts
tota
l
land
and
bu
ildin
g
plan
t an
d m
achi
nery
trans
port
equi
pmen
t
softw
are
and
hard
war
e to
ols a
nd
othe
r fix
ed
asse
ts
to
tal
(1) (2) (3) (4) (5) (6) (7) (8) (9) (10) (11) (12) (13) 01405 540836 134709 36793 0 5005 717343 8256 0 0 0 0 8256
15 96154 40954 4699 38 5253 147097 20612 1198 5 21 95 21933 16 36708 7544 4940 0 1703 50896 7127 0 0 0 0 7127 17 73144 20329 2742 84 1994 98293 6915 536 0 0 13 7464 18 23297 9088 868 1 3489 36743 57221 66 0 0 11 57297
19 44392 8577 286 0 3056 56311 31379 0 0 0 0 31379 20 65637 19137 2331 14 3781 90900 61532 1381 0 0 35 62948 21 37752 31688 9604 167 2625 81837 14143 0 0 0 0 14143 22 49700 68462 4338 7528 6668 136695 107981 0 0 0 13 107995 23 71205 21075 23185 0 2078 117544 50774 0 0 0 0 50774
24 83914 15538 7576 208 5457 112693 23456 242 215 0 0 23914 25 139629 202513 3672 19 9287 355121 98699 1013 0 0 0 99712 26 60681 19526 12755 27 6674 99664 36684 463 3 0 2 37152 27 30784 51153 6345 0 8525 96808 58011 1634 0 0 167 59813 28 91001 35608 5766 4 4755 137135 62445 169 0 0 7 62621
29 145716 57683 9167 54 9740 222361 69084 34 0 4 1 69122 30 0 0 0 0 0 0 0 0 0 0 0 0 31 62534 21266 2652 363 6239 93053 82673 0 0 0 77 82749 32 69690 280275 20907 0 1864 372736 66682 0 0 0 0 66682 33 336000 72033 11293 0 11737 431062 0 0 0 0 0 0
34 64353 61722 14901 0 6586 147563 94704 1354 0 0 0 96058 35 63382 30430 3696 9 6854 104371 58359 0 0 0 0 58359 36 46922 9492 2624 217 5020 64276 34489 55 411 0 21 34976 37 21574 9942 4224 0 848 36588 53070 0 0 0 0 53070 all 68688 26195 3799 119 4332 103132 37006 592 52 5 36 37691

Appendix A
NSS Report No. 525: Unorganised Manufacturing Sector in India, 2005-06: Employment, Assets and Borrowings. A - 74
Table 6: (continued) Market value of fixed assets per enterprise (in Rs) as on last date of
reference year by type of asset for each industry Rural NDME all-India
market value (in Rs ) of fixed assets per enterprise as on date of survey owned + hired
number of enterprises industry
(NIC 2004) land and
building plant and
machinery
transport equip-ment
software and
hardware
tools and other fixed
assets total estimated sample
(1) (14) (15) (16) (17) (18) (19) (20) (21) 01405 549091 134709 36793 0 5005 725599 233 5
15 116766 42152 4704 59 5348 169030 185605 1576 16 43835 7544 4940 0 1703 58022 5199 50 17 80059 20865 2742 84 2006 105757 129161 547 18 80518 9154 868 1 3500 94041 124596 1110
19 75771 8577 286 0 3056 87690 3164 34 20 127169 20518 2331 14 3816 153848 70010 674 21 51895 31688 9604 167 2625 95980 1736 15 22 157681 68462 4338 7528 6682 244690 5897 84 23 121979 21075 23185 0 2078 168318 1756 15
24 107370 15781 7791 208 5457 136607 3943 89 25 238329 203526 3672 19 9287 454833 7104 89 26 97365 19990 12757 27 6677 136815 32220 366 27 88795 52788 6345 0 8692 156620 2598 46 28 153446 35777 5766 4 4762 199756 62155 685
29 214800 57717 9167 58 9740 291483 8017 139 30 0 0 0 0 0 0 0 0 31 145206 21266 2652 363 6316 175802 7903 110 32 136372 280275 20907 0 1864 439418 252 2 33 336000 72033 11293 0 11737 431062 1153 3
34 159058 63076 14901 0 6586 243620 1319 30 35 121740 30430 3696 9 6854 162730 1062 33 36 81411 9547 3036 217 5040 99252 89891 1028 37 74645 9942 4224 0 848 89659 293 8 all 105694 26787 3851 124 4367 140823 745269 6738

Appendix A
NSS Report No. 525: Unorganised Manufacturing Sector in India, 2005-06: Employment, Assets and Borrowings. A - 75
Table 6: Market value of fixed assets per enterprise (in Rs) as on last date of reference year by type of
asset for each industry Rural DME all-India
market value (in Rs ) of fixed assets per enterprise as on date of survey owned hired
industry (NIC 2004)
land
and
bu
ildin
g
plan
t and
m
achi
nery
trans
port
equi
pmen
t
softw
are
and
hard
war
e to
ols a
nd
othe
r fix
ed
asse
ts
tota
l
land
and
bu
ildin
g
plan
t an
d m
achi
nery
trans
port
equi
pmen
t so
ftwar
e an
d ha
rdw
are
tool
s and
ot
her f
ixed
as
sets
to
tal
(1) (2) (3) (4) (5) (6) (7) (8) (9) (10) (11) (12) (13) 01405 1012787 713059 24803 2051 28812 1781513 86978 7061 2602 0 0 96641
15 152997 100678 19121 218 16739 289753 17442 4958 26 0 73 22499 16 77793 51266 114984 1040 34840 279923 284815 0 0 0 0 284815 17 198080 158700 15220 537 11567 384103 19723 2972 0 0 65 22759 18 134804 93870 13149 1713 16886 260422 110829 35597 0 0 97 146523
19 81121 19441 3981 21 4417 108980 55797 0 0 0 0 55797 20 318977 338068 13843 214 25937 697039 69295 9610 0 0 152 79058 21 209097 160893 53508 699 5398 429596 70213 20 133 0 534 70899 22 673168 671395 559058 23988 10278 1937888 48773 384 0 0 0 49157 23 614920 831168 24303 5082 28903 1504376 166430 14394 0 0 0 180825
24 403669 69586 24106 3676 24209 525246 58491 107 37 0 38 58672 25 336125 438133 70009 1882 34582 880731 336843 870 373 0 15 338102 26 230159 121879 67218 256 16071 435584 91170 1006 326 2 10 92514 27 878483 2003815 68042 17624 40796 3008760 147865 3893 0 0 1278 153036 28 213299 213308 20334 2458 18885 468284 113709 4175 0 0 10 117893
29 576058 624129 37216 13742 45075 1296221 78749 26 0 0 7 78783 30 0 0 0 0 0 0 0 0 0 0 0 0 31 1628038 882456 59887 13967 89400 2673748 156620 9231 0 0 0 165851 32 433964 197560 712051 4257 95897 1443728 92878 0 0 0 0 92878 33 167903 96196 27699 2542 8563 302902 124854 0 0 0 0 124854
34 222010 156206 5529 68 18482 402296 4469 0 0 0 0 4469 35 209360 144996 85096 6036 26127 471615 554509 10979 7319 0 0 572807 36 95747 34761 20696 507 11687 163398 66588 903 0 0 0 67491 37 374955 298750 228234 514 71679 974132 23657 0 0 0 0 23657 all 206368 142177 33059 941 16815 399359 47824 3720 78 0 61 51683

Appendix A
NSS Report No. 525: Unorganised Manufacturing Sector in India, 2005-06: Employment, Assets and Borrowings. A - 76
Table 6: (continued) Market value of fixed assets per enterprise (in Rs) as on last date of
reference year by type of asset for each industry Rural DME all-India
market value (in Rs ) of fixed assets per enterprise as on date of survey owned + hired
number of enterprises industry
(NIC 2004) land and
building plant and
machinery
transport equip-ment
software and
hardware
tools and other fixed
assets total estimated sample
(1) (14) (15) (16) (17) (18) (19) (20) (21) 01405 1099765 720120 27406 2051 28812 1878154 284 19
15 170439 105636 19147 218 16811 312252 112057 772 16 362608 51266 114984 1040 34840 564738 1277 25 17 217803 161671 15220 537 11631 406862 47378 460 18 245634 129467 13149 1713 16983 406945 3780 63
19 136918 19441 3981 21 4417 164777 2462 23 20 388273 347678 13843 214 26089 776097 7962 200 21 279310 160913 53641 699 5932 500495 2262 47 22 721941 671780 559058 23988 10278 1987045 1943 28 23 781351 845563 24303 5082 28903 1685201 638 20
24 462160 69693 24143 3676 24246 583918 13570 270 25 672968 439003 70382 1882 34598 1218833 3215 150 26 321329 122886 67544 258 16081 528098 45046 1472 27 1026348 2007708 68042 17624 42074 3161796 1315 76 28 327008 217482 20334 2458 18895 586177 5078 222
29 654807 624156 37216 13742 45083 1375004 1493 61 30 0 0 0 0 0 0 0 0 31 1784659 891687 59887 13967 89400 2839599 726 49 32 526842 197560 712051 4257 95897 1536607 458 2 33 292757 96196 27699 2542 8563 427756 66 8
34 226479 156206 5529 68 18482 406765 4420 32 35 763869 155974 92415 6036 26127 1044422 137 21 36 162335 35664 20696 507 11687 230889 18546 226 37 398612 298750 228234 514 71679 997789 164 5 all 254191 145897 33137 941 16875 451042 274277 4251

Appendix A
NSS Report No. 525: Unorganised Manufacturing Sector in India, 2005-06: Employment, Assets and Borrowings. A - 77
Table 6: Market value of fixed assets per enterprise (in Rs) as on last date of reference year by type of
asset for each industry Rural all enterprise type all-India
market value (in Rs ) of fixed assets per enterprise as on date of survey owned hired
industry (NIC 2004)
land
and
bu
ildin
g
plan
t and
m
achi
nery
trans
port
equi
pmen
t
softw
are
and
hard
war
e to
ols a
nd
othe
r fix
ed
asse
ts
tota
l
land
and
bu
ildin
g
plan
t an
d m
achi
nery
trans
port
equi
pmen
t
softw
are
and
hard
war
e to
ols a
nd
othe
r fix
ed
asse
ts
to
tal
(1) (2) (3) (4) (5) (6) (7) (8) (9) (10) (11) (12) (13) 01405 74976 38800 2540 88 1610 118015 7798 676 112 0 0 8586
15 40268 19514 2074 16 2592 64463 4871 486 4 2 19 5381 16 7216 46 89 1 112 7464 258 0 0 0 0 258 17 25699 7554 688 23 807 34770 1425 385 0 0 7 1818 18 18190 3265 261 4 896 22617 8286 92 0 0 2 8380
19 22625 2272 321 14 2066 27299 13870 32 0 0 1 13903 20 11688 2846 380 4 855 15773 3441 92 0 0 3 3537 21 8455 4135 1312 18 283 14202 12913 0 3 0 11 12927 22 97843 104493 63970 6087 5606 278000 68089 575 0 0 28 68692 23 114310 117395 11599 669 5578 249552 40489 1895 0 0 0 42384
24 34970 3571 1226 171 1299 41235 6133 9 5 0 2 6149 25 91915 115497 10159 244 7445 225259 71160 393 47 0 30 71631 26 35197 12649 6958 28 2259 57091 11892 160 28 0 5 12085 27 105201 206324 7972 1714 9893 331104 40435 706 0 0 156 41297 28 31132 11865 1535 35 2213 46780 15996 112 0 0 8 16116
29 50218 24667 2508 308 3840 81542 17829 351 0 0 0 18180 30 80000 0 0 11000 1500 92500 0 0 0 0 0 0 31 47680 17584 3118 252 4729 73363 39174 135 0 0 14 39323 32 154751 77960 158912 935 25521 418078 28639 0 0 0 0 28639 33 343745 76108 21036 733 11628 453250 8572 0 0 0 0 8572
34 168863 122253 7056 47 14525 312745 25214 681 0 0 0 25895 35 31130 14849 2799 147 3746 52671 42296 264 176 0 0 42737 36 27793 4493 2013 54 3025 37379 14756 66 70 0 9 14901 37 108641 78422 58573 127 18444 264207 29370 0 0 0 0 29370 all 22718 7673 1254 31 1298 32975 5556 189 5 0 6 5757

Appendix A
NSS Report No. 525: Unorganised Manufacturing Sector in India, 2005-06: Employment, Assets and Borrowings. A - 78
Table 6: (continued) Market value of fixed assets per enterprise (in Rs) as on last date of
reference year by type of asset for each industry Rural all enterprise type all-India
market value (in Rs ) of fixed assets per enterprise as on date of survey owned + hired
number of enterprises industry
(NIC 2004) land and
building plant and
machinery
transport equip-ment
software and
hardware
tools and other fixed
assets total estimated sample
(1) (14) (15) (16) (17) (18) (19) (20) (21) 01405 82773 39476 2653 88 1610 126601 6580 63
15 45139 20000 2077 18 2610 69845 2075265 8657 16 7474 46 89 1 112 7722 2342653 1669 17 27124 7940 688 23 814 36588 1765539 3977 18 26476 3357 261 4 898 30997 1943561 8681
19 36495 2304 321 14 2067 41202 38355 217 20 15129 2938 380 4 858 19310 1914554 5839 21 21367 4135 1315 18 295 27129 106292 184 22 165932 105068 63970 6087 5635 346692 17590 226 23 154799 119290 11599 669 5578 291936 4849 64
24 41103 3580 1230 171 1301 47384 297318 719 25 163075 115891 10206 244 7475 296890 25394 320 26 47088 12809 6987 28 2264 69176 536056 3849 27 145636 207030 7972 1714 10049 372401 13520 186 28 47128 11977 1535 35 2221 62895 369778 2485
29 68047 25018 2508 308 3840 99722 68219 580 30 80000 0 0 11000 1500 92500 57 1 31 86854 17719 3118 252 4743 112686 52476 460 32 183390 77960 158912 935 25521 446718 2088 13 33 352317 76108 21036 733 11628 461822 1330 15
34 194077 122934 7056 47 14525 338640 6390 73 35 73427 15113 2975 147 3746 95408 5681 82 36 42549 4558 2084 54 3034 52280 534059 3676 37 138010 78422 58573 127 18444 293576 662 14 all 28274 7862 1259 32 1305 38732 12128266 42050

Appendix A
NSS Report No. 525: Unorganised Manufacturing Sector in India, 2005-06: Employment, Assets and Borrowings. A - 79
Table 6: Market value of fixed assets per enterprise (in Rs) as on last date of reference year by type of
asset for each industry Urban OAME all-India
market value (in Rs ) of fixed assets per enterprise as on date of survey owned hired
industry (NIC 2004)
land
and
bu
ildin
g
plan
t and
m
achi
nery
trans
port
equi
pmen
t
softw
are
and
hard
war
e to
ols a
nd
othe
r fix
ed
asse
ts
tota
l
land
and
bu
ildin
g
plan
t an
d m
achi
nery
trans
port
equi
pmen
t
softw
are
and
hard
war
e to
ols a
nd
othe
r fix
ed
asse
ts
to
tal
(1) (2) (3) (4) (5) (6) (7) (8) (9) (10) (11) (12) (13) 01405 52553 11414 34 0 967 64968 41022 0 0 0 0 41022
15 51589 10911 1168 1 2384 66054 31063 393 7 0 43 31506 16 22367 1 12 0 135 22516 7519 0 0 0 0 7519 17 33596 4488 552 10 687 39333 9498 352 0 0 4 9854 18 23931 3137 241 2 949 28260 27439 52 0 0 8 27498
19 29461 1274 442 2 1457 32636 44844 13 3 0 0 44861 20 31452 2619 473 13 1266 35823 8548 61 1 0 2 8611 21 23993 610 250 1 531 25385 11720 0 0 0 2 11722 22 53145 19895 3139 3734 3995 83908 97224 529 0 0 3 97756 23 214827 5719 429 0 1112 222087 4157 0 0 0 0 4157
24 15455 337 244 50 230 16316 4805 0 0 0 2 4807 25 40637 5885 434 152 1188 48296 42429 11777 0 0 2 54208 26 44202 1742 786 0 1294 48025 14728 47 0 0 1 14775 27 48844 4913 932 279 4703 59672 38291 0 0 0 0 38291 28 67315 13773 1523 8 4101 86720 55179 236 0 0 6 55421
29 160869 31197 3532 99 4271 199969 77337 2102 4 0 692 80135 30 5000 0 10000 15000 10000 40000 25000 0 0 0 0 25000 31 46367 7801 5339 14 3478 62998 82719 566 0 0 60 83344 32 28154 2863 3966 758 4715 40458 40836 0 0 0 0 40836 33 156268 7966 808 132 13941 179116 111344 220 0 0 0 111564
34 58144 25513 1829 0 4825 90311 72379 5 0 0 0 72384 35 30364 10052 1136 263 2723 44537 32776 361 0 0 0 33137 36 50461 3495 1725 36 3924 59641 48137 30 1 0 9 48177 37 57808 1514 46 0 13514 72881 128173 0 4 0 0 128177 all 35180 4400 702 60 1496 41839 25635 211 1 0 16 25863

Appendix A
NSS Report No. 525: Unorganised Manufacturing Sector in India, 2005-06: Employment, Assets and Borrowings. A - 80
Table 6: (continued) Market value of fixed assets per enterprise (in Rs) as on last date of
reference year by type of asset for each industry Urban OAME all-India
market value (in Rs ) of fixed assets per enterprise as on date of survey owned + hired
number of enterprises industry
(NIC 2004) land and
building plant and
machinery
transport equip-ment
software and
hardware
tools and other fixed
assets total estimated sample
(1) (14) (15) (16) (17) (18) (19) (20) (21) 01405 93574 11414 34 0 967 105989 1671 33
15 82653 11304 1175 1 2427 97559 346262 3111 16 29887 1 12 0 135 30035 468361 1244 17 43094 4840 552 10 692 49187 587131 2772 18 51369 3189 241 2 957 55759 1020685 7703
19 74306 1287 445 2 1458 77497 58191 331 20 40000 2680 474 13 1267 44435 159382 1330 21 35713 610 250 1 532 37106 45637 340 22 150369 20425 3139 3734 3998 181664 44652 478 23 218984 5719 429 0 1112 226244 656 6
24 20260 337 244 50 231 21123 105788 400 25 83066 17662 434 152 1190 102504 15190 142 26 58930 1789 786 0 1295 62800 68437 681 27 87135 4913 932 279 4703 97962 9380 137 28 122495 14009 1523 8 4106 142141 84071 874
29 238207 33299 3536 99 4963 280104 37355 395 30 30000 0 10000 15000 10000 65000 98 1 31 129086 8367 5339 14 3537 146343 27359 373 32 68991 2863 3966 758 4715 81294 921 16 33 267612 8186 808 132 13941 290680 3796 43
34 130522 25518 1829 0 4825 162694 907 15 35 63140 10413 1136 263 2723 77674 5018 65 36 98598 3525 1726 36 3933 107817 411325 3481 37 185981 1514 50 0 13514 201058 1913 13 all 60815 4612 703 60 1513 67702 3504186 23984

Appendix A
NSS Report No. 525: Unorganised Manufacturing Sector in India, 2005-06: Employment, Assets and Borrowings. A - 81
Table 6: Market value of fixed assets per enterprise (in Rs) as on last date of reference year by type of
asset for each industry Urban NDME all-India
market value (in Rs ) of fixed assets per enterprise as on date of survey owned hired
industry (NIC 2004)
land
and
bu
ildin
g
plan
t and
m
achi
nery
trans
port
equi
pmen
t
softw
are
and
hard
war
e to
ols a
nd
othe
r fix
ed
asse
ts
tota
l
land
and
bu
ildin
g
plan
t an
d m
achi
nery
trans
port
equi
pmen
t
softw
are
and
hard
war
e to
ols a
nd
othe
r fix
ed
asse
ts
to
tal
(1) (2) (3) (4) (5) (6) (7) (8) (9) (10) (11) (12) (13) 01405 337671 65481 5833 329 6981 416296 113796 1098 0 0 7 114901
15 177366 32760 5506 79 8389 224099 108938 2067 59 0 80 111144 16 46584 420 2264 0 570 49838 14521 0 0 0 0 14521 17 129916 49322 11677 373 3138 194425 83020 5235 3 0 1 88260 18 57301 9458 1988 105 5169 74021 137786 172 0 0 88 138047
19 92501 8883 1912 1 4995 108293 132248 227 0 0 0 132475 20 184254 34581 6849 1 4745 230430 94526 1109 0 0 32 95667 21 194151 37045 4705 1336 5592 242830 170489 51 0 0 0 170540 22 119094 75892 8383 10796 9196 223361 203965 3762 122 0 4 207853 23 382995 26908 9475 194 1838 421410 24719 0 0 0 0 24719
24 81701 17949 17440 416 9243 126749 146610 0 0 0 0 146610 25 148670 94586 18509 646 7757 270168 240650 706 0 0 273 241628 26 229506 11722 8265 229 8935 258657 101849 1025 0 4 9 102887 27 203255 131094 18384 716 6926 360376 122336 61 0 0 21 122418 28 163614 50036 6748 60 7934 228392 147012 1258 37 0 9 148315
29 157515 82510 14218 1061 11879 267182 231306 2774 0 0 158 234238 30 0 13574 3563 1256 7159 25552 586366 0 0 0 0 586366 31 130383 22292 11349 693 6627 171344 251571 17 0 0 34 251622 32 74367 41334 559 21 2387 118668 89992 0 0 0 0 89992 33 75381 52233 5037 143 16999 149792 338217 157 0 0 836 339209
34 137841 54951 7201 327 8838 209157 117541 1951 0 0 0 119492 35 283860 48264 10676 417 10675 353892 125653 0 0 0 15 125668 36 152450 11495 25277 3219 12184 204626 144999 159 0 0 44 145203 37 82805 45131 13682 424 3372 145415 106924 0 10437 0 0 117361 all 136367 33280 9662 1090 7471 187870 137532 1482 25 0 54 139094

Appendix A
NSS Report No. 525: Unorganised Manufacturing Sector in India, 2005-06: Employment, Assets and Borrowings. A - 82
Table 6: (continued) Market value of fixed assets per enterprise (in Rs) as on last date of
reference year by type of asset for each industry Urban NDME all-India
market value (in Rs ) of fixed assets per enterprise as on date of survey owned + hired
number of enterprises industry
(NIC 2004) land and
building plant and
machinery
transport equip-ment
software and
hardware
tools and other fixed
assets total estimated sample
(1) (14) (15) (16) (17) (18) (19) (20) (21) 01405 451467 66579 5833 329 6988 531196 783 13
15 286303 34827 5565 79 8469 335242 149611 1816 16 61105 420 2264 0 570 64359 6093 27 17 212936 54557 11680 373 3139 282685 115782 770 18 195087 9630 1988 105 5257 212067 201087 2461
19 224749 9110 1912 1 4995 240767 31626 232 20 278780 35690 6849 1 4777 326097 53423 612 21 364640 37096 4705 1336 5592 413370 11199 99 22 323060 79654 8505 10796 9200 431214 39961 573 23 407714 26908 9475 194 1838 446129 185 3
24 228311 17949 17440 416 9243 273359 5039 84 25 389320 95292 18509 646 8030 511797 18807 201 26 331355 12747 8265 234 8944 361544 24866 263 27 325592 131155 18384 716 6947 482794 7454 124 28 310626 51294 6785 60 7943 376708 122074 1219
29 388821 85283 14218 1061 12037 501420 44052 429 30 586366 13574 3563 1256 7159 611918 533 6 31 381954 22309 11349 693 6661 422965 23638 325 32 164359 41334 559 21 2387 208660 1032 14 33 413598 52390 5037 143 17834 489002 3263 41
34 255382 56902 7201 327 8838 328649 5459 75 35 409513 48264 10676 417 10690 479560 5015 87 36 297450 11654 25277 3219 12229 349828 153350 1834 37 189729 45131 24119 424 3372 262776 684 14 all 273900 34762 9687 1090 7525 326964 1025013 11322

Appendix A
NSS Report No. 525: Unorganised Manufacturing Sector in India, 2005-06: Employment, Assets and Borrowings. A - 83
Table 6: Market value of fixed assets per enterprise (in Rs) as on last date of reference year by type of
asset for each industry Urban DME all-India
market value (in Rs ) of fixed assets per enterprise as on date of survey owned hired
industry (NIC 2004)
land
and
bu
ildin
g
plan
t and
m
achi
nery
trans
port
equi
pmen
t
softw
are
and
hard
war
e to
ols a
nd
othe
r fix
ed
asse
ts
tota
l
land
and
bu
ildin
g
plan
t an
d m
achi
nery
trans
port
equi
pmen
t so
ftwar
e an
d ha
rdw
are
tool
s and
ot
her f
ixed
as
sets
to
tal
(1) (2) (3) (4) (5) (6) (7) (8) (9) (10) (11) (12) (13) 01405 3523128 578110 318187 164 87434 4507022 3514 95561 0 0 0 99075
15 573226 141243 46808 3387 31923 796586 256129 6995 108 0 156 263388 16 281377 13334 15463 1236 17270 328681 293439 2667 0 0 0 296105 17 355540 200071 19114 1346 11226 587296 177979 25795 33 0 277 204083 18 151772 42935 18390 953 11266 225316 291841 1889 0 2 129 293860
19 118896 33678 11958 955 8190 173677 247422 637 14 4 57 248135 20 399213 76604 57490 345 9236 542889 292420 4595 0 0 20 297035 21 488958 162394 29627 2575 25656 709209 762339 719 6979 0 60 770096 22 285227 759982 58780 20449 43606 1168045 748754 1766 94 0 362 750975 23 117033 89104 75025 3807 29749 314718 193979 384 0 0 274 194636
24 386064 179603 75516 4573 80801 726558 313444 4452 197 0 1058 319150 25 294867 424782 27357 7545 27916 782467 445615 18191 64 0 191 464061 26 880373 138239 52936 2184 40195 1113927 248681 546 1401 0 0 250628 27 979792 556916 53672 2901 34230 1627511 311849 35546 60 0 8337 355792 28 465906 168839 47558 2756 21518 706576 271791 1904 121 0 22 273839
29 437092 206599 127065 18131 46392 835279 231564 3618 71 0 93 235345 30 53344 740760 126033 135257 118739 1174132 963455 9623 0 0 0 973078 31 314239 122403 79153 8728 26565 551087 419619 740 202 0 10 420572 32 163905 72693 43154 2674 23533 305960 1232945 18749 2521 0 0 125421633 490598 128596 84763 10441 49283 763681 388498 3216 0 4 2 391721
34 510321 156983 117231 4331 49368 838233 230225 27652 707 0 0 258584 35 1071573 136303 36580 10030 19084 1273571 87641 856 7 0 3 88507 36 190591 41692 60535 6977 24164 323959 531946 4198 0 0 268 536412 37 212915 38085 11061 443 40945 303449 638661 0 0 0 0 638661 all 372654 169527 43841 4792 23247 614061 314700 9564 189 0 282 324736

Appendix A
NSS Report No. 525: Unorganised Manufacturing Sector in India, 2005-06: Employment, Assets and Borrowings. A - 84
Table 6: (continued) Market value of fixed assets per enterprise (in Rs) as on last date of
reference year by type of asset for each industry Urban DME all-India
market value (in Rs ) of fixed assets per enterprise as on date of survey owned + hired
number of enterprises industry
(NIC 2004) land and
building plant and
machinery
transport equip-ment
software and
hardware
tools and other fixed
assets total estimated sample
(1) (14) (15) (16) (17) (18) (19) (20) (21) 01405 3526642 673671 318187 164 87434 4606098 97 10
15 829355 148238 46916 3387 32079 1059974 31669 995 16 574816 16001 15463 1236 17270 624787 1043 27 17 533518 225866 19147 1346 11503 791380 99361 709 18 443613 44824 18390 955 11395 519176 48537 357
19 366318 34315 11972 960 8247 421813 15853 153 20 691633 81199 57490 345 9256 839923 10912 158 21 1251296 163113 36606 2575 25716 1479305 4951 119 22 1033981 761748 58874 20449 43968 1919020 15712 272 23 311011 89488 75025 3807 30023 509354 196 15
24 699507 184056 75713 4573 81859 1045708 10065 256 25 740482 442972 27421 7545 28107 1246528 12920 250 26 1129054 138785 54337 2184 40195 1364555 12459 188 27 1291641 592462 53731 2901 42567 1983302 4779 142 28 737698 170743 47679 2756 21540 980415 43951 525
29 668656 210217 127136 18131 46485 1070624 24641 330 30 1016799 750384 126033 135257 118739 2147210 211 11 31 733858 123143 79355 8728 26575 971660 7317 279 32 1396850 91442 45676 2674 23533 1560175 1704 37 33 879096 131812 84763 10445 49286 1155402 1178 45
34 740546 184635 117938 4331 49368 1096817 2504 92 35 1159214 137159 36587 10030 19087 1362077 9389 89 36 722537 45890 60535 6977 24432 860371 53273 470 37 851576 38085 11061 443 40945 942110 632 12 all 687354 179091 44030 4793 23529 938797 413355 5541

Appendix A
NSS Report No. 525: Unorganised Manufacturing Sector in India, 2005-06: Employment, Assets and Borrowings. A - 85
Table 6: Market value of fixed assets per enterprise (in Rs) as on last date of reference year by type of
asset for each industry Urban all enterprise type all-India
market value (in Rs ) of fixed assets per enterprise as on date of survey owned hired
industry (NIC 2004)
land
and
bu
ildin
g
plan
t and
m
achi
nery
trans
port
equi
pmen
t
softw
are
and
hard
war
e to
ols a
nd
othe
r fix
ed
asse
ts
tota
l
land
and
bu
ildin
g
plan
t an
d m
achi
nery
trans
port
equi
pmen
t
softw
are
and
hard
war
e to
ols a
nd
othe
r fix
ed
asse
ts
to
tal
(1) (2) (3) (4) (5) (6) (7) (8) (9) (10) (11) (12) (13) 01405 272441 49624 13949 107 6111 342232 61928 3982 0 0 2 65912
15 118574 24931 5138 226 5861 154730 66660 1264 28 0 60 68011 16 23246 36 75 3 178 23538 8236 6 0 0 0 8242 17 87369 35181 4456 228 2346 129581 40974 4208 5 0 38 45224 18 34098 5658 1211 55 2011 43033 55009 141 0 0 25 55175
19 61746 8412 2610 145 3526 76439 101395 171 4 1 9 101579 20 85878 13860 4777 26 2485 107027 42925 532 0 0 10 43468 21 92096 20179 3412 449 3462 119597 100650 67 559 0 6 101282 22 115760 158103 13942 9164 12270 309238 241775 2011 63 0 60 243908 23 226357 25262 16143 754 6654 275170 43705 73 0 0 52 43829
24 49073 15997 7228 442 7314 80053 36413 371 16 0 90 36889 25 153952 156796 15094 2386 11182 339410 232916 9105 18 0 163 242201 26 186275 20169 8688 311 7673 223117 62772 336 165 1 3 63276 27 307953 170491 18613 1010 11999 510066 127766 7881 13 0 1851 137511 28 184367 58724 12163 516 9033 264803 138070 1028 39 0 10 139147
29 223659 93268 36675 4688 17219 375509 177131 2733 18 0 331 180213 30 13962 194381 35030 36468 35476 315317 615514 2414 0 0 0 617927 31 114033 28054 17037 1382 7651 168157 193435 365 25 0 43 193869 32 104447 46255 21265 1443 12826 186237 610168 8736 1175 0 0 620080 33 172045 42756 14492 1611 20207 251111 240858 623 0 1 331 241814
34 234840 80743 37713 1424 19869 374589 144732 9008 200 0 0 153939 35 599165 80952 20734 5024 12686 718561 83281 507 3 0 5 83797 36 87851 8773 12639 1424 7719 118407 113883 422 1 0 40 114345 37 93461 17911 5090 177 16735 133374 223586 0 2213 0 0 225800 all 84389 24199 6168 670 4554 119980 73016 1257 22 0 46 74341

Appendix A
NSS Report No. 525: Unorganised Manufacturing Sector in India, 2005-06: Employment, Assets and Borrowings. A - 86
Table 6: (continued) Market value of fixed assets per enterprise (in Rs) as on last date of
reference year by type of asset for each industry Urban all enterprise type all-India
market value (in Rs ) of fixed assets per enterprise as on date of survey owned + hired
number of enterprises industry
(NIC 2004) land and
building plant and
machinery
transport equip-ment
software and
hardware
tools and other fixed
assets total estimated sample
(1) (14) (15) (16) (17) (18) (19) (20) (21) 01405 334369 53606 13949 107 6113 408144 2551 56
15 185233 26195 5166 226 5920 222741 527542 5922 16 31482 42 75 3 178 31780 475497 1298 17 128344 39389 4461 228 2384 174805 802274 4251 18 89107 5799 1211 55 2037 98208 1270308 10521
19 163140 8583 2613 145 3535 178017 105669 716 20 128803 14393 4777 26 2495 150495 223716 2100 21 192746 20245 3971 449 3468 220879 61787 558 22 357534 160113 14005 9164 12329 553146 100324 1323 23 270062 25334 16143 754 6706 318999 1037 24
24 85485 16368 7244 442 7403 116942 120892 740 25 386868 165902 15111 2386 11344 581611 46917 593 26 249047 20504 8853 312 7676 286393 105762 1132 27 435719 178372 18626 1010 13850 647577 21613 403 28 322437 59752 12203 516 9043 403950 250097 2618
29 400790 96001 36693 4688 17550 555722 106048 1154 30 629476 196795 35030 36468 35476 933245 842 18 31 307468 28419 17062 1382 7694 362026 58314 977 32 714616 54992 22439 1443 12826 806316 3656 67 33 412904 43379 14492 1611 20539 492925 8237 129
34 379572 89751 37912 1424 19869 528528 8870 182 35 682446 81459 20737 5024 12691 802357 19421 241 36 201735 9195 12640 1424 7759 232752 617948 5785 37 317048 17911 7303 177 16735 359173 3229 39 all 157404 25457 6190 670 4601 194321 4942554 40847
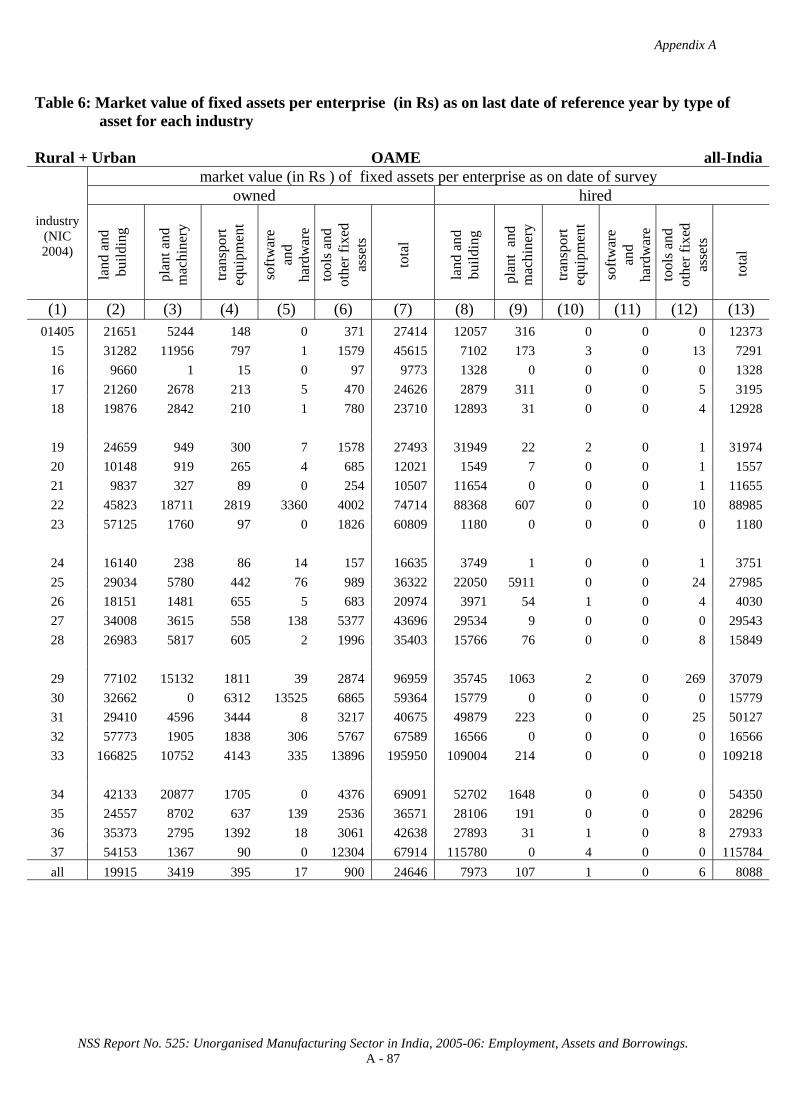
Appendix A
NSS Report No. 525: Unorganised Manufacturing Sector in India, 2005-06: Employment, Assets and Borrowings. A - 87
Table 6: Market value of fixed assets per enterprise (in Rs) as on last date of reference year by type of
asset for each industry Rural + Urban OAME all-India
market value (in Rs ) of fixed assets per enterprise as on date of survey owned hired
industry (NIC 2004)
land
and
bu
ildin
g
plan
t and
m
achi
nery
trans
port
equi
pmen
t
softw
are
and
hard
war
e to
ols a
nd
othe
r fix
ed
asse
ts
tota
l
land
and
bu
ildin
g
plan
t an
d m
achi
nery
trans
port
equi
pmen
t
softw
are
and
hard
war
e to
ols a
nd
othe
r fix
ed
asse
ts
to
tal
(1) (2) (3) (4) (5) (6) (7) (8) (9) (10) (11) (12) (13) 01405 21651 5244 148 0 371 27414 12057 316 0 0 0 12373
15 31282 11956 797 1 1579 45615 7102 173 3 0 13 7291 16 9660 1 15 0 97 9773 1328 0 0 0 0 1328 17 21260 2678 213 5 470 24626 2879 311 0 0 5 3195 18 19876 2842 210 1 780 23710 12893 31 0 0 4 12928
19 24659 949 300 7 1578 27493 31949 22 2 0 1 31974 20 10148 919 265 4 685 12021 1549 7 0 0 1 1557 21 9837 327 89 0 254 10507 11654 0 0 0 1 11655 22 45823 18711 2819 3360 4002 74714 88368 607 0 0 10 88985 23 57125 1760 97 0 1826 60809 1180 0 0 0 0 1180
24 16140 238 86 14 157 16635 3749 1 0 0 1 3751 25 29034 5780 442 76 989 36322 22050 5911 0 0 24 27985 26 18151 1481 655 5 683 20974 3971 54 1 0 4 4030 27 34008 3615 558 138 5377 43696 29534 9 0 0 0 29543 28 26983 5817 605 2 1996 35403 15766 76 0 0 8 15849
29 77102 15132 1811 39 2874 96959 35745 1063 2 0 269 37079 30 32662 0 6312 13525 6865 59364 15779 0 0 0 0 15779 31 29410 4596 3444 8 3217 40675 49879 223 0 0 25 50127 32 57773 1905 1838 306 5767 67589 16566 0 0 0 0 16566 33 166825 10752 4143 335 13896 195950 109004 214 0 0 0 109218
34 42133 20877 1705 0 4376 69091 52702 1648 0 0 0 54350 35 24557 8702 637 139 2536 36571 28106 191 0 0 0 28296 36 35373 2795 1392 18 3061 42638 27893 31 1 0 8 27933 37 54153 1367 90 0 12304 67914 115780 0 4 0 0 115784 all 19915 3419 395 17 900 24646 7973 107 1 0 6 8088

Appendix A
NSS Report No. 525: Unorganised Manufacturing Sector in India, 2005-06: Employment, Assets and Borrowings. A - 88
Table 6: (continued) Market value of fixed assets per enterprise (in Rs) as on last date of
reference year by type of asset for each industry Rural + Urban OAME all-India
market value (in Rs ) of fixed assets per enterprise as on date of survey owned + hired
number of enterprises industry
(NIC 2004) land and
building plant and
machinery
transport equip-ment
software and
hardware
tools and other fixed
assets total estimated sample
(1) (14) (15) (16) (17) (18) (19) (20) (21) 01405 33708 5560 148 0 371 39787 7734 72
15 38385 12128 800 1 1592 52905 2123865 9420 16 10988 1 15 0 97 11101 2804538 2838 17 24139 2989 213 5 475 27820 2176131 5742 18 32769 2873 210 1 784 36638 2835870 15211
19 56608 971 302 7 1579 59467 90919 491 20 11697 926 266 4 686 13578 1995963 6295 21 21491 327 89 0 254 22162 147931 462 22 134190 19318 2819 3360 4012 163699 54402 592 23 58306 1760 97 0 1826 61989 3111 35
24 19889 239 86 14 158 20386 385593 760 25 51084 11691 442 76 1013 64307 30264 223 26 22122 1535 655 5 687 25004 527228 2692 27 63542 3625 558 138 5377 73240 18988 201 28 42748 5893 605 2 2003 51252 386616 2452
29 112847 16195 1813 39 3144 134037 96064 775 30 48441 0 6312 13525 6865 75143 155 2 31 79289 4819 3444 8 3242 90802 71207 674 32 74339 1905 1838 306 5767 84155 2300 25 33 275829 10966 4143 335 13896 305168 3906 47
34 94835 22525 1705 0 4376 123441 1559 26 35 52663 8892 637 139 2536 64867 9500 93 36 63266 2826 1393 18 3069 70571 836946 5903 37 169933 1367 93 0 12304 183697 2118 14 all 27888 3527 395 17 906 32733 14612907 55045

Appendix A
NSS Report No. 525: Unorganised Manufacturing Sector in India, 2005-06: Employment, Assets and Borrowings. A - 89
Table 6: Market value of fixed assets per enterprise (in Rs) as on last date of reference year by type of
asset for each industry Rural + Urban NDME all-India
market value (in Rs ) of fixed assets per enterprise as on date of survey owned hired
industry (NIC 2004)
land
and
bu
ildin
g
plan
t and
m
achi
nery
trans
port
equi
pmen
t
softw
are
and
hard
war
e to
ols a
nd
othe
r fix
ed
asse
ts
tota
l
land
and
bu
ildin
g
plan
t an
d m
achi
nery
trans
port
equi
pmen
t
softw
are
and
hard
war
e to
ols a
nd
othe
r fix
ed
asse
ts
to
tal
(1) (2) (3) (4) (5) (6) (7) (8) (9) (10) (11) (12) (13) 01405 384330 81380 12943 254 6527 485435 89557 846 0 0 5 90408
15 132400 37297 5059 56 6653 181464 60033 1586 29 12 88 61749 16 42037 3700 3496 0 1092 50325 11117 0 0 0 0 11117 17 99979 34034 6966 221 2534 143734 42889 2757 2 0 7 45656 18 44292 9317 1560 65 4526 59760 106964 131 0 0 59 107154
19 88126 8855 1764 1 4819 103565 123074 207 0 0 0 123281 20 116975 25822 4287 8 4198 151289 75812 1263 0 0 34 77109 21 173159 36326 5363 1179 5194 221221 149504 44 0 0 0 149548 22 110170 74937 7863 10375 8871 212216 191622 3278 106 0 5 195011 23 100941 21632 21877 19 2055 146524 48289 0 0 0 0 48289
24 82673 16891 13109 325 7581 120578 92545 106 95 0 0 92746 25 146191 124177 14441 474 8177 293461 201730 790 0 0 198 202718 26 134220 16127 10799 115 7659 168920 65069 708 1 2 5 65785 27 158679 110433 15273 531 7340 292255 105711 467 0 0 59 106237 28 139116 45168 6417 41 6862 197604 118481 891 24 0 8 119404
29 155698 78687 13440 906 11550 260281 206328 2352 0 1 133 208814 30 0 13574 3563 1256 7159 25552 586366 0 0 0 0 586366 31 113383 22035 9170 610 6530 151728 209253 13 0 0 45 209310 32 73449 88228 4553 17 2284 168531 85417 0 0 0 0 85417 33 143432 57403 6670 106 15625 223236 249903 116 0 0 617 250636
34 123543 56268 8699 263 8400 197173 113098 1835 0 0 0 114933 35 245332 45148 9456 345 10007 310289 113893 0 0 0 13 113906 36 113452 10755 16905 2110 9537 152758 104159 120 152 0 36 104468 37 64430 34571 10844 297 2615 112757 90763 0 7305 0 0 98068 all 107875 30297 7194 681 6149 152196 95212 1107 37 2 46 96405

Appendix A
NSS Report No. 525: Unorganised Manufacturing Sector in India, 2005-06: Employment, Assets and Borrowings. A - 90
Table 6: (continued) Market value of fixed assets per enterprise (in Rs) as on last date of
reference year by type of asset for each industry Rural + Urban NDME all-India
market value (in Rs ) of fixed assets per enterprise as on date of survey owned + hired
number of enterprises industry
(NIC 2004) land and
building plant and
machinery
transport equip-ment
software and
hardware
tools and other fixed
assets total estimated sample
(1) (14) (15) (16) (17) (18) (19) (20) (21) 01405 473887 82226 12943 254 6533 575843 1017 18
15 192433 38883 5088 68 6741 243213 335216 3392 16 53154 3700 3496 0 1092 61442 11292 77 17 142869 36791 6967 221 2542 189389 244943 1317 18 151256 9448 1560 65 4585 166914 325683 3571
19 211200 9061 1764 1 4819 226845 34790 266 20 192787 27085 4287 8 4232 228398 123433 1286 21 322662 36370 5363 1179 5194 370769 12935 114 22 301792 78215 7969 10375 8876 407227 45858 657 23 149230 21632 21877 19 2055 194813 1941 18
24 175218 16997 13204 325 7581 213325 8982 173 25 347921 124967 14441 474 8375 496178 25911 290 26 199289 16835 10800 117 7664 234705 57086 629 27 264390 110900 15273 531 7398 398492 10051 170 28 257597 46059 6441 41 6870 317008 184229 1904
29 362026 81039 13440 906 11683 469095 52069 568 30 586366 13574 3563 1256 7159 611918 533 6 31 322636 22047 9170 610 6575 361038 31540 435 32 158866 88228 4553 17 2284 253948 1284 16 33 393336 57519 6670 106 16242 473873 4416 44
34 236641 58103 8699 263 8400 312106 6777 105 35 359225 45148 9456 345 10020 424195 6077 120 36 217611 10876 17057 2110 9572 257226 243241 2862 37 155193 34571 18149 297 2615 210825 977 22 all 203087 31404 7230 684 6196 248601 1770282 18060

Appendix A
NSS Report No. 525: Unorganised Manufacturing Sector in India, 2005-06: Employment, Assets and Borrowings. A - 91
Table 6: Market value of fixed assets per enterprise (in Rs) as on last date of reference year by type of
asset for each industry Rural + Urban DME all-India
market value (in Rs ) of fixed assets per enterprise as on date of survey owned hired
industry (NIC 2004)
land
and
bu
ildin
g
plan
t and
m
achi
nery
trans
port
equi
pmen
t
softw
are
and
hard
war
e to
ols a
nd
othe
r fix
ed
asse
ts
tota
l
land
and
bu
ildin
g
plan
t an
d m
achi
nery
trans
port
equi
pmen
t
softw
are
and
hard
war
e to
ols a
nd
othe
r fix
ed
asse
ts
to
tal
(1) (2) (3) (4) (5) (6) (7) (8) (9) (10) (11) (12) (13) 01405 1653801 678600 99719 1569 43781 2477470 65665 29660 1938 0 0 97263
15 245591 109616 25221 916 20085 401430 70035 5407 44 0 91 75577 16 169332 34210 70236 1128 26940 301846 288693 1199 0 0 0 289892 17 304701 186713 17857 1084 11336 521691 126882 18426 22 0 209 145539 18 150546 46615 18011 1008 11672 227852 278763 4324 0 2 127 283215
19 113817 31764 10886 830 7683 164979 221658 551 12 4 50 222275 20 365365 186905 39077 290 16281 607918 198293 6711 0 0 76 205079 21 401208 161923 37115 1987 19304 621537 545324 500 4832 0 209 550864 22 327930 750230 113849 20839 39937 1252786 671702 1614 83 0 322 673722 23 497925 656796 36222 4782 29102 1224827 172904 11102 0 0 64 184070
24 396172 116438 46000 4058 48309 610978 167066 1957 105 0 472 169600 25 303088 427442 35856 6417 29244 802047 423941 14739 126 0 156 438962 26 371037 125424 64124 674 21298 582557 125297 907 559 1 8 126771 27 957938 869034 56771 6077 35646 1925467 276475 28718 47 0 6814 312054 28 439744 173444 44738 2725 21246 681897 255419 2139 109 0 21 257687
29 445032 230456 121931 17880 46317 861617 222833 3412 67 0 88 226399 30 53344 740760 126033 135257 118739 1174132 963455 9623 0 0 0 973078 31 432863 191029 77413 9201 32238 742745 395873 1507 184 0 10 397573 32 221110 99143 184844 3010 38861 546968 991450 14778 1987 0 0 100821533 473438 126873 81728 10020 47118 739178 374478 3045 0 4 2 377529
34 326283 156487 45929 1610 29653 559961 86119 10001 256 0 0 96375 35 1059206 136428 37276 9973 19185 1262067 94338 1001 112 0 3 95454 36 166099 39902 50247 5307 20942 282497 411775 3347 0 0 199 415321 37 246305 91799 55813 458 47279 441653 511931 0 0 0 0 511931 all 306327 158618 39540 3256 20681 528423 208251 7233 145 0 194 215823

Appendix A
NSS Report No. 525: Unorganised Manufacturing Sector in India, 2005-06: Employment, Assets and Borrowings. A - 92
Table 6: (continued) Market value of fixed assets per enterprise (in Rs) as on last date of
reference year by type of asset for each industry Rural + Urban DME all-India
market value (in Rs ) of fixed assets per enterprise as on date of survey owned + hired
number of enterprises industry
(NIC 2004) land and
building plant and
machinery
transport equip-ment
software and
hardware
tools and other fixed
assets total estimated sample
(1) (14) (15) (16) (17) (18) (19) (20) (21) 01405 1719466 708259 101657 1569 43781 2574733 381 29
15 315626 115023 25266 916 20176 477007 143726 1767 16 458025 35409 70236 1128 26940 591738 2320 52 17 431583 205139 17879 1084 11544 667230 146739 1169 18 429310 50939 18011 1009 11799 511068 52316 420
19 335475 32315 10897 834 7732 387254 18315 176 20 563658 193616 39077 290 16357 812998 18874 358 21 946531 162423 41947 1987 19512 1172401 7213 166 22 999633 751844 113933 20839 40260 1926508 17655 300 23 670829 667898 36222 4782 29166 1408897 834 35
24 563238 118396 46105 4058 48781 780578 23635 526 25 727029 442182 35982 6417 29400 1241009 16135 400 26 496334 126330 64683 675 21306 709328 57506 1660 27 1234414 897752 56818 6077 42461 2237521 6094 218 28 695163 175584 44847 2725 21266 939584 49029 747
29 667865 233869 121998 17880 46405 1088016 26135 391 30 1016799 750384 126033 135257 118739 2147210 211 11 31 828736 192536 77597 9201 32248 1140318 8043 328 32 1212560 113920 186831 3010 38861 1555183 2162 39 33 847916 129918 81728 10025 47120 1116707 1244 53
34 412402 166488 46184 1610 29653 656337 6924 124 35 1153544 137429 37388 9973 19188 1357521 9525 110 36 577874 43250 50247 5307 21141 697818 71819 696 37 758236 91799 55813 458 47279 953584 796 17 all 514578 165851 39685 3256 20875 744245 687632 9792

Appendix A
NSS Report No. 525: Unorganised Manufacturing Sector in India, 2005-06: Employment, Assets and Borrowings. A - 93
Table 6: Market value of fixed assets per enterprise (in Rs) as on last date of reference year by type of
asset for each industry Rural + Urban all enterprise type all-India
market value (in Rs ) of fixed assets per enterprise as on date of survey owned hired
industry (NIC 2004)
land
and
bu
ildin
g
plan
t and
m
achi
nery
trans
port
equi
pmen
t
softw
are
and
hard
war
e to
ols a
nd
othe
r fix
ed
asse
ts
tota
l
land
and
bu
ildin
g
plan
t an
d m
achi
nery
trans
port
equi
pmen
t
softw
are
and
hard
war
e to
ols a
nd
othe
r fix
ed
asse
ts
to
tal
(1) (2) (3) (4) (5) (6) (7) (8) (9) (10) (11) (12) (13) 01405 130151 41825 5728 94 2868 180666 22923 1600 81 0 1 24604
15 56139 20612 2695 58 3254 82759 17394 644 9 2 27 18075 16 9921 44 87 1 123 10176 1604 1 0 0 0 1605 17 44967 16186 1865 87 1288 64392 13781 1580 2 0 17 15379 18 24478 4211 637 24 1337 30686 26754 111 0 0 11 26876
19 51327 6777 2000 110 3137 63352 78086 134 3 0 7 78230 20 19450 3998 840 7 1025 25320 7572 139 0 0 4 7714 21 39202 10032 2084 176 1452 52946 45165 25 207 0 9 45407 22 113087 150105 21405 8705 11276 304578 215864 1797 54 0 55 217770 23 134055 101160 12400 684 5768 254066 41056 1574 0 0 9 42639
24 39046 7163 2961 249 3037 52456 14886 114 8 0 28 15035 25 132166 142293 13361 1634 9869 299323 176111 6046 28 0 116 182301 26 60092 13889 7243 75 3151 84450 20276 189 51 0 5 20520 27 229929 184280 14518 1281 11189 441197 94159 5120 8 0 1199 100486 28 92957 30771 5823 229 4964 134744 65248 482 16 0 9 65755
29 155763 66413 23300 2974 11982 260432 114770 1801 11 0 201 116783 30 18173 181986 32797 34844 33310 301109 576263 2260 0 0 0 578523 31 82605 23095 10444 847 6267 123257 120368 256 13 0 29 120667 32 122734 57781 71303 1259 17441 270518 398765 5560 748 0 0 405074 33 195908 47391 15401 1489 19015 279204 208576 537 0 1 285 209399
34 207214 98124 24876 847 17632 348694 94688 5521 116 0 0 100325 35 470613 65992 16675 3920 10663 567863 74006 452 42 0 4 74504 36 60009 6789 7713 789 5543 80843 67929 257 33 0 26 68244 37 96044 28207 14190 168 17025 155635 190540 0 1837 0 0 192377 all 40573 12458 2677 216 2241 58166 25088 498 10 0 18 25614
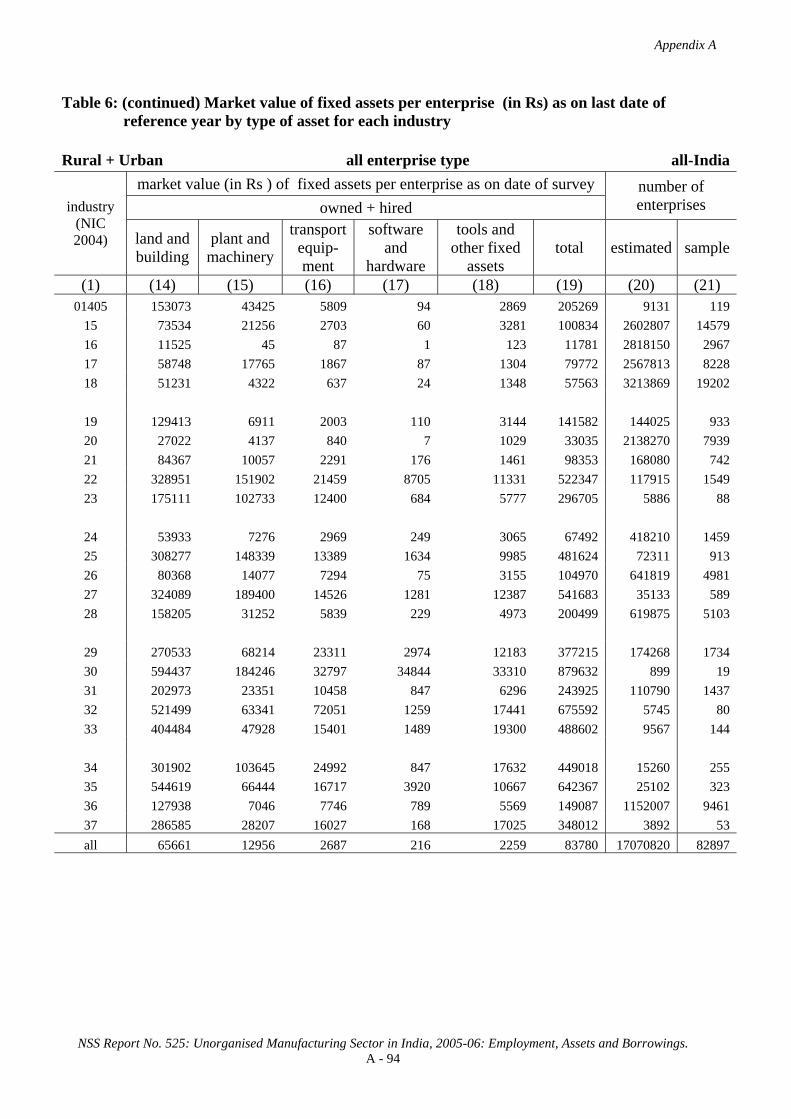
Appendix A
NSS Report No. 525: Unorganised Manufacturing Sector in India, 2005-06: Employment, Assets and Borrowings. A - 94
Table 6: (continued) Market value of fixed assets per enterprise (in Rs) as on last date of
reference year by type of asset for each industry Rural + Urban all enterprise type all-India
market value (in Rs ) of fixed assets per enterprise as on date of survey owned + hired
number of enterprises industry
(NIC 2004) land and
building plant and
machinery
transport equip-ment
software and
hardware
tools and other fixed
assets total estimated sample
(1) (14) (15) (16) (17) (18) (19) (20) (21) 01405 153073 43425 5809 94 2869 205269 9131 119
15 73534 21256 2703 60 3281 100834 2602807 14579 16 11525 45 87 1 123 11781 2818150 2967 17 58748 17765 1867 87 1304 79772 2567813 8228 18 51231 4322 637 24 1348 57563 3213869 19202
19 129413 6911 2003 110 3144 141582 144025 933 20 27022 4137 840 7 1029 33035 2138270 7939 21 84367 10057 2291 176 1461 98353 168080 742 22 328951 151902 21459 8705 11331 522347 117915 1549 23 175111 102733 12400 684 5777 296705 5886 88
24 53933 7276 2969 249 3065 67492 418210 1459 25 308277 148339 13389 1634 9985 481624 72311 913 26 80368 14077 7294 75 3155 104970 641819 4981 27 324089 189400 14526 1281 12387 541683 35133 589 28 158205 31252 5839 229 4973 200499 619875 5103
29 270533 68214 23311 2974 12183 377215 174268 1734 30 594437 184246 32797 34844 33310 879632 899 19 31 202973 23351 10458 847 6296 243925 110790 1437 32 521499 63341 72051 1259 17441 675592 5745 80 33 404484 47928 15401 1489 19300 488602 9567 144
34 301902 103645 24992 847 17632 449018 15260 255 35 544619 66444 16717 3920 10667 642367 25102 323 36 127938 7046 7746 789 5569 149087 1152007 9461 37 286585 28207 16027 168 17025 348012 3892 53 all 65661 12956 2687 216 2259 83780 17070820 82897

Appendix A
NSS Report No. 525: Unorganised Manufacturing Sector in India, 2005-06: Employment, Assets and Borrowings. A - 95
Table 6: Market value of fixed assets per enterprise (in Rs) as on last date of reference year by type
of asset for each State/UTs Rural OAME
market value (in Rs ) of fixed assets per enterprise as on date of survey owned hired
State/UT
land
and
bu
ildin
g
plan
t and
m
achi
nery
trans
port
equi
pmen
t
softw
are
and
hard
war
e
tool
s and
ot
her f
ixed
as
sets
tota
l
land
and
bu
ildin
g
plan
t an
d m
achi
nery
trans
port
equi
pmen
t
softw
are
and
hard
war
e
tool
s and
ot
her f
ixed
as
sets
to
tal
(1) (2) (3) (4) (5) (6) (7) (8) (9) (10) (11) (12) (13) Andhra Pradesh 13631 2060 124 1 583 16399 1671 159 0 0 3 1834
Arunachal Pradesh 8399 4871 0 0 2584 15854 10909 1588 0 0 0 12497 Assam 8123 3860 259 20 864 13126 738 4 0 0 0 743 Bihar 18387 4510 177 0 755 23829 429 1 0 0 0 430 Chhattisgarh 12147 2242 106 1 850 15345 601 0 0 0 0 601 Delhi 58903 5470 0 0 5747 70121 8979 0 0 0 0 8979 Goa 97998 21690 725 128 1279 121819 26125 0 0 0 0 26125 Gujarat 23577 5597 1189 24 1241 31628 3341 30 11 0 12 3395 Haryana 37365 7794 1517 0 2684 49360 12945 17 0 0 0 12963
Himachal Pradesh 24644 9703 253 6 1705 36311 6683 5 0 0 88 6776
Jammu & Kashmir 30421 7284 345 14 1339 39401 3250 8 0 0 0 3259 Jharkhand 9858 1483 134 0 496 11970 179 0 0 0 0 179 Karnataka 18917 3399 90 7 522 22935 1534 56 0 0 1 1591 Kerala 14906 4504 332 2 1146 20890 7245 180 0 0 10 7435 Madhya Pradesh 15765 2354 158 0 569 18847 1150 10 1 0 2 1163 Maharashtra 19902 5362 520 10 957 26751 6706 57 1 0 3 6766 Manipur 21561 3236 4 2 732 25535 1602 16 0 0 0 1617 Meghalaya 11827 2899 1 0 1475 16203 4445 0 0 0 0 4445 Mizoram 20359 14073 35 6 1544 36017 2177 7 0 0 0 2184 Nagaland 36242 4635 0 2 2243 43122 2155 141 0 0 1 2298 Orissa 5852 865 239 0 429 7384 626 1 0 0 1 628 Punjab 35484 6323 1155 7 1555 44524 9664 7 3 0 0 9675 Rajasthan 25788 6466 445 2 1507 34208 4467 175 0 0 7 4648 Sikkim 9277 2522 0 0 1184 12983 9055 29 0 0 0 9084 Tamil Nadu 14814 2546 759 3 554 18676 5598 28 0 0 0 5626 Tripura 6477 1648 5 6 731 8867 1175 2 0 0 1 1178 Uttaranchal 24739 9284 34 0 1570 35627 9808 265 0 0 0 10074 Uttar Pradesh 16862 4539 276 1 615 22294 2421 214 0 0 3 2637 West Bengal 10189 786 156 1 487 11619 578 41 0 0 3 622 A & N Islands 29771 8213 11 0 2210 40204 12625 125 0 0 9 12760 Chandigarh 80200 3688 131 0 1242 85261 80636 406 0 0 0 81043 D & N Haveli 11218 2557 301 0 437 14514 5338 0 0 0 0 5338 Daman & Diu 9445 1555 457 0 240 11698 29884 0 0 0 0 29884 Lakshadweep 10345 3722 179 0 817 15063 7236 9 0 0 0 7244 Pondicherry 94826 4566 227 0 497 100116 10206 24 0 0 0 10230 all-India 15099 3110 298 3 712 19222 2402 75 0 0 3 2480

Appendix A
NSS Report No. 525: Unorganised Manufacturing Sector in India, 2005-06: Employment, Assets and Borrowings. A - 96
Table 6: (continued) Market value of fixed assets per enterprise (in Rs) as on last date of reference
year by type of asset for each State/UTs Rural OAME
market value (in Rs ) of fixed assets per enterprise as on date of survey
owned + hired number of enterprises State/UTs
land and building
plant and machinery
transport equipment
software and hardware
tools and other fixed assets total estimated sample
(1) (14) (15) (16) (17) (18) (19) (20) (21) Andhra Pradesh 15302 2220 124 1 587 18233 998813 2959 Arunachal Pradesh 19308 6460 0 0 2584 28352 304 36 Assam 8861 3864 259 20 865 13869 306157 1780 Bihar 18816 4511 177 0 755 24259 639312 2195 Chhattisgarh 12748 2242 106 1 850 15946 169729 392 Delhi 67882 5470 0 0 5747 79100 767 16 Goa 124123 21690 725 128 1279 147944 3200 70 Gujarat 26918 5627 1200 24 1253 35022 276152 1043 Haryana 50310 7811 1517 0 2684 62322 102113 637 Himachal Pradesh 31327 9708 253 6 1793 43087 92900 732 Jammu & Kashmir 33671 7292 345 14 1339 42660 132883 878 Jharkhand 10036 1483 134 0 496 12149 522684 863 Karnataka 20451 3455 90 7 523 24525 580125 1424 Kerala 22150 4684 332 2 1156 28325 374908 1653 Madhya Pradesh 16915 2364 159 0 571 20010 541814 1328 Maharashtra 26608 5419 521 10 960 33517 499406 1587 Manipur 23163 3251 4 2 732 27152 34388 388 Meghalaya 16271 2899 1 0 1475 20647 26803 249 Mizoram 22536 14080 35 6 1544 38201 3078 181 Nagaland 38397 4777 0 2 2244 45420 6842 394 Orissa 6478 866 239 0 429 8012 843862 1917 Punjab 45149 6330 1159 7 1555 54199 135428 902 Rajasthan 30255 6641 445 2 1514 38856 371194 1250 Sikkim 18333 2550 0 0 1184 22067 3260 135 Tamil Nadu 20412 2574 759 3 555 24303 720436 1896 Tripura 7653 1649 5 6 732 10044 33235 672 Uttaranchal 34548 9549 34 0 1570 45701 44403 253 Uttar Pradesh 19283 4753 276 1 618 24931 1577716 2541 West Bengal 10767 828 156 1 490 12241 2061369 2423 A & N Islands 42396 8338 11 0 2219 52964 1283 108 Chandigarh 160837 4094 131 0 1242 166303 567 15 D & N Haveli 16557 2557 301 0 437 19852 506 19 Daman & Diu 39329 1555 457 0 240 41582 852 37 Lakshadweep 17580 3731 179 0 817 22307 204 20 Pondicherry 105032 4590 227 0 497 110346 2026 68 all-India 17502 3184 298 3 715 21702 11108720 31061

Appendix A
NSS Report No. 525: Unorganised Manufacturing Sector in India, 2005-06: Employment, Assets and Borrowings. A - 97
Table 6: Market value of fixed assets per enterprise (in Rs) as on last date of reference year by type of
asset for each State/UTs Rural NDME
market value (in Rs ) of fixed assets per enterprise as on date of survey owned hired
State/UT
land
and
bu
ildin
g
plan
t and
m
achi
nery
trans
port
equi
pmen
t
softw
are
and
hard
war
e
tool
s and
ot
her f
ixed
as
sets
tota
l
land
and
bu
ildin
g
plan
t an
d m
achi
nery
trans
port
equi
pmen
t
softw
are
and
hard
war
e
tool
s and
ot
her f
ixed
as
sets
to
tal
(1) (2) (3) (4) (5) (6) (7) (8) (9) (10) (11) (12) (13) Andhra Pradesh 90616 45162 2624 118 3596 142116 84501 3574 13 88 49 88225
Arunachal Pradesh 26573 11641 88 133 2567 41001 20023 99 0 0 1763 21885 Assam 28550 14476 851 46 3179 47101 8518 142 0 0 29 8689 Bihar 20959 16987 397 0 1551 39894 10487 0 0 0 1 10488 Chhattisgarh 141248 111677 11707 0 13601 278233 3491 10 0 0 0 3502 Delhi 67045 20777 3147 0 4042 95011 162337 0 0 0 0 162337 Goa 175889 55466 16456 3325 4750 255887 11961 1147 373 0 172 13652 Gujarat 49574 17012 6553 21 3365 76524 25575 1 0 0 0 25576 Haryana 122322 94903 8847 36 8980 235088 119396 39 59 0 118 119612
Himachal Pradesh 113638 30525 1448 1144 7119 153874 73016 78 0 0 7 73101
Jammu & Kashmir 102552 57485 7490 63 7045 174634 14920 0 0 0 0 14920 Jharkhand 25913 5502 2519 0 1712 35646 5393 0 0 0 0 5393 Karnataka 116025 38562 6838 97 5175 166696 35513 378 0 0 4 35895 Kerala 63967 31310 3962 260 6236 105736 65419 1086 375 0 40 66920 Madhya Pradesh 14888 7552 1659 2 2352 26454 44733 0 6 0 0 44740 Maharashtra 83415 40691 9393 3 4921 138423 44797 108 0 0 0 44904 Manipur 37570 20316 0 0 5593 63480 65557 1231 0 0 0 66788 Meghalaya 38080 9162 147 0 3317 50705 13194 0 0 0 31 13225 Mizoram 21996 27655 2807 0 5383 57841 10259 24 0 0 14 10297 Nagaland 37150 14761 0 0 4942 56854 27476 0 0 0 0 27476 Orissa 38972 18338 6815 21 2676 66823 7180 318 0 0 0 7498 Punjab 185913 36666 5177 508 7025 235289 95053 1999 0 0 6 97058 Rajasthan 57500 18977 3641 903 3462 84481 27694 585 0 0 26 28305 Sikkim 129590 27376 0 0 4104 161070 102801 0 0 0 0 102801 Tamil Nadu 111893 32853 6037 121 3467 154372 16100 581 0 0 152 16833 Tripura 19781 6594 5 0 3875 30254 5637 35 0 0 33 5705 Uttaranchal 103660 24795 3024 0 5765 137244 89499 1 0 0 0 89500 Uttar Pradesh 48840 16985 1343 13 2690 69870 32284 187 0 0 5 32476 West Bengal 49014 12845 1993 1 5008 68861 14674 201 0 0 18 14893 A & N Islands 41889 37061 1409 296 27825 108480 109372 0 0 0 0 109372 Chandigarh 214545 18817 1990 0 19537 254889 188683 0 0 0 0 188683 D & N Haveli 17155 29578 1117 55 2206 50110 77485 0 0 0 0 77485 Daman & Diu 16052 44425 5079 939 4761 71256 42746 10116 0 0 0 52863 Lakshadweep 47833 22537 174 0 4248 74793 4661 0 0 0 0 4661 Pondicherry 107530 72594 31714 190 15069 227097 400205 1686 0 0 0 401891 all-India 68688 26195 3799 119 4332 103132 37006 592 52 5 36 37691

Appendix A
NSS Report No. 525: Unorganised Manufacturing Sector in India, 2005-06: Employment, Assets and Borrowings. A - 98
Table 6: (continued) Market value of fixed assets per enterprise (in Rs) as on last date of reference
year by type of asset for each State/UTs Rural NDME
market value (in Rs ) of fixed assets per enterprise as on date of survey
owned + hired number of enterprises State/UTs
land and building
plant and machinery
transport equipment
software and hardware
tools and other fixed assets total estimated sample
(1) (14) (15) (16) (17) (18) (19) (20) (21) Andhra Pradesh 175117 48736 2638 206 3644 230341 45316 523 Arunachal Pradesh 46595 11740 88 133 4329 62886 226 37 Assam 37068 14618 851 46 3208 55790 24581 273 Bihar 31446 16987 397 0 1551 50381 23138 220 Chhattisgarh 144740 111688 11707 0 13601 281735 1549 54 Delhi 229382 20777 3147 0 4042 257348 1810 28 Goa 187850 56613 16829 3325 4922 269539 888 32 Gujarat 75148 17013 6553 21 3365 102100 14538 134 Haryana 241719 94942 8906 36 9097 354700 14267 206 Himachal Pradesh 186654 30603 1448 1144 7126 226975 6763 161 Jammu & Kashmir 117472 57485 7490 63 7045 189555 6501 157 Jharkhand 31306 5502 2519 0 1712 41038 16622 90 Karnataka 151538 38939 6838 97 5179 202591 32323 192 Kerala 129386 32396 4337 260 6276 172655 98679 827 Madhya Pradesh 59621 7552 1666 2 2352 71193 13146 98 Maharashtra 128212 40798 9393 3 4921 183327 39967 192 Manipur 103127 21548 0 0 5593 130268 1288 45 Meghalaya 51274 9162 147 0 3348 63931 6579 106 Mizoram 32255 27678 2807 0 5397 68138 196 39 Nagaland 64626 14761 0 0 4942 84330 319 28 Orissa 46153 18655 6815 21 2676 74320 23583 166 Punjab 280966 38664 5177 508 7031 332346 13610 172 Rajasthan 85193 19562 3641 903 3487 112786 23428 295 Sikkim 232392 27376 0 0 4104 263871 397 21 Tamil Nadu 127994 33434 6037 122 3619 171205 88273 690 Tripura 25418 6629 5 0 3908 35960 5400 347 Uttaranchal 193159 24796 3024 0 5765 226744 7371 94 Uttar Pradesh 81124 17172 1343 13 2695 102346 100935 545 West Bengal 63688 13046 1993 1 5026 83754 131237 783 A & N Islands 151262 37061 1409 296 27825 217853 488 60 Chandigarh 403228 18817 1990 0 19537 443572 154 13 D & N Haveli 94641 29578 1117 55 2206 127596 247 31 Daman & Diu 58798 54542 5079 939 4761 124118 133 20 Lakshadweep 52495 22537 174 0 4248 79454 48 8 Pondicherry 507735 74280 31714 190 15069 628987 1270 51 all-India 105694 26787 3851 124 4367 140823 745269 6738

Appendix A
NSS Report No. 525: Unorganised Manufacturing Sector in India, 2005-06: Employment, Assets and Borrowings. A - 99
Table 6: Market value of fixed assets per enterprise (in Rs) as on last date of reference year by type of asset for each State/UTs
Rural DME
market value (in Rs ) of fixed assets per enterprise as on date of survey owned hired
State/UT
land
and
bu
ildin
g
plan
t and
m
achi
nery
trans
port
equi
pmen
t
softw
are
and
hard
war
e
tool
s and
ot
her f
ixed
as
sets
tota
l
land
and
bu
ildin
g
plan
t an
d m
achi
nery
trans
port
equi
pmen
t
softw
are
and
hard
war
e to
ols a
nd
othe
r fix
ed
asse
ts
to
tal
(1) (2) (3) (4) (5) (6) (7) (8) (9) (10) (11) (12) (13) Andhra Pradesh 124065 37537 6726 25 3751 172104 12152 5871 34 0 148 18204
Arunachal Pradesh 841775 172838 1653677 0 73830 2742120 2855136 2120958 0 0 0 4976094Assam 151832 135575 113277 0 16221 416904 32766 595 397 0 79 33838 Bihar 80792 70684 10093 0 14081 175650 18987 0 0 0 0 18987 Chhattisgarh 833369 1838136 45532 17457 36626 2771120 153036 12105 0 0 0 165141 Delhi 292782 302213 123922 3913 14594 737425 515537 11372 0 0 1137 528046 Goa 806860 852306 201200 29437 86733 1976537 57056 0 0 0 0 57056 Gujarat 126225 75156 34423 627 14447 250878 39112 243 0 0 0 39355 Haryana 749043 530880 133990 3295 59249 1476457 443474 9836 526 0 0 453835
Himachal Pradesh 909961 475840 79567 5829 33992 1505188 248995 9 0 0 153 249156
Jammu & Kashmir 549395 390919 86768 152 104275 1131509 747832 0 9880 0 0 757712 Jharkhand 55509 90448 25242 206 3745 175149 6324 0 0 0 0 6324 Karnataka 92672 36983 7729 85 6969 144438 5985 72 24 0 0 6081 Kerala 497430 330514 75488 3284 41672 948388 74871 2018 0 0 99 76988 Madhya Pradesh 107623 44281 36734 87 11502 200228 11685 3 49 0 53 11789 Maharashtra 339445 286089 47291 2277 16353 691454 33823 5176 42 0 0 39042 Manipur 505652 30168 788 0 6380 542988 66388 284 0 0 0 66672 Meghalaya 87300 88734 26351 0 13556 215941 18469 0 0 0 0 18469 Mizoram 136849 134795 0 32692 14313 318649 1241 0 0 0 0 1241 Nagaland 105995 4191 25081 0 29994 165261 137540 0 0 0 0 137540 Orissa 203117 133360 54246 14 22175 412912 16396 1608 0 0 0 18004 Punjab 592541 192673 105297 3078 21644 915233 287536 54897 0 0 0 342434 Rajasthan 192891 253273 51895 1502 22998 522559 37879 4560 0 0 66 42505 Sikkim 208254 1004192 201849 58483 41187 1513965 1061845 655993 0 0 0 1717838Tamil Nadu 292521 219242 52333 1355 20414 585866 41689 3826 40 0 100 45655 Tripura 211507 156830 57521 0 21139 446997 108729 151 4153 0 38 113070 Uttaranchal 298603 104008 13405 2082 11871 429969 246510 13267 148 33 368 260325 Uttar Pradesh 117206 90457 33772 28 8712 250174 70420 9643 0 0 22 80085 West Bengal 119690 76104 12698 213 27371 236077 29779 241 22 0 24 30067 A & N Islands 267057 198472 111279 6215 48258 631281 179511 0 0 0 0 179511 Chandigarh 914299 262208 11901 0 14612 1203020 557278 0 0 0 0 557278 D & N Haveli 71311 202563 6750 1287 10571 292482 160538 0 0 0 0 160538 Daman & Diu 320790 362154 121005 3593 63477 871018 4717 2838 0 0 0 7555 Lakshadweep 17500 137500 0 0 15600 170600 0 28550 0 0 0 28550 Pondicherry 768315 477637 48486 2259 29582 1326279 849468 0 656 0 0 850123 all-India 206368 142177 33059 941 16815 399359 47824 3720 78 0 61 51683

Appendix A
NSS Report No. 525: Unorganised Manufacturing Sector in India, 2005-06: Employment, Assets and Borrowings. A - 100
Table 6: (continued) Market value of fixed assets per enterprise (in Rs) as on last date of reference year
by type of asset for each State/UTs Rural DME
market value (in Rs ) of fixed assets per enterprise as on date of survey owned + hired
number of enterprises State/UTs
land and building
plant and machinery
transport equipment
software and hardware
tools and other fixed assets total estimated sample
(1) (14) (15) (16) (17) (18) (19) (20) (21) Andhra Pradesh 136217 43408 6760 25 3899 190309 41113 394 Arunachal Pradesh 3696910 2293796 1653677 0 73830 7718214 11 3 Assam 184598 136171 113673 0 16300 450742 2268 31 Bihar 99779 70684 10093 0 14081 194637 929 53 Chhattisgarh 986405 1850241 45532 17457 36626 2936261 1332 82 Delhi 808320 313586 123922 3913 15731 1265471 1062 27 Goa 863917 852306 201200 29437 86733 2033593 458 45 Gujarat 165337 75399 34423 627 14447 290233 10064 173 Haryana 1192517 540716 134516 3295 59249 1930292 3306 275 Himachal Pradesh 1158956 475848 79567 5829 34144 1754345 774 118 Jammu & Kashmir 1297227 390919 96648 152 104275 1889221 1083 48 Jharkhand 61833 90448 25242 206 3745 181473 944 22 Karnataka 98656 37055 7753 85 6969 150519 50764 154 Kerala 572301 332532 75488 3284 41770 1025376 19191 202 Madhya Pradesh 119308 44284 36783 87 11555 212017 9502 215 Maharashtra 373268 291265 47333 2277 16353 730496 16795 184 Manipur 572041 30452 788 0 6380 609660 121 10 Meghalaya 105769 88734 26351 0 13556 234410 1131 33 Mizoram 138091 134795 0 32692 14313 319890 18 3 Nagaland 243536 4191 25081 0 29994 302801 6 3 Orissa 219513 134969 54246 14 22175 430916 3432 107 Punjab 880078 247570 105297 3078 21644 1257667 1170 56 Rajasthan 230769 257833 51895 1502 23064 565063 6253 487 Sikkim 1270100 1660185 201849 58483 41187 3231804 26 8 Tamil Nadu 334210 223068 52373 1355 20515 631521 41644 612 Tripura 320236 156981 61674 0 21176 560067 265 48 Uttaranchal 545113 117275 13552 2115 12239 690294 2167 30 Uttar Pradesh 187626 100100 33772 28 8733 330259 25865 292 West Bengal 149470 76346 12721 213 27395 266144 31162 414 A & N Islands 446568 198472 111279 6215 48258 810792 101 13 Chandigarh 1471578 262208 11901 0 14612 1760298 31 10 D & N Haveli 231849 202563 6750 1287 10571 453020 44 19 Daman & Diu 325508 364991 121005 3593 63477 878574 479 20 Lakshadweep 17500 166050 0 0 15600 199150 3 2 Pondicherry 1617782 477637 49142 2259 29582 2176402 762 58 all-India 254191 145897 33137 941 16875 451042 274277 4251

Appendix A
NSS Report No. 525: Unorganised Manufacturing Sector in India, 2005-06: Employment, Assets and Borrowings. A - 101
Table 6: Market value of fixed assets per enterprise (in Rs) as on last date of reference year by type of asset for each State/UTs
Rural all enterprise type
market value (in Rs ) of fixed assets per enterprise as on date of survey owned hired
State/UT
land
and
bu
ildin
g
plan
t and
m
achi
nery
trans
port
equi
pmen
t
softw
are
and
hard
war
e
tool
s and
ot
her f
ixed
as
sets
tota
l
land
and
bu
ildin
g
plan
t an
d m
achi
nery
trans
port
equi
pmen
t so
ftwar
e an
d ha
rdw
are
tool
s and
ot
her f
ixed
as
sets
to
tal
(1) (2) (3) (4) (5) (6) (7) (8) (9) (10) (11) (12) (13) Andhra Pradesh 21030 5204 479 6 829 27548 5527 518 2 4 11 6061
Arunachal Pradesh 32709 11070 33203 55 4006 81043 71762 43472 0 0 737 115971 Assam 10610 5541 1072 22 1140 18384 1531 18 3 0 3 1555 Bihar 18564 5037 199 0 801 24602 805 1 0 0 0 807 Chhattisgarh 19643 17391 561 135 1240 38970 1803 94 0 0 0 1897 Delhi 131218 99698 37736 1142 7482 277277 233109 3319 0 0 332 236760 Goa 184573 111898 23979 3703 10559 334712 26470 224 73 0 34 26801 Gujarat 28268 8476 2560 44 1785 41134 5613 35 10 0 11 5670 Haryana 67153 32628 6050 95 4997 110923 37528 291 22 0 14 37855 Himachal Pradesh 37461 14698 945 128 2319 55551 13018 10 0 0 83 13110
Jammu & Kashmir 37762 12566 1342 17 2397 54084 9533 8 76 0 0 9618 Jharkhand 10431 1762 251 1 539 12984 350 0 0 0 0 350 Karnataka 29295 7683 1004 17 1242 39241 3531 73 2 0 1 3606 Kerala 43522 22568 3986 182 3744 74001 21528 433 75 0 19 22056 Madhya Pradesh 17291 3181 809 2 795 22078 2343 10 2 0 3 2356 Maharashtra 34115 16378 2570 78 1707 54848 10262 215 2 0 2 10481 Manipur 23768 3941 7 2 926 28644 4121 60 0 0 0 4182 Meghalaya 19304 6905 892 0 2222 29323 6572 0 0 0 6 6578 Mizoram 21077 15522 200 180 1840 38818 2652 8 0 0 1 2661 Nagaland 36343 5086 22 2 2387 43839 3400 135 0 0 1 3536 Orissa 7526 1860 630 1 575 10592 866 16 0 0 1 882 Punjab 53453 10523 2331 76 2207 68590 19565 615 3 0 1 20184 Rajasthan 30248 11047 1434 78 1957 44764 6345 267 0 0 9 6621 Sikkim 23667 12351 1441 417 1784 39661 26676 4708 0 0 0 31384 Tamil Nadu 38491 16304 3833 82 1829 60539 8456 271 2 0 21 8750 Tripura 9720 3391 397 5 1306 14819 2527 7 28 0 6 2568 Uttaranchal 46526 15209 980 84 2557 65356 30207 752 6 1 15 30981 Uttar Pradesh 20279 6580 847 2 861 28569 5221 355 0 0 3 5579 West Bengal 14014 2553 440 4 1131 18142 1819 53 1 0 4 1877 A & N Islands 45777 26034 6400 414 11380 90005 46881 86 0 0 6 46973 Chandigarh 142282 17493 999 0 5547 166321 122527 306 0 0 0 122833 D & N Haveli 16370 21958 910 88 1544 40869 36278 0 0 0 0 36278 Daman & Diu 112005 123527 40353 1262 21359 298506 22806 1845 0 0 0 24651 Lakshadweep 17490 8832 176 0 1636 28135 6666 341 0 0 0 7007 Pondicherry 225337 114735 19148 484 10522 370225 289934 539 123 0 0 290596 all-India 22718 7673 1254 31 1298 32975 5556 189 5 0 6 5757

Appendix A
NSS Report No. 525: Unorganised Manufacturing Sector in India, 2005-06: Employment, Assets and Borrowings. A - 102
Table 6: (continued) Market value of fixed assets per enterprise (in Rs) as on last date of reference
year by type of asset for each State/UTs Rural all enterprise type
market value (in Rs ) of fixed assets per enterprise as on date of survey
owned + hired number of enterprises State/UTs
land and building
plant and machinery
transport equipment
software and hardware
tools and other fixed assets total estimated sample
(1) (14) (15) (16) (17) (18) (19) (20) (21) Andhra Pradesh 26556 5723 480 10 840 33609 1085242 3876 Arunachal Pradesh 104471 54542 33203 55 4742 197014 541 76 Assam 12140 5559 1075 22 1143 19939 333006 2084 Bihar 19370 5039 199 0 801 25409 663379 2468 Chhattisgarh 21446 17484 561 135 1240 40867 172610 528 Delhi 364327 103018 37736 1142 7813 514037 3639 71 Goa 211043 112122 24052 3703 10592 361513 4546 147 Gujarat 33881 8512 2571 44 1797 46805 300753 1350 Haryana 104681 32919 6072 95 5011 148778 119687 1118 Himachal Pradesh 50479 14708 945 128 2402 68661 100437 1011 Jammu & Kashmir 47295 12574 1418 17 2397 63701 140468 1083 Jharkhand 10781 1762 251 1 539 13334 540250 975 Karnataka 32825 7756 1006 17 1243 42848 663211 1770 Kerala 65050 23002 4061 182 3763 96057 492777 2682 Madhya Pradesh 19634 3191 811 2 798 24434 564463 1641 Maharashtra 44377 16593 2572 78 1709 65329 556168 1963 Manipur 27890 4001 7 2 926 32825 35797 443 Meghalaya 25876 6905 892 0 2228 35901 34513 388 Mizoram 23729 15530 200 180 1841 41479 3291 223 Nagaland 39743 5221 22 2 2388 47375 7167 425 Orissa 8392 1876 630 1 576 11474 870877 2190 Punjab 73018 11139 2334 76 2207 88774 150208 1130 Rajasthan 36593 11314 1434 78 1966 51385 400875 2032 Sikkim 50343 17060 1441 417 1784 71045 3684 164 Tamil Nadu 46948 16575 3834 82 1850 69289 850353 3198 Tripura 12247 3398 425 5 1312 17387 38900 1067 Uttaranchal 76734 15961 986 85 2572 96337 53940 377 Uttar Pradesh 25500 6935 847 2 864 34148 1704516 3378 West Bengal 15834 2607 440 4 1135 20019 2223768 3620 A & N Islands 92658 26120 6400 414 11386 136978 1872 181 Chandigarh 264808 17799 999 0 5547 289154 753 38 D & N Haveli 52648 21958 910 88 1544 77147 797 69 Daman & Diu 134811 125372 40353 1262 21359 323158 1464 77 Lakshadweep 24156 9173 176 0 1636 35142 255 30 Pondicherry 515271 115275 19271 484 10522 660822 4058 177 all-India 28274 7862 1259 32 1305 38732 12128266 42050

Appendix A
NSS Report No. 525: Unorganised Manufacturing Sector in India, 2005-06: Employment, Assets and Borrowings. A - 103
Table 6: Market value of fixed assets per enterprise (in Rs) as on last date of reference year by type of
asset for each State/UTs Urban OAME
market value (in Rs ) of fixed assets per enterprise as on date of survey owned hired
State/UT
land
and
bu
ildin
g
plan
t and
m
achi
nery
trans
port
equi
pmen
t
softw
are
and
hard
war
e
tool
s and
ot
her f
ixed
as
sets
tota
l
land
and
bu
ildin
g
plan
t an
d m
achi
nery
trans
port
equi
pmen
t
softw
are
and
hard
war
e
tool
s and
ot
her f
ixed
as
sets
to
tal
(1) (2) (3) (4) (5) (6) (7) (8) (9) (10) (11) (12) (13) Andhra Pradesh 26242 3842 552 27 1103 31766 28966 212 1 0 3 29181
Arunachal Pradesh 22702 2108 0 0 14716 39526 26529 1132 0 0 39 27701 Assam 25691 4693 215 20 1883 32502 17906 124 0 0 18 18048 Bihar 27207 3984 133 35 1449 32808 8811 3 0 0 2 8816 Chhattisgarh 166288 6734 2714 482 2442 178659 22141 4 0 0 0 22145 Delhi 103301 8398 295 0 1750 113743 123868 7 0 0 0 123875 Goa 56442 4926 1660 0 4184 67212 68387 20 0 0 9 68416 Gujarat 40347 6154 1974 62 1925 50463 26824 104 0 0 6 26934 Haryana 151168 13574 1967 216 4726 171651 145169 132 11 0 0 145312
Himachal Pradesh 66828 10444 387 494 5237 83389 86892 139 0 0 0 87031
Jammu & Kashmir 86511 3287 181 99 2265 92343 51891 117 0 0 4 52013 Jharkhand 21933 4930 558 0 1477 28898 18416 12 0 0 4 18431 Karnataka 29291 3583 372 117 1075 34439 19055 103 0 0 0 19158 Kerala 13145 4648 548 55 1786 20182 15535 36 7 0 4 15581 Madhya Pradesh 31207 3451 346 19 925 35947 13069 73 0 0 22 13164 Maharashtra 40861 5898 818 50 1617 49244 25635 884 2 0 19 26540 Manipur 32630 4049 1 2 974 37656 760 5 0 0 0 764 Meghalaya 28910 6916 18 0 1751 37593 22776 0 0 0 0 22776 Mizoram 75727 13945 34 6 2764 92476 39112 0 0 0 5 39117 Nagaland 34747 2995 16 0 2836 40595 23907 86 0 0 1 23994 Orissa 14490 3040 483 212 1267 19492 8841 5 0 0 4 8850 Punjab 79574 8080 1162 88 2937 91841 48449 182 0 0 13 48643 Rajasthan 50522 4989 879 76 2336 58802 29593 126 0 0 5 29724 Sikkim 18787 5715 0 0 3836 28338 145009 29 0 0 0 145038 Tamil Nadu 23963 3963 944 56 1123 30050 29413 168 1 0 57 29639 Tripura 16267 4743 0 0 5512 26522 57967 0 0 0 1 57967 Uttaranchal 53162 5004 302 44 2868 61381 55565 0 0 0 0 55565 Uttar Pradesh 36101 3765 416 64 1251 41597 20502 239 1 0 18 20760 West Bengal 16195 2027 228 15 1288 19753 12934 120 0 0 11 13065 A & N Islands 8108 13188 3469 0 4240 29005 87751 0 0 0 0 87751 Chandigarh 226 19946 0 0 991 21164 33913 0 0 0 0 33913 D & N Haveli 59452 12049 22 0 1045 72568 89176 0 0 0 0 89176 Daman & Diu 21679 2785 1839 0 2224 28526 16452 0 0 0 0 16452 Lakshadweep 34359 7903 501 0 1542 44305 15743 486 0 0 38 16267 Pondicherry 68866 7424 329 0 2788 79408 43937 441 0 0 0 44378 all-India 35180 4400 702 60 1496 41839 25635 211 1 0 16 25863
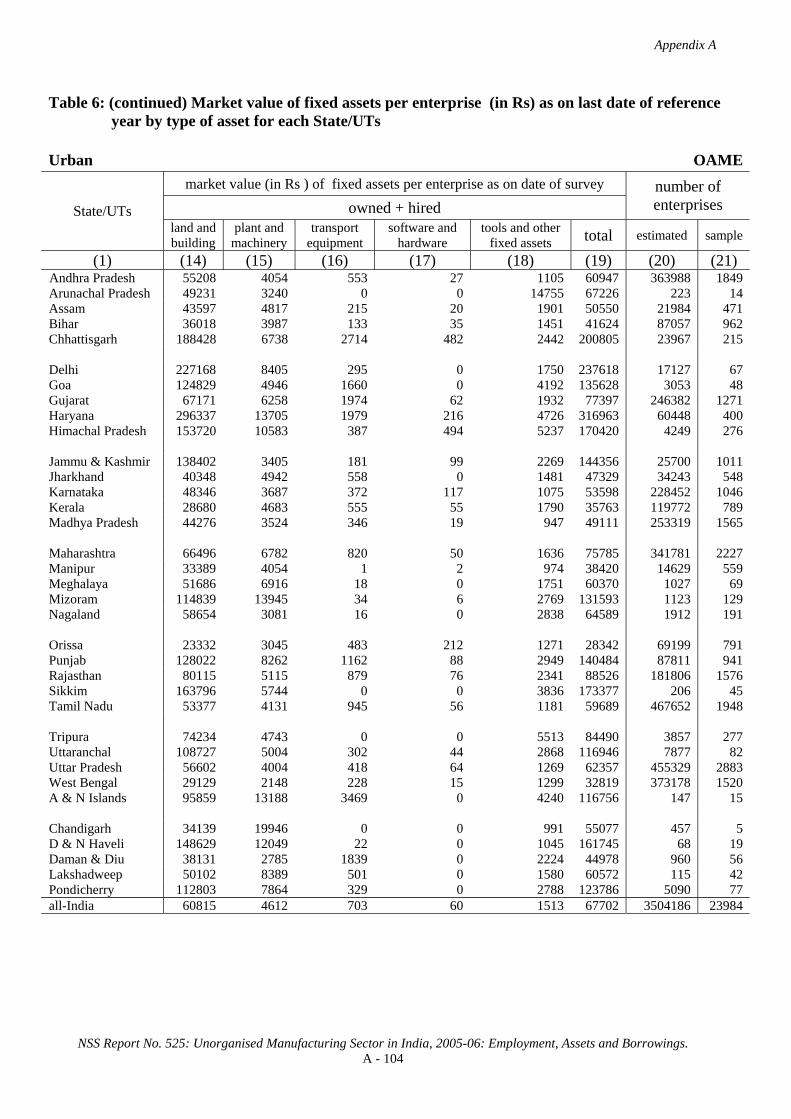
Appendix A
NSS Report No. 525: Unorganised Manufacturing Sector in India, 2005-06: Employment, Assets and Borrowings. A - 104
Table 6: (continued) Market value of fixed assets per enterprise (in Rs) as on last date of reference
year by type of asset for each State/UTs Urban OAME
market value (in Rs ) of fixed assets per enterprise as on date of survey
owned + hired number of enterprises State/UTs
land and building
plant and machinery
transport equipment
software and hardware
tools and other fixed assets total estimated sample
(1) (14) (15) (16) (17) (18) (19) (20) (21) Andhra Pradesh 55208 4054 553 27 1105 60947 363988 1849 Arunachal Pradesh 49231 3240 0 0 14755 67226 223 14 Assam 43597 4817 215 20 1901 50550 21984 471 Bihar 36018 3987 133 35 1451 41624 87057 962 Chhattisgarh 188428 6738 2714 482 2442 200805 23967 215 Delhi 227168 8405 295 0 1750 237618 17127 67 Goa 124829 4946 1660 0 4192 135628 3053 48 Gujarat 67171 6258 1974 62 1932 77397 246382 1271 Haryana 296337 13705 1979 216 4726 316963 60448 400 Himachal Pradesh 153720 10583 387 494 5237 170420 4249 276 Jammu & Kashmir 138402 3405 181 99 2269 144356 25700 1011 Jharkhand 40348 4942 558 0 1481 47329 34243 548 Karnataka 48346 3687 372 117 1075 53598 228452 1046 Kerala 28680 4683 555 55 1790 35763 119772 789 Madhya Pradesh 44276 3524 346 19 947 49111 253319 1565 Maharashtra 66496 6782 820 50 1636 75785 341781 2227 Manipur 33389 4054 1 2 974 38420 14629 559 Meghalaya 51686 6916 18 0 1751 60370 1027 69 Mizoram 114839 13945 34 6 2769 131593 1123 129 Nagaland 58654 3081 16 0 2838 64589 1912 191 Orissa 23332 3045 483 212 1271 28342 69199 791 Punjab 128022 8262 1162 88 2949 140484 87811 941 Rajasthan 80115 5115 879 76 2341 88526 181806 1576 Sikkim 163796 5744 0 0 3836 173377 206 45 Tamil Nadu 53377 4131 945 56 1181 59689 467652 1948 Tripura 74234 4743 0 0 5513 84490 3857 277 Uttaranchal 108727 5004 302 44 2868 116946 7877 82 Uttar Pradesh 56602 4004 418 64 1269 62357 455329 2883 West Bengal 29129 2148 228 15 1299 32819 373178 1520 A & N Islands 95859 13188 3469 0 4240 116756 147 15 Chandigarh 34139 19946 0 0 991 55077 457 5 D & N Haveli 148629 12049 22 0 1045 161745 68 19 Daman & Diu 38131 2785 1839 0 2224 44978 960 56 Lakshadweep 50102 8389 501 0 1580 60572 115 42 Pondicherry 112803 7864 329 0 2788 123786 5090 77 all-India 60815 4612 703 60 1513 67702 3504186 23984

Appendix A
NSS Report No. 525: Unorganised Manufacturing Sector in India, 2005-06: Employment, Assets and Borrowings. A - 105
Table 6: Market value of fixed assets per enterprise (in Rs) as on last date of reference year by type of asset for each State/UTs
Urban NDME
market value (in Rs ) of fixed assets per enterprise as on date of survey owned hired
State/UT
land
and
bu
ildin
g
plan
t and
m
achi
nery
trans
port
equi
pmen
t
softw
are
and
hard
war
e
tool
s and
ot
her f
ixed
as
sets
tota
l
land
and
bu
ildin
g
plan
t an
d m
achi
nery
trans
port
equi
pmen
t
softw
are
and
hard
war
e to
ols a
nd
othe
r fix
ed
asse
ts
to
tal
(1) (2) (3) (4) (5) (6) (7) (8) (9) (10) (11) (12) (13) Andhra Pradesh 83385 29956 4381 474 4664 122859 118937 296 0 0 13 119246
Arunachal Pradesh 9107 36226 0 0 10528 55861 86762 1339 0 0 0 88101 Assam 30021 22688 1118 1398 7488 62713 70503 479 0 0 0 70983 Bihar 50053 17405 1647 200 5321 74627 45872 528 0 0 33 46433 Chhattisgarh 277493 33152 17754 3418 7828 339645 158303 0 0 0 0 158303 Delhi 199114 38770 3870 268 5610 247633 220696 501 0 0 0 221197 Goa 166139 24926 10345 834 10221 212465 137666 285 183 0 49 138182 Gujarat 161996 52519 27379 638 10091 252623 157045 5142 0 0 130 162317 Haryana 540203 62338 12759 882 17565 633748 199188 154 127 0 10 199478
Himachal Pradesh 173170 40258 4714 2007 19415 239563 287890 11 0 0 4 287905
Jammu & Kashmir 300550 28131 5585 562 12973 347800 196835 103 0 0 44 196982 Jharkhand 76500 26059 4891 1267 6479 115196 45025 476 0 0 2 45503 Karnataka 66534 42967 9052 591 8712 127856 171106 5889 92 0 82 177170 Kerala 68154 29382 4658 1080 7231 110505 78572 288 241 0 92 79194 Madhya Pradesh 78018 19334 4312 204 5108 106976 69351 3484 0 0 431 73266 Maharashtra 224689 53958 28629 4884 7759 319919 205089 4052 0 0 79 209220 Manipur 81334 30781 1 0 4764 116880 27836 0 0 0 1313 29149 Meghalaya 28245 18673 46 102 5937 53002 88586 1323 0 0 74 89983 Mizoram 260903 47107 2340 0 6832 317181 68610 5 0 0 0 68615 Nagaland 14084 19425 0 102 3575 37185 79496 0 0 0 122 79618 Orissa 42903 22895 3536 1291 7339 77963 41092 254 0 0 188 41534 Punjab 281548 43309 9315 793 11598 346562 182460 13 0 0 5 182478 Rajasthan 110913 21772 8148 598 7099 148530 166658 917 0 0 9 167584 Sikkim 9837 17408 0 0 6939 34184 226690 0 41 0 0 226730 Tamil Nadu 81078 39688 8950 586 7892 138193 148855 734 61 0 33 149683 Tripura 78338 16133 30 615 7805 102921 67124 57 0 46 25 67252 Uttaranchal 230525 17966 854 1230 12647 263222 169019 0 0 0 0 169019 Uttar Pradesh 87357 15651 3217 140 4064 110429 107935 255 0 0 6 108196 West Bengal 59716 16438 1621 176 7684 85634 69492 400 4 0 34 69930 A & N Islands 113542 61283 19375 12708 24225 231133 141250 0 0 0 0 141250 Chandigarh 167690 27200 1076 41 3963 199971 83627 0 0 0 0 83627 D & N Haveli 92492 46825 3843 1867 2208 147235 92200 0 0 0 0 92200 Daman & Diu 42126 20252 1459 0 2769 66607 32059 0 0 0 0 32059 Lakshadweep 188333 83000 889 0 4833 277056 66778 0 0 0 0 66778 Pondicherry 108053 27367 2940 0 5050 143410 179911 0 0 0 0 179911 all-India 136367 33280 9662 1090 7471 187870 137532 1482 25 0 54 139094
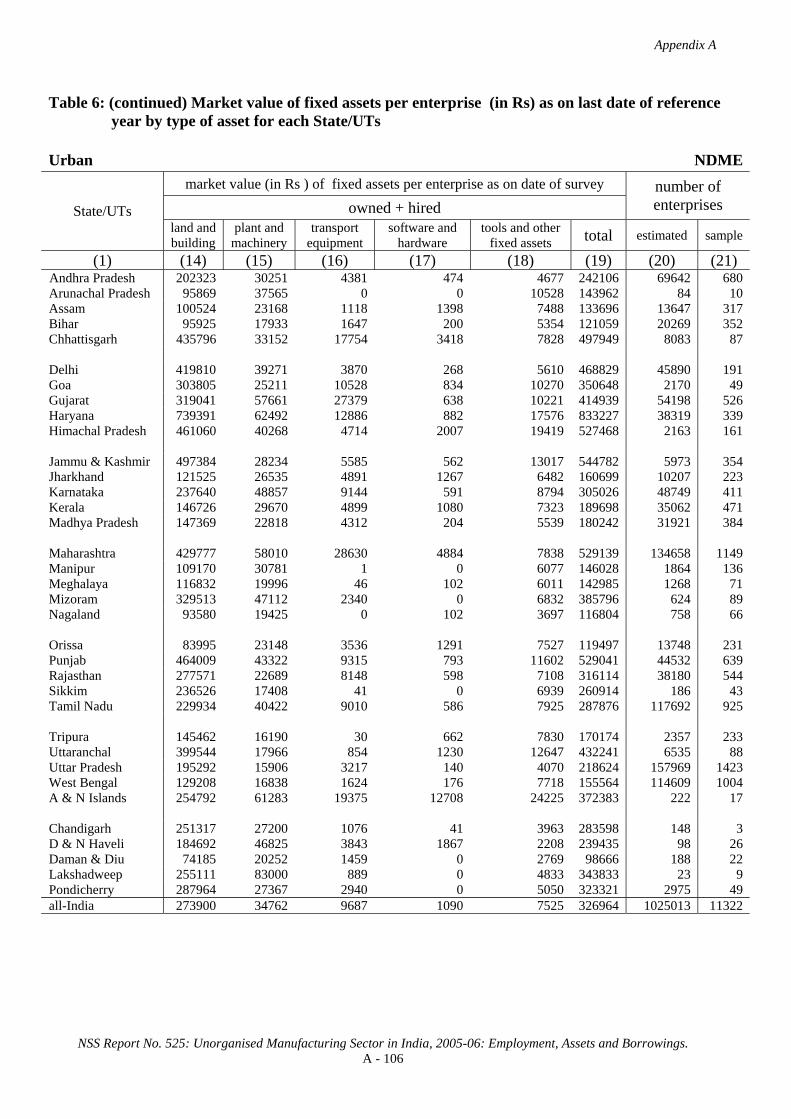
Appendix A
NSS Report No. 525: Unorganised Manufacturing Sector in India, 2005-06: Employment, Assets and Borrowings. A - 106
Table 6: (continued) Market value of fixed assets per enterprise (in Rs) as on last date of reference
year by type of asset for each State/UTs Urban NDME
market value (in Rs ) of fixed assets per enterprise as on date of survey
owned + hired number of enterprises State/UTs
land and building
plant and machinery
transport equipment
software and hardware
tools and other fixed assets total estimated sample
(1) (14) (15) (16) (17) (18) (19) (20) (21) Andhra Pradesh 202323 30251 4381 474 4677 242106 69642 680 Arunachal Pradesh 95869 37565 0 0 10528 143962 84 10 Assam 100524 23168 1118 1398 7488 133696 13647 317 Bihar 95925 17933 1647 200 5354 121059 20269 352 Chhattisgarh 435796 33152 17754 3418 7828 497949 8083 87 Delhi 419810 39271 3870 268 5610 468829 45890 191 Goa 303805 25211 10528 834 10270 350648 2170 49 Gujarat 319041 57661 27379 638 10221 414939 54198 526 Haryana 739391 62492 12886 882 17576 833227 38319 339 Himachal Pradesh 461060 40268 4714 2007 19419 527468 2163 161 Jammu & Kashmir 497384 28234 5585 562 13017 544782 5973 354 Jharkhand 121525 26535 4891 1267 6482 160699 10207 223 Karnataka 237640 48857 9144 591 8794 305026 48749 411 Kerala 146726 29670 4899 1080 7323 189698 35062 471 Madhya Pradesh 147369 22818 4312 204 5539 180242 31921 384 Maharashtra 429777 58010 28630 4884 7838 529139 134658 1149 Manipur 109170 30781 1 0 6077 146028 1864 136 Meghalaya 116832 19996 46 102 6011 142985 1268 71 Mizoram 329513 47112 2340 0 6832 385796 624 89 Nagaland 93580 19425 0 102 3697 116804 758 66 Orissa 83995 23148 3536 1291 7527 119497 13748 231 Punjab 464009 43322 9315 793 11602 529041 44532 639 Rajasthan 277571 22689 8148 598 7108 316114 38180 544 Sikkim 236526 17408 41 0 6939 260914 186 43 Tamil Nadu 229934 40422 9010 586 7925 287876 117692 925 Tripura 145462 16190 30 662 7830 170174 2357 233 Uttaranchal 399544 17966 854 1230 12647 432241 6535 88 Uttar Pradesh 195292 15906 3217 140 4070 218624 157969 1423 West Bengal 129208 16838 1624 176 7718 155564 114609 1004 A & N Islands 254792 61283 19375 12708 24225 372383 222 17 Chandigarh 251317 27200 1076 41 3963 283598 148 3 D & N Haveli 184692 46825 3843 1867 2208 239435 98 26 Daman & Diu 74185 20252 1459 0 2769 98666 188 22 Lakshadweep 255111 83000 889 0 4833 343833 23 9 Pondicherry 287964 27367 2940 0 5050 323321 2975 49 all-India 273900 34762 9687 1090 7525 326964 1025013 11322

Appendix A
NSS Report No. 525: Unorganised Manufacturing Sector in India, 2005-06: Employment, Assets and Borrowings. A - 107
Table 6: Market value of fixed assets per enterprise (in Rs) as on last date of reference year by type of asset for each State/UTs
Urban DME
market value (in Rs ) of fixed assets per enterprise as on date of survey owned hired
State/UT
land
and
bu
ildin
g
plan
t and
m
achi
nery
trans
port
equi
pmen
t
softw
are
and
hard
war
e
tool
s and
ot
her f
ixed
as
sets
tota
l
land
and
bu
ildin
g
plan
t an
d m
achi
nery
trans
port
equi
pmen
t so
ftwar
e an
d ha
rdw
are
tool
s and
ot
her f
ixed
as
sets
to
tal
(1) (2) (3) (4) (5) (6) (7) (8) (9) (10) (11) (12) (13) Andhra Pradesh 323657 166017 26979 716 13705 531074 242886 3104 961 0 2 246952
Arunachal Pradesh 818182 681818 454545 0 54545 2009091 0 0 0 0 0 0 Assam 220634 82271 6498 3584 28295 341282 86883 96244 165 0 0 183292 Bihar 137294 46544 2813 0 9379 196031 121001 0 0 0 24 121025 Chhattisgarh 348936 134668 26535 2151 15891 528180 242535 610 0 0 0 243145 Delhi 304410 118437 38262 2196 12063 475368 448658 517 0 0 15 449191 Goa 473604 132793 188654 13832 40661 849543 507199 0 0 0 0 507199 Gujarat 368526 220163 67647 7995 30879 695211 172880 1772 0 0 26 174677 Haryana 866315 260767 52124 3240 32258 1214704 382363 6605 268 0 32 389268
Himachal Pradesh 1174041 784928 110945 16740 87766 2174420 291693 9451 0 0 0 301145
Jammu & Kashmir 605158 490181 100359 4498 52864 1253060 1504774 303 0 0 0 1505077 Jharkhand 269167 80580 37200 3238 11182 401368 394337 0 5184 0 74 399595 Karnataka 649987 173877 30513 2516 20936 877828 350750 328 0 0 539 351616 Kerala 291045 416400 28740 9379 39494 785057 419880 2407 66 0 148 422502 Madhya Pradesh 372401 235863 74514 17608 34926 735312 331525 1169 153 0 0 332846 Maharashtra 232269 189623 58580 6529 20705 507705 549078 32415 470 1 931 582896 Manipur 26584 44266 0 0 9538 80388 155837 392 0 0 313 156543 Meghalaya 494209 77287 53544 583 24539 650163 111588 0 0 0 0 111588 Mizoram 1557046 451868 111824 5595 33824 2160156 30478 0 0 0 0 30478 Nagaland 127066 91530 804 0 7137 226538 127133 0 0 0 0 127133 Orissa 258556 185568 52831 5951 24126 527032 179413 16290 242 0 366 196312 Punjab 574554 197908 71226 6149 29516 879352 190586 74 19 0 31 190710 Rajasthan 488521 133365 28724 2150 39654 692415 195217 162 88 0 33 195499 Sikkim 81448 17638 0 0 25186 124271 258778 0 0 0 0 258778 Tamil Nadu 371369 187383 39107 4226 26072 628158 234647 3262 18 0 97 238025 Tripura 476549 72993 2297 637 17067 569543 58006 0 0 0 0 58006 Uttaranchal 2456193 35155 4850 368 43388 2539954 55698 0 0 0 0 55698 Uttar Pradesh 566158 106324 32234 3636 14693 723046 137238 1271 6 2 10 138527 West Bengal 199280 50058 11682 1563 20143 282727 167355 3368 130 0 83 170936 A & N Islands 36843 72439 49124 18913 68510 245828 238599 0 0 0 0 238599 Chandigarh 2581649 927056 876896 11795 663701 5061096 12333333 0 0 0 0 12333333D & N Haveli 1645865 1200824 248217 99373 1098576 4292854 0 0 0 0 0 0 Daman & Diu 0 261795 1607 0 76014 339416 239286 0 0 0 0 239286 Lakshadweep 25169 365169 74438 9831 5292 479899 505618 0 0 0 0 505618 Pondicherry 75703 14666 18224 7253 12126 127973 257100 17017 0 0 2127 276243 all-India 372654 169527 43841 4792 23247 614061 314700 9564 189 0 282 324736

Appendix A
NSS Report No. 525: Unorganised Manufacturing Sector in India, 2005-06: Employment, Assets and Borrowings. A - 108
Table 6: (continued) Market value of fixed assets per enterprise (in Rs) as on last date of reference year
by type of asset for each State/UTs Urban DME
market value (in Rs ) of fixed assets per enterprise as on date of survey owned + hired
number of enterprises State/UTs
land and building
plant and machinery
transport equipment
software and hardware
tools and other fixed assets total estimated sample
(1) (14) (15) (16) (17) (18) (19) (20) (21) Andhra Pradesh 566542 169121 27940 716 13707 778026 14366 178 Arunachal Pradesh 818182 681818 454545 0 54545 2009091 11 2 Assam 307518 178515 6663 3584 28295 524574 2143 43 Bihar 258296 46544 2813 0 9402 317056 1692 43 Chhattisgarh 591470 135278 26535 2151 15891 771325 2821 47 Delhi 753068 118955 38262 2196 12079 924559 30979 229 Goa 980803 132793 188654 13832 40661 1356742 539 17 Gujarat 541405 221935 67647 7995 30904 869888 53024 365 Haryana 1248678 267372 52392 3240 32290 1603972 11656 312 Himachal Pradesh 1465734 794379 110945 16740 87766 2475565 593 55 Jammu & Kashmir 2109932 490484 100359 4498 52864 2758137 1272 83 Jharkhand 663505 80580 42384 3238 11256 800963 1248 32 Karnataka 1000737 174205 30513 2516 21475 1229445 21349 209 Kerala 710925 418807 28806 9379 39642 1207558 11080 194 Madhya Pradesh 703926 237031 74666 17608 34926 1068159 4857 189 Maharashtra 781347 222039 59049 6530 21636 1090600 93855 1101 Manipur 182421 44658 0 0 9851 236930 228 24 Meghalaya 605797 77287 53544 583 24539 761751 179 16 Mizoram 1587524 451868 111824 5595 33824 2190634 63 12 Nagaland 254200 91530 804 0 7137 353672 68 11 Orissa 437970 201858 53074 5951 24493 723344 3406 80 Punjab 765140 197982 71245 6149 29548 1070063 10686 315 Rajasthan 683738 133527 28812 2150 39687 887914 15609 330 Sikkim 340226 17638 0 0 25186 383050 28 10 Tamil Nadu 606016 190646 39125 4226 26169 866182 46236 530 Tripura 534555 72993 2297 637 17067 627549 256 29 Uttaranchal 2511891 35155 4850 368 43388 2595652 735 13 Uttar Pradesh 703396 107596 32240 3638 14704 861574 41561 561 West Bengal 366635 53427 11812 1563 20226 453663 41238 466 A & N Islands 275441 72439 49124 18913 68510 484426 75 6 Chandigarh 14914982 927056 876896 11795 663701 17394430 15 12 D & N Haveli 1645865 1200824 248217 99373 1098576 4292854 6 5 Daman & Diu 239286 261795 1607 0 76014 578702 28 2 Lakshadweep 530787 365169 74438 9831 5292 985517 4 2 Pondicherry 332803 31683 18224 7253 14254 404217 1448 18 all-India 687354 179091 44030 4793 23529 938797 413355 5541
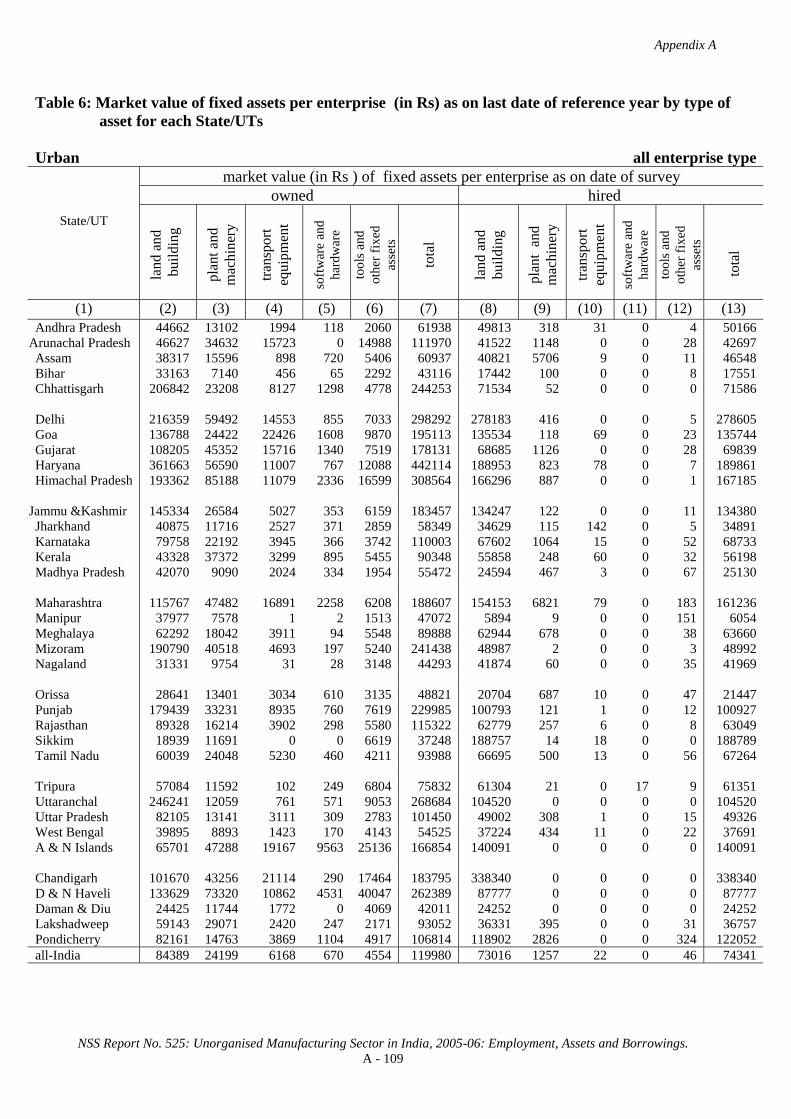
Appendix A
NSS Report No. 525: Unorganised Manufacturing Sector in India, 2005-06: Employment, Assets and Borrowings. A - 109
Table 6: Market value of fixed assets per enterprise (in Rs) as on last date of reference year by type of
asset for each State/UTs Urban all enterprise type
market value (in Rs ) of fixed assets per enterprise as on date of survey owned hired
State/UT
land
and
bu
ildin
g
plan
t and
m
achi
nery
trans
port
equi
pmen
t
softw
are
and
hard
war
e
tool
s and
ot
her f
ixed
as
sets
tota
l
land
and
bu
ildin
g
plan
t an
d m
achi
nery
trans
port
equi
pmen
t
softw
are
and
hard
war
e to
ols a
nd
othe
r fix
ed
asse
ts
to
tal
(1) (2) (3) (4) (5) (6) (7) (8) (9) (10) (11) (12) (13) Andhra Pradesh 44662 13102 1994 118 2060 61938 49813 318 31 0 4 50166
Arunachal Pradesh 46627 34632 15723 0 14988 111970 41522 1148 0 0 28 42697 Assam 38317 15596 898 720 5406 60937 40821 5706 9 0 11 46548 Bihar 33163 7140 456 65 2292 43116 17442 100 0 0 8 17551 Chhattisgarh 206842 23208 8127 1298 4778 244253 71534 52 0 0 0 71586 Delhi 216359 59492 14553 855 7033 298292 278183 416 0 0 5 278605 Goa 136788 24422 22426 1608 9870 195113 135534 118 69 0 23 135744 Gujarat 108205 45352 15716 1340 7519 178131 68685 1126 0 0 28 69839 Haryana 361663 56590 11007 767 12088 442114 188953 823 78 0 7 189861 Himachal Pradesh 193362 85188 11079 2336 16599 308564 166296 887 0 0 1 167185
Jammu &Kashmir 145334 26584 5027 353 6159 183457 134247 122 0 0 11 134380 Jharkhand 40875 11716 2527 371 2859 58349 34629 115 142 0 5 34891 Karnataka 79758 22192 3945 366 3742 110003 67602 1064 15 0 52 68733 Kerala 43328 37372 3299 895 5455 90348 55858 248 60 0 32 56198 Madhya Pradesh 42070 9090 2024 334 1954 55472 24594 467 3 0 67 25130 Maharashtra 115767 47482 16891 2258 6208 188607 154153 6821 79 0 183 161236 Manipur 37977 7578 1 2 1513 47072 5894 9 0 0 151 6054 Meghalaya 62292 18042 3911 94 5548 89888 62944 678 0 0 38 63660 Mizoram 190790 40518 4693 197 5240 241438 48987 2 0 0 3 48992 Nagaland 31331 9754 31 28 3148 44293 41874 60 0 0 35 41969 Orissa 28641 13401 3034 610 3135 48821 20704 687 10 0 47 21447 Punjab 179439 33231 8935 760 7619 229985 100793 121 1 0 12 100927 Rajasthan 89328 16214 3902 298 5580 115322 62779 257 6 0 8 63049 Sikkim 18939 11691 0 0 6619 37248 188757 14 18 0 0 188789 Tamil Nadu 60039 24048 5230 460 4211 93988 66695 500 13 0 56 67264 Tripura 57084 11592 102 249 6804 75832 61304 21 0 17 9 61351 Uttaranchal 246241 12059 761 571 9053 268684 104520 0 0 0 0 104520 Uttar Pradesh 82105 13141 3111 309 2783 101450 49002 308 1 0 15 49326 West Bengal 39895 8893 1423 170 4143 54525 37224 434 11 0 22 37691 A & N Islands 65701 47288 19167 9563 25136 166854 140091 0 0 0 0 140091 Chandigarh 101670 43256 21114 290 17464 183795 338340 0 0 0 0 338340 D & N Haveli 133629 73320 10862 4531 40047 262389 87777 0 0 0 0 87777 Daman & Diu 24425 11744 1772 0 4069 42011 24252 0 0 0 0 24252 Lakshadweep 59143 29071 2420 247 2171 93052 36331 395 0 0 31 36757 Pondicherry 82161 14763 3869 1104 4917 106814 118902 2826 0 0 324 122052 all-India 84389 24199 6168 670 4554 119980 73016 1257 22 0 46 74341

Appendix A
NSS Report No. 525: Unorganised Manufacturing Sector in India, 2005-06: Employment, Assets and Borrowings. A - 110
Table 6: (continued) Market value of fixed assets per enterprise (in Rs) as on last date of reference
year by type of asset for each State/UTs Urban all enterprise type
market value (in Rs ) of fixed assets per enterprise as on date of survey
owned + hired number of enterprises State/UTs
land and building
plant and machinery
transport equipment
software and hardware
tools and other fixed assets total estimated sample
(1) (14) (15) (16) (17) (18) (19) (20) (21) Andhra Pradesh 94475 13420 2026 118 2065 112104 447997 2707 Arunachal Pradesh 88150 35780 15723 0 15015 154668 318 26 Assam 79138 21302 907 720 5417 107484 37774 831 Bihar 50606 7240 456 65 2300 60667 109018 1357 Chhattisgarh 278376 23260 8127 1298 4778 315839 34871 349 Delhi 494542 59909 14553 855 7038 576897 93997 487 Goa 272322 24540 22495 1608 9893 330857 5762 114 Gujarat 176889 46479 15716 1340 7547 247970 353605 2162 Haryana 550616 57412 11085 767 12095 631975 110423 1051 Himachal Pradesh 359658 86075 11079 2336 16601 475748 7005 492 Jammu & Kashmir 279581 26706 5027 353 6170 317838 32944 1448 Jharkhand 75504 11832 2668 371 2865 93240 45698 803 Karnataka 147360 23256 3960 366 3794 178736 298549 1666 Kerala 99186 37619 3360 895 5487 146547 165914 1454 Madhya Pradesh 66664 9557 2026 334 2021 80602 290097 2138 Maharashtra 269920 54304 16969 2258 6392 349843 570294 4477 Manipur 43871 7587 1 2 1664 53126 16721 719 Meghalaya 125236 18720 3911 94 5586 153548 2474 156 Mizoram 239777 40520 4693 197 5243 290430 1810 230 Nagaland 73205 9814 31 28 3183 86262 2739 268 Orissa 49345 14088 3043 610 3183 70269 86352 1102 Punjab 280232 33352 8937 760 7631 330912 143029 1895 Rajasthan 152107 16471 3908 298 5588 178371 235595 2450 Sikkim 207695 11705 18 0 6619 226037 420 98 Tamil Nadu 126734 24548 5243 460 4267 161252 631580 3403 Tripura 118388 11613 102 266 6814 137183 6470 539 Uttaranchal 350761 12059 761 571 9053 373205 15146 183 Uttar Pradesh 131107 13449 3113 309 2798 150776 654859 4867 West Bengal 77119 9328 1434 170 4165 92216 529025 2990 A & N Islands 205792 47288 19167 9563 25136 306945 444 38 Chandigarh 440010 43256 21114 290 17464 522135 621 20 D & N Haveli 221406 73320 10862 4531 40047 350167 172 50 Daman & Diu 48677 11744 1772 0 4069 66263 1175 80 Lakshadweep 95474 29466 2420 247 2202 129809 142 53 Pondicherry 201064 17589 3869 1104 5241 228866 9513 144 all-India 157404 25457 6190 670 4601 194321 4942554 40847

Appendix A
NSS Report No. 525: Unorganised Manufacturing Sector in India, 2005-06: Employment, Assets and Borrowings. A - 111
Table 6: Market value of fixed assets per enterprise (in Rs) as on last date of reference year by type of asset for each State/UTs
Rural + Urban OAME
market value (in Rs ) of fixed assets per enterprise as on date of survey owned hired
State/UT
land
and
bu
ildin
g
plan
t and
m
achi
nery
trans
port
equi
pmen
t
softw
are
and
hard
war
e
tool
s and
ot
her f
ixed
as
sets
tota
l
land
and
bu
ildin
g
plan
t an
d m
achi
nery
trans
port
equi
pmen
t
softw
are
and
hard
war
e
tool
s and
ot
her f
ixed
as
sets
to
tal
(1) (2) (3) (4) (5) (6) (7) (8) (9) (10) (11) (12) (13) Andhra Pradesh 16999 2536 238 8 722 20504 8961 173 0 0 3 9138
Arunachal Pradesh 14449 3702 0 0 7716 25868 17517 1395 0 0 17 18929 Assam 9300 3916 256 20 933 14424 1888 12 0 0 1 1902 Bihar 19444 4447 172 4 838 24905 1433 1 0 0 0 1435 Chhattisgarh 31219 2797 429 60 1047 35553 3266 1 0 0 0 3267 Delhi 101398 8272 282 0 1922 111874 118944 7 0 0 0 118950 Goa 77709 13505 1182 66 2697 95158 46759 10 0 0 4 46773 Gujarat 31484 5860 1559 42 1564 40509 14414 65 6 0 10 14494 Haryana 79682 9943 1684 80 3443 94833 62112 60 4 0 0 62176
Himachal Pradesh 26489 9735 259 27 1860 38370 10191 11 0 0 84 10286
Jammu & Kashmir 39511 6636 318 27 1489 47981 11133 26 0 0 1 11160 Jharkhand 10600 1695 160 0 556 13011 1300 1 0 0 0 1301 Karnataka 21848 3451 170 38 678 26185 6484 69 0 0 1 6554 Kerala 14479 4539 384 15 1301 20719 9252 145 2 0 8 9407 Madhya Pradesh 20685 2703 218 6 683 24295 4947 30 0 0 8 4986 Maharashtra 28418 5580 641 26 1225 35890 14397 393 1 0 9 14800 Manipur 24864 3478 3 2 804 29152 1350 12 0 0 0 1363 Meghalaya 12457 3048 1 0 1485 16992 5121 0 0 0 0 5121 Mizoram 35161 14039 35 6 1870 51110 12051 5 0 0 1 12058 Nagaland 35915 4277 4 1 2373 42570 6906 129 0 0 1 7037 Orissa 6506 1030 257 16 492 8302 1249 1 0 0 1 1251 Punjab 52827 7014 1158 39 2098 63136 24920 76 2 0 5 25003 Rajasthan 33920 5980 588 26 1780 42293 12727 159 0 0 6 12892 Sikkim 9842 2711 0 0 1341 13894 17126 29 0 0 0 17155 Tamil Nadu 18415 3104 832 24 778 23153 14972 83 0 0 23 15078 Tripura 7495 1970 5 5 1228 10703 7081 1 0 0 1 7083 Uttaranchal 29022 8639 74 7 1766 39507 16703 225 0 0 0 16928 Uttar Pradesh 21171 4366 307 15 758 26617 6470 219 0 0 6 6696 West Bengal 11109 977 167 3 610 12865 2472 53 0 0 4 2530 A & N Islands 27548 8724 366 0 2418 39055 20334 112 0 0 8 20454 Chandigarh 44494 10947 72 0 1130 56643 59776 225 0 0 0 60001 D & N Haveli 16955 3686 268 0 509 21418 15309 0 0 0 0 15309 Daman & Diu 15925 2206 1189 0 1291 20611 22770 0 0 0 0 22770 Lakshadweep 19004 5229 295 0 1078 25608 10303 181 0 0 14 10498 Pondicherry 76256 6610 300 0 2136 85303 34335 322 0 0 0 34657 all-India 19915 3419 395 17 900 24646 7973 107 1 0 6 8088

Appendix A
NSS Report No. 525: Unorganised Manufacturing Sector in India, 2005-06: Employment, Assets and Borrowings. A - 112
Table 6: (continued) Market value of fixed assets per enterprise (in Rs) as on last date of reference
year by type of asset for each State/UTs Rural + Urban OAME
market value (in Rs ) of fixed assets per enterprise as on date of survey
owned + hired number of enterprises State/UTs
land and building
plant and machinery
transport equipment
software and hardware
tools and other fixed assets total estimated sample
(1) (14) (15) (16) (17) (18) (19) (20) (21) Andhra Pradesh 25961 2710 238 8 725 29642 1362802 4808 Arunachal Pradesh 31966 5098 0 0 7733 44797 527 50 Assam 11188 3928 256 20 934 16326 328142 2251 Bihar 20878 4448 172 4 838 26340 726369 3157 Chhattisgarh 34485 2798 429 60 1047 38819 193695 607 Delhi 220341 8279 282 0 1922 230824 17894 83 Goa 124467 13515 1182 66 2701 141931 6252 118 Gujarat 45898 5925 1565 42 1573 55003 522534 2314 Haryana 141794 10003 1688 80 3443 157009 162561 1037 Himachal Pradesh 36680 9746 259 27 1944 48656 97149 1008 Jammu & Kashmir 50644 6662 318 27 1490 59141 158583 1889 Jharkhand 11900 1696 160 0 556 14312 556927 1411 Karnataka 28332 3520 170 38 679 32739 808576 2470 Kerala 23731 4684 386 15 1309 30126 494680 2442 Madhya Pradesh 25632 2734 218 6 691 29281 795133 2893 Maharashtra 42815 5973 642 26 1234 50691 841187 3814 Manipur 26215 3491 3 2 804 30515 49017 947 Meghalaya 17578 3048 1 0 1486 22113 27830 318 Mizoram 47212 14044 35 6 1871 63168 4201 310 Nagaland 42822 4406 4 1 2374 49607 8754 585 Orissa 7755 1031 257 16 493 9552 913061 2708 Punjab 77747 7090 1160 39 2103 88139 223239 1843 Rajasthan 46647 6139 588 26 1786 55186 553000 2826 Sikkim 26968 2740 0 0 1341 31049 3466 180 Tamil Nadu 33388 3187 832 24 801 38231 1188088 3844 Tripura 14576 1971 5 5 1229 17786 37093 949 Uttaranchal 45724 8864 74 7 1766 56435 52280 335 Uttar Pradesh 27642 4585 308 15 764 33313 2033045 5424 West Bengal 13581 1030 167 3 614 15395 2434547 3943 A & N Islands 47882 8836 366 0 2426 59510 1429 123 Chandigarh 104270 11172 72 0 1130 116644 1024 20 D & N Haveli 32264 3686 268 0 509 36727 574 38 Daman & Diu 38694 2206 1189 0 1291 43381 1812 93 Lakshadweep 29308 5410 295 0 1092 36106 320 62 Pondicherry 110591 6932 300 0 2136 119960 7116 145 all-India 27888 3527 395 17 906 32733 14612907 55045

Appendix A
NSS Report No. 525: Unorganised Manufacturing Sector in India, 2005-06: Employment, Assets and Borrowings. A - 113
Table 6: Market value of fixed assets per enterprise (in Rs) as on last date of reference year by type of asset for each State/UTs
Rural + Urban NDME
market value (in Rs ) of fixed assets per enterprise as on date of survey owned hired
State/UT
land
and
bu
ildin
g
plan
t and
m
achi
nery
trans
port
equi
pmen
t
softw
are
and
hard
war
e
tool
s and
ot
her f
ixed
as
sets
tota
l
land
and
bu
ildin
g
plan
t an
d m
achi
nery
trans
port
equi
pmen
t so
ftwar
e an
d ha
rdw
are
tool
s and
ot
her f
ixed
as
sets
to
tal
(1) (2) (3) (4) (5) (6) (7) (8) (9) (10) (11) (12) (13) Andhra Pradesh 86236 35950 3688 334 4243 130450 105363 1588 5 35 27 107018
Arunachal Pradesh 21844 18298 64 97 4722 45025 38094 435 0 0 1285 39814 Assam 29075 17408 946 529 4717 52675 30646 262 0 0 19 30927 Bihar 34545 17182 981 93 3311 56112 27010 246 0 0 16 27272 Chhattisgarh 255582 45781 16782 2868 8756 329769 133406 2 0 0 0 133408 Delhi 194104 38087 3843 258 5550 241842 218481 482 0 0 0 218964 Goa 168971 33797 12120 1558 8632 225078 101152 535 238 0 85 102010 Gujarat 138219 45009 22974 507 8668 215378 129239 4054 0 0 102 133396 Haryana 426828 71173 11698 653 15236 525588 177539 123 108 0 40 177810
Himachal Pradesh 128065 32884 2240 1353 10099 174641 125091 62 0 0 6 125159
Jammu & Kashmir 197353 43430 6578 302 9883 257546 102021 50 0 0 21 102092 Jharkhand 45159 13323 3421 482 3526 65911 20471 181 0 0 1 20653 Karnataka 86266 41211 8169 394 7302 143341 117046 3692 55 0 51 120844 Kerala 65064 30805 4144 475 6497 106986 68867 877 340 0 53 70137 Madhya Pradesh 59602 15897 3539 145 4304 83487 62170 2468 2 0 305 64944 Maharashtra 192355 50921 24227 3767 7109 278380 168402 3149 0 0 61 171613 Manipur 63452 26505 1 0 5103 95061 43249 503 0 0 776 44528 Meghalaya 36490 10699 130 16 3740 51077 25378 214 0 0 38 25630 Mizoram 203907 42466 2451 0 6486 255311 54689 9 0 0 3 54702 Nagaland 20920 18043 0 72 3980 43014 64080 0 0 0 86 64166 Orissa 40420 20016 5607 489 4393 70925 19669 294 0 0 69 20032 Punjab 259162 41754 8346 726 10527 320515 162000 478 0 0 5 162483 Rajasthan 90602 20709 6434 714 5716 124174 113814 791 0 0 15 114620 Sikkim 91347 24193 0 0 5009 120549 142365 0 13 0 0 142378 Tamil Nadu 94285 36759 7701 387 5995 145127 91959 668 35 0 84 92746 Tripura 37573 9492 12 187 5069 52333 24319 42 0 14 31 24406 Uttaranchal 163279 21586 2004 578 8999 196446 126869 0 0 0 0 126869 Uttar Pradesh 72341 16171 2487 90 3528 94617 78442 228 0 0 6 78676 West Bengal 54003 14520 1820 82 6256 76681 40230 294 2 0 25 40550 A & N Islands 64293 44634 7027 4177 26699 146830 119339 0 0 0 0 119339 Chandigarh 191578 22926 1542 20 11903 227970 137187 0 0 0 0 137187 D & N Haveli 38457 34455 1888 567 2207 77573 81646 0 0 0 0 81646 Daman & Diu 31329 30263 2958 389 3594 68532 36485 4189 0 0 0 40674 Lakshadweep 93330 42116 406 0 4438 140290 24776 0 0 0 0 24776 Pondicherry 107897 40897 11548 57 8047 168446 245815 504 0 0 0 246319 all-India 107875 30297 7194 681 6149 152196 95212 1107 37 2 46 96405

Appendix A
NSS Report No. 525: Unorganised Manufacturing Sector in India, 2005-06: Employment, Assets and Borrowings. A - 114
Table 6: (continued) Market value of fixed assets per enterprise (in Rs) as on last date of reference
year by type of asset for each State/UTs Rural + Urban NDME
market value (in Rs ) of fixed assets per enterprise as on date of survey
owned + hired number of enterprises State/UTs
land and building
plant and machinery
transport equipment
software and hardware
tools and other fixed assets total estimated sample
(1) (14) (15) (16) (17) (18) (19) (20) (21) Andhra Pradesh 191598 37538 3694 368 4270 237468 114958 1203 Arunachal Pradesh 59937 18733 64 97 6008 84839 310 47 Assam 59721 17670 946 529 4736 83601 38228 590 Bihar 61555 17429 981 93 3327 83385 43407 572 Chhattisgarh 388988 45782 16782 2868 8756 463177 9632 141 Delhi 412585 38570 3843 258 5550 460806 47700 219 Goa 270123 34332 12358 1558 8716 327088 3059 81 Gujarat 267458 49064 22974 507 8771 348773 68736 660 Haryana 604367 71296 11806 653 15276 703398 52586 545 Himachal Pradesh 253156 32945 2240 1353 10105 299800 8927 322 Jammu & Kashmir 299374 43480 6578 302 9904 359638 12474 511 Jharkhand 65630 13504 3421 482 3527 86564 26829 313 Karnataka 203311 44903 8225 394 7353 264185 81071 603 Kerala 133932 31682 4484 475 6550 177123 133741 1298 Madhya Pradesh 121772 18365 3540 145 4609 148431 45067 482 Maharashtra 360758 54071 24227 3767 7171 449993 174625 1341 Manipur 106701 27008 1 0 5879 139589 3152 181 Meghalaya 61868 10913 130 16 3778 76706 7847 177 Mizoram 258596 42476 2451 0 6489 310013 820 128 Nagaland 84999 18043 0 72 4066 107180 1078 94 Orissa 60089 20310 5607 489 4462 90958 37330 397 Punjab 421161 42232 8346 726 10532 482998 58142 811 Rajasthan 204416 21500 6434 714 5731 238795 61608 839 Sikkim 233712 24193 13 0 5009 262927 583 64 Tamil Nadu 186244 37427 7736 387 6079 237873 205965 1615 Tripura 61892 9534 12 201 5100 76739 7756 580 Uttaranchal 290148 21586 2004 578 8999 323315 13906 182 Uttar Pradesh 150783 16399 2487 90 3534 173293 258904 1968 West Bengal 94232 14814 1821 82 6281 117231 245846 1787 A & N Islands 183632 44634 7027 4177 26699 266169 710 77 Chandigarh 328765 22926 1542 20 11903 365157 303 16 D & N Haveli 120103 34455 1888 567 2207 159219 345 57 Daman & Diu 67813 34452 2958 389 3594 109206 320 42 Lakshadweep 118106 42116 406 0 4438 165066 71 17 Pondicherry 353712 41402 11548 57 8047 414766 4245 100 all-India 203087 31404 7230 684 6196 248601 1770282 18060

Appendix A
NSS Report No. 525: Unorganised Manufacturing Sector in India, 2005-06: Employment, Assets and Borrowings. A - 115
Table 6: Market value of fixed assets per enterprise (in Rs) as on last date of reference year by type of
asset for each State/UTs Rural + Urban DME
market value (in Rs ) of fixed assets per enterprise as on date of survey owned hired
State/UT
land
and
bu
ildin
g
plan
t and
m
achi
nery
trans
port
equi
pmen
t
softw
are
and
hard
war
e
tool
s and
ot
her f
ixed
as
sets
tota
l
land
and
bu
ildin
g
plan
t an
d m
achi
nery
trans
port
equi
pmen
t so
ftwar
e an
d ha
rdw
are
tool
s and
ot
her f
ixed
as
sets
to
tal
(1) (2) (3) (4) (5) (6) (7) (8) (9) (10) (11) (12) (13) Andhra Pradesh 175749 70807 11971 204 6329 265059 71900 5154 274 0 110 77438
Arunachal Pradesh 829900 429017 1050133 0 64124 2373174 1418097 1053443 0 0 0 2471540Assam 185260 109677 61397 1741 22087 380162 59060 47067 284 0 41 106452 Bihar 117263 55102 5394 0 11046 188805 84836 0 0 0 15 84851 Chhattisgarh 504308 681021 32628 7060 22542 1247558 213830 4296 0 0 0 218126 Delhi 304024 124529 41101 2253 12147 484055 450875 877 0 0 53 451805 Goa 626607 463133 194414 20996 61813 1366963 300531 0 0 0 0 300531 Gujarat 329875 197032 62347 6820 28258 624332 151541 1528 0 0 22 153091 Haryana 840401 320455 70215 3252 38222 1272545 395867 7319 325 0 25 403536
Himachal Pradesh 1024475 609871 93173 10560 57310 1795389 267511 4103 0 0 86 271700
Jammu & Kashmir 579505 444516 94107 2499 76516 1197141 1156546 164 4545 0 0 1161255Jharkhand 177175 84829 32051 1932 7980 303968 227276 0 2952 0 42 230270 Karnataka 257665 77510 14474 805 11104 361558 108052 148 17 0 159 108377 Kerala 421889 361950 58377 5515 40875 888605 201152 2160 24 0 117 203453 Madhya Pradesh 197189 109087 49514 6014 19426 381229 119876 397 84 0 35 120392 Maharashtra 248536 204265 56866 5883 20044 535595 470871 28281 405 1 790 500347 Manipur 192272 39390 272 0 8446 240380 124901 354 0 0 205 125461 Meghalaya 143008 87167 30074 80 15059 275389 31217 0 0 0 0 31217 Mizoram 1246314 382494 87357 11524 29555 1757243 24081 0 0 0 0 24081 Nagaland 125320 84290 2817 0 9032 221459 127996 0 0 0 0 127996 Orissa 230734 159367 53541 2971 23147 469760 97602 8922 121 0 182 106827 Punjab 576328 197391 74588 5846 28739 882893 200153 5484 17 0 28 205681 Rajasthan 403961 167663 35352 1965 34890 643830 150213 1420 63 0 42 151737 Sikkim 143287 498748 98435 28520 32989 801979 650407 319906 0 0 0 970314 Tamil Nadu 334005 202480 45375 2866 23391 608117 143210 3530 28 0 99 146866 Tripura 341751 115632 30384 313 19138 507217 83803 77 2112 0 19 86011 Uttaranchal 844862 86576 11239 1648 19850 964176 198200 9908 110 25 275 208518 Uttar Pradesh 393936 100238 32824 2252 12399 541648 111606 4483 4 1 15 116108 West Bengal 165024 61269 12120 982 23254 262648 108140 2022 84 0 58 110304 A & N Islands 168918 144745 84783 11628 56891 466964 204700 0 0 0 0 204700 Chandigarh 1450292 475933 289965 3792 223270 2443251 4342851 0 0 0 0 4342851D & N Haveli 260712 322643 35796 13086 141446 773682 141227 0 0 0 0 141227 Daman & Diu 303091 356616 114417 3395 64168 841688 17659 2681 0 0 0 20341 Lakshadweep 21668 261240 40458 5344 9998 338707 274809 13033 0 0 0 287842 Pondicherry 314601 174356 28662 5531 18147 541297 461422 11147 226 0 1393 474188 all-India 306327 158618 39540 3256 20681 528423 208251 7233 145 0 194 215823

Appendix A
NSS Report No. 525: Unorganised Manufacturing Sector in India, 2005-06: Employment, Assets and Borrowings. A - 116
Table 6: (continued) Market value of fixed assets per enterprise (in Rs) as on last date of reference
year by type of asset for each State/UTs Rural + Urban DME
market value (in Rs ) of fixed assets per enterprise as on date of survey owned + hired
number of enterprises State/UTs
land and building
plant and machinery
transport equipment
software and hardware
tools and other fixed assets total estimated sample
(1) (14) (15) (16) (17) (18) (19) (20) (21) Andhra Pradesh 247649 75961 12245 204 6439 342497 55479 572 Arunachal Pradesh 2247996 1482460 1050133 0 64124 4844714 22 5 Assam 244320 156744 61681 1741 22128 486614 4411 74 Bihar 202099 55102 5394 0 11061 273656 2621 96 Chhattisgarh 718138 685318 32628 7060 22542 1465685 4153 129 Delhi 754899 125406 41101 2253 12200 935860 32041 256 Goa 927138 463133 194414 20996 61813 1667495 997 62 Gujarat 481416 198560 62347 6820 28279 777423 63088 538 Haryana 1236268 327774 70540 3252 38247 1676081 14963 587 Himachal Pradesh 1291986 613974 93173 10560 57397 2067090 1367 173 Jammu & Kashmir 1736051 444679 98652 2499 76516 2358396 2355 131 Jharkhand 404451 84829 35003 1932 8022 534237 2192 54 Karnataka 365717 77658 14491 805 11264 469935 72113 363 Kerala 623040 364110 58401 5515 40991 1092058 30271 396 Madhya Pradesh 317065 109484 49598 6014 19461 501622 14359 404 Maharashtra 719407 232546 57271 5884 20834 1035942 110650 1285 Manipur 317173 39745 272 0 8651 365841 349 34 Meghalaya 174226 87167 30074 80 15059 306606 1310 49 Mizoram 1270395 382494 87357 11524 29555 1781325 80 15 Nagaland 253316 84290 2817 0 9032 349455 75 14 Orissa 328336 168289 53662 2971 23330 576587 6838 187 Punjab 776481 202875 74605 5846 28768 1088574 11856 371 Rajasthan 554173 169083 35414 1965 34932 795567 21862 817 Sikkim 793695 818654 98435 28520 32989 1772293 54 18 Tamil Nadu 477215 206010 45403 2866 23490 754983 87880 1142 Tripura 425554 115709 32496 313 19157 593228 521 77 Uttaranchal 1043063 96484 11349 1673 20125 1172693 2902 43 Uttar Pradesh 505542 104721 32827 2253 12413 657757 67426 853 West Bengal 273164 63291 12203 982 23312 372952 72400 880 A & N Islands 373617 144745 84783 11628 56891 671664 177 19 Chandigarh 5793142 475933 289965 3792 223270 6786102 46 22 D & N Haveli 401939 322643 35796 13086 141446 914908 50 24 Daman & Diu 320750 359298 114417 3395 64168 862028 507 22 Lakshadweep 296477 274273 40458 5344 9998 626549 7 4 Pondicherry 776023 185503 28888 5531 19541 1015486 2210 76 all-India 514578 165851 39685 3256 20875 744245 687632 9792

Appendix A
NSS Report No. 525: Unorganised Manufacturing Sector in India, 2005-06: Employment, Assets and Borrowings. A - 117
Table 6: Market value of fixed assets per enterprise (in Rs) as on last date of reference year by type of asset for each State/UTs
Rural + Urban all enterprise type
market value (in Rs ) of fixed assets per enterprise as on date of survey owned hired
State/UT
land
and
bu
ildin
g
plan
t and
m
achi
nery
trans
port
equi
pmen
t
softw
are
and
hard
war
e
tool
s and
ot
her f
ixed
as
sets
tota
l
land
and
bu
ildin
g
plan
t an
d m
achi
nery
trans
port
equi
pmen
t
softw
are
and
hard
war
e to
ols a
nd
othe
r fix
ed
asse
ts
to
tal
(1) (2) (3) (4) (5) (6) (7) (8) (9) (10) (11) (12) (13) Andhra Pradesh 27935 7512 921 39 1189 37596 18467 460 10 3 9 18948
Arunachal Pradesh 37860 19790 26734 35 8070 92489 60570 27808 0 0 474 88853 Assam 13432 6565 1054 93 1574 22719 5534 598 4 0 4 6139 Bihar 20625 5334 235 9 1012 27215 3154 15 0 0 1 3170 Chhattisgarh 51105 18369 1833 331 1835 73472 13523 87 0 0 0 13609 Delhi 213185 60991 15417 865 7050 297509 276503 525 0 0 17 277045 Goa 157861 62999 23111 2532 10174 256677 87436 165 71 0 28 87699 Gujarat 71464 28404 9669 744 4884 115165 39696 625 5 0 20 40346 Haryana 208479 44127 8429 417 8400 269852 110193 546 49 0 11 110798
Himachal Pradesh 47625 19294 1606 272 3250 72047 23011 67 0 0 77 23156
Jammu & Kashmir 58198 15229 2042 81 3111 78662 33226 29 62 0 2 33320 Jharkhand 12806 2539 429 29 720 16522 3023 9 11 0 0 3044 Karnataka 44959 12187 1917 126 2019 61207 23420 381 6 0 17 23823 Kerala 43473 26297 3813 361 4175 78119 30175 387 71 0 22 30656 Madhya Pradesh 25703 5187 1221 114 1189 33414 9896 165 2 0 24 10087 Maharashtra 75453 32125 9820 1181 3986 122566 83110 3559 41 0 94 86804 Manipur 28292 5099 5 2 1113 34511 4686 44 0 0 48 4778 Meghalaya 22179 7650 1094 7 2445 33374 10343 45 0 0 8 10397 Mizoram 81291 24391 1794 186 3046 110708 19092 6 0 0 2 19099 Nagaland 34957 6377 24 9 2598 43965 14037 114 0 0 10 14162 Orissa 9431 2901 847 56 806 14040 2656 76 1 0 5 2737 Punjab 114904 21599 5552 410 4847 147312 59185 374 2 0 6 59567 Rajasthan 52117 12960 2348 159 3298 70882 27235 263 2 0 8 27508 Sikkim 23183 12284 1294 375 2279 39414 43253 4228 2 0 0 47483 Tamil Nadu 47675 19605 4428 243 2844 74794 33277 369 7 0 36 33688 Tripura 16474 4560 355 40 2090 23519 10909 9 24 2 6 10951 Uttaranchal 90311 14518 932 191 3981 109933 46500 587 5 1 12 47104 Uttar Pradesh 37439 8401 1476 88 1394 48798 17373 342 0 0 6 17721 West Bengal 18988 3772 629 36 1710 25134 8623 127 2 0 7 8760 A & N Islands 49596 30108 8847 2167 14017 104737 64749 69 0 0 5 64823 Chandigarh 123928 29136 10090 131 10933 174218 220058 168 0 0 0 220226 D & N Haveli 37163 31065 2674 876 8371 80150 45410 0 0 0 0 45410 Daman & Diu 73012 73758 23176 700 13661 184307 23450 1024 0 0 0 24474 Lakshadweep 32362 16058 977 88 1827 51312 17257 360 0 0 11 17629 Pondicherry 124972 44656 8438 919 6593 185577 170043 2142 37 0 227 172449 all-India 40573 12458 2677 216 2241 58166 25088 498 10 0 18 25614

Appendix A
NSS Report No. 525: Unorganised Manufacturing Sector in India, 2005-06: Employment, Assets and Borrowings. A - 118
Table 6: (continued) Market value of fixed assets per enterprise (in Rs) as on last date of reference
year by type of asset for each State/UTs Rural + Urban all enterprise type
market value (in Rs ) of fixed assets per enterprise as on date of survey
owned + hired number of enterprises State/UTs
land and building
plant and machinery
transport equipment
software and hardware
tools and other fixed assets total estimated sample
(1) (14) (15) (16) (17) (18) (19) (20) (21) Andhra Pradesh 46401 7972 932 42 1198 56544 1533239 6583 Arunachal Pradesh 98431 47598 26734 35 8544 181342 859 102 Assam 18966 7163 1058 93 1578 28858 370781 2915 Bihar 23778 5349 235 9 1013 30385 772397 3825 Chhattisgarh 64627 18455 1833 331 1835 87081 207481 877 Delhi 489689 61515 15417 865 7067 574554 97636 558 Goa 245298 63164 23181 2532 10201 344376 10308 261 Gujarat 111160 29028 9674 744 4904 155511 654358 3512 Haryana 318672 44673 8478 417 8411 380650 230110 2169 Himachal Pradesh 70637 19361 1606 272 3327 95203 107442 1503 Jammu & Kashmir 91424 15259 2104 81 3114 111981 173412 2531 Jharkhand 15829 2548 440 29 720 19566 585948 1778 Karnataka 68379 12567 1923 126 2035 85030 961761 3436 Kerala 73648 26684 3884 361 4197 108775 658692 4136 Madhya Pradesh 35599 5352 1223 114 1213 43501 854559 3779 Maharashtra 158563 35685 9861 1182 4080 209370 1126462 6440 Manipur 32978 5143 5 2 1161 39289 52518 1162 Meghalaya 32522 7695 1094 7 2453 43771 36987 544 Mizoram 100383 24397 1794 186 3048 129807 5101 453 Nagaland 48994 6491 24 9 2608 58126 9906 693 Orissa 12086 2977 847 56 811 16778 957229 3292 Punjab 174089 21974 5554 410 4853 206879 293237 3025 Rajasthan 79352 13223 2350 159 3306 98390 636470 4482 Sikkim 66437 16512 1295 375 2279 86897 4103 262 Tamil Nadu 80952 19973 4435 243 2880 108482 1481933 6601 Tripura 27383 4570 379 42 2097 34470 45370 1606 Uttaranchal 136811 15105 936 192 3993 157037 69087 560 Uttar Pradesh 54812 8743 1476 88 1400 66519 2359375 8245 West Bengal 27611 3898 631 36 1717 33894 2752793 6610 A & N Islands 114345 30178 8847 2167 14022 169560 2316 219 Chandigarh 343987 29304 10090 131 10933 394444 1373 58 D & N Haveli 82573 31065 2674 876 8371 125559 969 119 Daman & Diu 96462 74782 23176 700 13661 208781 2639 157 Lakshadweep 49619 16419 977 88 1838 68941 397 83 Pondicherry 295015 46798 8475 919 6820 358026 13572 321 all-India 65661 12956 2687 216 2259 83780 17070820 82897

Appendix A
NSS Report No. 525: Unorganised Manufacturing Sector in India, 2005-06: Employment, Assets and Borrowings. A - 119
Table 7: Net additions to owned fixed assets per enterprise (in Rs.) during the reference year and annual rent payable per enterprise (in Rs.) by type of asset for each industry
Rural OAME all-India net additions (Rs.) to owned fixed assets per enterprise during the reference
year annual rent payable (Rs.) on fixed assets per enterprise no. of enterprises industry (NIC 2004) land &
building plant and
machinery transport
equipment
software&
hardware
tools and other fixed
assets total Land &
building plant and
machinery transport
equipment
software &
hardware
tools and other fixed
assets total estimated sample
(1) (2) (3) (4) (5) (6) (7) (8) (9) (10) (11) (12) (13) (14) (15) 01405 1778 234 52 0 44 2107 266 78 0 0 0 344 6063 39
15 308 773 45 0 115 1254 123 23 0 0 2 148 1777603 6309 16 1 0 0 0 6 8 4 0 0 0 0 4 2336177 1594 17 86 37 1 0 28 152 32 57 0 0 3 92 1589000 2970 18 127 111 2 0 27 268 285 8 0 0 0 293 1815185 7508
19 0 0 0 0 11 12 341 0 0 0 0 341 32729 160 20 14 49 11 0 29 103 41 1 0 0 1 43 1836581 4965 21 11 0 0 0 1 13 193 0 0 0 0 193 102294 122 22 388 1196 0 257 76 1918 2298 67 0 0 28 2394 9750 114 23 0 0 0 0 47 47 0 0 0 0 0 0 2455 29
24 0 0 0 0 10 10 90 0 0 0 0 90 279805 360 25 242 903 0 0 24 1169 79 0 0 0 0 79 15074 81 26 62 18 15 0 49 145 210 14 0 0 0 224 458791 2011 27 20 0 38 0 468 526 1186 1 0 0 0 1188 9608 64 28 40 36 33 0 32 141 197 12 0 0 9 218 302545 1578
29 149 328 18 0 144 639 416 71 0 0 0 487 58709 380 30 0 0 0 0 0 0 0 0 0 0 0 0 57 1 31 442 556 263 0 290 1551 2253 3 0 0 0 2257 43847 301 32 0 0 0 0 37 37 16 0 0 0 0 16 1379 9 33 0 297 0 0 68 365 2967 0 0 0 0 2967 110 4
34 0 3767 0 0 1049 4816 3095 1073 0 0 0 4168 651 11 35 28 4 0 0 94 125 593 0 0 0 0 593 4482 28 36 49 108 17 0 132 306 440 13 1 0 0 454 425621 2422 37 0 0 0 0 0 0 0 0 0 0 0 0 205 1 all 95 168 13 0 44 322 129 15 0 0 1 146 11108720 31061

Appendix A
NSS Report No. 525: Unorganised Manufacturing Sector in India, 2005-06: Employment, Assets and Borrowings. A - 120
Table 7: Net additions to owned fixed assets per enterprise (in Rs.) during the reference year and annual rent payable per enterprise (in Rs.) by type of asset for each industry
Rural NDME all-India net additions (Rs.) to owned fixed assets per enterprise during the
reference year annual rent payable (Rs.) on fixed assets per enterprise no. of enterprises industry (NIC 2004) land &
building plant and
machinery transport
equipment
Software&
hardware
tools and other fixed
assets total Land &
building plant and
machinery transport
equipment
software &
hardware
tools and other fixed
assets total estimated sample
(1) (2) (3) (4) (5) (6) (7) (8) (9) (10) (11) (12) (13) (14) (15) 01405 0 1743 0 0 0 1743 13 0 0 0 0 13 233 5
15 1348 1958 273 6 459 4044 914 168 2 0 128 1212 185605 1576 16 0 0 0 0 4 4 648 0 0 0 0 648 5199 50 17 296 339 209 1 71 917 504 40 0 0 7 550 129161 547 18 794 737 11 0 176 1716 3249 25 0 0 0 3275 124596 1110
19 72 370 0 0 275 717 1541 0 0 0 0 1541 3164 34 20 60 1008 226 0 228 1522 1218 171 0 0 28 1417 70010 674 21 15 1022 164 0 89 1291 754 0 0 0 0 754 1736 15 22 365 670 13 1841 1003 3891 5256 0 0 0 159 5415 5897 84 23 2587 171 80 0 20 2857 721 0 0 0 0 721 1756 15
24 1007 454 31 0 274 1766 1019 16 1 0 0 1036 3943 89 25 28210 64274 224 0 1620 94328 5117 27 0 0 0 5145 7104 89 26 1124 1369 852 0 312 4143 4499 90 0 0 0 4589 32220 366 27 0 75 0 0 1122 1197 3787 1095 0 0 33 4915 2598 46 28 193 2929 1625 0 337 5084 3590 30 0 0 6 3627 62155 685
29 5759 5643 44 0 256 11702 3861 65 0 1 0 3927 8017 139 30 - - - - - - - - - - - - - 0 31 30 282 314 0 376 1002 3809 0 0 0 73 3882 7903 110 32 0 0 0 0 348 348 2728 0 0 0 0 2728 252 2 33 307817 60626 0 0 9095 377538 0 0 0 0 0 0 1153 3
34 0 3867 2 0 5 3874 7589 390 0 0 0 7979 1319 30 35 381 5147 1527 0 52 7107 6625 0 0 0 0 6625 1062 33 36 745 673 174 1 276 1869 1595 12 0 0 1 1608 89891 1028 37 19092 4737 158 0 389 24376 6603 0 0 0 0 6603 293 8 all 1510 1948 330 16 304 4129 1891 82 0 0 39 2012 745269 6738

Appendix A
NSS Report No. 525: Unorganised Manufacturing Sector in India, 2005-06: Employment, Assets and Borrowings. A - 121
Table 7: Net additions to owned fixed assets per enterprise (in Rs.) during the reference year and annual rent payable per enterprise (in Rs.) by type of asset for each industry
Rural DME all-India net additions (Rs.) to owned fixed assets per enterprise during the reference
year annual rent payable (Rs.) on fixed assets per enterprise no. of enterprises industry (NIC 2004) land &
building plant and
machinery transport
equipment
Software&
hardware
tools and other fixed
assets total Land &
building plant and
machinery transport
equipment
software &
hardware
tools and other fixed
assets total estimated sample
(1) (2) (3) (4) (5) (6) (7) (8) (9) (10) (11) (12) (13) (14) (15) 01405 0 11001 2791 0 339 14131 168904 2960 0 0 0 171864 284 19
15 3433 5750 669 146 774 10773 1128 2197 23 0 84 3433 112057 772 16 317 794 2456 0 95 3662 73444 0 0 0 0 73444 1277 25 17 5979 9489 1422 21 824 17735 1434 244 0 0 23 1702 47378 460 18 9026 1749 4357 682 1333 17146 8505 5608 0 0 0 14113 3780 63
19 277 78 83 0 677 1115 5089 0 0 0 0 5089 2462 23 20 521 2159 971 6 795 4452 4949 1957 0 0 13 6920 7962 200 21 346 22271 1477 304 1075 25473 3662 10 7 0 0 3679 2262 47 22 0 2320 15 1389 7 3730 2407 38 0 0 0 2445 1943 28 23 6873 5089 1428 3037 2648 19075 3428 0 0 0 0 3428 638 20
24 4472 8256 2459 2430 973 18589 3779 36 15 0 5 3835 13570 270 25 42061 32748 29487 2048 1716 108062 12157 128 149 0 16 12449 3215 150 26 6136 3945 4761 5 1200 16047 14151 264 13 1 3 14432 45046 1472 27 138910 691574 5399 15133 12453 863469 17464 2929 0 0 96 20489 1315 76 28 29165 33041 509 1867 4233 68815 6235 437 0 0 0 6672 5078 222
29 193169 66299 1874 889 6414 268644 4184 5 0 0 1 4190 1493 61 30 - - - - - - - - - - - - - 0 31 75423 43510 17696 6532 5128 148288 4261 828 0 0 0 5089 726 49 32 0 0 103742 0 0 103742 5573 0 0 0 0 5573 458 2 33 3077 4012 0 2113 2232 11434 5188 0 0 0 0 5188 66 8
34 8228 108228 830 0 11507 128792 607 0 0 0 0 607 4420 32 35 0 0 0 0 26 26 57838 2196 3513 0 0 63547 137 21 36 2778 1873 1179 0 776 6607 3237 285 0 0 0 3522 18546 226 37 61662 82216 86 514 2569 147047 1670 0 0 0 0 1670 164 5 all 7135 12066 2246 367 1214 23028 4743 1169 16 0 40 5968 274277 4251
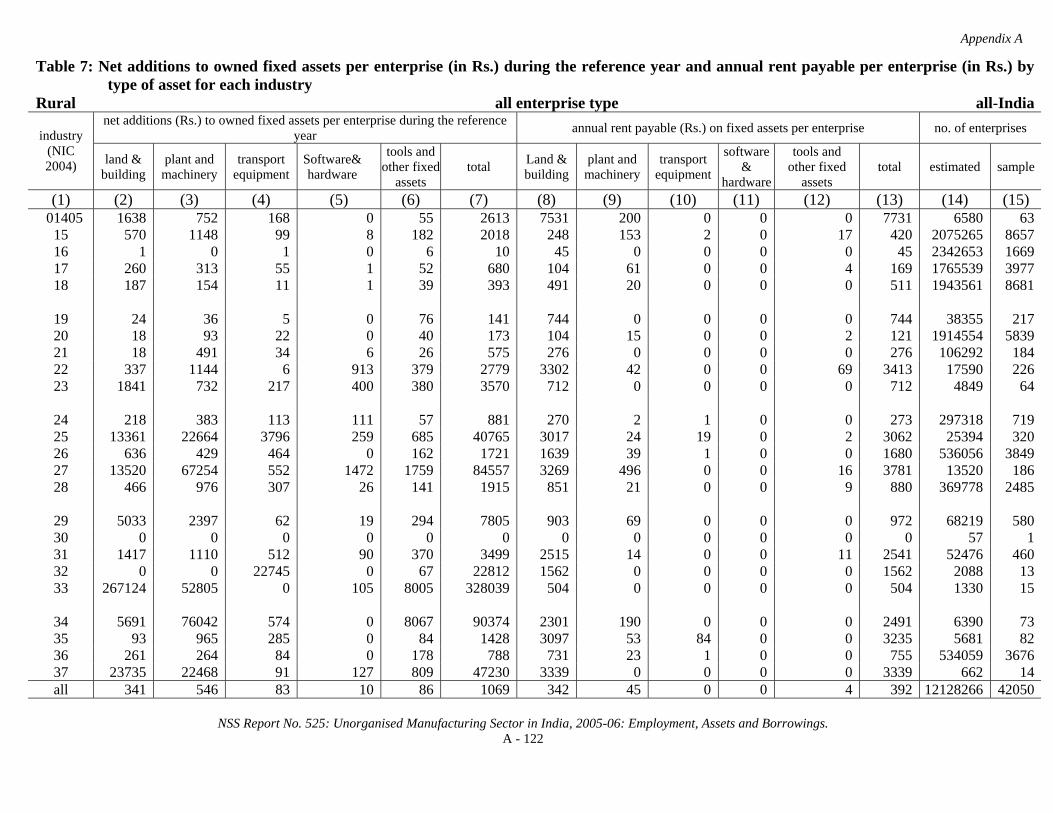
Appendix A
NSS Report No. 525: Unorganised Manufacturing Sector in India, 2005-06: Employment, Assets and Borrowings. A - 122
Table 7: Net additions to owned fixed assets per enterprise (in Rs.) during the reference year and annual rent payable per enterprise (in Rs.) by type of asset for each industry
Rural all enterprise type all-India net additions (Rs.) to owned fixed assets per enterprise during the reference
year annual rent payable (Rs.) on fixed assets per enterprise no. of enterprises industry (NIC 2004) land &
building plant and
machinery transport
equipment Software& hardware
tools and other fixed
assets total Land &
building plant and
machinery transport
equipment
software &
hardware
tools and other fixed
assets total estimated sample
(1) (2) (3) (4) (5) (6) (7) (8) (9) (10) (11) (12) (13) (14) (15) 01405 1638 752 168 0 55 2613 7531 200 0 0 0 7731 6580 63
15 570 1148 99 8 182 2018 248 153 2 0 17 420 2075265 8657 16 1 0 1 0 6 10 45 0 0 0 0 45 2342653 1669 17 260 313 55 1 52 680 104 61 0 0 4 169 1765539 3977 18 187 154 11 1 39 393 491 20 0 0 0 511 1943561 8681
19 24 36 5 0 76 141 744 0 0 0 0 744 38355 217 20 18 93 22 0 40 173 104 15 0 0 2 121 1914554 5839 21 18 491 34 6 26 575 276 0 0 0 0 276 106292 184 22 337 1144 6 913 379 2779 3302 42 0 0 69 3413 17590 226 23 1841 732 217 400 380 3570 712 0 0 0 0 712 4849 64
24 218 383 113 111 57 881 270 2 1 0 0 273 297318 719 25 13361 22664 3796 259 685 40765 3017 24 19 0 2 3062 25394 320 26 636 429 464 0 162 1721 1639 39 1 0 0 1680 536056 3849 27 13520 67254 552 1472 1759 84557 3269 496 0 0 16 3781 13520 186 28 466 976 307 26 141 1915 851 21 0 0 9 880 369778 2485
29 5033 2397 62 19 294 7805 903 69 0 0 0 972 68219 580 30 0 0 0 0 0 0 0 0 0 0 0 0 57 1 31 1417 1110 512 90 370 3499 2515 14 0 0 11 2541 52476 460 32 0 0 22745 0 67 22812 1562 0 0 0 0 1562 2088 13 33 267124 52805 0 105 8005 328039 504 0 0 0 0 504 1330 15
34 5691 76042 574 0 8067 90374 2301 190 0 0 0 2491 6390 73 35 93 965 285 0 84 1428 3097 53 84 0 0 3235 5681 82 36 261 264 84 0 178 788 731 23 1 0 0 755 534059 3676 37 23735 22468 91 127 809 47230 3339 0 0 0 0 3339 662 14 all 341 546 83 10 86 1069 342 45 0 0 4 392 12128266 42050

Appendix A
NSS Report No. 525: Unorganised Manufacturing Sector in India, 2005-06: Employment, Assets and Borrowings. A - 123
Table 7: Net additions to owned fixed assets per enterprise (in Rs.) during the reference year and annual rent payable per enterprise (in Rs.) by type of asset for each industry
Urban OAME all-India net additions (Rs.) to owned fixed assets per enterprise during the
reference year annual rent payable (Rs.) on fixed assets per enterprise no. of enterprises industry (NIC 2004) land &
building plant and
machinery transport
equipment
Software &
hardware
tools and other fixed
assets total Land &
building plant and
machinery transport
equipmentsoftware & hardware
tools and other fixed
assets total estimated sample
(1) (2) (3) (4) (5) (6) (7) (8) (9) (10) (11) (12) (13) (14) (15) 01405 2865 752 0 0 75 3692 2341 0 0 0 0 2341 1671 33
15 479 368 29 1 105 982 1591 300 17 0 21 1929 346262 3111 16 22 0 0 0 4 26 264 0 0 0 0 264 468361 1244 17 523 154 153 0 40 871 310 57 0 0 1 368 587131 2772 18 139 114 3 0 31 288 1154 16 0 0 1 1171 1020685 7703
19 1 75 3 2 51 132 1809 1 3 0 0 1813 58191 331 20 13 33 2 0 47 98 451 16 0 0 0 468 159382 1330 21 2 15 1 0 6 24 801 0 0 0 0 801 45637 340 22 763 434 497 128 147 1968 3376 62 0 0 0 3437 44652 478 23 36 0 0 0 466 502 200 0 0 0 0 200 656 6
24 136 0 3 0 2 141 319 0 0 0 0 319 105788 400 25 146 101 7 0 57 312 1788 1159 0 0 0 2947 15190 142 26 237 96 5 0 76 413 420 57 0 0 1 478 68437 681 27 6 20 13 2 14 56 2049 0 0 0 0 2049 9380 137 28 76 148 30 0 97 352 2259 63 0 0 3 2324 84071 874
29 4248 3116 400 99 254 8117 2783 233 0 0 24 3040 37355 395 30 0 0 0 0 0 0 3000 0 0 0 0 3000 98 1 31 726 172 165 0 158 1221 3841 66 0 0 21 3928 27359 373 32 0 6 0 0 60 66 2544 0 0 0 0 2544 921 16 33 5 14 0 0 81 100 3562 0 0 0 0 3562 3796 43
34 0 0 0 0 28 28 4549 0 0 0 0 4549 907 15 35 0 175 0 0 199 374 2463 70 0 0 0 2533 5018 65 36 1373 57 300 0 158 1888 1906 5 2 0 1 1914 411325 3481 37 0 0 0 0 650 650 1777 0 5 0 0 1782 1913 13 all 413 152 78 3 59 705 1065 57 2 0 3 1127 3504186 23984

Appendix A
NSS Report No. 525: Unorganised Manufacturing Sector in India, 2005-06: Employment, Assets and Borrowings. A - 124
Table 7: Net additions to owned fixed assets per enterprise (in Rs.) during the reference year and annual rent payable per enterprise (in Rs.) by type of asset for each industry
Urban NDME all-India net additions (Rs.) to owned fixed assets per enterprise during the
reference year annual rent payable (Rs.) on fixed assets per enterprise no. of enterprises industry (NIC 2004) land &
building plant and
machinery transport
equipment
Software&
hardware
tools and other fixed
assets total Land &
building plant and
machinery transport
equipment
software &
hardware
tools and other fixed
assets total estimated sample
(1) (2) (3) (4) (5) (6) (7) (8) (9) (10) (11) (12) (13) (14) (15) 01405 0 0 0 0 354 354 5188 0 0 0 0 5188 783 13
15 1752 1427 181 0 426 3836 5267 355 35 0 56 5713 149611 1816 16 0 0 0 0 13 13 788 0 0 0 0 788 6093 27 17 315 3427 542 204 161 4648 3623 1147 0 0 0 4769 115782 770 18 1360 498 167 4 394 2423 7544 29 0 0 10 7583 201087 2461
19 26 2848 32 1 1249 4156 6606 202 0 0 0 6807 31626 232 20 948 891 142 0 298 2278 5407 115 0 0 7 5529 53423 612 21 0 712 22 0 167 901 6762 5 0 0 0 6768 11199 99 22 846 3959 804 889 316 6815 10327 532 82 0 3 10943 39961 573 23 0 0 0 0 428 428 2432 0 0 0 0 2432 185 3
24 24 264 643 12 287 1229 3685 0 0 0 0 3685 5039 84 25 282 3745 4588 96 448 9158 12704 103 0 0 48 12855 18807 201 26 471 648 301 0 321 1741 4737 239 0 0 3 4980 24866 263 27 22 174 817 0 303 1316 5638 0 0 0 0 5638 7454 124 28 459 632 435 4 404 1934 8925 245 0 0 3 9173 122074 1219
29 161 1670 604 63 525 3024 10172 803 0 0 75 11050 44052 429 30 0 0 0 0 0 0 13275 0 0 0 0 13275 533 6 31 736 382 156 49 399 1722 12735 5 0 0 24 12763 23638 325 32 0 19 -153 0 35 -99 9958 0 0 0 0 9958 1032 14 33 7461 76 77 171 418 8203 11983 113 0 0 183 12279 3263 41
34 39 2844 1874 49 456 5260 7641 454 0 0 0 8095 5459 75 35 2735 755 223 101 362 4178 11451 0 0 0 0 11451 5015 87 36 702 476 8708 3544 2381 15812 5986 45 0 0 11 6043 153350 1834 37 0 27 159 360 582 1127 12821 0 2160 0 0 14981 684 14 all 879 1323 1656 597 688 5150 6886 301 10 0 18 7215 1025013 11322

Appendix A
NSS Report No. 525: Unorganised Manufacturing Sector in India, 2005-06: Employment, Assets and Borrowings. A - 125
Table 7: Net additions to owned fixed assets per enterprise (in Rs.) during the reference year and annual rent payable per enterprise (in Rs.) by type of asset for each industry
Urban DME all-India net additions (Rs.) to owned fixed assets per enterprise during the
reference year annual rent payable (Rs.) on fixed assets per enterprise no. of enterprises industry (NIC 2004) land &
building plant and
machinery transport
equipment
Software&
hardware
tools and other fixed
assets total Land &
building plant and
machinery transport
equipment
software &
hardware
tools and other fixed
assets total estimated sample
(1) (2) (3) (4) (5) (6) (7) (8) (9) (10) (11) (12) (13) (14) (15) 01405 0 3115 21585 0 -68 24632 141 22935 0 0 0 23075 97 10
15 17025 13529 7170 294 1237 39255 12321 531 116 0 70 13037 31669 995 16 1798 526 2125 0 466 4915 9592 340 0 0 0 9932 1043 27 17 2354 4090 1296 427 966 9131 11036 10062 3 0 21 21122 99361 709 18 1470 3946 1467 188 1180 8250 17909 609 0 0 92 18610 48537 357
19 11412 1621 1667 184 557 15441 14928 229 0 0 8 15165 15853 153 20 6755 12924 16415 27 1190 37312 8159 517 0 0 0 8676 10912 158 21 32399 7319 3953 614 834 45118 19308 28 511 0 15 19861 4951 119 22 5512 168427 6160 3300 15194 198593 44304 246 27 0 35 44613 15712 272 23 90 6524 8239 2142 10203 27198 5699 384 0 0 35 6117 196 15
24 6719 13954 3032 303 3805 27813 25608 1172 90 0 201 27072 10065 256 25 2964 26639 4043 390 1221 35257 27775 2173 8 0 119 30074 12920 250 26 42118 9895 6370 46 2748 61176 13842 232 471 0 0 14545 12459 188 27 4953 22377 2063 213 3649 33257 29606 9563 1 0 1051 40222 4779 142 28 17623 6547 7815 749 1124 33858 13353 254 15 0 0 13621 43951 525
29 23299 31409 11293 2261 2113 70374 18498 912 48 0 38 19497 24641 330 30 2776 21235 0 75415 16022 115447 154335 2695 0 0 0 157029 211 11 31 2762 10517 5073 1071 2196 21619 21074 147 23 0 7 21251 7317 279 32 1909 9410 847 730 10417 23313 19930 3795 32 0 0 23757 1704 37 33 7248 16115 8450 3156 4987 39956 9973 154 0 10 3 10140 1178 45
34 1170 20257 35089 840 6221 63577 13339 4056 120 0 0 17515 2504 92 35 641 71605 319 50 11393 84009 4428 82 0 0 2 4512 9389 89 36 511 1454 5478 1876 1765 11083 17705 27 0 0 46 17778 53273 470 37 0 19 967 0 291 1277 30360 0 0 0 0 30360 632 12 all 8273 15897 4791 844 2242 32047 16276 2915 39 0 52 19282 413355 5541

Appendix A
NSS Report No. 525: Unorganised Manufacturing Sector in India, 2005-06: Employment, Assets and Borrowings. A - 126
Table 7: Net additions to owned fixed assets per enterprise (in Rs.) during the reference year and annual rent payable per enterprise (in Rs.) by type of asset for each industry
Urban all enterprise type all-India net additions (Rs.) to owned fixed assets per enterprise during the
reference year annual rent payable (Rs.) on fixed assets per enterprise no. of enterprises industry (NIC 2004) land &
building plant and
machinery transport
equipment
Software&
hardware
tools and other fixed
assets total Land &
building plant and
machinery transport
equipment
software &
hardware
tools and other fixed
assets total estimated sample
(1) (2) (3) (4) (5) (6) (7) (8) (9) (10) (11) (12) (13) (14) (15) 01405 1876 611 823 0 155 3466 3131 875 0 0 0 4005 2551 56
15 1833 1458 501 18 264 4089 3277 330 28 0 34 3669 527542 5922 16 26 1 5 0 5 37 292 1 0 0 0 292 475497 1298 17 720 1114 350 82 172 2439 2116 1453 0 0 3 3574 802274 4251 18 383 321 85 8 133 930 2806 41 0 0 6 2853 1270308 10521
19 1721 1137 261 29 485 3633 5213 95 2 0 1 5311 105669 716 20 565 867 836 1 162 2433 2010 64 0 0 2 2077 223716 2100 21 2598 727 322 49 101 3797 3365 3 41 0 1 3410 61787 558 22 1540 28147 1506 928 2571 34691 12554 278 37 0 7 12875 100324 1323 23 40 1233 1557 405 2300 5535 1637 73 0 0 7 1716 1037 24
24 680 1173 282 26 330 2491 2565 98 8 0 17 2687 120892 740 25 976 8870 2955 146 534 13481 13320 1015 2 0 52 14389 46917 593 26 5226 1380 824 5 448 7883 3016 120 56 0 2 3194 105762 1132 27 1106 5017 744 48 918 7832 9380 2115 0 0 232 11728 21613 403 28 3347 1509 1596 133 427 7012 7462 185 3 0 3 7653 250097 2618
29 6977 9090 3016 586 799 20467 9504 628 11 0 49 10192 106048 1154 30 696 5326 0 18915 4018 28956 47457 676 0 0 0 48133 842 18 31 985 1555 777 154 511 3983 9608 51 3 0 20 9683 58314 977 32 889 4391 351 340 4879 10851 12737 1768 15 0 0 14520 3656 67 33 3995 2342 1239 519 916 9011 7815 67 0 1 73 7956 8237 129
34 354 7468 11059 267 2039 21188 8933 1425 34 0 0 10392 8870 182 35 1016 34856 212 50 5653 41787 5734 58 0 0 1 5793 19421 241 36 1132 281 2833 1041 848 6136 4281 17 1 0 7 4306 617948 5785 37 0 9 223 76 565 874 9711 0 460 0 0 10171 3229 39 all 1167 1711 799 196 372 4248 3544 346 7 0 11 3908 4942554 40847
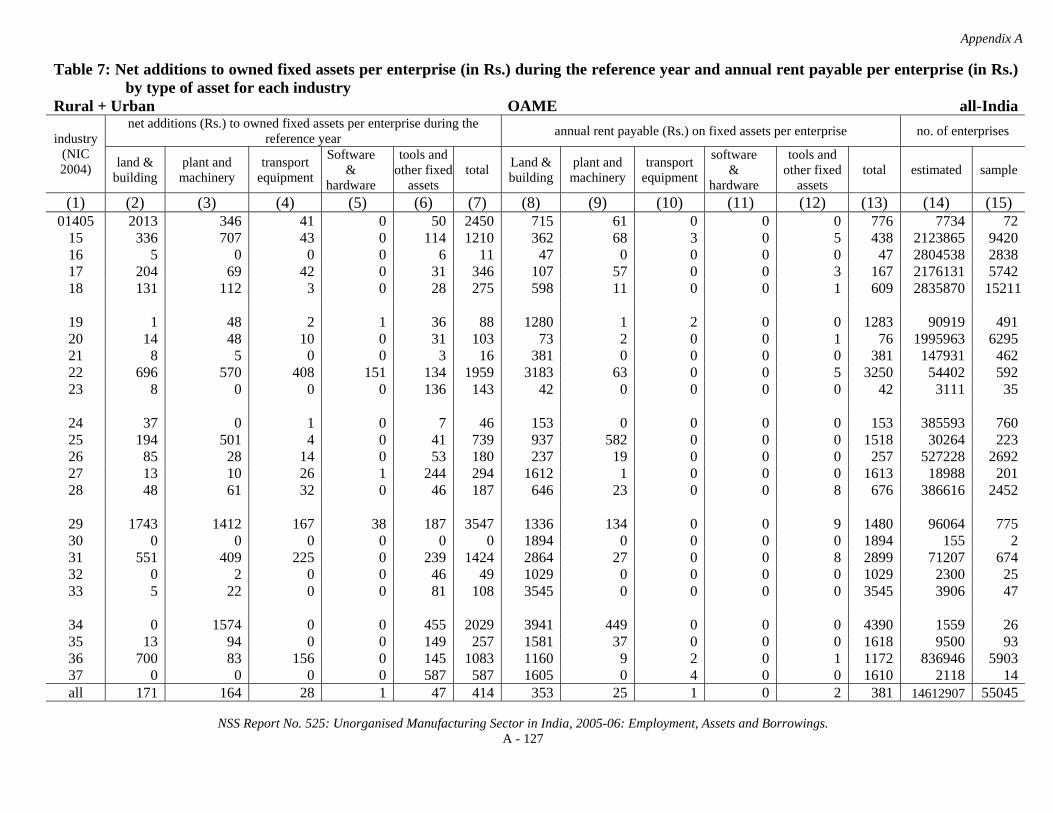
Appendix A
NSS Report No. 525: Unorganised Manufacturing Sector in India, 2005-06: Employment, Assets and Borrowings. A - 127
Table 7: Net additions to owned fixed assets per enterprise (in Rs.) during the reference year and annual rent payable per enterprise (in Rs.) by type of asset for each industry
Rural + Urban OAME all-India net additions (Rs.) to owned fixed assets per enterprise during the
reference year annual rent payable (Rs.) on fixed assets per enterprise no. of enterprises industry (NIC 2004) land &
building plant and
machinery transport
equipment
Software&
hardware
tools and other fixed
assets total Land &
building plant and
machinery transport
equipment
software &
hardware
tools and other fixed
assets total estimated sample
(1) (2) (3) (4) (5) (6) (7) (8) (9) (10) (11) (12) (13) (14) (15) 01405 2013 346 41 0 50 2450 715 61 0 0 0 776 7734 72
15 336 707 43 0 114 1210 362 68 3 0 5 438 2123865 9420 16 5 0 0 0 6 11 47 0 0 0 0 47 2804538 2838 17 204 69 42 0 31 346 107 57 0 0 3 167 2176131 5742 18 131 112 3 0 28 275 598 11 0 0 1 609 2835870 15211
19 1 48 2 1 36 88 1280 1 2 0 0 1283 90919 491 20 14 48 10 0 31 103 73 2 0 0 1 76 1995963 6295 21 8 5 0 0 3 16 381 0 0 0 0 381 147931 462 22 696 570 408 151 134 1959 3183 63 0 0 5 3250 54402 592 23 8 0 0 0 136 143 42 0 0 0 0 42 3111 35
24 37 0 1 0 7 46 153 0 0 0 0 153 385593 760 25 194 501 4 0 41 739 937 582 0 0 0 1518 30264 223 26 85 28 14 0 53 180 237 19 0 0 0 257 527228 2692 27 13 10 26 1 244 294 1612 1 0 0 0 1613 18988 201 28 48 61 32 0 46 187 646 23 0 0 8 676 386616 2452
29 1743 1412 167 38 187 3547 1336 134 0 0 9 1480 96064 775 30 0 0 0 0 0 0 1894 0 0 0 0 1894 155 2 31 551 409 225 0 239 1424 2864 27 0 0 8 2899 71207 674 32 0 2 0 0 46 49 1029 0 0 0 0 1029 2300 25 33 5 22 0 0 81 108 3545 0 0 0 0 3545 3906 47
34 0 1574 0 0 455 2029 3941 449 0 0 0 4390 1559 26 35 13 94 0 0 149 257 1581 37 0 0 0 1618 9500 93 36 700 83 156 0 145 1083 1160 9 2 0 1 1172 836946 5903 37 0 0 0 0 587 587 1605 0 4 0 0 1610 2118 14 all 171 164 28 1 47 414 353 25 1 0 2 381 14612907 55045
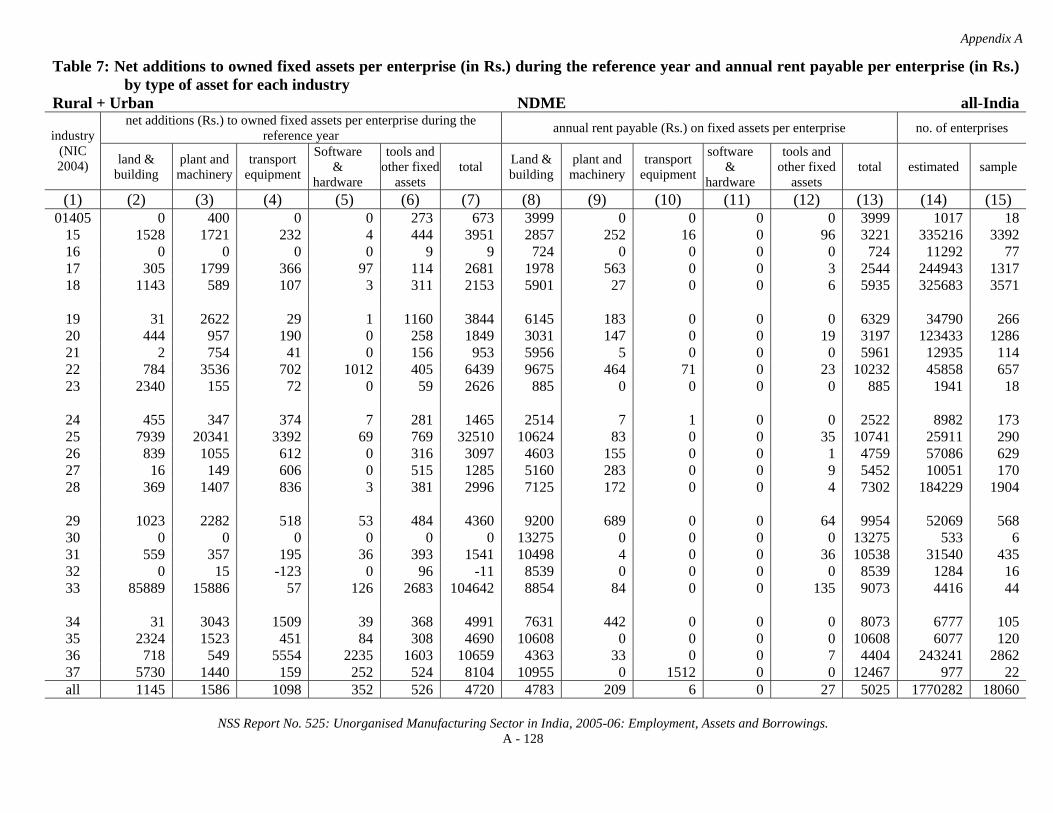
Appendix A
NSS Report No. 525: Unorganised Manufacturing Sector in India, 2005-06: Employment, Assets and Borrowings. A - 128
Table 7: Net additions to owned fixed assets per enterprise (in Rs.) during the reference year and annual rent payable per enterprise (in Rs.) by type of asset for each industry
Rural + Urban NDME all-India net additions (Rs.) to owned fixed assets per enterprise during the
reference year annual rent payable (Rs.) on fixed assets per enterprise no. of enterprises industry (NIC 2004) land &
building plant and
machinery transport
equipment
Software&
hardware
tools and other fixed
assets total Land &
building plant and
machinery transport
equipment
software &
hardware
tools and other fixed
assets total estimated sample
(1) (2) (3) (4) (5) (6) (7) (8) (9) (10) (11) (12) (13) (14) (15) 01405 0 400 0 0 273 673 3999 0 0 0 0 3999 1017 18
15 1528 1721 232 4 444 3951 2857 252 16 0 96 3221 335216 3392 16 0 0 0 0 9 9 724 0 0 0 0 724 11292 77 17 305 1799 366 97 114 2681 1978 563 0 0 3 2544 244943 1317 18 1143 589 107 3 311 2153 5901 27 0 0 6 5935 325683 3571
19 31 2622 29 1 1160 3844 6145 183 0 0 0 6329 34790 266 20 444 957 190 0 258 1849 3031 147 0 0 19 3197 123433 1286 21 2 754 41 0 156 953 5956 5 0 0 0 5961 12935 114 22 784 3536 702 1012 405 6439 9675 464 71 0 23 10232 45858 657 23 2340 155 72 0 59 2626 885 0 0 0 0 885 1941 18
24 455 347 374 7 281 1465 2514 7 1 0 0 2522 8982 173 25 7939 20341 3392 69 769 32510 10624 83 0 0 35 10741 25911 290 26 839 1055 612 0 316 3097 4603 155 0 0 1 4759 57086 629 27 16 149 606 0 515 1285 5160 283 0 0 9 5452 10051 170 28 369 1407 836 3 381 2996 7125 172 0 0 4 7302 184229 1904
29 1023 2282 518 53 484 4360 9200 689 0 0 64 9954 52069 568 30 0 0 0 0 0 0 13275 0 0 0 0 13275 533 6 31 559 357 195 36 393 1541 10498 4 0 0 36 10538 31540 435 32 0 15 -123 0 96 -11 8539 0 0 0 0 8539 1284 16 33 85889 15886 57 126 2683 104642 8854 84 0 0 135 9073 4416 44
34 31 3043 1509 39 368 4991 7631 442 0 0 0 8073 6777 105 35 2324 1523 451 84 308 4690 10608 0 0 0 0 10608 6077 120 36 718 549 5554 2235 1603 10659 4363 33 0 0 7 4404 243241 2862 37 5730 1440 159 252 524 8104 10955 0 1512 0 0 12467 977 22 all 1145 1586 1098 352 526 4720 4783 209 6 0 27 5025 1770282 18060

Appendix A
NSS Report No. 525: Unorganised Manufacturing Sector in India, 2005-06: Employment, Assets and Borrowings. A - 129
Table 7: Net additions to owned fixed assets per enterprise (in Rs.) during the reference year and annual rent payable per enterprise (in Rs.) by type of asset for each industry
Rural + Urban DME all-India net additions (Rs.) to owned fixed assets per enterprise during the
reference year annual rent payable (Rs.) on fixed assets per enterprise no. of enterprises industry (NIC 2004) land &
building plant and
machinery transport
equipment
Software&
hardware
tools and other fixed
assets total land &
building plant and
machinery transport
equipment
software &
hardware
tools and other fixed
assets total estimated sample
(1) (2) (3) (4) (5) (6) (7) (8) (9) (10) (11) (12) (13) (14) (15) 01405 0 8987 7590 0 235 16812 125811 8060 0 0 0 133871 381 29
15 6428 7464 2101 179 876 17048 3594 1830 44 0 81 5549 143726 1767 16 983 674 2307 0 262 4225 44734 153 0 0 0 44887 2320 52 17 3524 5833 1336 296 920 11909 7936 6892 2 0 22 14851 146739 1169 18 2016 3787 1676 224 1191 8893 17230 970 0 0 85 18285 52316 420
19 9915 1414 1454 160 573 13515 13606 198 0 0 7 13810 18315 176 20 4125 8383 9900 18 1024 23449 6805 1125 0 0 6 7935 18874 358 21 22349 12007 3177 517 910 38959 14402 22 353 0 10 14787 7213 166 22 4905 150143 5483 3090 13522 177143 39692 223 24 0 31 39971 17655 300 23 5279 5426 3028 2826 4424 20983 3961 90 0 0 8 4060 834 35
24 5429 10683 2703 1524 2179 22517 13075 520 47 0 89 13731 23635 526 25 10755 27856 9114 720 1320 49764 24662 1766 36 0 98 26562 16135 400 26 13932 5234 5109 14 1535 25825 14084 257 112 1 2 14456 57506 1660 27 33850 166733 2783 3432 5548 212346 26987 8132 0 0 845 35965 6094 218 28 18818 9291 7059 864 1446 37478 12616 273 13 0 0 12902 49029 747
29 33005 33402 10755 2183 2358 81703 17680 860 45 0 36 18622 26135 391 30 2776 21235 0 75415 16022 115447 154335 2695 0 0 0 157029 211 11 31 9323 13496 6213 1564 2461 33056 19555 209 21 0 7 19792 8043 328 32 1504 7417 22643 575 8211 40350 16889 2991 25 0 0 19905 2162 39 33 7027 15472 8000 3100 4840 38439 9719 146 0 10 2 9877 1244 53
34 5675 76411 13220 304 9595 105206 5212 1467 43 0 0 6722 6924 124 35 632 70578 315 50 11230 82804 5194 112 51 0 2 5359 9525 110 36 1096 1562 4368 1391 1510 9927 13969 94 0 0 34 14097 71819 696 37 12706 16957 786 106 761 31315 24448 0 0 0 0 24448 796 17 all 7819 14369 3776 654 1832 28449 11676 2218 30 0 47 13971 687632 9792

Appendix A
NSS Report No. 525: Unorganised Manufacturing Sector in India, 2005-06: Employment, Assets and Borrowings. A - 130
Table 7: Net additions to owned fixed assets per enterprise (in Rs.) during the reference year and annual rent payable per enterprise (in Rs.) by type of asset for each industry
Rural + Urban all enterprise type all-India net additions (Rs.) to owned fixed assets per enterprise during the
reference year annual rent payable (Rs.) on fixed assets per enterprise no. of enterprises industry (NIC 2004) land &
building plant and
machinery
transport equipme
nt
software&
hardware
tools and other fixed
assets total land &
building plant and
machinery transport
equipment
software &
hardware
tools and other fixed
assets total estimated sample
(1) (2) (3) (4) (5) (6) (7) (8) (9) (10) (11) (12) (13) (14) (15) 01405 1705 712 351 0 83 2851 6302 388 0 0 0 6690 9131 119
15 826 1211 181 10 198 2437 862 189 7 0 21 1079 2602807 14579 16 6 1 2 0 6 14 87 0 0 0 0 87 2818150 2967 17 403 563 147 26 90 1230 733 496 0 0 4 1233 2567813 8228 18 265 220 40 4 76 605 1406 28 0 0 3 1437 3213869 19202
19 1269 844 193 21 376 2703 4023 70 1 0 1 4095 144025 933 20 75 174 108 0 53 410 304 20 0 0 2 326 2138270 7939 21 967 577 140 22 53 1759 1411 1 15 0 0 1428 168080 742 22 1360 24119 1282 926 2244 29931 11174 243 31 0 16 11464 117915 1549 23 1524 820 453 401 718 3916 875 13 0 0 1 889 5886 88
24 351 611 162 86 136 1347 934 30 3 0 5 971 418210 1459 25 5326 13714 3250 186 587 23063 9702 667 8 0 34 10411 72311 913 26 1393 586 524 1 209 2737 1866 53 10 0 0 1929 641819 4981 27 5883 28967 670 596 1241 37358 7028 1492 0 0 149 8670 35133 589 28 1628 1191 827 69 256 3972 3518 87 1 0 6 3612 619875 5103
29 6216 6470 1860 364 601 15511 6137 409 7 0 30 6583 174268 1734 30 652 4986 0 17709 3762 27109 44431 633 0 0 0 45064 899 19 31 1190 1344 651 124 444 3754 6249 34 2 0 16 6300 110790 1437 32 566 2795 8492 216 3130 15199 8674 1125 9 0 0 9809 5745 80 33 40564 9355 1067 462 1901 53348 6799 58 0 1 63 6920 9567 144
34 2589 36181 6669 155 4563 50157 6156 908 20 0 0 7084 15260 255 35 807 27186 229 39 4393 32653 5137 57 19 0 1 5214 25102 323 36 728 273 1558 559 538 3657 2635 20 1 0 4 2660 1152007 9461 37 4038 3831 201 85 607 8761 8627 0 382 0 0 9009 3892 53 all 580 884 290 64 169 1989 1269 133 2 0 6 1410 17070820 82897

NSS Report No. 525: Unorganised Manufacturing Sector in India, 2005-06: Employment, Assets and Borrowings. A - 131
Table 7: Net additions to owned fixed assets per enterprise (in Rs.) during the reference
year and annual rent payable per enterprise (in Rs.) by type of asset for each State/UTs
Rural OAME
net additions (Rs.) to owned fixed assets per enterprise during the reference year State/UT land &
building plant and
machinerytransport
equipment Software& hardware
tools and other fixed assets total
(1) (2) (3) (4) (5) (6) (7) Andhra Pradesh 108 238 11 0 42 399 Arunachal Pradesh 797 1413 0 0 0 2211 Assam 54 18 3 0 43 119 Bihar 41 125 7 0 48 221 Chhattisgarh 76 44 0 0 34 154 Delhi 0 0 0 0 5 5 Goa 2700 1013 0 0 34 3747 Gujarat 56 99 0 0 64 219 Haryana 130 320 15 0 747 1211 Himachal Pradesh 200 780 5 0 91 1075 Jammu & Kashmir 149 72 0 1 80 302 Jharkhand 6 17 0 0 10 34 Karnataka 135 113 22 0 18 288 Kerala 240 249 76 0 73 637 Madhya Pradesh 42 31 0 0 21 95 Maharashtra 215 272 20 0 35 541 Manipur 107 87 0 0 76 270 Meghalaya 10 8 0 0 8 26 Mizoram 17 76 0 0 37 130 Nagaland 37 5 0 0 120 162 Orissa 11 30 21 0 31 93 Punjab 28 187 26 1 77 320 Rajasthan 66 72 0 0 41 237 Sikkim 0 18 0 0 22 40 Tamil Nadu 111 44 55 3 25 237 Tripura 149 25 0 0 34 208 Uttaranchal 835 150 6 0 45 1036 Uttar Pradesh 105 535 4 0 37 682 West Bengal 89 49 3 0 36 177 A & N Islands 91 346 0 0 205 642 Chandigarh 0 0 0 0 68 68 D & N Haveli 0 0 0 0 0 0 Daman & Diu 0 0 0 0 0 0 Lakshadweep 92 0 0 0 0 92 Pondicherry 0 395 4 0 14 413 all-India 95 168 13 0 44 322

NSS Report No. 525: Unorganised Manufacturing Sector in India, 2005-06: Employment, Assets and Borrowings. A - 132
Table 7 (continued): Net additions to owned fixed assets per enterprise (in Rs.) during the
reference year and annual rent payable per enterprise (in Rs.) by type of asset for each State/UTs
Rural OAME
annual rent payable (Rs.) on fixed assets per enterprise no. of enterprises State/UT Land &
building plant and
machinery transport
equipment software & hardware
tools and other fixed assets total estimated sample
(1) (8) (9) (10) (11) (12) (13) (14) (15) Andhra Pradesh 116 19 0 0 0 135 998813 2959 Arunachal Pradesh 7252 52 0 0 0 7304 304 36 Assam 166 0 0 0 0 166 306157 1780 Bihar 31 0 0 0 2 33 639312 2195 Chhattisgarh 51 0 0 0 0 51 169729 392 Delhi 641 0 0 0 0 641 767 16 Goa 442 0 0 0 0 442 3200 70 Gujarat 199 13 1 0 1 214 276152 1043 Haryana 773 4 0 0 0 777 102113 637 Himachal Pradesh 400 24 0 0 32 456 92900 732 Jammu & Kashmir 345 0 0 0 3 347 132883 878 Jharkhand 15 0 0 0 0 15 522684 863 Karnataka 100 23 0 0 0 123 580125 1424 Kerala 379 24 0 0 4 407 374908 1653 Madhya Pradesh 135 3 0 0 3 141 541814 1328 Maharashtra 274 15 1 0 1 291 499406 1587 Manipur 55 2 0 0 0 58 34388 388 Meghalaya 345 0 0 0 0 345 26803 249 Mizoram 92 10 0 0 1 103 3078 181 Nagaland 219 112 0 0 0 331 6842 394 Orissa 45 0 0 0 0 45 843862 1917 Punjab 415 2 0 0 0 418 135428 902 Rajasthan 284 15 0 0 0 300 371194 1250 Sikkim 1168 57 0 0 0 1226 3260 135 Tamil Nadu 210 4 0 0 0 214 720436 1896 Tripura 68 3 0 0 0 71 33235 672 Uttaranchal 444 0 0 0 0 444 44403 253 Uttar Pradesh 106 39 0 0 1 145 1577716 2541 West Bengal 20 20 0 0 2 41 2061369 2423 A & N Islands 550 11 0 0 3 564 1283 108 Chandigarh 1568 84 0 0 0 1652 567 15 D & N Haveli 417 0 0 0 0 417 506 19 Daman & Diu 784 0 0 0 0 784 852 37 Lakshadweep 576 0 0 0 0 576 204 20 Pondicherry 352 0 0 0 0 352 2026 68 all-India 129 15 0 0 1 146 11108720 31061

NSS Report No. 525: Unorganised Manufacturing Sector in India, 2005-06: Employment, Assets and Borrowings. A - 133
Table 7: Net additions to owned fixed assets per enterprise (in Rs.) during the reference
year and annual rent payable per enterprise (in Rs.) by type of asset for each State/UTs
Rural NDME
net additions (Rs.) to owned fixed assets per enterprise during the reference yearState/UT land &
building plant and
machinerytransport
equipment Software& hardware
tools and other fixed assets total
(1) (2) (3) (4) (5) (6) (7) Andhra Pradesh 3401 2739 145 24 405 6713 Arunachal Pradesh 0 0 0 0 0 0 Assam 561 171 0 0 132 864 Bihar 59 333 30 0 69 491 Chhattisgarh 0 36 0 0 72 109 Delhi 0 0 0 0 0 0 Goa 1463 3617 0 84 488 5653 Gujarat 1 105 2 0 121 229 Haryana 10082 33397 67 0 575 44122 Himachal Pradesh 1 3664 47 0 775 4487 Jammu & Kashmir 9 43 0 0 219 270 Jharkhand 0 56 0 0 9 65 Karnataka 506 3325 1384 0 363 5579 Kerala 2351 2472 1067 45 431 6366 Madhya Pradesh 446 204 105 0 456 1212 Maharashtra 1172 1918 560 0 379 4029 Manipur 190 29 0 0 133 352 Meghalaya 9 40 0 0 20 69 Mizoram 39 267 780 0 217 1302 Nagaland 0 49 0 0 269 319 Orissa 1298 1097 19 0 296 2710 Punjab 193 507 134 480 653 1966 Rajasthan 59 296 17 0 304 1343 Sikkim 0 2364 0 0 447 2811 Tamil Nadu 332 984 104 0 90 1510 Tripura 505 102 0 0 148 754 Uttaranchal 48448 9506 10 0 1504 59468 Uttar Pradesh 213 1129 333 1 304 1980 West Bengal 489 489 53 0 265 1296 A & N Islands 87 638 0 0 1589 2314 Chandigarh 0 88 0 0 106 194 D & N Haveli 0 0 0 0 0 0 Daman & Diu 0 0 0 0 0 0 Lakshadweep 19 1959 0 0 132 2110 Pondicherry 10 635 8409 0 533 9586 all-India 1510 1948 330 16 304 4129

NSS Report No. 525: Unorganised Manufacturing Sector in India, 2005-06: Employment, Assets and Borrowings. A - 134
Table 7 (continued): Net additions to owned fixed assets per enterprise (in Rs.) during the reference
year and annual rent payable per enterprise (in Rs.) by type of asset for each State/UTs Rural NDME
annual rent payable (Rs.) on fixed assets per enterprise no. of enterprises State/UT Land &
building plant and
machinery transport
equipment software & hardware
tools and other fixed assets total estimated sample
(1) (8) (9) (10) (11) (12) (13) (14) (15) Andhra Pradesh 2317 412 6 0 5 2740 45316 523 Arunachal Pradesh 2094 57 0 0 0 2151 226 37 Assam 960 0 0 0 0 960 24581 273 Bihar 666 0 0 0 0 666 23138 220 Chhattisgarh 208 0 0 0 0 208 1549 54 Delhi 8096 0 0 0 0 8096 1810 28 Goa 1912 0 0 0 0 1912 888 32 Gujarat 1828 0 0 0 0 1828 14538 134 Haryana 4139 3 0 0 1412 5554 14267 206 Himachal Pradesh 3694 23 0 0 0 3717 6763 161 Jammu & Kashmir 269 0 0 0 0 269 6501 157 Jharkhand 488 0 0 0 0 488 16622 90 Karnataka 2645 108 0 0 1 2754 32323 192 Kerala 3513 113 0 0 22 3648 98679 827 Madhya Pradesh 7630 0 1 0 0 7631 13146 98 Maharashtra 2970 53 0 0 0 3023 39967 192 Manipur 2266 485 0 0 0 2751 1288 45 Meghalaya 1414 0 0 0 0 1414 6579 106 Mizoram 881 44 0 0 19 943 196 39 Nagaland 3985 0 0 0 0 3985 319 28 Orissa 434 96 0 0 0 531 23583 166 Punjab 4149 228 0 0 69 4446 13610 172 Rajasthan 1166 101 0 0 3 1269 23428 295 Sikkim 9789 0 0 0 0 9789 397 21 Tamil Nadu 1140 118 0 0 39 1296 88273 690 Tripura 391 122 0 0 11 523 5400 347 Uttaranchal 3190 0 0 0 0 3190 7371 94 Uttar Pradesh 1306 8 0 0 0 1314 100935 545 West Bengal 602 35 0 0 13 649 131237 783 A & N Islands 6319 0 0 0 0 6319 488 60 Chandigarh 26086 0 0 0 0 26086 154 13 D & N Haveli 8297 0 0 0 0 8297 247 31 Daman & Diu 10526 1126 0 0 0 11652 133 20 Lakshadweep 373 0 0 0 0 373 48 8 Pondicherry 13524 578 0 0 0 14102 1270 51 all-India 1891 82 0 0 39 2012 745269 6738

NSS Report No. 525: Unorganised Manufacturing Sector in India, 2005-06: Employment, Assets and Borrowings. A - 135
Table 7: Net additions to owned fixed assets per enterprise (in Rs.) during the reference
year and annual rent payable per enterprise (in Rs.) by type of asset for each State/UTs
Rural DME
net additions (Rs.) to owned fixed assets per enterprise during the reference year State/UT land &
building plant and
machinerytransport
equipment Software& hardware
tools and other fixed assets total
(1) (2) (3) (4) (5) (6) (7) Andhra Pradesh 1637 1378 114 3 397 3528 Arunachal Pradesh 5277 6886 0 0 6352 18515 Assam 64014 5761 33064 0 1007 103847 Bihar 91 207 95 0 117 511 Chhattisgarh 129739 654749 8989 15170 4276 812924 Delhi 0 680 0 308 24 1012 Goa 283279 329117 5875 21175 42177 681624 Gujarat 169 745 31 60 1069 2073 Haryana 53409 100822 19807 1039 5717 180793 Himachal Pradesh 19860 33483 16043 568 6065 76019 Jammu & Kashmir 37 3023 5 0 1278 4342 Jharkhand 447 2405 856 5 173 3886 Karnataka 4756 6330 109 28 634 11857 Kerala 9407 8681 11175 740 937 30940 Madhya Pradesh 386 1038 172 0 655 2252 Maharashtra 1071 31384 3181 1918 3575 41129 Manipur 0 2882 0 0 0 2882 Meghalaya 28 9 0 0 1 38 Mizoram 0 2235 0 0 0 2235 Nagaland 971 0 0 0 8091 9061 Orissa 1388 9502 6 0 1091 11987 Punjab 28781 20567 38545 6212 3123 97227 Rajasthan 743 2388 1222 32 241 4626 Sikkim 33523 6390 0 0 43 39957 Tamil Nadu 3242 7501 847 24 487 12101 Tripura 6433 3596 3032 0 929 13990 Uttaranchal 135209 44755 6855 2023 6441 195283 Uttar Pradesh 1638 7521 1035 2 2203 12399 West Bengal 6763 4217 1022 137 1097 13237 A & N Islands 0 2044 421 0 2679 5143 Chandigarh 0 0 0 0 0 0 D & N Haveli 0 0 0 0 0 0 Daman & Diu 26 0 0 0 13 39 Lakshadweep 225 0 0 0 2500 2725 Pondicherry 101390 13396 6682 1256 2511 125235 all-India 7135 12066 2246 367 1214 23028
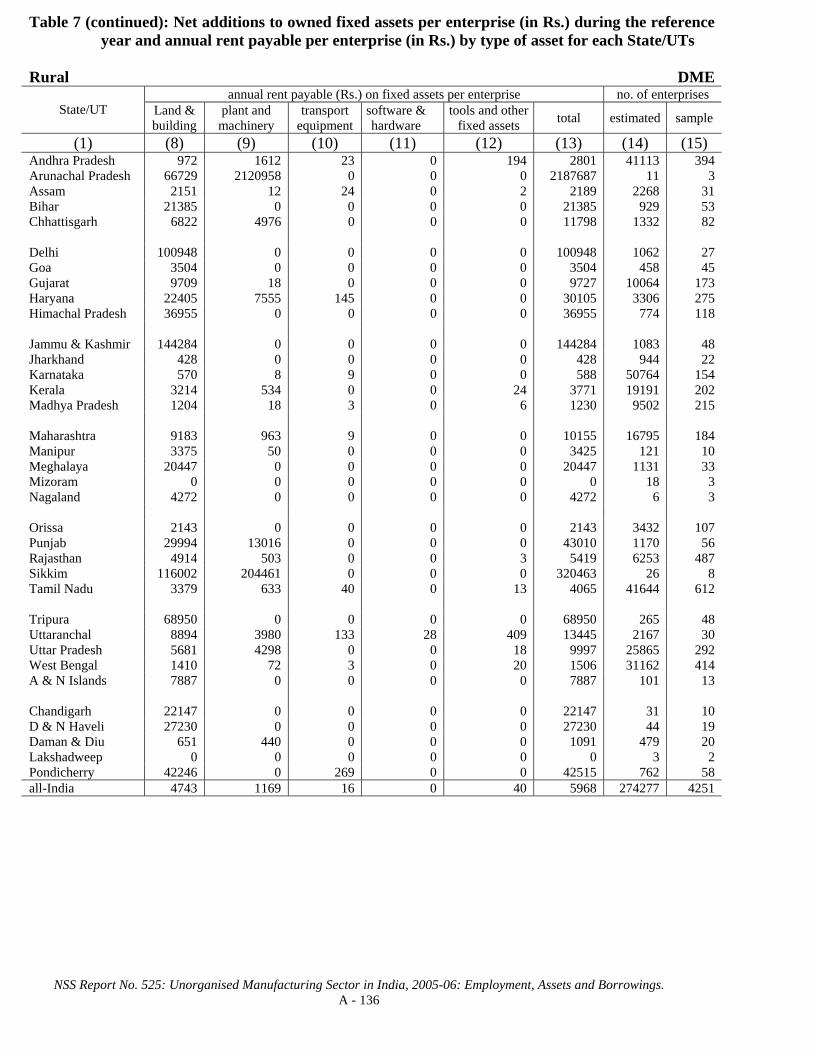
NSS Report No. 525: Unorganised Manufacturing Sector in India, 2005-06: Employment, Assets and Borrowings. A - 136
Table 7 (continued): Net additions to owned fixed assets per enterprise (in Rs.) during the reference
year and annual rent payable per enterprise (in Rs.) by type of asset for each State/UTs Rural DME
annual rent payable (Rs.) on fixed assets per enterprise no. of enterprises State/UT Land &
building plant and
machinery transport
equipment software & hardware
tools and other fixed assets total estimated sample
(1) (8) (9) (10) (11) (12) (13) (14) (15) Andhra Pradesh 972 1612 23 0 194 2801 41113 394 Arunachal Pradesh 66729 2120958 0 0 0 2187687 11 3 Assam 2151 12 24 0 2 2189 2268 31 Bihar 21385 0 0 0 0 21385 929 53 Chhattisgarh 6822 4976 0 0 0 11798 1332 82 Delhi 100948 0 0 0 0 100948 1062 27 Goa 3504 0 0 0 0 3504 458 45 Gujarat 9709 18 0 0 0 9727 10064 173 Haryana 22405 7555 145 0 0 30105 3306 275 Himachal Pradesh 36955 0 0 0 0 36955 774 118 Jammu & Kashmir 144284 0 0 0 0 144284 1083 48 Jharkhand 428 0 0 0 0 428 944 22 Karnataka 570 8 9 0 0 588 50764 154 Kerala 3214 534 0 0 24 3771 19191 202 Madhya Pradesh 1204 18 3 0 6 1230 9502 215 Maharashtra 9183 963 9 0 0 10155 16795 184 Manipur 3375 50 0 0 0 3425 121 10 Meghalaya 20447 0 0 0 0 20447 1131 33 Mizoram 0 0 0 0 0 0 18 3 Nagaland 4272 0 0 0 0 4272 6 3 Orissa 2143 0 0 0 0 2143 3432 107 Punjab 29994 13016 0 0 0 43010 1170 56 Rajasthan 4914 503 0 0 3 5419 6253 487 Sikkim 116002 204461 0 0 0 320463 26 8 Tamil Nadu 3379 633 40 0 13 4065 41644 612 Tripura 68950 0 0 0 0 68950 265 48 Uttaranchal 8894 3980 133 28 409 13445 2167 30 Uttar Pradesh 5681 4298 0 0 18 9997 25865 292 West Bengal 1410 72 3 0 20 1506 31162 414 A & N Islands 7887 0 0 0 0 7887 101 13 Chandigarh 22147 0 0 0 0 22147 31 10 D & N Haveli 27230 0 0 0 0 27230 44 19 Daman & Diu 651 440 0 0 0 1091 479 20 Lakshadweep 0 0 0 0 0 0 3 2 Pondicherry 42246 0 269 0 0 42515 762 58 all-India 4743 1169 16 0 40 5968 274277 4251
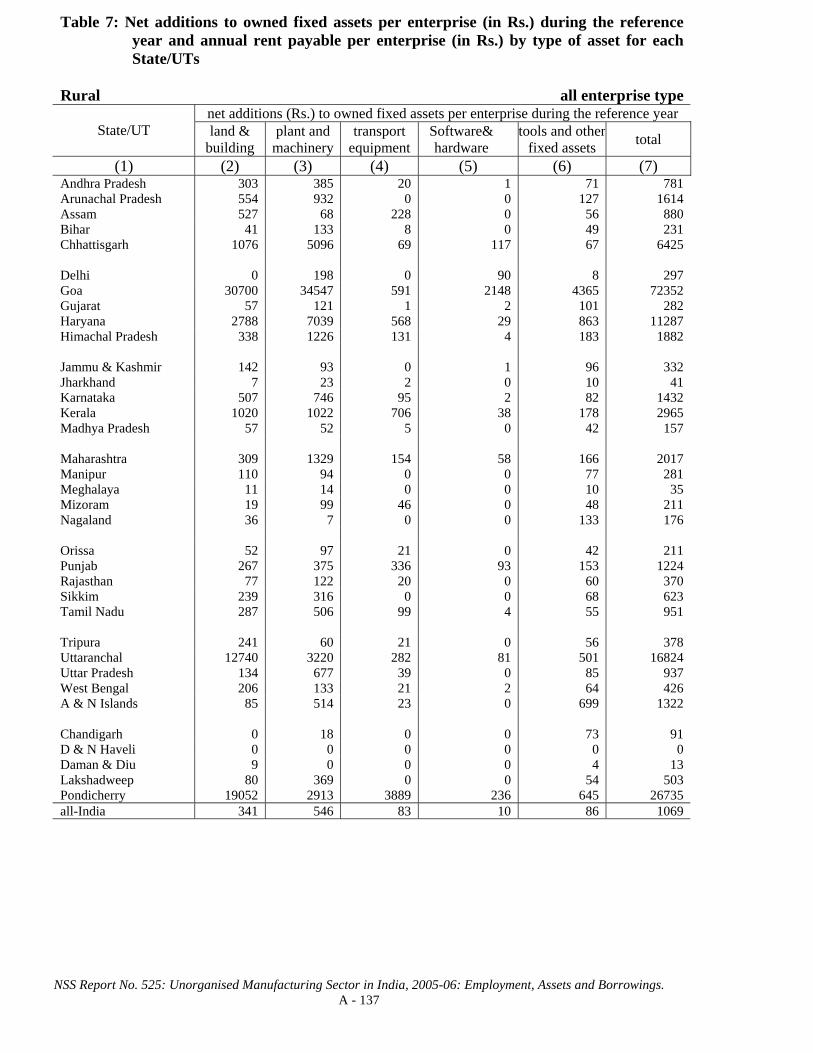
NSS Report No. 525: Unorganised Manufacturing Sector in India, 2005-06: Employment, Assets and Borrowings. A - 137
Table 7: Net additions to owned fixed assets per enterprise (in Rs.) during the reference
year and annual rent payable per enterprise (in Rs.) by type of asset for each State/UTs
Rural all enterprise type
net additions (Rs.) to owned fixed assets per enterprise during the reference year State/UT land &
building plant and
machinerytransport
equipment Software& hardware
tools and other fixed assets total
(1) (2) (3) (4) (5) (6) (7) Andhra Pradesh 303 385 20 1 71 781 Arunachal Pradesh 554 932 0 0 127 1614 Assam 527 68 228 0 56 880 Bihar 41 133 8 0 49 231 Chhattisgarh 1076 5096 69 117 67 6425 Delhi 0 198 0 90 8 297 Goa 30700 34547 591 2148 4365 72352 Gujarat 57 121 1 2 101 282 Haryana 2788 7039 568 29 863 11287 Himachal Pradesh 338 1226 131 4 183 1882 Jammu & Kashmir 142 93 0 1 96 332 Jharkhand 7 23 2 0 10 41 Karnataka 507 746 95 2 82 1432 Kerala 1020 1022 706 38 178 2965 Madhya Pradesh 57 52 5 0 42 157 Maharashtra 309 1329 154 58 166 2017 Manipur 110 94 0 0 77 281 Meghalaya 11 14 0 0 10 35 Mizoram 19 99 46 0 48 211 Nagaland 36 7 0 0 133 176 Orissa 52 97 21 0 42 211 Punjab 267 375 336 93 153 1224 Rajasthan 77 122 20 0 60 370 Sikkim 239 316 0 0 68 623 Tamil Nadu 287 506 99 4 55 951 Tripura 241 60 21 0 56 378 Uttaranchal 12740 3220 282 81 501 16824 Uttar Pradesh 134 677 39 0 85 937 West Bengal 206 133 21 2 64 426 A & N Islands 85 514 23 0 699 1322 Chandigarh 0 18 0 0 73 91 D & N Haveli 0 0 0 0 0 0 Daman & Diu 9 0 0 0 4 13 Lakshadweep 80 369 0 0 54 503 Pondicherry 19052 2913 3889 236 645 26735 all-India 341 546 83 10 86 1069
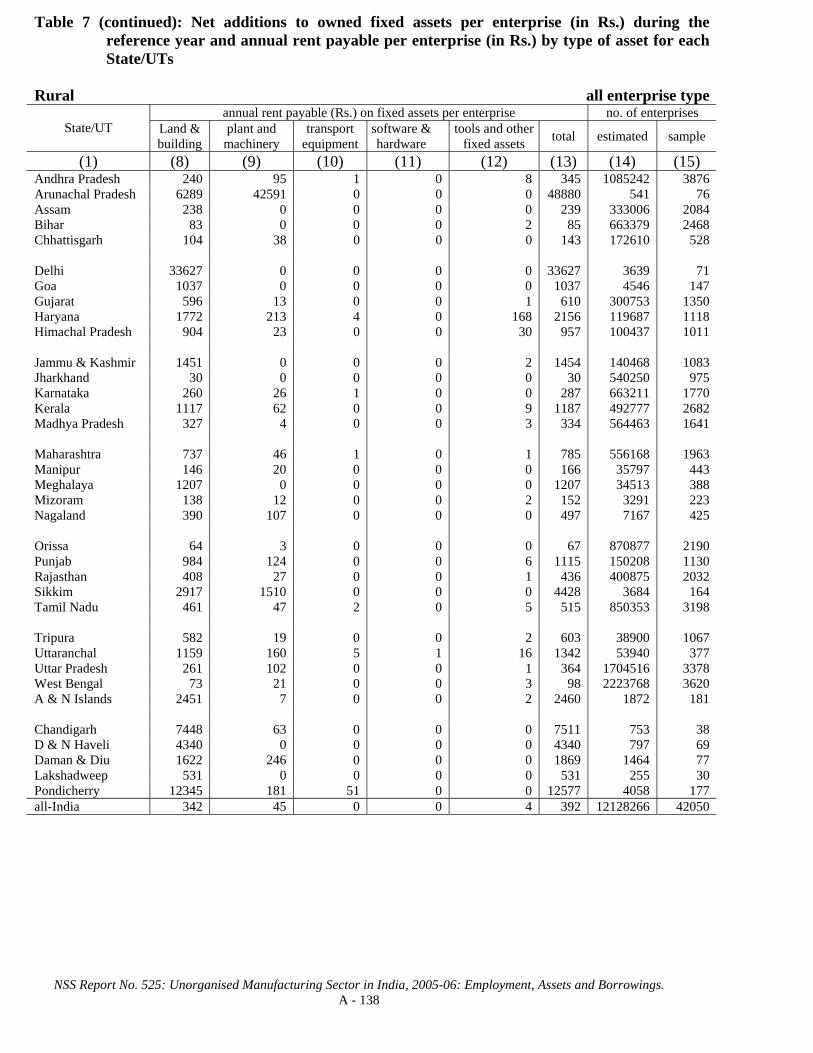
NSS Report No. 525: Unorganised Manufacturing Sector in India, 2005-06: Employment, Assets and Borrowings. A - 138
Table 7 (continued): Net additions to owned fixed assets per enterprise (in Rs.) during the
reference year and annual rent payable per enterprise (in Rs.) by type of asset for each State/UTs
Rural all enterprise type
annual rent payable (Rs.) on fixed assets per enterprise no. of enterprises State/UT Land &
building plant and
machinery transport
equipment software & hardware
tools and other fixed assets total estimated sample
(1) (8) (9) (10) (11) (12) (13) (14) (15) Andhra Pradesh 240 95 1 0 8 345 1085242 3876 Arunachal Pradesh 6289 42591 0 0 0 48880 541 76 Assam 238 0 0 0 0 239 333006 2084 Bihar 83 0 0 0 2 85 663379 2468 Chhattisgarh 104 38 0 0 0 143 172610 528 Delhi 33627 0 0 0 0 33627 3639 71 Goa 1037 0 0 0 0 1037 4546 147 Gujarat 596 13 0 0 1 610 300753 1350 Haryana 1772 213 4 0 168 2156 119687 1118 Himachal Pradesh 904 23 0 0 30 957 100437 1011 Jammu & Kashmir 1451 0 0 0 2 1454 140468 1083 Jharkhand 30 0 0 0 0 30 540250 975 Karnataka 260 26 1 0 0 287 663211 1770 Kerala 1117 62 0 0 9 1187 492777 2682 Madhya Pradesh 327 4 0 0 3 334 564463 1641 Maharashtra 737 46 1 0 1 785 556168 1963 Manipur 146 20 0 0 0 166 35797 443 Meghalaya 1207 0 0 0 0 1207 34513 388 Mizoram 138 12 0 0 2 152 3291 223 Nagaland 390 107 0 0 0 497 7167 425 Orissa 64 3 0 0 0 67 870877 2190 Punjab 984 124 0 0 6 1115 150208 1130 Rajasthan 408 27 0 0 1 436 400875 2032 Sikkim 2917 1510 0 0 0 4428 3684 164 Tamil Nadu 461 47 2 0 5 515 850353 3198 Tripura 582 19 0 0 2 603 38900 1067 Uttaranchal 1159 160 5 1 16 1342 53940 377 Uttar Pradesh 261 102 0 0 1 364 1704516 3378 West Bengal 73 21 0 0 3 98 2223768 3620 A & N Islands 2451 7 0 0 2 2460 1872 181 Chandigarh 7448 63 0 0 0 7511 753 38 D & N Haveli 4340 0 0 0 0 4340 797 69 Daman & Diu 1622 246 0 0 0 1869 1464 77 Lakshadweep 531 0 0 0 0 531 255 30 Pondicherry 12345 181 51 0 0 12577 4058 177 all-India 342 45 0 0 4 392 12128266 42050
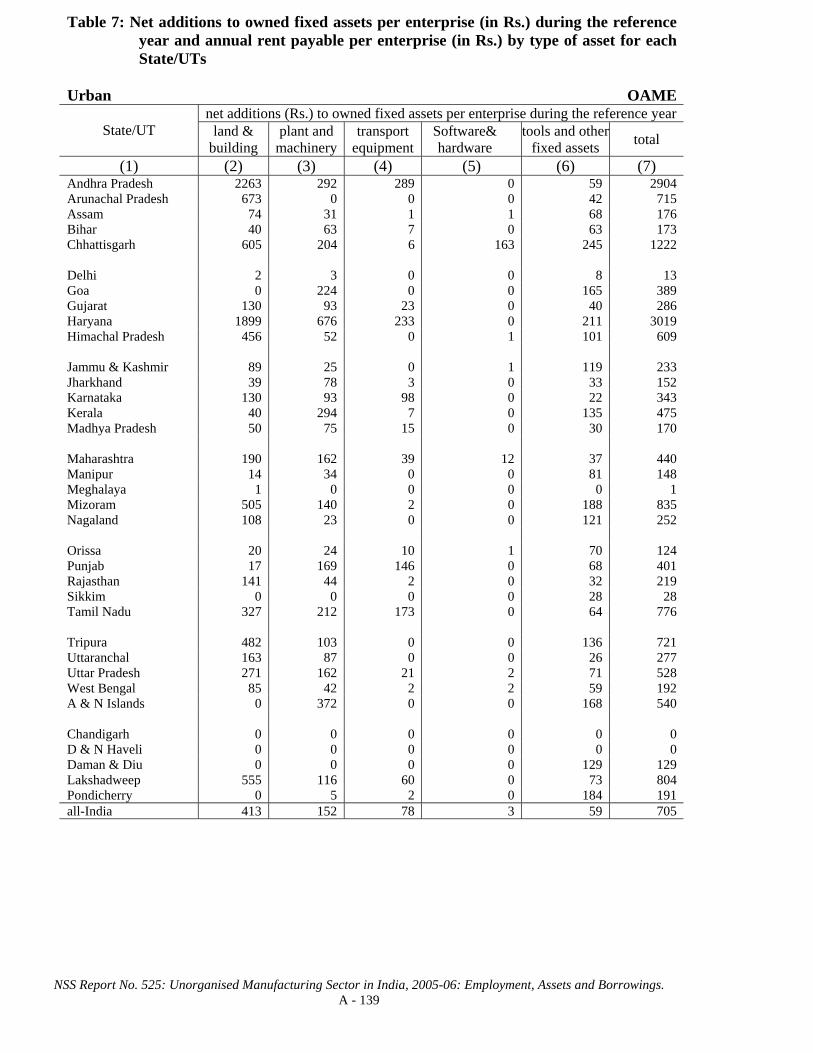
NSS Report No. 525: Unorganised Manufacturing Sector in India, 2005-06: Employment, Assets and Borrowings. A - 139
Table 7: Net additions to owned fixed assets per enterprise (in Rs.) during the reference
year and annual rent payable per enterprise (in Rs.) by type of asset for each State/UTs
Urban OAME
net additions (Rs.) to owned fixed assets per enterprise during the reference yearState/UT land &
building plant and
machinerytransport
equipment Software& hardware
tools and other fixed assets total
(1) (2) (3) (4) (5) (6) (7) Andhra Pradesh 2263 292 289 0 59 2904 Arunachal Pradesh 673 0 0 0 42 715 Assam 74 31 1 1 68 176 Bihar 40 63 7 0 63 173 Chhattisgarh 605 204 6 163 245 1222 Delhi 2 3 0 0 8 13 Goa 0 224 0 0 165 389 Gujarat 130 93 23 0 40 286 Haryana 1899 676 233 0 211 3019 Himachal Pradesh 456 52 0 1 101 609 Jammu & Kashmir 89 25 0 1 119 233 Jharkhand 39 78 3 0 33 152 Karnataka 130 93 98 0 22 343 Kerala 40 294 7 0 135 475 Madhya Pradesh 50 75 15 0 30 170 Maharashtra 190 162 39 12 37 440 Manipur 14 34 0 0 81 148 Meghalaya 1 0 0 0 0 1 Mizoram 505 140 2 0 188 835 Nagaland 108 23 0 0 121 252 Orissa 20 24 10 1 70 124 Punjab 17 169 146 0 68 401 Rajasthan 141 44 2 0 32 219 Sikkim 0 0 0 0 28 28 Tamil Nadu 327 212 173 0 64 776 Tripura 482 103 0 0 136 721 Uttaranchal 163 87 0 0 26 277 Uttar Pradesh 271 162 21 2 71 528 West Bengal 85 42 2 2 59 192 A & N Islands 0 372 0 0 168 540 Chandigarh 0 0 0 0 0 0 D & N Haveli 0 0 0 0 0 0 Daman & Diu 0 0 0 0 129 129 Lakshadweep 555 116 60 0 73 804 Pondicherry 0 5 2 0 184 191 all-India 413 152 78 3 59 705

NSS Report No. 525: Unorganised Manufacturing Sector in India, 2005-06: Employment, Assets and Borrowings. A - 140
Table 7 (continued): Net additions to owned fixed assets per enterprise (in Rs.) during the reference
year and annual rent payable per enterprise (in Rs.) by type of asset for each State/UTs Urban OAME
annual rent payable (Rs.) on fixed assets per enterprise no. of enterprises State/UT Land &
building plant and
machinery transport
equipment software & hardware
tools and other fixed assets total estimated sample
(1) (8) (9) (10) (11) (12) (13) (14) (15) Andhra Pradesh 1222 13 1 0 0 1236 363988 1849 Arunachal Pradesh 11064 91 0 0 0 11155 223 14 Assam 1551 10 0 0 0 1561 21984 471 Bihar 757 0 0 0 0 757 87057 962 Chhattisgarh 1105 0 0 0 0 1105 23967 215 Delhi 4595 0 0 0 0 4595 17127 67 Goa 4217 12 0 0 6 4235 3053 48 Gujarat 1043 19 0 0 2 1064 246382 1271 Haryana 2775 38 64 0 0 2876 60448 400 Himachal Pradesh 4064 0 0 0 0 4064 4249 276 Jammu & Kashmir 1319 3 0 0 1 1323 25700 1011 Jharkhand 1043 8 0 0 0 1051 34243 548 Karnataka 1059 12 0 0 0 1071 228452 1046 Kerala 612 7 0 0 5 624 119772 789 Madhya Pradesh 858 60 0 0 5 924 253319 1565 Maharashtra 1438 355 3 0 20 1815 341781 2227 Manipur 43 54 0 0 0 97 14629 559 Meghalaya 4008 0 0 0 6 4014 1027 69 Mizoram 1448 0 0 0 0 1448 1123 129 Nagaland 2182 38 0 0 0 2220 1912 191 Orissa 740 1 0 0 0 741 69199 791 Punjab 1553 20 0 0 0 1573 87811 941 Rajasthan 1176 41 0 0 2 1219 181806 1576 Sikkim 11587 17 0 0 0 11604 206 45 Tamil Nadu 1207 12 2 0 2 1222 467652 1948 Tripura 1992 0 0 0 0 1992 3857 277 Uttaranchal 2154 0 0 0 0 2154 7877 82 Uttar Pradesh 872 35 3 0 1 911 455329 2883 West Bengal 314 39 0 0 3 356 373178 1520 A & N Islands 8195 0 0 0 0 8195 147 15 Chandigarh 5426 0 0 0 0 5426 457 5 D & N Haveli 9297 0 0 0 0 9297 68 19 Daman & Diu 1461 0 0 0 0 1461 960 56 Lakshadweep 788 19 0 0 4 810 115 42 Pondicherry 1151 29 0 0 0 1181 5090 77 all-India 1065 57 2 0 3 1127 3504186 23984

NSS Report No. 525: Unorganised Manufacturing Sector in India, 2005-06: Employment, Assets and Borrowings. A - 141
Table 7: Net additions to owned fixed assets per enterprise (in Rs.) during the reference
year and annual rent payable per enterprise (in Rs.) by type of asset for each State/UTs
Urban NDME
net additions (Rs.) to owned fixed assets per enterprise during the reference year State/UT land &
building plant and
machinerytransport
equipment Software& hardware
tools and other fixed assets total
(1) (2) (3) (4) (5) (6) (7) Andhra Pradesh 645 1040 433 15 332 2465 Arunachal Pradesh 0 0 0 0 0 0 Assam 127 386 0 0 279 792 Bihar 64 237 51 0 208 561 Chhattisgarh 4 5217 714 0 466 6401 Delhi 80 1995 20 0 739 2835 Goa 19183 4448 1487 11 2035 27164 Gujarat 69 6414 1725 401 412 9020 Haryana 124 824 131 0 1199 2277 Himachal Pradesh 22 4358 -109 0 1630 9321 Jammu & Kashmir 1231 170 0 0 1680 3082 Jharkhand 1141 262 0 6 323 1732 Karnataka 5 622 665 4 148 1444 Kerala 818 3670 778 394 484 6144 Madhya Pradesh 549 241 585 35 125 1535 Maharashtra 442 944 9848 4139 2442 17815 Manipur 12 6 0 0 476 494 Meghalaya 22 57 0 0 295 374 Mizoram 300 261 0 0 310 871 Nagaland 18 223 0 3 369 612 Orissa 1249 425 8 0 192 1874 Punjab 2911 884 94 46 650 4585 Rajasthan 935 407 12 1 104 1459 Sikkim 1481 44 0 0 243 1768 Tamil Nadu 1592 1299 724 80 479 4174 Tripura 1810 307 0 85 262 2464 Uttaranchal 113 132 9 0 265 519 Uttar Pradesh 1058 1003 244 1 314 2620 West Bengal 633 590 182 24 359 1788 A & N Islands 0 83 19375 7208 4883 31550 Chandigarh 0 0 0 0 0 0 D & N Haveli 0 0 0 0 0 0 Daman & Diu 0 0 0 0 193 193 Lakshadweep 0 1156 0 0 78 1233 Pondicherry 19916 689 60 0 572 21237 all-India 879 1323 1656 597 688 5150

NSS Report No. 525: Unorganised Manufacturing Sector in India, 2005-06: Employment, Assets and Borrowings. A - 142
Table 7 (continued): Net additions to owned fixed assets per enterprise (in Rs.) during the
reference year and annual rent payable per enterprise (in Rs.) by type of asset for each State/UTs
Urban NDME
annual rent payable (Rs.) on fixed assets per enterprise no. of enterprises State/UT Land &
building plant and
machinery transport
equipment software & hardware
tools and other fixed assets total estimated sample
(1) (8) (9) (10) (11) (12) (13) (14) (15) Andhra Pradesh 6129 41 0 0 1 6170 69642 680 Arunachal Pradesh 18750 0 0 0 0 18750 84 10 Assam 6637 93 0 0 3 6733 13647 317 Bihar 7313 0 0 0 0 7313 20269 352 Chhattisgarh 5396 0 0 0 0 5396 8083 87 Delhi 8510 77 0 0 0 8587 45890 191 Goa 7789 0 0 0 0 7789 2170 49 Gujarat 6395 863 0 0 65 7322 54198 526 Haryana 5751 43 85 0 2 5881 38319 339 Himachal Pradesh 11831 0 0 0 0 11831 2163 161 Jammu & Kashmir 4193 0 0 0 0 4193 5973 354 Jharkhand 4069 140 0 0 0 4209 10207 223 Karnataka 10851 638 0 0 51 11540 48749 411 Kerala 4060 56 145 0 6 4267 35062 471 Madhya Pradesh 4450 1733 0 0 51 6234 31921 384 Maharashtra 12500 797 0 0 51 13348 134658 1149 Manipur 2694 0 0 0 370 3064 1864 136 Meghalaya 12232 276 0 0 24 12532 1268 71 Mizoram 5760 0 0 0 0 5760 624 89 Nagaland 15086 0 0 0 0 15086 758 66 Orissa 8002 0 0 0 0 8002 13748 231 Punjab 6326 5 0 0 0 6330 44532 639 Rajasthan 6724 263 0 0 4 6991 38180 544 Sikkim 25907 0 490 0 0 26397 186 43 Tamil Nadu 8699 221 13 0 14 8947 117692 925 Tripura 2733 27 0 5 0 2765 2357 233 Uttaranchal 4910 0 0 0 0 4910 6535 88 Uttar Pradesh 4876 30 0 0 1 4908 157969 1423 West Bengal 2039 122 0 0 8 2169 114609 1004 A & N Islands 13275 0 0 0 0 13275 222 17 Chandigarh 16725 0 0 0 0 16725 148 3 D & N Haveli 12900 0 0 0 0 12900 98 26 Daman & Diu 8509 0 0 0 0 8509 188 22 Lakshadweep 1667 0 0 0 0 1667 23 9 Pondicherry 6978 0 0 0 0 6978 2975 49 all-India 6886 301 10 0 18 7215 1025013 11322

NSS Report No. 525: Unorganised Manufacturing Sector in India, 2005-06: Employment, Assets and Borrowings. A - 143
Table 7: Net additions to owned fixed assets per enterprise (in Rs.) during the reference
year and annual rent payable per enterprise (in Rs.) by type of asset for each State/UTs
Urban DME
net additions (Rs.) to owned fixed assets per enterprise during the reference year State/UT land &
building plant and
machinerytransport
equipment Software& hardware
tools and other fixed assets total
(1) (2) (3) (4) (5) (6) (7) Andhra Pradesh 15776 6407 11744 26 635 34588 Arunachal Pradesh 27273 0 45455 0 0 72727 Assam 977 2388 563 40 1253 5220 Bihar 10 333 19 0 335 697 Chhattisgarh 671 46478 1639 23 355 49165 Delhi 1850 818 2130 197 333 5328 Goa 113115 24568 17316 2901 3319 161218 Gujarat 947 17931 196 213 1001 20288 Haryana 31231 44935 5282 202 4349 85998 Himachal Pradesh 3650 49199 2597 383 1853 57682 Jammu & Kashmir 808 8254 7549 903 1351 18864 Jharkhand 26 363 841 34 277 1541 Karnataka 23956 8919 4569 474 2555 40473 Kerala 2766 20669 2310 3311 17400 46456 Madhya Pradesh 2412 21863 20243 549 5069 50137 Maharashtra 1751 17249 9351 2167 2099 32619 Manipur 23 298 0 0 716 1036 Meghalaya 29 633 -1509 238 5989 5382 Mizoram 0 7386 0 0 2019 9405 Nagaland 0 720 0 0 802 1521 Orissa 136 19851 1217 229 2358 23790 Punjab 5668 40462 3447 659 2089 52325 Rajasthan 1537 7068 1433 80 737 10854 Sikkim 0 448 0 0 334 782 Tamil Nadu 28579 17736 3279 832 1299 51725 Tripura 9853 1750 88 12 505 12208 Uttaranchal 0 4166 618 677 321 5782 Uttar Pradesh 3882 24209 4933 380 3330 36734 West Bengal 8817 4845 3018 199 1845 18723 A & N Islands 123 1105 0 1474 2075 4777 Chandigarh 64167 177352 50907 4000 324510 620935 D & N Haveli 0 1220 0 37632 297354 336206 Daman & Diu 0 0 0 0 19 19 Lakshadweep 0 0 0 0 0 0 Pondicherry 0 859 907 178 161 2107 all-India 8273 15897 4791 844 2242 32047

NSS Report No. 525: Unorganised Manufacturing Sector in India, 2005-06: Employment, Assets and Borrowings. A - 144
Table 7 (continued): Net additions to owned fixed assets per enterprise (in Rs.) during the reference
year and annual rent payable per enterprise (in Rs.) by type of asset for each State/UTs Urban DME
annual rent payable (Rs.) on fixed assets per enterprise no. of enterprises State/UT Land &
building plant and
machinery transport
equipment software & hardware
tools and other fixed assets total estimated sample
(1) (8) (9) (10) (11) (12) (13) (14) (15) Andhra Pradesh 10567 146 346 0 1 11059 14366 178 Arunachal Pradesh 0 0 0 0 0 0 11 2 Assam 6848 0 0 0 0 6848 2143 43 Bihar 6507 0 0 0 0 6507 1692 43 Chhattisgarh 7690 278 0 0 0 7968 2821 47 Delhi 19165 3 0 0 9 19177 30979 229 Goa 9272 0 0 0 0 9272 539 17 Gujarat 8076 302 0 0 4 8381 53024 365 Haryana 9938 1859 12 0 2 11812 11656 312 Himachal Pradesh 57975 567 0 0 0 58542 593 55 Jammu & Kashmir 2874 371 0 0 0 3245 1272 83 Jharkhand 14083 0 0 0 296 14379 1248 32 Karnataka 22675 41 0 0 98 22814 21349 209 Kerala 13771 126 110 0 4 14012 11080 194 Madhya Pradesh 20110 75 339 0 0 20524 4857 189 Maharashtra 30896 11545 54 0 132 42628 93855 1101 Manipur 9371 0 0 0 0 9371 228 24 Meghalaya 13364 0 0 0 0 13364 179 16 Mizoram 11168 0 0 0 0 11168 63 12 Nagaland 51091 0 0 0 0 51091 68 11 Orissa 8978 411 242 0 25 9656 3406 80 Punjab 7513 9 19 0 31 7572 10686 315 Rajasthan 9809 173 29 0 0 10011 15609 330 Sikkim 17126 0 0 0 0 17126 28 10 Tamil Nadu 15048 287 2 0 27 15364 46236 530 Tripura 1603 0 0 0 0 1603 256 29 Uttaranchal 3264 0 0 0 0 3264 735 13 Uttar Pradesh 8923 215 8 0 3 9148 41561 561 West Bengal 7718 1051 28 0 16 8813 41238 466 A & N Islands 29158 0 0 0 0 29158 75 6 Chandigarh 190800 0 0 0 0 190800 15 12 D & N Haveli 0 0 0 0 0 0 6 5 Daman & Diu 30011 0 0 0 0 30011 28 2 Lakshadweep 20225 0 0 0 0 20225 4 2 Pondicherry 20132 5105 0 0 2552 27789 1448 18 all-India 16276 2915 39 0 52 19282 413355 5541

NSS Report No. 525: Unorganised Manufacturing Sector in India, 2005-06: Employment, Assets and Borrowings. A - 145
Table 7: Net additions to owned fixed assets per enterprise (in Rs.) during the reference
year and annual rent payable per enterprise (in Rs.) by type of asset for each State/UTs
Urban all enterprise type
net additions (Rs.) to owned fixed assets per enterprise during the reference year State/UT land &
building plant and
machinerytransport
equipment Software& hardware
tools and other fixed assets total
(1) (2) (3) (4) (5) (6) (7) Andhra Pradesh 2445 605 679 3 120 3852 Arunachal Pradesh 1415 0 1572 0 29 3017 Assam 144 293 33 3 211 685 Bihar 44 100 16 0 94 253 Chhattisgarh 471 5109 302 114 305 6301 Delhi 649 1244 712 65 472 3142 Goa 17808 4093 2180 276 1164 25520 Gujarat 243 3737 310 93 241 4625 Haryana 4379 5399 731 21 990 11521 Himachal Pradesh 592 5541 186 33 721 8129 Jammu & Kashmir 324 369 291 35 450 1469 Jharkhand 285 127 25 2 105 543 Karnataka 1813 810 511 35 224 3393 Kerala 386 2368 324 304 1362 4744 Madhya Pradesh 144 458 416 13 124 1156 Maharashtra 506 3159 3888 1341 944 9838 Manipur 14 34 0 0 133 199 Meghalaya 14 75 -109 17 585 582 Mizoram 417 432 2 0 293 1143 Nagaland 80 96 0 1 207 383 Orissa 220 870 57 9 179 1336 Punjab 1340 3402 377 63 400 5583 Rajasthan 362 568 98 5 90 1124 Sikkim 657 49 0 0 143 850 Tamil Nadu 2631 1698 503 76 231 5139 Tripura 1336 242 3 31 196 1810 Uttaranchal 134 305 34 33 143 648 Uttar Pradesh 690 1891 386 26 336 3331 West Bengal 884 535 276 22 263 1983 A & N Islands 21 352 9688 3854 2849 16764 Chandigarh 1526 4218 1211 95 7718 14769 D & N Haveli 0 43 0 1315 10388 11745 Daman & Diu 0 0 0 0 136 137 Lakshadweep 451 282 49 0 72 853 Pondicherry 6228 349 158 27 302 7064 all-India 1167 1711 799 196 372 4248

NSS Report No. 525: Unorganised Manufacturing Sector in India, 2005-06: Employment, Assets and Borrowings. A - 146
Table 7 (continued): Net additions to owned fixed assets per enterprise (in Rs.) during the reference
year and annual rent payable per enterprise (in Rs.) by type of asset for each State/UTs Urban all enterprise type
annual rent payable (Rs.) on fixed assets per enterprise no. of enterprises State/UT Land &
building plant and
machinery transport
equipment software & hardware
tools and other fixed assets total estimated sample
(1) (8) (9) (10) (11) (12) (13) (14) (15) Andhra Pradesh 2285 22 12 0 0 2318 447997 2707 Arunachal Pradesh 12712 64 0 0 0 12775 318 26 Assam 3689 40 0 0 1 3730 37774 831 Bihar 2065 0 0 0 0 2065 109018 1357 Chhattisgarh 2632 22 0 0 0 2655 34871 349 Delhi 11308 39 0 0 3 11350 93997 487 Goa 6035 6 0 0 3 6045 5762 114 Gujarat 2918 191 0 0 12 3121 353605 2162 Haryana 4564 232 66 0 1 4862 110423 1051 Himachal Pradesh 11025 48 0 0 0 11073 7005 492 Jammu & Kashmir 1900 17 0 0 1 1918 32944 1448 Jharkhand 2075 37 0 0 8 2121 45698 803 Karnataka 4204 116 0 0 15 4336 298549 1666 Kerala 2220 25 38 0 5 2288 165914 1454 Madhya Pradesh 1576 244 6 0 10 1836 290097 2138 Maharashtra 8898 2301 11 0 46 11255 570294 4477 Manipur 465 47 0 0 41 554 16721 719 Meghalaya 8901 141 0 0 15 9058 2474 156 Mizoram 3271 0 0 0 0 3271 1810 230 Nagaland 6976 26 0 0 0 7002 2739 268 Orissa 2221 17 10 0 1 2248 86352 1102 Punjab 3484 14 1 0 2 3502 143029 1895 Rajasthan 2647 85 2 0 2 2737 235595 2450 Sikkim 18308 9 217 0 0 18534 420 98 Tamil Nadu 3616 71 4 0 6 3697 631580 3403 Tripura 2247 10 0 2 0 2258 6470 539 Uttaranchal 3397 0 0 0 0 3397 15146 183 Uttar Pradesh 2349 45 3 0 1 2398 654859 4867 West Bengal 1265 136 2 0 5 1408 529025 2990 A & N Islands 14291 0 0 0 0 14291 444 38 Chandigarh 12537 0 0 0 0 12537 621 20 D & N Haveli 11018 0 0 0 0 11018 172 50 Daman & Diu 3266 0 0 0 0 3266 1175 80 Lakshadweep 1418 15 0 0 3 1437 142 53 Pondicherry 5862 793 0 0 389 7043 9513 144 all-India 3544 346 7 0 11 3908 4942554 40847

NSS Report No. 525: Unorganised Manufacturing Sector in India, 2005-06: Employment, Assets and Borrowings. A - 147
Table 7: Net additions to owned fixed assets per enterprise (in Rs.) during the reference
year and annual rent payable per enterprise (in Rs.) by type of asset for each State/UTs
Rural + Urban OAME
net additions (Rs.) to owned fixed assets per enterprise during the reference year State/UT land &
building plant and
machinerytransport
equipment Software& hardware
tools and other fixed assets total
(1) (2) (3) (4) (5) (6) (7) Andhra Pradesh 684 252 85 0 47 1068 Arunachal Pradesh 745 815 0 0 18 1578 Assam 55 19 3 0 45 123 Bihar 40 118 7 0 50 215 Chhattisgarh 142 64 1 20 60 286 Delhi 2 3 0 0 7 13 Goa 1382 628 0 0 98 2107 Gujarat 91 96 11 0 53 251 Haryana 787 453 96 0 547 1883 Himachal Pradesh 211 748 5 0 91 1055 Jammu & Kashmir 140 64 0 1 86 291 Jharkhand 8 21 0 0 11 41 Karnataka 133 108 44 0 19 304 Kerala 191 260 59 0 88 598 Madhya Pradesh 45 45 5 0 24 118 Maharashtra 205 227 28 5 36 500 Manipur 79 71 0 0 77 233 Meghalaya 10 7 0 0 8 25 Mizoram 148 93 1 0 77 319 Nagaland 53 9 0 0 120 181 Orissa 12 30 20 0 34 96 Punjab 24 180 73 1 73 352 Rajasthan 91 63 1 0 38 231 Sikkim 0 17 0 0 22 39 Tamil Nadu 196 110 102 2 40 450 Tripura 184 33 0 0 44 261 Uttaranchal 734 140 5 0 42 921 Uttar Pradesh 142 452 8 1 44 647 West Bengal 88 48 3 0 39 179 A & N Islands 82 349 0 0 201 632 Chandigarh 0 0 0 0 38 38 D & N Haveli 0 0 0 0 0 0 Daman & Diu 0 0 0 0 68 68 Lakshadweep 259 42 22 0 26 349 Pondicherry 0 116 2 0 135 254 all-India 171 164 28 1 47 414
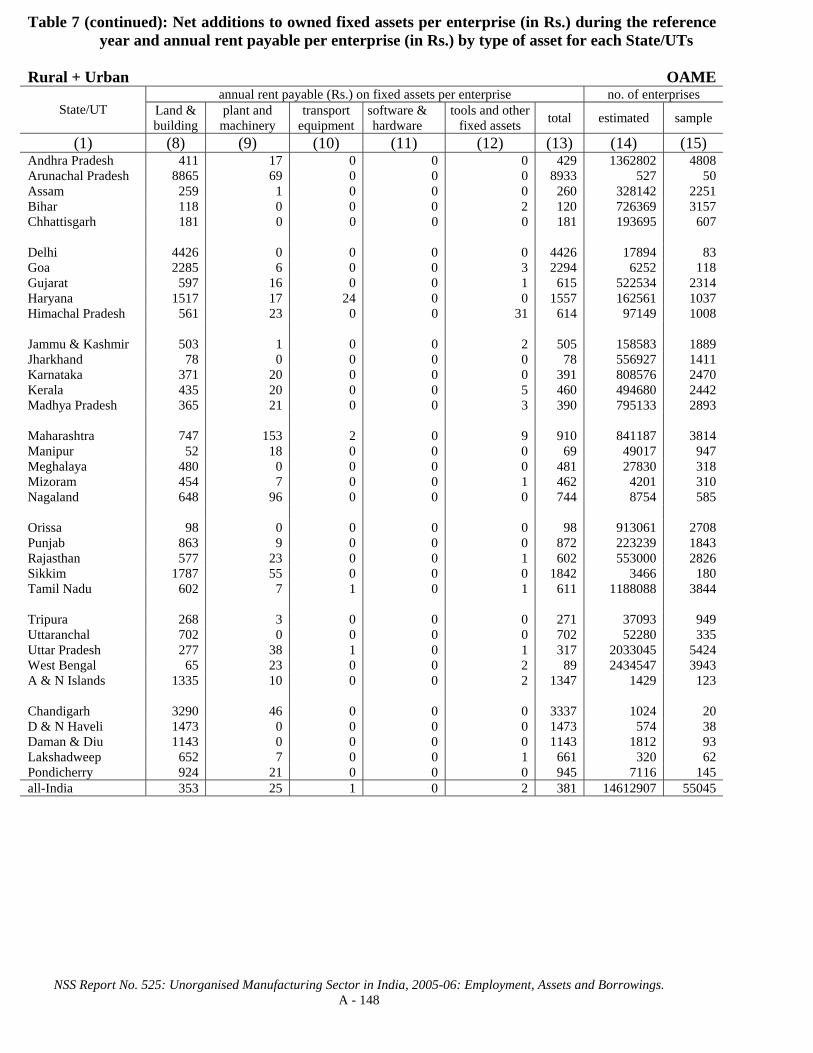
NSS Report No. 525: Unorganised Manufacturing Sector in India, 2005-06: Employment, Assets and Borrowings. A - 148
Table 7 (continued): Net additions to owned fixed assets per enterprise (in Rs.) during the reference
year and annual rent payable per enterprise (in Rs.) by type of asset for each State/UTs Rural + Urban OAME
annual rent payable (Rs.) on fixed assets per enterprise no. of enterprises State/UT Land &
building plant and
machinery transport
equipment software & hardware
tools and other fixed assets total estimated sample
(1) (8) (9) (10) (11) (12) (13) (14) (15) Andhra Pradesh 411 17 0 0 0 429 1362802 4808 Arunachal Pradesh 8865 69 0 0 0 8933 527 50 Assam 259 1 0 0 0 260 328142 2251 Bihar 118 0 0 0 2 120 726369 3157 Chhattisgarh 181 0 0 0 0 181 193695 607 Delhi 4426 0 0 0 0 4426 17894 83 Goa 2285 6 0 0 3 2294 6252 118 Gujarat 597 16 0 0 1 615 522534 2314 Haryana 1517 17 24 0 0 1557 162561 1037 Himachal Pradesh 561 23 0 0 31 614 97149 1008 Jammu & Kashmir 503 1 0 0 2 505 158583 1889 Jharkhand 78 0 0 0 0 78 556927 1411 Karnataka 371 20 0 0 0 391 808576 2470 Kerala 435 20 0 0 5 460 494680 2442 Madhya Pradesh 365 21 0 0 3 390 795133 2893 Maharashtra 747 153 2 0 9 910 841187 3814 Manipur 52 18 0 0 0 69 49017 947 Meghalaya 480 0 0 0 0 481 27830 318 Mizoram 454 7 0 0 1 462 4201 310 Nagaland 648 96 0 0 0 744 8754 585 Orissa 98 0 0 0 0 98 913061 2708 Punjab 863 9 0 0 0 872 223239 1843 Rajasthan 577 23 0 0 1 602 553000 2826 Sikkim 1787 55 0 0 0 1842 3466 180 Tamil Nadu 602 7 1 0 1 611 1188088 3844 Tripura 268 3 0 0 0 271 37093 949 Uttaranchal 702 0 0 0 0 702 52280 335 Uttar Pradesh 277 38 1 0 1 317 2033045 5424 West Bengal 65 23 0 0 2 89 2434547 3943 A & N Islands 1335 10 0 0 2 1347 1429 123 Chandigarh 3290 46 0 0 0 3337 1024 20 D & N Haveli 1473 0 0 0 0 1473 574 38 Daman & Diu 1143 0 0 0 0 1143 1812 93 Lakshadweep 652 7 0 0 1 661 320 62 Pondicherry 924 21 0 0 0 945 7116 145 all-India 353 25 1 0 2 381 14612907 55045

NSS Report No. 525: Unorganised Manufacturing Sector in India, 2005-06: Employment, Assets and Borrowings. A - 149
Table 7: Net additions to owned fixed assets per enterprise (in Rs.) during the reference
year and annual rent payable per enterprise (in Rs.) by type of asset for each State/UTs
Rural + Urban NDME
net additions (Rs.) to owned fixed assets per enterprise during the reference year State/UT land &
building plant and
machinerytransport
equipment Software& hardware
tools and other fixed assets total
(1) (2) (3) (4) (5) (6) (7) Andhra Pradesh 1731 1710 319 19 361 4140 Arunachal Pradesh 0 0 0 0 0 0 Assam 406 248 0 0 184 838 Bihar 61 288 40 0 134 523 Chhattisgarh 4 4383 599 0 402 5389 Delhi 77 1919 19 0 711 2727 Goa 14036 4207 1055 33 1585 20916 Gujarat 54 5079 1361 316 351 7161 Haryana 2826 9661 113 0 1030 13630 Himachal Pradesh 6 3832 10 0 982 5658 Jammu & Kashmir 594 104 0 0 918 1616 Jharkhand 434 135 0 2 128 699 Karnataka 205 1700 951 2 234 3092 Kerala 1949 2786 991 136 445 6308 Madhya Pradesh 519 230 445 24 222 1441 Maharashtra 609 1167 7723 3191 1970 14660 Manipur 85 15 0 0 336 436 Meghalaya 11 43 0 0 65 119 Mizoram 238 263 186 0 287 974 Nagaland 13 172 0 2 339 525 Orissa 1280 850 15 0 258 2402 Punjab 2275 795 104 147 651 3972 Rajasthan 602 365 14 1 180 1415 Sikkim 473 1623 0 0 382 2478 Tamil Nadu 1052 1164 459 46 312 3032 Tripura 902 164 0 26 182 1274 Uttaranchal 25734 5101 10 0 922 31766 Uttar Pradesh 729 1052 279 1 310 2371 West Bengal 556 536 113 11 309 1525 A & N Islands 60 465 6058 2254 2619 11455 Chandigarh 0 45 0 0 54 99 D & N Haveli 0 0 0 0 0 0 Daman & Diu 0 0 0 0 113 113 Lakshadweep 13 1699 0 0 114 1826 Pondicherry 13961 673 2558 0 560 17751 all-India 1145 1586 1098 352 526 4720

NSS Report No. 525: Unorganised Manufacturing Sector in India, 2005-06: Employment, Assets and Borrowings. A - 150
Table 7 (continued): Net additions to owned fixed assets per enterprise (in Rs.) during the reference
year and annual rent payable per enterprise (in Rs.) by type of asset for each State/UTs Rural + Urban NDME
annual rent payable (Rs.) on fixed assets per enterprise no. of enterprises State/UT Land &
building plant and
machinery transport
equipment software & hardware
tools and other fixed assets total estimated sample
(1) (8) (9) (10) (11) (12) (13) (14) (15) Andhra Pradesh 4626 187 2 0 3 4818 114958 1203 Arunachal Pradesh 6604 42 0 0 0 6645 310 47 Assam 2987 34 0 0 1 3021 38228 590 Bihar 3770 0 0 0 0 3770 43407 572 Chhattisgarh 4561 0 0 0 0 4561 9632 141 Delhi 8494 74 0 0 0 8568 47700 219 Goa 6082 0 0 0 0 6082 3059 81 Gujarat 5429 681 0 0 51 6160 68736 660 Haryana 5314 32 62 0 384 5792 52586 545 Himachal Pradesh 5666 18 0 0 0 5683 8927 322 Jammu & Kashmir 2148 0 0 0 0 2148 12474 511 Jharkhand 1850 53 0 0 0 1904 26829 313 Karnataka 7579 427 0 0 31 8037 81071 603 Kerala 3656 98 38 0 18 3810 133741 1298 Madhya Pradesh 5377 1228 0 0 36 6642 45067 482 Maharashtra 10319 626 0 0 39 10985 174625 1341 Manipur 2519 198 0 0 219 2936 3152 181 Meghalaya 3162 45 0 0 4 3211 7847 177 Mizoram 4596 10 0 0 4 4611 820 128 Nagaland 11796 0 0 0 0 11796 1078 94 Orissa 3221 61 0 0 0 3282 37330 397 Punjab 5816 57 0 0 16 5889 58142 811 Rajasthan 4611 201 0 0 4 4815 61608 839 Sikkim 14936 0 156 0 0 15092 583 64 Tamil Nadu 5459 177 7 0 25 5668 205965 1615 Tripura 1102 93 0 2 8 1204 7756 580 Uttaranchal 3998 0 0 0 0 3998 13906 182 Uttar Pradesh 3484 22 0 0 1 3507 258904 1968 West Bengal 1272 75 0 0 10 1358 245846 1787 A & N Islands 8494 0 0 0 0 8494 710 77 Chandigarh 21498 0 0 0 0 21498 303 16 D & N Haveli 9599 0 0 0 0 9599 345 57 Daman & Diu 9344 466 0 0 0 9811 320 42 Lakshadweep 792 0 0 0 0 792 71 17 Pondicherry 8936 173 0 0 0 9109 4245 100 all-India 4783 209 6 0 27 5025 1770282 18060

NSS Report No. 525: Unorganised Manufacturing Sector in India, 2005-06: Employment, Assets and Borrowings. A - 151
Table 7: Net additions to owned fixed assets per enterprise (in Rs.) during the reference
year and annual rent payable per enterprise (in Rs.) by type of asset for each State/UTs
Rural + Urban DME
net additions (Rs.) to owned fixed assets per enterprise during the reference year State/UT land &
building plant and
machinerytransport
equipment Software& hardware
tools and other fixed assets total
(1) (2) (3) (4) (5) (6) (7) Andhra Pradesh 5298 2680 3126 9 459 11571 Arunachal Pradesh 16348 3420 22878 0 3155 45801 Assam 33387 4123 17273 19 1126 55928 Bihar 39 288 46 0 258 631 Chhattisgarh 42067 241569 3996 4881 1613 294126 Delhi 1789 813 2060 201 323 5185 Goa 191240 164391 12063 11291 21159 400144 Gujarat 822 15189 170 189 1012 17383 Haryana 36132 57284 8491 387 4651 106945 Himachal Pradesh 12831 40298 10212 487 4239 68067 Jammu & Kashmir 453 5847 4078 487 1317 12183 Jharkhand 207 1242 847 21 232 2550 Karnataka 10440 7096 1429 160 1203 20329 Kerala 6976 13069 7931 1681 6963 36619 Madhya Pradesh 1072 8082 6961 186 2149 18450 Maharashtra 1648 19395 8415 2130 2323 33910 Manipur 15 1191 0 0 468 1675 Meghalaya 28 95 -207 33 821 770 Mizoram 0 6259 0 0 1577 7836 Nagaland 80 660 0 0 1406 2146 Orissa 764 14657 609 114 1722 17867 Punjab 7949 38499 6910 1206 2191 56756 Rajasthan 1310 5729 1373 66 595 9073 Sikkim 16348 3346 0 0 192 19886 Tamil Nadu 16573 12886 2127 449 914 32948 Tripura 8114 2689 1586 6 720 13114 Uttaranchal 100977 34478 5276 1682 4892 147305 Uttar Pradesh 3022 17807 3437 235 2898 27399 West Bengal 7933 4575 2158 172 1523 16362 A & N Islands 52 1644 241 628 2421 4987 Chandigarh 20627 57012 16365 1286 104318 199608 D & N Haveli 0 147 0 4527 35768 40442 Daman & Diu 25 0 0 0 13 38 Lakshadweep 103 0 0 0 1141 1244 Pondicherry 34972 5184 2899 550 972 44576 all-India 7819 14369 3776 654 1832 28449

NSS Report No. 525: Unorganised Manufacturing Sector in India, 2005-06: Employment, Assets and Borrowings. A - 152
Table 7 (continued): Net additions to owned fixed assets per enterprise (in Rs.) during the reference
year and annual rent payable per enterprise (in Rs.) by type of asset for each State/UTs Rural + Urban DME
annual rent payable (Rs.) on fixed assets per enterprise no. of enterprises State/UT Land &
building plant and
machinery transport
equipment software & hardware
tools and other fixed assets total estimated sample
(1) (8) (9) (10) (11) (12) (13) (14) (15) Andhra Pradesh 3456 1232 107 0 144 4939 55479 572
Arunachal Pradesh 33143 1053443 0 0 0 108658
6 22 5 Assam 4433 6 12 0 1 4452 4411 74 Bihar 11782 0 0 0 0 11782 2621 96 Chhattisgarh 7412 1785 0 0 0 9197 4153 129 Delhi 21876 3 0 0 9 21888 32041 256 Goa 6624 0 0 0 0 6624 997 62 Gujarat 8336 256 0 0 3 8596 63088 538 Haryana 12693 3118 41 0 2 15854 14963 587 Himachal Pradesh 46070 246 0 0 0 46316 1367 173 Jammu & Kashmir 67929 200 0 0 0 68130 2355 131 Jharkhand 8204 0 0 0 168 8372 2192 54 Karnataka 7114 18 7 0 29 7168 72113 363 Kerala 7078 384 40 0 17 7520 30271 396 Madhya Pradesh 7599 37 117 0 4 7757 14359 404 Maharashtra 27601 9939 48 0 112 37699 110650 1285 Manipur 7297 17 0 0 0 7314 349 34 Meghalaya 19477 0 0 0 0 19477 1310 49 Mizoram 8724 0 0 0 0 8724 80 15 Nagaland 47210 0 0 0 0 47210 75 14 Orissa 5547 205 121 0 12 5885 6838 187 Punjab 9731 1293 17 0 28 11069 11856 371 Rajasthan 8409 267 21 0 1 8698 21862 817 Sikkim 65344 99709 0 0 0 165053 54 18 Tamil Nadu 9518 451 20 0 21 10010 87880 1142 Tripura 35855 0 0 0 0 35855 521 77 Uttaranchal 7469 2972 100 21 306 10867 2902 43 Uttar Pradesh 7679 1781 5 0 8 9474 67426 853 West Bengal 5003 630 18 0 18 5668 72400 880 A & N Islands 16955 0 0 0 0 16955 177 19 Chandigarh 76363 0 0 0 0 76363 46 22 D & N Haveli 23954 0 0 0 0 23954 50 24 Daman & Diu 2271 416 0 0 0 2687 507 22 Lakshadweep 10992 0 0 0 0 10992 7 4 Pondicherry 27760 3344 93 0 1672 32869 2210 76 all-India 11676 2218 30 0 47 13971 687632 9792

NSS Report No. 525: Unorganised Manufacturing Sector in India, 2005-06: Employment, Assets and Borrowings. A - 153
Table 7: Net additions to owned fixed assets per enterprise (in Rs.) during the reference
year and annual rent payable per enterprise (in Rs.) by type of asset for each State/UTs
Rural + Urban all enterprise type
net additions (Rs.) to owned fixed assets per enterprise during the reference year State/UT land &
building plant and
machinerytransport
equipment Software& hardware
tools and other fixed assets total
(1) (2) (3) (4) (5) (6) (7) Andhra Pradesh 929 449 213 2 85 1678Arunachal Pradesh 873 587 582 0 91 2133Assam 488 91 208 0 72 860Bihar 42 128 9 0 55 234Chhattisgarh 974 5098 109 116 107 6404 Delhi 625 1205 685 66 455 3036Goa 23494 17523 1479 1101 2576 46173Gujarat 158 2075 168 51 177 2629Haryana 3552 6252 646 25 924 11399Himachal Pradesh 355 1507 135 6 218 2290 Jammu & Kashmir 177 145 55 7 163 548Jharkhand 28 31 3 0 18 80Karnataka 912 766 224 12 126 2040Kerala 860 1361 610 105 476 3413Madhya Pradesh 87 190 145 5 70 496 Maharashtra 409 2256 2044 707 560 5977Manipur 79 75 0 0 95 255Meghalaya 11 18 -7 1 49 71Mizoram 160 217 30 0 135 542Nagaland 48 31 0 0 154 234 Orissa 67 166 24 1 55 313Punjab 791 1851 356 79 273 3350Rajasthan 182 287 49 2 71 649Sikkim 282 289 0 0 76 647Tamil Nadu 1286 1014 271 34 130 2736 Tripura 397 86 18 5 76 582Uttaranchal 9976 2581 227 71 423 13278Uttar Pradesh 289 1014 136 7 155 1601West Bengal 336 210 70 6 103 725A & N Islands 73 483 1875 739 1112 4282 Chandigarh 690 1916 547 43 3528 6724D & N Haveli 0 8 0 233 1842 2083Daman & Diu 5 0 0 0 63 68Lakshadweep 212 338 17 0 60 628Pondicherry 10063 1116 1273 90 404 12946all-India 580 884 290 64 169 1989

NSS Report No. 525: Unorganised Manufacturing Sector in India, 2005-06: Employment, Assets and Borrowings. A - 154
Table 7 (continued): Net additions to owned fixed assets per enterprise (in Rs.) during the reference
year and annual rent payable per enterprise (in Rs.) by type of asset for each State/UTs Rural + Urban all enterprise type
annual rent payable (Rs.) on fixed assets per enterprise no. of enterprises State/UT Land &
building plant and
machinery transport
equipment software & hardware
tools and other fixed assets total estimated sample
(1) (8) (9) (10) (11) (12) (13) (14) (15) Andhra Pradesh 838 74 4 0 6 921 1533239 6583 Arunachal Pradesh 8666 26852 0 0 0 35518 859 102 Assam 590 4 0 0 0 594 370781 2915 Bihar 363 0 0 0 1 364 772397 3825 Chhattisgarh 529 36 0 0 0 565 207481 877 Delhi 12140 37 0 0 3 12180 97636 558 Goa 3831 4 0 0 2 3837 10308 261 Gujarat 1851 109 0 0 7 1967 654358 3512 Haryana 3111 222 34 0 88 3455 230110 2169 Himachal Pradesh 1564 25 0 0 28 1617 107442 1503 Jammu & Kashmir 1537 3 0 0 2 1542 173412 2531 Jharkhand 189 3 0 0 1 193 585948 1778 Karnataka 1484 54 0 0 5 1544 961761 3436 Kerala 1395 52 10 0 8 1464 658692 4136 Madhya Pradesh 751 85 2 0 5 844 854559 3779 Maharashtra 4868 1188 6 0 24 6086 1126462 6440 Manipur 248 29 0 0 13 290 52518 1162 Meghalaya 1722 9 0 0 1 1733 36987 544 Mizoram 1250 8 0 0 1 1259 5101 453 Nagaland 2211 85 0 0 0 2296 9906 693 Orissa 259 4 1 0 0 264 957229 3292 Punjab 2204 71 1 0 4 2279 293237 3025 Rajasthan 1237 49 1 0 1 1288 636470 4482 Sikkim 4492 1357 22 0 0 5870 4103 262 Tamil Nadu 1806 57 3 0 5 1871 1481933 6601 Tripura 819 18 0 0 1 839 45370 1606 Uttaranchal 1650 125 4 1 13 1792 69087 560 Uttar Pradesh 841 86 1 0 1 929 2359375 8245 West Bengal 302 43 0 0 3 349 2752793 6610 A & N Islands 4721 6 0 0 2 4728 2316 219 Chandigarh 9748 35 0 0 0 9783 1373 58 D & N Haveli 5524 0 0 0 0 5524 969 119 Daman & Diu 2354 137 0 0 0 2491 2639 157 Lakshadweep 848 5 0 0 1 854 397 83 Pondicherry 7801 610 15 0 272 8698 13572 321 all-India 1269 133 2 0 6 1410 17070820 82897
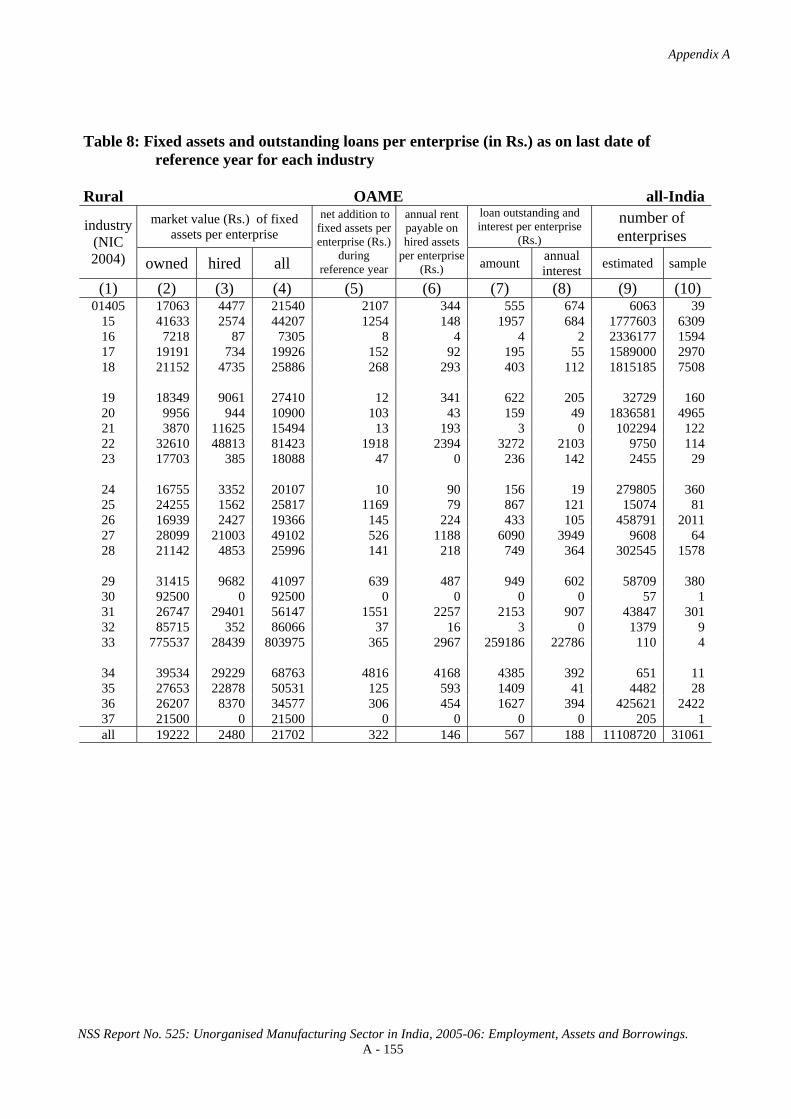
Appendix A
NSS Report No. 525: Unorganised Manufacturing Sector in India, 2005-06: Employment, Assets and Borrowings. A - 155
Table 8: Fixed assets and outstanding loans per enterprise (in Rs.) as on last date of reference year for each industry
Rural OAME all-India
market value (Rs.) of fixed assets per enterprise
loan outstanding and interest per enterprise
(Rs.)
number of enterprises
industry (NIC 2004) owned hired all
net addition to fixed assets per enterprise (Rs.)
during reference year
annual rent payable on hired assets
per enterprise (Rs.) amount annual
interest estimated sample
(1) (2) (3) (4) (5) (6) (7) (8) (9) (10) 01405 17063 4477 21540 2107 344 555 674 6063 39
15 41633 2574 44207 1254 148 1957 684 1777603 6309 16 7218 87 7305 8 4 4 2 2336177 1594 17 19191 734 19926 152 92 195 55 1589000 2970 18 21152 4735 25886 268 293 403 112 1815185 7508
19 18349 9061 27410 12 341 622 205 32729 160 20 9956 944 10900 103 43 159 49 1836581 4965 21 3870 11625 15494 13 193 3 0 102294 122 22 32610 48813 81423 1918 2394 3272 2103 9750 114 23 17703 385 18088 47 0 236 142 2455 29
24 16755 3352 20107 10 90 156 19 279805 360 25 24255 1562 25817 1169 79 867 121 15074 81 26 16939 2427 19366 145 224 433 105 458791 2011 27 28099 21003 49102 526 1188 6090 3949 9608 64 28 21142 4853 25996 141 218 749 364 302545 1578
29 31415 9682 41097 639 487 949 602 58709 380 30 92500 0 92500 0 0 0 0 57 1 31 26747 29401 56147 1551 2257 2153 907 43847 301 32 85715 352 86066 37 16 3 0 1379 9 33 775537 28439 803975 365 2967 259186 22786 110 4
34 39534 29229 68763 4816 4168 4385 392 651 11 35 27653 22878 50531 125 593 1409 41 4482 28 36 26207 8370 34577 306 454 1627 394 425621 2422 37 21500 0 21500 0 0 0 0 205 1 all 19222 2480 21702 322 146 567 188 11108720 31061

Appendix A
NSS Report No. 525: Unorganised Manufacturing Sector in India, 2005-06: Employment, Assets and Borrowings. A - 156
Table 8: Fixed assets and outstanding loans per enterprise (in Rs.) as on last date of
reference year for each industry Rural NDME all-India
market value (Rs.) of fixed assets per enterprise
loan outstanding and interest per enterprise
(Rs.)
number of enterprises
industry (NIC 2004) owned hired all
net addition to fixed assets per enterprise (Rs.)
during reference year
annual rent payable on hired assets
per enterprise (Rs.) amount annual
interest estimated sample
(1) (2) (3) (4) (5) (6) (7) (8) (9) (10) 01405 717343 8256 725599 1743 13 0 0 233 5
15 147097 21933 169030 4044 1212 12944 2272 185605 1576 16 50896 7127 58022 4 648 9318 2271 5199 50 17 98293 7464 105757 917 550 9275 1248 129161 547 18 36743 57297 94041 1716 3275 3871 691 124596 1110
19 56311 31379 87690 717 1541 7335 817 3164 34 20 90900 62948 153848 1522 1417 6406 1413 70010 674 21 81837 14143 95980 1291 754 12024 1364 1736 15 22 136695 107995 244690 3891 5415 37025 5038 5897 84 23 117544 50774 168318 2857 721 6784 1395 1756 15
24 112693 23914 136607 1766 1036 25648 4481 3943 89 25 355121 99712 454833 94328 5145 129901 16270 7104 89 26 99664 37152 136815 4143 4589 26621 4329 32220 366 27 96808 59813 156620 1197 4915 14559 4445 2598 46 28 137135 62621 199756 5084 3627 22386 2847 62155 685
29 222361 69122 291483 11702 3927 12966 1024 8017 139 30 - - - - - - - - 0 31 93053 82749 175802 1002 3882 32963 4398 7903 110 32 372736 66682 439418 348 2728 0 0 252 2 33 431062 0 431062 377538 0 162854 38540 1153 3
34 147563 96058 243620 3874 7979 25811 2404 1319 30 35 104371 58359 162730 7107 6625 20027 1787 1062 33 36 64276 34976 99252 1869 1608 14586 2491 89891 1028 37 36588 53070 89659 24376 6603 15464 1742 293 8 all 103132 37691 140823 4129 2012 13536 2140 745269 6738

Appendix A
NSS Report No. 525: Unorganised Manufacturing Sector in India, 2005-06: Employment, Assets and Borrowings. A - 157
Table 8: Fixed assets and outstanding loans per enterprise (in Rs.) as on last date of
reference year for each industry Rural DME all-India
market value (Rs.) of fixed assets per enterprise
loan outstanding and interest per enterprise
(Rs.)
number of enterprises industry
(NIC 2004) owned hired all
net addition to fixed
assets per enterprise
(Rs.) during reference
year
annual rent payable on hired assets
per enterprise (Rs.) amount annual
interest estimated sample
(1) (2) (3) (4) (5) (6) (7) (8) (9) (10) 01405 1781513 96641 1878154 14131 171864 263628 189555 284 19
15 289753 22499 312252 10773 3433 138649 17670 112057 772 16 279923 284815 564738 3662 73444 41052 40737 1277 25 17 384103 22759 406862 17735 1702 71145 8776 47378 460 18 260422 146523 406945 17146 14113 63865 5822 3780 63
19 108980 55797 164777 1115 5089 32547 13698 2462 23 20 697039 79058 776097 4452 6920 124019 34155 7962 200 21 429596 70899 500495 25473 3679 380495 50249 2262 47 22 1937888 49157 1987045 3730 2445 65189 14160 1943 28 23 1504376 180825 1685201 19075 3428 603188 113525 638 20
24 525246 58672 583918 18589 3835 183186 37847 13570 270 25 880731 338102 1218833 108062 12449 666922 64696 3215 150 26 435584 92514 528098 16047 14432 121894 28013 45046 1472 27 3008760 153036 3161796 863469 20489 2626463 379893 1315 76 28 468284 117893 586177 68815 6672 147957 56676 5078 222
29 1296221 78783 1375004 268644 4190 344110 25913 1493 61 30 - - - - - - - - 0 31 2673748 165851 2839599 148288 5089 1614820 166953 726 49 32 1443728 92878 1536607 103742 5573 1905963 71958 458 2 33 302902 124854 427756 11434 5188 296381 20926 66 8
34 402296 4469 406765 128792 607 130202 9666 4420 32 35 471615 572807 1044422 26 63547 237327 13341 137 21 36 163398 67491 230889 6607 3522 31700 4521 18546 226 37 974132 23657 997789 147047 1670 11292 4065 164 5 all 399359 51683 451042 23028 5968 145171 22375 274277 4251

Appendix A
NSS Report No. 525: Unorganised Manufacturing Sector in India, 2005-06: Employment, Assets and Borrowings. A - 158
Table 8: Fixed assets and outstanding loans per enterprise (in Rs.) as on last date of
reference year for each industry Rural all enterprise type all-India
market value (Rs.) of fixed assets per enterprise
loan outstanding and interest per enterprise
(Rs.)
number of enterprises
industry (NIC 2004) owned hired all
net addition to fixed assets per enterprise (Rs.)
during reference year
annual rent payable on hired assets
per enterprise (Rs.) amount annual
interest estimated sample
(1) (2) (3) (4) (5) (6) (7) (8) (9) (10) 01405 118015 8586 126601 2613 7731 11882 8797 6580 63
15 64463 5381 69845 2018 420 10320 1743 2075265 8657 16 7464 258 7722 10 45 47 30 2342653 1669 17 34770 1818 36588 680 169 2763 376 1765539 3977 18 22617 8380 30997 393 511 749 160 1943561 8681
19 27299 13903 41202 141 744 3225 1122 38355 217 20 15773 3537 19310 173 121 903 241 1914554 5839 21 14202 12927 27129 575 276 8296 1092 106292 184 22 278000 68692 346692 2779 3413 21428 4419 17590 226 23 249552 42384 291936 3570 712 81974 15520 4849 64
24 41235 6149 47384 881 273 8848 1804 297318 719 25 225259 71631 296890 40765 3062 121296 12815 25394 320 26 57091 12085 69176 1721 1680 12214 2704 536056 3849 27 331104 41297 372401 84557 3781 262489 40597 13520 186 28 46780 16116 62895 1915 880 6407 1555 369778 2485
29 81542 18180 99722 7805 972 9873 1206 68219 580 30 92500 0 92500 0 0 0 0 57 1 31 73363 39323 112686 3499 2541 29110 3731 52476 460 32 418078 28639 446718 22812 1562 417878 15777 2088 13 33 453250 8572 461822 328039 504 177488 36357 1330 15
34 312745 25895 338640 90374 2491 95832 7222 6390 73 35 52671 42737 95408 1428 3235 10563 687 5681 82 36 37379 14901 52280 788 755 4852 890 534059 3676 37 264207 29370 293576 47230 3339 9647 1779 662 14 all 32975 5757 38732 1069 392 4634 809 12128266 42050

Appendix A
NSS Report No. 525: Unorganised Manufacturing Sector in India, 2005-06: Employment, Assets and Borrowings. A - 159
Table 8: Fixed assets and outstanding loans per enterprise (in Rs.) as on last date of
reference year for each industry Urban OAME all-India
market value (Rs.) of fixed assets per enterprise
loan outstanding and interest per enterprise
(Rs.)
number of enterprises
industry (NIC 2004) owned hired all
net addition to fixed assets per enterprise (Rs.)
during reference year
annual rent payable on hired assets
per enterprise (Rs.) amount annual
interest estimated sample
(1) (2) (3) (4) (5) (6) (7) (8) (9) (10) 01405 64968 41022 105989 3692 2341 4291 1970 1671 33
15 66054 31506 97559 982 1929 3011 693 346262 3111 16 22516 7519 30035 26 264 2 0 468361 1244 17 39333 9854 49187 871 368 967 174 587131 2772 18 28260 27498 55759 288 1171 575 133 1020685 7703
19 32636 44861 77497 132 1813 2430 227 58191 331 20 35823 8611 44435 98 468 1501 243 159382 1330 21 25385 11722 37106 24 801 260 38 45637 340 22 83908 97756 181664 1968 3437 6573 1275 44652 478 23 222087 4157 226244 502 200 14298 41177 656 6
24 16316 4807 21123 141 319 591 81 105788 400 25 48296 54208 102504 312 2947 1427 194 15190 142 26 48025 14775 62800 413 478 1204 532 68437 681 27 59672 38291 97962 56 2049 688 230 9380 137 28 86720 55421 142141 352 2324 1621 479 84071 874
29 199969 80135 280104 8117 3040 18884 2511 37355 395 30 40000 25000 65000 0 3000 3000 1200 98 1 31 62998 83344 146343 1221 3928 3737 599 27359 373 32 40458 40836 81294 66 2544 664 0 921 16 33 179116 111564 290680 100 3562 13597 1803 3796 43
34 90311 72384 162694 28 4549 0 0 907 15 35 44537 33137 77674 374 2533 5304 1035 5018 65 36 59641 48177 107817 1888 1914 11052 1442 411325 3481 37 72881 128177 201058 650 1782 2375 83 1913 13 all 41839 25863 67702 705 1127 2468 407 3504186 23984

Appendix A
NSS Report No. 525: Unorganised Manufacturing Sector in India, 2005-06: Employment, Assets and Borrowings. A - 160
Table 8: Fixed assets and outstanding loans per enterprise (in Rs.) as on last date of
reference year for each industry Urban NDME all-India
market value (Rs.) of fixed assets per enterprise
loan outstanding and interest per enterprise
(Rs.)
number of enterprises
industry (NIC 2004) owned hired all
net addition to fixed assets per enterprise (Rs.)
during reference year
annual rent payable on hired assets
per enterprise (Rs.) amount annual
interest estimated sample
(1) (2) (3) (4) (5) (6) (7) (8) (9) (10) 01405 416296 114901 531196 354 5188 1422 158 783 13
15 224099 111144 335242 3836 5713 16148 4708 149611 1816 16 49838 14521 64359 13 788 639 7 6093 27 17 194425 88260 282685 4648 4769 15028 1592 115782 770 18 74021 138047 212067 2423 7583 4646 734 201087 2461
19 108293 132475 240767 4156 6807 4958 540 31626 232 20 230430 95667 326097 2278 5529 13266 2808 53423 612 21 242830 170540 413370 901 6768 11684 1099 11199 99 22 223361 207853 431214 6815 10943 31453 5709 39961 573 23 421410 24719 446129 428 2432 45333 4080 185 3
24 126749 146610 273359 1229 3685 25907 1870 5039 84 25 270168 241628 511797 9158 12855 29000 4156 18807 201 26 258657 102887 361544 1741 4980 17888 2592 24866 263 27 360376 122418 482794 1316 5638 28855 2644 7454 124 28 228392 148315 376708 1934 9173 26007 3272 122074 1219
29 267182 234238 501420 3024 11050 48986 6585 44052 429 30 25552 586366 611918 0 13275 47392 1272 533 6 31 171344 251622 422965 1722 12763 11333 1202 23638 325 32 118668 89992 208660 -99 9958 1318 321 1032 14 33 149792 339209 489002 8203 12279 33720 3447 3263 41
34 209157 119492 328649 5260 8095 31970 25835 5459 75 35 353892 125668 479560 4178 11451 20108 7539 5015 87 36 204626 145203 349828 15812 6043 235397 27320 153350 1834 37 145415 117361 262776 1127 14981 111877 16300 684 14 all 187870 139094 326964 5150 7215 49638 6562 1025013 11322

Appendix A
NSS Report No. 525: Unorganised Manufacturing Sector in India, 2005-06: Employment, Assets and Borrowings. A - 161
Table 8: Fixed assets and outstanding loans per enterprise (in Rs.) as on last date of
reference year for each industry Urban DME all-India
market value (Rs.) of fixed assets per enterprise
loan outstanding and interest per enterprise
(Rs.)
number of enterprises industry
(NIC 2004) owned hired all
net addition to fixed
assets per enterprise
(Rs.) during reference
year
annual rent payable on hired assets
per enterprise (Rs.) amount annual
interest estimated sample
(1) (2) (3) (4) (5) (6) (7) (8) (9) (10) 01405 4507022 99075 4606098 24632 23075 1512540 209525 97 10
15 796586 263388 1059974 39255 13037 327126 44093 31669 995 16 328681 296105 624787 4915 9932 98637 12321 1043 27 17 587296 204083 791380 9131 21122 78883 9029 99361 709 18 225316 293860 519176 8250 18610 145115 14171 48537 357
19 173677 248135 421813 15441 15165 66875 9846 15853 153 20 542889 297035 839923 37312 8676 187590 31856 10912 158 21 709209 770096 1479305 45118 19861 360709 33139 4951 119 22 1168045 750975 1919020 198593 44613 605153 47909 15712 272 23 314718 194636 509354 27198 6117 425527 54612 196 15
24 726558 319150 1045708 27813 27072 366976 51276 10065 256 25 782467 464061 1246528 35257 30074 287051 26132 12920 250 26 1113927 250628 1364555 61176 14545 235558 26686 12459 188 27 1627511 355792 1983302 33257 40222 418203 117679 4779 142 28 706576 273839 980415 33858 13621 307053 93443 43951 525
29 835279 235345 1070624 70374 19497 188397 26714 24641 330 30 1174132 973078 2147210 115447 157029 5673074 406384 211 11 31 551087 420572 971660 21619 21251 357159 28082 7317 279 32 305960 1254216 1560175 23313 23757 151145 14678 1704 37 33 763681 391721 1155402 39956 10140 317482 31547 1178 45
34 838233 258584 1096817 63577 17515 254029 26940 2504 92 35 1273571 88507 1362077 84009 4512 71943 6449 9389 89 36 323959 536412 860371 11083 17778 415613 37448 53273 470 37 303449 638661 942110 1277 30360 194718 25012 632 12 all 614061 324736 938797 32047 19282 238215 32543 413355 5541

Appendix A
NSS Report No. 525: Unorganised Manufacturing Sector in India, 2005-06: Employment, Assets and Borrowings. A - 162
Table 8: Fixed assets and outstanding loans per enterprise (in Rs.) as on last date of
reference year for each industry Urban all enterprise type all-India
market value (Rs.) of fixed assets per enterprise
loan outstanding and interest per enterprise
(Rs.)
number of enterprises
industry (NIC 2004) owned hired all
net addition to fixed assets per enterprise (Rs.)
during reference year
annual rent payable on hired assets
per enterprise (Rs.) amount annual
interest estimated sample
(1) (2) (3) (4) (5) (6) (7) (8) (9) (10) 01405 342232 65912 408144 3466 4005 60939 9330 2551 56
15 154730 68011 222741 4089 3669 26194 4437 527542 5922 16 23538 8242 31780 37 292 227 27 475497 1298 17 129581 45224 174805 2439 3574 12646 1475 802274 4251 18 43033 55175 98208 930 2853 6742 764 1270308 10521
19 76439 101579 178017 3633 5311 12855 1763 105669 716 20 107027 43468 150495 2433 2077 13387 2397 223716 2100 21 119597 101282 220879 3797 3410 31216 2883 61787 558 22 309238 243908 553146 34691 12875 110225 10344 100324 1323 23 275170 43829 318999 5535 1716 97564 37096 1037 24
24 80053 36889 116942 2491 2687 32151 4418 120892 740 25 339410 242201 581611 13481 14389 91135 8925 46917 593 26 223117 63276 286393 7883 3194 32735 4098 105762 1132 27 510066 137511 647577 7832 11728 102726 27033 21613 403 28 264803 139147 403950 7012 7653 67200 18179 250097 2618
29 375509 180213 555722 20467 10192 70776 9827 106048 1154 30 315317 617927 933245 28956 48133 1453224 102872 842 18 31 168157 193869 362026 3983 9683 51160 4292 58314 977 32 186237 620080 806316 10851 14520 70965 6930 3656 67 33 251111 241814 492925 9011 7956 65033 6708 8237 129
34 374589 153939 528528 21188 10392 91387 23504 8870 182 35 718561 83797 802357 41787 5793 41341 5332 19421 241 36 118407 114345 232752 6136 4306 101602 10968 617948 5785 37 133374 225800 359173 874 10171 63217 8398 3229 39 all 119980 74341 194321 4248 3908 31966 4371 4942554 40847

Appendix A
NSS Report No. 525: Unorganised Manufacturing Sector in India, 2005-06: Employment, Assets and Borrowings. A - 163
Table 8: Fixed assets and outstanding loans per enterprise (in Rs.) as on last date of
reference year for each industry Rural + Urban OAME all-India
market value (Rs.) of fixed assets per enterprise
loan outstanding and interest per enterprise
(Rs.)
number of enterprises
industry (NIC 2004) owned hired all
net addition to fixed assets per enterprise (Rs.)
during reference year
annual rent payable on hired assets
per enterprise (Rs.) amount annual
interest estimated sample
(1) (2) (3) (4) (5) (6) (7) (8) (9) (10) 01405 27414 12373 39787 2450 776 1362 954 7734 72
15 45615 7291 52905 1210 438 2129 686 2123865 9420 16 9773 1328 11101 11 47 3 2 2804538 2838 17 24626 3195 27820 346 167 403 87 2176131 5742 18 23710 12928 36638 275 609 465 119 2835870 15211
19 27493 31974 59467 88 1283 1779 219 90919 491 20 12021 1557 13578 103 76 266 64 1995963 6295 21 10507 11655 22162 16 381 83 12 147931 462 22 74714 88985 163699 1959 3250 5981 1423 54402 592 23 60809 1180 61989 143 42 3202 8796 3111 35
24 16635 3751 20386 46 153 276 36 385593 760 25 36322 27985 64307 739 1518 1148 157 30264 223 26 20974 4030 25004 180 257 533 161 527228 2692 27 43696 29543 73240 294 1613 3421 2112 18988 201 28 35403 15849 51252 187 676 938 389 386616 2452
29 96959 37079 134037 3547 1480 7923 1344 96064 775 30 59364 15779 75143 0 1894 1894 757 155 2 31 40675 50127 90802 1424 2899 2762 789 71207 674 32 67589 16566 84155 49 1029 268 0 2300 25 33 195950 109218 305168 108 3545 20529 2395 3906 47
34 69091 54350 123441 2029 4390 1832 164 1559 26 35 36571 28296 64867 257 1618 3466 566 9500 93 36 42638 27933 70571 1083 1172 6259 909 836946 5903 37 67914 115784 183697 587 1610 2145 75 2118 14 all 24646 8088 32733 414 381 1023 240 14612907 55045

Appendix A
NSS Report No. 525: Unorganised Manufacturing Sector in India, 2005-06: Employment, Assets and Borrowings. A - 164
Table 8: Fixed assets and outstanding loans per enterprise (in Rs.) as on last date of
reference year for each industry Rural + Urban NDME all-India
market value (Rs.) of fixed assets per enterprise
loan outstanding and interest per enterprise
(Rs.)
number of enterprises
industry (NIC 2004) owned hired all
net addition to fixed assets per enterprise (Rs.)
during reference year
annual rent payable on hired assets
per enterprise (Rs.) amount annual
interest estimated sample
(1) (2) (3) (4) (5) (6) (7) (8) (9) (10) 01405 485435 90408 575843 673 3999 1096 122 1017 18
15 181464 61749 243213 3951 3221 14374 3359 335216 3392 16 50325 11117 61442 9 724 4635 1049 11292 77 17 143734 45656 189389 2681 2544 11994 1411 244943 1317 18 59760 107154 166914 2153 5935 4349 718 325683 3571
19 103565 123281 226845 3844 6329 5174 565 34790 266 20 151289 77109 228398 1849 3197 9375 2017 123433 1286 21 221221 149548 370769 953 5961 11729 1135 12935 114 22 212216 195011 407227 6439 10232 32170 5623 45858 657 23 146524 48289 194813 2626 885 10460 1651 1941 18
24 120578 92746 213325 1465 2522 25793 3016 8982 173 25 293461 202718 496178 32510 10741 56665 7477 25911 290 26 168920 65785 234705 3097 4759 22817 3573 57086 629 27 292255 106237 398492 1285 5452 25160 3109 10051 170 28 197604 119404 317008 2996 7302 24785 3129 184229 1904
29 260281 208814 469095 4360 9954 43440 5729 52069 568 30 25552 586366 611918 0 13275 47392 1272 533 6 31 151728 209310 361038 1541 10538 16753 2003 31540 435 32 168531 85417 253948 -11 8539 1060 258 1284 16 33 223236 250636 473873 104642 9073 67439 12610 4416 44
34 197173 114933 312106 4991 8073 30772 21276 6777 105 35 310289 113906 424195 4690 10608 20093 6534 6077 120 36 152758 104468 257226 10659 4404 153795 18144 243241 2862 37 112757 98068 210825 8104 12467 82944 11932 977 22 all 152196 96405 248601 4720 5025 34440 4701 1770282 18060
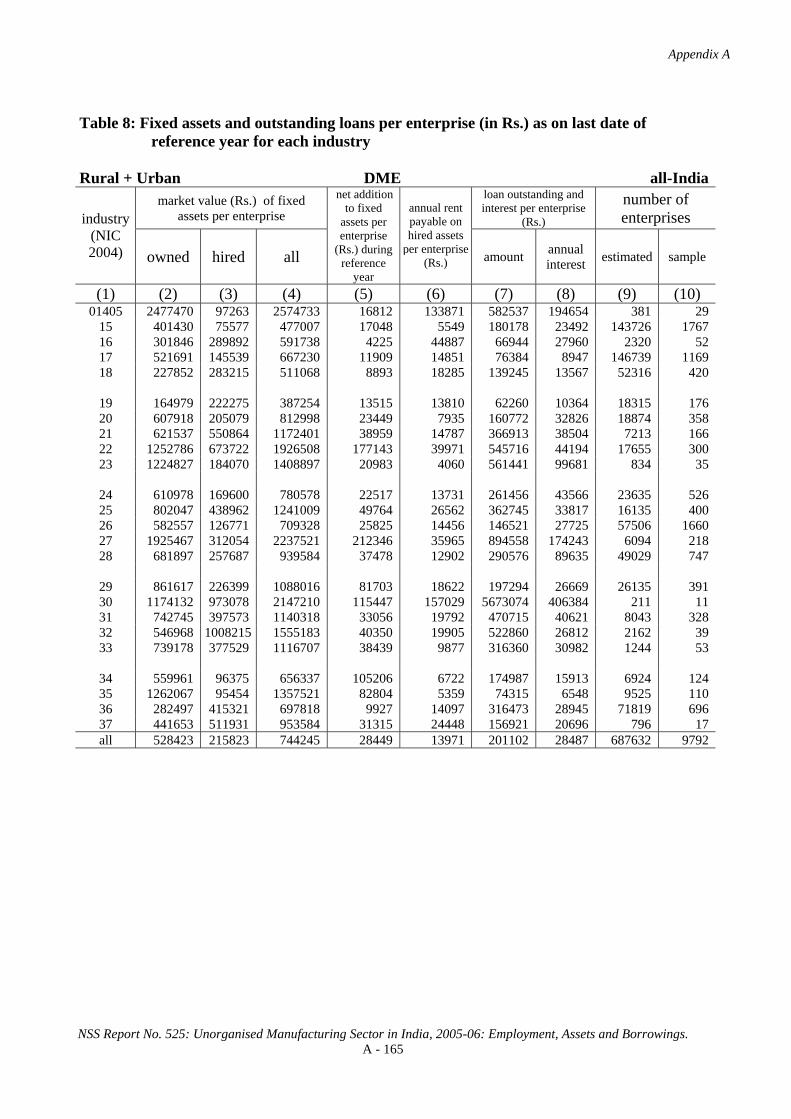
Appendix A
NSS Report No. 525: Unorganised Manufacturing Sector in India, 2005-06: Employment, Assets and Borrowings. A - 165
Table 8: Fixed assets and outstanding loans per enterprise (in Rs.) as on last date of
reference year for each industry Rural + Urban DME all-India
market value (Rs.) of fixed assets per enterprise
loan outstanding and interest per enterprise
(Rs.)
number of enterprises industry
(NIC 2004) owned hired all
net addition to fixed
assets per enterprise
(Rs.) during reference
year
annual rent payable on hired assets
per enterprise (Rs.) amount annual
interest estimated sample
(1) (2) (3) (4) (5) (6) (7) (8) (9) (10) 01405 2477470 97263 2574733 16812 133871 582537 194654 381 29
15 401430 75577 477007 17048 5549 180178 23492 143726 1767 16 301846 289892 591738 4225 44887 66944 27960 2320 52 17 521691 145539 667230 11909 14851 76384 8947 146739 1169 18 227852 283215 511068 8893 18285 139245 13567 52316 420
19 164979 222275 387254 13515 13810 62260 10364 18315 176 20 607918 205079 812998 23449 7935 160772 32826 18874 358 21 621537 550864 1172401 38959 14787 366913 38504 7213 166 22 1252786 673722 1926508 177143 39971 545716 44194 17655 300 23 1224827 184070 1408897 20983 4060 561441 99681 834 35
24 610978 169600 780578 22517 13731 261456 43566 23635 526 25 802047 438962 1241009 49764 26562 362745 33817 16135 400 26 582557 126771 709328 25825 14456 146521 27725 57506 1660 27 1925467 312054 2237521 212346 35965 894558 174243 6094 218 28 681897 257687 939584 37478 12902 290576 89635 49029 747
29 861617 226399 1088016 81703 18622 197294 26669 26135 391 30 1174132 973078 2147210 115447 157029 5673074 406384 211 11 31 742745 397573 1140318 33056 19792 470715 40621 8043 328 32 546968 1008215 1555183 40350 19905 522860 26812 2162 39 33 739178 377529 1116707 38439 9877 316360 30982 1244 53
34 559961 96375 656337 105206 6722 174987 15913 6924 124 35 1262067 95454 1357521 82804 5359 74315 6548 9525 110 36 282497 415321 697818 9927 14097 316473 28945 71819 696 37 441653 511931 953584 31315 24448 156921 20696 796 17 all 528423 215823 744245 28449 13971 201102 28487 687632 9792

Appendix A
NSS Report No. 525: Unorganised Manufacturing Sector in India, 2005-06: Employment, Assets and Borrowings. A - 166
Table 8: Fixed assets and outstanding loans per enterprise (in Rs.) as on last date of
reference year for each industry Rural + Urban all enterprise type all-India
market value (Rs.) of fixed assets per enterprise
loan outstanding and interest per enterprise
(Rs.)
number of enterprises
industry (NIC 2004) owned hired all
net addition to fixed assets per enterprise (Rs.)
during reference year
annual rent payable on hired assets
per enterprise (Rs.) amount annual
interest estimated sample
(1) (2) (3) (4) (5) (6) (7) (8) (9) (10) 01405 180666 24604 205269 2851 6690 25590 8946 9131 119
15 82759 18075 100834 2437 1079 13538 2289 2602807 14579 16 10176 1605 11781 14 87 77 29 2818150 2967 17 64392 15379 79772 1230 1233 5851 720 2567813 8228 18 30686 26876 57563 605 1437 3118 399 3213869 19202
19 63352 78230 141582 2703 4095 10290 1593 144025 933 20 25320 7714 33035 410 326 2209 466 2138270 7939 21 52946 45407 98353 1759 1428 16722 1750 168080 742 22 304578 217770 522347 29931 11464 96979 9460 117915 1549 23 254066 42639 296705 3916 889 84722 19322 5886 88
24 52456 15035 67492 1347 971 15584 2560 418210 1459 25 299323 182301 481624 23063 10411 101726 10291 72311 913 26 84450 20520 104970 2737 1929 15595 2934 641819 4981 27 441197 100486 541683 37358 8670 164206 32253 35133 589 28 134744 65755 200499 3972 3612 30935 8262 619875 5103
29 260432 116783 377215 15511 6583 46935 6452 174268 1734 30 301109 578523 879632 27109 45064 1360555 96312 899 19 31 123257 120667 243925 3754 6300 40716 4026 110790 1437 32 270518 405074 675592 15199 9809 197078 10146 5745 80 33 279204 209399 488602 53348 6920 80662 10829 9567 144
34 348694 100325 449018 50157 7084 93249 16686 15260 255 35 567863 74504 642367 32653 5214 34376 4281 25102 323 36 80843 68244 149087 3657 2660 56750 6296 1152007 9461 37 155635 192377 348012 8761 9009 54102 7272 3892 53 all 58166 25614 83780 1989 1410 12548 1840 17070820 82897
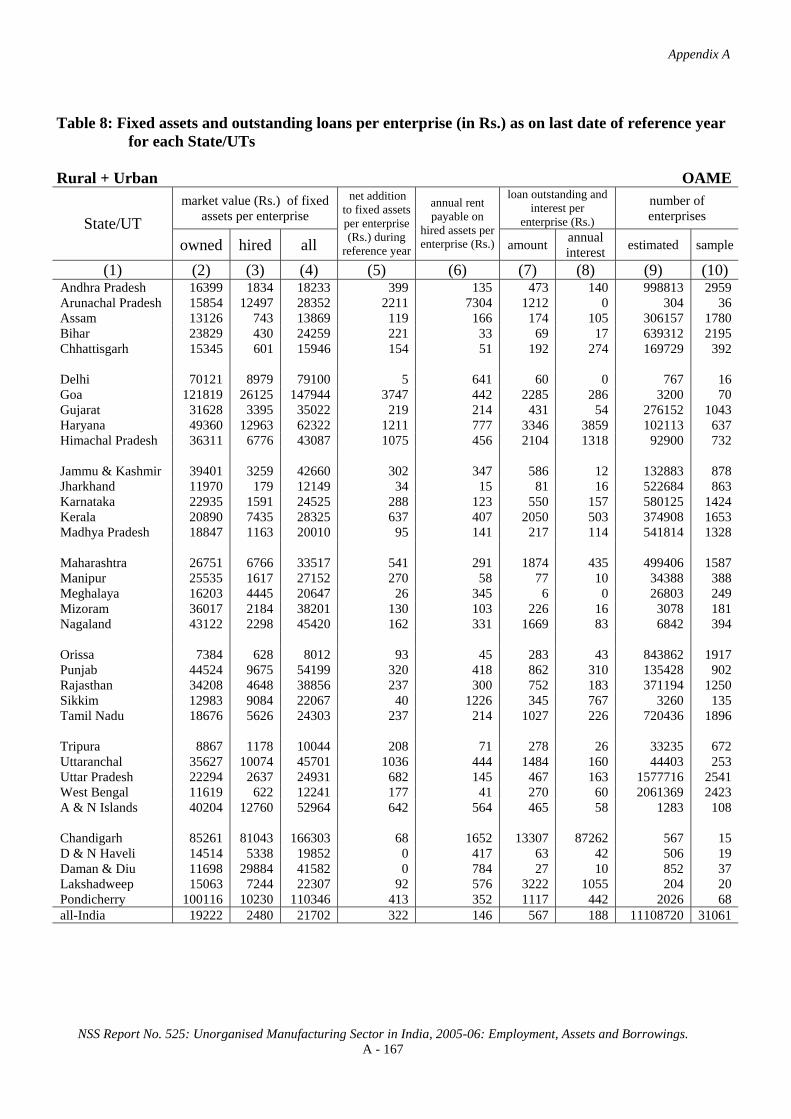
Appendix A
NSS Report No. 525: Unorganised Manufacturing Sector in India, 2005-06: Employment, Assets and Borrowings. A - 167
Table 8: Fixed assets and outstanding loans per enterprise (in Rs.) as on last date of reference year
for each State/UTs Rural + Urban OAME
market value (Rs.) of fixed assets per enterprise
loan outstanding and interest per
enterprise (Rs.)
number of enterprises State/UT
owned hired all
net addition to fixed assets per enterprise (Rs.) during
reference year
annual rent payable on
hired assets per enterprise (Rs.) amount annual
interest estimated sample
(1) (2) (3) (4) (5) (6) (7) (8) (9) (10) Andhra Pradesh 16399 1834 18233 399 135 473 140 998813 2959 Arunachal Pradesh 15854 12497 28352 2211 7304 1212 0 304 36 Assam 13126 743 13869 119 166 174 105 306157 1780 Bihar 23829 430 24259 221 33 69 17 639312 2195 Chhattisgarh 15345 601 15946 154 51 192 274 169729 392 Delhi 70121 8979 79100 5 641 60 0 767 16 Goa 121819 26125 147944 3747 442 2285 286 3200 70 Gujarat 31628 3395 35022 219 214 431 54 276152 1043 Haryana 49360 12963 62322 1211 777 3346 3859 102113 637 Himachal Pradesh 36311 6776 43087 1075 456 2104 1318 92900 732 Jammu & Kashmir 39401 3259 42660 302 347 586 12 132883 878 Jharkhand 11970 179 12149 34 15 81 16 522684 863 Karnataka 22935 1591 24525 288 123 550 157 580125 1424 Kerala 20890 7435 28325 637 407 2050 503 374908 1653 Madhya Pradesh 18847 1163 20010 95 141 217 114 541814 1328 Maharashtra 26751 6766 33517 541 291 1874 435 499406 1587 Manipur 25535 1617 27152 270 58 77 10 34388 388 Meghalaya 16203 4445 20647 26 345 6 0 26803 249 Mizoram 36017 2184 38201 130 103 226 16 3078 181 Nagaland 43122 2298 45420 162 331 1669 83 6842 394 Orissa 7384 628 8012 93 45 283 43 843862 1917 Punjab 44524 9675 54199 320 418 862 310 135428 902 Rajasthan 34208 4648 38856 237 300 752 183 371194 1250 Sikkim 12983 9084 22067 40 1226 345 767 3260 135 Tamil Nadu 18676 5626 24303 237 214 1027 226 720436 1896 Tripura 8867 1178 10044 208 71 278 26 33235 672 Uttaranchal 35627 10074 45701 1036 444 1484 160 44403 253 Uttar Pradesh 22294 2637 24931 682 145 467 163 1577716 2541 West Bengal 11619 622 12241 177 41 270 60 2061369 2423 A & N Islands 40204 12760 52964 642 564 465 58 1283 108 Chandigarh 85261 81043 166303 68 1652 13307 87262 567 15 D & N Haveli 14514 5338 19852 0 417 63 42 506 19 Daman & Diu 11698 29884 41582 0 784 27 10 852 37 Lakshadweep 15063 7244 22307 92 576 3222 1055 204 20 Pondicherry 100116 10230 110346 413 352 1117 442 2026 68 all-India 19222 2480 21702 322 146 567 188 11108720 31061

Appendix A
NSS Report No. 525: Unorganised Manufacturing Sector in India, 2005-06: Employment, Assets and Borrowings. A - 168
Table 8: Fixed assets and outstanding loans per enterprise (in Rs.) as on last date of reference year
for each State/UTs Rural NDME
market value (Rs.) of fixed assets per enterprise
loan outstanding and interest per
enterprise (Rs.)
number of enterprises
State/UT owned hired all
net addition to fixed assets per enterprise (Rs.)
during reference year
annual rent payable on hired assets
per enterprise
(Rs.) amount annual
interest estimated sample
(1) (2) (3) (4) (5) (6) (7) (8) (9) (10) Andhra Pradesh 142116 88225 230341 6713 2740 11510 2261 45316 523 Arunachal Pradesh 41001 21885 62886 0 2151 3916 9182 226 37 Assam 47101 8689 55790 864 960 1796 520 24581 273 Bihar 39894 10488 50381 491 666 739 262 23138 220 Chhattisgarh 278233 3502 281735 109 208 1437 2395 1549 54 Delhi 95011 162337 257348 0 8096 1694 469 1810 28 Goa 255887 13652 269539 5653 1912 49285 6536 888 32 Gujarat 76524 25576 102100 229 1828 3670 822 14538 134 Haryana 235088 119612 354700 44122 5554 76540 9980 14267 206 Himachal Pradesh 153874 73101 226975 4487 3717 24809 4849 6763 161 Jammu & Kashmir 174634 14920 189555 270 269 12379 2590 6501 157 Jharkhand 35646 5393 41038 65 488 2577 140 16622 90 Karnataka 166696 35895 202591 5579 2754 11309 2186 32323 192 Kerala 105736 66920 172655 6366 3648 33148 4245 98679 827 Madhya Pradesh 26454 44740 71193 1212 7631 2556 2549 13146 98 Maharashtra 138423 44904 183327 4029 3023 32485 4089 39967 192 Manipur 63480 66788 130268 352 2751 1976 1096 1288 45 Meghalaya 50705 13225 63931 69 1414 46 1 6579 106 Mizoram 57841 10297 68138 1302 943 22815 5315 196 39 Nagaland 56854 27476 84330 319 3985 2230 195 319 28 Orissa 66823 7498 74320 2710 531 12697 1916 23583 166 Punjab 235289 97058 332346 1966 4446 11922 937 13610 172 Rajasthan 84481 28305 112786 1343 1269 12362 2510 23428 295 Sikkim 161070 102801 263871 2811 9789 514 0 397 21 Tamil Nadu 154372 16833 171205 1510 1296 6587 1489 88273 690 Tripura 30254 5705 35960 754 523 2800 1447 5400 347 Uttaranchal 137244 89500 226744 59468 3190 30911 8613 7371 94 Uttar Pradesh 69870 32476 102346 1980 1314 2501 979 100935 545 West Bengal 68861 14893 83754 1296 649 8933 1078 131237 783 A & N Islands 108480 109372 217853 2314 6319 11473 1133 488 60 Chandigarh 254889 188683 443572 194 26086 846 106 154 13 D & N Haveli 50110 77485 127596 0 8297 774 180 247 31 Daman & Diu 71256 52863 124118 0 11652 0 0 133 20 Lakshadweep 74793 4661 79454 2110 373 559 56 48 8 Pondicherry 227097 401891 628987 9586 14102 28112 4444 1270 51 all-India 103132 37691 140823 4129 2012 13536 2140 745269 6738

Appendix A
NSS Report No. 525: Unorganised Manufacturing Sector in India, 2005-06: Employment, Assets and Borrowings. A - 169
Table 8: Fixed assets and outstanding loans per enterprise (in Rs.) as on last date of reference year
for each State/UTs Rural DME
market value (Rs.) of fixed assets per enterprise
loan outstanding and interest per enterprise
(Rs.)
number of enterprises
State/UT owned hired all
net addition to fixed
assets per enterprise
(Rs.) during reference
year
annual rent payable on hired assets
per enterprise
(Rs.) amount annual
interest estimated sample
(1) (2) (3) (4) (5) (6) (7) (8) (9) (10) Andhra Pradesh 172104 18204 190309 3528 2801 39551 7472 41113 394 Arunachal Pradesh 2742120 4976094 7718214 18515 2187687 407923 24321 11 3 Assam 416904 33838 450742 103847 2189 72990 5926 2268 31 Bihar 175650 18987 194637 511 21385 60409 1762 929 53 Chhattisgarh 2771120 165141 2936261 812924 11798 2661127 359976 1332 82 Delhi 737425 528046 1265471 1012 100948 176160 68749 1062 27 Goa 1976537 57056 2033593 681624 3504 1194644 159263 458 45 Gujarat 250878 39355 290233 2073 9727 60679 25368 10064 173 Haryana 1476457 453835 1930292 180793 30105 1069575 110515 3306 275 Himachal Pradesh 1505188 249156 1754345 76019 36955 472903 79892 774 118 Jammu & Kashmir 1131509 757712 1889221 4342 144284 117497 4277 1083 48 Jharkhand 175149 6324 181473 3886 428 21481 4436 944 22 Karnataka 144438 6081 150519 11857 588 18757 5277 50764 154 Kerala 948388 76988 1025376 30940 3771 566511 44152 19191 202 Madhya Pradesh 200228 11789 212017 2252 1230 92108 26794 9502 215 Maharashtra 691454 39042 730496 41129 10155 231826 29374 16795 184 Manipur 542988 66672 609660 2882 3425 4383 2282 121 10 Meghalaya 215941 18469 234410 38 20447 4983 1189 1131 33 Mizoram 318649 1241 319890 2235 0 0 0 18 3 Nagaland 165261 137540 302801 9061 4272 24272 0 6 3 Orissa 412912 18004 430916 11987 2143 96447 10469 3432 107 Punjab 915233 342434 1257667 97227 43010 548092 56791 1170 56 Rajasthan 522559 42505 565063 4626 5419 296022 47659 6253 487 Sikkim 1513965 1717838 3231804 39957 320463 371618 8646 26 8 Tamil Nadu 585866 45655 631521 12101 4065 74970 23363 41644 612 Tripura 446997 113070 560067 13990 68950 108063 54476 265 48 Uttaranchal 429969 260325 690294 195283 13445 348603 39323 2167 30 Uttar Pradesh 250174 80085 330259 12399 9997 58852 23345 25865 292 West Bengal 236077 30067 266144 13237 1506 119126 16346 31162 414 A & N Islands 631281 179511 810792 5143 7887 409922 6019 101 13 Chandigarh 1203020 557278 1760298 0 22147 0 0 31 10 D & N Haveli 292482 160538 453020 0 27230 0 0 44 19 Daman & Diu 871018 7555 878574 39 1091 83 39 479 20 Lakshadweep 170600 28550 199150 2725 0 0 0 3 2 Pondicherry 1326279 850123 2176402 125235 42515 539349 60227 762 58 all-India 399359 51683 451042 23028 5968 145171 22375 274277 4251

Appendix A
NSS Report No. 525: Unorganised Manufacturing Sector in India, 2005-06: Employment, Assets and Borrowings. A - 170
Table 8: Fixed assets and outstanding loans per enterprise (in Rs.) as on last date of reference year
for each State/UTs Rural all enterprise type
market value (Rs.) of fixed assets per enterprise
loan outstanding and interest per
enterprise (Rs.)
number of enterprises
State/UT owned hired all
net addition to fixed assets per enterprise (Rs.)
during reference year
annual rent payable on hired assets
per enterprise
(Rs.) amount annual
interest estimated sample
(1) (2) (3) (4) (5) (6) (7) (8) (9) (10) Andhra Pradesh 27548 6061 33609 781 345 2415 506 1085242 3876 Arunachal Pradesh 81043 115971 197014 1614 48880 10499 4326 541 76 Assam 18384 1555 19939 880 239 790 176 333006 2084 Bihar 24602 807 25409 231 85 177 28 663379 2468 Chhattisgarh 38970 1897 40867 6425 143 20737 3069 172610 528 Delhi 277277 236760 514037 297 33627 52274 20300 3639 71 Goa 334712 26801 361513 72352 1037 131489 17510 4546 147 Gujarat 41134 5670 46805 282 610 2603 938 300753 1350 Haryana 110923 37855 148778 11287 2156 41526 7536 119687 1118 Himachal Pradesh 55551 13110 68661 1882 957 7262 2162 100437 1011 Jammu & Kashmir 54084 9618 63701 332 1454 2033 164 140468 1083 Jharkhand 12984 350 13334 41 30 195 28 540250 975 Karnataka 39241 3606 42848 1432 287 2468 648 663211 1770 Kerala 74001 22056 96057 2965 1187 30260 2952 492777 2682 Madhya Pradesh 22078 2356 24434 157 334 1819 620 564463 1641 Maharashtra 54848 10481 65329 2017 785 11018 1572 556168 1963 Manipur 28644 4182 32825 281 166 160 57 35797 443 Meghalaya 29323 6578 35901 35 1207 177 39 34513 388 Mizoram 38818 2661 41479 211 152 1567 331 3291 223 Nagaland 43839 3536 47375 176 497 1713 87 7167 425 Orissa 10592 882 11474 211 67 998 135 870877 2190 Punjab 68590 20184 88774 1224 1115 6126 807 150208 1130 Rajasthan 44764 6621 51385 370 436 6036 1060 400875 2032 Sikkim 39661 31384 71045 623 4428 3014 741 3684 164 Tamil Nadu 60539 8750 69289 951 515 5226 1490 850353 3198 Tripura 14819 2568 17387 378 603 1362 594 38900 1067 Uttaranchal 65356 30981 96337 16824 1342 19451 2888 53940 377 Uttar Pradesh 28569 5579 34148 937 364 1473 563 1704516 3378 West Bengal 18142 1877 20019 426 98 2447 349 2223768 3620 A & N Islands 90005 46973 136978 1322 2460 25504 661 1872 181 Chandigarh 166321 122833 289154 91 7511 10200 65775 753 38 D & N Haveli 40869 36278 77147 0 4340 280 83 797 69 Daman & Diu 298506 24651 323158 13 1869 43 18 1464 77 Lakshadweep 28135 7007 35142 503 531 2683 854 255 30 Pondicherry 370225 290596 660822 26735 12577 110688 12927 4058 177 all-India 32975 5757 38732 1069 392 4634 809 12128266 42050

Appendix A
NSS Report No. 525: Unorganised Manufacturing Sector in India, 2005-06: Employment, Assets and Borrowings. A - 171
Table 8: Fixed assets and outstanding loans per enterprise (in Rs.) as on last date of reference year for
each State/UTs Urban OAME
market value (Rs.) of fixed assets per enterprise
loan outstanding and interest per
enterprise (Rs.)
number of enterprises State/UT
owned hired all
net addition to fixed assets per enterprise (Rs.) during
reference year
annual rent payable on
hired assets per enterprise (Rs.) amount annual
interest estimated sample
(1) (2) (3) (4) (5) (6) (7) (8) (9) (10) Andhra Pradesh 31766 29181 60947 2904 1236 1199 406 363988 1849 Arunachal Pradesh 39526 27701 67226 715 11155 2242 269 223 14 Assam 32502 18048 50550 176 1561 293 58 21984 471 Bihar 32808 8816 41624 173 757 209 68 87057 962 Chhattisgarh 178659 22145 200805 1222 1105 3750 776 23967 215 Delhi 113743 123875 237618 13 4595 3455 1008 17127 67 Goa 67212 68416 135628 389 4235 1039 152 3053 48 Gujarat 50463 26934 77397 286 1064 1940 247 246382 1271 Haryana 171651 145312 316963 3019 2876 9926 1564 60448 400 Himachal Pradesh 83389 87031 170420 609 4064 5143 699 4249 276 Jammu & Kashmir 92343 52013 144356 233 1323 623 43 25700 1011 Jharkhand 28898 18431 47329 152 1051 107 43 34243 548 Karnataka 34439 19158 53598 343 1071 1274 234 228452 1046 Kerala 20182 15581 35763 475 624 2117 272 119772 789 Madhya Pradesh 35947 13164 49111 170 924 1285 76 253319 1565 Maharashtra 49244 26540 75785 440 1815 11964 1402 341781 2227 Manipur 37656 764 38420 148 97 124 27 14629 559 Meghalaya 37593 22776 60370 1 4014 19 23 1027 69 Mizoram 92476 39117 131593 835 1448 0 0 1123 129 Nagaland 40595 23994 64589 252 2220 152 26 1912 191 Orissa 19492 8850 28342 124 741 636 198 69199 791 Punjab 91841 48643 140484 401 1573 4892 609 87811 941 Rajasthan 58802 29724 88526 219 1219 1794 553 181806 1576 Sikkim 28338 145038 173377 28 11604 402 0 206 45 Tamil Nadu 30050 29639 59689 776 1222 1305 326 467652 1948 Tripura 26522 57967 84490 721 1992 671 512 3857 277 Uttaranchal 61381 55565 116946 277 2154 896 779 7877 82 Uttar Pradesh 41597 20760 62357 528 911 738 256 455329 2883 West Bengal 19753 13065 32819 192 356 520 109 373178 1520 A & N Islands 29005 87751 116756 540 8195 315 0 147 15 Chandigarh 21164 33913 55077 0 5426 0 0 457 5 D & N Haveli 72568 89176 161745 0 9297 0 0 68 19 Daman & Diu 28526 16452 44978 129 1461 204 41 960 56 Lakshadweep 44305 16267 60572 804 810 0 0 115 42 Pondicherry 79408 44378 123786 191 1181 503 287 5090 77 all-India 41839 25863 67702 705 1127 2468 407 3504186 23984
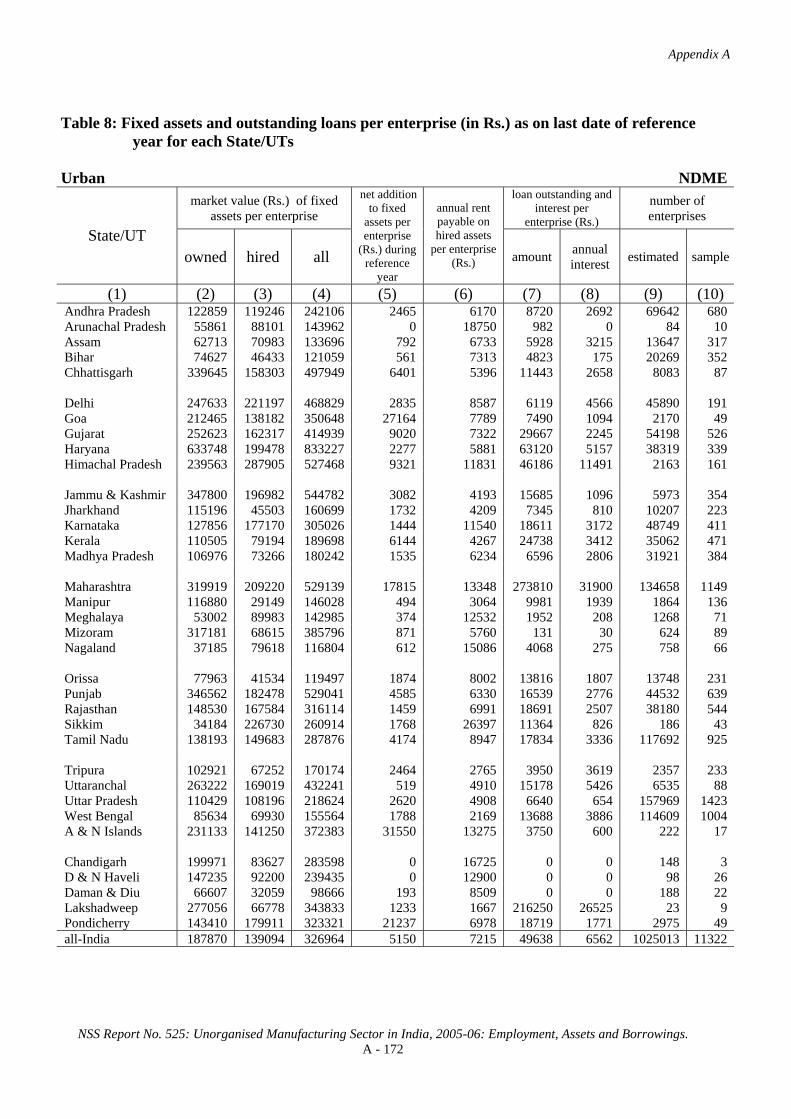
Appendix A
NSS Report No. 525: Unorganised Manufacturing Sector in India, 2005-06: Employment, Assets and Borrowings. A - 172
Table 8: Fixed assets and outstanding loans per enterprise (in Rs.) as on last date of reference
year for each State/UTs Urban NDME
market value (Rs.) of fixed assets per enterprise
loan outstanding and interest per
enterprise (Rs.)
number of enterprises
State/UT owned hired all
net addition to fixed
assets per enterprise
(Rs.) during reference
year
annual rent payable on hired assets
per enterprise (Rs.) amount annual
interest estimated sample
(1) (2) (3) (4) (5) (6) (7) (8) (9) (10) Andhra Pradesh 122859 119246 242106 2465 6170 8720 2692 69642 680 Arunachal Pradesh 55861 88101 143962 0 18750 982 0 84 10 Assam 62713 70983 133696 792 6733 5928 3215 13647 317 Bihar 74627 46433 121059 561 7313 4823 175 20269 352 Chhattisgarh 339645 158303 497949 6401 5396 11443 2658 8083 87 Delhi 247633 221197 468829 2835 8587 6119 4566 45890 191 Goa 212465 138182 350648 27164 7789 7490 1094 2170 49 Gujarat 252623 162317 414939 9020 7322 29667 2245 54198 526 Haryana 633748 199478 833227 2277 5881 63120 5157 38319 339 Himachal Pradesh 239563 287905 527468 9321 11831 46186 11491 2163 161 Jammu & Kashmir 347800 196982 544782 3082 4193 15685 1096 5973 354 Jharkhand 115196 45503 160699 1732 4209 7345 810 10207 223 Karnataka 127856 177170 305026 1444 11540 18611 3172 48749 411 Kerala 110505 79194 189698 6144 4267 24738 3412 35062 471 Madhya Pradesh 106976 73266 180242 1535 6234 6596 2806 31921 384 Maharashtra 319919 209220 529139 17815 13348 273810 31900 134658 1149 Manipur 116880 29149 146028 494 3064 9981 1939 1864 136 Meghalaya 53002 89983 142985 374 12532 1952 208 1268 71 Mizoram 317181 68615 385796 871 5760 131 30 624 89 Nagaland 37185 79618 116804 612 15086 4068 275 758 66 Orissa 77963 41534 119497 1874 8002 13816 1807 13748 231 Punjab 346562 182478 529041 4585 6330 16539 2776 44532 639 Rajasthan 148530 167584 316114 1459 6991 18691 2507 38180 544 Sikkim 34184 226730 260914 1768 26397 11364 826 186 43 Tamil Nadu 138193 149683 287876 4174 8947 17834 3336 117692 925 Tripura 102921 67252 170174 2464 2765 3950 3619 2357 233 Uttaranchal 263222 169019 432241 519 4910 15178 5426 6535 88 Uttar Pradesh 110429 108196 218624 2620 4908 6640 654 157969 1423 West Bengal 85634 69930 155564 1788 2169 13688 3886 114609 1004 A & N Islands 231133 141250 372383 31550 13275 3750 600 222 17 Chandigarh 199971 83627 283598 0 16725 0 0 148 3 D & N Haveli 147235 92200 239435 0 12900 0 0 98 26 Daman & Diu 66607 32059 98666 193 8509 0 0 188 22 Lakshadweep 277056 66778 343833 1233 1667 216250 26525 23 9 Pondicherry 143410 179911 323321 21237 6978 18719 1771 2975 49 all-India 187870 139094 326964 5150 7215 49638 6562 1025013 11322
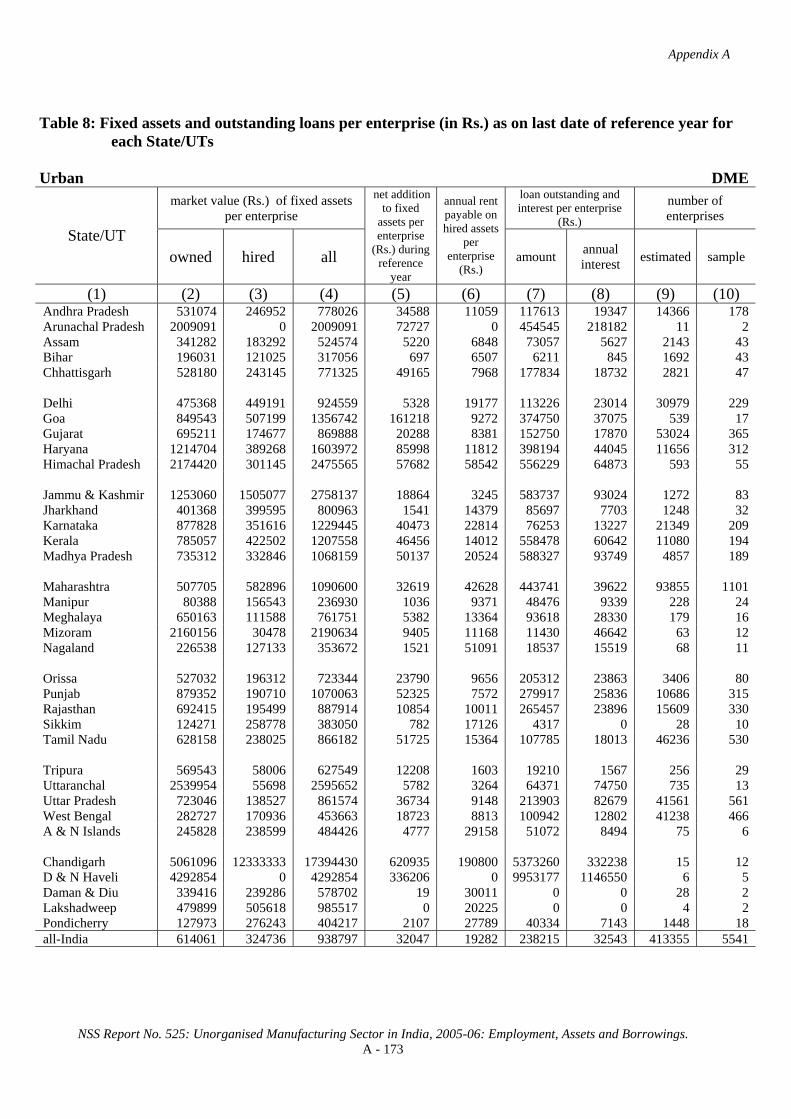
Appendix A
NSS Report No. 525: Unorganised Manufacturing Sector in India, 2005-06: Employment, Assets and Borrowings. A - 173
Table 8: Fixed assets and outstanding loans per enterprise (in Rs.) as on last date of reference year for
each State/UTs Urban DME
market value (Rs.) of fixed assets per enterprise
loan outstanding and interest per enterprise
(Rs.)
number of enterprises
State/UT owned hired all
net addition to fixed
assets per enterprise
(Rs.) during reference
year
annual rent payable on hired assets
per enterprise
(Rs.) amount annual
interest estimated sample
(1) (2) (3) (4) (5) (6) (7) (8) (9) (10) Andhra Pradesh 531074 246952 778026 34588 11059 117613 19347 14366 178 Arunachal Pradesh 2009091 0 2009091 72727 0 454545 218182 11 2 Assam 341282 183292 524574 5220 6848 73057 5627 2143 43 Bihar 196031 121025 317056 697 6507 6211 845 1692 43 Chhattisgarh 528180 243145 771325 49165 7968 177834 18732 2821 47 Delhi 475368 449191 924559 5328 19177 113226 23014 30979 229 Goa 849543 507199 1356742 161218 9272 374750 37075 539 17 Gujarat 695211 174677 869888 20288 8381 152750 17870 53024 365 Haryana 1214704 389268 1603972 85998 11812 398194 44045 11656 312 Himachal Pradesh 2174420 301145 2475565 57682 58542 556229 64873 593 55 Jammu & Kashmir 1253060 1505077 2758137 18864 3245 583737 93024 1272 83 Jharkhand 401368 399595 800963 1541 14379 85697 7703 1248 32 Karnataka 877828 351616 1229445 40473 22814 76253 13227 21349 209 Kerala 785057 422502 1207558 46456 14012 558478 60642 11080 194 Madhya Pradesh 735312 332846 1068159 50137 20524 588327 93749 4857 189 Maharashtra 507705 582896 1090600 32619 42628 443741 39622 93855 1101 Manipur 80388 156543 236930 1036 9371 48476 9339 228 24 Meghalaya 650163 111588 761751 5382 13364 93618 28330 179 16 Mizoram 2160156 30478 2190634 9405 11168 11430 46642 63 12 Nagaland 226538 127133 353672 1521 51091 18537 15519 68 11 Orissa 527032 196312 723344 23790 9656 205312 23863 3406 80 Punjab 879352 190710 1070063 52325 7572 279917 25836 10686 315 Rajasthan 692415 195499 887914 10854 10011 265457 23896 15609 330 Sikkim 124271 258778 383050 782 17126 4317 0 28 10 Tamil Nadu 628158 238025 866182 51725 15364 107785 18013 46236 530 Tripura 569543 58006 627549 12208 1603 19210 1567 256 29 Uttaranchal 2539954 55698 2595652 5782 3264 64371 74750 735 13 Uttar Pradesh 723046 138527 861574 36734 9148 213903 82679 41561 561 West Bengal 282727 170936 453663 18723 8813 100942 12802 41238 466 A & N Islands 245828 238599 484426 4777 29158 51072 8494 75 6 Chandigarh 5061096 12333333 17394430 620935 190800 5373260 332238 15 12 D & N Haveli 4292854 0 4292854 336206 0 9953177 1146550 6 5 Daman & Diu 339416 239286 578702 19 30011 0 0 28 2 Lakshadweep 479899 505618 985517 0 20225 0 0 4 2 Pondicherry 127973 276243 404217 2107 27789 40334 7143 1448 18 all-India 614061 324736 938797 32047 19282 238215 32543 413355 5541

Appendix A
NSS Report No. 525: Unorganised Manufacturing Sector in India, 2005-06: Employment, Assets and Borrowings. A - 174
Table 8: Fixed assets and outstanding loans per enterprise (in Rs.) as on last date of reference year
for each State/UTs Urban all enterprise type
market value (Rs.) of fixed assets per enterprise
loan outstanding and interest per
enterprise (Rs.)
number of enterprises
State/UT owned hired all
net addition to fixed
assets per enterprise
(Rs.) during reference
year
annual rent payable on hired assets
per enterprise
(Rs.) amount annual
interest estimated sample
(1) (2) (3) (4) (5) (6) (7) (8) (9) (10) Andhra Pradesh 61938 50166 112104 3852 2318 6101 1369 447997 2707 Arunachal Pradesh 111970 42697 154668 3017 12775 17555 7736 318 26 Assam 60937 46548 107484 685 3730 6457 1515 37774 831 Bihar 43116 17551 60667 253 2065 1160 100 109018 1357 Chhattisgarh 244253 71586 315839 6301 2655 19617 2665 34871 349 Delhi 298292 278605 576897 3142 11350 40933 9998 93997 487 Goa 195113 135744 330857 25520 6045 38430 3961 5762 114 Gujarat 178131 69839 247970 4625 3121 28804 3196 353605 2162 Haryana 442114 189861 631975 11521 4862 69371 7295 110423 1051 Himachal Pradesh 308564 167185 475748 8129 11073 64451 9462 7005 492 Jammu & Kashmir 183457 134380 317838 1469 1918 25861 3823 32944 1448 Jharkhand 58349 34891 93240 543 2121 4062 424 45698 803 Karnataka 110003 68733 178736 3393 4336 9467 1642 298549 1666 Kerala 90348 56198 146547 4744 2288 44051 4967 165914 1454 Madhya Pradesh 55472 25130 80602 1156 1836 11698 1945 290097 2138 Maharashtra 188607 161236 349843 9838 11255 144850 14893 570294 4477 Manipur 47072 6054 53126 199 554 1882 367 16721 719 Meghalaya 89888 63660 153548 582 9058 7793 2169 2474 156 Mizoram 241438 48992 290430 1143 3271 440 1622 1810 230 Nagaland 44293 41969 86262 383 7002 1695 482 2739 268 Orissa 48821 21447 70269 1336 2248 10808 1387 86352 1102 Punjab 229985 100927 330912 5583 3502 29066 3169 143029 1895 Rajasthan 115322 63049 178371 1124 2737 22001 2416 235595 2450 Sikkim 37248 188789 226037 850 18534 5526 367 420 98 Tamil Nadu 93988 67264 161252 5139 3697 12180 2182 631580 3403 Tripura 75832 61351 137183 1810 2258 2599 1686 6470 539 Uttaranchal 268684 104520 373205 648 3397 10137 6372 15146 183 Uttar Pradesh 101450 49326 150776 3331 2398 15690 5583 654859 4867 West Bengal 54525 37691 92216 1983 1408 11201 1917 529025 2990 A & N Islands 166854 140091 306945 16764 14291 10643 1741 444 38 Chandigarh 183795 338340 522135 14769 12537 127802 7902 621 20 D & N Haveli 262389 87777 350167 11745 11018 347709 40054 172 50 Daman & Diu 42011 24252 66263 137 3266 167 33 1175 80 Lakshadweep 93052 36757 129809 853 1437 35132 4309 142 53 Pondicherry 106814 122052 228866 7064 7043 12262 1795 9513 144 all-India 119980 74341 194321 4248 3908 31966 4371 4942554 40847

Appendix A
NSS Report No. 525: Unorganised Manufacturing Sector in India, 2005-06: Employment, Assets and Borrowings. A - 175
Table 8: Fixed assets and outstanding loans per enterprise (in Rs.) as on last date of reference year
for each State/UTs Rural + Urban OAME
market value (Rs.) of fixed assets per enterprise
loan outstanding and interest per
enterprise (Rs.)
number of enterprises State/UT
owned hired all
net addition to fixed assets per enterprise (Rs.) during
reference year
annual rent payable on
hired assets per enterprise (Rs.) amount annual
interest estimated sample
(1) (2) (3) (4) (5) (6) (7) (8) (9) (10) Andhra Pradesh 20504 9138 29642 1068 429 667 211 1362802 4808 Arunachal Pradesh 25868 18929 44797 1578 8933 1648 114 527 50 Assam 14424 1902 16326 123 260 182 102 328142 2251 Bihar 24905 1435 26340 215 120 86 23 726369 3157 Chhattisgarh 35553 3267 38819 286 181 633 337 193695 607 Delhi 111874 118950 230824 13 4426 3310 965 17894 83 Goa 95158 46773 141931 2107 2294 1676 221 6252 118 Gujarat 40509 14494 55003 251 615 1142 145 522534 2314 Haryana 94833 62176 157009 1883 1557 5793 3006 162561 1037 Himachal Pradesh 38370 10286 48656 1055 614 2237 1291 97149 1008 Jammu & Kashmir 47981 11160 59141 291 505 592 17 158583 1889 Jharkhand 13011 1301 14312 41 78 83 18 556927 1411 Karnataka 26185 6554 32739 304 391 755 179 808576 2470 Kerala 20719 9407 30126 598 460 2066 447 494680 2442 Madhya Pradesh 24295 4986 29281 118 390 558 102 795133 2893 Maharashtra 35890 14800 50691 500 910 5974 828 841187 3814 Manipur 29152 1363 30515 233 69 91 15 49017 947 Meghalaya 16992 5121 22113 25 481 7 1 27830 318 Mizoram 51110 12058 63168 319 462 165 12 4201 310 Nagaland 42570 7037 49607 181 744 1338 70 8754 585 Orissa 8302 1251 9552 96 98 309 55 913061 2708 Punjab 63136 25003 88139 352 872 2447 428 223239 1843 Rajasthan 42293 12892 55186 231 602 1095 305 553000 2826 Sikkim 13894 17155 31049 39 1842 349 722 3466 180 Tamil Nadu 23153 15078 38231 450 611 1136 265 1188088 3844 Tripura 10703 7083 17786 261 271 318 77 37093 949 Uttaranchal 39507 16928 56435 921 702 1396 253 52280 335 Uttar Pradesh 26617 6696 33313 647 317 527 184 2033045 5424 West Bengal 12865 2530 15395 179 89 308 68 2434547 3943 A & N Islands 39055 20454 59510 632 1347 449 52 1429 123 Chandigarh 56643 60001 116644 38 3337 7366 48302 1024 20 D & N Haveli 21418 15309 36727 0 1473 56 37 574 38 Daman & Diu 20611 22770 43381 68 1143 121 26 1812 93 Lakshadweep 25608 10498 36106 349 661 2060 674 320 62 Pondicherry 85303 34657 119960 254 945 678 331 7116 145 all-India 24646 8088 32733 414 381 1023 240 14612907 55045

Appendix A
NSS Report No. 525: Unorganised Manufacturing Sector in India, 2005-06: Employment, Assets and Borrowings. A - 176
Table 8: Fixed assets and outstanding loans per enterprise (in Rs.) as on last date of reference year
for each State/UTs Rural + Urban NDME
market value (Rs.) of fixed assets per enterprise
loan outstanding and interest per
enterprise (Rs.)
number of enterprises
State/UT owned hired all
net addition to fixed
assets per enterprise
(Rs.) during reference
year
annual rent payable on hired assets
per enterprise
(Rs.) amount annual
interest estimated sample
(1) (2) (3) (4) (5) (6) (7) (8) (9) (10) Andhra Pradesh 130450 107018 237468 4140 4818 9820 2522 114958 1203 Arunachal Pradesh 45025 39814 84839 0 6645 3122 6696 310 47 Assam 52675 30927 83601 838 3021 3271 1482 38228 590 Bihar 56112 27272 83385 523 3770 2646 222 43407 572 Chhattisgarh 329769 133408 463177 5389 4561 9834 2616 9632 141 Delhi 241842 218964 460806 2727 8568 5951 4410 47700 219 Goa 225078 102010 327088 20916 6082 19630 2675 3059 81 Gujarat 215378 133396 348773 7161 6160 24169 1944 68736 660 Haryana 525588 177810 703398 13630 5792 66761 6466 52586 545 Himachal Pradesh 174641 125159 299800 5658 5683 29989 6459 8927 322 Jammu & Kashmir 257546 102092 359638 1616 2148 13962 1875 12474 511 Jharkhand 65911 20653 86564 699 1904 4391 395 26829 313 Karnataka 143341 120844 264185 3092 8037 15700 2779 81071 603 Kerala 106986 70137 177123 6308 3810 30943 4027 133741 1298 Madhya Pradesh 83487 64944 148431 1441 6642 5417 2731 45067 482 Maharashtra 278380 171613 449993 14660 10985 218577 25535 174625 1341 Manipur 95061 44528 139589 436 2936 6711 1595 3152 181 Meghalaya 51077 25630 76706 119 3211 354 34 7847 177 Mizoram 255311 54702 310013 974 4611 5543 1291 820 128 Nagaland 43014 64166 107180 525 11796 3523 252 1078 94 Orissa 70925 20032 90958 2402 3282 13109 1876 37330 397 Punjab 320515 162483 482998 3972 5889 15458 2346 58142 811 Rajasthan 124174 114620 238795 1415 4815 16285 2508 61608 839 Sikkim 120549 142378 262927 2478 15092 3979 264 583 64 Tamil Nadu 145127 92746 237873 3032 5668 13014 2544 205965 1615 Tripura 52333 24406 76739 1274 1204 3149 2107 7756 580 Uttaranchal 196446 126869 323315 31766 3998 23518 7115 13906 182 Uttar Pradesh 94617 78676 173293 2371 3507 5026 781 258904 1968 West Bengal 76681 40550 117231 1525 1358 11150 2387 245846 1787 A & N Islands 146830 119339 266169 11455 8494 9058 966 710 77 Chandigarh 227970 137187 365157 99 21498 431 54 303 16 D & N Haveli 77573 81646 159219 0 9599 555 129 345 57 Daman & Diu 68532 40674 109206 113 9811 0 0 320 42 Lakshadweep 140290 24776 165066 1826 792 70405 8627 71 17 Pondicherry 168446 246319 414766 17751 9109 21529 2571 4245 100 all-India 152196 96405 248601 4720 5025 34440 4701 1770282 18060

Appendix A
NSS Report No. 525: Unorganised Manufacturing Sector in India, 2005-06: Employment, Assets and Borrowings. A - 177
Table 8: Fixed assets and outstanding loans per enterprise (in Rs.) as on last date of reference year for
each State/UTs Rural + Urban DME
market value (Rs.) of fixed assets per enterprise
loan outstanding and interest per
enterprise (Rs.)
number of enterprises
State/UT owned hired all
net addition to fixed assets
per enterprise (Rs.) during
reference year
annual rent payable on hired assets
per enterprise
(Rs.) amount annual
interest estimated sample
(1) (2) (3) (4) (5) (6) (7) (8) (9) (10) Andhra Pradesh 265059 77438 342497 11571 4939 59765 10547 55479 572 Arunachal Pradesh 2373174 2471540 4844714 45801 1086586 431389 121894 22 5 Assam 380162 106452 486614 55928 4452 73022 5781 4411 74 Bihar 188805 84851 273656 631 11782 25425 1170 2621 96 Chhattisgarh 1247558 218126 1465685 294126 9197 974300 128179 4153 129 Delhi 484055 451805 935860 5185 21888 115312 24530 32041 256 Goa 1366963 300531 1667495 400144 6624 751176 93173 997 62 Gujarat 624332 153091 777423 17383 8596 138063 19066 63088 538 Haryana 1272545 403536 1676081 106945 15854 546553 58734 14963 587 Himachal Pradesh 1795389 271700 2067090 68067 46316 509036 73379 1367 173 Jammu & Kashmir 1197141 1161255 2358396 12183 68130 369245 52196 2355 131 Jharkhand 303968 230270 534237 2550 8372 58049 6296 2192 54 Karnataka 361558 108377 469935 20329 7168 35779 7630 72113 363 Kerala 888605 203453 1092058 36619 7520 563571 50187 30271 396 Madhya Pradesh 381229 120392 501622 18450 7757 259963 49443 14359 404 Maharashtra 535595 500347 1035942 33910 37699 411576 38066 110650 1285 Manipur 240380 125461 365841 1675 7314 33227 6898 349 34 Meghalaya 275389 31217 306606 770 19477 17118 4904 1310 49 Mizoram 1757243 24081 1781325 7836 8724 8929 36437 80 15 Nagaland 221459 127996 349455 2146 47210 19013 14232 75 14 Orissa 469760 106827 576587 17867 5885 150677 17141 6838 187 Punjab 882893 205681 1088574 56756 11069 306378 28891 11856 371 Rajasthan 643830 151737 795567 9073 8698 274200 30693 21862 817 Sikkim 801979 970314 1772293 19886 165053 183438 4217 54 18 Tamil Nadu 608117 146866 754983 32948 10010 92235 20548 87880 1142 Tripura 507217 86011 593228 13114 35855 64400 28477 521 77 Uttaranchal 964176 208518 1172693 147305 10867 276641 48292 2902 43 Uttar Pradesh 541648 116108 657757 27399 9474 154424 59918 67426 853 West Bengal 262648 110304 372952 16362 5668 108769 14328 72400 880 A & N Islands 466964 204700 671664 4987 16955 256946 7074 177 19 Chandigarh 2443251 4342851 6786102 199608 76363 1727307 106803 46 22 D & N Haveli 773682 141227 914908 40442 23954 1197255 137917 50 24 Daman & Diu 841688 20341 862028 38 2687 78 37 507 22 Lakshadweep 338707 287842 626549 1244 10992 0 0 7 4 Pondicherry 541297 474188 1015486 44576 32869 212456 25453 2210 76 all-India 528423 215823 744245 28449 13971 201102 28487 687632 9792

Appendix A
NSS Report No. 525: Unorganised Manufacturing Sector in India, 2005-06: Employment, Assets and Borrowings. A - 178
Table 8: Fixed assets and outstanding loans per enterprise (in Rs.) as on last date of reference year
for each State/UTs Rural + Urban all enterprise type
market value (Rs.) of fixed assets per enterprise
loan outstanding and interest per
enterprise (Rs.)
number of enterprises
State/UT owned hired all
net addition to fixed assets per enterprise (Rs.)
during reference year
annual rent payable on hired assets
per enterprise
(Rs.) amount annual
interest estimated sample
(1) (2) (3) (4) (5) (6) (7) (8) (9) (10) Andhra Pradesh 37596 18948 56544 1678 921 3492 758 1533239 6583 Arunachal Pradesh 92489 88853 181342 2133 35518 13111 5588 859 102 Assam 22719 6139 28858 860 594 1367 312 370781 2915 Bihar 27215 3170 30385 234 364 316 38 772397 3825 Chhattisgarh 73472 13609 87081 6404 565 20549 3001 207481 877 Delhi 297509 277045 574554 3036 12180 41356 10382 97636 558 Goa 256677 87699 344376 46173 3837 79470 9936 10308 261 Gujarat 115165 40346 155511 2629 1967 16762 2158 654358 3512 Haryana 269852 110798 380650 11399 3455 54888 7420 230110 2169 Himachal Pradesh 72047 23156 95203 2290 1617 10991 2638 107442 1503 Jammu & Kashmir 78662 33320 111981 548 1542 6560 859 173412 2531 Jharkhand 16522 3044 19566 80 193 497 59 585948 1778 Karnataka 61207 23823 85030 2040 1544 4641 957 961761 3436 Kerala 78119 30656 108775 3413 1464 33734 3460 658692 4136 Madhya Pradesh 33414 10087 43501 496 844 5173 1070 854559 3779 Maharashtra 122566 86804 209370 5977 6086 78773 8316 1126462 6440 Manipur 34511 4778 39289 255 290 709 156 52518 1162 Meghalaya 33374 10397 43771 71 1733 686 182 36987 544 Mizoram 110708 19099 129807 542 1259 1167 789 5101 453 Nagaland 43965 14162 58126 234 2296 1708 197 9906 693 Orissa 14040 2737 16778 313 264 1883 248 957229 3292 Punjab 147312 59567 206879 3350 2279 17315 1959 293237 3025 Rajasthan 70882 27508 98390 649 1288 11946 1562 636470 4482 Sikkim 39414 47483 86897 647 5870 3271 703 4103 262 Tamil Nadu 74794 33688 108482 2736 1871 8189 1785 1481933 6601 Tripura 23519 10951 34470 582 839 1538 750 45370 1606 Uttaranchal 109933 47104 157037 13278 1792 17409 3652 69087 560 Uttar Pradesh 48798 17721 66519 1601 929 5419 1956 2359375 8245 West Bengal 25134 8760 33894 725 349 4129 650 2752793 6610 A & N Islands 104737 64823 169560 4282 4728 22655 868 2316 219 Chandigarh 174218 220226 394444 6724 9783 63347 39621 1373 58 D & N Haveli 80150 45410 125559 2083 5524 61887 7170 969 119 Daman & Diu 184307 24474 208781 68 2491 98 25 2639 157 Lakshadweep 51312 17629 68941 628 854 14268 2088 397 83 Pondicherry 185577 172449 358026 12946 8698 41693 5123 13572 321 all-India 58166 25614 83780 1989 1410 12548 1840 17070820 82897

Appendix A
NSS Report No. 525: Unorganised Manufacturing Sector in India, 2005-06: Employment, Assets and Borrowings. A - 179
Table 9: Outstanding loans per enterprise (in Rs.) on the date of survey and annual interest
payable per enterprise (in Rs.) by source agency of loan for each industry Rural OAME all-India
agency from which loan is taken central and state level term lending institution, govern-ment (central, state, local
bodies), banks and societies
other institutional
agencies money lenders business partner supplier /
contractor industry
(NIC 2004)
amount interest amount interest amount interest amount interest amount interest(1) (2) (3) (4) (5) (6) (7) (8) (9) (10) (11)
01405 0 0 0 0 555 674 0 0 0 0 15 826 235 68 22 566 372 3 1 53 4 16 0 0 0 0 1 2 0 0 2 0 17 31 9 1 0 113 45 0 0 23 0 18 241 60 19 4 55 43 0 0 6 5
19 482 148 0 0 82 34 0 0 51 21 20 59 21 2 1 42 25 0 0 8 1 21 3 0 0 0 0 0 0 0 0 0 22 2609 1911 208 25 134 134 0 0 17 0 23 0 0 0 0 236 142 0 0 0 0
24 144 14 1 0 7 4 0 0 0 0 25 643 95 94 23 9 3 0 0 1 0 26 237 32 13 4 97 63 0 0 8 4 27 391 46 597 673 319 383 0 0 23 0 28 392 215 120 17 112 114 0 0 15 0
29 364 414 0 0 395 175 0 0 34 0 30 0 0 0 0 0 0 0 0 0 0 31 1537 856 0 0 130 49 82 0 0 0 32 0 0 0 0 0 0 0 0 0 0 33 137055 20558 0 0 7425 2227 0 0 0 0
34 0 0 2740 383 274 9 0 0 0 0 35 344 41 0 0 0 0 0 0 10 0 36 843 249 7 2 297 116 1 0 35 4 37 0 0 0 0 0 0 0 0 0 0 all 257 77 20 6 145 90 1 0 17 2
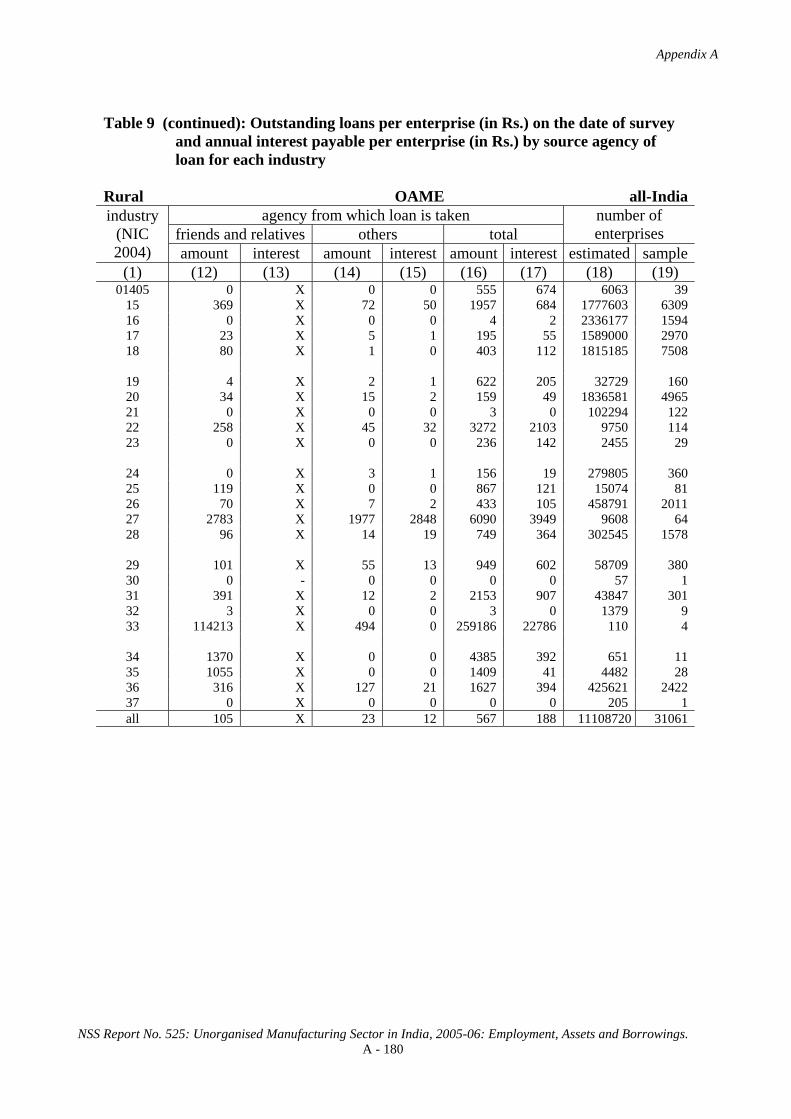
Appendix A
NSS Report No. 525: Unorganised Manufacturing Sector in India, 2005-06: Employment, Assets and Borrowings. A - 180
Table 9 (continued): Outstanding loans per enterprise (in Rs.) on the date of survey
and annual interest payable per enterprise (in Rs.) by source agency of loan for each industry
Rural OAME all-India
agency from which loan is taken friends and relatives others total
number of enterprises
industry (NIC 2004) amount interest amount interest amount interest estimated sample
(1) (12) (13) (14) (15) (16) (17) (18) (19) 01405 0 X 0 0 555 674 6063 39
15 369 X 72 50 1957 684 1777603 6309 16 0 X 0 0 4 2 2336177 1594 17 23 X 5 1 195 55 1589000 2970 18 80 X 1 0 403 112 1815185 7508
19 4 X 2 1 622 205 32729 160 20 34 X 15 2 159 49 1836581 4965 21 0 X 0 0 3 0 102294 122 22 258 X 45 32 3272 2103 9750 114 23 0 X 0 0 236 142 2455 29
24 0 X 3 1 156 19 279805 360 25 119 X 0 0 867 121 15074 81 26 70 X 7 2 433 105 458791 2011 27 2783 X 1977 2848 6090 3949 9608 64 28 96 X 14 19 749 364 302545 1578
29 101 X 55 13 949 602 58709 380 30 0 - 0 0 0 0 57 1 31 391 X 12 2 2153 907 43847 301 32 3 X 0 0 3 0 1379 9 33 114213 X 494 0 259186 22786 110 4
34 1370 X 0 0 4385 392 651 11 35 1055 X 0 0 1409 41 4482 28 36 316 X 127 21 1627 394 425621 2422 37 0 X 0 0 0 0 205 1 all 105 X 23 12 567 188 11108720 31061

Appendix A
NSS Report No. 525: Unorganised Manufacturing Sector in India, 2005-06: Employment, Assets and Borrowings. A - 181
Table 9: Outstanding loans per enterprise (in Rs.) on the date of survey and annual interest
payable per enterprise (in Rs.) by source agency of loan for each industry Rural NDME all-India
agency from which loan is taken central and state level term lending institution, govern-ment (central, state, local
bodies), banks and societies
other institutional
agencies money lenders business partner supplier /
contractor industry
(NIC 2004)
amount interest amount interest amount interest amount interest amount interest(1) (2) (3) (4) (5) (6) (7) (8) (9) (10) (11)
01405 0 0 0 0 0 0 0 0 0 0 15 7593 1503 1987 270 1132 372 16 1 762 119 16 0 0 69 8 9069 2262 0 0 179 0 17 7667 1132 220 35 288 70 0 0 123 2 18 1992 279 903 110 579 283 1 0 35 0
19 6468 815 0 0 5 2 0 0 0 0 20 3668 798 68 131 1030 369 417 27 583 21 21 10793 1357 0 0 11 7 0 0 1219 0 22 24743 2653 2111 253 4578 2131 0 0 0 0 23 513 6 0 0 2542 610 0 0 0 0
24 18545 4054 19 2 1574 395 252 30 369 0 25 101505 12886 13198 1723 4424 1362 2074 0 281 0 26 17313 2134 3020 606 2309 1562 204 25 93 0 27 8506 3298 0 0 5841 1147 0 0 200 0 28 18013 2114 460 106 1603 586 13 0 200 18
29 4954 618 780 197 636 191 534 7 329 11 30 0 0 0 0 0 0 0 0 0 0 31 24248 3215 1193 214 444 234 0 0 5021 14 32 0 0 0 0 0 0 0 0 0 0 33 162854 38540 0 0 0 0 0 0 0 0
34 17890 2093 6555 311 0 0 0 0 0 0 35 15586 1774 37 7 47 6 0 0 0 0 36 11198 1792 206 25 1234 648 160 20 271 5 37 14584 1742 0 0 0 0 0 0 0 0 all 9466 1468 1060 166 1096 439 99 7 391 34

Appendix A
NSS Report No. 525: Unorganised Manufacturing Sector in India, 2005-06: Employment, Assets and Borrowings. A - 182
Table 9 (continued): Outstanding loans per enterprise (in Rs.) on the date of survey
and annual interest payable per enterprise (in Rs.) by source agency of loan for each industry
Rural NDME all-India
agency from which loan is taken friends and relatives others total
number of enterprises
industry (NIC 2004) amount interest amount interest amount interest estimated sample
(1) (12) (13) (14) (15) (16) (17) (18) (19) 01405 0 X 0 0 0 0 233 5
15 1403 X 51 6 12944 2272 185605 1576 16 0 X 0 0 9318 2271 5199 50 17 945 X 33 8 9275 1248 129161 547 18 348 X 13 18 3871 691 124596 1110
19 402 X 460 0 7335 817 3164 34 20 607 X 33 69 6406 1413 70010 674 21 0 X 0 0 12024 1364 1736 15 22 5593 X 0 0 37025 5038 5897 84 23 0 X 3729 779 6784 1395 1756 15
24 4889 X 0 0 25648 4481 3943 89 25 7590 X 830 299 129901 16270 7104 89 26 3664 X 18 2 26621 4329 32220 366 27 12 X 0 0 14559 4445 2598 46 28 2080 X 17 23 22386 2847 62155 685
29 5733 X 0 0 12966 1024 8017 139 30 - - - - - - - 0 31 1297 X 760 721 32963 4398 7903 110 32 0 X 0 0 0 0 252 2 33 0 X 0 0 162854 38540 1153 3
34 1366 X 0 0 25811 2404 1319 30 35 4357 X 0 0 20027 1787 1062 33 36 1510 X 6 1 14586 2491 89891 1028 37 880 X 0 0 15464 1742 293 8 all 1371 X 53 27 13536 2140 745269 6738

Appendix A
NSS Report No. 525: Unorganised Manufacturing Sector in India, 2005-06: Employment, Assets and Borrowings. A - 183
Table 9: Outstanding loans per enterprise (in Rs.) on the date of survey and annual interest
payable per enterprise (in Rs.) by source agency of loan for each industry Rural DME all-India
agency from which loan is taken central and state level term lending institution, govern-ment (central, state, local
bodies), banks and societies
other institutional
agencies money lenders business partner supplier /
contractor industry
(NIC 2004)
amount interest amount interest amount interest amount interest amount interest(1) (2) (3) (4) (5) (6) (7) (8) (9) (10) (11)
01405 183507 187700 0 0 10254 1288 2117 195 50134 372 15 60685 10545 58355 3289 4339 919 6387 1694 1274 90 16 37477 40037 313 38 190 114 0 0 0 0 17 54318 7188 1491 188 7171 1194 61 12 1985 1 18 53308 4071 2494 453 2166 275 5200 531 513 492
19 17602 1936 0 0 14662 11762 0 0 0 0 20 74075 22723 17267 6897 25158 4491 599 44 108 0 21 167060 37147 1380 189 9940 1177 152511 11735 777 0 22 42523 11284 33 12 13595 1864 5007 601 0 0 23 529754 57134 0 0 8742 928 0 0 0 0
24 101820 17328 25772 15181 13721 4494 382 7 5375 220 25 313958 46898 71500 8257 29102 3146 72960 5722 10518 300 26 61745 19133 10132 1221 25788 5843 9679 847 839 48 27 2256470 280576 50015 58063 128355 31997 86122 6004 58768 2284 28 132500 55622 2467 231 1866 394 752 246 135 0
29 121011 15843 10625 1488 8498 2940 49810 5083 19737 0 30 0 0 0 0 0 0 0 0 0 0 31 677406 65157 2923 350 44664 3612 851342 94736 0 0 32 1852402 60286 0 0 53561 11673 0 0 0 0 33 89259 18161 9148 937 15233 1828 0 0 64194 0
34 112337 7653 243 35 8359 1977 0 0 0 0 35 177022 10267 0 0 36595 1230 0 0 0 0 36 17199 2498 1367 283 11446 1714 6 1 694 21 37 0 0 0 0 11292 4065 0 0 0 0 all 81249 14768 28874 2945 11210 2424 9420 1322 1913 79

Appendix A
NSS Report No. 525: Unorganised Manufacturing Sector in India, 2005-06: Employment, Assets and Borrowings. A - 184
Table 9 (continued): Outstanding loans per enterprise (in Rs.) on the date of survey
and annual interest payable per enterprise (in Rs.) by source agency of loan for each industry
Rural DME all-India
agency from which loan is taken friends and relatives others total
number of enterprises
industry (NIC 2004) amount interest amount interest amount interest estimated sample
(1) (12) (13) (14) (15) (16) (17) (18) (19) 01405 17616 X 0 0 263628 189555 284 19
15 2633 X 4975 1132 138649 17670 112057 772 16 1741 X 1330 548 41052 40737 1277 25 17 5175 X 942 193 71145 8776 47378 460 18 136 X 47 0 63865 5822 3780 63
19 283 X 0 0 32547 13698 2462 23 20 6809 X 4 1 124019 34155 7962 200 21 48760 X 67 0 380495 50249 2262 47 22 1247 X 2784 399 65189 14160 1943 28 23 877 X 63815 55463 603188 113525 638 20
24 31541 X 4575 619 183186 37847 13570 270 25 167112 X 1772 374 666922 64696 3215 150 26 6534 X 7176 921 121894 28013 45046 1472 27 39368 X 7365 970 2626463 379893 1315 76 28 9542 X 695 183 147957 56676 5078 222
29 124189 X 10239 559 344110 25913 1493 61 30 - - - - - - - 0 31 18485 X 20000 3098 1614820 166953 726 49 32 0 X 0 0 1905963 71958 458 2 33 117871 X 676 0 296381 20926 66 8
34 9263 X 0 0 130202 9666 4420 32 35 8340 X 15370 1844 237327 13341 137 21 36 984 X 6 3 31700 4521 18546 226 37 0 X 0 0 11292 4065 164 5 all 8542 X 3962 837 145171 22375 274277 4251
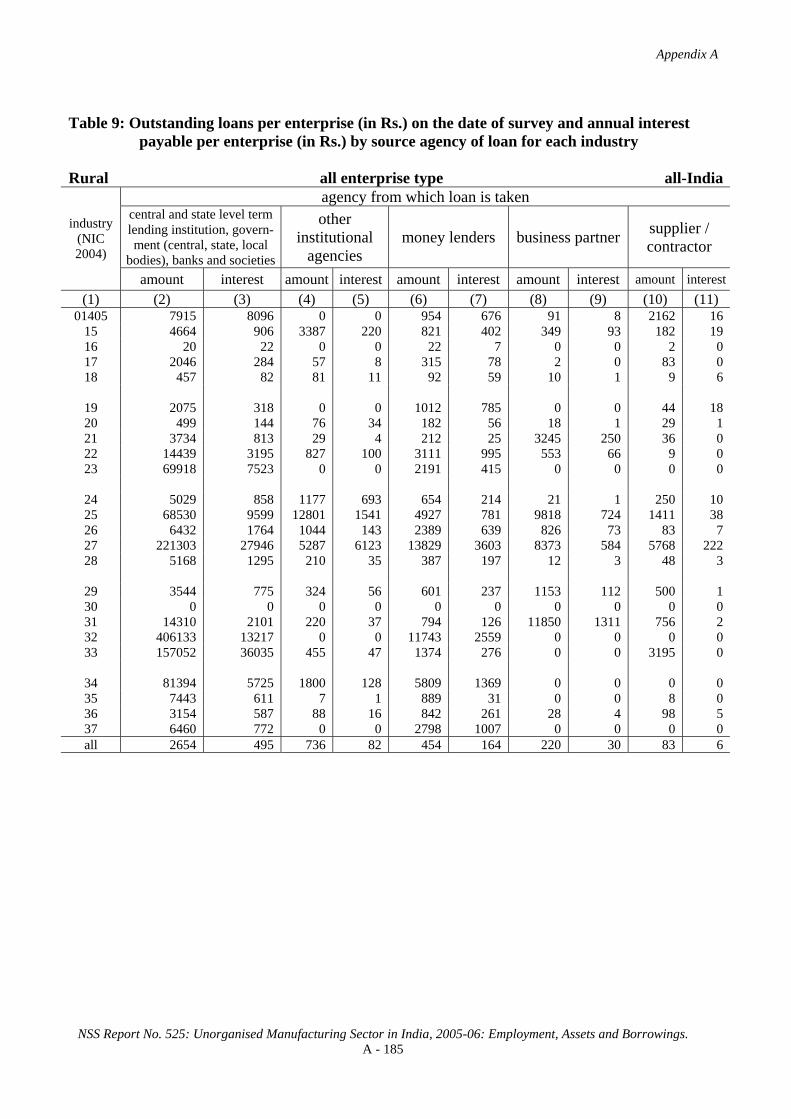
Appendix A
NSS Report No. 525: Unorganised Manufacturing Sector in India, 2005-06: Employment, Assets and Borrowings. A - 185
Table 9: Outstanding loans per enterprise (in Rs.) on the date of survey and annual interest
payable per enterprise (in Rs.) by source agency of loan for each industry Rural all enterprise type all-India
agency from which loan is taken central and state level term lending institution, govern-ment (central, state, local
bodies), banks and societies
other institutional
agencies money lenders business partner supplier /
contractor industry
(NIC 2004)
amount interest amount interest amount interest amount interest amount interest(1) (2) (3) (4) (5) (6) (7) (8) (9) (10) (11)
01405 7915 8096 0 0 954 676 91 8 2162 16 15 4664 906 3387 220 821 402 349 93 182 19 16 20 22 0 0 22 7 0 0 2 0 17 2046 284 57 8 315 78 2 0 83 0 18 457 82 81 11 92 59 10 1 9 6
19 2075 318 0 0 1012 785 0 0 44 18 20 499 144 76 34 182 56 18 1 29 1 21 3734 813 29 4 212 25 3245 250 36 0 22 14439 3195 827 100 3111 995 553 66 9 0 23 69918 7523 0 0 2191 415 0 0 0 0
24 5029 858 1177 693 654 214 21 1 250 10 25 68530 9599 12801 1541 4927 781 9818 724 1411 38 26 6432 1764 1044 143 2389 639 826 73 83 7 27 221303 27946 5287 6123 13829 3603 8373 584 5768 222 28 5168 1295 210 35 387 197 12 3 48 3
29 3544 775 324 56 601 237 1153 112 500 1 30 0 0 0 0 0 0 0 0 0 0 31 14310 2101 220 37 794 126 11850 1311 756 2 32 406133 13217 0 0 11743 2559 0 0 0 0 33 157052 36035 455 47 1374 276 0 0 3195 0
34 81394 5725 1800 128 5809 1369 0 0 0 0 35 7443 611 7 1 889 31 0 0 8 0 36 3154 587 88 16 842 261 28 4 98 5 37 6460 772 0 0 2798 1007 0 0 0 0 all 2654 495 736 82 454 164 220 30 83 6

Appendix A
NSS Report No. 525: Unorganised Manufacturing Sector in India, 2005-06: Employment, Assets and Borrowings. A - 186
Table 9 (continued): Outstanding loans per enterprise (in Rs.) on the date of survey
and annual interest payable per enterprise (in Rs.) by source agency of loan for each industry
Rural all enterprise type all-India
agency from which loan is taken friends and relatives others total
number of enterprises
industry (NIC 2004) amount interest amount interest amount interest estimated sample
(1) (12) (13) (14) (15) (16) (17) (18) (19) 01405 760 X 0 0 11882 8797 6580 63
15 583 X 334 104 10320 1743 2075265 8657 16 1 X 1 0 47 30 2342653 1669 17 228 X 32 6 2763 376 1765539 3977 18 97 X 2 1 749 160 1943561 8681
19 55 X 40 1 3225 1122 38355 217 20 83 X 16 5 903 241 1914554 5839 21 1038 X 1 0 8296 1092 106292 184 22 2156 X 333 62 21428 4419 17590 226 23 115 X 9751 7583 81974 15520 4849 64
24 1505 X 212 29 8848 1804 297318 719 25 23352 X 457 131 121296 12815 25394 320 26 830 X 610 79 12214 2704 536056 3849 27 5808 X 2121 2118 262489 40597 13520 186 28 559 X 24 22 6407 1555 369778 2485
29 3479 X 271 24 9873 1206 68219 580 30 0 X 0 0 0 0 57 1 31 778 X 401 153 29110 3731 52476 460 32 2 X 0 0 417878 15777 2088 13 33 15338 X 75 0 177488 36357 1330 15
34 6828 X 0 0 95832 7222 6390 73 35 1847 X 370 44 10563 687 5681 82 36 540 X 102 17 4852 890 534059 3676 37 390 X 0 0 9647 1779 662 14 all 374 X 114 32 4634 809 12128266 42050

Appendix A
NSS Report No. 525: Unorganised Manufacturing Sector in India, 2005-06: Employment, Assets and Borrowings. A - 187
Table 9: Outstanding loans per enterprise (in Rs.) on the date of survey and annual interest
payable per enterprise (in Rs.) by source agency of loan for each industry Urban OAME all-India
agency from which loan is taken central and state level term lending institution, govern-ment (central, state, local
bodies), banks and societies
other institutional
agencies money lenders business partner supplier /
contractor industry
(NIC 2004)
amount interest amount interest amount interest amount interest amount interest(1) (2) (3) (4) (5) (6) (7) (8) (9) (10) (11)
01405 947 303 0 0 3283 1667 0 0 0 0 15 1312 288 190 39 806 323 43 9 299 25 16 0 0 1 0 0 0 0 0 0 0 17 497 102 15 5 264 63 3 0 41 3 18 275 55 23 25 86 45 0 0 1 0
19 437 71 9 2 207 154 0 0 46 0 20 587 82 76 22 307 138 0 0 1 0 21 26 5 9 3 215 30 0 0 7 0 22 2982 527 1835 493 819 250 0 0 0 0 23 0 0 0 0 14298 41177 0 0 0 0
24 267 51 16 10 32 21 0 0 0 0 25 1022 130 68 8 245 37 0 0 38 19 26 800 411 0 0 225 121 0 0 20 0 27 379 230 0 0 0 0 0 0 36 0 28 1117 170 87 21 202 288 0 0 47 0
29 14245 1811 49 16 2178 682 0 0 669 0 30 0 0 3000 1200 0 0 0 0 0 0 31 803 242 521 88 1090 267 11 0 0 0 32 0 0 0 0 0 0 0 0 664 0 33 537 534 11470 1261 0 0 0 0 60 7
34 0 0 0 0 0 0 0 0 0 0 35 2672 561 2631 474 0 0 0 0 0 0 36 2106 477 204 55 504 184 222 21 28 0 37 695 83 0 0 0 0 0 0 927 0 all 832 167 103 30 286 118 31 3 51 3

Appendix A
NSS Report No. 525: Unorganised Manufacturing Sector in India, 2005-06: Employment, Assets and Borrowings. A - 188
Table 9 (continued): Outstanding loans per enterprise (in Rs.) on the date of survey
and annual interest payable per enterprise (in Rs.) by source agency of loan for each industry
Urban OAME all-India
agency from which loan is taken friends and relatives others total
number of enterprises
industry (NIC 2004) amount interest amount interest amount interest estimated sample
(1) (12) (13) (14) (15) (16) (17) (18) (19) 01405 61 X 0 0 4291 1970 1671 33
15 318 X 43 8 3011 693 346262 3111 16 1 X 0 0 2 0 468361 1244 17 132 X 15 1 967 174 587131 2772 18 166 X 25 8 575 133 1020685 7703
19 1731 X 0 0 2430 227 58191 331 20 530 X 0 0 1501 243 159382 1330 21 3 X 0 0 260 38 45637 340 22 918 X 20 4 6573 1275 44652 478 23 0 X 0 0 14298 41177 656 6
24 276 X 0 0 591 81 105788 400 25 55 X 0 0 1427 194 15190 142 26 157 X 1 0 1204 532 68437 681 27 273 X 0 0 688 230 9380 137 28 169 X 0 0 1621 479 84071 874
29 1741 X 2 1 18884 2511 37355 395 30 0 X 0 0 3000 1200 98 1 31 1306 X 6 2 3737 599 27359 373 32 0 X 0 0 664 0 921 16 33 1529 X 0 0 13597 1803 3796 43
34 0 X 0 0 0 0 907 15 35 1 X 0 0 5304 1035 5018 65 36 585 X 7402 705 11052 1442 411325 3481 37 753 X 0 0 2375 83 1913 13 all 283 X 883 86 2468 407 3504186 23984

Appendix A
NSS Report No. 525: Unorganised Manufacturing Sector in India, 2005-06: Employment, Assets and Borrowings. A - 189
Table 9: Outstanding loans per enterprise (in Rs.) on the date of survey and annual interest
payable per enterprise (in Rs.) by source agency of loan for each industry Urban NDME all-India
agency from which loan is taken central and state level term lending institution, govern-ment (central, state, local
bodies), banks and societies
other institutional
agencies money lenders business partner supplier /
contractor industry
(NIC 2004)
amount interest amount interest amount interest amount interest amount interest(1) (2) (3) (4) (5) (6) (7) (8) (9) (10) (11)
01405 1422 158 0 0 0 0 0 0 0 0 15 9474 2285 1142 116 2363 2148 175 50 996 23 16 71 7 0 0 0 0 0 0 568 0 17 5924 972 155 25 2303 498 10 0 909 96 18 2283 293 190 70 967 345 50 8 65 3
19 2146 320 0 0 152 65 0 0 43 11 20 7887 1256 279 26 4415 1519 0 0 83 0 21 8947 431 893 631 0 0 0 0 29 0 22 26249 5297 484 73 928 223 0 0 52 0 23 45333 4080 0 0 0 0 0 0 0 0
24 10063 1008 465 97 8182 679 0 0 3785 0 25 14978 1562 1806 637 4984 1717 149 0 475 15 26 10456 1471 628 75 1846 984 0 0 88 51 27 12519 1779 0 0 7499 137 77 0 0 0 28 15716 2356 762 220 2124 653 15 2 355 24
29 16969 2231 9188 1226 3952 2663 3006 268 1210 12 30 1526 146 0 0 45866 1126 0 0 0 0 31 6356 821 284 42 456 99 2226 239 38 0 32 209 48 0 0 84 253 0 0 0 0 33 2862 1411 3078 349 0 0 0 0 468 56
34 21834 21972 1409 189 2634 1706 0 0 560 1940 35 17526 7496 0 0 72 43 0 0 1176 0 36 13734 1565 567 81 1874 867 18 2 1181 1 37 80592 10476 16876 5630 0 0 0 0 0 0 all 9845 1665 921 156 2049 921 225 26 584 31

Appendix A
NSS Report No. 525: Unorganised Manufacturing Sector in India, 2005-06: Employment, Assets and Borrowings. A - 190
Table 9 (continued): Outstanding loans per enterprise (in Rs.) on the date of survey
and annual interest payable per enterprise (in Rs.) by source agency of loan for each industry
Urban NDME all-India
agency from which loan is taken friends and relatives others total
number of enterprises
industry (NIC 2004) amount interest amount interest amount interest estimated sample
(1) (12) (13) (14) (15) (16) (17) (18) (19) 01405 0 X 0 0 1422 158 783 13
15 945 X 1054 86 16148 4708 149611 1816 16 0 X 0 0 639 7 6093 27 17 5714 X 12 0 15028 1592 115782 770 18 936 X 154 16 4646 734 201087 2461
19 2103 X 514 144 4958 540 31626 232 20 524 X 78 7 13266 2808 53423 612 21 1236 X 579 37 11684 1099 11199 99 22 3385 X 355 117 31453 5709 39961 573 23 0 X 0 0 45333 4080 185 3
24 1859 X 1552 86 25907 1870 5039 84 25 4916 X 1692 225 29000 4156 18807 201 26 4805 X 64 11 17888 2592 24866 263 27 1123 X 7637 728 28855 2644 7454 124 28 6975 X 60 18 26007 3272 122074 1219
29 13019 X 1642 185 48986 6585 44052 429 30 0 X 0 0 47392 1272 533 6 31 1941 X 33 1 11333 1202 23638 325 32 0 X 1025 21 1318 321 1032 14 33 609 X 26703 1631 33720 3447 3263 41
34 5197 X 336 27 31970 25835 5459 75 35 1333 X 0 0 20108 7539 5015 87 36 1505 X 216518 24805 235397 27320 153350 1834 37 13705 X 704 195 111877 16300 684 14 all 3134 X 32881 3762 49638 6562 1025013 11322

Appendix A
NSS Report No. 525: Unorganised Manufacturing Sector in India, 2005-06: Employment, Assets and Borrowings. A - 191
Table 9: Outstanding loans per enterprise (in Rs.) on the date of survey and annual interest
payable per enterprise (in Rs.) by source agency of loan for each industry Urban DME all-India
agency from which loan is taken central and state level term lending institution, govern-ment (central, state, local
bodies), banks and societies
other institutional
agencies money lenders business partner supplier /
contractor industry
(NIC 2004)
amount interest amount interest amount interest amount interest amount interest(1) (2) (3) (4) (5) (6) (7) (8) (9) (10) (11)
01405 1338010 186846 8078 359 46946 7824 95368 14497 0 0 15 189219 29017 8526 1068 39474 6803 43043 4257 4701 906 16 24772 2334 902 107 242 58 54937 9316 8044 193 17 41452 4506 6879 533 15955 2813 1521 326 2062 799 18 49980 5115 468 247 41414 3780 22331 3069 98 13
19 44167 4133 4499 4441 4605 711 736 49 463 71 20 112757 23722 463 46 51828 7496 4048 368 949 82 21 148689 21648 1096 73 60637 9179 4160 167 4458 377 22 352819 35652 41708 4415 27785 2901 9703 683 82639 2332 23 281720 44946 0 0 68067 6981 7864 708 0 0
24 150280 13603 6241 5162 79086 20497 31825 3209 2933 132 25 164211 18856 4211 402 20005 3246 3588 329 5007 260 26 139234 15223 9749 1500 34300 8237 1611 605 2501 948 27 137363 15222 150209 94420 35079 3474 18794 876 7352 466 28 194401 81010 10191 1254 21752 5030 1690 154 3799 74
29 76699 16247 40108 2509 23043 2580 4064 2709 1712 6 30 5608522 402345 47959 1980 8147 502 1351 0 0 0 31 139225 16244 11503 1412 29305 4834 37516 2654 12378 1082 32 53616 6027 921 210 40578 7680 0 0 9373 0 33 234724 23800 31052 4469 15220 1184 9310 797 3498 0
34 202293 22809 3242 242 4284 543 21193 2091 3681 803 35 37629 3710 110 11 9666 1159 13504 1491 1337 5 36 349398 32126 1081 122 3237 883 4506 946 746 31 37 172401 22018 334 53 7867 1074 0 0 1085 336 all 144116 22497 10420 2195 24179 3936 10286 1344 5438 444

Appendix A
NSS Report No. 525: Unorganised Manufacturing Sector in India, 2005-06: Employment, Assets and Borrowings. A - 192
Table 9 (continued): Outstanding loans per enterprise (in Rs.) on the date of survey
and annual interest payable per enterprise (in Rs.) by source agency of loan for each industry
Urban DME all-India
agency from which loan is taken friends and relatives others total
number of enterprises
industry (NIC 2004) amount interest amount interest amount interest estimated sample
(1) (12) (13) (14) (15) (16) (17) (18) (19) 01405 24137 X 0 0 1512540 209525 97 10
15 25837 X 16326 1993 327126 44093 31669 995 16 4624 X 5117 314 98637 12321 1043 27 17 10415 X 597 51 78883 9029 99361 709 18 6060 X 24763 1946 145115 14171 48537 357
19 5264 X 7143 441 66875 9846 15853 153 20 16095 X 1449 141 187590 31856 10912 158 21 117580 X 24090 1696 360709 33139 4951 119 22 60730 X 29769 1926 605153 47909 15712 272 23 53056 X 14821 1977 425527 54612 196 15
24 25990 X 70622 8672 366976 51276 10065 256 25 47673 X 42357 3040 287051 26132 12920 250 26 42146 X 6018 174 235558 26686 12459 188 27 24528 X 44877 3222 418203 117679 4779 142 28 12253 X 62968 5923 307053 93443 43951 525
29 16118 X 26653 2664 188397 26714 24641 330 30 0 X 7094 1557 5673074 406384 211 11 31 100673 X 26559 1856 357159 28082 7317 279 32 37370 X 9287 762 151145 14678 1704 37 33 7202 X 16477 1297 317482 31547 1178 45
34 12559 X 6777 451 254029 26940 2504 92 35 8383 X 1313 73 71943 6449 9389 89 36 5405 X 51239 3341 415613 37448 53273 470 37 0 X 13031 1531 194718 25012 632 12 all 18441 X 25336 2124 238215 32543 413355 5541
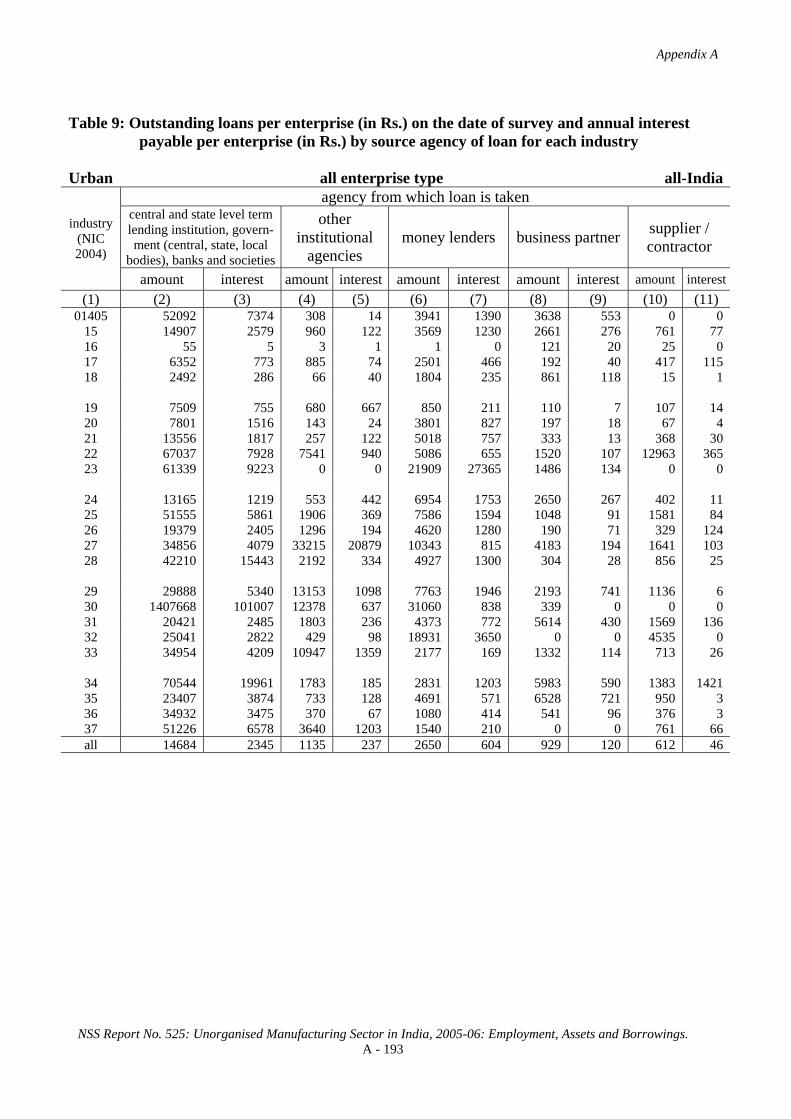
Appendix A
NSS Report No. 525: Unorganised Manufacturing Sector in India, 2005-06: Employment, Assets and Borrowings. A - 193
Table 9: Outstanding loans per enterprise (in Rs.) on the date of survey and annual interest
payable per enterprise (in Rs.) by source agency of loan for each industry Urban all enterprise type all-India
agency from which loan is taken central and state level term lending institution, govern-ment (central, state, local
bodies), banks and societies
other institutional
agencies money lenders business partner supplier /
contractor industry
(NIC 2004)
amount interest amount interest amount interest amount interest amount interest(1) (2) (3) (4) (5) (6) (7) (8) (9) (10) (11)
01405 52092 7374 308 14 3941 1390 3638 553 0 0 15 14907 2579 960 122 3569 1230 2661 276 761 77 16 55 5 3 1 1 0 121 20 25 0 17 6352 773 885 74 2501 466 192 40 417 115 18 2492 286 66 40 1804 235 861 118 15 1
19 7509 755 680 667 850 211 110 7 107 14 20 7801 1516 143 24 3801 827 197 18 67 4 21 13556 1817 257 122 5018 757 333 13 368 30 22 67037 7928 7541 940 5086 655 1520 107 12963 365 23 61339 9223 0 0 21909 27365 1486 134 0 0
24 13165 1219 553 442 6954 1753 2650 267 402 11 25 51555 5861 1906 369 7586 1594 1048 91 1581 84 26 19379 2405 1296 194 4620 1280 190 71 329 124 27 34856 4079 33215 20879 10343 815 4183 194 1641 103 28 42210 15443 2192 334 4927 1300 304 28 856 25
29 29888 5340 13153 1098 7763 1946 2193 741 1136 6 30 1407668 101007 12378 637 31060 838 339 0 0 0 31 20421 2485 1803 236 4373 772 5614 430 1569 136 32 25041 2822 429 98 18931 3650 0 0 4535 0 33 34954 4209 10947 1359 2177 169 1332 114 713 26
34 70544 19961 1783 185 2831 1203 5983 590 1383 1421 35 23407 3874 733 128 4691 571 6528 721 950 3 36 34932 3475 370 67 1080 414 541 96 376 3 37 51226 6578 3640 1203 1540 210 0 0 761 66 all 14684 2345 1135 237 2650 604 929 120 612 46

Appendix A
NSS Report No. 525: Unorganised Manufacturing Sector in India, 2005-06: Employment, Assets and Borrowings. A - 194
Table 9 (continued): Outstanding loans per enterprise (in Rs.) on the date of survey
and annual interest payable per enterprise (in Rs.) by source agency of loan for each industry
Urban all enterprise type all-India
agency from which loan is taken friends and relatives others total
number of enterprises
industry (NIC 2004) amount interest amount interest amount interest estimated sample
(1) (12) (13) (14) (15) (16) (17) (18) (19) 01405 961 X 0 0 60939 9330 2551 56
15 2028 X 1308 149 26194 4437 527542 5922 16 11 X 11 1 227 27 475497 1298 17 2211 X 87 7 12646 1475 802274 4251 18 513 X 991 83 6742 764 1270308 10521
19 2373 X 1226 109 12855 1763 105669 716 20 1288 X 89 9 13387 2397 223716 2100 21 9649 X 2035 143 31216 2883 61787 558 22 11268 X 4812 350 110225 10344 100324 1323 23 10028 X 2801 374 97564 37096 1037 24
24 2483 X 5945 726 32151 4418 120892 740 25 15116 X 12342 927 91135 8925 46917 593 26 6196 X 725 23 32735 4098 105762 1132 27 5930 X 12557 964 102726 27033 21613 403 28 5615 X 11095 1050 67200 18179 250097 2618
29 9767 X 6876 696 70776 9827 106048 1154 30 0 X 1779 391 1453224 102872 842 18 31 14031 X 3348 234 51160 4292 58314 977 32 17412 X 4616 361 70965 6930 3656 67 33 1976 X 12935 832 65033 6708 8237 129
34 6744 X 2120 144 91387 23504 8870 182 35 4397 X 635 35 41341 5332 19421 241 36 1229 X 63075 6913 101602 10968 617948 5785 37 3349 X 2700 341 63217 8398 3229 39 all 2393 X 9564 1019 31966 4371 4942554 40847

Appendix A
NSS Report No. 525: Unorganised Manufacturing Sector in India, 2005-06: Employment, Assets and Borrowings. A - 195
Table 9: Outstanding loans per enterprise (in Rs.) on the date of survey and annual interest
payable per enterprise (in Rs.) by source agency of loan for each industry Rural + Urban OAME all-India
agency from which loan is taken central and state level term lending institution, govern-ment (central, state, local
bodies), banks and societies
other institutional
agencies money lenders business partner supplier /
contractor industry
(NIC 2004)
amount interest amount interest amount interest amount interest amount interest(1) (2) (3) (4) (5) (6) (7) (8) (9) (10) (11)
01405 205 65 0 0 1144 888 0 0 0 0 15 905 244 88 24 605 364 10 3 93 7 16 0 0 0 0 1 2 0 0 2 0 17 157 34 5 2 153 50 1 0 28 1 18 253 58 21 11 66 44 0 0 4 3
19 453 99 6 1 162 111 0 0 47 8 20 101 26 8 2 63 34 0 0 7 1 21 10 2 3 1 66 9 0 0 2 0 22 2915 775 1543 409 696 230 0 0 3 0 23 0 0 0 0 3202 8796 0 0 0 0
24 178 24 5 3 14 9 0 0 0 0 25 833 113 81 15 127 20 0 0 20 10 26 310 81 11 4 114 70 0 0 10 3 27 385 137 302 340 161 194 0 0 29 0 28 550 205 113 18 131 152 0 0 22 0
29 5761 957 19 6 1089 372 0 0 281 0 30 0 0 1894 757 0 0 0 0 0 0 31 1255 620 200 34 499 133 55 0 0 0 32 0 0 0 0 0 0 0 0 266 0 33 4391 1100 11146 1226 210 63 0 0 59 7
34 0 0 1145 160 115 4 0 0 0 0 35 1574 316 1389 250 0 0 0 0 5 0 36 1464 361 104 28 399 150 109 10 31 2 37 628 75 0 0 0 0 0 0 837 0 all 395 99 39 11 179 97 8 1 25 2

Appendix A
NSS Report No. 525: Unorganised Manufacturing Sector in India, 2005-06: Employment, Assets and Borrowings. A - 196
Table 9 (continued): Outstanding loans per enterprise (in Rs.) on the date of survey
and annual interest payable per enterprise (in Rs.) by source agency of loan for each industry
Rural + Urban OAME all-India
agency from which loan is taken friends and relatives others total
number of enterprises
industry (NIC 2004) amount interest amount interest amount interest estimated sample
(1) (12) (13) (14) (15) (16) (17) (18) (19) 01405 13 X 0 0 1362 954 7734 72
15 360 X 67 43 2129 686 2123865 9420 16 0 X 0 0 3 2 2804538 2838 17 52 X 8 1 403 87 2176131 5742 18 111 X 10 3 465 119 2835870 15211
19 1110 X 1 0 1779 219 90919 491 20 74 X 14 2 266 64 1995963 6295 21 1 X 0 0 83 12 147931 462 22 799 X 24 9 5981 1423 54402 592 23 0 X 0 0 3202 8796 3111 35
24 76 X 2 0 276 36 385593 760 25 87 X 0 0 1148 157 30264 223 26 82 X 6 2 533 161 527228 2692 27 1543 X 1001 1441 3421 2112 18988 201 28 112 X 11 15 938 389 386616 2452
29 739 X 34 9 7923 1344 96064 775 30 0 X 0 0 1894 757 155 2 31 743 X 10 2 2762 789 71207 674 32 2 X 0 0 268 0 2300 25 33 4710 X 14 0 20529 2395 3906 47
34 573 X 0 0 1832 164 1559 26 35 498 X 0 0 3466 566 9500 93 36 448 X 3703 357 6259 909 836946 5903 37 680 X 0 0 2145 75 2118 14 all 148 X 229 30 1023 240 14612907 55045
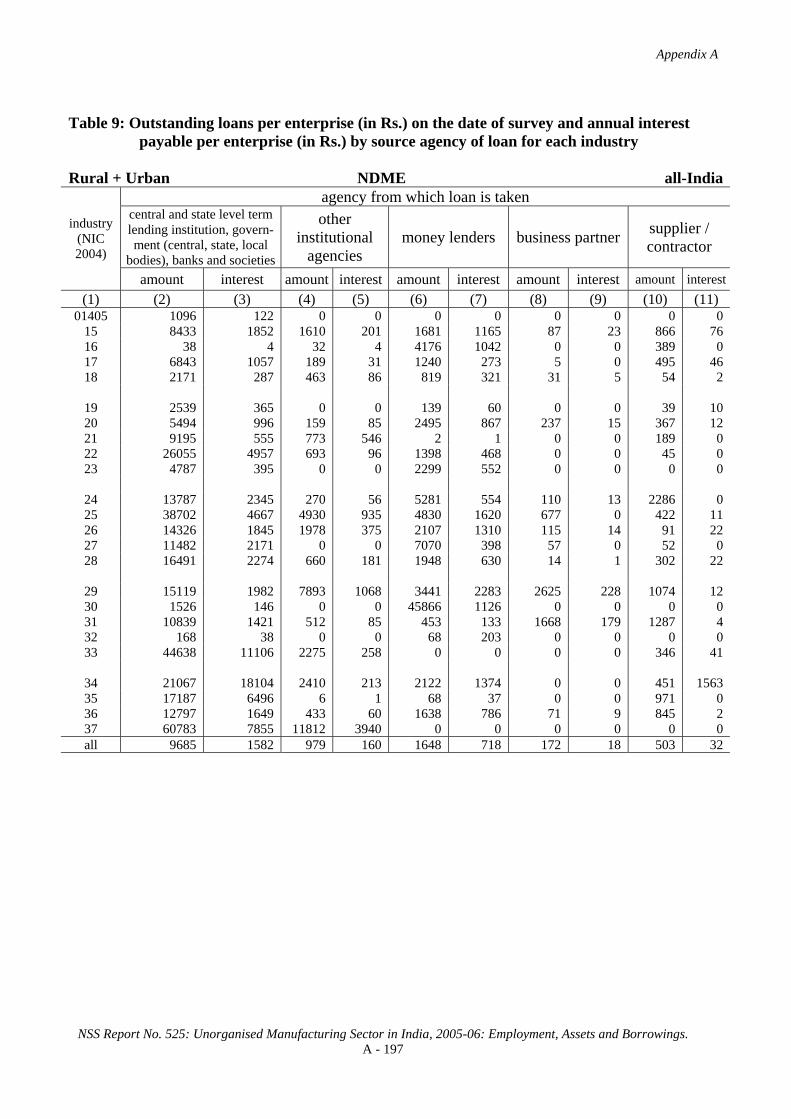
Appendix A
NSS Report No. 525: Unorganised Manufacturing Sector in India, 2005-06: Employment, Assets and Borrowings. A - 197
Table 9: Outstanding loans per enterprise (in Rs.) on the date of survey and annual interest
payable per enterprise (in Rs.) by source agency of loan for each industry Rural + Urban NDME all-India
agency from which loan is taken central and state level term lending institution, govern-ment (central, state, local
bodies), banks and societies
other institutional
agencies money lenders business partner supplier /
contractor industry
(NIC 2004)
amount interest amount interest amount interest amount interest amount interest(1) (2) (3) (4) (5) (6) (7) (8) (9) (10) (11)
01405 1096 122 0 0 0 0 0 0 0 0 15 8433 1852 1610 201 1681 1165 87 23 866 76 16 38 4 32 4 4176 1042 0 0 389 0 17 6843 1057 189 31 1240 273 5 0 495 46 18 2171 287 463 86 819 321 31 5 54 2
19 2539 365 0 0 139 60 0 0 39 10 20 5494 996 159 85 2495 867 237 15 367 12 21 9195 555 773 546 2 1 0 0 189 0 22 26055 4957 693 96 1398 468 0 0 45 0 23 4787 395 0 0 2299 552 0 0 0 0
24 13787 2345 270 56 5281 554 110 13 2286 0 25 38702 4667 4930 935 4830 1620 677 0 422 11 26 14326 1845 1978 375 2107 1310 115 14 91 22 27 11482 2171 0 0 7070 398 57 0 52 0 28 16491 2274 660 181 1948 630 14 1 302 22
29 15119 1982 7893 1068 3441 2283 2625 228 1074 12 30 1526 146 0 0 45866 1126 0 0 0 0 31 10839 1421 512 85 453 133 1668 179 1287 4 32 168 38 0 0 68 203 0 0 0 0 33 44638 11106 2275 258 0 0 0 0 346 41
34 21067 18104 2410 213 2122 1374 0 0 451 1563 35 17187 6496 6 1 68 37 0 0 971 0 36 12797 1649 433 60 1638 786 71 9 845 2 37 60783 7855 11812 3940 0 0 0 0 0 0 all 9685 1582 979 160 1648 718 172 18 503 32
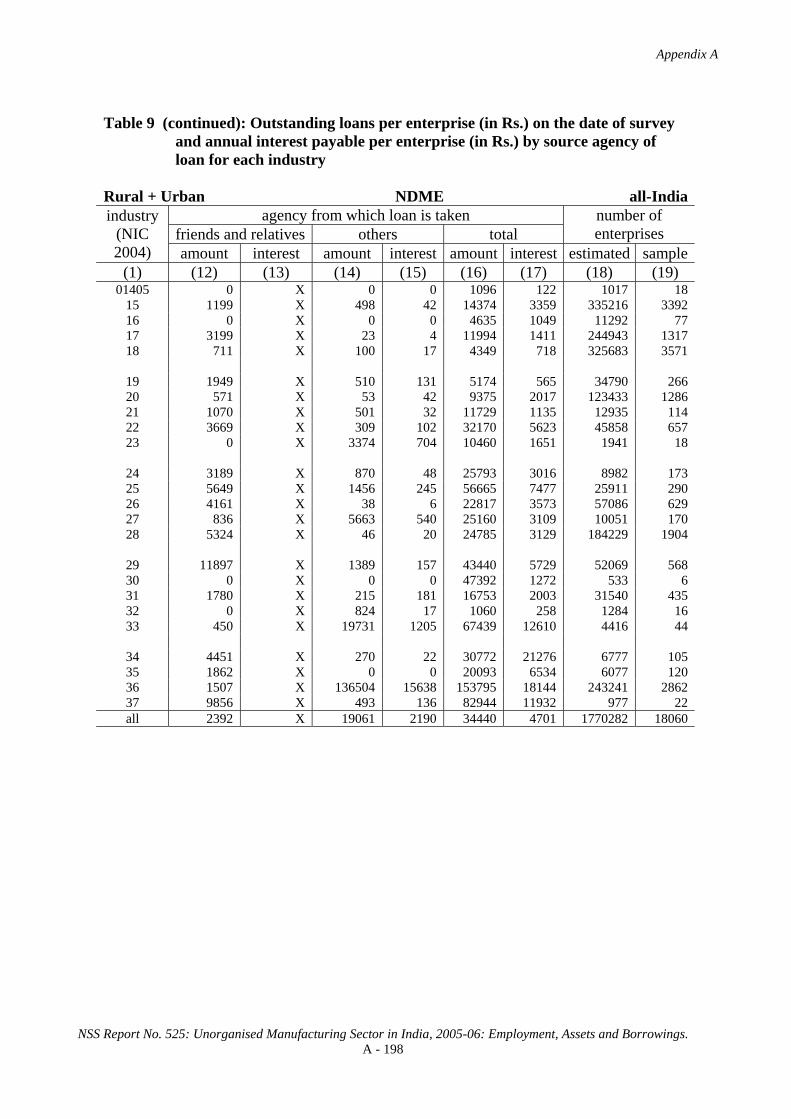
Appendix A
NSS Report No. 525: Unorganised Manufacturing Sector in India, 2005-06: Employment, Assets and Borrowings. A - 198
Table 9 (continued): Outstanding loans per enterprise (in Rs.) on the date of survey
and annual interest payable per enterprise (in Rs.) by source agency of loan for each industry
Rural + Urban NDME all-India
agency from which loan is taken friends and relatives others total
number of enterprises
industry (NIC 2004) amount interest amount interest amount interest estimated sample
(1) (12) (13) (14) (15) (16) (17) (18) (19) 01405 0 X 0 0 1096 122 1017 18
15 1199 X 498 42 14374 3359 335216 3392 16 0 X 0 0 4635 1049 11292 77 17 3199 X 23 4 11994 1411 244943 1317 18 711 X 100 17 4349 718 325683 3571
19 1949 X 510 131 5174 565 34790 266 20 571 X 53 42 9375 2017 123433 1286 21 1070 X 501 32 11729 1135 12935 114 22 3669 X 309 102 32170 5623 45858 657 23 0 X 3374 704 10460 1651 1941 18
24 3189 X 870 48 25793 3016 8982 173 25 5649 X 1456 245 56665 7477 25911 290 26 4161 X 38 6 22817 3573 57086 629 27 836 X 5663 540 25160 3109 10051 170 28 5324 X 46 20 24785 3129 184229 1904
29 11897 X 1389 157 43440 5729 52069 568 30 0 X 0 0 47392 1272 533 6 31 1780 X 215 181 16753 2003 31540 435 32 0 X 824 17 1060 258 1284 16 33 450 X 19731 1205 67439 12610 4416 44
34 4451 X 270 22 30772 21276 6777 105 35 1862 X 0 0 20093 6534 6077 120 36 1507 X 136504 15638 153795 18144 243241 2862 37 9856 X 493 136 82944 11932 977 22 all 2392 X 19061 2190 34440 4701 1770282 18060

Appendix A
NSS Report No. 525: Unorganised Manufacturing Sector in India, 2005-06: Employment, Assets and Borrowings. A - 199
Table 9: Outstanding loans per enterprise (in Rs.) on the date of survey and annual interest
payable per enterprise (in Rs.) by source agency of loan for each industry Rural + Urban DME all-India
agency from which loan is taken central and state level term lending institution, govern-ment (central, state, local
bodies), banks and societies
other institutional
agencies money lenders business partner supplier /
contractor industry
(NIC 2004)
amount interest amount interest amount interest amount interest amount interest(1) (2) (3) (4) (5) (6) (7) (8) (9) (10) (11)
01405 478309 187482 2063 92 19624 2957 25928 3847 37332 277 15 89007 14615 47376 2800 12081 2215 14464 2259 2029 270 16 31764 23084 578 69 213 89 24702 4189 3617 87 17 45606 5372 5139 422 13119 2291 1050 225 2037 541 18 50220 5040 615 262 38579 3527 21094 2886 128 48
19 40595 3838 3894 3844 5957 2197 637 43 400 61 20 96439 23301 7552 2936 40577 6229 2593 231 595 47 21 154449 26508 1185 109 44741 6670 50675 3794 3304 259 22 318662 32969 37120 3930 26223 2787 9186 674 73543 2075 23 471470 54270 0 0 22682 2350 1848 166 0 0
24 122457 15742 17454 10914 41557 11309 13772 1370 4335 182 25 194050 24443 17619 1967 21818 3226 17411 1403 6105 268 26 78534 18286 10049 1282 27633 6361 7931 794 1199 243 27 594486 72463 128595 86577 55200 9627 33318 1982 18443 858 28 187990 78380 9391 1148 19692 4550 1593 163 3419 66
29 79231 16224 38423 2451 22212 2600 6678 2845 2742 5 30 5608522 402345 47959 1980 8147 502 1351 0 0 0 31 187818 20660 10728 1316 30692 4724 110997 10968 11260 985 32 434645 17520 726 165 43328 8525 0 0 7388 0 33 226988 23500 29887 4281 15221 1219 8815 755 6726 0
34 144872 13135 1328 110 6885 1459 7665 756 1331 290 35 39629 3804 109 11 10052 1160 13310 1470 1318 5 36 263613 24475 1155 164 5357 1098 3344 702 733 28 37 136876 17481 265 42 8573 1691 0 0 861 266 all 119040 19414 17781 2494 19006 3333 9941 1335 4032 298

Appendix A
NSS Report No. 525: Unorganised Manufacturing Sector in India, 2005-06: Employment, Assets and Borrowings. A - 200
Table 9 (continued): Outstanding loans per enterprise (in Rs.) on the date of survey
and annual interest payable per enterprise (in Rs.) by source agency of loan for each industry
Rural + Urban DME all-India
agency from which loan is taken friends and relatives others total
number of enterprises
industry (NIC 2004) amount interest amount interest amount interest estimated sample
(1) (12) (13) (14) (15) (16) (17) (18) (19) 01405 19281 X 0 0 582537 194654 381 29
15 7746 X 7476 1322 180178 23492 143726 1767 16 3037 X 3033 443 66944 27960 2320 52 17 8723 X 709 97 76384 8947 146739 1169 18 5632 X 22977 1805 139245 13567 52316 420
19 4594 X 6183 382 62260 10364 18315 176 20 12178 X 839 82 160772 32826 18874 358 21 96002 X 16558 1164 366913 38504 7213 166 22 54183 X 26799 1758 545716 44194 17655 300 23 13138 X 52302 42895 561441 99681 834 35
24 29177 X 32702 4048 261456 43566 23635 526 25 71473 X 34270 2509 362745 33817 16135 400 26 14250 X 6925 759 146521 27725 57506 1660 27 27730 X 36785 2736 894558 174243 6094 218 28 11972 X 56518 5328 290576 89635 49029 747
29 22293 X 25715 2544 197294 26669 26135 391 30 0 X 7094 1557 5673074 406384 211 11 31 93252 X 25967 1968 470715 40621 8043 328 32 29454 X 7320 601 522860 26812 2162 39 33 13087 X 15636 1228 316360 30982 1244 53
34 10455 X 2451 163 174987 15913 6924 124 35 8383 X 1514 98 74315 6548 9525 110 36 4263 X 38008 2479 316473 28945 71819 696 37 0 X 10346 1216 156921 20696 796 17 all 14493 X 16810 1611 201102 28487 687632 9792

Appendix A
NSS Report No. 525: Unorganised Manufacturing Sector in India, 2005-06: Employment, Assets and Borrowings. A - 201
Table 9: Outstanding loans per enterprise (in Rs.) on the date of survey and annual interest
payable per enterprise (in Rs.) by source agency of loan for each industry Rural + Urban all enterprise type all-India
agency from which loan is taken central and state level term lending institution, govern-ment (central, state, local
bodies), banks and societies
other institutional
agencies money lenders business partner supplier /
contractor industry
(NIC 2004)
amount interest amount interest amount interest amount interest amount interest(1) (2) (3) (4) (5) (6) (7) (8) (9) (10) (11)
01405 20259 7894 86 4 1788 876 1082 161 1558 12 15 6740 1245 2895 200 1378 570 818 130 300 31 16 26 19 1 0 18 6 20 3 6 0 17 3392 436 316 28 998 199 61 13 187 36 18 1261 163 75 23 769 129 347 47 11 4
19 6062 638 499 489 893 364 81 5 90 15 20 1263 287 83 33 561 136 37 3 33 2 21 7345 1182 113 48 1979 294 2175 163 158 11 22 59190 7222 6539 815 4791 705 1375 101 11030 311 23 68406 7822 0 0 5665 5164 262 24 0 0
24 7381 962 997 621 2475 659 781 78 294 10 25 57516 7174 5732 780 6652 1309 4128 313 1521 68 26 8565 1869 1085 151 2757 744 721 72 124 26 27 106605 13264 22468 15201 11684 1888 5795 344 3229 149 28 20113 7003 1009 156 2219 642 130 13 374 12
29 19576 3553 8131 690 4959 1277 1786 495 887 4 30 1317903 94566 11589 596 29079 785 317 0 0 0 31 17527 2303 1053 142 2678 466 8568 847 1184 73 32 163579 6601 273 62 16318 3253 0 0 2886 0 33 51923 8632 9488 1176 2065 184 1147 98 1058 22
34 75087 14000 1790 161 4078 1273 3478 343 804 826 35 19794 3136 569 99 3831 449 5051 558 737 2 36 20200 2136 239 43 970 343 303 53 247 4 37 43609 5590 3021 998 1754 346 0 0 632 55 all 6137 1031 852 127 1090 291 425 56 236 17

Appendix A
NSS Report No. 525: Unorganised Manufacturing Sector in India, 2005-06: Employment, Assets and Borrowings. A - 202
Table 9 (continued): Outstanding loans per enterprise (in Rs.) on the date of survey
and annual interest payable per enterprise (in Rs.) by source agency of loan for each industry
Rural + Urban all enterprise type all-India
agency from which loan is taken friends and relatives others total
number of enterprises
industry (NIC 2004) amount interest amount interest amount interest estimated sample
(1) (12) (13) (14) (15) (16) (17) (18) (19) 01405 816 X 0 0 25590 8946 9131 119
15 876 X 532 113 13538 2289 2602807 14579 16 3 X 3 0 77 29 2818150 2967 17 848 X 49 7 5851 720 2567813 8228 18 262 X 393 34 3118 399 3213869 19202
19 1755 X 910 80 10290 1593 144025 933 20 209 X 23 5 2209 466 2138270 7939 21 4203 X 749 52 16722 1750 168080 742 22 9908 X 4144 307 96979 9460 117915 1549 23 1862 X 8526 6312 84722 19322 5886 88
24 1787 X 1869 230 15584 2560 418210 1459 25 18009 X 8168 648 101726 10291 72311 913 26 1714 X 629 70 15595 2934 641819 4981 27 5883 X 8541 1408 164206 32253 35133 589 28 2599 X 4491 436 30935 8262 619875 5103
29 7305 X 4290 433 46935 6452 174268 1734 30 0 X 1666 366 1360555 96312 899 19 31 7754 X 1953 196 40716 4026 110790 1437 32 11083 X 2938 230 197078 10146 5745 80 33 3833 X 11148 716 80662 10829 9567 144
34 6779 X 1232 84 93249 16686 15260 255 35 3820 X 575 37 34376 4281 25102 323 36 910 X 33882 3716 56750 6296 1152007 9461 37 2845 X 2240 283 54102 7272 3892 53 all 958 X 2850 318 12548 1840 17070820 82897
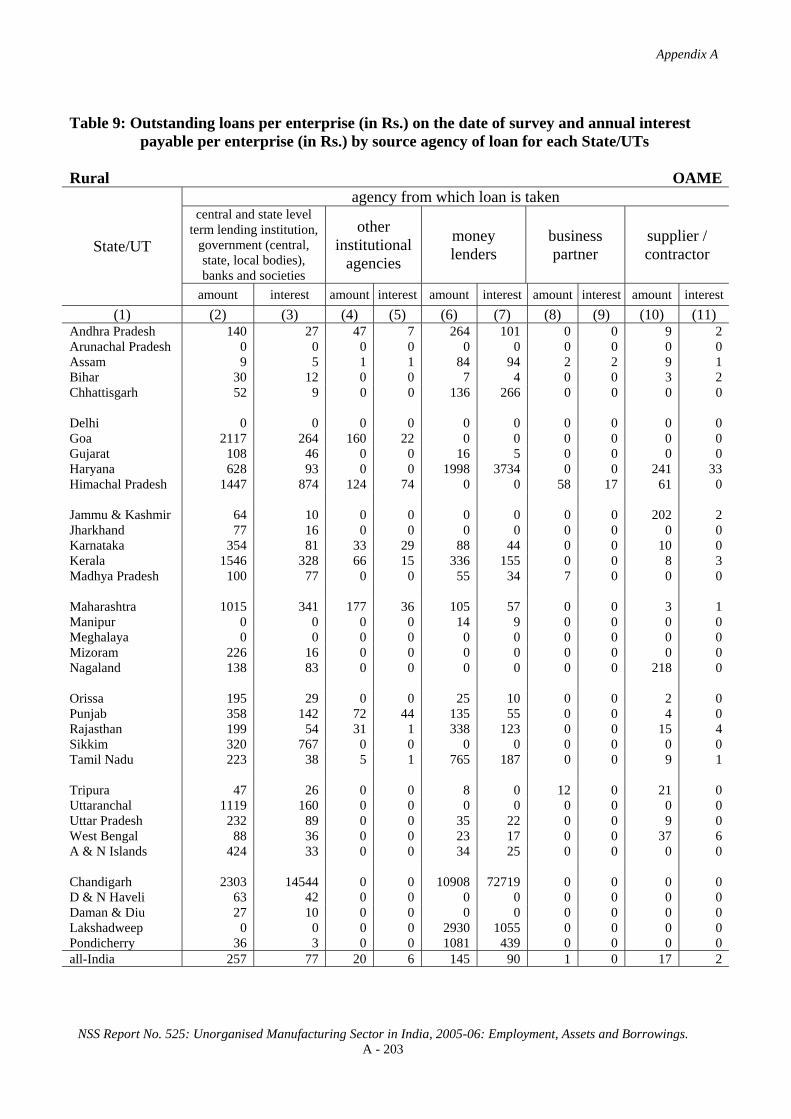
Appendix A
NSS Report No. 525: Unorganised Manufacturing Sector in India, 2005-06: Employment, Assets and Borrowings. A - 203
Table 9: Outstanding loans per enterprise (in Rs.) on the date of survey and annual interest
payable per enterprise (in Rs.) by source agency of loan for each State/UTs Rural OAME
agency from which loan is taken central and state level
term lending institution, government (central, state, local bodies), banks and societies
other institutional
agencies
money lenders
business partner
supplier / contractor State/UT
amount interest amount interest amount interest amount interest amount interest(1) (2) (3) (4) (5) (6) (7) (8) (9) (10) (11)
Andhra Pradesh 140 27 47 7 264 101 0 0 9 2 Arunachal Pradesh 0 0 0 0 0 0 0 0 0 0 Assam 9 5 1 1 84 94 2 2 9 1 Bihar 30 12 0 0 7 4 0 0 3 2 Chhattisgarh 52 9 0 0 136 266 0 0 0 0 Delhi 0 0 0 0 0 0 0 0 0 0 Goa 2117 264 160 22 0 0 0 0 0 0 Gujarat 108 46 0 0 16 5 0 0 0 0 Haryana 628 93 0 0 1998 3734 0 0 241 33 Himachal Pradesh 1447 874 124 74 0 0 58 17 61 0 Jammu & Kashmir 64 10 0 0 0 0 0 0 202 2 Jharkhand 77 16 0 0 0 0 0 0 0 0 Karnataka 354 81 33 29 88 44 0 0 10 0 Kerala 1546 328 66 15 336 155 0 0 8 3 Madhya Pradesh 100 77 0 0 55 34 7 0 0 0 Maharashtra 1015 341 177 36 105 57 0 0 3 1 Manipur 0 0 0 0 14 9 0 0 0 0 Meghalaya 0 0 0 0 0 0 0 0 0 0 Mizoram 226 16 0 0 0 0 0 0 0 0 Nagaland 138 83 0 0 0 0 0 0 218 0 Orissa 195 29 0 0 25 10 0 0 2 0 Punjab 358 142 72 44 135 55 0 0 4 0 Rajasthan 199 54 31 1 338 123 0 0 15 4 Sikkim 320 767 0 0 0 0 0 0 0 0 Tamil Nadu 223 38 5 1 765 187 0 0 9 1 Tripura 47 26 0 0 8 0 12 0 21 0 Uttaranchal 1119 160 0 0 0 0 0 0 0 0 Uttar Pradesh 232 89 0 0 35 22 0 0 9 0 West Bengal 88 36 0 0 23 17 0 0 37 6 A & N Islands 424 33 0 0 34 25 0 0 0 0 Chandigarh 2303 14544 0 0 10908 72719 0 0 0 0 D & N Haveli 63 42 0 0 0 0 0 0 0 0 Daman & Diu 27 10 0 0 0 0 0 0 0 0 Lakshadweep 0 0 0 0 2930 1055 0 0 0 0 Pondicherry 36 3 0 0 1081 439 0 0 0 0 all-India 257 77 20 6 145 90 1 0 17 2

Appendix A
NSS Report No. 525: Unorganised Manufacturing Sector in India, 2005-06: Employment, Assets and Borrowings. A - 204
Table 9 (continued): Outstanding loans per enterprise (in Rs.) on the date of survey and
annual interest payable per enterprise (in Rs.) by source agency of loan for each State/UTs
Rural OAME
agency from which loan is taken friends and relatives others total
number of enterprises State/UT
amount interest amount interest amount interest estimated sample(1) (12) (13) (14) (15) (16) (17) (18) (19)
Andhra Pradesh 7 X 5 2 473 140 998813 2959 Arunachal Pradesh 1212 X 0 0 1212 0 304 36 Assam 56 X 12 4 174 105 306157 1780 Bihar 30 X 0 0 69 17 639312 2195 Chhattisgarh 4 X 0 0 192 274 169729 392 Delhi 60 X 0 0 60 0 767 16 Goa 7 X 0 0 2285 286 3200 70 Gujarat 305 X 2 3 431 54 276152 1043 Haryana 369 X 110 0 3346 3859 102113 637 Himachal Pradesh 168 X 246 354 2104 1318 92900 732 Jammu & Kashmir 286 X 33 0 586 12 132883 878 Jharkhand 4 X 0 0 81 16 522684 863 Karnataka 51 X 14 4 550 157 580125 1424 Kerala 87 X 7 2 2050 503 374908 1653 Madhya Pradesh 46 X 10 3 217 114 541814 1328 Maharashtra 523 X 51 1 1874 435 499406 1587 Manipur 49 X 14 2 77 10 34388 388 Meghalaya 6 X 0 0 6 0 26803 249 Mizoram 0 X 0 0 226 16 3078 181 Nagaland 1314 X 0 0 1669 83 6842 394 Orissa 27 X 34 5 283 43 843862 1917 Punjab 56 X 237 68 862 310 135428 902 Rajasthan 167 X 1 1 752 183 371194 1250 Sikkim 19 X 6 0 345 767 3260 135 Tamil Nadu 25 X 0 0 1027 226 720436 1896 Tripura 150 X 41 0 278 26 33235 672 Uttaranchal 366 X 0 0 1484 160 44403 253 Uttar Pradesh 182 X 9 52 467 163 1577716 2541 West Bengal 81 X 40 1 270 60 2061369 2423 A & N Islands 6 X 0 0 465 58 1283 108 Chandigarh 0 X 96 0 13307 87262 567 15 D & N Haveli 0 X 0 0 63 42 506 19 Daman & Diu 0 X 0 0 27 10 852 37 Lakshadweep 293 X 0 0 3222 1055 204 20 Pondicherry 0 X 0 0 1117 442 2026 68 all-India 105 X 23 12 567 188 11108720 31061

Appendix A
NSS Report No. 525: Unorganised Manufacturing Sector in India, 2005-06: Employment, Assets and Borrowings. A - 205
Table 9: Outstanding loans per enterprise (in Rs.) on the date of survey and annual interest
payable per enterprise (in Rs.) by source agency of loan for each State/UTs Rural NDME
agency from which loan is taken central and state level
term lending institution, government (central, state, local bodies), banks and societies
other institutional
agencies
money lenders
business partner
supplier / contractor State/UT
amount interest amount interest amount interest amount interest amount interest(1) (2) (3) (4) (5) (6) (7) (8) (9) (10) (11)
Andhra Pradesh 6698 1467 2117 247 1778 547 0 0 2 0 Arunachal Pradesh 0 0 0 0 22 0 0 0 2210 0 Assam 1213 489 0 0 5 2 18 0 80 0 Bihar 273 248 0 0 23 14 0 0 0 0 Chhattisgarh 1010 1492 0 0 14 25 0 0 0 0 Delhi 0 0 0 0 977 469 0 0 0 0 Goa 44487 5985 3937 551 0 0 0 0 0 0 Gujarat 2148 696 186 40 220 19 650 67 0 0 Haryana 56834 8198 9503 1520 560 150 1333 4 306 13 Himachal Pradesh 16997 3706 4258 768 0 0 2126 266 483 109 Jammu & Kashmir 8436 1208 665 1382 0 0 0 0 1922 0 Jharkhand 2577 140 0 0 0 0 0 0 0 0 Karnataka 8724 1653 1030 104 1026 267 0 0 0 0 Kerala 24846 2986 1898 249 2764 966 0 0 923 20 Madhya Pradesh 842 120 0 0 1497 2402 0 0 6 1 Maharashtra 25100 3502 1859 307 482 279 0 0 93 0 Manipur 0 0 0 0 1827 1096 0 0 0 0 Meghalaya 0 0 0 0 12 1 0 0 0 0 Mizoram 22815 5315 0 0 0 0 0 0 0 0 Nagaland 425 176 0 0 0 0 31 19 0 0 Orissa 3364 1031 7163 860 43 20 4 0 24 0 Punjab 6643 833 17 9 374 67 0 0 10 4 Rajasthan 8561 1817 215 29 932 569 1280 89 0 0 Sikkim 0 0 0 0 0 0 0 0 0 0 Tamil Nadu 3160 572 285 65 2854 850 0 0 27 2 Tripura 1389 1269 0 0 393 164 139 0 610 0 Uttaranchal 30736 8561 0 0 175 53 0 0 0 0 Uttar Pradesh 1520 727 35 38 460 215 0 0 183 0 West Bengal 6017 541 162 33 337 286 0 0 1136 172 A & N Islands 10958 1133 0 0 0 0 0 0 10 0 Chandigarh 846 106 0 0 0 0 0 0 0 0 D & N Haveli 774 180 0 0 0 0 0 0 0 0 Daman & Diu 0 0 0 0 0 0 0 0 0 0 Lakshadweep 559 56 0 0 0 0 0 0 0 0 Pondicherry 27150 4091 45 29 901 324 0 0 0 0 all-India 9466 1468 1060 166 1096 439 99 7 391 34

Appendix A
NSS Report No. 525: Unorganised Manufacturing Sector in India, 2005-06: Employment, Assets and Borrowings. A - 206
Table 9 (continued): Outstanding loans per enterprise (in Rs.) on the date of survey and
annual interest payable per enterprise (in Rs.) by source agency of loan for each State/UTs
Rural NDME
agency from which loan is taken friends and relatives others total
number of enterprises State/UT
amount interest amount interest amount interest estimated sample(1) (12) (13) (14) (15) (16) (17) (18) (19)
Andhra Pradesh 915 X 0 0 11510 2261 45316 523 Arunachal Pradesh 919 X 765 9182 3916 9182 226 37 Assam 353 X 128 28 1796 520 24581 273 Bihar 444 X 0 0 739 262 23138 220 Chhattisgarh 6 X 407 878 1437 2395 1549 54 Delhi 718 X 0 0 1694 469 1810 28 Goa 861 X 0 0 49285 6536 888 32 Gujarat 466 X 0 0 3670 822 14538 134 Haryana 7545 X 459 96 76540 9980 14267 206 Himachal Pradesh 914 X 30 0 24809 4849 6763 161 Jammu & Kashmir 1350 X 6 0 12379 2590 6501 157 Jharkhand 0 X 0 0 2577 140 16622 90 Karnataka 390 X 139 162 11309 2186 32323 192 Kerala 2634 X 82 23 33148 4245 98679 827 Madhya Pradesh 100 X 112 27 2556 2549 13146 98 Maharashtra 4951 X 0 0 32485 4089 39967 192 Manipur 150 X 0 0 1976 1096 1288 45 Meghalaya 35 X 0 0 46 1 6579 106 Mizoram 0 X 0 0 22815 5315 196 39 Nagaland 1774 X 0 0 2230 195 319 28 Orissa 2070 X 31 5 12697 1916 23583 166 Punjab 4741 X 136 25 11922 937 13610 172 Rajasthan 1297 X 77 6 12362 2510 23428 295 Sikkim 506 X 8 0 514 0 397 21 Tamil Nadu 260 X 0 0 6587 1489 88273 690 Tripura 185 X 82 14 2800 1447 5400 347 Uttaranchal 0 X 0 0 30911 8613 7371 94 Uttar Pradesh 302 X 0 0 2501 979 100935 545 West Bengal 1205 X 77 45 8933 1078 131237 783 A & N Islands 506 X 0 0 11473 1133 488 60 Chandigarh 0 X 0 0 846 106 154 13 D & N Haveli 0 X 0 0 774 180 247 31 Daman & Diu 0 X 0 0 0 0 133 20 Lakshadweep 0 X 0 0 559 56 48 8 Pondicherry 16 X 0 0 28112 4444 1270 51 all-India 1371 X 53 27 13536 2140 745269 6738

Appendix A
NSS Report No. 525: Unorganised Manufacturing Sector in India, 2005-06: Employment, Assets and Borrowings. A - 207
Table 9: Outstanding loans per enterprise (in Rs.) on the date of survey and annual interest
payable per enterprise (in Rs.) by source agency of loan for each State/UTs Rural DME
agency from which loan is taken central and state level
term lending institution, government (central, state, local bodies), banks and societies
other institutional
agencies
money lenders
business partner
supplier / contractor State/UT
amount interest amount interest amount interest amount interest amount interest(1) (2) (3) (4) (5) (6) (7) (8) (9) (10) (11)
Andhra Pradesh 11719 3444 2063 296 8561 1706 13456 1598 2154 249 Arunachal Pradesh 368494 17688 0 0 0 0 0 0 39429 6633 Assam 38594 3262 15158 2274 493 236 0 0 0 0 Bihar 58580 1268 0 0 0 0 0 0 1830 494 Chhattisgarh 2478580 320975 2688 390 9275 318 99693 5848 300 33 Delhi 149940 67488 60 23 18537 1018 0 0 0 0 Goa 1139215 154232 35394 5020 0 0 0 0 9284 0 Gujarat 18819 5116 16684 19219 5487 269 6663 694 0 0 Haryana 568058 77479 43969 3007 85534 9986 158920 18200 39636 1112 Himachal Pradesh 388163 73403 10647 987 27822 4097 1096 662 0 0 Jammu & Kashmir 32947 3852 4637 281 0 0 279 145 0 0 Jharkhand 20183 3370 0 0 0 0 0 0 0 0 Karnataka 15850 5081 389 39 625 155 9 1 2 0 Kerala 173058 19710 338730 19941 29225 4440 483 41 2835 20 Madhya Pradesh 75381 23709 274 36 3573 2128 6527 472 2367 168 Maharashtra 156770 23266 880 1030 1019 280 37219 4116 3564 61 Manipur 0 0 1300 780 1625 975 0 0 0 0 Meghalaya 1371 999 126 106 63 84 0 0 0 0 Mizoram 0 0 0 0 0 0 0 0 0 0 Nagaland 0 0 0 0 0 0 0 0 24272 0 Orissa 73922 6592 577 99 21649 3777 0 0 109 0 Punjab 401872 47134 344 420 68998 4788 33594 3984 3202 0 Rajasthan 103709 19760 40368 3061 101610 20834 19716 1835 146 25 Sikkim 356556 8646 0 0 0 0 0 0 0 0 Tamil Nadu 51022 16362 5783 3231 13115 3462 2459 254 464 48 Tripura 107229 54441 0 0 98 35 0 0 0 0 Uttaranchal 279181 33759 0 0 0 0 4161 122 0 0 Uttar Pradesh 27559 10969 2 2 7525 3534 8835 4026 4573 6 West Bengal 83769 13374 11029 527 4344 1566 3361 507 535 60 A & N Islands 43468 4146 0 0 3903 1873 0 0 0 0 Chandigarh 0 0 0 0 0 0 0 0 0 0 D & N Haveli 0 0 0 0 0 0 0 0 0 0 Daman & Diu 83 39 0 0 0 0 0 0 0 0 Lakshadweep 0 0 0 0 0 0 0 0 0 0 Pondicherry 403928 44192 100465 12464 24921 2826 66 8 2590 0 all-India 81249 14768 28874 2945 11210 2424 9420 1322 1913 79

Appendix A
NSS Report No. 525: Unorganised Manufacturing Sector in India, 2005-06: Employment, Assets and Borrowings. A - 208
Table 9 (continued): Outstanding loans per enterprise (in Rs.) on the date of survey and
annual interest payable per enterprise (in Rs.) by source agency of loan for each State/UTs
Rural DME
agency from which loan is taken friends and relatives others total
number of enterprises State/UT
amount interest amount interest amount interest estimated sample(1) (12) (13) (14) (15) (16) (17) (18) (19)
Andhra Pradesh 226 X 1372 179 39551 7472 41113 394 Arunachal Pradesh 0 X 0 0 407923 24321 11 3 Assam 18640 X 105 154 72990 5926 2268 31 Bihar 0 X 0 0 60409 1762 929 53 Chhattisgarh 1972 X 68620 32411 2661127 359976 1332 82 Delhi 5927 X 1696 221 176160 68749 1062 27 Goa 10545 X 207 11 1194644 159263 458 45 Gujarat 12860 X 166 70 60679 25368 10064 173 Haryana 161183 X 12275 730 1069575 110515 3306 275 Himachal Pradesh 40131 X 5044 743 472903 79892 774 118 Jammu & Kashmir 79634 X 0 0 117497 4277 1083 48 Jharkhand 0 X 1298 1066 21481 4436 944 22 Karnataka 1883 X 0 0 18757 5277 50764 154 Kerala 22181 X 0 0 566511 44152 19191 202 Madhya Pradesh 1562 X 2424 280 92108 26794 9502 215 Maharashtra 29146 X 3230 621 231826 29374 16795 184 Manipur 580 X 878 527 4383 2282 121 10 Meghalaya 3423 X 0 0 4983 1189 1131 33 Mizoram 0 X 0 0 0 0 18 3 Nagaland 0 X 0 0 24272 0 6 3 Orissa 190 X 0 0 96447 10469 3432 107 Punjab 19728 X 20354 464 548092 56791 1170 56 Rajasthan 19214 X 11261 2144 296022 47659 6253 487 Sikkim 15062 X 0 0 371618 8646 26 8 Tamil Nadu 2092 X 36 6 74970 23363 41644 612 Tripura 736 X 0 0 108063 54476 265 48 Uttaranchal 10477 X 54784 5442 348603 39323 2167 30 Uttar Pradesh 1644 X 8714 4809 58852 23345 25865 292 West Bengal 4265 X 11822 311 119126 16346 31162 414 A & N Islands 362551 X 0 0 409922 6019 101 13 Chandigarh 0 X 0 0 0 0 31 10 D & N Haveli 0 X 0 0 0 0 44 19 Daman & Diu 0 X 0 0 83 39 479 20 Lakshadweep 0 X 0 0 0 0 3 2 Pondicherry 2511 X 4869 737 539349 60227 762 58 all-India 8542 X 3962 837 145171 22375 274277 4251
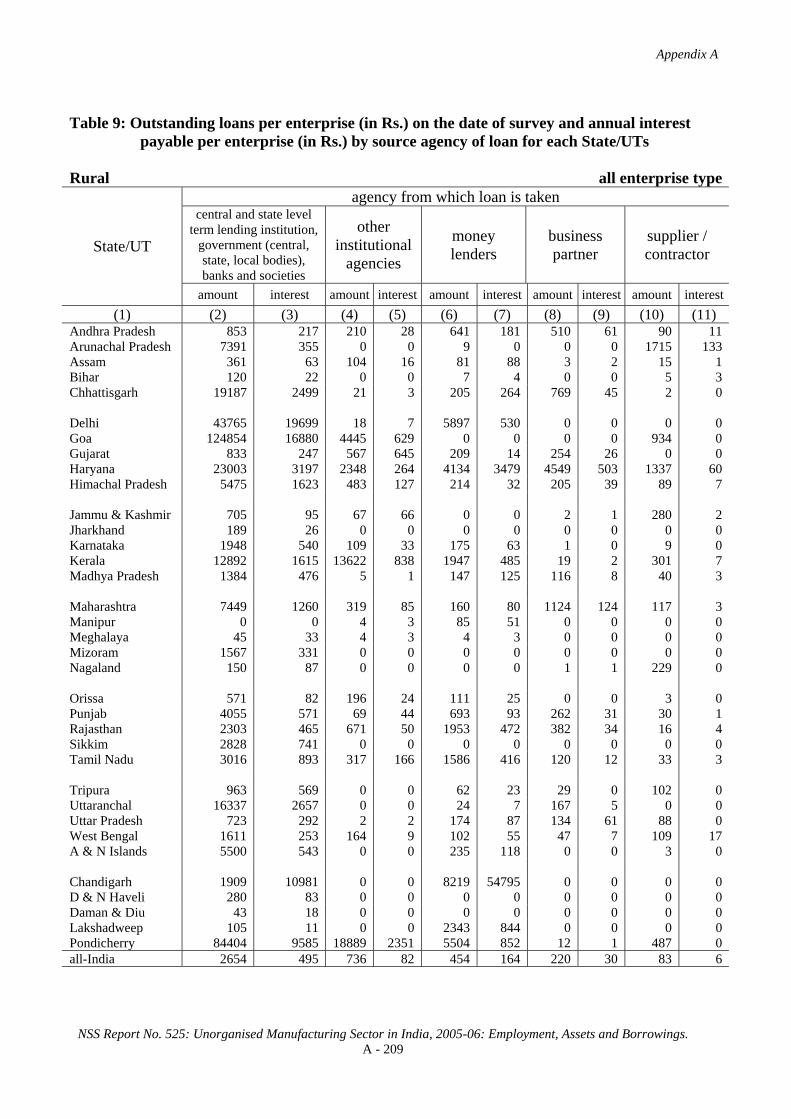
Appendix A
NSS Report No. 525: Unorganised Manufacturing Sector in India, 2005-06: Employment, Assets and Borrowings. A - 209
Table 9: Outstanding loans per enterprise (in Rs.) on the date of survey and annual interest
payable per enterprise (in Rs.) by source agency of loan for each State/UTs Rural all enterprise type
agency from which loan is taken central and state level
term lending institution, government (central, state, local bodies), banks and societies
other institutional
agencies
money lenders
business partner
supplier / contractor State/UT
amount interest amount interest amount interest amount interest amount interest(1) (2) (3) (4) (5) (6) (7) (8) (9) (10) (11)
Andhra Pradesh 853 217 210 28 641 181 510 61 90 11 Arunachal Pradesh 7391 355 0 0 9 0 0 0 1715 133 Assam 361 63 104 16 81 88 3 2 15 1 Bihar 120 22 0 0 7 4 0 0 5 3 Chhattisgarh 19187 2499 21 3 205 264 769 45 2 0 Delhi 43765 19699 18 7 5897 530 0 0 0 0 Goa 124854 16880 4445 629 0 0 0 0 934 0 Gujarat 833 247 567 645 209 14 254 26 0 0 Haryana 23003 3197 2348 264 4134 3479 4549 503 1337 60 Himachal Pradesh 5475 1623 483 127 214 32 205 39 89 7 Jammu & Kashmir 705 95 67 66 0 0 2 1 280 2 Jharkhand 189 26 0 0 0 0 0 0 0 0 Karnataka 1948 540 109 33 175 63 1 0 9 0 Kerala 12892 1615 13622 838 1947 485 19 2 301 7 Madhya Pradesh 1384 476 5 1 147 125 116 8 40 3 Maharashtra 7449 1260 319 85 160 80 1124 124 117 3 Manipur 0 0 4 3 85 51 0 0 0 0 Meghalaya 45 33 4 3 4 3 0 0 0 0 Mizoram 1567 331 0 0 0 0 0 0 0 0 Nagaland 150 87 0 0 0 0 1 1 229 0 Orissa 571 82 196 24 111 25 0 0 3 0 Punjab 4055 571 69 44 693 93 262 31 30 1 Rajasthan 2303 465 671 50 1953 472 382 34 16 4 Sikkim 2828 741 0 0 0 0 0 0 0 0 Tamil Nadu 3016 893 317 166 1586 416 120 12 33 3 Tripura 963 569 0 0 62 23 29 0 102 0 Uttaranchal 16337 2657 0 0 24 7 167 5 0 0 Uttar Pradesh 723 292 2 2 174 87 134 61 88 0 West Bengal 1611 253 164 9 102 55 47 7 109 17 A & N Islands 5500 543 0 0 235 118 0 0 3 0 Chandigarh 1909 10981 0 0 8219 54795 0 0 0 0 D & N Haveli 280 83 0 0 0 0 0 0 0 0 Daman & Diu 43 18 0 0 0 0 0 0 0 0 Lakshadweep 105 11 0 0 2343 844 0 0 0 0 Pondicherry 84404 9585 18889 2351 5504 852 12 1 487 0 all-India 2654 495 736 82 454 164 220 30 83 6

Appendix A
NSS Report No. 525: Unorganised Manufacturing Sector in India, 2005-06: Employment, Assets and Borrowings. A - 210
Table 9 (continued): Outstanding loans per enterprise (in Rs.) on the date of survey and
annual interest payable per enterprise (in Rs.) by source agency of loan for each State/UTs
Rural all enterprise type
agency from which loan is taken friends and relatives others total
number of enterprises State/UT
amount interest amount interest amount interest estimated sample(1) (12) (13) (14) (15) (16) (17) (18) (19)
Andhra Pradesh 54 X 57 9 2415 506 1085242 3876 Arunachal Pradesh 1065 X 320 3838 10499 4326 541 76 Assam 205 X 21 7 790 176 333006 2084 Bihar 45 X 0 0 177 28 663379 2468 Chhattisgarh 19 X 533 258 20737 3069 172610 528 Delhi 2100 X 495 64 52274 20300 3639 71 Goa 1235 X 21 1 131489 17510 4546 147 Gujarat 733 X 7 5 2603 938 300753 1350 Haryana 5667 X 488 32 41526 7536 119687 1118 Himachal Pradesh 526 X 268 333 7262 2162 100437 1011 Jammu & Kashmir 947 X 32 0 2033 164 140468 1083 Jharkhand 4 X 2 2 195 28 540250 975 Karnataka 208 X 19 11 2468 648 663211 1770 Kerala 1458 X 22 6 30260 2952 492777 2682 Madhya Pradesh 72 X 53 9 1819 620 564463 1641 Maharashtra 1705 X 143 19 11018 1572 556168 1963 Manipur 54 X 17 3 160 57 35797 443 Meghalaya 124 X 0 0 177 39 34513 388 Mizoram 0 X 0 0 1567 331 3291 223 Nagaland 1333 X 0 0 1713 87 7167 425 Orissa 83 X 34 4 998 135 870877 2190 Punjab 634 X 385 67 6126 807 150208 1130 Rajasthan 530 X 182 35 6036 1060 400875 2032 Sikkim 179 X 7 0 3014 741 3684 164 Tamil Nadu 150 X 2 0 5226 1490 850353 3198 Tripura 159 X 46 2 1362 594 38900 1067 Uttaranchal 722 X 2201 219 19451 2888 53940 377 Uttar Pradesh 211 X 140 121 1473 563 1704516 3378 West Bengal 206 X 208 8 2447 349 2223768 3620 A & N Islands 19766 X 0 0 25504 661 1872 181 Chandigarh 0 X 72 0 10200 65775 753 38 D & N Haveli 0 X 0 0 280 83 797 69 Daman & Diu 0 X 0 0 43 18 1464 77 Lakshadweep 234 X 0 0 2683 854 255 30 Pondicherry 477 X 915 138 110688 12927 4058 177 all-India 374 X 114 32 4634 809 12128266 42050

Appendix A
NSS Report No. 525: Unorganised Manufacturing Sector in India, 2005-06: Employment, Assets and Borrowings. A - 211
Table 9: Outstanding loans per enterprise (in Rs.) on the date of survey and annual interest
payable per enterprise (in Rs.) by source agency of loan for each State/UTs Urban OAME
agency from which loan is taken central and state level
term lending institution, government (central, state, local bodies), banks and societies
other institutional
agencies
money lenders
business partner
supplier / contractor State/UT
amount interest amount interest amount interest amount interest amount interest(1) (2) (3) (4) (5) (6) (7) (8) (9) (10) (11)
Andhra Pradesh 267 108 67 18 728 275 9 3 71 2 Arunachal Pradesh 0 0 0 0 0 0 0 0 2242 269 Assam 119 13 0 0 14 8 1 1 0 0 Bihar 124 46 0 0 43 22 0 0 12 0 Chhattisgarh 3578 696 0 0 161 81 0 0 4 0 Delhi 896 98 1341 910 0 0 0 0 0 0 Goa 894 117 0 0 145 35 0 0 0 0 Gujarat 746 157 172 15 130 43 357 30 1 0 Haryana 8537 909 31 17 827 638 0 0 407 0 Himachal Pradesh 4728 648 101 32 48 2 0 0 19 0 Jammu & Kashmir 338 43 0 0 0 0 42 0 45 0 Jharkhand 55 7 16 5 26 31 0 0 0 0 Karnataka 801 128 182 39 117 45 0 0 48 16 Kerala 1958 222 4 1 104 46 0 0 13 0 Madhya Pradesh 718 42 0 0 90 33 1 0 5 1 Maharashtra 1619 425 413 73 63 34 0 0 13 0 Manipur 0 0 0 0 33 14 0 0 3 5 Meghalaya 0 0 0 0 0 0 0 0 0 0 Mizoram 0 0 0 0 0 0 0 0 0 0 Nagaland 0 0 0 0 7 17 0 0 7 1 Orissa 515 178 0 0 24 18 0 0 5 0 Punjab 4029 544 179 58 43 7 0 0 28 0 Rajasthan 757 312 82 75 682 165 0 0 6 0 Sikkim 0 0 0 0 0 0 0 0 219 0 Tamil Nadu 232 44 12 3 763 279 3 0 141 0 Tripura 401 507 0 0 0 0 0 0 3 0 Uttaranchal 436 74 0 0 117 705 0 0 0 0 Uttar Pradesh 353 154 52 9 57 73 30 7 61 12 West Bengal 42 10 66 48 122 51 0 0 22 1 A & N Islands 0 0 0 0 0 0 0 0 0 0 Chandigarh 0 0 0 0 0 0 0 0 0 0 D & N Haveli 0 0 0 0 0 0 0 0 0 0 Daman & Diu 109 41 0 0 0 0 0 0 0 0 Lakshadweep 0 0 0 0 0 0 0 0 0 0 Pondicherry 0 0 0 0 503 287 0 0 0 0 all-India 832 167 103 30 286 118 31 3 51 3

Appendix A
NSS Report No. 525: Unorganised Manufacturing Sector in India, 2005-06: Employment, Assets and Borrowings. A - 212
Table 9 (continued): Outstanding loans per enterprise (in Rs.) on the date of survey and
annual interest payable per enterprise (in Rs.) by source agency of loan for each State/UTs
Urban OAME
agency from which loan is taken friends and relatives others total
number of enterprises State/UT
amount interest amount interest amount interest estimated sample(1) (12) (13) (14) (15) (16) (17) (18) (19)
Andhra Pradesh 55 X 2 0 1199 406 363988 1849 Arunachal Pradesh 0 X 0 0 2242 269 223 14 Assam 103 X 57 36 293 58 21984 471 Bihar 31 X 0 0 209 68 87057 962 Chhattisgarh 7 X 0 0 3750 776 23967 215 Delhi 1217 X 1 0 3455 1008 17127 67 Goa 0 X 0 0 1039 152 3053 48 Gujarat 514 X 21 3 1940 247 246382 1271 Haryana 123 X 0 0 9926 1564 60448 400 Himachal Pradesh 200 X 48 17 5143 699 4249 276 Jammu & Kashmir 46 X 152 0 623 43 25700 1011 Jharkhand 10 X 0 0 107 43 34243 548 Karnataka 86 X 39 5 1274 234 228452 1046 Kerala 28 X 11 3 2117 272 119772 789 Madhya Pradesh 467 X 4 1 1285 76 253319 1565 Maharashtra 898 X 8958 870 11964 1402 341781 2227 Manipur 84 X 3 7 124 27 14629 559 Meghalaya 0 X 19 23 19 23 1027 69 Mizoram 0 X 0 0 0 0 1123 129 Nagaland 127 X 10 8 152 26 1912 191 Orissa 85 X 8 2 636 198 69199 791 Punjab 566 X 47 0 4892 609 87811 941 Rajasthan 268 X 0 0 1794 553 181806 1576 Sikkim 183 X 0 0 402 0 206 45 Tamil Nadu 152 X 2 1 1305 326 467652 1948 Tripura 244 X 23 5 671 512 3857 277 Uttaranchal 343 X 0 0 896 779 7877 82 Uttar Pradesh 174 X 12 1 738 256 455329 2883 West Bengal 269 X 0 0 520 109 373178 1520 A & N Islands 315 X 0 0 315 0 147 15 Chandigarh 0 X 0 0 0 0 457 5 D & N Haveli 0 X 0 0 0 0 68 19 Daman & Diu 95 X 0 0 204 41 960 56 Lakshadweep 0 X 0 0 0 0 115 42 Pondicherry 0 X 0 0 503 287 5090 77 all-India 283 X 883 86 2468 407 3504186 23984

Appendix A
NSS Report No. 525: Unorganised Manufacturing Sector in India, 2005-06: Employment, Assets and Borrowings. A - 213
Table 9: Outstanding loans per enterprise (in Rs.) on the date of survey and annual interest
payable per enterprise (in Rs.) by source agency of loan for each State/UTs Urban NDME
agency from which loan is taken central and state level
term lending institution, government (central, state, local bodies), banks and societies
other institutional
agencies
money lenders
business partner
supplier / contractor State/UT
amount interest amount interest amount interest amount interest amount interest(1) (2) (3) (4) (5) (6) (7) (8) (9) (10) (11)
Andhra Pradesh 2470 483 964 375 5005 1642 0 0 83 190 Arunachal Pradesh 0 0 0 0 0 0 0 0 982 0 Assam 3657 3071 100 46 74 41 0 0 93 0 Bihar 4280 148 0 0 117 27 0 0 173 0 Chhattisgarh 6460 2034 3470 337 46 56 0 0 45 0 Delhi 1173 2450 249 75 1006 1908 1132 122 1009 6 Goa 3716 1094 0 0 0 0 0 0 0 0 Gujarat 11542 1521 1889 256 1147 128 52 5 3724 191 Haryana 39759 4401 8 1 3493 753 53 1 1454 0 Himachal Pradesh 24907 10892 0 0 250 90 0 0 1641 509 Jammu & Kashmir 15111 1096 0 0 0 0 0 0 491 0 Jharkhand 4818 797 0 0 64 0 0 0 0 0 Karnataka 9518 1263 2338 208 5292 1562 461 138 139 1 Kerala 18906 2222 1094 208 2590 897 0 0 409 85 Madhya Pradesh 2760 421 124 58 2680 2296 176 9 4 0 Maharashtra 19270 3134 569 170 1008 144 517 60 1013 3 Manipur 8590 1375 505 121 726 430 0 0 0 0 Meghalaya 1647 208 0 0 0 0 0 0 0 0 Mizoram 119 30 0 0 0 0 0 0 0 0 Nagaland 121 14 73 87 0 0 123 174 1653 0 Orissa 11059 1581 1368 165 144 34 5 5 207 0 Punjab 12145 2343 234 135 738 213 135 11 13 2 Rajasthan 7936 925 76 14 3347 1110 1763 130 601 17 Sikkim 11211 826 0 0 0 0 0 0 109 0 Tamil Nadu 8299 1138 3778 497 4964 1699 0 0 65 2 Tripura 3223 3556 23 6 112 57 0 0 122 0 Uttaranchal 14820 5410 0 0 0 0 0 0 0 0 Uttar Pradesh 2577 543 4 1 296 97 0 0 99 11 West Bengal 8652 1775 179 27 1130 2025 22 2 587 4 A & N Islands 0 0 0 0 1250 600 0 0 0 0 Chandigarh 0 0 0 0 0 0 0 0 0 0 D & N Haveli 0 0 0 0 0 0 0 0 0 0 Daman & Diu 0 0 0 0 0 0 0 0 0 0 Lakshadweep 212361 26525 0 0 0 0 0 0 0 0 Pondicherry 5105 287 398 143 3118 1340 0 0 303 0 all-India 9845 1665 921 156 2049 921 225 26 584 31

Appendix A
NSS Report No. 525: Unorganised Manufacturing Sector in India, 2005-06: Employment, Assets and Borrowings. A - 214
Table 9 (continued): Outstanding loans per enterprise (in Rs.) on the date of survey and
annual interest payable per enterprise (in Rs.) by source agency of loan for each State/UTs
Urban NDME
agency from which loan is taken friends and relatives others total
number of enterprises State/UT
amount interest amount interest amount interest estimated sample(1) (12) (13) (14) (15) (16) (17) (18) (19)
Andhra Pradesh 172 X 26 1 8720 2692 69642 680 Arunachal Pradesh 0 X 0 0 982 0 84 10 Assam 1605 X 399 57 5928 3215 13647 317 Bihar 253 X 0 0 4823 175 20269 352 Chhattisgarh 1061 X 362 232 11443 2658 8083 87 Delhi 1411 X 138 6 6119 4566 45890 191 Goa 3774 X 0 0 7490 1094 2170 49 Gujarat 10070 X 1244 143 29667 2245 54198 526 Haryana 18319 X 33 0 63120 5157 38319 339 Himachal Pradesh 19256 X 132 0 46186 11491 2163 161 Jammu & Kashmir 82 X 0 0 15685 1096 5973 354 Jharkhand 2326 X 138 13 7345 810 10207 223 Karnataka 863 X 0 0 18611 3172 48749 411 Kerala 1699 X 40 0 24738 3412 35062 471 Madhya Pradesh 571 X 282 22 6596 2806 31921 384 Maharashtra 3755 X 247677 28389 273810 31900 134658 1149 Manipur 160 X 0 12 9981 1939 1864 136 Meghalaya 305 X 0 0 1952 208 1268 71 Mizoram 12 X 0 0 131 30 624 89 Nagaland 2098 X 0 0 4068 275 758 66 Orissa 915 X 118 22 13816 1807 13748 231 Punjab 2757 X 517 72 16539 2776 44532 639 Rajasthan 1142 X 3828 312 18691 2507 38180 544 Sikkim 41 X 4 0 11364 826 186 43 Tamil Nadu 721 X 7 1 17834 3336 117692 925 Tripura 97 X 372 0 3950 3619 2357 233 Uttaranchal 281 X 78 16 15178 5426 6535 88 Uttar Pradesh 3634 X 29 1 6640 654 157969 1423 West Bengal 2451 X 669 52 13688 3886 114609 1004 A & N Islands 2500 X 0 0 3750 600 222 17 Chandigarh 0 X 0 0 0 0 148 3 D & N Haveli 0 X 0 0 0 0 98 26 Daman & Diu 0 X 0 0 0 0 188 22 Lakshadweep 3889 X 0 0 216250 26525 23 9 Pondicherry 9795 X 0 0 18719 1771 2975 49 all-India 3134 X 32881 3762 49638 6562 1025013 11322

Appendix A
NSS Report No. 525: Unorganised Manufacturing Sector in India, 2005-06: Employment, Assets and Borrowings. A - 215
Table 9: Outstanding loans per enterprise (in Rs.) on the date of survey and annual interest
payable per enterprise (in Rs.) by source agency of loan for each State/UTs Urban DME
agency from which loan is taken central and state level
term lending institution, government (central, state, local bodies), banks and societies
other institutional
agencies
money lenders
business partner
supplier / contractor State/UT
amount interest amount interest amount interest amount interest amount interest(1) (2) (3) (4) (5) (6) (7) (8) (9) (10) (11)
Andhra Pradesh 76146 6626 3965 974 28558 10074 2366 119 4351 1510 Arunachal Pradesh 454545 218182 0 0 0 0 0 0 0 0 Assam 60787 4659 3306 258 3983 470 1073 44 1155 0 Bihar 1522 0 0 0 3521 845 0 0 1000 0 Chhattisgarh 52393 6465 2519 207 99090 10193 1290 242 1732 207 Delhi 47045 4428 24095 16640 1158 194 6094 168 1762 201 Goa 322249 37075 0 0 0 0 0 0 0 0 Gujarat 44479 5895 483 52 70918 9673 19695 1851 1200 93 Haryana 273079 30868 11550 701 13642 1780 18966 8601 17638 1197 Himachal Pradesh 372000 57840 22516 1067 2996 43 11178 930 14158 6 Jammu & Kashmir 543969 92174 219 54 832 180 295 295 258 0 Jharkhand 83645 7510 50 71 2003 122 0 0 0 0 Karnataka 49718 6912 12551 2998 9673 2774 1114 126 1650 409 Kerala 516169 53095 10382 2175 20592 4920 1908 446 1094 6 Madhya Pradesh 382586 76587 8098 1044 13290 1295 29386 1728 11086 962 Maharashtra 250592 25035 19346 1647 22036 2752 17108 2168 14854 1139 Manipur 41294 6607 0 0 6399 2732 0 0 0 0 Meghalaya 20597 19159 0 0 4647 836 0 0 18388 3314 Mizoram 11430 46642 0 0 0 0 0 0 0 0 Nagaland 10037 1829 0 0 4388 13689 0 0 0 0 Orissa 173022 22159 3855 898 2359 625 0 0 5521 79 Punjab 179500 18731 1830 339 5925 972 27987 3176 1759 23 Rajasthan 159984 14812 8603 815 39666 6018 7893 845 7007 133 Sikkim 0 0 0 0 0 0 0 0 1222 0 Tamil Nadu 61198 8907 9233 1137 30852 7646 1734 230 1377 53 Tripura 19210 1567 0 0 0 0 0 0 0 0 Uttaranchal 44127 73219 0 0 3335 400 5010 729 0 0 Uttar Pradesh 171392 80548 435 39 8514 763 3879 434 843 162 West Bengal 66429 9369 10861 1002 6294 759 6819 1273 2182 79 A & N Islands 38791 4073 0 0 12281 4421 0 0 0 0 Chandigarh 1984859 166711 731983 81542 69768 3776 595564 13005 9583 0 D & N Haveli 8293477 1078347 0 0 0 0 0 0 0 0 Daman & Diu 0 0 0 0 0 0 0 0 0 0 Lakshadweep 0 0 0 0 0 0 0 0 0 0 Pondicherry 9280 972 4814 706 17122 4903 0 0 6269 0 all-India 144116 22497 10420 2195 24179 3936 10286 1344 5438 444

Appendix A
NSS Report No. 525: Unorganised Manufacturing Sector in India, 2005-06: Employment, Assets and Borrowings. A - 216
Table 9 (continued): Outstanding loans per enterprise (in Rs.) on the date of survey and
annual interest payable per enterprise (in Rs.) by source agency of loan for each State/UTs
Urban DME
agency from which loan is taken friends and relatives others total
number of enterprises State/UT
amount interest amount interest amount interest estimated sample(1) (12) (13) (14) (15) (16) (17) (18) (19)
Andhra Pradesh 1865 X 362 44 117613 19347 14366 178 Arunachal Pradesh 0 X 0 0 454545 218182 11 2 Assam 454 X 2299 194 73057 5627 2143 43 Bihar 169 X 0 0 6211 845 1692 43 Chhattisgarh 1637 X 19173 1420 177834 18732 2821 47 Delhi 22382 X 10689 1383 113226 23014 30979 229 Goa 52501 X 0 0 374750 37075 539 17 Gujarat 13420 X 2555 307 152750 17870 53024 365 Haryana 54082 X 9237 897 398194 44045 11656 312 Himachal Pradesh 82520 X 50861 4988 556229 64873 593 55 Jammu & Kashmir 2553 X 35610 321 583737 93024 1272 83 Jharkhand 0 X 0 0 85697 7703 1248 32 Karnataka 1467 X 80 7 76253 13227 21349 209 Kerala 7858 X 475 0 558478 60642 11080 194 Madhya Pradesh 25417 X 118464 11810 588327 93749 4857 189 Maharashtra 33262 X 86543 6881 443741 39622 93855 1101 Manipur 784 X 0 0 48476 9339 228 24 Meghalaya 0 X 49987 5021 93618 28330 179 16 Mizoram 0 X 0 0 11430 46642 63 12 Nagaland 4113 X 0 0 18537 15519 68 11 Orissa 6501 X 14053 102 205312 23863 3406 80 Punjab 29269 X 33646 2595 279917 25836 10686 315 Rajasthan 30990 X 11315 1271 265457 23896 15609 330 Sikkim 3095 X 0 0 4317 0 28 10 Tamil Nadu 3090 X 301 40 107785 18013 46236 530 Tripura 0 X 0 0 19210 1567 256 29 Uttaranchal 7283 X 4617 402 64371 74750 735 13 Uttar Pradesh 22754 X 6086 733 213903 82679 41561 561 West Bengal 4333 X 4024 321 100942 12802 41238 466 A & N Islands 0 X 0 0 51072 8494 75 6 Chandigarh 789052 X 1192451 67206 5373260 332238 15 12 D & N Haveli 1186815 X 472885 68203 9953177 1146550 6 5 Daman & Diu 0 X 0 0 0 0 28 2 Lakshadweep 0 X 0 0 0 0 4 2 Pondicherry 0 X 2850 561 40334 7143 1448 18 all-India 18441 X 25336 2124 238215 32543 413355 5541

Appendix A
NSS Report No. 525: Unorganised Manufacturing Sector in India, 2005-06: Employment, Assets and Borrowings. A - 217
Table 9: Outstanding loans per enterprise (in Rs.) on the date of survey and annual interest
payable per enterprise (in Rs.) by source agency of loan for each State/UTs Urban all enterprise type
agency from which loan is taken central and state level
term lending institution, government (central, state, local bodies), banks and societies
other institutional
agencies
money lenders
business partner
supplier / contractor State/UT
amount interest amount interest amount interest amount interest amount interest(1) (2) (3) (4) (5) (6) (7) (8) (9) (10) (11)
Andhra Pradesh 3042 375 332 104 2285 802 83 7 210 80 Arunachal Pradesh 15723 7547 0 0 0 0 0 0 1832 189 Assam 4840 1381 224 31 261 46 61 3 99 0 Bihar 918 64 0 0 111 36 0 0 57 0 Chhattisgarh 8195 1473 1008 95 8138 893 104 20 153 17 Delhi 16241 2673 8307 5687 873 995 2561 115 1073 69 Goa 32021 3943 0 0 77 18 0 0 0 0 Gujarat 8959 1226 482 57 10901 1500 3210 299 751 43 Haryana 47297 5283 1239 84 3105 798 2021 908 2589 126 Himachal Pradesh 42038 8651 1966 110 360 33 946 79 1716 158 Jammu & Kashmir 24000 3790 8 2 32 7 44 11 134 0 Jharkhand 3402 388 13 6 88 27 0 0 0 0 Karnataka 5722 799 1419 278 1645 488 155 32 178 42 Kerala 39879 4176 927 190 1997 551 127 30 169 18 Madhya Pradesh 7336 1365 150 24 596 303 512 30 190 17 Maharashtra 46761 5115 3566 355 3902 507 2938 371 2692 188 Manipur 1521 243 56 14 197 98 0 0 3 5 Meghalaya 2337 1495 0 0 337 61 0 0 1333 240 Mizoram 436 1622 0 0 0 0 0 0 0 0 Nagaland 284 50 20 24 115 354 34 48 463 1 Orissa 8998 1268 370 62 135 45 1 1 255 3 Punjab 19666 2463 319 103 699 144 2133 241 153 2 Rajasthan 12470 1372 645 114 3696 706 809 77 566 12 Sikkim 4977 367 0 0 0 0 0 0 236 0 Tamil Nadu 6198 896 1388 178 3748 1083 129 17 217 4 Tripura 2173 1660 9 2 41 21 0 0 46 0 Uttaranchal 8761 5924 0 0 223 386 243 35 0 0 Uttar Pradesh 11745 5350 65 9 651 123 267 33 119 21 West Bengal 7082 1122 932 118 822 534 536 100 313 8 A & N Islands 6581 691 0 0 2708 1050 0 0 0 0 Chandigarh 47209 3965 17410 1939 1659 90 14165 309 228 0 D & N Haveli 289728 37672 0 0 0 0 0 0 0 0 Daman & Diu 89 33 0 0 0 0 0 0 0 0 Lakshadweep 34500 4309 0 0 0 0 0 0 0 0 Pondicherry 3009 238 857 152 3851 1319 0 0 1049 0 all-India 14684 2345 1135 237 2650 604 929 120 612 46

Appendix A
NSS Report No. 525: Unorganised Manufacturing Sector in India, 2005-06: Employment, Assets and Borrowings. A - 218
Table 9 (continued): Outstanding loans per enterprise (in Rs.) on the date of survey and
annual interest payable per enterprise (in Rs.) by source agency of loan for each State/UTs
Urban all enterprise type
agency from which loan is taken friends and relatives others total
number of enterprises State/UT
amount interest amount interest amount interest estimated sample(1) (12) (13) (14) (15) (16) (17) (18) (19)
Andhra Pradesh 54 X 57 9 2415 506 1085242 3876 Arunachal Pradesh 1065 X 320 3838 10499 4326 541 76 Assam 205 X 21 7 790 176 333006 2084 Bihar 45 X 0 0 177 28 663379 2468 Chhattisgarh 19 X 533 258 20737 3069 172610 528 Delhi 2100 X 495 64 52274 20300 3639 71 Goa 1235 X 21 1 131489 17510 4546 147 Gujarat 733 X 7 5 2603 938 300753 1350 Haryana 5667 X 488 32 41526 7536 119687 1118 Himachal Pradesh 526 X 268 333 7262 2162 100437 1011 Jammu & Kashmir 947 X 32 0 2033 164 140468 1083 Jharkhand 4 X 2 2 195 28 540250 975 Karnataka 208 X 19 11 2468 648 663211 1770 Kerala 1458 X 22 6 30260 2952 492777 2682 Madhya Pradesh 72 X 53 9 1819 620 564463 1641 Maharashtra 1705 X 143 19 11018 1572 556168 1963 Manipur 54 X 17 3 160 57 35797 443 Meghalaya 124 X 0 0 177 39 34513 388 Mizoram 0 X 0 0 1567 331 3291 223 Nagaland 1333 X 0 0 1713 87 7167 425 Orissa 83 X 34 4 998 135 870877 2190 Punjab 634 X 385 67 6126 807 150208 1130 Rajasthan 530 X 182 35 6036 1060 400875 2032 Sikkim 179 X 7 0 3014 741 3684 164 Tamil Nadu 150 X 2 0 5226 1490 850353 3198 Tripura 159 X 46 2 1362 594 38900 1067 Uttaranchal 722 X 2201 219 19451 2888 53940 377 Uttar Pradesh 211 X 140 121 1473 563 1704516 3378 West Bengal 206 X 208 8 2447 349 2223768 3620 A & N Islands 19766 X 0 0 25504 661 1872 181 Chandigarh 0 X 72 0 10200 65775 753 38 D & N Haveli 0 X 0 0 280 83 797 69 Daman & Diu 0 X 0 0 43 18 1464 77 Lakshadweep 234 X 0 0 2683 854 255 30 Pondicherry 477 X 915 138 110688 12927 4058 177 all-India 374 X 114 32 4634 809 12128266 42050

Appendix A
NSS Report No. 525: Unorganised Manufacturing Sector in India, 2005-06: Employment, Assets and Borrowings. A - 219
Table 9: Outstanding loans per enterprise (in Rs.) on the date of survey and annual interest
payable per enterprise (in Rs.) by source agency of loan for each State/UTs Rural + Urban OAME
agency from which loan is taken central and state level
term lending institution, government (central, state, local bodies), banks and societies
other institutional
agencies
money lenders
business partner
supplier / contractor State/UT
amount interest amount interest amount interest amount interest amount interest(1) (2) (3) (4) (5) (6) (7) (8) (9) (10) (11)
Andhra Pradesh 174 49 53 10 388 148 2 1 26 2 Arunachal Pradesh 0 0 0 0 0 0 0 0 948 114 Assam 17 6 1 0 79 88 2 2 9 1 Bihar 41 16 0 0 11 6 0 0 4 2 Chhattisgarh 488 94 0 0 139 243 0 0 1 0 Delhi 857 94 1284 871 0 0 0 0 0 0 Goa 1520 192 82 11 71 17 0 0 0 0 Gujarat 409 98 81 7 69 23 168 14 1 0 Haryana 3569 396 12 6 1563 2582 0 0 303 20 Himachal Pradesh 1591 864 123 72 2 0 55 17 59 0 Jammu & Kashmir 109 16 0 0 0 0 7 0 177 1 Jharkhand 76 16 1 0 2 2 0 0 0 0 Karnataka 480 94 75 32 96 44 0 0 21 4 Kerala 1646 302 51 12 280 129 0 0 9 2 Madhya Pradesh 297 66 0 0 66 34 5 0 1 0 Maharashtra 1261 375 273 51 88 48 0 0 7 0 Manipur 0 0 0 0 20 10 0 0 1 2 Meghalaya 0 0 0 0 0 0 0 0 0 0 Mizoram 165 12 0 0 0 0 0 0 0 0 Nagaland 107 64 0 0 2 4 0 0 172 0 Orissa 219 40 0 0 25 11 0 0 2 0 Punjab 1802 300 114 49 98 37 0 0 14 0 Rajasthan 383 139 48 25 451 137 0 0 12 2 Sikkim 301 722 0 0 0 0 0 0 13 0 Tamil Nadu 227 40 8 2 764 223 1 0 61 0 Tripura 84 76 0 0 8 0 10 0 19 0 Uttaranchal 1016 147 0 0 18 106 0 0 0 0 Uttar Pradesh 259 104 12 2 40 33 7 2 20 3 West Bengal 81 32 10 7 39 22 0 0 35 5 A & N Islands 381 30 0 0 31 22 0 0 0 0 Chandigarh 1275 8050 0 0 6038 40252 0 0 0 0 D & N Haveli 56 37 0 0 0 0 0 0 0 0 Daman & Diu 71 26 0 0 0 0 0 0 0 0 Lakshadweep 0 0 0 0 1873 674 0 0 0 0 Pondicherry 10 1 0 0 668 330 0 0 0 0 all-India 395 99 39 11 179 97 8 1 25 2

Appendix A
NSS Report No. 525: Unorganised Manufacturing Sector in India, 2005-06: Employment, Assets and Borrowings. A - 220
Table 9 (continued): Outstanding loans per enterprise (in Rs.) on the date of survey and
annual interest payable per enterprise (in Rs.) by source agency of loan for each State/UTs
Rural + Urban OAME
agency from which loan is taken friends and relatives others total
number of enterprises State/UT
amount interest amount interest amount interest estimated sample(1) (12) (13) (14) (15) (16) (17) (18) (19)
Andhra Pradesh 20 X 5 2 667 211 1362802 4808 Arunachal Pradesh 699 X 0 0 1648 114 527 50 Assam 59 X 15 6 182 102 328142 2251 Bihar 30 X 0 0 86 23 726369 3157 Chhattisgarh 5 X 0 0 633 337 193695 607 Delhi 1168 X 1 0 3310 965 17894 83 Goa 4 X 0 0 1676 221 6252 118 Gujarat 403 X 11 3 1142 145 522534 2314 Haryana 278 X 69 0 5793 3006 162561 1037 Himachal Pradesh 170 X 237 339 2237 1291 97149 1008 Jammu & Kashmir 247 X 52 0 592 17 158583 1889 Jharkhand 5 X 0 0 83 18 556927 1411 Karnataka 61 X 21 4 755 179 808576 2470 Kerala 73 X 8 2 2066 447 494680 2442 Madhya Pradesh 180 X 8 2 558 102 795133 2893 Maharashtra 675 X 3670 354 5974 828 841187 3814 Manipur 59 X 11 3 91 15 49017 947 Meghalaya 6 X 1 1 7 1 27830 318 Mizoram 0 X 0 0 165 12 4201 310 Nagaland 1055 X 2 2 1338 70 8754 585 Orissa 31 X 32 4 309 55 913061 2708 Punjab 257 X 163 41 2447 428 223239 1843 Rajasthan 200 X 1 1 1095 305 553000 2826 Sikkim 29 X 6 0 349 722 3466 180 Tamil Nadu 75 X 1 0 1136 265 1188088 3844 Tripura 159 X 39 1 318 77 37093 949 Uttaranchal 362 X 0 0 1396 253 52280 335 Uttar Pradesh 180 X 9 41 527 184 2033045 5424 West Bengal 110 X 34 1 308 68 2434547 3943 A & N Islands 38 X 0 0 449 52 1429 123 Chandigarh 0 X 53 0 7366 48302 1024 20 D & N Haveli 0 X 0 0 56 37 574 38 Daman & Diu 50 X 0 0 121 26 1812 93 Lakshadweep 187 X 0 0 2060 674 320 62 Pondicherry 0 X 0 0 678 331 7116 145 all-India 148 X 229 30 1023 240 14612907 55045

Appendix A
NSS Report No. 525: Unorganised Manufacturing Sector in India, 2005-06: Employment, Assets and Borrowings. A - 221
Table 9: Outstanding loans per enterprise (in Rs.) on the date of survey and annual interest
payable per enterprise (in Rs.) by source agency of loan for each State/UTs Rural + Urban NDME
agency from which loan is taken central and state level
term lending institution, government (central, state, local bodies), banks and societies
other institutional
agencies
money lenders
business partner
supplier / contractor State/UT
amount interest amount interest amount interest amount interest amount interest(1) (2) (3) (4) (5) (6) (7) (8) (9) (10) (11)
Andhra Pradesh 4136 871 1419 325 3733 1210 0 0 51 115 Arunachal Pradesh 0 0 0 0 16 0 0 0 1878 0 Assam 2085 1411 36 16 29 16 12 0 85 0 Bihar 2144 201 0 0 67 20 0 0 81 0 Chhattisgarh 5583 1947 2912 283 41 51 0 0 37 0 Delhi 1129 2357 240 72 1005 1853 1089 117 971 6 Goa 15559 2515 1144 160 0 0 0 0 0 0 Gujarat 9555 1347 1529 210 951 105 179 18 2936 151 Haryana 44392 5431 2584 413 2698 589 400 2 1142 4 Himachal Pradesh 18914 5448 3226 582 60 22 1611 201 764 206 Jammu & Kashmir 11632 1154 346 720 0 0 0 0 1237 0 Jharkhand 3429 390 0 0 24 0 0 0 0 0 Karnataka 9201 1418 1817 166 3591 1046 277 83 84 1 Kerala 23289 2786 1687 238 2718 948 0 0 789 37 Madhya Pradesh 2200 333 88 41 2335 2327 125 7 5 0 Maharashtra 20605 3218 864 201 887 175 399 46 803 2 Manipur 5080 813 299 72 1176 702 0 0 0 0 Meghalaya 266 34 0 0 10 0 0 0 0 0 Mizoram 5534 1291 0 0 0 0 0 0 0 0 Nagaland 211 62 51 61 0 0 96 128 1163 0 Orissa 6198 1234 5029 604 80 26 4 2 92 0 Punjab 10857 1989 183 106 653 179 103 9 12 2 Rajasthan 8174 1264 129 20 2428 904 1579 114 372 11 Sikkim 3580 264 0 0 0 0 0 0 35 0 Tamil Nadu 6097 895 2281 312 4060 1335 0 0 49 2 Tripura 1947 1964 7 2 308 132 96 0 462 0 Uttaranchal 23256 7080 0 0 93 28 0 0 0 0 Uttar Pradesh 2165 615 16 15 360 143 0 0 132 7 West Bengal 7245 1117 170 31 707 1096 10 1 880 94 A & N Islands 7531 779 0 0 391 188 0 0 7 0 Chandigarh 431 54 0 0 0 0 0 0 0 0 D & N Haveli 555 129 0 0 0 0 0 0 0 0 Daman & Diu 0 0 0 0 0 0 0 0 0 0 Lakshadweep 69146 8627 0 0 0 0 0 0 0 0 Pondicherry 11700 1425 293 109 2455 1036 0 0 212 0 all-India 9685 1582 979 160 1648 718 172 18 503 32

Appendix A
NSS Report No. 525: Unorganised Manufacturing Sector in India, 2005-06: Employment, Assets and Borrowings. A - 222
Table 9 (continued): Outstanding loans per enterprise (in Rs.) on the date of survey and
annual interest payable per enterprise (in Rs.) by source agency of loan for each State/UTs
Rural + Urban NDME
agency from which loan is taken friends and relatives others total
number of enterprises State/UT
amount interest amount interest amount interest estimated sample(1) (12) (13) (14) (15) (16) (17) (18) (19)
Andhra Pradesh 465 X 16 1 9820 2522 114958 1203 Arunachal Pradesh 670 X 558 6696 3122 6696 310 47 Assam 800 X 224 39 3271 1482 38228 590 Bihar 355 X 0 0 2646 222 43407 572 Chhattisgarh 891 X 369 336 9834 2616 9632 141 Delhi 1385 X 133 5 5951 4410 47700 219 Goa 2928 X 0 0 19630 2675 3059 81 Gujarat 8038 X 981 113 24169 1944 68736 660 Haryana 15396 X 149 26 66761 6466 52586 545 Himachal Pradesh 5359 X 55 0 29989 6459 8927 322 Jammu & Kashmir 743 X 3 0 13962 1875 12474 511 Jharkhand 885 X 52 5 4391 395 26829 313 Karnataka 674 X 55 64 15700 2779 81071 603 Kerala 2389 X 71 17 30943 4027 133741 1298 Madhya Pradesh 433 X 232 23 5417 2731 45067 482 Maharashtra 4029 X 190991 21892 218577 25535 174625 1341 Manipur 156 X 0 7 6711 1595 3152 181 Meghalaya 78 X 0 0 354 34 7847 177 Mizoram 9 X 0 0 5543 1291 820 128 Nagaland 2002 X 0 0 3523 252 1078 94 Orissa 1644 X 63 11 13109 1876 37330 397 Punjab 3222 X 428 61 15458 2346 58142 811 Rajasthan 1201 X 2401 196 16285 2508 61608 839 Sikkim 357 X 7 0 3979 264 583 64 Tamil Nadu 524 X 4 1 13014 2544 205965 1615 Tripura 159 X 170 10 3149 2107 7756 580 Uttaranchal 132 X 37 7 23518 7115 13906 182 Uttar Pradesh 2335 X 18 1 5026 781 258904 1968 West Bengal 1786 X 353 48 11150 2387 245846 1787 A & N Islands 1129 X 0 0 9058 966 710 77 Chandigarh 0 X 0 0 431 54 303 16 D & N Haveli 0 X 0 0 555 129 345 57 Daman & Diu 0 X 0 0 0 0 320 42 Lakshadweep 1259 X 0 0 70405 8627 71 17 Pondicherry 6869 X 0 0 21529 2571 4245 100 all-India 2392 X 19061 2190 34440 4701 1770282 18060

Appendix A
NSS Report No. 525: Unorganised Manufacturing Sector in India, 2005-06: Employment, Assets and Borrowings. A - 223
Table 9: Outstanding loans per enterprise (in Rs.) on the date of survey and annual interest
payable per enterprise (in Rs.) by source agency of loan for each State/UTs Rural + Urban DME
agency from which loan is taken central and state level
term lending institution, government (central, state, local bodies), banks and societies
other institutional
agencies
money lenders
business partner
supplier / contractor State/UT
amount interest amount interest amount interest amount interest amount interest(1) (2) (3) (4) (5) (6) (7) (8) (9) (10) (11)
Andhra Pradesh 28403 4268 2556 472 13739 3873 10584 1215 2723 576 Arunachal Pradesh 411805 118600 0 0 0 0 0 0 19584 3294 Assam 49377 3941 9400 1294 2188 350 521 22 561 0 Bihar 21750 450 0 0 2272 545 0 0 1294 175 Chhattisgarh 830544 107338 2573 265 70283 7025 32851 2040 1273 151 Delhi 50456 6518 23299 16089 1734 221 5892 162 1703 194 Goa 697331 90864 16250 2305 0 0 0 0 4262 0 Gujarat 40385 5771 3068 3109 60481 8173 17617 1667 1008 78 Haryana 338262 41168 18714 1211 29528 3594 49893 10722 22499 1178 Himachal Pradesh 381154 66654 15794 1021 17057 2339 5468 778 6140 2 Jammu & Kashmir 308876 51542 2251 158 449 97 288 226 140 0 Jharkhand 56321 5727 29 40 1140 70 0 0 0 0 Karnataka 25877 5623 3989 915 3303 930 336 38 490 121 Kerala 298644 31929 218547 13438 26065 4615 1005 189 2198 15 Madhya Pradesh 179298 41596 2920 377 6860 1846 14259 897 5317 436 Maharashtra 236351 24767 16543 1553 18846 2377 20161 2464 13141 975 Manipur 27012 4322 450 270 4748 2124 0 0 0 0 Meghalaya 4003 3485 109 91 691 187 0 0 2517 454 Mizoram 8929 36437 0 0 0 0 0 0 0 0 Nagaland 9205 1678 0 0 4024 12554 0 0 2012 0 Orissa 123288 14347 2210 497 12040 2207 0 0 2805 39 Punjab 201442 21534 1684 347 12148 1349 28540 3256 1902 21 Rajasthan 143887 16227 17689 1458 57384 10256 11275 1128 5044 102 Sikkim 173881 4217 0 0 0 0 0 0 626 0 Tamil Nadu 56376 12440 7598 2129 22447 5663 2078 242 944 50 Tripura 63976 28459 0 0 50 18 0 0 0 0 Uttaranchal 219670 43750 0 0 844 101 4376 275 0 0 Uttar Pradesh 116216 53857 269 25 8135 1826 5780 1812 2274 102 West Bengal 73893 11093 10933 797 5455 1106 5331 944 1473 70 A & N Islands 41475 4115 0 0 7474 2959 0 0 0 0 Chandigarh 638060 53591 235306 26213 22428 1214 191452 4181 3081 0 D & N Haveli 997612 129713 0 0 0 0 0 0 0 0 Daman & Diu 78 37 0 0 0 0 0 0 0 0 Lakshadweep 0 0 0 0 0 0 0 0 0 0 Pondicherry 145403 15880 37806 4762 19812 4186 23 3 5000 0 all-India 119040 19414 17781 2494 19006 3333 9941 1335 4032 298

Appendix A
NSS Report No. 525: Unorganised Manufacturing Sector in India, 2005-06: Employment, Assets and Borrowings. A - 224
Table 9 (continued): Outstanding loans per enterprise (in Rs.) on the date of survey and
annual interest payable per enterprise (in Rs.) by source agency of loan for each State/UTs
Rural + Urban DME
agency from which loan is taken friends and relatives others total
number of enterprises State/UT
amount interest amount interest amount interest estimated sample(1) (12) (13) (14) (15) (16) (17) (18) (19)
Andhra Pradesh 651 X 1110 144 59765 10547 55479 572 Arunachal Pradesh 0 X 0 0 431389 121894 22 5 Assam 9804 X 1171 173 73022 5781 4411 74 Bihar 109 X 0 0 25425 1170 2621 96 Chhattisgarh 1744 X 35032 11359 974300 128179 4153 129 Delhi 21837 X 10391 1344 115312 24530 32041 256 Goa 33238 X 95 5 751176 93173 997 62 Gujarat 13330 X 2174 269 138063 19066 63088 538 Haryana 77749 X 9908 860 546553 58734 14963 587 Himachal Pradesh 58512 X 24912 2584 509036 73379 1367 173 Jammu & Kashmir 38014 X 19228 173 369245 52196 2355 131 Jharkhand 0 X 559 459 58049 6296 2192 54 Karnataka 1760 X 24 2 35779 7630 72113 363 Kerala 16938 X 174 0 563571 50187 30271 396 Madhya Pradesh 9632 X 41677 4181 259963 49443 14359 404 Maharashtra 32637 X 73897 5931 411576 38066 110650 1285 Manipur 713 X 304 182 33227 6898 349 34 Meghalaya 2954 X 6843 687 17118 4904 1310 49 Mizoram 0 X 0 0 8929 36437 80 15 Nagaland 3772 X 0 0 19013 14232 75 14 Orissa 3334 X 7000 51 150677 17141 6838 187 Punjab 28328 X 32334 2385 306378 28891 11856 371 Rajasthan 27621 X 11299 1521 274200 30693 21862 817 Sikkim 8931 X 0 0 183438 4217 54 18 Tamil Nadu 2617 X 175 24 92235 20548 87880 1142 Tripura 374 X 0 0 64400 28477 521 77 Uttaranchal 9668 X 42083 4166 276641 48292 2902 43 Uttar Pradesh 14656 X 7094 2296 154424 59918 67426 853 West Bengal 4304 X 7381 317 108769 14328 72400 880 A & N Islands 207997 X 0 0 256946 7074 177 19 Chandigarh 253652 X 383330 21604 1727307 106803 46 22 D & N Haveli 142760 X 56883 8204 1197255 137917 50 24 Daman & Diu 0 X 0 0 78 37 507 22 Lakshadweep 0 X 0 0 0 0 7 4 Pondicherry 866 X 3546 622 212456 25453 2210 76 all-India 14493 X 16810 1611 201102 28487 687632 9792

Appendix A
NSS Report No. 525: Unorganised Manufacturing Sector in India, 2005-06: Employment, Assets and Borrowings. A - 225
Table 9: Outstanding loans per enterprise (in Rs.) on the date of survey and annual interest
payable per enterprise (in Rs.) by source agency of loan for each State/UTs Rural + Urban all enterprise type
agency from which loan is taken central and state level
term lending institution, government (central, state, local bodies), banks and societies
other institutional
agencies
money lenders
business partner
supplier / contractor State/UT
amount interest amount interest amount interest amount interest amount interest(1) (2) (3) (4) (5) (6) (7) (8) (9) (10) (11)
Andhra Pradesh 1493 263 246 50 1122 362 385 45 125 31 Arunachal Pradesh 10474 3017 0 0 6 0 0 0 1758 154 Assam 817 197 116 17 99 84 9 2 23 1 Bihar 233 27 0 0 22 9 0 0 13 2 Chhattisgarh 17339 2326 187 18 1539 370 658 41 28 3 Delhi 17267 3308 7998 5475 1060 978 2466 110 1033 67 Goa 72961 9648 1960 277 43 10 0 0 412 0 Gujarat 5224 776 521 327 5986 817 1852 174 406 23 Haryana 34661 4198 1816 178 3640 2193 3336 698 1938 92 Himachal Pradesh 7859 2082 580 126 224 32 254 42 195 17 Jammu & Kashmir 5131 797 55 54 6 1 10 3 253 1 Jharkhand 440 54 1 0 7 2 0 0 0 0 Karnataka 3120 620 516 109 631 195 49 10 61 13 Kerala 19689 2260 10424 675 1960 501 46 9 268 10 Madhya Pradesh 3405 777 54 9 300 185 251 15 91 8 Maharashtra 27352 3212 1963 222 2055 296 2042 249 1420 96 Manipur 484 78 21 6 121 66 0 0 1 1 Meghalaya 198 131 4 3 27 7 0 0 89 16 Mizoram 1166 789 0 0 0 0 0 0 0 0 Nagaland 187 76 6 7 32 98 10 14 293 0 Orissa 1331 189 212 27 113 27 0 0 26 0 Punjab 11669 1494 191 72 696 118 1174 133 90 1 Rajasthan 6066 801 661 74 2598 559 540 50 220 7 Sikkim 3048 703 0 0 0 0 0 0 24 0 Tamil Nadu 4372 894 774 171 2508 700 124 14 112 4 Tripura 1136 724 1 0 59 23 25 0 94 0 Uttaranchal 14676 3374 0 0 68 90 184 12 0 0 Uttar Pradesh 3782 1696 20 4 306 97 171 53 97 6 West Bengal 2662 420 312 30 241 147 141 25 148 15 A & N Islands 5708 571 0 0 709 297 0 0 2 0 Chandigarh 22381 7810 7868 876 5255 30072 6402 140 103 0 D & N Haveli 51606 6748 0 0 0 0 0 0 0 0 Daman & Diu 63 25 0 0 0 0 0 0 0 0 Lakshadweep 12385 1545 0 0 1507 542 0 0 0 0 Pondicherry 27347 3033 6249 810 4345 1179 4 0 881 0 all-India 6137 1031 852 127 1090 291 425 56 236 17

Appendix A
NSS Report No. 525: Unorganised Manufacturing Sector in India, 2005-06: Employment, Assets and Borrowings. A - 226
Table 9 (continued): Outstanding loans per enterprise (in Rs.) on the date of survey and
annual interest payable per enterprise (in Rs.) by source agency of loan for each State/UTs
Rural + Urban all enterprise type
agency from which loan is taken friends and relatives others total
number of enterprises State/UT
amount interest amount interest amount interest estimated sample(1) (12) (13) (14) (15) (16) (17) (18) (19)
Andhra Pradesh 76 X 46 7 3492 758 1533239 6583 Arunachal Pradesh 671 X 201 2417 13111 5588 859 102 Assam 252 X 50 11 1367 312 370781 2915 Bihar 49 X 0 0 316 38 772397 3825 Chhattisgarh 81 X 718 243 20549 3001 207481 877 Delhi 8057 X 3475 444 41356 10382 97636 558 Goa 4085 X 9 0 79470 9936 10308 261 Gujarat 2452 X 321 40 16762 2158 654358 3512 Haryana 8770 X 727 62 54888 7420 230110 2169 Himachal Pradesh 1343 X 536 339 10991 2638 107442 1503 Jammu & Kashmir 795 X 309 2 6560 859 173412 2531 Jharkhand 45 X 4 2 497 59 585948 1778 Karnataka 240 X 24 9 4641 957 961761 3436 Kerala 1318 X 28 5 33734 3460 658692 4136 Madhya Pradesh 352 X 720 74 5173 1070 854559 3779 Maharashtra 4335 X 39607 4241 78773 8316 1126462 6440 Manipur 70 X 12 5 709 156 52518 1162 Meghalaya 126 X 243 25 686 182 36987 544 Mizoram 1 X 0 0 1167 789 5101 453 Nagaland 1178 X 2 2 1708 197 9906 693 Orissa 118 X 83 5 1883 248 957229 3292 Punjab 1980 X 1516 140 17315 1959 293237 3025 Rajasthan 1239 X 621 72 11946 1562 636470 4482 Sikkim 192 X 6 0 3271 703 4103 262 Tamil Nadu 288 X 12 2 8189 1785 1481933 6601 Tripura 162 X 61 2 1538 750 45370 1606 Uttaranchal 707 X 1775 176 17409 3652 69087 560 Uttar Pradesh 830 X 213 101 5419 1956 2359375 8245 West Bengal 370 X 256 13 4129 650 2752793 6610 A & N Islands 16237 X 0 0 22655 868 2316 219 Chandigarh 8481 X 12857 722 63347 39621 1373 58 D & N Haveli 7352 X 2929 422 61887 7170 969 119 Daman & Diu 35 X 0 0 98 25 2639 157 Lakshadweep 376 X 0 0 14268 2088 397 83 Pondicherry 2290 X 578 101 41693 5123 13572 321 all-India 958 X 2850 318 12548 1840 17070820 82897

Appendix B Coverage, Sample Design,
Estimation Procedure

Appendix B
NSS Report No. 525: Unorganised Manufacturing sector in India, 2005-06: Employment, Assets and Borrowings. B - 1
Coverage, Sample Design and Estimation Procedure
1.0 Introduction: 1.0.1The National Sample Survey (NSS), set up by the Government of India in 1950 to collect socio-economic data employing scientific sampling methods started its sixty-second round from 1st July, 2005. The survey continued upto 30th June 2006. 1.0.2 Following the first Economic Census 1977, small establishments and enterprises not employing any hired worker [and henceforth called 'own account enterprises' (OAEs)] engaged in manufacturing and repairing activities were surveyed on sample basis in the thirty-third round of NSS during 1978-79. 1.0.3 As a follow-up to the second Economic Census 1980, own account enterprises and Non-directory Establishments engaged in manufacturing and repairing activities (i.e., OAMEs and NDMEs respectively) were surveyed in the fortieth and forty-fifth rounds of NSS during July 1984-June 1985 and July 1989-June 1990 respectively. The Directory Manufacturing Establishments (DMEs) were surveyed during October 1984-September 1985 and October 1989 to September 1990 respectively by a group of special staff (Assistant Superintendents only) of the Field Operations Division (FOD) of the NSSO under the technical direction of the CSO. 1.0.4 As a follow-up to the third Economic Census 1990, the first integrated survey on unorganised manufacturing and repairing enterprises covering OAMEs, NDMEs and DMEs was undertaken during the fifty-first round of NSS (July 1994-June 1995). 1.0.5 Following this, two other surveys were undertaken – (i) Special Enterprise Survey on enterprises in the unorganised sector during the period August 1998 to June 1999 and (ii) Informal sector enterprises as part of NSS 55th round during July 1999 to June 2000. Manufacturing sector was part of coverage in both these surveys. As a follow up of fourth Economic Census 1998, survey of manufacturing enterprises in the unorganised sector was conducted in the 56th round of NSS during July 2000 to June 2001. 1.1 Subject Coverage: The 62nd round (July 2005 - June 2006) of NSS was earmarked for survey on (i) unorganised manufacturing enterprises under the two-digit codes 15 to 37 (Section ‘D’) of NIC–2004 and enterprises under cotton ginning, cleaning and baling (NIC–2004, code 01405), (ii) annual survey of consumer expenditure and (iii) survey on employment – unemployment. Following activities have been classified under Manufacturing (NIC –2004 Section D):
Division Description 15 Manufacture of Food Products and Beverages 16 Manufacture of Tobacco Products 17 Manufacture of Textiles 18 Manufacture of Wearing Apparel; Dressing and Dyeing of Fur 19 Tanning and Dressing of Leather; Manufacture of Luggage, Handbags, Saddlery, Harness and
Footwear 20 Manufacture of Wood and of Products of Wood and Cork, Except
Furniture; Manufacture of Articles of Straw and Plaiting Materials 21 Manufacture of Paper and Paper Products

Appendix B
NSS Report No. 525: Unorganised Manufacturing sector in India, 2005-06: Employment, Assets and Borrowings. B - 2
Division Description 22 Publishing, Printing and Reproduction of Recorded Media 23 Manufacture of Coke, Refined Petroleum Products and Nuclear Fuel 24 Manufacture of Chemicals and Chemical Products 25 Manufacture of Rubber and Plastics Products 26 Manufacture of Other Non-Metallic Mineral Products 27 Manufacture of Basic Metals 28 Manufacture of Fabricated Metal Products, Except Machinery and Equipment 29 Manufacture of Machinery and Equipment N.E.C. 30 Manufacture of Office, Accounting and Computing Machinery 31 Manufacture of Electrical Machinery and Apparatus N.E.C. 32 Manufacture of Radio, Television and Communication Equipment and Apparatus 33 Manufacture of Medical, Precision and Optical Instruments, Watches and Clocks 34 Manufacture of Motor Vehicles, Trailers and Semi-Trailers 35 Manufacture of Other Transport Equipment 36 Manufacture of Furniture; Manufacturing N.E.C. 37 Recycling
Thus survey on unorganised manufacturing enterprises covered:
(a) Manufacturing enterprises not registered under Sections 2m(i) and 2m(ii) of the Factories Act, 1948
(b) Manufacturing enterprises registered under Section 85 of Factories Act, 1948 (c) Non-ASI enterprises engaged in cotton ginning, cleaning and baling (NIC- 2004, code
01405) (d) Non-ASI enterprises manufacturing bidi and cigar (those registered under bidi and cigar
workers (condition of employment) Act, 1966 as well as those un-registered) and excluded:
(a) Repairing enterprises not falling under Section ‘D’ of NIC- 2004 (b) Departmental units such as Railway Workshops, RTC Workshops, Government Mint,
Sanitary, Water supply, Gas, Storage, etc. in line with ASI coverage (c) Units covered under ASI (d) Public Sector Units
1.2 Geographical coverage: The survey covered the whole of the Indian Union except (i) Leh (Ladakh) and Kargil districts of Jammu & Kashmir, (ii) interior villages of Nagaland situated beyond five kilometres of the bus route and (iii) villages in Andaman and Nicobar Islands which remain inaccessible throughout the year. 1.3 Period of survey and work programme: The period of survey was of one year duration starting on 1st July 2005 and ending on 30th June 2006. The survey period of this round was divided into four sub-rounds of three months’ duration each to spread the survey workload uniformly. The sub-rounds were as follows:
sub-round 1 : July - September 2005
sub-round 2 : October - December 2005
sub-round 3 : January - March 2006
sub-round 4 : April - June 2006

Appendix B
NSS Report No. 525: Unorganised Manufacturing sector in India, 2005-06: Employment, Assets and Borrowings. B - 3
Because of the arduous field conditions, sub-round restriction was not strictly enforced in Andaman and Nicobar Islands, Lakshadweep, rural areas of Arunachal Pradesh and Nagaland. 1.4 Schedules of enquiry: During this round, the following schedules of enquiry were canvassed:
Schedule 0.0 : list of households and non-agricultural enterprises
Schedule 2.2 : manufacturing enterprises
Schedule 1.0 : consumer expenditure
Schedule 10 : employment and unemployment
1.5 Participation of States: In this round all the States and Union Territories except Andaman & Nicobar Islands, Dadra & Nagar Haveli and Lakshadweep participated at least on an equal matching basis. The following was the matching pattern of the participating States/ UTs.
Nagaland (U) : triple
J & K, Manipur & Delhi : double
Goa, Maharashtra (U), Kerala : one and half
Remaining States/ UTs : equal
2 Sample Design 2.1 Outline of sample design: Two frames were used for the 62nd round survey viz. List frame and Area frame. 2.1.2 List frame: This was used only for urban sector and that too for selection of manufacturing enterprises only. For unorganised manufacturing enterprises, a list of about 8000 big non-ASI manufacturing units in the urban sector prepared on the basis of the data of the census of manufacturing enterprises conducted by Development Commissioners of Small Scale Industries (DCSSI) in 2003 was used as list frame. The ‘big’ DCSSI units in the urban sector had been identified by the criteria given below:
(1) From the list of registered SSI units, units not registered under sections 2m(i) or 2m(ii) of
Factories Act, 1948 and belonging to NIC ’98 codes 01405, 15 – 37 were considered.
(2) Out of the above units, the units whose gross value of output in 2001 were more than 6 times the average output (Rs. 14,32,314) of all urban SSI units were separated out.
(3) From the above units, those with 6 or more workers were identified as the big units for list frame.
About 8000 such units constituted the list frame. All these units in the list frame were to be surveyed and there was not any sampling for list frame. To avoid duplication, these units were excluded from the list of enterprises prepared in the selected urban blocks/villages drawn from the area frame. There was no sub-round restriction for the list frame units.

Appendix B
NSS Report No. 525: Unorganised Manufacturing sector in India, 2005-06: Employment, Assets and Borrowings. B - 4
All the enterprises in the list frame are common to both central and state samples.
2.1.3 Area frame: This was adopted for both rural and urban sectors. The list of villages as per census 2001 (for Manipur, 1991 census was used since 2001 census list was not available) was used as frame for the rural sector and the latest available list of UFS blocks was used as frame in the urban sector. However, EC-98 was used as frame for the 27 towns with population 10 lakhs or more (as per Census 2001). A stratified multi-stage design had been adopted for the 62nd round survey. The first stage units (FSU) were the 2001 census (for Manipur, 1991 census ) villages (Panchayat wards in case of Kerala) in the rural sector and Urban Frame Survey (UFS) blocks in the urban sector. The ultimate stage units (USU) were households/ unorganised-manufacturing enterprises (OAME/ NDME/ DMEs), in both the sectors. In the case of large villages/ blocks requiring hamlet-group (hg)/ sub-block (sb) formation, one intermediate stage was the selection of two hgs/ sbs from each FSU.
2.1.4 Stratification: Within each district of a State/ UT, two basic strata were formed: i) rural stratum comprising of all rural areas of the district and (ii) urban stratum comprising of all the urban areas of the district. However, if there were one or more towns with population 10 lakhs or more as per population census 2001 in a district, each of them also formed a separate basic stratum and the remaining urban areas of the district was considered as another basic stratum. There are 27 towns with population 10 lakhs or more at all-India level as per census 2001.
2.1.5 Sub-stratification for area frame: 2.1.5.1 Rural sector:
Development Commissioner of Small Scale Industries (DCSSI) conducted a survey of all
Small Scale Industries (SSI) units in 2003 covering all registered SSI units on a census basis and other SSI units on a sample basis. 9306 villages having a ‘big’ non-ASI registered SSI manufacturing unit as per DCSSI census had been identified by matching the identification particulars of census 2001 with those of DCSSI census. ‘Big’ DCSSI unit, on the basis of which villages had been identified, satisfied the conditions:
(a) It was a registered SSI unit in rural area as per DCSSI census belonging to NIC ’98 codes 01405, 15 – 37 and it was not registered under sections 2m(i) or 2m(ii) of Factories Act, 1948 and
(b) It had 6 or more workers.
A subset of these 9306 villages having ‘bigger’ non-ASI registered SSI manufacturing unit had been considered for formation of a separate sub-stratum (termed as sub-stratum 1). The ‘bigger’ registered SSI units were those which, in addition to fulfilling the criteria (a) and (b) above, satisfied the criteria:
(c) The SSI unit had gross value of output in 2001 more than the average output (Rs. 7,52,159) of rural SSI units identified in (a) and (b) above and
(d) The SSI unit had 11 or more workers and

Appendix B
NSS Report No. 525: Unorganised Manufacturing sector in India, 2005-06: Employment, Assets and Borrowings. B - 5
(e) The output of the SSI unit had been continuously increasing over the last three years between 1999 and 2001.
Sub-stratum 1 villages had been identified at the State/ UT level after arranging the above villages in descending order of total of gross output of the bigger registered SSI units in the village during these three years and selecting the required number of them from the top. Obviously, the district containing any such villages had sub-stratum 1. The total number of such sub-stratum 1 villages at all-India level was 462.
2.1.5.2 Sub-stratification of rural areas of each district comprised the following:
sub-stratum 1: The villages in the district which belonged to the list of 462 villages. sub-stratum 2: The villages in the district which were not in sub-stratum 1 but belonged to the set of
9306 villages. sub-stratum 3, 4, 5, … : Remaining FSUs of the district were first arranged in ascending order of
census 2001 population. Then n/2 sub-strata, n being the stratum allocation excluding the allocations for sub-strata 1 & 2, were formed in such a way that each sub-stratum had more or less equal population.
Sub-strata 1 & 2 were not formed in Kerala. Also sub-strata 1/ sub-strata 2 were not formed for some smaller States/ UTs. 2.1.5.3 Urban sector:
(a) For the 27 cities where EC-98 frame was used: Two sub-strata were formed within each stratum based on EC-98 information as under:
sub-stratum 1: all FSUs (i.e. UFS blocks as per the EC-98) with at least one DME or NDME in the unorganised sector.
sub-stratum 2: remaining FSUs.
(b) For towns where latest phase of UFS were used: Two sub-strata were formed as follows:
sub-stratum 1: all FSUs (i.e. UFS blocks as per the latest UFS) identified as Industrial Area (IA) or Bazar Area (BA) or Slum Area (SA).
sub-stratum 2: remaining FSUs 2.1.6. Total sample size: 9997 FSUs (rural & urban combined) for area frame and 8000 manufacturing units for list frame (urban only) were allocated at all-India level for central sample on the basis of investigator strength. For state sample 10518 FSUs were allocated for area frame. List frame units for the state sample were the same as those in the central sample. 2.1.7 Allocation of samples to rural & urban sector: The allocation between rural and urban sectors had been made in proportion to the number of unorganised non-agricultural workers as per EC-98. 2.1.8 Allocation of total samples to States and UTs: The total (all-India) rural/ urban sample size had been allocated to different States and UTs in proportion to number of unorganised non-

Appendix B
NSS Report No. 525: Unorganised Manufacturing sector in India, 2005-06: Employment, Assets and Borrowings. B - 6
agriculture workers as per EC-98 subject to the availability of investigators ensuring more or less uniform work-load. 2.1.9 Allocation to strata: Within each sector of a State/ UT, the respective sample size were allocated to the different strata in proportion to the stratum population as per census 2001. 2.1.10 Allocation to sub-strata: 2.1.10.1 Rural sector: 462 FSUs of sub-stratum 1 were allocated to the districts where these FSUs were located. For each sub-stratum 2, maximum allocation was 4. A set of 856 FSUs in the central sample and 796 samples in the state sample were selected at all-India level for sub-stratum 2. Minimum allocation for sub-stratum 3 and above was 2.
2.1.10.2 Urban sector: For 27 million plus cities in the urban sector, stratum allocations were distributed over the sub-strata in proportion to the number of non-agricultural workers in the unorganised sector as per EC ’98. For other towns, stratum allocation was divided among the sub-strata in proportion to number of FSUs in the sub-strata with double weightage to sub-stratum 1. Minimum sub-stratum allocation was 2. 2.1.11 Selection of FSUs: Samples were drawn in the form of two sub-samples in each stratum × sub-stratum. However, all the FSUs of sub-stratum 1 in rural sector were in sub-sample 1. Similarly, all list frame units in urban sector were considered in sub-sample 1 only. All the FSUs of sub-stratum 1 in rural sector were common to both central and State samples. 2.1.11.1 Rural sector: (a) sub-stratum 1: All 462 FSUs were surveyed.
(b) sub-stratum 2: FSUs were selected with PPSWR where size was number of non-ASI registered SSI DME units in the village.
(c) sub-stratum 3, 4, 5, ….: FSUs were selected by PPSWR with size as population as per census 2001.
2.1.11.2 Urban sector: (a) For 27 million plus cities: FSUs were selected by PPSWR with the number of manufacturing
workers in the unorganised sector as per EC ’98 as size. The number of manufacturing workers was taken as 1 for those blocks where there were no unorganised manufacturing enterprises. However, some manufacturing enterprises had been found to have large number of workers as per EC- 98 frame even though they were in the unorganised sector. Some adjustment to the size of workers for such enterprises were, therefore, made before calculating the size of FSUs. For this purpose, any unorganised manufacturing enterprise having more than 200 workers was deemed to have a size equal to 200. Enterprise sizes were thereafter added up to get the FSU size and sub-stratum/ stratum size.
(b) For other cities/ towns: FSUs were selected by SRSWOR. 2.1.12 Formation of segment 9: Segment 9 was formed in the selected sample FSUs of rural sub-strata 1 & 2 of each stratum. It comprised only the big non-ASI registered SSI manufacturing unit(s) in the village as per DCSSI census on the basis of which the villages had been identified. The names of such units in the selected sample FSUs were supplied to field offices. If any such unit was found to be eligible for ASI, it was not be covered under segment 9. If there was a change
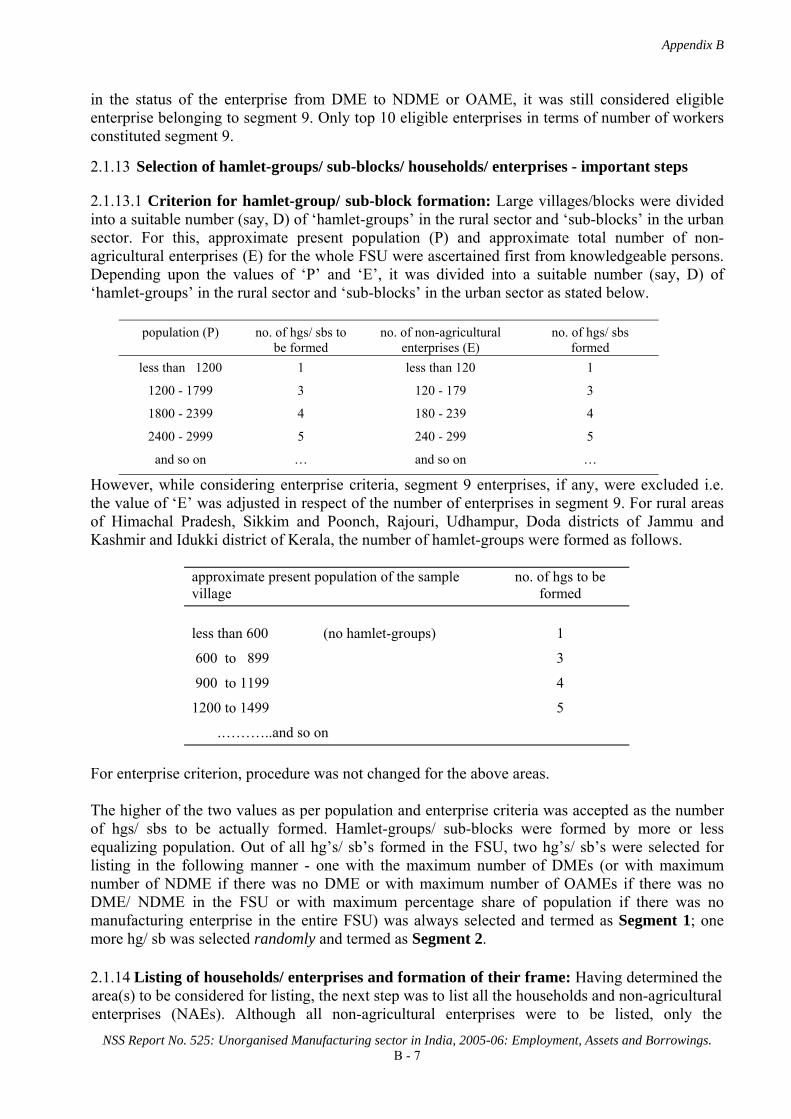
Appendix B
NSS Report No. 525: Unorganised Manufacturing sector in India, 2005-06: Employment, Assets and Borrowings. B - 7
in the status of the enterprise from DME to NDME or OAME, it was still considered eligible enterprise belonging to segment 9. Only top 10 eligible enterprises in terms of number of workers constituted segment 9. 2.1.13 Selection of hamlet-groups/ sub-blocks/ households/ enterprises - important steps 2.1.13.1 Criterion for hamlet-group/ sub-block formation: Large villages/blocks were divided into a suitable number (say, D) of ‘hamlet-groups’ in the rural sector and ‘sub-blocks’ in the urban sector. For this, approximate present population (P) and approximate total number of non-agricultural enterprises (E) for the whole FSU were ascertained first from knowledgeable persons. Depending upon the values of ‘P’ and ‘E’, it was divided into a suitable number (say, D) of ‘hamlet-groups’ in the rural sector and ‘sub-blocks’ in the urban sector as stated below.
population (P) no. of hgs/ sbs to be formed
no. of non-agricultural enterprises (E)
no. of hgs/ sbs formed
less than 1200 1 less than 120 1
1200 - 1799 3 120 - 179 3
1800 - 2399 4 180 - 239 4
2400 - 2999 5 240 - 299 5
and so on … and so on …
However, while considering enterprise criteria, segment 9 enterprises, if any, were excluded i.e. the value of ‘E’ was adjusted in respect of the number of enterprises in segment 9. For rural areas of Himachal Pradesh, Sikkim and Poonch, Rajouri, Udhampur, Doda districts of Jammu and Kashmir and Idukki district of Kerala, the number of hamlet-groups were formed as follows.
approximate present population of the sample village
no. of hgs to be formed
less than 600 (no hamlet-groups) 1
600 to 899 3
900 to 1199 4
1200 to 1499 5
.………..and so on
For enterprise criterion, procedure was not changed for the above areas. The higher of the two values as per population and enterprise criteria was accepted as the number of hgs/ sbs to be actually formed. Hamlet-groups/ sub-blocks were formed by more or less equalizing population. Out of all hg’s/ sb’s formed in the FSU, two hg’s/ sb’s were selected for listing in the following manner - one with the maximum number of DMEs (or with maximum number of NDME if there was no DME or with maximum number of OAMEs if there was no DME/ NDME in the FSU or with maximum percentage share of population if there was no manufacturing enterprise in the entire FSU) was always selected and termed as Segment 1; one more hg/ sb was selected randomly and termed as Segment 2.
2.1.14 Listing of households/ enterprises and formation of their frame: Having determined the area(s) to be considered for listing, the next step was to list all the households and non-agricultural enterprises (NAEs). Although all non-agricultural enterprises were to be listed, only the

Appendix B
NSS Report No. 525: Unorganised Manufacturing sector in India, 2005-06: Employment, Assets and Borrowings. B - 8
unorganised manufacturing enterprises under Industry Division 15 to 37 and NIC code 01405 (cotton ginning, cleaning and baling) as per NIC-2004 were covered. Thus, manufacturing enterprise registered under Sec. 2m(i) & 2m(ii) of the Factories Act, 1948 or Bidi and Cigar workers (conditions of employment) Act 1966 under the coverage of ASI or Govt. manufacturing enterprise/ PSU were not considered for survey. Further, only those manufacturing enterprises which operated for at least 30 days (15 days for seasonal enterprises) during the reference year (i.e. last 365 days preceding the date of survey) qualified for survey. Such enterprises will hereafter be referred to as ‘eligible enterprises’. Listing of households as well as eligible enterprises for the purpose of sample selection were independent for segments 1 & 2.
2.1.15 Formation of Second Stage Strata and allocation of enterprises for schedule 2.2:
All the eligible enterprises listed in the selected village/ block/ segment were stratified into two broad second stage strata by enterprise type OAME and NDME/ DME. Each of these two broad second-stage strata was divided into 3 second-stage strata by Broad Manufacturing Group (BMG) i.e. BMG 1, BMG 2 & BMG 3. Thus there were a maximum of 6 second-stage strata [SSS 1: (OAME x BMG 1), SSS 2: (OAME x BMG 2), SSS 3: (OAME x BMG 3), SSS 4: (NDME/ DME x BMG 1), SSS 5: (NDME/ DME x BMG 2) and SSS 6: (NDME/ DME x BMG 3)] in each segment.
The three BMGs were to be formed after classifying the unorganized manufacturing enterprises as per NIC-2004 as follows:
BMG NIC-2004 codes
1 15 to 20
2 23, 27, 30 to 35, 01405
3 rest of NIC codes under Section ‘D’
The composition of SSS and number of enterprises allocated for schedule 2.2 in each FSU was as follows (excluding DMEs in segment 9).
number of enterprises to be surveyed for schedule 2.2
enterprise type BMG SSS no. without hg/ sb formation
with hg/ sb formation (for each segment)
1 1 2 1
2 2 2 1
OAME
3 3 2 1
1 4 2 1
2 5 2 1
NDME/ DME
3 6 2 1
From each SSS the sample enterprises for schedule 2.2 were selected by SRSWOR.
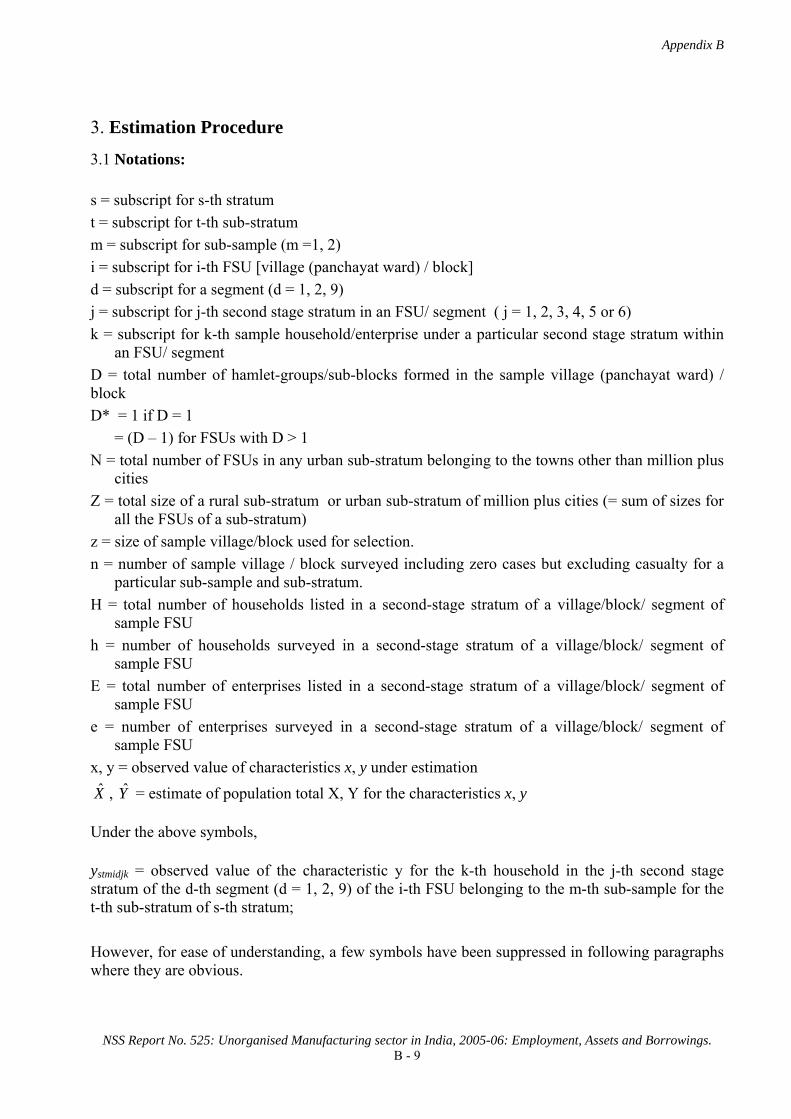
Appendix B
NSS Report No. 525: Unorganised Manufacturing sector in India, 2005-06: Employment, Assets and Borrowings. B - 9
3. Estimation Procedure 3.1 Notations: s = subscript for s-th stratum t = subscript for t-th sub-stratum m = subscript for sub-sample (m =1, 2) i = subscript for i-th FSU [village (panchayat ward) / block] d = subscript for a segment (d = 1, 2, 9) j = subscript for j-th second stage stratum in an FSU/ segment ( j = 1, 2, 3, 4, 5 or 6) k = subscript for k-th sample household/enterprise under a particular second stage stratum within
an FSU/ segment D = total number of hamlet-groups/sub-blocks formed in the sample village (panchayat ward) / block D* = 1 if D = 1 = (D – 1) for FSUs with D > 1 N = total number of FSUs in any urban sub-stratum belonging to the towns other than million plus
cities Z = total size of a rural sub-stratum or urban sub-stratum of million plus cities (= sum of sizes for
all the FSUs of a sub-stratum) z = size of sample village/block used for selection. n = number of sample village / block surveyed including zero cases but excluding casualty for a
particular sub-sample and sub-stratum. H = total number of households listed in a second-stage stratum of a village/block/ segment of
sample FSU h = number of households surveyed in a second-stage stratum of a village/block/ segment of
sample FSU E = total number of enterprises listed in a second-stage stratum of a village/block/ segment of
sample FSU e = number of enterprises surveyed in a second-stage stratum of a village/block/ segment of
sample FSU x, y = observed value of characteristics x, y under estimation X , Y = estimate of population total X, Y for the characteristics x, y
Under the above symbols,
ystmidjk = observed value of the characteristic y for the k-th household in the j-th second stage stratum of the d-th segment (d = 1, 2, 9) of the i-th FSU belonging to the m-th sub-sample for the t-th sub-stratum of s-th stratum; However, for ease of understanding, a few symbols have been suppressed in following paragraphs where they are obvious.

Appendix B
NSS Report No. 525: Unorganised Manufacturing sector in India, 2005-06: Employment, Assets and Borrowings. B - 10
3.2A Formulae for estimation of aggregates for a particular sub-sample and stratum in case of Area Frame: 3.2A.1 Rural:
(a) Estimation formula for a sub-stratum 1 of a stratum: (i) For enterprises selected in j-th second stage stratum:
∑ ∑∑∑= === ⎥
⎥⎦
⎤
⎢⎢⎣
⎡×++=
j
i
e
kjki
ji
jie
kjki
ji
jie
kjkij
ny
eE
iDyeE
yYjijiji
1 12
2
2
11
1
1
19
219 *ˆ
(ii) For all selected enterprises:
∑=j
jYY ˆˆ
(b) Estimation formula for sub-stratum 2 of a stratum:
(i) For enterprises selected in j-th second stage stratum:
∑ ∑∑∑= === ⎥
⎥⎦
⎤
⎢⎢⎣
⎡×++=
j
i
e
kjki
ji
jie
kjki
ji
jie
kjki
ijj
ny
eE
iDyeE
yzn
ZYjijiji
1 12
2
2
11
1
1
19
219 *1ˆ
(ii) For all selected enterprises:
∑=j
jYY ˆˆ
Note: For segment 9, an adjustment may be necessary if E ≠ e for a second-stage stratum due to
casualty at the detailed enquiry stage. In that case, contribution of segment 9 (i.e.∑=
jie
kjkiy
9
19 ) may be
replaced by ∑=
jie
kjki
ji
ji yeL 9
19
9
9 , where Li9j = (number of list frame enterprises of segment 9 with survey
code 1) + (number of list frame enterprises of segment 9 with survey code 3 and reason for casualty codes 3 & 9). Li9j = ei9j if there is no casualty or there is casualty but with reason for casualty code as 1 or 2. (c) Estimation formula for a sub-stratum other than sub-strata 1 & 2 of a stratum:
(i) For enterprises selected in j-th second stage stratum:
∑ ∑∑= == ⎥
⎥⎦
⎤
⎢⎢⎣
⎡×+=
j
i
e
kjki
ji
jie
kjki
ji
ji
ijj
ny
eE
iDyeE
znZY
jiji
1 12
2
2
11
1
121 *1ˆ

Appendix B
NSS Report No. 525: Unorganised Manufacturing sector in India, 2005-06: Employment, Assets and Borrowings. B - 11
(ii) For all selected enterprises:
∑=j
jYY ˆˆ
3.2A.2 Urban:
(a) Estimation formula for a sub-stratum of million plus cities: (i) For enterprises selected in j-th second stage stratum:
∑ ∑∑= == ⎥
⎥⎦
⎤
⎢⎢⎣
⎡×+=
j
i
e
kjki
ji
jie
kjki
ji
ji
ijj
ny
eE
iDyeE
znZY
jiji
1 12
2
2
11
1
121 *1ˆ
(ii) For all selected enterprises:
∑=j
jYY ˆˆ
(b) Estimation formula for a sub-stratum of other strata:
(i) For enterprises selected in j-th second stage stratum:
∑ ∑∑= == ⎥
⎥⎦
⎤
⎢⎢⎣
⎡×+=
j
i
e
kjki
ji
jie
kjki
ji
ji
jj
ny
eE
iDyeE
nNY
jiji
1 12
2
2
11
1
121 *ˆ
(ii) For all selected enterprises:
∑=j
jYY ˆˆ
3.2A.3 Estimate for a stratum:
∑=t
stYsY ˆˆ
3.2A.4 Overall Estimate for Aggregates for Area Frame:
Overall estimate for aggregates for a stratum ( sY ) based on two sub-samples is obtained as:
∑=
=2
1
ˆ21ˆ
msms YY
3.2A.5 Overall Area Frame Estimate of Aggregates at State/UT/all-India level:
The overall estimate Y at the State/ UT/ all-India level is obtained by summing the area frame
estimates ( sY ) of stratum over all strata belonging to the State/ UT/ all-India.

Appendix B
NSS Report No. 525: Unorganised Manufacturing sector in India, 2005-06: Employment, Assets and Borrowings. B - 12
3.2B Estimates from List Frame enterprises in urban sector:
∑′
=′=
L
lly
LLY
1,
where L = (number of list frame enterprises with survey code 1) + (number of list frame
enterprises with survey code 3 and reason for casualty codes 3 & 9 in item 20, block 1, schedule 2.2)
L' = (number of list frame enterprises with survey code 1 in item 19, block 1, schedule 2.2)
Estimate may be generated for any domain e.g. district, State, All-India as well as for any NIC category, Division, Group etc., by restricting L, L' to that particular domain.
If there is no casualty or there is casualty but with reason for casualty code as 1 or 2 in item 20, block 1, schedule 2.2, then L = L'.
3.3 Overall Estimate of Aggregates at State/UT/all-India level in the urban sector:
The overall estimate Y at the State/ UT/ all-India level for urban sector for the schedule 2.2 is obtained by summing the area frame estimates and list frame estimates of aggregates for the State/ UT/ all-India. 3.4 Estimates of Ratios:
Let Y and X be the overall estimate of the aggregates Y and X (sum of area frame and list frame estimates) for two characteristics y and x respectively at the State/ UT/ all-India level.
Then the combined ratio estimate )ˆ(R of the ratio )(XYR = will be obtained as
X
YR ˆ
ˆˆ = .
3.5 Estimates of Error: There is no sampling for the list frame enterprises since it was the census of all units. The variance will comprise only that due to area frame units. The estimated variances of the estimates will be as follows:
3.5.1 For aggregate Y :
∑=s
sYraVYraV )ˆ(ˆ)ˆ(ˆ
where )ˆ(ˆ sYraV are as given below.
3.5.1.1 For strata with PPSWR selection at first stage:
⎥⎦
⎤⎢⎣
⎡−
−= ∑ ∑
=t
st
ist
sti
stist
ststsppswr
nY
zYZ
nnYraV
1
2)ˆˆ(
)1(1)ˆ(ˆ ,

Appendix B
NSS Report No. 525: Unorganised Manufacturing sector in India, 2005-06: Employment, Assets and Borrowings. B - 13
where ∑=j
stijsti YY and
⎥⎥⎦
⎤
⎢⎢⎣
⎡×++= ∑∑∑
===
jstijstijsti e
kjksti
jsti
jstie
kjksti
jsti
jstie
kjkstistij y
eE
stiDyeE
yY219
12
2
2
11
1
1
19
*ˆ
3.5.1.2 For strata with SRSWOR selection at first stage:
( ) ( )∑ −=t
ststssrswor YYYrVa2
21ˆˆ
41ˆˆ ,
where 1stY and 2stY are the estimates for sub-sample 1 and sub-sample 2 respectively for stratum ‘s’ and sub-stratum ‘t’.
3.5.2 For ratio R :
⎥⎦
⎤⎢⎣
⎡ += ∑∑′
′
ss
ss RESMRESM
XRESM )ˆ(ˆ)ˆ(ˆ
)ˆ(1)ˆ(ˆ
2
where s, s' indicate respectively the strata with PPSWR and SRSWOR selection at first stage.
3.5.2.1 For strata with PPSWR selection at first stage:
∑ ∑=
⎥⎦⎤
⎢⎣⎡ −−−
−=
t
st
istststisti
sti
st
ststs
nXRYXRY
zZ
nnRESM
2
1)ˆˆˆ()ˆˆˆ(
)1(1)ˆ(ˆ
where
∑=j
stijsti YY ˆˆ , ∑=j
stijsti XX ˆˆ ,
⎥⎥⎦
⎤
⎢⎢⎣
⎡×++= ∑∑∑
===
jstijstijsti e
kjksti
jsti
jstie
kjksti
jsti
jstie
kjkstistij y
eE
stiDyeE
yY219
12
2
2
11
1
1
19
*ˆ
and
⎥⎥⎦
⎤
⎢⎢⎣
⎡×++= ∑∑∑
===
jstijstijsti e
kjksti
jsti
jstie
kjksti
jsti
jstie
kjkstistij x
eE
stiDxeE
xX219
12
2
2
11
1
1
19
*ˆ
3.5.2.2 For strata with SRSWOR selection at first stage:
( ) ( ) ( )( )∑ ⎥⎦⎤
⎢⎣⎡ −−−−+−= ′′′′′′′′′
ttstststststststss XXYYRXXRYYRESM 2121
221
2221
ˆˆˆˆˆ2ˆˆˆˆˆ41)ˆ(ˆ
where 1ˆ
tsY ′ and 2ˆ
tsY ′ are the estimates for sub-sample 1 and sub-sample 2 respectively for stratum ‘s'’ and sub-stratum ‘t’.

Appendix B
NSS Report No. 525: Unorganised Manufacturing sector in India, 2005-06: Employment, Assets and Borrowings. B - 14
3.6 Estimates of RSE:
( ) ( )100ˆ
ˆˆˆˆ ×=Y
YraVYESR
( ) ( )100ˆ
ˆˆˆˆ ×=
R
RESMRESR
3.7 Multipliers for Area frame enterprises: The formulae for multipliers for a sub-sample and schedule type are given below:
formula for multipliers sch type sector sub-
stratum segment 9 segment 1 segment 2
1 jstmi
jstmi
eL
9
9 jstmi
jstmi
eE
1
1 jstmi
jstmistmi e
ED
2
2* ×
rural
2, 3 jstmi
jstmi
stmistm
st
eL
znZ
9
91××
jstmi
jstmi
stmistmj
st
eE
znZ
1
11××
jstmi
jstmistmi
stmistmj
st
eE
Dzn
Z
2
2*1×××
1, 2 (of EC-98 frame)
jstmi
jstmi
stmistmj
st
eE
znZ
1
11××
jstmi
jstmistmi
stmistmj
st
eE
Dzn
Z
2
2*1×××
2.2
urban 1, 2 (of UFS
frame)
jstmi
jstmi
stmj
st
eE
nN
1
1× jstmi
jstmistmi
stmj
st
eE
DnN
2
2* ××
Note: (i) For estimating any characteristic for any domain not specifically considered in sample
design, indicator variable may be used. (ii) Multipliers have to be computed on the basis of information available in the listing
schedule irrespective of any misclassification observed between the listing schedule and detailed enquiry schedule.
(iii) For estimating number of villages possessing a characteristics, *stmiD = 1 in the relevant
multipliers and there will be only one multiplier for the village.
(iv) Li9j = (number of list frame enterprises of segment 9 with survey code 1) + (number of list frame enterprises of segment 9 with survey code 3 and reason for casualty codes 3 & 9) in i-th FSU and j-th second-stage stratum of m-th sub-sample of t-th sub-stratum belonging to s-th stratum.’
4. Treatment for zero cases, casualty cases etc.: 4.1 While counting the number of FSUs surveyed (nstm ) in a sub-stratum, all the FSUs with survey codes 1 to 6 in schedule 0.0 will be considered. In addition, if no SSU is available in the frame for a particular schedule then also that FSU will be treated as surveyed in respect of that schedule. However, if the SSUs of a particular schedule type are available in the frame of the FSU but none of these could be surveyed then that FSU has to be treated as casualty and it will not be treated as surveyed in respect of that schedule.

Appendix B
NSS Report No. 525: Unorganised Manufacturing sector in India, 2005-06: Employment, Assets and Borrowings. B - 15
4.2 Casualty cases: FSUs with survey code 7 as per schedule 0.0 are treated as casualties. In addition to this, an FSU, although surveyed, may have to be treated as casualty for a particular schedule type and a particular second stage stratum as given in the following para:
4.2.1 FSUs with survey codes 1 and 4 as per schedule 0.0 having number of households in the frame of j-th second stage stratum greater than 0 but number of households surveyed according to data file, considering both segments together, as nil (i.e. Hi1j + Hi2j >0 but hi1j + hi2j =0) will be taken as casualties for j-th second stage stratum. 4.2.2 Similarly, FSUs with survey codes 1 and 4 as per schedule 0.0 having number of enterprises in the frame of j-th second stage stratum greater than 0 but number of enterprises surveyed according to data file, considering all three segments together, as nil (i.e. Ei9j +Ei1j + Ei2j >0 but ei9j + ei1j + ei2j =0) will be taken as casualties for j-th second stage stratum
All the FSUs with survey codes 1 to 6 as per schedule 0.0 minus the number of casualties as identified above will be taken as the number of surveyed FSUs (nstmj ) for that sub-stratum × second stage stratum. 4.2.3 When casualty for j-th second stage stratum occurs for a particular segment but not for the other segment, the FSU will not be treated as casualty but some adjustments in the value of H and E for the other segment will be done as follows:
(i) Suppose for segment 1, Hi1j > 0 but hi1j = 0 while for segment 2, Hi2j > 0 and hi2j > 0. In that case jii HD 2
* × will be replaced by )( 2*
1 jiiji HDH ×+ in the formula for multiplier of segment 2.
(ii) Suppose for segment 1, Hi1j>0 and hi1j > 0 while for segment 2, Hi2j>0 but hi2j=0. In that case jiH 1 will be replaced by )( 2
*1 jiiji HDH ×+ in the formula for multiplier of
segment 1.
Adjustments may be made in the multipliers for schedule 2.2 if similar situation arises for enterprises. However, segment 9 need not be clubbed with segment 1 or segment 2 if segment 9 enterprises are surveyed but no enterprises could be surveyed from segments 1 / 2.
It may be noted that nstmj would be same for segments 1 & 2 of an FSU.
5. Treatment in cases of void second-stage strata/sub-strata /strata/NSS region at FSU or household level
5.1 A sub-stratum may be void because of the casualty of all the FSUs belonging to the sub-stratum. This may occur in one sub-sample or in both the sub-samples. If it relates to only one sub-sample, then estimate for the void sub-stratum may be replaced with the estimate as obtained from the other sub-sample for the same sub-stratum. 5.2 When a sub-stratum is void in both the sub-samples, the following procedure is recommended:
Case(I): Sub-stratum void cases at FSU levels (i.e. all FSUs having survey code 7):

Appendix B
NSS Report No. 525: Unorganised Manufacturing sector in India, 2005-06: Employment, Assets and Borrowings. B - 16
i) If one of the rural sub-strata 3, 4, 5, …, etc. is void then it may be merged with a sub-stratum having the next higher population size class of villages within the same district. Sub-stratum 3 may be merged with sub-stratum 4, sub-stratum 4 with sub-stratum 5 and so on. If last sub-stratum is void, it will be merged with the previous sub-stratum.
ii) If sub-stratum 1 and/or sub-stratum 2 are void, SDRD may be consulted for necessary guidelines
(iii) If an urban sub-stratum is void then it may be merged with the sub-stratum with the other sub-stratum of the same stratum.
iv) If all the sub-strata in a district are void, it may be excluded from the coverage of the survey. The state level estimates will be based on the estimates of districts for which estimates are available and remarks to that effect may be added in appropriate places.
Case (II): Stratum void case at second stage stratum level (i.e. all the FSUs are casualties for a particular second stage stratum):
An FSU may be a casualty for a particular second stage stratum although survey code is not 7. If all the FSUs of a sub-stratum become casualties in this manner for a particular second stage stratum, the sub-stratum will become void. In such cases, sub-strata will be merged with other sub-strata for all the second stage strata as in Case (I) above.
However, if whole district/stratum becomes void in this manner for a particular second stage stratum, adjustment for this type of stratum void case may be done according to the following guidelines. The adjustment will be made involving other strata (within NSS region) of the State/U.T. Suppose A, B, C and D are the four strata in the State/UT/Region and stratum C is void for j-th second stage stratum. If ajY , bjY and djY are the aggregate estimates for the
strata A, B and D respectively, then the estimate cjY for stratum C may be obtained as
⎟⎟⎠
⎞⎜⎜⎝
⎛×
++++
cdba
djbjaj ZZZZYYY ˆˆˆ
where Za, Zb, Zc and Zd are the sizes of strata A, B, C and D
respectively. 5.3 It may be noted that sub-round wise allocations of sample FSUs in 62nd round were not equal for all the sub-rounds. Sub-round wise estimates may not be comparable and hence they may not be attempted.

Appendix C Schedule 2.2

Appendix C
NSS Report No. 525: Unorganised Manufacturing sector in India, 2005-06: Employment, Assets and Borrowings. C - 1
RURAL * CENTRAL *URBAN GOVERNMENT OF INDIA STATE
NATIONAL SAMPLE SURVEY ORGANISATION SOCIO-ECONOMIC SURVEY SIXTY-SECOND ROUND: JULY 2005 – JUNE 2006 SCHEDULE 2.2: MANUFACTURING ENTERPRISES
[0] descriptive identification of sample enterprise 1. state / u.t.: 6. ward /inv. unit / UFS block:
2. district: 7. name of owner:
3. tehsil / town*: 8. name of informant:
4. village name: 9. name and address of the enterprise:
5. serial no. of hamlet:
[1] identification of sample enterprise item no. item code item
no. item code
12. stratum
13. sub-stratum 1. serial number of
sample village/block (area frame) / enterprise (list frame)
14. segment number (1 / 2 / 9)
2. frame used (list-1, area-2) 15. second stage stratum (code)
3. round number 6 2
4. schedule number 0 2 2 16.
for ‘area frame’ units only sample enterprise number (segment 1/2)
/ enterprise number (segment 9)
5. sample (central-1, state-2) 17. informant code
6. sector (rural - 1, urban - 2) 18. response code
7. state – region 19. survey code
8. district
9. sub – round
10. sub – sample (put ‘1’ for list frame)
11. FOD sub-region
20.
reason for casualty (list frame / segment 9 of area
frame)/ substitution of original enterprise (segment
1/2 of area frame)
CODES FOR BLOCK 1
item 17 : informant code : owner/partner – 1, manager – 2, others working in the enterprise – 9 item 18 : response code (to be filled up after filling up the entire schedule): informant : co-operative and capable – 1, co-operative but not capable – 2, busy – 3, reluctant – 4, others – 9 item 19 : survey code: original enterprise surveyed – 1, substitute surveyed – 2, casualty – 3 item 20 : reason for
casualty (list frame and segment 9 of area frame): enterprise: Government/ PSU/ registered under Section 2m(i) or 2m(ii) of Factories Act, 1948/ Bidi and Cigar Workers (Condition of Employment) Act, 1966 and under the coverage of ASI – 1, non-operative/closed during the reference year/ non-traceable – 2, in operation during the reference year but data could not be collected – 3, others(specify) – 9
substitution of original enterprise (segment 1/2 of area frame): informant : busy – 1, not available – 2, non-cooperative – 3, others – 9
* Tick mark (√) may be put in appropriate place.

Appendix C
NSS Report No. 525: Unorganised Manufacturing sector in India, 2005-06: Employment, Assets and Borrowings. C - 2
CODES FOR BLOCK 2
item 207: type of ownership proprietary (male)………………………………… 1 partnership between members not all from the same household… 4 proprietary (female)………………………………. 2 co-operative society……………………………………………… 5 partnership with members of the same household.. 3 limited company (outside public sector)………………………… 6 others………………………………………………………. 9 item 212: general educational level of the working owner not literate……………………… 01 primary…………… 04 diploma/ certificate course….. 08 literate without formal schooling 02 middle……………. 05 graduate…………………….. 10 literate but below primary……… 03 secondary………… 06 postgraduate or above………. 11 higher secondary…. 07 item 213: whether accounts maintained Yes, accounts usually maintained,
and information was collected from books of accounts.. 1 No usable books of accounts maintained……. 3 but information was collected orally…………………... 2
item 215: location of the enterprise within household premises ………………………………… 1
outside household premises: with fixed premises and with permanent structure………….. 2 mobile market …………………………….. 5 with fixed premises and with temporary structure/kiosk/stall 3 with fixed premises but without any structure …………….. 4 without fixed premises (street vendors, etc.) . 6 items 217 and 218: registered/recognised under District Industries Centre as Small Scale Industry (SSI)………….. 01 Silk Board……………………………………. 06 Khadi and Village Industries Commission………………………… 02 Jute Commissioner…………………………… 07 Development Commissioner, handicrafts………………………… 03 municipal corporation, panchayat, local body.. 08 Development Commissioner, handlooms…………………………. 04 Section 85 of Factories Act ………………… 10 Coir Board………………………………………………………….. 05 other (please specify)………………………… 19 items 219 to 222: source/destination agency government …………………………........ 1 private individual/ household ………………. 5 co-operative/ marketing society ……….. ... 2 no specific source agency …........................... 6 private enterprise …………………………. 3 contractor/ middleman ………………….... 4 others..……………………………………….. 9 item 228: any other problem local problems/ harassment……………………… 1 non-recovery of service charges/ fees/ credit …….. 5 competition from larger units …………………… 2 lack of other infrastructure facilities ………………. 9 non-availability of labour/ labour problems…….. 3 fuel not available or available at exorbitant price.. 4 no specific problem ……………………………….. 6 item 230: type of contract working solely for enterprise/contractor…... 1 mainly for customers but also on contract… 3 mainly on contract but also for other customers… 2 items 231 and 232: equipment/ raw materials supplied by self-procured ………………………….…. 1 both ………………………………… 3 supplied by the master unit/contractor ….. 2 items 234 and 235: types of assistance received financial loan (institutional) ……………… 1 marketing ……………………………. 6 financial loan (non-institutional) ………… 2 procurement of raw material………… 7 subsidy……………………………………. 3 others ………………………………... 9 machinery/ equipment……………………. 4 training …………………………………… 5 no assistance received from any source 8

Appendix C
NSS Report No. 525: Unorganised Manufacturing sector in India, 2005-06: Employment, Assets and Borrowings. C - 3
[2] particulars of operation and background information description of major activity during the reference year: 5-digit code as per NIC 2004 201. nature of operation (perennial – 1, seasonal – 2, casual – 3) 202.
number of months (in whole number) operated during the reference year 203. during the reference year 204.
number of hours the enterprise normally worked in a day during the reference month 205.
was the enterprise pursuing mixed activity during reference year? (yes – 1, no – 2) 206. type of ownership (code) 207.
did the working owner (s) undertake any other economic activity during the reference year? (yes – 1, no – 2) 208.
was the present enterprise the major source of annual income of the working owner (s)? (yes – 1, no – 2) 209.
% of annual income of the working owner (s) derived from this enterprise (in whole number) 210.
description of most important other activity
if item 208 is 1 if item 209
is 2 industry section as per NIC 2004 211.
if item 207 is 1 to 4
general educational level of working owner (code) 212. whether accounts maintained (code) 213.
from D D M M Y Y to D D M M Y Ydata of blocks 3 to 7 collected for the period 214. location of the enterprise (code) 215. registered/ recognised under any act/ authority? (yes - 1, no - 2) 216.
217. if item 216 is ‘1’, registered/ recognised under (at most 2 codes in the order of code list) if item 217/218 is 19, please specify the registration agency: 218.
219. source agency for purchase of basic inputs (code) (codes for at most 2 agencies in descending order of purchase value may be given) 220.
221. destination agency for sale of final product/service (code) (codes for at most 2 agencies in descending order of sale value may be given) 222.
non-availability of electricity connection (yes – 1, no – 2) 223. power-cut (yes – 1, no – 2) 224. shortage of capital (yes – 1, no – 2) 225. non-availability of raw materials (yes – 1, no – 2) 226. marketing of product (yes – 1, no – 2) 227.
nature of problems faced, if any, during the reference year
any other problem (code) 228. did the enterprise undertake any work on contract basis? (yes – 1, no – 2) 229.
type of contract (code) 230. equipment supplied by (code) 231. raw materials supplied by (code) 232.
if item 229 is ‘1’
design specified by contractor? (yes –1, no – 2 ) 233. 234. types of assistance received during the last five years (code)
(at most 2 codes may be given in descending order of the importance of assistance) 235. status of the enterprise over the last 3 years (expanding – 1, stagnant – 2, contracting – 3, operated for less than 3 years - 4) 236.
enterprise type during the reference year (OAME-1, NDME-2, DME-3) 237.

Appendix C
NSS Report No. 525: Unorganised Manufacturing sector in India, 2005-06: Employment, Assets and Borrowings. C - 4
[3] principal operating expenses during the reference period (whole number of rupees) manufacturing activity (NIC-2004 codes 01405, 15111 to 37200)
item no. raw materials consumed ASICC code
unit of quantity (code)
quantity (in
whole no.)
value (Rs.)
(1) (2) (3) (4) (5) (6) 301.
302.
303.
304.
305.
306. other raw materials
309. total (items 301 to 306)
trading and other activities*
commodities purchased or items consumed
311. goods incidental to manufacturing
312. other trading items
313. others
319. total (items 311 to 313) * NIC-2004 divisions 45 to 74, 80 to 93
CODES FOR BLOCKS 3 AND 4 col. (4): unit of quantity code no. ………… 01 pair………… 08 kg………….. 02 gram……… 09 tonne………. 03 carat……… 10 metre………. 04 Kwh………. 11 sq. metre…… 05 no. in '00…. 12 cu. metre…… 06 no. in '000… 13 litre………… 07 others 19 1 cft = 0.0283 cubic meter

Appendix C
NSS Report No. 525: Unorganised Manufacturing sector in India, 2005-06: Employment, Assets and Borrowings. C - 5
[3.1] other operating expenses during the reference period: all activities (The overall expenses of the enterprise will be recorded here. If some of the items have already been covered under specific activities in block 3, they should not be reported here again.) itemno. item value
(Rs.) (1) (2) (3)
321. electricity charges 322. fuel and lubricant 323. raw materials consumed for own construction of building, furniture and fixtures (please
check consistency with item 442) 324. building 325. plant and machinery 326. transport equipment 327. software and hardware 328.
minor repair and maintenance of (major repairs will not appear here)
tools and other fixed assets 331. rent payable on fixed assets (other than land and building)
332. service charges for work done by other concerns (contract, sub-contract, legal, audit, advertising and other accounting services, warehousing expenses, commission expenses, etc.)
333. travelling, freight and cartage (transport) expenses 334. communication expenses (telephone, telegram, fax, postal, courier, e-mail, etc.) 335. consumable stores, packing materials, etc. 336. paper, printing and stationery expenses 337. license fees, cess charged by local bodies, other local rates (building tax, etc.)
(excise duties and other indirect taxes are not to be included) 338. royalties and insurance charges payable 341. other expenses (puja, customer entertainment, etc.) 349. total (items 321 to 341)
[4] principal receipts during the reference period (Rs. in whole number) manufacturing activity (NIC-2004 codes 01405, 15111 to 37200)
item no.
products and by-products manufactured
ASICC code
unit of quantity (code)
quantity (in whole
no.)
value* (Rs.)
(1) (2) (3) (4) (5) (6) 401. 402. 403. 404. 405. 406. other products and by-products 409. total (items 401 to 406) 411. opening stock of semi-finished goods 412. closing stock of semi-finished goods
413. changes in stock of semi-finished goods (item 412 − item 411) [put (−) sign in case of negative value]
419. total (item 409+item 413) *ex-factory or sale value (items manufactured and sold) / ex-factory value (items manufactured but not sold)

Appendix C
NSS Report No. 525: Unorganised Manufacturing sector in India, 2005-06: Employment, Assets and Borrowings. C - 6
[4] principal receipts during the reference period (Rs. in whole number) (continued)trading and other activities* item no. item value
(Rs.) (1) (2) (6)
trading
421. receipts from sale of goods incidental to manufacturing and other trading (please check consistency with items 311 and 312)
422. opening stock of trading goods
423. closing stock of trading goods
424. change in stock of trading goods (item 423 – item 422) [put (-) sign in case of negative value]
429. total (item 421+ item 424) other activities
431. receipts from other activities
439. total (item 429 + item 431) * NIC-2004 divisions 45 to 74, 80 to 93 Note: Cols. (3) to (5) are not applicable for this sub-block. [4.1] other receipts during the reference period : all activities (Rs. in whole number) (The overall receipts of the enterprise will be recorded here. If some items have already been covered under specific activities in block 4, they should not be reported here again.)
item no. item value
(Rs.) (1) (2) (3)
441. receipts from services provided to others including commission charges
442. value of own construction of building, furniture and fixtures including own and hired labour charges (please check consistency with item 323)
443. value of consumption of goods/services produced or traded for own use of the owner or employees (at owner’s cost)
444. rent receivable on fixed assets (other than land and building) 445. funding / donations received (including recurring govt. grants and subsidies) 446. other receipts (including royalties receivable) 449. total (items 441 to 446)
[5] calculation of gross value added for the reference period (Rs. in whole number) item no. item value
(Rs.) (1) (2) (3)
501. total operating expenses: [items (309+319+349)] 502. distributive expenses, if any@ 503. total receipts: [items (419+439+449) ]
509. gross value added (item 503 - item 502 − item 501) [put (−) sign in case of negative value]#
# in case of negative value added give reasons in blocks 11 /12 after deep probing. @ if value of receipts are reported at ex-factory value, distributive expenses will be zero.
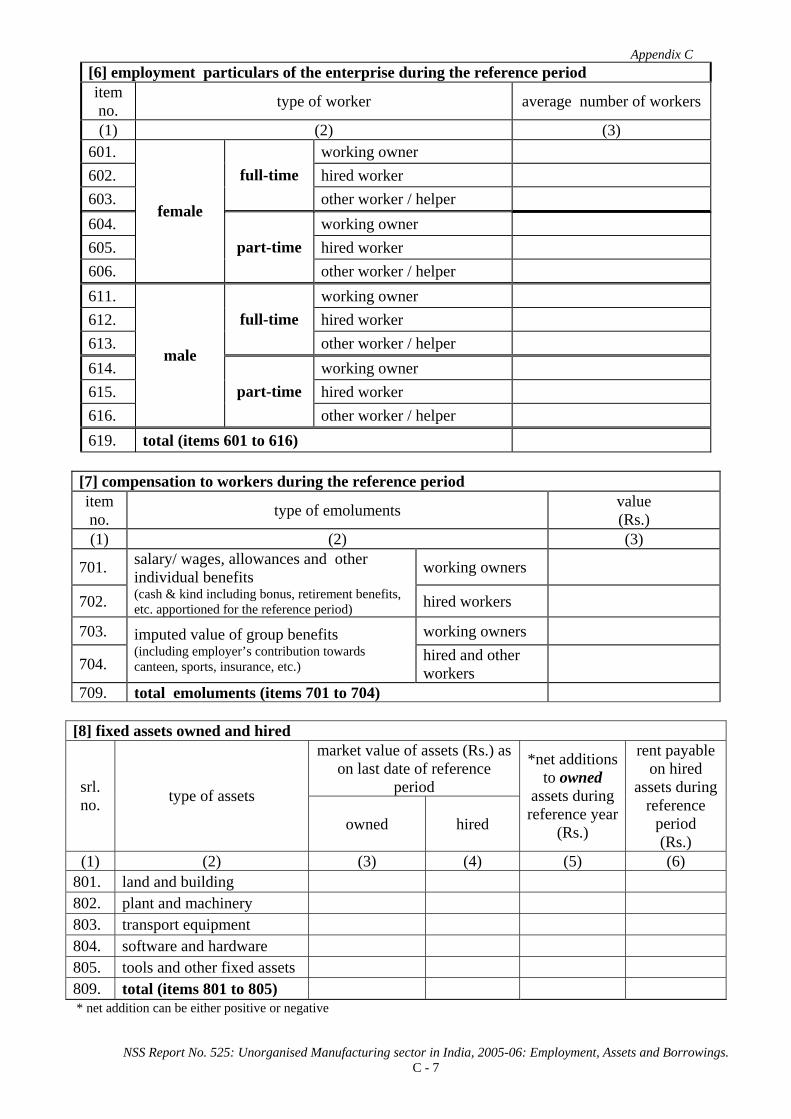
Appendix C
NSS Report No. 525: Unorganised Manufacturing sector in India, 2005-06: Employment, Assets and Borrowings. C - 7
[6] employment particulars of the enterprise during the reference period item no. type of worker average number of workers
(1) (2) (3) 601. working owner 602. hired worker 603.
full-time other worker / helper
604. working owner 605. hired worker 606.
female
part-time other worker / helper
611. working owner 612. hired worker 613.
full-time other worker / helper
614. working owner 615. hired worker 616.
male
part-time other worker / helper
619. total (items 601 to 616) [7] compensation to workers during the reference period item no. type of emoluments value
(Rs.) (1) (2) (3)
701. working owners
702.
salary/ wages, allowances and other individual benefits (cash & kind including bonus, retirement benefits, etc. apportioned for the reference period) hired workers
703. working owners
704.
imputed value of group benefits (including employer’s contribution towards canteen, sports, insurance, etc.)
hired and other workers
709. total emoluments (items 701 to 704) [8] fixed assets owned and hired
market value of assets (Rs.) as on last date of reference
period srl. no. type of assets
owned hired
*net additions to owned
assets during reference year
(Rs.)
rent payable on hired
assets during reference
period (Rs.)
(1) (2) (3) (4) (5) (6) 801. land and building 802. plant and machinery 803. transport equipment 804. software and hardware 805. tools and other fixed assets 809. total (items 801 to 805) * net addition can be either positive or negative

Appendix C
NSS Report No. 525: Unorganised Manufacturing sector in India, 2005-06: Employment, Assets and Borrowings. C - 8
[9] loan outstanding as on last date of the reference period (only loans taken for enterprise to be considered)
srl. no. source of loan amount (Rs.)
interest payable during the
reference period (Rs.)
(1) (2) (3) (4)
901. central and state level term lending institutions, government (central, state, local bodies), banks & societies (public sector, commercial, co-operative)
902. other institutional agencies
903. moneylenders
904. business partner(s)
905. suppliers / contractors
906. friends and relatives
907. others
909. total (901 to 907)
[10] particulars of field operations srl. no. particulars investigator/
senior investigator senior investigator/
superintendent superintendent/
senior superintendent (1) (2) (3) (4) (5) 1 (i) name in block letters (ii) code 2 total time taken to canvass
Sch. 2.2 (minutes)
3 date(s) of D D M M Y Y D D M M Y Y D D M M Y Y (i) survey / inspection (ii) receipt (iii) scrutiny (iv) despatch 4 signature
[11] remarks by investigator/ senior investigator
[12] comments by supervisory officer(s)

1
List of NSS Reports available for sale
Sl. Report Title of the Report Price (in Rs.) No. No. Hard
Copy Floppy(s)/
CD(s) (1) (2) (3) (4) (5) Unorganised Trade, NSS 46th Round 1* 403 Small Trading Units in India 150 380 2 403/1 State Level results on small trading units in India: Vol.-I 250 710 3* 403/1 State Level results on small trading units in India: Vol.-II 250 710 Land & livestock holdings and Debt & Investment,
NSS 48th Round
4* 407 Operational land holdings in India, 1991-92: Salient features 250 710
5 408 Live-stock and Agricultural implements in House-hold operational holdings, 1991-92
150 380
6 414 Seasonal variation in the operation of land holdings in India, 1991-92 250 710 7 419 Household Assets and Liabilities as on 30.6.91 250 1140 8 420 Indebtedness of Rural Households as on 30.6.1991 250 1370 9 421 Indebtedness of Urban Households as on 30.6.1991 250 1370 10 431(Part I) Household Borrowings and Repayments during 1.7.91 to 30.6.92 250 1140 11 431(Part-II) -do- 250 1140 12 432 (Part-I) Households Assets and Indebtedness of Social Groups as on 30.6.91 250 1140 13 432 (Part-II) -do- 250 710 14 437 Household capital expenditure during 1.7.91 to 30.6.92. 250 1370 Housing Conditions and Migration with special emphasis on slum
dwellers, NSS 49th round
15 417 Slums in India 150 380 16 429 Housing Conditions in India 150 380 17 430 Migration in India 250 710 Employment & Unemployment, NSS 50th Round 18 406 Key Results on Employment & Unemployment 150 610 19 409 Employment & Unemployment in India, 1993-94 250 710 20 411 Employment & Unemployment situation in cities and Towns in India,
1993-94 150 380
21 412 Economic activities and school attendance by children in India, 1993-94 150 380
22* 416 Participation of Indian women in household work and other specified
activities, 1993-94 150 380
23 418 Unemployed in India, 1993-94 : Salient Features 150 380 24 425 Employment & Unemployment situation among social groups in India,
1993-94 250 480
25 438 Employment & Unemployment situation among religious groups in
India, 1993-94 150 610
Consumer Expenditure, NSS 50th Round 26 401 Key results on Household Consumer Expenditure, 1993-94 150 380 27 402 Level and Pattern of Consumer Expenditure 250 710 28* 404 Consumption of some important commodities in India 250 710 29 405 Nutritional intake in India 250 710 30 410/1 Dwellings in India 250 710 31 410/2 Energy used by Indian households 150 380 32 413 Sources of household income in India, 1993-94 150 380 33 415 Reported adequacy of food intake in India, 1993-94 150 380 34 422 Differences in level of consumption among socio-economic groups 150 380 35 423 IRDP assistance and participation in Public Works, 1993-94 150 380 36 426 Use of durable goods by Indian households, 1993-94 150 380 37 424 Ownership of Live-Stock, cultivation of selected crops and consumption
levels, 1993-94 150 610
38 427 Consumption of tobacco in India, 1993-94 150 610 39 428 Wages in kind, Exchanges of Gifts and Expenditure on Ceremonies and
Insurance in India, 1993-94 150 610
* The hard copies are out of stock. However, soft copies are available. Continued

2
List of NSS Reports available for sale(contd.)
Sl. Report Title of the Report Price (in Rs.) No. No. Hard
Copy Floppy(s)/
CD(s) (1) (2) (3) (4) (5) Consumer Expenditure and Unorganised Manufacture,
NSS 51st Round
40 433 Unorganised Manufacturing Sector in India Its Size, Employment and Some Key Estimates.
250 710
41 434 Unorganised Manufacturing Enterprises in India: Salient Features 250 710 42 435 Assets and Borrowings of the Unorganised Manufacturing Enterprises in
India 150 380
43 436 Household Consumer Expenditure and Employment Situation in India, 1994-95
150 610
Consumer Expenditure, NSS 52nd Round 44 440 Household Consumer Expenditure and Employment Situation in India,
1995-96 150 610
Education, NSS 52nd Round 45 439 Attending an Educational Institution in India: Its level, nature and cost 250 1140 Health, NSS 52nd Round 46* 441 Morbidity and Treatment of ailments 250 1140 47 445 Maternal and Child Health Care in India 150 1270 Aged in India, NSS 52nd Round 48 446 The Aged in India, A Socio-Economic Profile, 1995-96 150 380 Consumer Expenditure, NSS 53rd Round 49 442 Household Consumer Expenditure and Employment Situation in India,
1997 150 610
Unorganised Trade, NSS 53rd Round 50 443 Small Trading units in India and their Basic Characteristics: 1997, Vol. I 250 710 51 444 Small Trading units in India and their Basic Characteristics: 1997, Vol. II 250 710 Consumer Expenditure, Common Property Resources, Sanitation &
Hygiene, Services, NSS 54th Round
52 448 Household Consumer Expenditure and Employment Situation in India 150 610 53 449 Drinking water, sanitation and hygiene in India 250 1140 54 450 Travel and Use of Mass Media and Financial Services by Indian
Households 150 610
55 451 Cultivation Practices in India 250 1370 56 452 Common Property Resources 250 1370 Choice of Reference Period for Consumption Data,
NSS 51st, 52nd, 53rd & 54th Round
57 447 Choice of Reference Period for Consumption Data 150 1700 Consumer Expenditure, NSS 55th Round
(July’99 - June 2000)
58 453 Household Consumer Expenditure in India (July – December 1999) - Key Results
150 610
59 454 Household Consumer Expenditure in India, 1999–2000 - Key Results 150 610 60* 457 Level and Pattern of Consumer Expenditure in India, 1999 - 2000 250 1520 61 461 Consumption of some important Commodities in India, 1999-2000 250 1370 62 463 Sources of household income in India, 1999-2000 150 380 63 464 Energy Used by Indian Households, 1999-2000 150 610 64 466 Reported Adequacy of Food Intake in India, 1999 - 2000 150 610 65 467 IRDP Assistance and Participation in Public Works: 1999-2000 150 610 66 471 Nutritional Intake in India, 1999-2000 250 710 67 472 Differences in the level of consumption among socio economic groups,
1999-2000 250 480
68 473 Literacy and Levels of Education in India, 1999 - 2000 250 610 69 474 Sources of household consumption in India, 1999 - 2000 250 710
* The hard copies are out of stock. However, soft copies are available. Continued

3
List of NSS Reports available for sale (contd.)
Sl. Report Title of the Report Price (in Rs.) No. No. Hard
Copy Floppy(s)/
CD(s) (1) (2) (3) (4) (5) Employment & Unemployment, NSS 55th Round
(July’99 - June 2000)
70 455 Employment and Unemployment in India, 1999-2000 - Key Results 150 610 71 458 (Part-I) Employment and Unemployment Situation in India, 1999 - 2000 250 750 72 458(Part-II) Employment and Unemployment Situation in India, 1999 - 2000 250 1370 73 460 Non agricultural workers in Informal Sector based on Employment
and Unemployment Survey, 1999-2000 150 610
74 462 Employment and Unemployment situation in Cities and Towns of India, 1999-2000
150 610
75 465 Participation of Indian Women in Household work and other specified activities, 1999-2000
150 610
76 468 Employment and Unemployment among religious groups in India, 1999-2000
150 610
77 469 Employment and Unemployment among social groups in India, 1999-2000
250 2950
78 470 Migration in India, 1999-2000 250 1140 Non-agricultural Enterprises in Informal Sector 1999-2000, NSS
55th Round (July’99 - June 2000)
79* 456 Non-agricultural Enterprises in the Informal Sector in India, 1999-2000 - Key Results
150 610
80 459 Informal Sector in India, 1999 - 2000 - Salient Features 250 1600 Unorganised Manufacturing,
NSS 56th Round (July 2000 - June 2001)
81 477 Unorganised Manufacturing Sector in India 2000-2001 - Key Results 250 710 82 478 Unorganised Manufacturing Sector in India 2000-2001 -Characteristics
of Enterprises 250 1370
83 479 Unorganised Manufacturing Sector in India, 2000 – 2001: Employment, Assets and Borrowings
250 1370
84 480 Unorganised Manufacturing Sector in India, 2000 – 2001: Input, Output and Value added
250 1370
Consumer Expenditure, NSS 56th Round (July 2000 - June 2001)
85 476 Household Consumer Expenditure and Employment - Unemployment Situation in India, 2000 - 2001
150 1040
Pilot Survey on Suitability of Reference Period for Measuring Household Consumption
86 475 Results of a Pilot Survey on Suitability of Different Reference Periods for Measuring Household Consumption
150 610
Unorganised Service Sector, NSS 57th Round (July 2001 - June 2002)
87 482 Unorganised Service Sector in India 2001 - 02 Salient Features 250 1925 88 483 Unorganised Service Sector in India 2001 - 02 Characteristics of
Enterprises 250 1370
Consumer Expenditure, NSS 57th Round (July 2001 - June 2002)
89 481 Household Consumer Expenditure and Employment - Unemployment Situation in India, 2001 - 2002
250 2680
Disability, NSS 58th Round (July 2002 - December 2002)
90 485 Disabled Persons in India, July-December 2002 250 7080 Consumer Expenditure,
NSS 58th Round (July 2002 - December 2002)
91 484 Household Consumer Expenditure and Employment - Unemployment Situation in India, 2002 - 2003
150 2380
* The hard copies are out of stock. However, soft copies are available.
Continued

4
List of NSS Reports available for sale (contd.)
Sl. Report Title of the Report Price (in Rs.) No. No. Hard
Copy Floppy(s)/
CD(s) (1) (2) (3) (4) (5) Village facilities,
NSS 58th Round (July 2002 - December 2002)
92 487 Report on village facilities, July-December 2002 150 980 Urban Slums, NSS 58th Round
(July 2002 - December 2002)
93 486 Condition of Urban Slums, 2002: Salient Features 250 2080 Housing Condition,
NSS 58th Round (July 2002 - December 2002)
94 488 Housing Condition in India, 2002: Housing stock and constructions 250 9280 95 489 Housing Condition in India, 2002: Household Amenities and Other
Characteristics 250 9220
Consumer Expenditure, NSS 59th Round (January - December 2003)
96 490 Household Consumer Expenditure and Employment - Unemployment Situation in India
150 1580
Situation Assessment Survey of Farmers, NSS 59th Round (January - December 2003)
97 498 Indebtedness of Farmer Households 150 1380 98 499 Access to Modern Technology for Farming, 2003 250 1680 99 496 Some Aspects of Farming, 2003 250 2680 100 495 Consumption Expenditure of Farmer Households, 2003 250 2140 101 497 Income, Expenditure and Productive Assets of Farmer Households, 2003 250 3480 Land & livestock holdings and Debt & Investment,
NSS 59th Round (January - December 2003)
102 491 Household Ownership Holdings in India, 2003 250 3680 103 492 Some Aspects of Operational Land Holdings in India, 2002-03 250 5080 104 493 Livestock Ownership Across Operational Land Holding Classes in India,
2002-03 150 1580
105 494 Seasonal Variation in the Operational Land Holdings in India, 2002-03 250 2080 106 500 Household Assets and Liabilities in India as on 30.06.2002 250 4880 107 501 Household Indebtedness in India as on 30.06.2002 250 6000 108 502 Household Borrowings and Repayments in India during 1.7.2002 to
30.6.2003 250 4750
109 503 Household Assets Holdings, Indebtedness, Current Borrowings and Repayments of Social Groups in India as on 30.06.2002
250 3880
110 504 Household Capital Expenditure in India during 1.7.2002 to 30.6.2003 250 7280 Employment & Unemployment,
NSS 60th Round (January - June 2004)
111 506 Employment and Unemployment Situation in India, January - June 2004 250 3580 Consumer Expenditure,
NSS 60th Round (January - June 2004)
112 505 Household Consumer Expenditure in India, January - June 2004 150 2580 Health, NSS 60th Round
(January - June 2004)
113 507 Morbidity, Health Care and the Condition of the Aged 250 4480 Consumer Expenditure, NSS 61st Round
(July 2004 - June 2005)
114 508 Level and Pattern of Consumer Expenditure, 2004-05 250 5080 115 509 Vol. I Household Consumption of Various Goods and Services in India,
2004-05 Vol. I 250 4480
116 509 Vol. II Household Consumption of Various Goods and Services in India, 2004-05 Vol. II
250 4080
* The hard copies are out of stock. However, soft copies are available.
Continued

5
List of NSS Reports available for sale
Sl. Report Title of the Report Price (in Rs.) No. No. Hard
Copy Floppy(s)/
CD(s) (1) (2) (3) (4) (5) Consumer Expenditure, NSS 61st Round
(July 2004 - June 2005)
117 510 Vol. I Public Distribution System and Other Sources of Household Consumption, 2004-05 Vol. I
250 3880
118 510 Vol. II Public Distribution System and Other Sources of Household Consumption, 2004-05 Vol. II
250 3680
119 511 Energy Sources of Indian Households for Cooking and Lighting, 2004-05 250 2480 120 512 Perceived Adequacy of Food Consumption in Indian Households 2004-
2005 150 1780
121 513 Nutritional intake in India, 2004-2005 250 3680 122 514 Household Consumer Expenditure among Socio-Economic Groups: 2004
- 2005 250 2880
Employment & Unemployment, NSS 61st Round (July 2004 - June 2005)
123 515 (Part-I) Employment and Unemployment Situation in India, 2004-05 (Part-I) 250 4680 124 515 (Part-II) Employment and Unemployment Situation in India, 2004-05 (Part-II) 250 4680 125 516 Employment and Unemployment Situation Among Social Groups in India,
2004-05 250 3680
126 517 Status of Education and Vocational Training in India 2004-2005 250 2680 127 518 Participation of Women in Specified Activities along with Domestic
Duties 150 1380
128 519(Part-I) Informal Sector and Conditions of Employment in India, 2004-05(Part-I) 250 3880 129 519(Part-II) Informal Sector and Conditions of Employment in India, 2004-05(Part-II) 250 4480 130 520 Employment and Unemployment Situation in Cities and Towns in India,
2004-2005 150 1570
131 521 Employment and Unemployment Situation among Major Religious Groups in India, 2004-05
250 2480
Employment & Unemployment, NSS 62nd Round (July 2005 - June 2006)
132 522 Employment and Unemployment Situation in India, 2005-06 250 4480 Unorganised Manufacturing Enterprises, NSS 62nd Round
(July 2005 - June 2006)
133 524 Operational Characteristics of Unorganised Manufacturing Enterprises in India, 2005-06
250 4880
134 525 Unorganised Manufacturing Sector in India, 2005-06 – Employment, Assets and Borrowings
250 2880
* The hard copies are out of stock. However, soft copies are available.
Copies are available with the Deputy Director General, SDRD, NSSO, 164, Gopal Lal Tagore Road, Kolkata-700 108 on payment basis through Demand Draft drawn in favour of “Pay & Accounts Officer, Ministry of Statistics & P.I., Kolkata”. Postal Charges will be Rs. 85/- by Speed Post and Rs. 30/- by Regd. Parcel for single copy within India.