employment and manufacturing exports in indonesia: an input-output
TRANSCRIPT

Employment and Manufacturing Exports in Indonesia: An Input-Output Analysis
William E. James Chief, Research Division, ICSEAD
Natsuki Fujita Professor, University of Tokyo
Working Paper Series Vol. 2000-06 May 2000
The views expressed in this publication are those of the author(s) and
do not necessarily reflect those of the Institute.
No part of this article may be used reproduced in any manner
whatsoever without written permission except in the case of brief
quotations embodied in articles and reviews. For information, please
write to the Centre.
The International Centre for the Study of East Asian Development, Kitakyushu

Employment and Manufacturing Exports in Indonesia: An Input-Output Analysis
William E. James and Natsuki Fujita∗
Abstract Manufactured exports have responded positively to trade reforms in Indonesia over the period of study (1985-95). Manufactured exports, in turn, have generated additional employment both directly and indirectly through inter-industrial linkages. In this paper we estimate the employment effects of manufactured exports in two sub-periods, 1985-90 and 1990-95, using the newly available 1995 input-output (I-O) table and the I-O tables from 1990 and 1985. In the latter period, despite continued rapid growth of production and exports, employment creation is far less robust than in the period of 1985-90. Although light industrial exports continued to expand, they did not generate as much incremental employment as in the past. Moreover, the distribution of employment effects changed dramatically between the two periods. In the former period, employment creation through manufactured exports was greatest in manufacturing but was also quite significant in primary and tertiary industries. However, in the latter period, primary employment creation was marginal and the largest gains were in services rather than in manufacturing. And in some light industrial sectors, particularly wood, it appears that slackened export growth led, via backward linkages, to reduced employment in the primary wood sector in the latter period. JEL Code F16, C67
∗ The views expressed are those of the authors and not necessarily of the institutions with which they are affiliated. Any errors are the responsibility of the authors.

1
Employment and Manufacturing Exports in Indonesia: An Input-Output Analysis
William E. James and Natsuki Fujita Introduction Prior to the economic crisis that began in late 1997 and plunged the country into
turmoil in 1998, the Indonesian economy had achieved an enviable record of economic
growth and poverty alleviation. After almost two years of economic contraction, the
economy began to expand in the latter half of 1999 and the recovery appears to be
gathering momentum in early 2000. However, the severe contraction and its adverse
social impact together with the revival of populism have given rise to sentiments favoring
protection and a return to inward-looking development strategies. The slow progress in
implementing reforms under the IMF restructuring package is evidently the result of
conflicting views within the new government of President Wahid. The recent sacking of
ministers and revamp of the cabinet indicates the problems are serious indeed.
In this context, it is important to accurately assess the record of the past,
particularly regarding the period of deregulation and trade reform that began in the mid-
1980s and continued until the crisis broke out in 1997. One important measure of the
economic success of the reforms is the creation of employment and the important role the
expansion of manufactured exports played in this achievement.
In this paper we re-examine changes in the structure of employment and
decompose employment growth in Indonesia between 1985 and 1995. The most recent
input-output table is for 1995 and enables us to compare changes that occurred between
1985-1990 and 1990-1995. It will be of interest to learn if the impressive record of
employment creation recorded during the period 1985-1990 continued in the latter

2
period.1 Trade liberalization, which began in earnest in 1987 (Fane and Condon 1996)
played a key role in enabling the expansion of labor-intensive manufacturing and exports
played a key role in this growth. We use updated estimates of trade reform up to 1995 to
examine this issue.
Trade Reform in Indonesia
The process of trade reform has been uneven in Indonesia, with a distinct
slowdown of reform between 1991-1994 compared with 1987-1991. For example, the
World Bank (1995) reported that the simple arithmetic average tariff plus surcharge was
20 per cent in 1990 and 19.5 per cent in 1994.2 Using import weights, the average tariff
actually increased from 11 per cent in 1991 to 12.5 per cent in 1994. Non-tariff barriers
(NTBs) were estimated by the World Bank (1995) to cover 31.1 per cent of non-oil
manufacturing in 1991 and 30.6 per cent in 1994. 3 Indonesia’s participation in the
successful Uruguay Round negotiations did not signal that significant trade reforms
would follow. This is because Indonesia’s market access commitment was limited to
binding substantially all tariffs.4 Nevertheless, major trade reforms were unilaterally
adopted in 1995. The May 1995 trade liberalization lowered tariff and non-tariff barriers,
but took place too late to really have much impact on production, employment or trade in
that year.
Over the period as a whole, trade reforms are estimated to have reduced the
1 Fujita and James (1997) estimate that light industrial exports induced employment of 3.1 million workers in 1990 up from 1.1 million in 1985. 2 Prior to reforms in 1985, the simple average tariff was 37 per cent, the import weighted tariff was 22 per cent and the production weighted tariff (1987 production weights) was 29 per cent (World Bank 1995). 3 In 1986, non-tariff barriers covered an estimated 46 per cent of non-oil manufacturing. The World Bank also reports production weighted average tariffs as falling from 15 per cent in 1991 to 10.4 per cent in 1994. These estimates, however, use 1987 production weights and may be quite misleading. Fane and Condon (1996) provide estimates using 1990 production weights. 4 The bound rate for over 95% of Indonesia’s 9000 plus tariff lines was set at 40%.

3
nominal rate of protection in non-oil manufacturing from 21 per cent in 1987 to 11 per
cent in 1990 and, further, to 6 per cent in 1995. The effective rate of protection fell from
80 per cent in 1987 to 35 per cent in 1990 and, further, to 25 per cent in 1995.5 Moreover,
industries deemed to be export-competing were given a more level playing field with
import-competing industries during this period of trade reform. Effective protection (or
assistance) rose from –28 per cent in 1987 to –21 per cent in 1995 for export-competing
sectors and fell from 46 per cent in 1987 to 19 per cent in 1995 for import-competing
sectors. 6 The standard deviation of nominal and effective rates of protection in
manufacturing was reduced greatly by these reforms (Fane and Condon 1996). The
reduced anti-trade bias in the industrial policy regime fostered rapid growth in exports
from non-oil manufacturing, with labor-intensive sectors such as textiles, apparel,
footwear, wood products and miscellaneous manufactures all growing impressively.
Employment and Manufactured Exports
The composition of trade has certainly changed over the period of study. If one
takes 1985 as the pre-trade reform year, the changes in the composition of exports
between that year compared with 1990 and 1995 should be instructive of the impact of
trade liberalization on export performance. In order to maintain consistency with the
input-output table, we have reported trade composition using the ISIC classification
(table 1).7 It is clear that manufactured exports continued to expand rapidly between
1990-95 and that the composition of overall exports reflects this expansion. However,
5 The figures for 1987 and 1990 are from Fane and Phillips (1991) and Fane and Condon (1995). The figures for 1995 are estimated using data reported in Fane and Condon (1996). 6 These figures are derived from Fane and Condon (1996) 7 The industries listed in table 1 do not match up perfectly with those in the I-O tables (see appendix 1), but the differences are minor using the industrial classification.

4
the relative importance of exports of heavy and chemical industries had increased by
1995. Exports of machinery grew more than 10-fold in the period of 1990-95.8
Within light industries, wood products (excluding furniture) expanded more
slowly after 1990, so that the share in total exports actually fell between 1990 and 1995.
Textiles, apparel, footwear, paper, and miscellaneous or other manufactures continued to
grow at a higher than average rate for exports as a whole. Hence, the share of light
industries (wood excluded) in merchandise exports expanded from 3.4 per cent in 1985 to
13.0 per cent in 1990 and, further, to 18.2 per cent in 1995.
Methodology
In the framework of the input-output (I-O) model, the following balance equation
can be derived:
X = Ad X + E + Fd (1)
where X, Ad , E, and Fd denote an output vector, a domestic input coefficient matrix, a
vector of exports, and a domestic final demand vector, respectively. Then, assuming X is
an endogenous variable, the following solution may be derived:
X = Rd (Fd + E) (2)
where Rd = (I – Ad ) is a domestic Leontief inverse matrix (where (I-Ad ) denotes the
inversion of the domestic input coefficient matrix). This method allows us to take into
account variations in the import content of intermediate and final demand. It is expected
that exports of light industries use a higher proportion of imported intermediate inputs
8 It is likely that exports of electrical and non-electrical machinery expanded with the increase in multinational companies’ activity in these sectors and that the expansion was related to the relative abundance of unskilled labor rather than growing comparative advantage in capital- or skill-intensive activities in Indonesia. Ramstetter (1999) provides some evidence regarding the importance of factor intensities in manufacturing exports in this regard.

5
than do manufactured goods for the domestic market, particularly after 1985, when a duty
drawback (exemption) scheme was adopted for exporters.9
A vector of employment is decomposed as follows:
W = LX = LRd Fd + LRd E (3)
where W is a vector of employment and L is a diagonal matrix of employment
coefficients. The second term on the right side of (3) captures the effects on employment
of exports. Therefore, the employment created by manufactured exports. Wem , is:
Wem = LRd Em (4)
where Em = (0,..,0, e1 , .., en ,0,..0)’ denotes a vector of manufactured exports.10
Estimates of Employment Creation The method outlined in the previous section was applied using I-O tables for 1985,
1990 and 1995 (BPS 1990, BPS 1994, and BPS 1998). The published employment tables
(BPS 1990, table 8, BPS 1994, vol. 2, table 9 and BPS 1998, vol. 2, table 9) were drawn
upon to estimate the employment induced by exports in each of the three years. The I-O
tables are of the “competitive import type” using current prices. The computation was
accomplished using the 66-sector classification (see appendix 1) and the results were
aggregated into five sectors and total employment (see table 2).
Estimates of employment induced by all manufactured exports (food processing,
light industries, heavy and chemical industries)11 are shown in terms of the number of
9 The import content for textiles, apparel, footwear and miscellaneous manufactures is likely to be higher than for wood products, however. 10 The total employment induced by exports is composed of employment induced by primary and manufactured exports. Employment may be induced directly or indirectly. For example, an exported manufactured good may require intermediate inputs produced by domestic manufacturers, as well as by primary and tertiary (service sector) producers. Thus, employment may be generated directly or indirectly through inter-industrial linkages. 11 Petroleum refineries are excluded from manufacturing and are included in the primary sector. See appendix 1.

6
employees and the per cent of total employment induced (table 2). Similarly, estimates
of employment induced by primary exports (agriculture, forestry, fisheries, mining, crude
oil & natural gas and petroleum refineries) are provided (table 3).
1985-90: Rapid Expansion in Employment
In 1985 manufactured exports induced employment of an estimated 1.71 million
Indonesians (2.7 per cent of the employed labor force of 62.5 million).12 In contrast,
primary exports induced employment for an estimated 1.82 million Indonesians or 2.9 per
cent of the workforce. Between 1985 and 1990 employment induced by manufactured
exports rose to an estimated 4.84 million (table 2), equivalent to 6.4 per cent of the total
employed workforce of 75.9 million. In contrast, employment induced by primary
exports fell to an estimated 1.20 million in 1990 (table 3) or just 1.6 per cent of the
workforce. This decline was associated with a large expansion of exports in wood and
food processing industries between 1985 and 1990 (table 1).13
The amount of primary employment induced indirectly by manufactured exports
increased by about 0.87 million between 1985 and 1990. This was much greater than the
direct loss of employment in the primary sector from the decline in primary exports
during the period (compare table 2, row 1 columns 1 and 2 with the same in table 3).
Light industrial exports account for a fair portion of the increment in primary
employment induced by manufactured exports (see table 4 row 1, columns 1 and 2).
Employment in the primary sector created by backward linkages from manufactured
exports is disaggregated (table 5). Between 1985 and 1990, there was a large increase in
12 Employed labor force estimates are from Asian Development Bank (ADB, 1999). 13 Caution should be used in interpreting the number of primary sector jobs induced by sectors such as the wood processing industry. In the absence of the processing factories, exports of raw material (i.e., logs and sawn timber) are likely to have been much larger.

7
primary sector employment induced by manufactured exports in most sub-sectors,
whether in agriculture, forestry, fisheries, mining or petroleum. The largest increment is
in wood with a gain of 0.18 million jobs. Backward linkages from the plywood and
wood furniture exports account for the expansion of employment in this primary sector.
Oil palm employment (induced by exports of processed palm cooking oil) also increased
by a substantial amount (about 0.06 million).
Between 1985 and 1990 the estimated employment created by manufactured
exports rose at an annual compound growth rate of 23.16 per cent and accounted for over
23 per cent of incremental employment. Of the increment in employment induced by
manufactured exports between 1985 and 1990, 60 per cent was induced in the
manufacturing sector. Over 47 per cent of the total increment in employment is estimated
to have been created in light industries. Much of this gain in employment was directly
induced by light industrial exports (compare table 4, row 3, columns 1 and 2 with the
same in table 2).
1990-95: Slow-down in Employment Creation
In the interval of 1990-95, manufactured exports are estimated to have created
an additional 0.96 million jobs. Total employment induced by manufactured exports
represented 7.2 per cent of the employed workforce of 80.1 million.14 In other words,
growth in employment induced by manufactured exports had slowed down to just 3.7 per
cent per annum, a much lower growth rate than in the period 1985-90. Employment
induced by primary exports continued to decrease between 1990 and 1995, falling to just
14 The estimated economically active population, including those not employed seeking work, in 1995 (BPS, Statistical Yearbook 1995) was 86.4 million compared with 77.8 million in 1990 (ADB, 1999). The growth rate of the economically active population is about 2.05 per cent per annum over this period.

8
0.69 million (table 3) although there was an increase in the value of primary exports
between 1990 and 1995.
A major change in the distribution of employment created by manufactured
exports also occurred between 1990-95. The amount of additional primary employment
induced indirectly by manufactured exports was only slightly over 0.03 million, far less
than the loss in primary employment generated over the period directly by primary
exports. Between 1990 and 1995, there was a contraction in jobs indirectly induced by
manufactured exports in the primary wood sector (table 5). The reduced rate of
expansion of wood exports between 1990 and 1995 is chiefly due to slower growth in the
plywood sector.15 However, as can be seen in table 5, employment generated indirectly in
primary tree crop sectors continued to expand between 1990 and 1995 (rubber, coconuts,
and oil palm). 16 Backward linkages from manufactured exports to primary sectors
supplying raw materials remained significant but did not expand as rapidly as in the
previous period.
Manufactured exports between 1990 and 1995 induced only 0.26 million new
manufacturing jobs, most of which were in light industry (table 2). Therefore, most of
the employment induced by manufactured exports was in the tertiary sector (services,
etc.) with a total increment of 0.67 million jobs. Light industrial exports created most of
the employment induced by manufactured exports (59 per cent). Aside from the
primary sector, light industry exports accounted for the bulk of employment induced in
manufacturing (65 per cent) and in services (58 per cent).
15 James (1996) shows that plywood exports fell in value by 7.2 per cent in 1995 compared with 1994 and fell in volume by 7.3 per cent. From 1993-95 export volume of plywood (SITC 634) fell by an estimated 11.5 per cent.

9
It is important to put the slow-down in employment expansion induced by
manufactured exports in the first half of the 1990s in proper perspective. The expansion
of employment created by manufactured exports was from a much higher base than in the
previous period. Overall growth in the labor force slowed considerably compared with
the previous period.17 According to census data, overall employment growth between
1990-95 was just 2.2 per cent, down from 3.2 per cent in the 1980-90 period and nearly
4.0 per cent in 1985-90. The excess of the rate of growth of employment over that of the
economically active population would be expected to result in a decline in measured
unemployment. However, it appears 1995 is somewhat unusual in this regard.18
Overall employment in manufacturing rose at an estimated rate of 4.1 per cent
and that of services grew by 4.9 per cent per annum between 1990-95 (Manning and
Junankar, 1998). However, this implies a low employment elasticity of manufacturing
growth given the double-digit rise in real manufacturing value added during 1990-95
(Manning and Junankar 1998). The positive growth in manufacturing and services
employment can be contrasted with negative growth in agricultural employment (–0.6 per
cent per annum) over the same period. Thus, despite the slow-down in employment
creation through manufactured exports, structural change continued to advance in
Indonesia.
16 The slow-down in expansion of wood product exports may indicate that easily harvested logs are becoming scarce. At the same time, expansion of tree crop production and exports may reflect the on-going conversion of forests into agricultural estates. 17 Jones (1994) estimated that the overall expansion in the labor force during the 1990s would be around 19 per cent compared with 33 per cent in the 1980s. 18 Manning and Junankar (1998) report that official unemployment was reported to be unusually high in 1995, possibly reflecting a change in the definition used compared with other years. As a percentage of the economically active population, unemployment was 7.3 per cent in 1995 but was only 2.4 per cent in 1990. Part of the reason for this was a rise in the labor force participation rate between 1990 and 1995 of about 1 per cent from 43.4 to 44.3 per cent of the population (ADB 1999).

10
Conclusion Economic growth between 1985 and 1995 was quite high in Indonesia and
manufacturing value-added grew at double-digit real rates over this entire period
(Timmer, 1999). Manufactured exports, particularly of light industrial products,
performed remarkably well and demonstrably responded to the trade liberalization
undertaken after 1985. However, in some light industries, export performance began to
weaken toward the end of the period of 1990-95 compared with 1985-90. This was
particularly the case in wood and may be indicative of supply-side constraints in
availability of raw material.
The slow progress in trade reform during the period of 1991-94 may have
contributed to the slightly slower growth of non-oil manufactured exports, between 1990-
95 compared with 1985-90. However, the main problem was not in any real slackening
of export growth, but in the apparently much lower elasticity of employment with respect
to manufacturing exports and production found in the latter period. In part, the
explanation for the decline in the employment elasticity of manufacturing growth may be
a shift of production and investment in the latter period to capital-intensive industries
(Manning and Jayasuriya 1996).
The slow-down in employment creation due to exports found in this study for
1990-95 compared with earlier periods may indicate that growth in employment became
less dependent on export expansion and was related more closely to domestic demand
growth. Concerns about the over-heating of the economy, slower export growth and a
rising current account deficit were recognized (Nasution 1995, James 1995, and Bird

11
1996) although they were later dismissed (perhaps prematurely in light of the crisis that
soon followed).
It remains to reconcile the seemingly robust economic expansion of the period
with the rise in the official unemployment rate reported in 1995. Labor market
segmentation and rigidities, rising real wages, improved enforcement of labor regulations
and minimum wage laws, and shortages of suitably trained potential employees may help
explain this apparent paradox. In addition there is the rise in labor force participation and
changes in the definition of unemployment.
Another set of issues surrounding the prospects for expansion of labor-intensive
manufacturing activity and exports has been that of competitiveness. The fear that
Indonesia was “losing competitiveness” in labor-intensive industries was oft expressed in
the period prior to the crisis. With the substantial nominal devaluation of the rupiah,
these concerns have lessened somewhat. In present circumstances, the view that
Indonesia must rush to promote “higher value-added” and technology-intensive industry
is heard less often. At present there is an obvious need to generate as much employment
as possible in private sector businesses. A logical manner of doing so would be through a
combination of trade, investment and labor-market reforms. Unfortunately, such reforms
appear to face strong resistance among interest groups and officialdom.

References Asian Development Bank. 1999. Key Indicators of Developing Asian and Pacific
Countries, New York: Oxford University Press.
Australian National University. 1997. Trade Data from the International Economic
Development Bank.
Badan Pusat Statistik. 1998. Indonesian Input-Output Table, 1995, 2 volumes, Jakarta.
_________________ 1994. Indonesian Input-Output Table, 1990, 2 volumes, Jakarta.
_________________ 1990. Indonesian Input-Output Table, 1985, Jakarta
_________________ 1995. Statistical Yearbook of Indonesia, Jakarta.
Bird, Kelly. 1996. “Survey of Recent Developments,” Bulletin of Indonesian Economic
Studies, 32 (1): 3-32.
Fane, George and Tim Condon. 1995. “Measuring De-regulation in Indonesia,” Paper
presented to the Economists Conference, Adelaide University, Adelaide, September.
__________________________ 1996. “Trade Reform in Indonesia, 1987-95,” Bulletin of
Indonesian Economic Studies, 32 (3): 33-54.
Fane George and Chris Phillips. 1991. “Effective Protection in Indonesia in 1987,” Bulletin of
Indonesian Economic Studies, 27 (1): 105-25.
Fujita, Natsuki and William E. James. 1997. “Employment Creation and Manufactured Exports
in Indonesia: 1980-90,” Bulletin of Indonesian Economic Studies, 33 (1): 103-15.

International Monetary Fund. 1999. International Financial Statistics Yearbook, Washington,
D.C.
James, William E. 1996. “Indonesia: Non-Oil and Non-Gas Export Performance in 1995 and
Prospects for 1996,” Paper presented at the 5th Convention of the East Asian Economic
Association, Sheraton Royal Orchid Hotel, Bangkok, October.
______________ 1995. “Survey of Recent Developments,” Bulletin of Indonesian Economic
Studies, 31 (3): 3-32.
Jones, Gavin. 1994. “Labour Force and Employment,” in Hal Hill (ed.), Indonesia’s New Order:
The Dynamics of Socio-economic Transformation, Allen & Unwin, Sydney.
Manning, Chris and S. Jayasuriya. 1996. “Survey of Recent Developments,” Bulletin of
Indonesian Economic Studies, 35 (2): 3-45.
Manning, Chris and P.N. Juanankar. 1998. “Choosy Youth or Unwanted Youth? A Survey of
Unemployment,” Bulletin of Indonesian Economic Studies, 34 (1): 55-94.
Nasution, Anwar. 1995. “Survey of Recent Developments,” Bulletin of Indonesian Economic
Studies, 31 (2): 3-40.
Ramstetter, Eric D. 1999. “Trade Propensities and Foreign Ownership Shares in Indonesian
Manufacturing,” Bulletin of Indonesian Economic Studies, 35 (2): 43-66.
Timmer, Marcel P. 1999. “Indonesia’s Ascent on the Technology Ladder: Capital Stock and
Total Factor Productivity in Indonesian Manufacturing, 1975-95,” Bulletin of Indonesian
Economic Studies, 35 (1): 75-98.
World Bank. 1995. Indonesia: Improving Efficiency and Equity, Changes in the Public Sector’s
Role, Report No. 14006-IND. Washington, D.C.

Tabl
e 1.
Com
posi
tion
of E
xpor
ts: I
ndon
esia
1985
1990
1995
1985
1990
1995
(mil.
US
$, c
urre
nt p
rices
)(%
)To
tal M
erch
andi
se E
xpor
ts18
,587
.025
,675
.045
,417
.010
0.00
100.
0010
0.00
Man
ufac
turin
g, e
xcl.
petro
leum
refin
erie
s:3,
498.
110
,852
.026
,781
.118
.82
42.2
758
.97
Food
, Bev
erag
es &
Tob
acco
597.
990
1.4
2,14
3.6
3.22
3.51
4.72
Ligh
t Man
ufac
turin
g:1,
825.
86,
738.
113
,598
.29.
8226
.24
29.9
4Te
xtile
s, A
ppar
el, L
eath
er58
8.4
3,00
7.4
6,34
3.4
3.17
11.7
113
.97
Bam
boo,
Woo
d an
d R
atta
n1,
195.
23,
398.
35,
327.
36.
4313
.24
11.7
3Pa
per a
nd P
aper
Pro
duct
s27
.520
1.8
1,26
9.0
0.15
0.79
2.79
Man
ufac
ture
of O
ther
Pro
duct
s, ne
c 14
.613
0.6
658.
50.
080.
511.
45H
eavy
& C
hem
ical
Indu
strie
s:1,
074.
43,
212.
511
,039
.36.
7317
.98
24.3
1In
dust
rial C
hem
ical
s15
3.2
459.
01,
308.
00.
821.
792.
88O
ther
Che
mic
al P
rodu
cts
70.2
161.
828
7.0
0.38
0.63
0.63
Rub
ber a
nd P
last
ic P
rodu
cts
20.8
882.
03,
155.
00.
113.
446.
95N
on-M
etal
lic M
iner
al P
rodu
cts
32.3
240.
435
7.8
0.17
0.94
0.79
Iron
and
Ste
el33
.925
4.1
415.
10.
180.
990.
91N
on-F
erro
us M
etal
Pro
duct
s 61
7.2
591.
789
5.9
3.32
2.30
1.97
Fabr
icat
ed M
etal
Pro
duct
s20
.222
3.0
794.
90.
110.
871.
75El
ectri
cal a
nd N
on-E
lect
rical
Mac
hine
ry12
3.9
281.
23,
350.
50.
671.
107.
38Tr
ansp
ort E
quip
men
t2.
611
9.3
475.
10.
010.
461.
05
Sou
rce:
Aus
tralia
n N
atio
nal U
nive
rsity
(199
7) a
nd a
utho
rs' c
ompi
latio
ns.

Table 2. Primary and Non-Primary Employment Induced by Manufactured Exports, 1985-95 (no./%)
1985 1990 1995
Primary Sectors 353,824 1,219,394 1,253,59120.7 25.2 21.6
Food Processing 28,612 240,345 192,6471.7 5.0 3.3
Light Industries 854,007 2,332,953 2,503,29550.0 48.2 43.2
Heavy & Chemical Industries 152,954 336,350 471,1399.0 7.0 8.1
Services, etc. 317,337 706,818 1,372,23618.6 14.6 23.7
Total 1,706,734 4,835,860 5,792,908100.0 100.0 100.0
Source: Authors' estimates.

Table 3. Primary and Non-Primary Employment Induced by Primary Exports, 1985-95 (no./%)
1985 1990 1995
Primary Sectors 1,447,457 945,119 518,15579.3 78.8 74.8
Food Processing 3,538 3,437 1,8470.2 0.3 0.3
Light Industries 27,216 16,405 7,0521.5 1.4 1.0
Heavy & Chemical Industries 19,446 20,522 11,5381.1 1.7 1.7
Services, etc. 318,028 213,149 154,28118.0 17.8 22.3
Total 1,815,685 1,198,632 692,873100.0 100.0 100.0
Source: Authors' estimates.

Table 4. Primary and Non-Primary Employment Induced by Light Industrial Exports, 1985-95 (no./%)
1985 1990 1995
Primary Sectors 92,564 372,204 375,4158.3 12.0 21.6
Food Processing 2,112 6,136 4,7110.2 0.2 3.3
Light Industries 848,471 2,319,063 2,478,47875.6 74.7 43.2
Heavy & Chemical Industries 8,729 27,927 40,0410.8 0.9 8.1
Services, etc. 168,812 380,283 771,50115.1 12.2 23.7
Total 1,120,688 3,105,613 3,670,145100.0 100.0 100.0
Source: Authors' estimates.
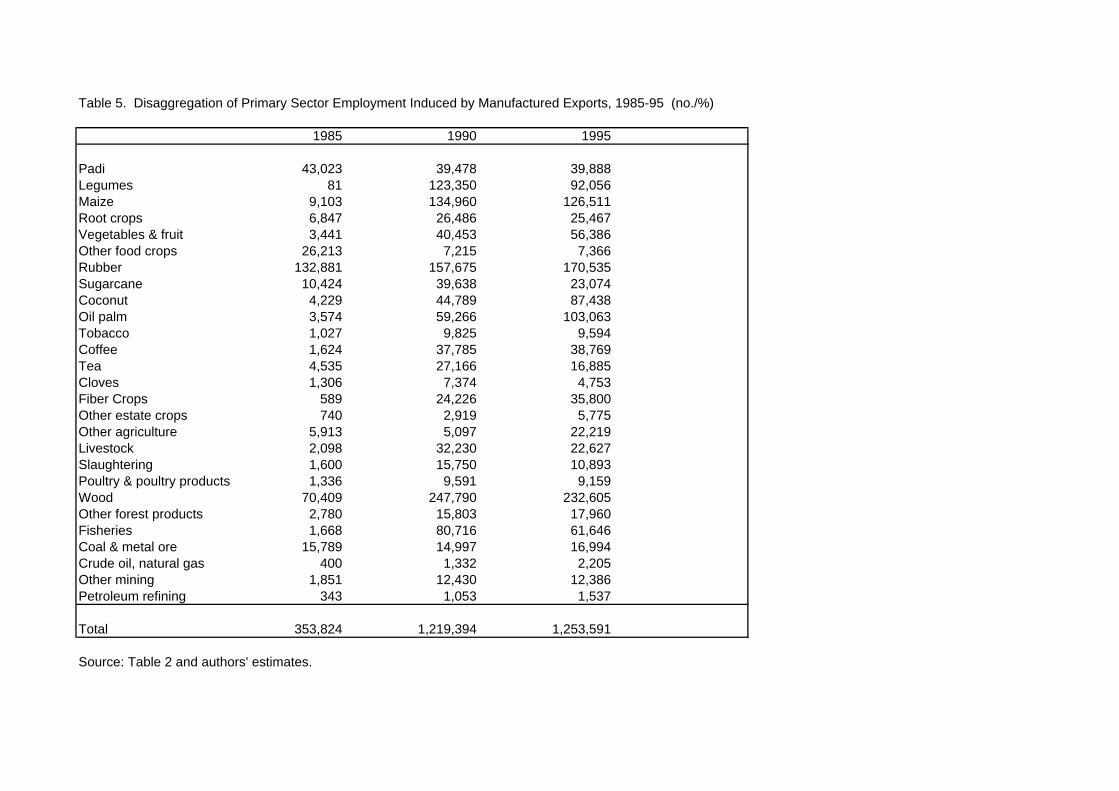
Table 5. Disaggregation of Primary Sector Employment Induced by Manufactured Exports, 1985-95 (no./%)
1985 1990 1995
Padi 43,023 39,478 39,888Legumes 81 123,350 92,056Maize 9,103 134,960 126,511Root crops 6,847 26,486 25,467Vegetables & fruit 3,441 40,453 56,386Other food crops 26,213 7,215 7,366Rubber 132,881 157,675 170,535Sugarcane 10,424 39,638 23,074Coconut 4,229 44,789 87,438Oil palm 3,574 59,266 103,063Tobacco 1,027 9,825 9,594Coffee 1,624 37,785 38,769Tea 4,535 27,166 16,885Cloves 1,306 7,374 4,753Fiber Crops 589 24,226 35,800Other estate crops 740 2,919 5,775Other agriculture 5,913 5,097 22,219Livestock 2,098 32,230 22,627Slaughtering 1,600 15,750 10,893Poultry & poultry products 1,336 9,591 9,159Wood 70,409 247,790 232,605Other forest products 2,780 15,803 17,960Fisheries 1,668 80,716 61,646Coal & metal ore 15,789 14,997 16,994Crude oil, natural gas 400 1,332 2,205Other mining 1,851 12,430 12,386Petroleum refining 343 1,053 1,537
Total 353,824 1,219,394 1,253,591
Source: Table 2 and authors' estimates.

APPENDIX 1: SECTORAL CLASSIFICATION
Primary Sector Paddy
Beans
Maize
Root crops
Vegetables and fruits
Other food crops
Rubber
Sugarcane
Coconut
Oil palm
Tobacco
Coffee
Tea
Clove
Fiber crops
Other estate crops
Other agriculture
Livestock
Slaughtering
Poultry and its product
Wood
Other forest products
Fishery
Coal and metal ore mining
Crude oil, natural gas and geothermal mining
Other mining and quarrying
Petroleum refinery
Food Sector Manufacture of food processing and preserving
Manufacture of oil and fat
Rice milling
Manufacture of flour, all kinds

Sugar factory
Manufacture of other food products
Manufacture of beverages
Manufacture of cigarettes
Light Industries Yarn spinning
Manufacture of textile, wearing apparel and leather
Manufacture of bamboo, wood and rattan products
Manufacture of paper, paper products and cardboard
Manufacture of other products not elsewhere classified
Heavy & Chemical Industries Manufacture of fertilizer and pesticide
Manufacture of chemicals
Manufacture of rubber and plastic wares
Manufacture of non metallic mineral products
Manufacture of cement
Manufacture of basic iron and steel
Manufacture of non ferrous basic metal
Manufacture of fabricated metal products
Manufacture of machine, electrical machinery and apparatus
Manufacture of transport equipment and its repair
Services etc. Electricity, gas and water supply
Construction
Trade
Restaurant and hotel
Railway transport
Road transport
Water transport
Air transport
Services allied to transport
Communication
Financial intermediaries

Real estate and business service
General government and defense
Social and community services
Other services
Unspecified sector