403 report
TRANSCRIPT

Supersonic Projectile Analysis
AE 403 Senior Project
Julian Bagtas
Katrina Granada
Jacqueline Alexis Mendoza
Ross Novencido
December 18, 2014

Nomenclature
Introduction
The purpose of this project was to analyze the effect of various geometries on drag and their
resulting shockwaves under supersonic conditions. This was achieved by utilizing the supersonic wind
tunnel testing facility located at San Diego State University. In order to fully understand the supersonic
aerodynamics of the bullet profiles, the students utilized prior high speed aerodynamic coursework in
order to hypothesize and infer the results of the conducted experiment.
In addition to high speed aerodynamics, a general interest in ballistics, and real world supersonic
testing formulated the idea to perform the following experiments. The opportunity to apply previous
coursework and gain hands on experience with aerospace engineering equipment was the secondary
purpose to this project.
The supersonic projectile analysis that was conducted this year was a partial continuation of a
previous bullet analysis project. The previous experiment tested various geometries different from the
current year’s project. Other varying elements of the previous experiment were the use of aluminum for
its fabrication, and the testing was performed at a test section velocity of approximately Mach four. Our
group was not able to completely utilize the entirety of the previous project due to its loss by the owner.
In order to improve on what was known about the previous project, the use of copper and a test
section velocity of Mach 2 were used. These improvements were based on the evident warping of
material of the previous bullets. Due to a high test section velocity and a low melting temperature, the
previous bullets suffered from warping and plastic deformation upon testing. The accounted deformation
caused a slight change in shock wave formation and skewed the results after numerous tests were
completed. For that reason, copper was utilized for its high melting temperature. A velocity of Mach two
was used for the test section chamber and was based off the average muzzle velocities of the four chosen
projectiles. The decision to change both the material and test section Mach number was to ensure that
there was to be no material deformation during testing.
The first projectile has a conically shaped body and was modeled after a boat-tail spitzer. The
tapered heel at the end of the bullet reduces air resistance. Therefore, its aerodynamic design gives it a
higher degree of accuracy and kinetic efficiency. With a high kinetic efficiency, has a high impact
velocity and decreases lateral drift caused by cross winds. This type of projectile has a muzzle velocity
that is usually around Mach 2 and will be used as the baseline for testing. The following image shows the
dimensions; given in inches, used to machine the projectile is shown below.

The second test was run with a simulated tank shell. This design was requested by Dr. Katz and
was modeled after a sabot round, which also has a conically shaped body. The tank shell, also known as a
sabot round, typically travels around Mach 5 which is 1,670 meters per second and has a maximum
effective range of 3,000 meters. The dimensions for this projectile are shown below.
The third body shape that was tested was a simulated hollow point. This bullet shape has a blunt
body. The hollow point bullet usually travels at a velocity that is slightly less than Mach 1, 340 meters per
second. The hollow point dimensions are given below.

The fourth and last body shape that was tested was a simulated shotgun pellet. A shotgun pellet
usually has a muzzle velocity at around Mach 1.62, 550 meters per second. This bullet has a blunt body as
well. The shotgun pellet dimensions are given below.
Method
In order to complete supersonic wind tunnel testing and aside from the projectiles, our group
utilized a load cell, load cell reader, testing mount, schlieren and Mach two nozzle. The wind tunnel
mount that was used was made from the previous ballistics testing experiment. This mount can be broken
down into two pieces, an outer mount that attaches to the wind tunnel and an internal mount that houses
the projectile and load cell. The outer mount could attach to the tail end of the test section and allow the
internal mount to be positioned in a way that allows the projectile to see the airflow free of any
obstructions. For this reason, the internal mount housed a threaded rod that extended several inches
forward.
It also housed the load cell and protected it from experiencing any airflow. The load cell was
positioned in such a way that the wire was aligned with the bottom leg of the internal mount, preventing it
from seeing direct airflow. The load cell utilized was the same type from the previous testing. The mount
also protected the load cell from the airflow. The load cell wire extended from inside the tunnel and
through an outlet further away from the airflow to be connected to a load cell reader. The load cell reader
gave the amount of force exerted on the test piece by the airflow in pounds.
The schlieren is a mirror imaging system that requires a light source and mirrors to show
shockwaves. The schlieren our group used can be broken down into several components; one light source,
four mirrors and one screen. Behind the test section the light source and two mirrors were positioned and
the rest positioned in front of the test section. This system works by reflecting the light from behind,
through, and in front of the test section to be projected onto a screen. In this process, the shockwaves bend
the light that is being reflected through the test section. To achieve the best possible images of the
shockwaves, testing was conducted in the dark. Our group had to also swap the nozzles in the wind tunnel
from Mach one to Mach two.

(Left) Opened test section with the Mach one nozzle installed, (Right) Wind Tunnel Mount in test section with the
simulated tank shell.
The wind tunnel itself was prepped for testing. The supersonic wind tunnel had to be calibrated
for the change from Mach one to Mach two. Prior to testing, our group had to ensure the tank pressure
was above 200 psig. Before the tank pressure could be reached the valves had to be opened. The dryers
also had to be set at four hours. The duration of the testing was chosen to be roughly seven seconds. The
testing mount would be attached to the opened section of the wind tunnel and the projectile would be
screwed to the internal mount. There also was a camera positioned to capture the images off of the
schlieren. With everything in place, the wind tunnel would be closed and secured, lights would be turned
off, the test would be run and the values for temperature, pressure, and applied load would be recorded (if
able to). This process was repeated for all projectiles with multiple tests run for each.
Discussion
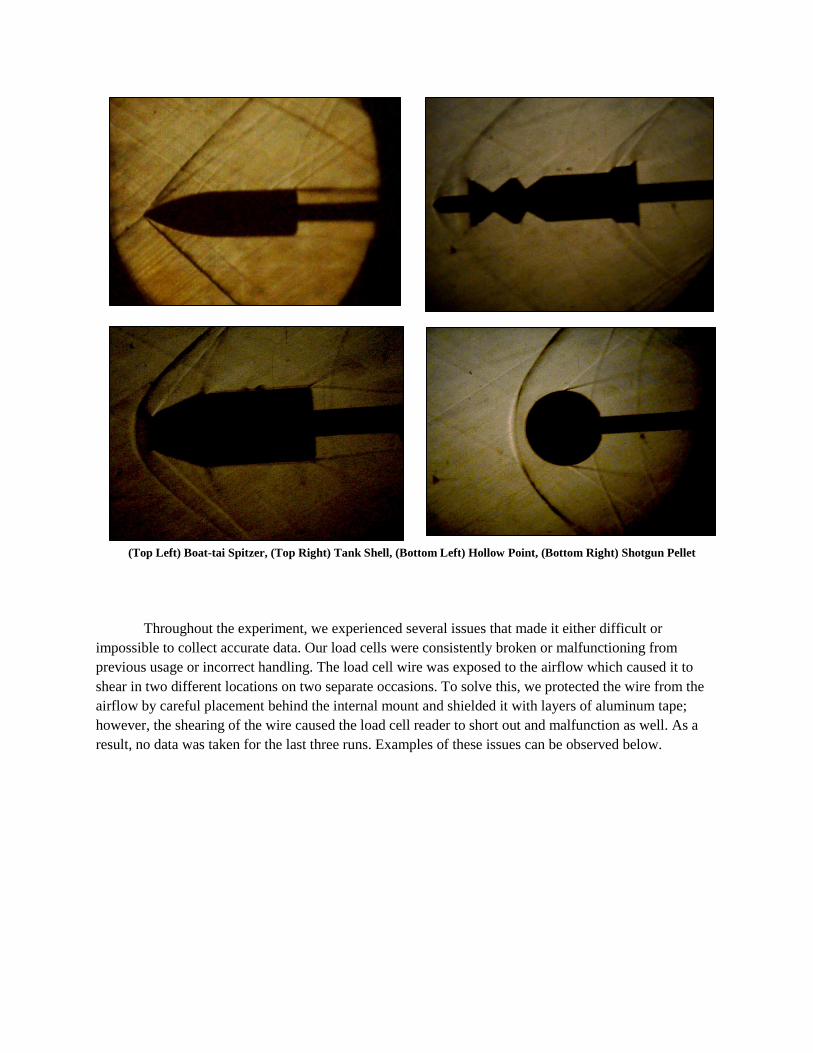
Conically shaped bodies have attached shocks. The attached shock can be seen at the tip of the
boat-tail spitzer. Blunt bodies have detached shockwaves that are bowlike. In front of the blunt body there
exists a region where the flow is less than Mach one, this is due to isentropic compression. This region
exists behind the shockwave and in front of the body until the sonic line is reached. At the sonic line, the
flow changes to greater than Mach one. For the simulated Tank Shell, Hollow Point and Shotgun Pellet,
these regions can be seen. Secondary shocks and expansion fans can also be seen in the images below.
Without the stagnation values and reliable values for applied load, our group was unable to further
analyze the shockwaves and their induced effects.
Throughout the experiment, we experienced several issues that made it either difficult or
impossible to collect accurate data. Our load cells were consistently broken or malfunctioning from
previous usage or incorrect handling. The load cell wire was exposed to the airflow which caused it to
shear in two different locations on two separate occasions. To solve this, we protected the wire from the
airflow by careful placement behind the internal mount and shielded it with layers of aluminum tape;
however, the shearing of the wire caused the load cell reader to short out and malfunction as well. As a
result, no data was taken for the last three runs. Examples of these issues can be observed below.
(Top Left) Boat-tai Spitzer, (Top Right) Tank Shell, (Bottom Left) Hollow Point, (Bottom Right) Shotgun Pellet

(Left) Sheared wire with load cell inside internal mount, removed from the wind tunnel. (Middle) Sheared wire with the
load cell in the wind tunnel testing mount. (Right) Load cell reader displaying loads on ports without a load cell
connected.
In the absence of data for the sabot round, hollow point and shotgun pellet, and reliable data for
the boat-tail Spitzer, we have collected existing experimental data from another source that helped us
predict and make expectations for the drag and ballistic coefficients of the aforementioned munitions.
The graph below depicts the Mach number versus CD for a typical boat-tail spitzer; at Mach 2 -
the speed at which we ran our tests - we estimated CD to be approximately 0.289. While this value does
not pertain to our specific bullet, it’s reasonable to assume it is within an acceptable tolerance and helped
develop a trend of worthy significance.
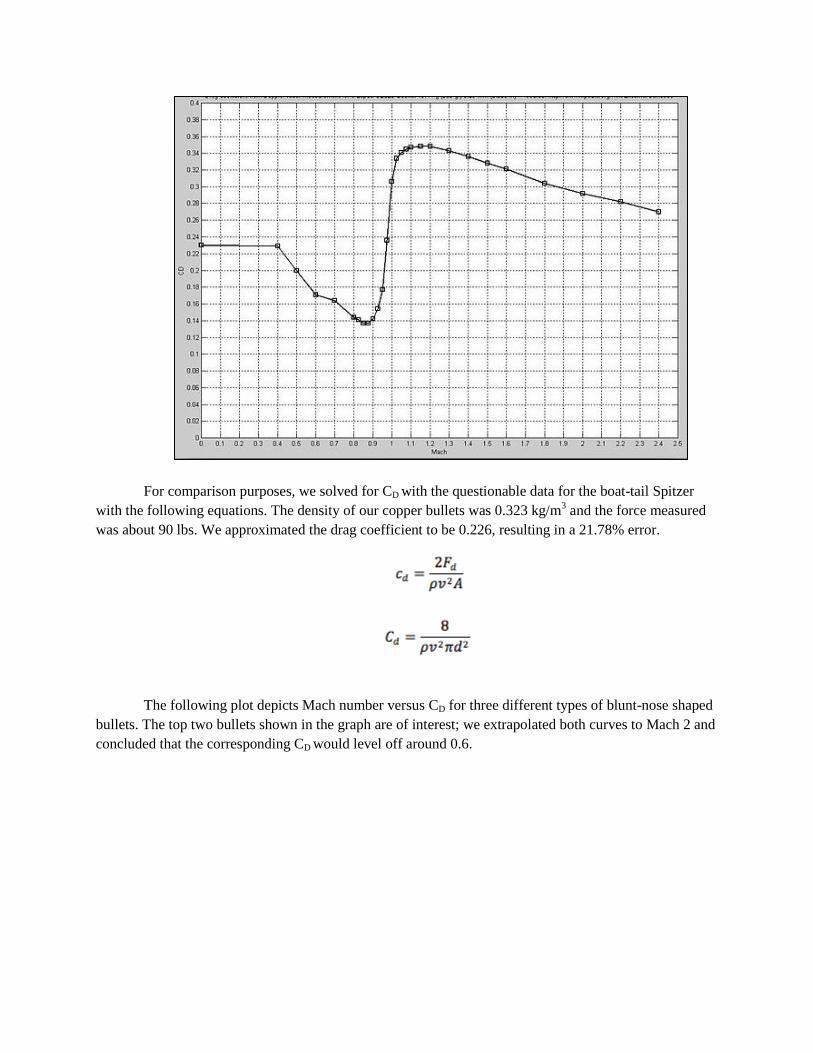
For comparison purposes, we solved for CD with the questionable data for the boat-tail Spitzer
with the following equations. The density of our copper bullets was 0.323 kg/m3 and the force measured
was about 90 lbs. We approximated the drag coefficient to be 0.226, resulting in a 21.78% error.
The following plot depicts Mach number versus CD for three different types of blunt-nose shaped
bullets. The top two bullets shown in the graph are of interest; we extrapolated both curves to Mach 2 and
concluded that the corresponding CD would level off around 0.6.
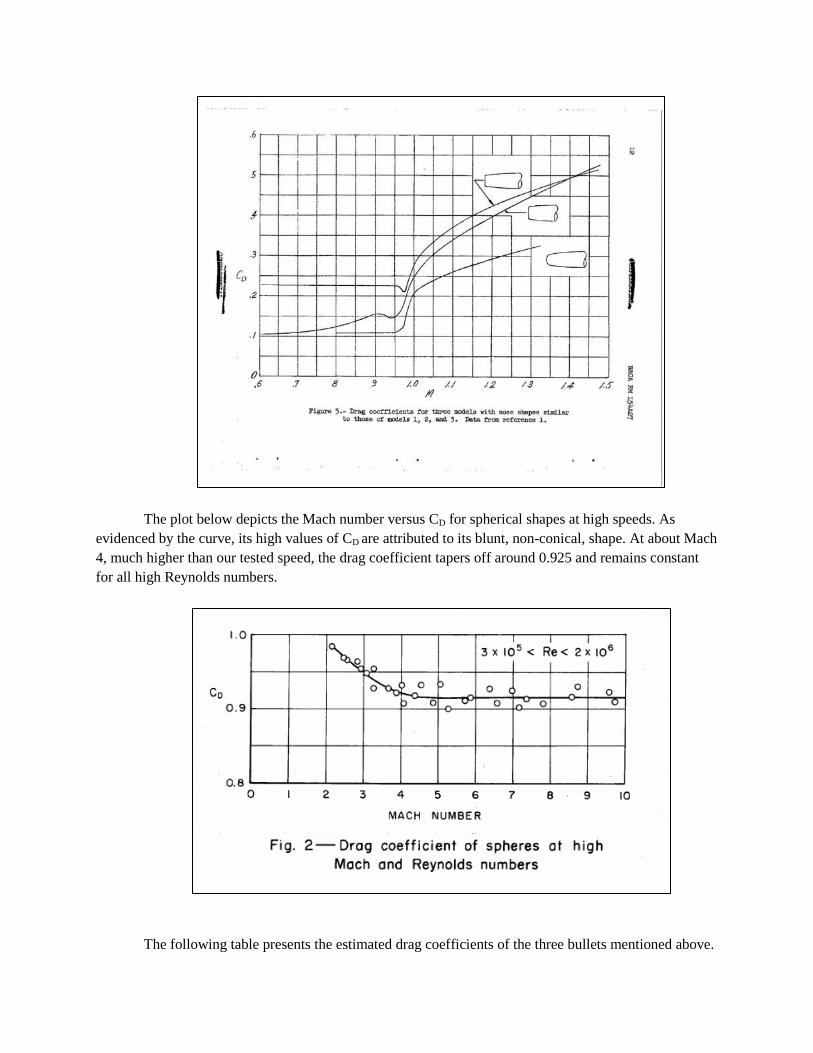
The plot below depicts the Mach number versus CD for spherical shapes at high speeds. As
evidenced by the curve, its high values of CD are attributed to its blunt, non-conical, shape. At about Mach
4, much higher than our tested speed, the drag coefficient tapers off around 0.925 and remains constant
for all high Reynolds numbers.
The following table presents the estimated drag coefficients of the three bullets mentioned above.

Because the sabot round was comprised of numerous complex geometries, estimating the drag
coefficient under the previous procedures was impossible. Numerous shockwaves were also evident
throughout the length, adding to the complexity. However, understanding the trend of the other three
bullets, we inferred that the tank shell would have a higher drag coefficient than the hollow point and a
lower drag coefficient than the pellet.
After estimating the coefficients of drag, we then calculated from the following equations and
estimated from other sources the ballistics coefficient of the three bullets.
In order to calculate the ballistics coefficient, we used the following equation to solve for i,
coefficient of form.
In order to calculate coefficient of form, we needed n, number of calibers. If the number of
calibers was not given, the following equation can be used to solve for it, where l is the length of the
bullet.
After attaining the ballistics coefficient, and comparing the values to the coefficient of drag, we
safely assumed that the sabot round would have a lower ballistics coefficient than the hollow point and a
higher value than the pellet. The following table represents the different ballistics coefficient of the three
bullets.
The following chart shows the difference between the two coefficients of each bullet. From left to
right, the plot depicts the boat-tail spitzer (1), the hollow point (2), and shotgun pellet (3). Thus, as the
coefficient of drag increases, the ballistics coefficient decreases.
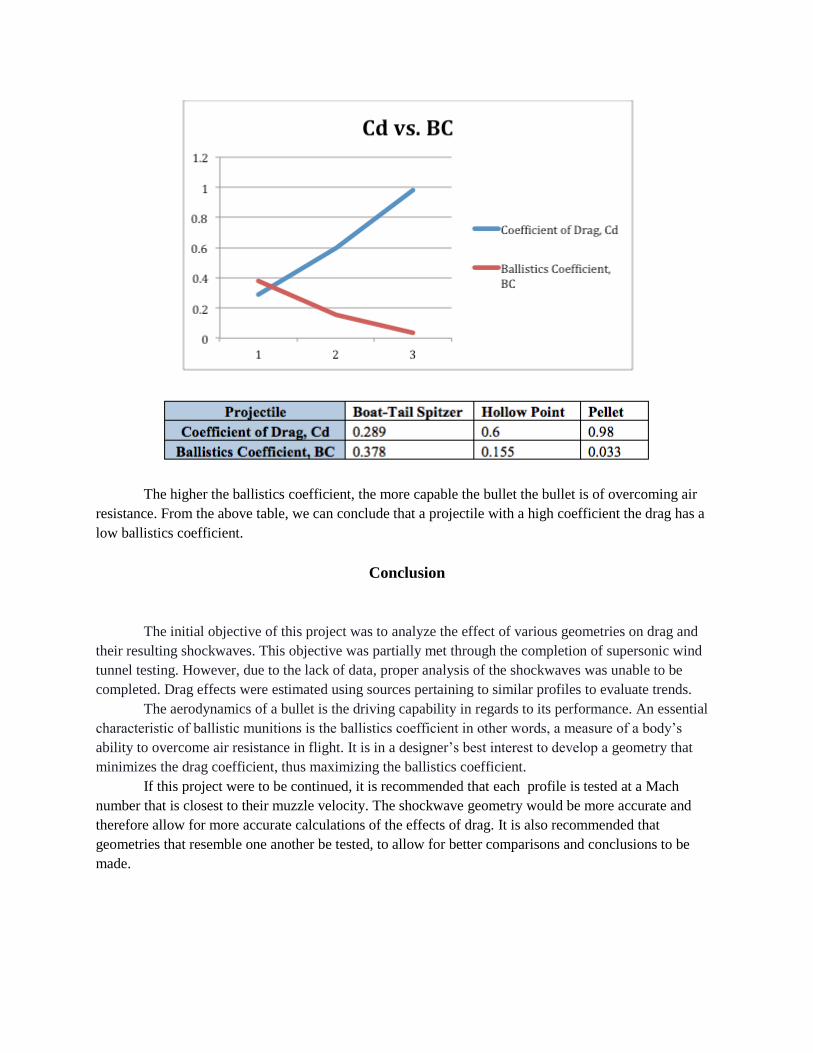
The higher the ballistics coefficient, the more capable the bullet the bullet is of overcoming air
resistance. From the above table, we can conclude that a projectile with a high coefficient the drag has a
low ballistics coefficient.
Conclusion
The initial objective of this project was to analyze the effect of various geometries on drag and
their resulting shockwaves. This objective was partially met through the completion of supersonic wind
tunnel testing. However, due to the lack of data, proper analysis of the shockwaves was unable to be
completed. Drag effects were estimated using sources pertaining to similar profiles to evaluate trends.
The aerodynamics of a bullet is the driving capability in regards to its performance. An essential
characteristic of ballistic munitions is the ballistics coefficient in other words, a measure of a body’s
ability to overcome air resistance in flight. It is in a designer’s best interest to develop a geometry that
minimizes the drag coefficient, thus maximizing the ballistics coefficient.
If this project were to be continued, it is recommended that each profile is tested at a Mach
number that is closest to their muzzle velocity. The shockwave geometry would be more accurate and
therefore allow for more accurate calculations of the effects of drag. It is also recommended that
geometries that resemble one another be tested, to allow for better comparisons and conclusions to be
made.

References
Steger, Joseph L., and Barrett S. Baldwin. Shock Waves and Drag in the Numerical Calculation
of Isentropic Transonic Flow. Washington, D.C.: National Aeronautics and Space
Administration, 1972. Print.
Masson, David J., D. N. Morris, and Daniel E. Bloxsom. Measurements of Sphere Drag from
Hypersonic Continuum to Free-molecule Flow. Santa Monica, CA: Rand, 1960. Web.
"External Ballistics." Wikipedia. Wikimedia Foundation, n.d. Web. 7 Dec. 2014.