4 daily management process for reduce cost...
TRANSCRIPT
Journal of Mechanical Engineering and Technology (JMET), ISSN 2347-3924 (Print),
ISSN 2347-3932 (Online), Volume 1, Issue 1, July -December (2013)
45
DAILY MANAGEMENT PROCESS FOR REDUCE COST OF
QUALITY IN AUTOMOBILE INDUSTRY
S.N.Teli1,
Dr.V.S.Majali2,
Dr.U.M.Bhushi3,
Sunil Gaikwaid4
1Associate Professor & HOD -Mech. Engg. Dept., SCOE, Kharghar, Maharashtra, India
[Research Scholar GIT Belgaum -VTU, Belgaum, Karnataka] 2 Professor & HOD – Mech. Engg.Dept. , GIT, Belgaum, Karnataka, India 3Principal - Sahyadri College of Mangalore Engineering & Management,
Mangalore, Karnataka, India 4M.E. Student - SCOE, Kharghar, Maharashtra, India
ABSTRACT
The global automotive industry features intense competition, a sharp focus on cost,
and a regulatory oversight. There is an ongoing trend towards global sourcing and distributed
manufacturing/assembly operations. All of these factors are driving a need for an extensible
and flexible quality management system that automates field-level quality management tasks
and provides real-time visibility into all aspects of quality management across manufacturing
facilities and supplier locations around the world. In pursuit of breakthrough improvement
and innovation, organizations tend to give less importance to routine activities or Daily
Management. In the absence of a proper Daily Management system, the benefits derived
from break through improvements & innovations slowly losses its effectiveness.
All the activities that must be carried out routinely in each area in order to attain the
purpose of their job effectively and efficiently is termed as “Daily Management” Daily
Management is also called as Daily Routine Management or Routine Management. In a nut
shell Management of routine jobs at all levels is Daily Management. In process improvement
efforts, the concept of quality costs or cost of quality is a means to quantify the total cost of
quality-related efforts and deficiencies. COQ costs as the “price of conformance” – the
prevention and appraisal costs and the “price of non-conformance” – the failure costs. In
recent years, interest in cost of quality (COQ) system is increasing among Indian Automobile
industries. Cost of Quality (COQ) is the sum of the costs incurred by a company in
preventing poor quality, the costs incurred to ensure and evaluate that the quality
requirements are being met, and any other costs incurred as a result of poor quality being
produced. Poor quality is defined as non-value added activities, waste, errors or failure to
meet customer needs and requirements. These COQ costs can be broken down into the three
categories of prevention, appraisal and failure costs. The implementation of Daily
Management System and other quality initiatives necessary to reduce the cost of quality
JOURNAL OF MECHANICAL ENGINEERING AND
TECHNOLOGY (JMET)
ISSN 2347-3924 (Print)
ISSN 2347-3932 (Online)
Volume 1, Issue 1, July-December (2013), pp. 45-53
© IAEME: http://www.iaeme.com/JMET.asp
JMET © I A E M E

Journal of Mechanical Engineering and Technology (JMET)
ISSN 2347-3932 (Online), Volume 1, Issue 1, July
Key Words: Automobile Industry,
INTRODUCTION/BACKGROUND
The methods required for sustaining Daily Management are the following:
� Standardization – to provide consistency
� Training – to give the associate the needed skills
� Standard Audits – to assure the standards are followed
� Failure Analysis – to address deviations
� Solicit and act on ideas for improvement
� Communications – so everyone knows the business
1. DAILY MANAGEMENT ACTIVITIES AND SCOPE
This process is for all employees of all functions across the automotive sector.
Applicability of this guideline is for all employees of all functions across the Automotive
Sector.
2. PURPOSE OF DAILY MANAGEMENT PROCESS
Managing the routine jobs at all levels effectively and efficiently, with
and improve the present level of performance (i.e stability). The
& fig 3 depict the importance of Daily Management.
Fig 1: Improvement by Breakthrough only
Daily Management
includes management of:
Hourly basis
Daily Job
Weekly Job
Monthly Job
seasonal Job
Yearly Job & etc
Journal of Mechanical Engineering and Technology (JMET), ISSN 2347-
, Volume 1, Issue 1, July -December (2013)
46
Industry, SDCA, PDCA, COQ
INTRODUCTION/BACKGROUND
The methods required for sustaining Daily Management are the following:
provide consistency
to give the associate the needed skills
to assure the standards are followed
to address deviations
Solicit and act on ideas for improvement
so everyone knows the business situation
DAILY MANAGEMENT ACTIVITIES AND SCOPE
This process is for all employees of all functions across the automotive sector.
Applicability of this guideline is for all employees of all functions across the Automotive
Classification of Daily
Management activities
. PURPOSE OF DAILY MANAGEMENT PROCESS
Managing the routine jobs at all levels effectively and efficiently, with intent
and improve the present level of performance (i.e stability). The illustrations shown in fig 2
the importance of Daily Management.
Improvement by Breakthrough only Fig 2: Improvement by Breakthrough &
Daily Management
Daily
Management
activites
Maintain the
current level
Incremental
improvement from
current level
Scope of Daily
Management includes
Front Line operation
Supervisor Lab
Section Manager Job
Department to Top
Manager Job etc.
-3924 (Print),
This process is for all employees of all functions across the automotive sector.
Applicability of this guideline is for all employees of all functions across the Automotive
intent to sustain
shown in fig 2
Improvement by Breakthrough &
Scope of Daily
Management includes
Front Line operation
Supervisor Lab
Section Manager Job
Department to Top
Manager Job etc.
Journal of Mechanical Engineering and Technology (JMET)
ISSN 2347-3932 (Online), Volume 1, Issue 1, July
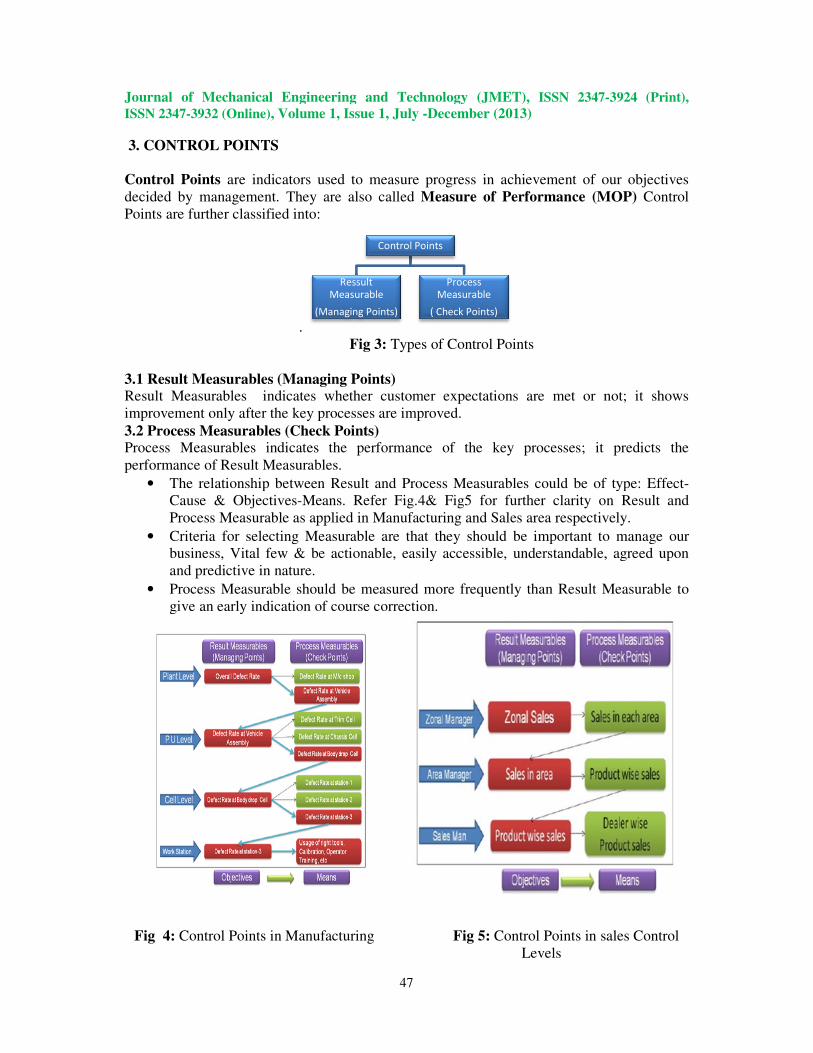
3. CONTROL POINTS
Control Points are indicators used to measure progress in achievement of our objectives
decided by management. They are also called
Points are further classified into:
.
3.1 Result Measurables (Managing Points) Result Measurables indicates whether customer expectations are met or not; it shows
improvement only after the key processes are improved.
3.2 Process Measurables (Check Points) Process Measurables indicates the performance of the
performance of Result Measurables.
• The relationship between Result and Process Measurables could be of type: Effect
Cause & Objectives-Means. Refer F
Process Measurable as applied in Manufacturing and Sales area respectively.
• Criteria for selecting Measurable
business, Vital few & be actionable, easily accessible, understandable, agreed upon
and predictive in nature.
• Process Measurable should be measured more frequently than Result
give an early indication of course correction.
Fig 4: Control Points in Manufacturing
(Managing Points)
Journal of Mechanical Engineering and Technology (JMET), ISSN 2347-
, Volume 1, Issue 1, July -December (2013)
47
are indicators used to measure progress in achievement of our objectives
decided by management. They are also called Measure of Performance (MOP)
Points are further classified into:
Fig 3: Types of Control Points
Managing Points) indicates whether customer expectations are met or not; it shows
improvement only after the key processes are improved.
(Check Points) Process Measurables indicates the performance of the key processes; it predicts the
Measurables.
The relationship between Result and Process Measurables could be of type: Effect
Means. Refer Fig.4& Fig5 for further clarity on Result and
as applied in Manufacturing and Sales area respectively.
Measurable are that they should be important to manage our
business, Vital few & be actionable, easily accessible, understandable, agreed upon
should be measured more frequently than Result Measurable
give an early indication of course correction.
Control Points in Manufacturing Fig 5: Control Points in sales
Levels
Control Points
Ressult
Measurable
(Managing Points)
Process
Measurable
( Check Points)
-3924 (Print),
are indicators used to measure progress in achievement of our objectives
Measure of Performance (MOP) Control
indicates whether customer expectations are met or not; it shows
processes; it predicts the
The relationship between Result and Process Measurables could be of type: Effect-
for further clarity on Result and
as applied in Manufacturing and Sales area respectively.
are that they should be important to manage our
business, Vital few & be actionable, easily accessible, understandable, agreed upon
Measurable to
Control Points in sales Control

Journal of Mechanical Engineering and Technology (JMET), ISSN 2347-3924 (Print),
ISSN 2347-3932 (Online), Volume 1, Issue 1, July -December (2013)
48
3.3 Control Levels They represent a standard used to judge whether a characteristics value of the control point is
in a controlled state or an uncontrolled state.
• This is the next step after Control Point is set, i.e to set the “Range” for the
Measurement. These ranges are called “Control Limits” or “Control Levels”.
• For those indicators that follow “Normal Distribution” such as physical and chemical
indicators, one can use Statistical Control Charts.
• For those indicators that do not always follow “Normal Distribution” such as
production amount, sales amount, etc one can identify the control limits based on
common sense. Past trend /Industrial benchmarks could be used to decide the Control
Levels. Control Levels can be unilateral / bilateral type.
• Criteria for selecting Control Levels are that they should be aggressive, yet attainable,
agreed upon, clearly benefiting our business, and flexible.
• Shown below are examples of Control Levels used for Result Measurables and
Process Measurables in a Manufacturing Plant.
Fig 6: Monitoring of Result Measurable Fig 7: Monitoring of Process Measurable
4. POLICY MANAGEMENT & DAILY MANAGEMENT
• Activities performed on the basis of cooperation of the whole business organization in
order to realize long term, middle term or short- term management plans and policies
effectively and efficiently comes under Policy Management.
• Breakthrough improvements are achieved by Policy Management, while continuous
improvements are achieved by Daily Management.
• In former, objectives are achieved through planned activities which are normally done
beyond the existing framework. While in latter, objectives are achieved through
standardization of activities and pursuing continuous improvement by identifying
abnormalities and taking appropriate measures to prevent its recurrence.
• Policy Management activities involves rotating Plan-Do-Check-Act (PDCA) till
performance is improved to a desired level. These activities then become part of Daily
Management so that they are standardized to sustain the performance in future by
rotating Standardize-Do-Check-Act (SDCA).

Journal of Mechanical Engineering and Technology (JMET), ISSN 2347-3924 (Print),
ISSN 2347-3932 (Online), Volume 1, Issue 1, July -December (2013)
49
• If some chronic problems are identified in Daily Management that needs to be
addressed on priority, then they are solved using structured problem solving tools
such as QC Story.
Refer Fig: 8 which depict the linkage between Policy Management and Daily
Management. Policy Deployment in Manufacturing is shown in Fig: 9 Objectives /
Deliverables are set at Sector level (i.e President Policy–CE Policy– Manufacturing
Head Policy), which gets cascaded to Plant Level and further to P.U Level.
Fig 8: Linkage between Policy Management Fig 9: Policy Deployment in Daily
Management Manufacturing
5. DAILY MANAGEMENT & POLICY MANAGEMENT WEIGHTAGE: AT
SENIOR MANAGEMENT LEVEL:
Both Daily Management and Policy Management are present. Weightage of Policy
Management is more, i.e they should standardize the activities and empower the people to
perform the “Daily Management” and should work much more on strategic issues. Apart
from that, they should also promote Daily Management amongst all levels of employees.
Fig 10: Weightage of “Management”
Both Daily Management and Policy Management are present. Weightage of Daily
Management is more, i.e they should more focus on Daily Management and also deploy
Organization’s vision and objectives.

Journal of Mechanical Engineering and Technology (JMET), ISSN 2347-3924 (Print),
ISSN 2347-3932 (Online), Volume 1, Issue 1, July -December (2013)
50
6. Abnormality Handling System: While monitoring the Control Point, any unusual
behavior other than which is normal must be captured. It covers both occurrence of non-
conformity and abnormal behavior of the process. Corrective actions to be taken once
abnormality occurs, irrespective whether it generates non-conformity or not If any
abnormalities are found, they are dealt as per the Abnormality Handling System shown in
Fig 11.
Fig 11: Abnormality Handling System
7. Elements of Daily Management: Steps involved in Daily Management are:
8. Daily Management in Manufacturing: Daily Management in Manufacturing is as
shown below.
Fig 12 : Daily Management Steps
Fig 13: Daily Management in Manufacturing

Journal of Mechanical Engineering and Technology (JMET), ISSN 2347-3924 (Print),
ISSN 2347-3932 (Online), Volume 1, Issue 1, July -December (2013)
51
9. POLICY DEPLOYMENT AND DAILY MANAGEMENT LINKAGE
Linkage between Policy Deployment and Daily Management is shown & how new
initiatives & improvement projects are identified is described below.
Fig 14: Linkage of Policy Management and Daily Management
10. VARIOUS INDICATORS ARE ILLUSTRATED BELOW
Types Indicators
Quality Warranty , User Plant PPM ,A-NOVA C , Global Demerit ,FRC,FBO,
Rejection PPM , Rework PPM
Productivity Equivalent Veh./man/year,effective working Time , Work content
Reduction , Manpower Reduction
Cost Variable cost(power, tools ,etc)/ eq. vehicle , fixed cost w.r.t. Budget ,
Cost saving due to improvements
Safety Reporable ,Non-reportable accidents , Accident free days , Near miss
cases , organ wise cases , safety Patrol rounds
Morale Training , Conflict resolution & meeting with top Management
Man of the month , absenteeism , i4 Team status , saving through
suggestions , kaizens , dormant & best team for i4 teams

Journal of Mechanical Engineering and Technology (JMET), ISSN 2347-3924 (Print),
ISSN 2347-3932 (Online), Volume 1, Issue 1, July -December (2013)
52
11. TYPICAL DISPLAY CHART FOR KEY INDICATORS MONITORING (DAILY
MANAGEMENT)
The monitoring and display of the key Quality indicators shall indicate Yearly, Monthly and
Daily trends.
Fig 15: Typical Display Chart for Key Indicators Monitoring (Daily Management)
Typical indicators monitored on a defined frequency to assess/measure the effectiveness of
Daily Management activities are:
• Percentage of Control Points which are within Control Levels.
• Number of abnormalities identified.
• Number of abnormalities for which corrective actions (PDCA rotations) were
undertaken.
• Percentage of Processes for which Daily Management practices are implemented.
12. CONCLUSION & RESULT
• Innovations/breakthroughs are brought about in any organization occasionally or
intermittently. There is a high jump in improvements. These high jump improvements
are incorporated in the new practices/systems/processes. Then, after one
innovation/breakthrough, there may be a lull. During this lull period and in absence of
daily management or continuous improvements, these dramatically improved
processes start degrading or deteriorating. And the processes become inefficient
/ineffective. Lots of advantages of innovation disappear or are lost.
Journal of Mechanical Engineering and Technology (JMET), ISSN 2347-3924 (Print),
ISSN 2347-3932 (Online), Volume 1, Issue 1, July -December (2013)
53
• This is where daily management comes in. It insists on daily performance and also,
daily improvements. It keeps on maintaining and further improving the processes. The
fall or degradation of processes is now just not possible. Therefore, daily management
is in fact a management imperative. You cannot do without it (you may occasionally
do without an innovation/breakthrough).
• It may not be as stunning or exciting as an innovation, effective daily management is
the foundation on which maximization of advantages due to innovation and company
viability firmly stay.
• Total COQ decreases over time for companies with Daily Management Process.
To successfully sustain any improvement or revitalization program, you need to “stay
the course” and the Daily Management system helps to make that happen. There are few
naturally born and dynamic leaders who can drive the transformation. The Daily
Management system provides guidance so that the average manager can perform well in
engaging the hearts and minds of all of the front-line workers.
REFERENCES
[1] Dennis C. Edwards, Total Asset Productivity Services, Inc. Performance Improvement
by “People Pulling Together, Striving for Excellence” Proceedings of IMECE2006
2006 ASME International Mechanical Engineering Congress and Exposition
November 5-10, 2006, Chicago, Illinois, US
[2] Akao, Yoji ed. 1991. Hoshin Kanri: Policy Deployment for Successful TQM.
Productivity Press Inc.
[3] AT&T. 1989. Process Quality Management and Improvement Guidelines.
[4] Fly, John, Vice-President of Internal Planning. 1994. Milliken Internal Document.
[5] Gillespie, Edward. January 28, 2002. Private communication.
[6] Harry, Mikel and Richard Schroeder. 2000. Six Sigma: The Breakthrough
Management Strategy Revolutionizing the World’s Top Corporations. New York:
Doubleday.
[7] Herman, John T. 1989. “Capability Index-Enough for Process Industries?” 1989
ASQC Quality Congress Transactions.
[8] Koura, Kozo. 1991. Hoshin Kanri. Cambridge, MA: Productivity Press, Inc.
[9] Matsushita, Konosuke. 1988. Talk to American Businessmen in Osaka, Japan.
[10] Petrovich, Michael. 1998. “Performance Analysis for Process Improvement” 1998
ASQ Congress Proceedings, Philadelphia, PA.
[11] Reichheld, Frederick F., and W. Earl Sasser, Jr. 1990. “Zero Defections: Quality
Comes to Customer Service.” Harvard Business Review (September/October): 105-
111.
[12] Suzaki, Kiyoshi. 1993. New Shop Floor Management: Empowering People for
Continuous Improvements, New York: Free Press.
[13] Welch, Cas and Pete Geissler. 1995. Applying Total Quality to Sales. Milwaukee:
ASQ Quality Press.
[14] Wheeler, Donald. 2000. Understanding Variation: The Key to Managing Chaos,
Second Edition. SPC Press.