3q14 rockwall isd ppt growth committee - wordpress.com
TRANSCRIPT

Learn from Yesterday…
Understand Today…
Plan for Tomorrow
Rockwall
Independent
School
District
Quarterly Report
3Q14
0.0%
0.5%
1.0%
1.5%
2.0%
2.5%
3.0%
3.5%
4.0%
4.5%
Houston Austin Dallas - FortWorth
San Jose Miami SanAntonio
New YorkCity
Los Angeles
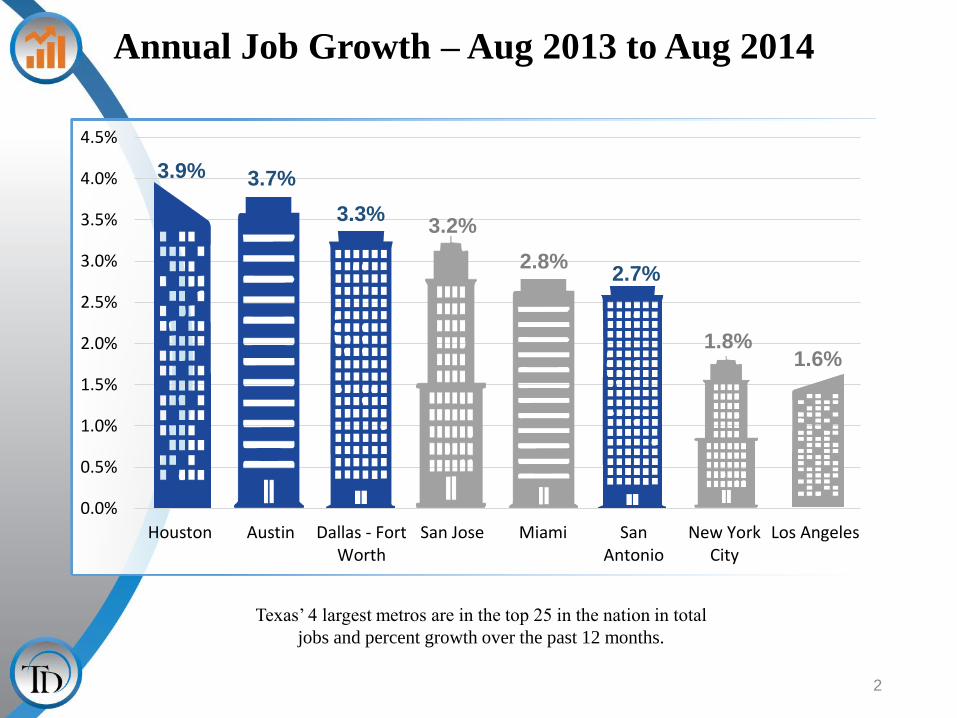
3.9%
Annual Job Growth – Aug 2013 to Aug 2014
2
Texas’ 4 largest metros are in the top 25 in the nation in total
jobs and percent growth over the past 12 months.
2.8%
3.7%
3.2% 3.3%
2.7%
1.6% 1.8%

Texas Enrollment Trends
3
2013 State Enrollment
Total Enrollment 5,151,925
Total Growth 76,085
120,145
73,685
78,644
78,078
98,273
85,773
64,962
77,261
76,085
0
20,000
40,000
60,000
80,000
100,000
120,000
140,000 Enrollment Change
4,399,019 4,519,164
4,592,849 4,671,493
4,749,571 4,847,844
4,933,617 4,998,579
5,075,840
5,151,925
4,000,000
4,200,000
4,400,000
4,600,000
4,800,000
5,000,000
5,200,000
5,400,000Total Enrollment

Region 10 Enrollment Trends
4
Rank District 2008/09
Enrollment 2013/14
Enrollment 5-YEAR Change (08/09-13/14)
1 Frisco ISD 30,797 46,053 15,256
2 Richardson ISD 34,407 38,283 3,876
3 Prosper ISD 3,125 6,413 3,288
4 Mesquite ISD 37,030 39,909 2,879
5 Allen ISD 17,590 20,382 2,792
6 Wylie ISD (Collin) 11,349 13,726 2,377
7 Dallas ISD 157,352 159,713 2,361
8 Irving ISD 33,131 35,328 2,197
9 Grand Prairie ISD 25,996 27,740 1,744
10 Coppell ISD 9,948 11,364 1,416
11 Forney ISD 7,438 8,648 1,210
12 Waxahachie ISD 6,646 7,814 1,168
13 McKinney ISD 23,401 24,565 1,164
14 Rockwall ISD 13,497 14,626 1,129
15 Lovejoy ISD 2,873 3,739 866
16 Princeton ISD 2,769 3,623 854
17 Lancaster ISD 5,995 6,820 825
18 Highland Park ISD (Dallas) 6,331 7,037 706
19 Royse City ISD 4,323 5,015 692
20 Melissa ISD 1,257 1,895 638

Existing Home Inventory (3.0 Month’s Supply)
-9%
Rockwall County Housing Market Year Over Year Comparisons
2%
4%
8%
5%
-8%
YTD Sales (1,607 YTD Sales Sept. 2014)
Number of Listings (2,195 Sept. 2014)
Average Price ($250,593 Sept. 2014)
Median Price ($215,000 Sept. 2014)
Days on the Market (57 Days)
5

DFW New Home Ranking Report
6
ISD Ranked by Annual Closings – 3Q14
Rank District Name Annual Starts Annual Closings VDL Future
1 Frisco ISD 2,660 2,756 4,256 7,291
2 Denton ISD 1,695 1,532 2,264 15,332
3 Northwest ISD 1,259 1,301 1,528 21,977
4 Prosper ISD 1,200 1,060 2,084 19,559
5 Keller ISD 1,028 935 1,415 3,186
6 Dallas ISD 926 918 2,070 7,357
7 Lewisville ISD 943 828 1,801 3,992
8 Eagle Mtn. - Saginaw ISD 806 817 1,380 21,114
9 McKinney ISD 588 617 1,294 6,813
10 Rockwall ISD 671 606 1,810 7,738
11 Mansfield ISD 560 591 841 4,749
12 Allen ISD 628 589 697 1,271
13 Forney ISD 542 515 959 11,518
14 Little Elm ISD 598 504 1,078 5,772
15 Burleson ISD 405 431 578 4,029
16 Plano ISD 419 397 878 1,649
17 Crowley ISD 443 383 1,460 8,616
18 Wylie ISD 390 381 635 4,813
19 Midlothian ISD 401 364 875 15,589
20 Garland ISD 427 333 629 4,153

New Housing Activity
• 2Q starts are over 200 units for the first time, a 24% rise from 3Q13
• Closings could near 600 units by the end of 2014
• Inventory remains in a good position to sustain the current closing rate 7
Rockwall ISD
0
50
100
150
200
250
300
350
400
450
Starts Closings Housing Inventory
Starts 2010 2011 2012 2013 2014 Closings 2010 2011 2012 2013 2014
1Q 86 68 83 117 129 1Q 56 65 72 100 142
2Q 69 77 95 137 194 2Q 89 72 101 100 140
3Q 85 63 140 170 211 3Q 84 70 90 154 174
4Q 54 87 134 137 4Q 80 79 87 150
Total 294 295 452 561 534 Total 309 286 350 504 456
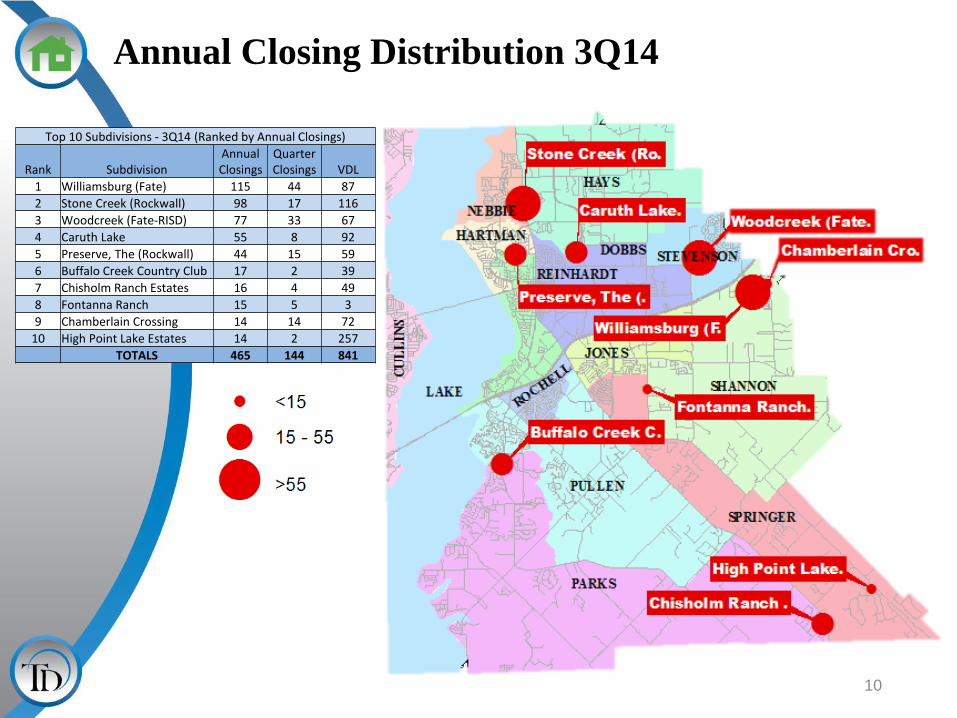
Annual Closing Distribution 3Q14
10
Top 10 Subdivisions - 3Q14 (Ranked by Annual Closings)
Rank Subdivision Annual Closings
Quarter Closings VDL
1 Williamsburg (Fate) 115 44 87
2 Stone Creek (Rockwall) 98 17 116
3 Woodcreek (Fate-RISD) 77 33 67
4 Caruth Lake 55 8 92
5 Preserve, The (Rockwall) 44 15 59
6 Buffalo Creek Country Club 17 2 39
7 Chisholm Ranch Estates 16 4 49
8 Fontanna Ranch 15 5 3
9 Chamberlain Crossing 14 14 72
10 High Point Lake Estates 14 2 257
TOTALS 465 144 841
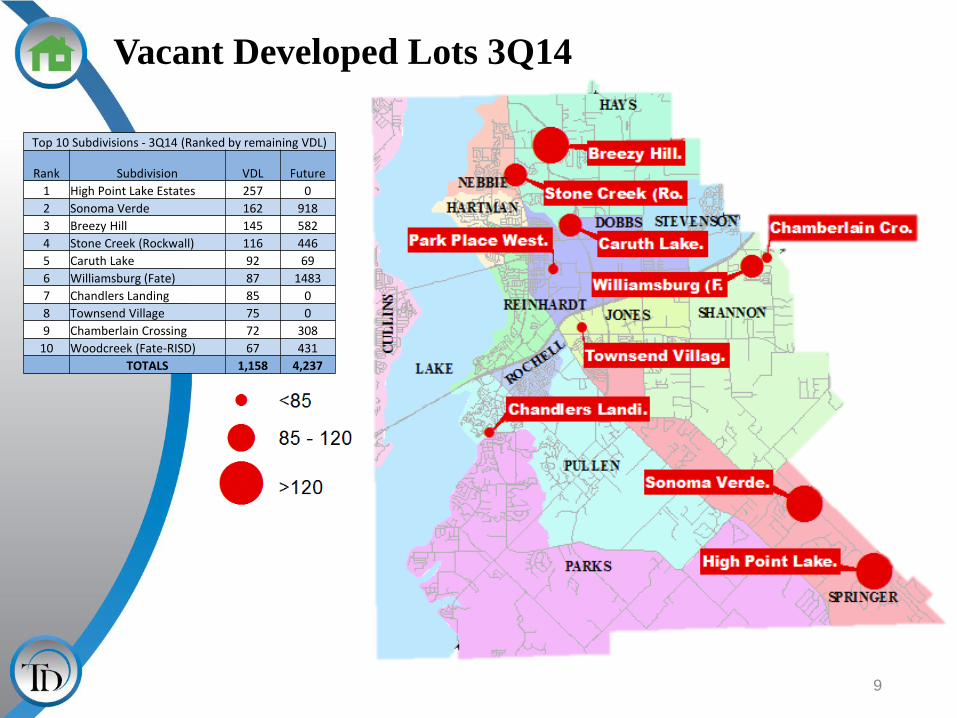
Vacant Developed Lots 3Q14
9
Top 10 Subdivisions - 3Q14 (Ranked by remaining VDL)
Rank Subdivision VDL Future
1 High Point Lake Estates 257 0
2 Sonoma Verde 162 918
3 Breezy Hill 145 582
4 Stone Creek (Rockwall) 116 446
5 Caruth Lake 92 69
6 Williamsburg (Fate) 87 1483
7 Chandlers Landing 85 0
8 Townsend Village 75 0
9 Chamberlain Crossing 72 308
10 Woodcreek (Fate-RISD) 67 431
TOTALS 1,158 4,237

Future Lots 3Q14
10
Top 10 Subdivisions - 3Q14 (Ranked by Future Inventory)
Rank Subdivision VDL Future
1 Williamsburg (Fate) 87 1483
2 Heath Golf & Yacht Club 0 1120
3 Sonoma Verde 162 918
4 Breezy Hill 145 582
5 Stone Creek (Rockwall) 116 446
6 Woodcreek (Fate-RISD) 67 431
7 Highlands, The (Rockwall) 0 399
8 Chamberlain Crossing 72 308
9 Lakes of Somerset (Rockwall) 0 276
10 Heath Golf & Yacht Club Villas TH 0 244
TOTALS 649 6,207

Overall Housing Data By Elementary Attendance Zone
Highest activity in the category
Second highest activity in the category
Third highest activity in the category
11
Elementary Zone Annual Starts Quarterly
Starts Annual Closings
Quarterly Closings Inventory VDL Futures
CULLINS ELEMENTARY 25 3 22 4 19 56 0
DOBBS ELEMENTARY 3 3 1 0 3 76 6
HARTMAN ELEMENTARY 39 9 44 15 23 59 285
HAYS ELEMENTARY 162 59 166 28 104 354 1268
JONES ELEMENTARY 2 2 0 0 2 75 141
NEBBIE ELEMENTARY 0 0 0 0 0 0 0
PARKS ELEMENTARY 90 39 76 20 66 265 1782
REINHARDT ELEMENTARY 10 6 4 0 10 30 62
ROCHELL ELEMENTARY 10 4 8 2 6 2 5
SHANNON ELEMENTARY 166 35 155 64 82 181 2289
SMITH PULLEN ELEMENTARY 30 8 24 3 18 118 237
SPRINGER ELEMENTARY 56 28 29 5 48 527 1232
STEVENSON ELEMENTARY 78 15 77 33 21 67 431
TOTALS 671 211 606 174 402 1,810 7,738

Ten Year Forecast By Grade Level
*Yellow box = largest grade per year *Green box = second largest grade per year
12
• Rockwall ISD will have more than 15,000 students by next fall
• 5 year growth = 1,526 students
• 2019/20 enrollment = 16,469
• 10 year growth = 3,490 students
• 2023/24 enrollment = 18,433
Year (Oct.) EE/PK K 1st 2nd 3rd 4th 5th 6th 7th 8th 9th 10th 11th 12th Total Total
Growth % Growth
2010/11 382 1,022 1,035 996 1,048 1,080 1,050 1,104 1,045 1,122 1,195 1,028 1,049 916 14,072
2011/12 397 937 1,053 1,060 1,003 1,079 1,115 1,086 1,147 1,091 1,227 1,106 998 1,031 14,330 258 1.8%
2012/13 392 950 1,003 1,083 1,093 1,057 1,124 1,161 1,148 1,177 1,179 1,135 1,050 934 14,486 156 1.1%
2013/14 390 925 1,014 1,033 1,127 1,135 1,081 1,159 1,195 1,189 1,251 1,081 1,061 1,006 14,647 161 1.1%
2014/15 452 976 942 1,051 1,067 1,158 1,180 1,104 1,204 1,216 1,276 1,216 1,070 1,031 14,943 296 2.0%
2015/16 452 1,017 1,044 974 1,085 1,091 1,180 1,215 1,159 1,246 1,310 1,217 1,191 1,033 15,215 272 1.8%
2016/17 452 1,050 1,075 1,088 1,009 1,119 1,125 1,215 1,283 1,206 1,342 1,249 1,199 1,155 15,568 353 2.3%
2017/18 452 1,078 1,117 1,114 1,125 1,040 1,153 1,165 1,280 1,324 1,300 1,287 1,232 1,158 15,824 255 1.6%
2018/19 452 1,097 1,150 1,156 1,152 1,167 1,067 1,192 1,243 1,331 1,427 1,247 1,266 1,194 16,141 318 2.0%
2019/20 452 1,127 1,161 1,189 1,194 1,195 1,201 1,106 1,273 1,317 1,434 1,369 1,229 1,223 16,469 328 2.0%
2020/21 452 1,138 1,199 1,198 1,226 1,236 1,224 1,243 1,191 1,338 1,452 1,405 1,349 1,187 16,838 369 2.2%
2021/22 452 1,167 1,215 1,247 1,240 1,274 1,270 1,268 1,342 1,250 1,482 1,403 1,384 1,283 17,278 439 2.6%
2022/23 452 1,193 1,241 1,259 1,294 1,285 1,303 1,314 1,348 1,401 1,384 1,436 1,383 1,317 17,610 332 1.9%
2023/24 452 1,222 1,272 1,286 1,301 1,337 1,323 1,349 1,412 1,412 1,551 1,343 1,416 1,330 18,006 397 2.3%
2024/25 452 1,256 1,305 1,320 1,331 1,346 1,377 1,371 1,448 1,479 1,563 1,502 1,322 1,361 18,433 426 2.4%

Ten Year Forecast By Elementary Campus
13
• Celia Hays Elementary may reach 600 students by the fall of 2016, this is a
21.5% increase from current enrollment
• Ouida Springer Elementary may reach 700 students by the fall of 2016
• By 2019, four elementary schools in Rockwall ISD may exceed stated capacity
HISTORY Current ENROLLMENT PROJECTIONS
Campus Capacity 2013/14 2014/15 2015/16 2016/17 2017/18 2018/19 2019/20 2020/21 2021/22 2022/23 2023/24 2024/25
AMANDA ROCHELL ELEMENTARY 725 599 571 575 561 550 553 568 572 577 585 595 606
AMY PARKS-HEATH ELEMENTARY 750 738 783 779 778 795 813 836 873 891 918 943 970
CELIA HAYS ELEMENTARY 765 435 506 569 615 663 707 753 798 839 881 922 966
CULLINS-LAKE POINTE ELEM 1,000 773 752 745 739 729 721 712 734 738 742 737 735
DORTHY SMITH-PULLEN ELEM 750 598 607 610 615 603 609 611 596 601 620 630 641
DORRIS JONES ELEMENTARY 750 627 606 600 592 572 580 574 582 602 611 622 629
GRACE HARTMAN ELEMENTARY 750 660 609 589 564 561 563 557 597 618 624 631 635
HOWARD DOBBS ELEM 650 605 607 602 620 633 646 667 669 681 690 702 720
NEBBIE WILLIAMS ELEM 750 600 569 574 555 554 551 556 572 589 606 621 641
OUIDA SPRINGER ELEMENTARY 750 639 659 685 701 724 738 755 770 777 788 804 820
SHARON SHANNON ELEMENTARY 765 601 580 611 639 684 725 777 837 891 941 991 1,042
VIRGINIA REINHARDT ELEM 600 556 560 565 568 561 572 566 583 585 589 592 596
BILLIE STEVENSON ELEMENTARY 765 433 521 555 587 614 655 692 733 745 746 752 757
ELEMENTARY TOTALS 7,864 7,930 8,059 8,134 8,243 8,433 8,624 8,916 9,134 9,341 9,542 9,758
Elementary Percent Change 0.01% 0.84% 1.63% 0.93% 1.33% 2.31% 2.27% 3.38% 2.44% 2.27% 2.16% 2.26%
Elementary Absolute Change 1 66 129 75 108 191 191 292 217 207 202 215
*Yellow box = exceeds stated capacity

Ten Year Forecast By Middle and High School Campus
14
• Herman Utley Middle School may have more than 800 students by
the fall of 2016, a 21.6% increase from current enrollment
• Rockwall High School may reach more than 2,500 students by the fall
of 2016, and 2,600 by the fall of 2018
• Rockwall-Heath High School may reach 2,400 students by 2017, a
9% increase from current enrollment
HISTORY Current ENROLLMENT PROJECTIONS
Campus Capacity 2013/14 2014/15 2015/16 2016/17 2017/18 2018/19 2019/20 2020/21 2021/22 2022/23 2023/24 2024/25
HERMAN UTLEY MIDDLE SCHOOL 1,125 702 669 710 814 876 890 877 876 915 979 1,021 1,063
J W WILLIAMS MIDDLE SCHOOL 1,050 770 810 785 780 807 789 841 751 722 820 864 897
MAURINE CAIN MIDDLE SCHOOL 1,050 912 941 910 895 921 895 872 902 955 950 939 967
MIDDLE SCHOOL TOTALS 2,384 2,420 2,405 2,489 2,604 2,574 2,590 2,529 2,592 2,749 2,824 2,927
Middle School Percent Change 2.54% 1.51% -0.62% 3.49% 4.62% -1.15% 0.62% -2.36% 2.49% 6.06% 2.73% 3.65%
Middle School Absolute Change 59 36 15 84 115 -30 16 61 63 157 75 103
ROCKWALL HIGH SCHOOL 2,650 2,284 2,335 2,426 2,527 2,519 2,653 2,736 2,862 3,002 2,939 3,000 3,051
ROCKWALL-HEATH HIGH SCHOOL 2,650 2,076 2,206 2,273 2,366 2,406 2,429 2,467 2,479 2,498 2,529 2,588 2,645
ROCKWALL ALTERNATIVE H S 39 52 52 52 52 52 52 52 52 52 52 52
HIGH SCHOOL TOTALS 4,399 4,593 4,751 4,945 4,977 5,134 5,255 5,393 5,552 5,520 5,640 5,748
High School Percent Change 2.35% 4.41% 3.44% 4.08% 0.65% 3.15% 2.36% 2.63% 2.95% -0.58% 2.17% 1.91%
High School Absolute Change 101 194 158 194 32 157 121 138 159 -32 120 108
DISTRICT TOTALS 14,647 14,943 15,215 15,568 15,824 16,141 16,469 16,838 17,278 17,610 18,006 18,433
District Percent Change 1.11% 2.02% 1.82% 2.32% 1.64% 2.01% 2.03% 2.24% 2.61% 1.92% 2.25% 2.37%
District Absolute Change 161 296 272 353 255 318 328 369 439 332 397 426
*Yellow box = exceeds stated capacity

Summary
• Texas economy continues to be the strongest state economy in
the country.
• DFW will continue to be a leader in job and population growth
due to the strong housing market and its diverse economy.
• Third quarter starts reached more than 200 units for the first
time, representing a 34% increase from 3Q13.
• RISD can expect an increase of approximately 1,500 students
during the next 5 years.
• 2019/20 enrollment projection: 16,469
• RISD is projected to enroll more than 18,400 students for the
2024/25 school year.
25