3d modeling of the santa terezinha coalfield, brazil
TRANSCRIPT
Int. Assoc. for Mathematical Geology XIth International Congress Université de Liège - Belgium
Liège – September, 3rd - 8th 2006 S14-05
3D Modeling of the Santa Terezinha Coalfield, Brazil -
implications for estimation of the CBM potential
H. Burger, R. Prissang1, M. Holz and W. Kalkreuth2
1 Institut für Geologische Wissenschaften, FU Berlin, Germany 2 Instituto de Geociências, UFRGS, Porto Alegre, RS, Brazil
Corresponding author: [email protected]
ABSTRACT : Authors Coalbed methane (CBM) is becoming an alternative energy source in the United States and Canada and exploration activities are increasing in other countries which contain abundant coal resources. This paper presents a study about the geologic characteristics of the Terezinha coalfield in Rio Grande do Sul state, Brazil with respect to the estimation of its CBM potential and it describes the procedure for allocating a test well. The most important controls for the coalbed methane potential in coal fields are a) basin geology, i.e. reservoir size, depth and thickness of coal seams; b) coal characteristics, i.e. coal rank, coal type and coal grade; c) in-situ methane content, measured by means of gas desorption tests and isotherm adsorption tests. The geometric modeling of the Terezinha coalfield was made possible due to conventional analysis of borehole data and a detailed study of the sequence stratigraphy. The combination of geometrical 3D-modeling and coal property modeling is the basis for estimating the CBM potential of the Terezinha coal field. Modeling of the depositional environment, tectonic events and basaltic intrusions is necessary for selecting an optimal location of a test well for analyzing the in-situ gas content. The idea for this work is to locate a drillhole in a rather homogeneous neighborhood of an existing borehole which has a high CBM potential. This paper describes first the iterative process of creating a sound geometrical model of the Santa Terezinha Basin using hard data from drillholes and soft information derived from a model of the depositional environment and in the Early Permian the tectonic setting during the development of the basin. In a second step GIS methods are used for selecting favorable boreholes which fit well known favorability criteria.
KEYWORDS : Coalbed methane, CBM, 3D modeling.
1. Introduction
The geometrical 3D-model of the Terezinha coal field is focused on a set of coal seams hosted in a succession of sandstones, mudstones, and shales of Early Permian age. Sequence stratigraphy was applied in order to subdivide this succession and to correlate the coal seams. Six coal bearing parasequences (PS1 to PS6) have been identified showing a cumulative coal thickness up to 10 m. The evaluation of the sequence stratigraphic records enabled us to iden-
Int. Assoc. for Mathematical Geology XIth International Congress Université de Liège - Belgium
Liège – September, 3rd - 8th 2006 S14-05
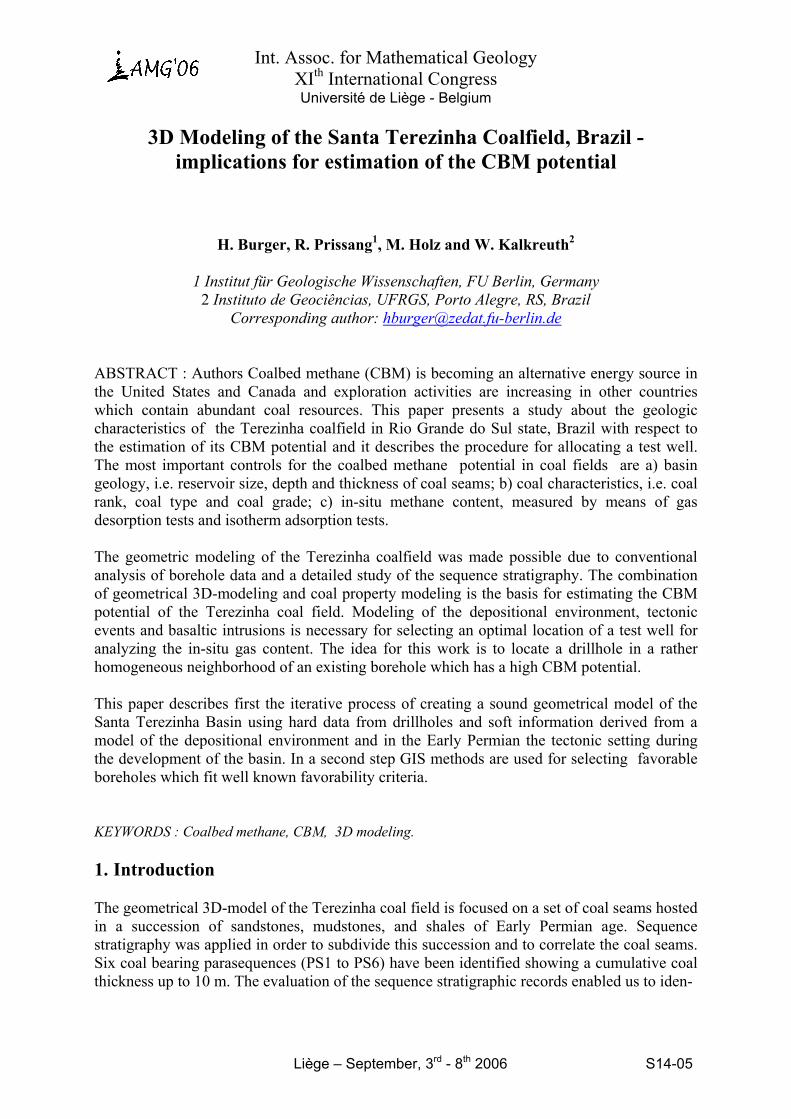
tify the location of faults belonging to two different fault systems. The combination of logs from a rather small number of boreholes and information from paleogeography and sequence stratigraphy provide a powerful tool for the construction of a consistent 3D-model of the coal basin. Assessment of coal rank is based on vitrinite reflectance measurements of 120 coal samples obtained from 27 borehole locations in the Santa Terezinha Coalfield (Fig. 1) in Rio Grande do Sul state (Brazil). The reflectance values indicate sub-bituminous to high volatile A bituminous coals. Locally, basalt intrusions have altered the rank of the coal seams to anthracite. Methane adsorption tests carried out in a number of coal seams indicate a general capacity of 2 - 6 m3/ton of coal. This result corresponds to those methane values calculated on the basis of empirical considerations including coal rank, ash yields and depth. In an earlier paper we have described the calculation of the CBM reserves based on the statistical evaluation of the cumulative thicknesses of the coal seams and the preliminary 3D model (Burger et al., 2003).
Fig. 1. Location map
2. Why do we need a 3D model
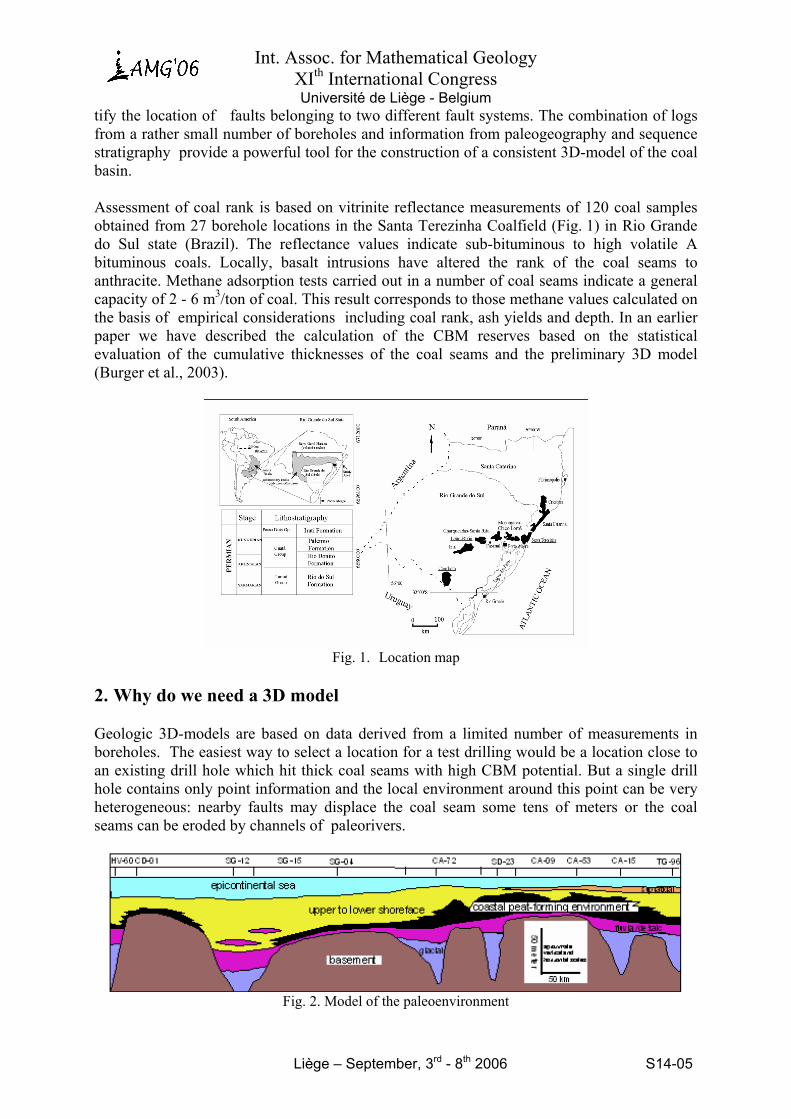
Geologic 3D-models are based on data derived from a limited number of measurements in boreholes. The easiest way to select a location for a test drilling would be a location close to an existing drill hole which hit thick coal seams with high CBM potential. But a single drill hole contains only point information and the local environment around this point can be very heterogeneous: nearby faults may displace the coal seam some tens of meters or the coal seams can be eroded by channels of paleorivers.
Fig. 2. Model of the paleoenvironment
Int. Assoc. for Mathematical Geology XIth International Congress Université de Liège - Belgium
Liège – September, 3rd - 8th 2006 S14-05
Therefore it is necessary to analyze the local environment with respect to faults, paleo-topography and erosional features which may have hindered the developments of peat or may have distorted the original coal seams. It is the goal of the 3D modeling process to delineate rather homogeneous areas within the coal deposit which can be used for drilling a test hole. A model of the depositional environment of the coal seams in the Terezinha basin is shown in Fig. 2.
3. The modeling process
All information necessary for the geometric modeling process is derived from the borehole data:
- depth of basement - depth and order of parasequences within boreholes - lateral extent of parasequences - depth and thickness of coal seams
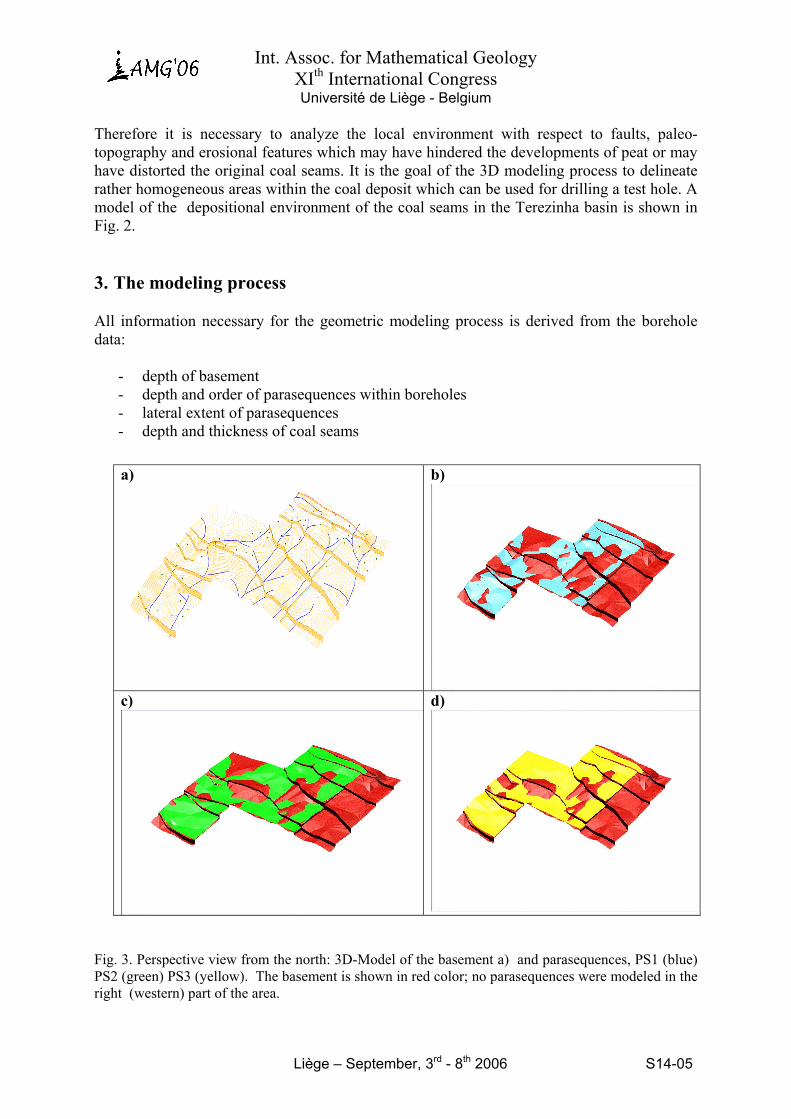
Fig. 3. Perspective view from the north: 3D-Model of the basement a) and parasequences, PS1 (blue) PS2 (green) PS3 (yellow). The basement is shown in red color; no parasequences were modeled in the right (western) part of the area.
a)
b)
c) d)
Int. Assoc. for Mathematical Geology XIth International Congress Université de Liège - Belgium
Liège – September, 3rd - 8th 2006 S14-05
Figure 3 shows the lateral extent of PS1 to PS3; the upper parasequences PS4, PS5 and PS6 cover the basement almost completely. Major coal seams are contained within parasequences PS3, PS4, and PS5. The estimation of the lateral extent of the coal seams is rather complicated and it must be based on detailed study of cross sections which reveal faults and topographic highs where only the upper parasequences have developed. The first and most important step of the modeling process is the construction of the basement topography and the paleo-drainagesystem (see Fig. 3a). The model shows two different fault systems with vertical displacements between 30 m and 250 m. In an iterative modeling process the sequence records were used to improve the basement topography. The main problem in this process is that differences in basement elevations between two adjacent drillholes may be caused by faults as well as by features of the paleotopography.
4. Optimal selection of drillholes and allocation of test well
Coal thickness, the number of coal seams, the extent of those seams define the volume of coal; their depth, coal rank, composition and water content determine their possible CBM content. In order to avoid the risk of drilling unpredictable coal seams we decided to select the neighborhood of an existing drillhole which has proved the existence of suitable coal; the 3D model serves as a tool which supports the decision if this neighborhood can be regarded as homogeneous. Therefore we defined a set of limiting factors and favorability criteria for selecting an optimal test site:
a) coal seams should exceed a total coal thickness of 4 m b) at least one coal seam in a drillhole should exceed a thickness of 0.5 m c) depth of coal seams should be in a range between 300 m and 800 m d) drillholes containing basaltic layers intercalated with coalseams should be excluded e) coal samples with vitrinite reflectance Rrandom > 1.5 indicate the influence of
basaltic intrusions. The neighborhood of these drillholes should be excluded. f) nearby faults should be avoided
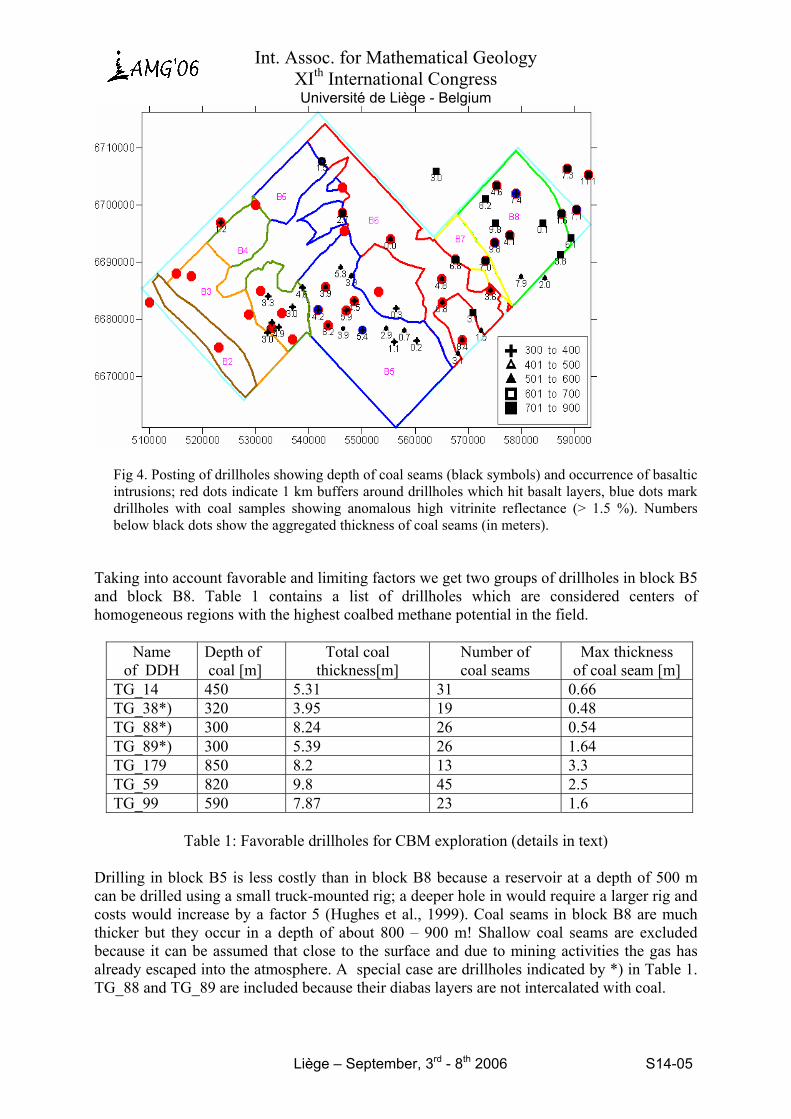
These criteria form a combination of hard data based upon core samples from drillholes and soft data derived from the 3D model of the coal basin. GIS methods were used to define buffers with a diameter of 1 kilometer along the faults and around drillholes which hit or indicate basalt intrusions (Fig. 4). These criteria as well as the size of the buffers may subject to discussion. There exist almost no experience with CBM exploration in Brazil and it is not possible to transfer favorability criteria for CBM from other countries.
Int. Assoc. for Mathematical Geology XIth International Congress Université de Liège - Belgium
Liège – September, 3rd - 8th 2006 S14-05
Fig 4. Posting of drillholes showing depth of coal seams (black symbols) and occurrence of basaltic intrusions; red dots indicate 1 km buffers around drillholes which hit basalt layers, blue dots mark drillholes with coal samples showing anomalous high vitrinite reflectance (> 1.5 %). Numbers below black dots show the aggregated thickness of coal seams (in meters).
Taking into account favorable and limiting factors we get two groups of drillholes in block B5 and block B8. Table 1 contains a list of drillholes which are considered centers of homogeneous regions with the highest coalbed methane potential in the field.
Name of DDH
Depth of coal [m]
Total coal thickness[m]
Number of coal seams
Max thickness of coal seam [m]
TG_14 450 5.31 31 0.66 TG_38*) 320 3.95 19 0.48 TG_88*) 300 8.24 26 0.54 TG_89*) 300 5.39 26 1.64 TG_179 850 8.2 13 3.3 TG_59 820 9.8 45 2.5 TG_99 590 7.87 23 1.6
Table 1: Favorable drillholes for CBM exploration (details in text)
Drilling in block B5 is less costly than in block B8 because a reservoir at a depth of 500 m can be drilled using a small truck-mounted rig; a deeper hole in would require a larger rig and costs would increase by a factor 5 (Hughes et al., 1999). Coal seams in block B8 are much thicker but they occur in a depth of about 800 – 900 m! Shallow coal seams are excluded because it can be assumed that close to the surface and due to mining activities the gas has already escaped into the atmosphere. A special case are drillholes indicated by *) in Table 1. TG_88 and TG_89 are included because their diabas layers are not intercalated with coal.
Int. Assoc. for Mathematical Geology XIth International Congress Université de Liège - Belgium
Liège – September, 3rd - 8th 2006 S14-05
Seam thickness in TG_38 is below 0.5 m but this hole is close to TG_88. In TG_89 the Rrandom values exceed 5.0 and the diabas layer is hit below the coal seams.
5. Conclusions
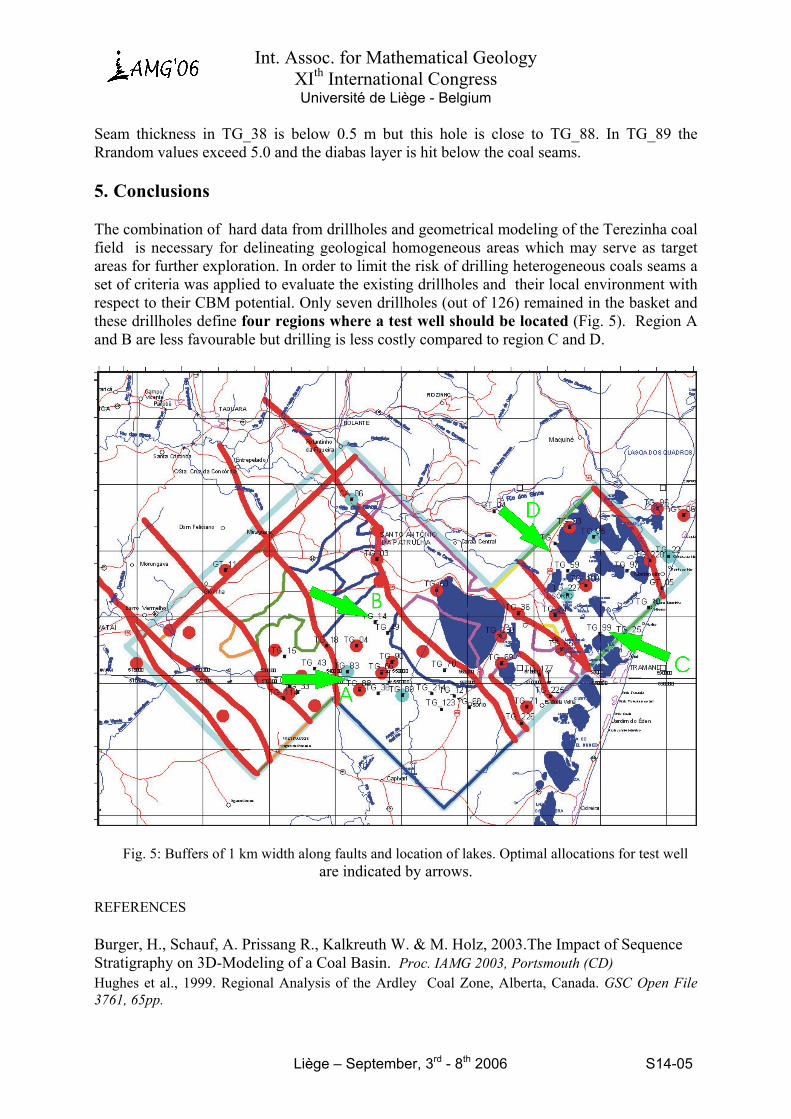
The combination of hard data from drillholes and geometrical modeling of the Terezinha coal field is necessary for delineating geological homogeneous areas which may serve as target areas for further exploration. In order to limit the risk of drilling heterogeneous coals seams a set of criteria was applied to evaluate the existing drillholes and their local environment with respect to their CBM potential. Only seven drillholes (out of 126) remained in the basket and these drillholes define four regions where a test well should be located (Fig. 5). Region A and B are less favourable but drilling is less costly compared to region C and D.
Fig. 5: Buffers of 1 km width along faults and location of lakes. Optimal allocations for test well are indicated by arrows.
REFERENCES Burger, H., Schauf, A. Prissang R., Kalkreuth W. & M. Holz, 2003.The Impact of Sequence Stratigraphy on 3D-Modeling of a Coal Basin. Proc. IAMG 2003, Portsmouth (CD) Hughes et al., 1999. Regional Analysis of the Ardley Coal Zone, Alberta, Canada. GSC Open File 3761, 65pp.