3209244 ho - scholarlypublications.universiteitleiden.nl
TRANSCRIPT

Cover Page
The handle https://hdl.handle.net/1887/3209244 holds various files of this Leiden University dissertation. Author: Willacey, C.C.W. Title: Developing metabolomics for a systems biology approach to understand Parkinson's disease Issue Date: 2021-09-08

29
Chapter 2
LC-MS/MS analysis of the central energy and
carbon metabolites in biological samples
following derivatization by
dimethylaminophenacyl bromide
Cornelius C W Willacey, Martijn Naaktgeboren, Edinson Lucumi Moreno,
Agnieszka B Wegrzyn, Daan Van der Es, Naama Karu, Ronan M T Fleming, Amy
C Harms, and Thomas Hankemeier
Journal of Chromatography A (2019)
Volume 1608, 20 December 2019, 460413

Chapter 2
30
2
Abstract
Recent advances in metabolomics have enabled larger proportions of the human
metabolome to be analyzed quantitatively. However, this usually requires the use of
several chromatographic methods coupled to mass spectrometry to cover the wide
range of polarity, acidity/basicity and concentration of metabolites. Chemical
derivatization allows in principle a wide coverage in a single method, as it affects
both the separation and the detection of metabolites: it increases retention, stabilizes
the analytes and improves the sensitivity of the analytes. The majority of quantitative
derivatization techniques for LC-MS in metabolomics react with amines, phenols and
thiols; however, there are unfortunately very few methods that can target carboxylic
acids at the same time, which contribute to a large proportion of the human
metabolome. Here, we describe a derivatization technique which simultaneously
labels carboxylic acids, thiols and amines using the reagent dimethylaminophenacyl
bromide (DmPABr). We further improve the quantitation by employing isotope-
coded derivatization (ICD), which uses internal standards derivatized with an
isotopically-labelled reagent (DmPABr-D6). We demonstrate the ability to measure
and quantify 64 central carbon and energy-related metabolites including amino
acids, N-acetylated amino acids, metabolites from the TCA cycle and pyruvate
metabolism, acylcarnitines and medium-/long-chain fatty acids. To demonstrate the
applicability of the analytical approach, we analyzed urine and SUIT-2 cells utilizing
a 15-minute single UPLC-MS/MS method in positive ionization mode. SUIT-2 cells
exposed to rotenone showed definitive changes in 28 out of the 64 metabolites,
including metabolites from all 7 classes mentioned. By realizing the full potential of
DmPABr to derivatize and quantify amines and thiols in addition to carboxylic acids,
we extended the coverage of the metabolome, producing a strong platform that can
be further applied to a variety of biological studies.

Absolute quantitative measurement of the energy metabolism
31
2
Background
Metabolomics, the younger sibling of genomics and proteomics, is a fast-evolving
field which has established itself as a promising approach for understanding
biological variations within a range of matrices in humans, animals, microbes and
plants1-8. The quantitative profiling of metabolites in biological samples is
challenging due to the vast number of metabolites, variation in physicochemical
properties and the wide range of concentrations in samples. All of these factors result
in large differences in the recovery, sensitivity and matrix interferences of these
metabolites when analyzed by various methods. Nevertheless, recent advances in
mass spectrometry have given scientists the ability to further understand the human
metabolome and focus more closely on selected pathway analysis. When we study
metabolic pathways, we experience the complexity as they can comprise of many
chemical conversions and are intertwined, making a targeted assay with coverage of
over 50 relevant metabolites highly beneficial for researchers in metabolism.
Mass spectrometry (MS) has the ability to identify and quantify the metabolome with
current methods reaching sensitivities down to picomolar concentrations, even
without any prior separation9. However, in the majority of cases, chromatography
prior to MS is used to better address the challenges introduced by ion suppression,
separation of isomers and in-source fragmentation. The three most common
separation techniques, LC, GC and CE, have provided robust methodologies to better
cover the human metabolome. Each of these techniques has been applied to
numerous types of metabolites, and each technique has tailored advantages for
specific types of metabolites. For example, UPLC-MS (RP & HILIC) provides coverage
for a large proportion of the metabolome with the advantages of high-throughput,
sensitivity, reliability and robustness10. Still, in LC-MS, metabolites can suffer from
limited sensitivity, or poor separation of particularly polar metabolites.
Quantification of metabolites with electrospray ionization (ESI)-MS can suffer from
ion suppression11. This interference can be corrected for by using coeluting
isotopically-labelled internal standards, which are of limited availability and
excessive costs.
Chapter 2
32
2
Methods have been developed to combat these problems using advanced separation
techniques and also chemical derivatization, which is the focus of this article.
Chemical derivatization can be used to increase the separation resolution, sensitivity
or to stabilize the metabolites, resulting in an increased metabolic coverage of MS-
based metabolomics methods. For instance, benzoyl chloride is used to derivatize
catecholamines and their metabolites to prevent oxidation and increase sensitivity
in LC-MS12. In a recent review, Higashi, Ogawa 13 summarise the current techniques
that are used for derivatization and conclude that isotope-coded derivatization (ICD)
has the ability to enhance quantification in LC-MS(/MS). ICD is the process of
labelling metabolites in a first sample with an unlabelled derivatization reagent and
then using an isotopically labelled reagent to derivatize the same metabolite
standards in a neat solution, i.e. pure solvent. This mixture, when added to the
sample, can act as the corresponding internal standard (IS) for all analytes of interest.
The benefit of this technique is the ability to introduce an isotopically labelled
equivalent for all metabolites regardless of chemical structure complexity, which
corrects for eventual ion suppression. Approaches such as ICD are important during
derivatization workflows to compensate for possible matrix effects as the native
matrix is altered due to derivatization. However, having an IS for each metabolite
provides a tool to adjust for matrix interferences independent of the starting
matrices. ICD can provide a cost-effective alternative when stable isotope IS are not
available while still enabling improved trueness and precision. In this way, the
derivatization reaction method is exploited in an additional manner next to
modifying the separation and ionization of metabolites.
Several studies have utilized a range of reagents, some taking advantage of the ICD
strategy to improve the quantitative performance12,14,15. Typical examples are
benzoyl chloride12,14 and dansyl chloride15 which both label amines, thiols, phenols
and some alcohols. Another reagent, dimethylaminophenacyl bromide (DmPABr),
has been applied previously to label carboxylic acid groups16. There were
inconsistent reports about the reactivity of DmPABr. Guo, Li 16 reported that DmPABr
reacts only with carboxylic acids (i.e., not amines and thiols), and in a follow-up study
Peng and Li acknowledged that it reacts also with nucleophiles at certain reaction
conditions17. However, to conform with the aims of their method, liquid-liquid
extraction (LLE) was applied to reduce the interference from amino acids and

Absolute quantitative measurement of the energy metabolism
33
2
derivatives, by excluding them altogether. The need for a reliable method that
combines labelling of the amine, thiol and carboxylic acid functional groups has been
highlighted by previous papers that have required two separate derivatization
methods (DmPABr and dansyl chloride) to achieve the same coverage18.
In the current paper, we expand the utilization of the reagent DmPABr to
simultaneously derivatize metabolites with carboxylic acid, amine and thiol
functional groups. We did not apply LLE, and analyzed amino acids, N-acetylated
amino acids, carnitines, and organic acids using LC-MS in positive ionization mode.
We have examined and optimised the reaction conditions to reliably and repeatably
derivatize a range of metabolites and analyze them in a single, highly sensitive
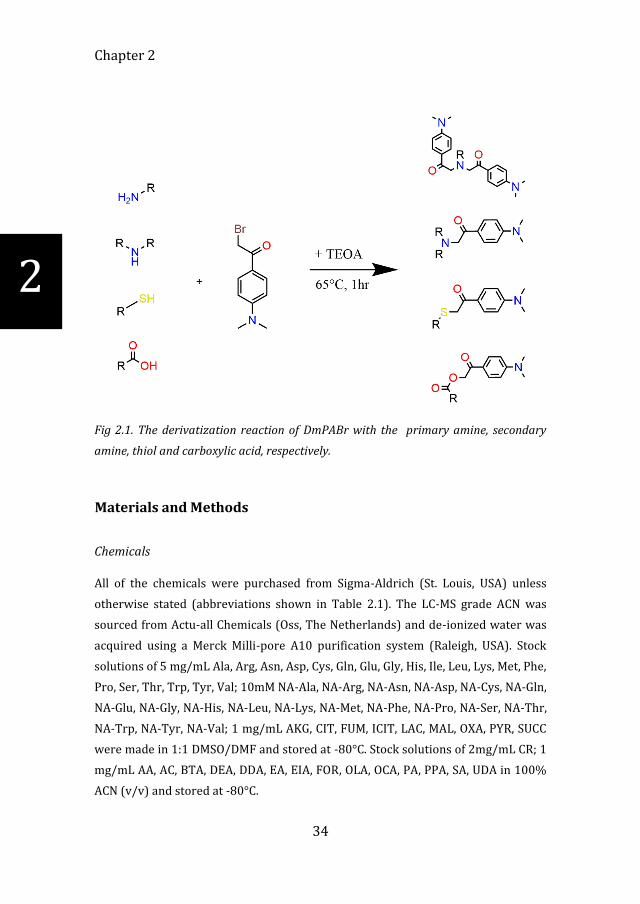
quantitative method. The reaction mechanism is identical to that of the reagent
phenacyl bromide with primary amines19, secondary amines20,21, thiols22,23 and
carboxylic acid-containing metabolites (derivatization example shown in Figure 2.1).
First, we made adaptations to the method published by Guo, Li 16,Peng, Li
17,Stanislaus, Guo, Li 24 to improve the metabolite coverage to include a wide range of
central carbon and energy-related metabolites. Then, we developed a targeted
quantitative UPLC-MS/MS method to allow for the sensitive analysis of these
metabolites in a single 10-minute analysis. The final applied method was successfully
validated for linearity, precision, limits of detection (LOD) and quantification (LOQ).
By applying this method to human urine and in vitro experiments using human
pancreatic cancer cells (SUIT-2), we could confirm the broad applicability of this
methodology and biological relevance for the scientific community.
Chapter 2
34
2
Fig 2.1. The derivatization reaction of DmPABr with the primary amine, secondary
amine, thiol and carboxylic acid, respectively.
Materials and Methods
Chemicals
All of the chemicals were purchased from Sigma-Aldrich (St. Louis, USA) unless
otherwise stated (abbreviations shown in Table 2.1). The LC-MS grade ACN was
sourced from Actu-all Chemicals (Oss, The Netherlands) and de-ionized water was
acquired using a Merck Milli-pore A10 purification system (Raleigh, USA). Stock
solutions of 5 mg/mL Ala, Arg, Asn, Asp, Cys, Gln, Glu, Gly, His, Ile, Leu, Lys, Met, Phe,
Pro, Ser, Thr, Trp, Tyr, Val; 10mM NA-Ala, NA-Arg, NA-Asn, NA-Asp, NA-Cys, NA-Gln,
NA-Glu, NA-Gly, NA-His, NA-Leu, NA-Lys, NA-Met, NA-Phe, NA-Pro, NA-Ser, NA-Thr,
NA-Trp, NA-Tyr, NA-Val; 1 mg/mL AKG, CIT, FUM, ICIT, LAC, MAL, OXA, PYR, SUCC
were made in 1:1 DMSO/DMF and stored at -80°C. Stock solutions of 2mg/mL CR; 1
mg/mL AA, AC, BTA, DEA, DDA, EA, EIA, FOR, OLA, OCA, PA, PPA, SA, UDA in 100%
ACN (v/v) and stored at -80°C.

Absolute quantitative measurement of the energy metabolism
35
2
Metabolite Abbreviation Metabolite Abbreviation
Alanine Ala
N-acetylmethionine NA-Met
Arginine Arg
N-acetylphenylalanine NA-Phe
Asparagine Asn
N-acetylproline NA-Pro
Aspartic acid Asp
N-acetylserine NA-Ser
Cysteine Cys
N-acetylthreonine NA-Thr
Glutamine Gln
N-acetyltryptophan NA-Trp
Glutamic acid Glu
N-acetyltyrosine NA-Tyr
Glycine Gly
N-acetylvaline NA-Val
Histidine His
Alpha-Ketoglutaric acid AKG
Isoleucine Ile
Citric acids CITS
Leucine Leu
Fumaric acid FUM
Lysine Lys
Lactic acid LAC
Methionine Met
Malic acid MAL
Phenylalanine Phe
Oxaloacetic acid OXA
Proline Pro
Pyruvic acid PYR
Serine Ser
Succinic acid SUCC
Threonine Thr
Acetylcarnitine AC
Tryptophan Trp
Decanoylcarnitine DC
Tyrosine Tyr
Hexanoylcarnitine HC
Valine Val
Lauroylcarnitine LC
N-acetylalanine NA-Ala
Myristoylcarnitine MC
N-acetylarginine NA-Arg
Octanoylcarnitine OC
N-acetylasparagine NA-Asn
Palmitoylcarnitine PC
N-acetylaspartic acid NA-Asp
Propionylcarnitine PPC
N-acetylcysteine NA-Cys
Stearoylcarnitine SC
N-acetylglutamine NA-Gln
Arachidonic acid AA
N-acetylglutamic acid NA-Glu
Capric acid DCA
N-acetylglycine NA-Gly
Caprylic acid OCA
N-acetylhistidine NA-His
Dodecanoic acid DDA
N-acetylisoleucine NA-Ile
Oleic acid OLA
N-acetylleucine NA-Leu
Undecanoic acid UDA
N-acetyllysine NA-Lys Creatinine CR
Table 2.1. List of the abbreviations for the metabolites analyzed in this method
Chapter 2
36
2
Derivatization reagent
The DmPABr reagent was purchased from BioConnect BV (Huissen, The
Netherlands) and the internal standard DmPABr was synthesised following the
published protocol by Guo, Li 16 using dimethyl sulphate-D6 instead of dimethyl
sulphate-13C2. The structure of the reagent was confirmed using nuclear magnetic
resonance (NMR). Also, with reference to the paper from Guo, Li 16, it is noted that
the stability of the metabolites after reaction with DmPABr lasts for up to 6 months
in a solution, and does not alter quantitative results24. The DmPABr reagent was
stored in ACN at -80°C to prevent the nucleophilic substitution reaction.
Method validation and biological application
Method optimization and validation
The following performance parameters were assessed on all 64 metabolites in
triplicate. Method optimization started with the selection of an appropriate alkaline
solution at a range of concentrations, comparing triethylamine (TEA at 0, 50, 100,
150, 250, 300, 500 and 750 mM) and triethanolamine (TEOA, at 0, 200, 400, 650, 700,
750, 800 and 1000 mM). The reaction time was assessed for the selected time points
0, 5, 15, 30, 45, 60, 90, 180 and 240 minutes using TEOA (750 mM) incubated for one
hour at 65°C. Due to the ability of water to react with the reagent acting as a
nucleophile the reaction was assessed in the presence of water at 0%, 20%, 40%,
60%, 80% and 100%. The final optimized method used 750 mM solution of TEOA for
derivatization at 65°C for one hour in a shaking incubator. The method was
characterised by a matrix-free 8-point calibration line, and by determining the carry-
over by a solvent injection blank after injecting the highest calibration level
(calibration point 7: supplementary material Table S6). The calibration experiment
was replicated (n=5). Matrix effect (ME) is defined as “the direct or indirect alteration
or interference in response due to the presence of unintended analytes (for analysis)
or other interfering substances in the sample”25. The ME was calculated as the area
of the internal standards in the neat solution against the area of the internal standard
in the presence of the matrix. The method was also assessed for linearity of the
calibration line (n=5) and LOD/LOQ. The LOD and LOQ were calculated using the
following equations according to the ICH Q2R1 guidelines – σ being standard
deviation of the signal in the blank injection:

Absolute quantitative measurement of the energy metabolism
37
2
LOD = (3.3 * σ) / slope
LOQ = (10 * σ) / slope
ME = (Internal standard in neat solution / internal standard in matrix) * 100
Urine validation samples
Urine from 10 healthy volunteers (aged 20-30) was collected and pooled and used
for method optimization and validation. A volume of 10 μL of urine was transferred
to an Eppendorf safe-lock vial (0.5 mL). The urine was dried in a Labconco SpeedVac
(MO, United States). The dried content was reconstituted in 10 μL of DMSO/DMF to
dissolve the remaining content. Then, 10 μL of triethanolamine (750 mM) was added
to the vial, followed by 10 μL of DmPABr (82 mM). The sealed Eppendorf vial was
placed into a shaking incubator for 60 minutes at 65°C to complete the derivatization.
A total of 10 μL of formic acid (30 mg/mL) was added to the vial to quench the
reaction with an additional 30 minutes in the shaking incubator. Then, 5 μL of
DmPABr-D6-labelled metabolites were then added (concentrations in supplementary
material Table S6). Before vortexing, 45 μL of ACN was also added to the vial. The
content was then transferred to an HPLC vial for analysis. The trueness and precision
of the method was generated by using a pooled sample of urine collected from
healthy urine donors. Samples were analyzed in repeated experiments on 3 separate
days in replicates each day (n=5). Using this data, RSD calculations were performed
to demonstrate the lack of variation in the derivatization conditions on separate days.
SUIT-2 oxidative stress analysis and validation
Human pancreatic cancer cells (SUIT-2) were cultured and placed into a 24-well
plate, each containing 1*106 cells in 0.4 mL of culture media. The SUIT-2 cells were
exposed to 1 nM, 10 nM and 100 nM of rotenone for 3, 8 and 24 hours (n=3). The cells
were washed with PBS and transferred into an Eppendrof tube. The aliquots were
centrifuged at 500 rpm to sediment the cells and the cell media was removed. To the
cells, cooled methanol (80% v/v) was added to the cells before probe sonification,
followed by centrifugation at 13,000 rpm to produce a protein precipitation; the
supernatant was transferred to an Eppendorf safe-lock vial (1.5 mL) without
disturbing the pellet. A volume equivalent to 2.5*105 cell supernatant was taken to
total dryness in a speed vacuum concentrator. The following were added to the vial
and vortexed between additions: 10 μL of DMSO/DMF (to first dissolve the dried

Chapter 2
38
2
content), 10 μL of triethanolamine (750 mM) And 10 μL of DmPABr (82 mM). The
sealed Eppendorf vial was placed into a shaking incubator for 60 minutes at 65°C to
complete the derivatization. A volume of 10 μL of formic acid (30 mg/mL) was added
to the vial to quench the reaction with an additional 30 minutes in the incubation.
Finally, 5 μL of DmPABr-D6-labelled metabolites were diluted in 45 μL of ACN and
added to the vial. The content was then transferred to an HPLC vial for analysis.
LC-MS/MS analysis
Samples were analyzed by LC-MS using a Waters Acquity UPLC Class II (Milford, USA)
coupled to an ABSciex QTrap 6500 series (Framingham, USA). The samples were run
using scheduled multi-reaction monitoring (MRM) in positive mode with selected
time windows. An injection of 1 μL was made per sample to minimise detector
saturation and maintain desirable peak shape. The analytical column used was a
Waters AccQ-tag C18 column (2.1mm x 100 mm, 1.8 μm, 180 Å), maintained at 60°C.
Mobile phase solvent A was 0.1% v/v formic acid and 10 mM ammonium formate in
water and mobile phase solvent B was 100% acetonitrile. Using the flow rate of 700
μL/min, the gradient profile is as follows: initial, 0.2% B; 1.5 min, 20% B; 4 min, 50%
B; 6 min, 90% B; 10 min, 99.8% B; 13 min, 99.8% B; 13.1 min, 0.2% B and 15 min,
0.2% B. The last 6 minutes allow for column washing and equilibration prior to the
next injection. The following parameters were used for the AB Sciex QTrap 6500
analysis (MRM transitions shown in Table S2 of the supplementary materials);
electrospray ionization was used in positive mode at 4.5 kV. The gas temperature
was 600°C. Automated peak integration was performed using AB Sciex MultiQuant
Workstation Quantitative Analysis for QTrap; all peaks were visually inspected to
ensure adequate integration.
Results & Discussion
Novel derivatization approach
DmPABr derivatization has been a successful method to support untargeted and
targeted metabolomics platforms using ICD for carboxylic acid-containing
metabolites. It was previously highlighted by Peng, Li 17 that DmPABr also reacts with
the amine group of asparagine and labels it twice (once on the acid and once on the
amine group), however the double labelled metabolite was reported to be the minor

Absolute quantitative measurement of the energy metabolism
39
2
peak compared to the single derivatized form. As demonstrated in this paper,
DmPABr can react with an amine group (once or twice) via a nucleophilic reaction in
a quantitative manner, which is useful for LC-MS analysis. In comparison to another
common reagent in LC-MS/MS, benzoyl chloride12,14, the reagent DmPABr offers a
more versatile and universal solution for derivatization. This reaction, however, is
slower and forms a more stable bond, as DmPABr has the ability to react next to the
amine group. It also reacts with carboxylic acids without forming an unstable
anhydride as the bromine is attached to a methyl group rather to the acyl group.
Therefore, we studied the ability of DmPABr to react with multiple functional groups
such as the amine, carboxy and thiol groups and to use it for the metabolomics
analysis of urine and cell samples.
Selection of metabolites and biological relevance
Utilizing the full capability of DmPABr allows us to extend from only derivatizing
carboxylic acids to also targeting amines and thiols which broadens the applicability
of the method significantly. To demonstrate this, we chose to measure central carbon
and energy-related metabolites related to mitochondrial dysfunction as it requires
the analysis of a broad range of chemically diverse metabolites. The key metabolites
in aerobic respiration that are imperative for mammalian survival, such as α-
ketoglutaric acid, citrates, succinic acid, fumaric acid, malic acid and oxaloacetic acid,
are frequently used references to determine changes in mitochondrial function and
cellular health in metabolomics studies in urine, plasma and in vitro models26. N-
acetylation has been known to increase during mitochondrial dysfunction due to the
elevation of acetyl-CoA. Therefore, N-acetylated amino acids reflect mitochondrial
dysfunction and energy metabolism, and in addition are highly relevant in urine as
they remove excess amino acids from the body27,28. Shifting of the energy balance
from aerobic respiration to anaerobic respiration can also be noted by measurement
of pyruvic acid and lactic acid which will both drastically increase 27. An additional
target group, acylcarnitines, was also selected, as it reflects energy processes,
particularly following beta-oxidation and when fatty acids are transported into the
mitochondria27,29. The last target group, fatty acids, is included to represent an
alternative energy source by the mitochondria when sugars are inaccessible or
depleted. Three common conditions that are often associated with mitochondrial

Chapter 2
40
2
dysfunction are Parkinson’s disease30, Leigh’s syndrome27 and diabetes31; all of which
hold extensive interest within the scientific community.
Optimization of reaction conditions
We investigated and optimised the method to analyze amines, thiols and carboxylic
acids to inform on central carbon and energy metabolism. We have found three key
factors that affect the derivatization of the functional groups mentioned above:
alkalinity of reaction solution, reaction time, and the presence of water during the
reaction. Figure 2.2A demonstrates that after 60 minutes the relative peak area did
not increase significantly anymore, with high performance parameters (indicated in
Table 2.2). This applied to all of the targeted functional groups: Ala (1° amine &
carboxylic acids), NA-Asp (carboxylic acids), NA-Cys (thiol & carboxylic acid), PYR
(α-keto acid) and AC (carboxylic acid). This derivatization time was considered
acceptable in terms of metabolic coverage. We have utilized similar inert base
catalysts as in previous articles published for DmPABr that target the carboxylic acid
function group, which utilized either 750 mM triethanolamine (TEOA) 16 or 200 mM
triethylamine (TEA) 24. Variations in response using these bases are depicted in
Figures 2.2B and 2.2C, leading to the selection of the appropriate conditions for
derivatization of amine and thiol groups. Additional experiments indicated that 750
mM of TEOA was the optimum condition for consistent derivatization of metabolites
in urine and cells (data not shown). TEOA (750 mM) also provided the most
consistent derivatization indicated by identical values over the concentration range
of 650 – 800 mM. TEOA was preferred because according to literature it causes less
ion suppression in mass spectrometers, than TEA at the concentration tested 32.

Absolute quantitative measurement of the energy metabolism
41
2
Figure 2.2. DmPABr reaction optimization shown for 5 metabolites (Ala – Blue; NA-Asp
– Red; NA-Cys – Green; PYR – Purple; AC – Orange; n=3 per condition) representing the
major classes selected in the method. (A) the effect of reaction time with 750 mM
triethanolamine; (B) use of TEA as base; (C) use of TEOA as base; and (D) the reaction
efficiency in the presence of water with 750mM triethanolamine. The data is presented
as peak area normalized to the highest peak area.
Chapter 2
42
2
Analyte LODs (nM) LOQs (nM) Fit (R2) RSD
(%) Carryover (%) Analyte LODs (nM) LOQs (nM) Fit (R2) RSD (%) Carryover (%)
Ala 44.8 134 0.9938 7.7 0.01 NA-Met 0.11 0.33 0.9867 4.4 0.003
Arg 10.3 30.8 0.9944 6 0.004 NA-Phe 0.27 0.82 0.9965 4.8 0.003
Asn 4.01 12 0.9965 3.5 0.01 NA-Pro 15.6 46.8 0.9969 12.5 0.05
Asp 11.4 34 0.9915 9.9 0.02 NA-Ser 5.55 16.6 0.9919 9.6 0.01
Cys 49.5 148.6 0.9834 6 0.01 NA-Thr 10.4 31.3 0.9987 3.7 0.01
Gln 18.5 55.5 0.9913 12.3 0.02 NA-Trp 2 6 0.9965 1.1 0.003
Glu 43.5 130.5 0.9941 2.1 0.01 NA-Tyr 0.12 0.37 0.9901 11.5 0.01
Gly 932.4 2797 0.9952 1.8 0.32 NA-Val 0.52 1.56 0.9932 13 0.002
His 379.4 1138 0.9956 4.1 0.01 AKG 29.7 89.1 0.9909 6.2 0.08
Ile 9.28 27.9 0.9956 7.9 0.01 CITS 1001 3003 0.9988 1.7 0.12
Leu 11.3 33.9 0.9942 7.5 0.01 FUM 69.5 208.5 0.9949 3.9 0.03
Lys 142.8 428.3 0.9959 6.3 0.02 LAC 2192 6578 0.9927 4 0.01
Met 4.33 13 0.9903 0.6 0.01 MAL 43.8 131.5 0.9979 1.6 0.01
Phe 25.6 76.9 0.9997 10.2 0.02 OXA 14 42 0.9950 1.7 0.02
Pro 22.1 66.4 0.9870 3.6 0.003 PYR 55.8 167.3 0.9926 2.4 0.004
Ser 506 1518 0.9917 3.3 0.01 SUCC 23.1 69.4 0.9997 3.8 0.02
Thr 47.6 142.8 0.9950 2.9 0.01 AC 0.36 1.09 0.9951 12.8 0.0001
Trp 5.33 16 0.9978 9 0.02 DC 0.3 0.91 0.9964 8 0.01
Tyr 6.87 20.6 0.9966 7 0.02 HC 0.61 1.82 0.9903 10.2 0.001
Val 11.7 35.6 0.9939 10.5 0.01 LC 0.9 2.7 0.9988 11.3 0.004
NA-Ala 4.21 12.6 0.9941 4.3 0.002 MC 0.5 1.5 0.9996 8.7 0.01
NA-Arg 0.16 0.47 0.9989 9.1 0.001 OC 1.32 3.98 0.9998 5.5 0.01
NA-Asn 0.27 0.81 0.9882 11 0.02 PC 0.91 2.72 0.9970 7.1 0.02
NA-Asp 4.32 13 0.9942 3 0.002 PPC 2.85 8.56 0.9985 8.5 0.0001
NA-Cys 34.5 103.4 0.9975 4.6 0.06 SC 0.25 0.75 0.9993 8.4 0.03
NA-Gln 0.94 2.83 0.9979 6.7 0.001 AA 4.45 13.4 0.9995 1 0.04
NA-Glu 3.65 10.9 0.9979 1.5 0.02 OCA 137 411 0.9992 4.2 0.02
NA-Gly 3.32 9.97 0.9971 4.5 0.001 DCA 104 314 0.9860 2.6 0.01
NA-His 0.16 0.48 0.9917 3.7 0.001 DDA 15.3 46 0.9912 4.5 0.01
NA-Ile 27.7 83 0.9961 1.1 0.001 OLA 185 555 0.9960 4.4 0.02
NA-Leu 30.4 91.2 0.9946 1.5 0.001 UDA 12.9 38.7 0.9985 4.2 0.008
NA-Lys 72.6 217 0.9912 4.9 0.028 CR 548.2 1644 0.9943 1.6 0.001

Absolute quantitative measurement of the energy metabolism
43
2
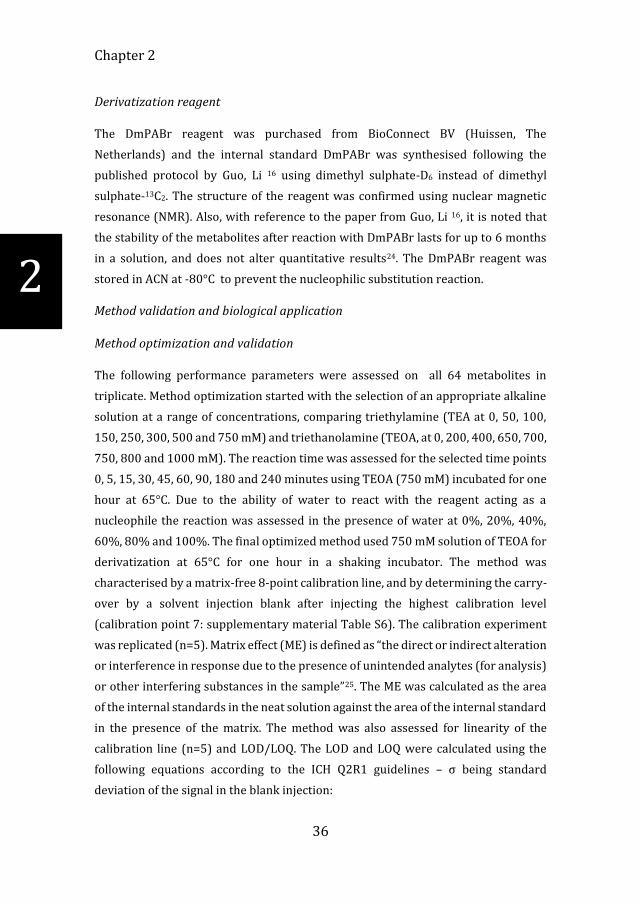
Table 2.2. Information relating to the carry-over, limit of detection (LOD), limit of
quantification (LOQ) and linearity of an 8-point calibration line in aqueous solution.
RSD was calculated using calibration point 4 (concentration shown in supplementary
Table S2).
Of the options for synthesized isotopically labelled DmPABr, D6 was used in place of
13C2 on the amine residue of DmPABr, as utilized for high-resolution MS by Guo, Li 16.
With this, we have been able to introduce a mass difference of 6 Da, which is
preferable for low-resolution MS compared to the previous addition of 2 Da, and less
costly. The mass difference of 2 Da with the internal standard DmPABr-13C2 provided
cross-talk interference in the triple-quadrupole MS with the metabolites labelled
once, such as long-chain fatty acids and N-acetylated amino acids. However, this was
not as detrimental to the metabolites labelled more than once (such as amino acids)
as a mass difference gain of 18 Da was observed for metabolites such as Ala (labelled
thrice) when using DmPABr-D6.
Other adaptations of the derivatization procedure were also evaluated, including the
total elimination of the aqueous content prior to derivatization with DmPABr to
improve reaction efficiency and decrease reaction variability. This was expected to
be needed to create a quantitative method, unlike the previous published method
that focused on identification. This variability and poor labelling efficiency may arise
from the ability of water to act as a nucleophile under basic conditions
(deprotonation). It has previously been noted that as little as 5% water content
during the derivatization reaction has the ability to reduce the labelling efficiency by
hydrolysing DmPABr [23]. It was also reported that the presence of water competes
with the metabolites to react with DmPABr as a nucleophile and thus hydrolysing the
reagent 33. We investigated whether a low percentage of water would interfere with
the labelling of the amine group. Figure 2.2D shows that the presence of 40% of water
did not significantly change the derivatization efficiency. This may be explained by
Stanislaus, Guo, Li 24, where the increase in DmPABr concentration from 20 mg/ml16
to 40 mg/ml (excess reagent) resulted in 2-fold higher rate of the Sn2 reaction,
ensuring completion of the reaction. The presence of water above 20% showed a
decline in derivatization efficiency and in the presence of 100% water, the reaction
is severely compromised. Therefore, we chose to conduct the reaction without the
Chapter 2
44
2
presence of water to avoid the complications due to possible hydrolysis of the
reagent.
Targeted LC-MS/MS method
The aims of the chromatographic method were to combine high-throughput analysis
with sensitive measurement of a wide range of chemical classes. After derivatization
with DmPABr, polar compounds which are hardly retained in RP could be retained
and separated, hence eliminating the need for HILIC separation. Moreover,
derivatization with DmPABr allows sensitive and universal analysis in positive
ionization mode, instead of in two ionization modes. By using DmPABr, we introduce
the tertiary amine group (Figure 2.3 that improves ionization hence enhances
signals. Further improvement in intensity of measured metabolites can be gained by
careful selection of MRMs. In Figure 2.4 A and B we illustrate that the metabolites
that are labelled on the carboxylic acid show common and prominent fragments of
180.0 Da or 134.1 Da. These product fragments are ideal when measuring
metabolites such as those involved in the TCA cycle as they lack nitrogen and are
difficult to analyze in positive ionization mode without labelling. For metabolites
which are labelled multiple times, such as amino acids, the fragments 180.0 Da and
134.1 Da are usually present (Fig. 2.4B) but are not selected as their signal is lower.
Instead, a higher mass product ion giving a better signal is often seen. This results
from derivatization twice on the amine group, and once on the acid moiety, yielding
more sensitive fragments like 319.2 Da and 366.2 Da observed for arginine & alanine
in Figure 2.4 C and 2.4 D, respectively. Having a common fragmentation pattern
reduces the specificity of metabolite species but with adequate chromatography, this
issue can be negated. Additionally, a qualifier transition can also be set which will
provide a unique fragmentation pattern to identify the specific metabolite but this
will provide a lower sensitivity due to more MS/MS events. For the complete method,
the labelling pattern and the chosen MRM transitions are detailed in supplementary
Table S2.

Absolute quantitative measurement of the energy metabolism
45
2
Figure 2.3. Demonstration of MS analysis of pyruvic acid: (A) in conventional negative
ionization mode, holding a negative charge on the oxygen (green circle); (B) following
DmPA labelling, producing a highly ionisable group (tertiary amine – red circle) and a
higher retention group (blue circle).
Figure 2.4. The common fragment formation of 180.0 Da & 134.1 Da: the product ion of
the derivatization label and metabolite-specific product ions.
Chapter 2
46
2
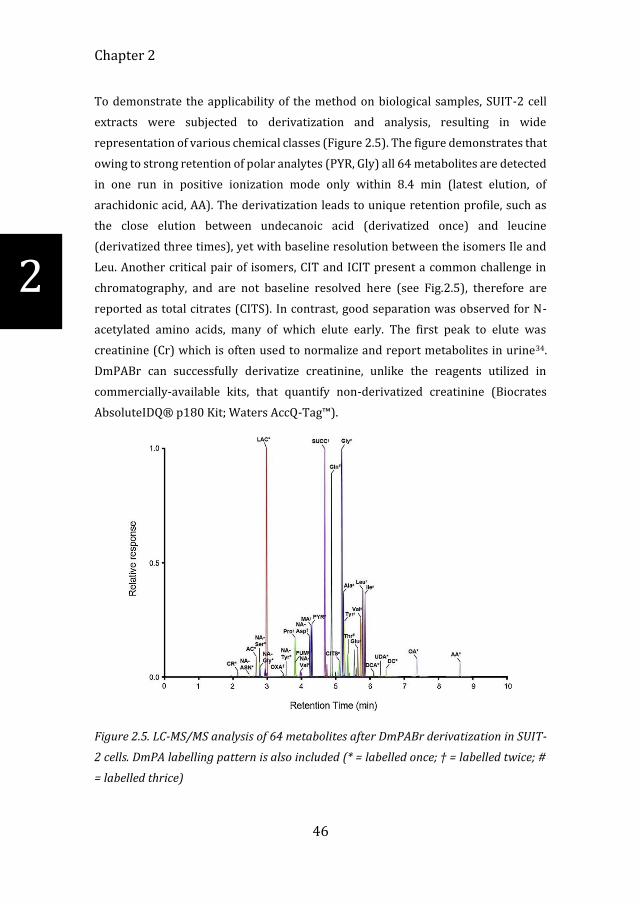
To demonstrate the applicability of the method on biological samples, SUIT-2 cell
extracts were subjected to derivatization and analysis, resulting in wide
representation of various chemical classes (Figure 2.5). The figure demonstrates that
owing to strong retention of polar analytes (PYR, Gly) all 64 metabolites are detected
in one run in positive ionization mode only within 8.4 min (latest elution, of
arachidonic acid, AA). The derivatization leads to unique retention profile, such as
the close elution between undecanoic acid (derivatized once) and leucine
(derivatized three times), yet with baseline resolution between the isomers Ile and
Leu. Another critical pair of isomers, CIT and ICIT present a common challenge in
chromatography, and are not baseline resolved here (see Fig.2.5), therefore are
reported as total citrates (CITS). In contrast, good separation was observed for N-
acetylated amino acids, many of which elute early. The first peak to elute was
creatinine (Cr) which is often used to normalize and report metabolites in urine34.
DmPABr can successfully derivatize creatinine, unlike the reagents utilized in
commercially-available kits, that quantify non-derivatized creatinine (Biocrates
AbsoluteIDQ® p180 Kit; Waters AccQ-Tag™).
Figure 2.5. LC-MS/MS analysis of 64 metabolites after DmPABr derivatization in SUIT-
2 cells. DmPA labelling pattern is also included (* = labelled once; † = labelled twice; #
= labelled thrice)

Absolute quantitative measurement of the energy metabolism
47
2
Method performance in neat solutions
The methods performance incorporates the derivatization efficiency and the
instrumental response. The method was validated for 64 metabolites that were
deemed to be biologically relevant to assess the central energy and carbon
metabolism. Using the ICD strategy, each metabolite had its corresponding DmPABr-
D6 internal standard to correct for ion suppression. This resulted in linear calibration
lines for all metabolites in neat solutions (Table 2.2). All metabolites, including the
amino acids which are derivatized by reacting 2-5 times with DmPABr showed a
satisfactory linear calibration (R2 > 0.99) except for Cys (R2 = 0.98) and Pro (R2 =
0.98). The RSD for all metabolites in neat solution was recorded below 12.8% also
shown in Table 2.2.
N-acetylated amino acids also showed good analytical performance similar to their
free amino acid counterparts. Table 2.2 also shows that the carry-over of the method
was negligible (<0.05%). Looking at limits of detection (which are affected by the
derivatization process itself), N-acetylated amino acids have a very low LOD, as
recorded for NA-Asp (4 nM), NA-Cys (34 nM) and NA-Phe (0.3 nM), which are
sufficient for their analysis in urine and cells. N-acetylated amino acids are used as
the transport mechanism to excrete excess amino acids (particularly in the urine)
that occur in relatively low concentrations when compared to free amino acids in
urine 28,35. We have circumvented the issues of limited dynamic range of the detector
in order to allow good quantitation of a wide concentration range of metabolites. As
shown in Table 2.2, the LOD of Gly, His, Ser, CITS and LAC, were higher compared to
the other metabolites in this method. This is due to intentional choice of less sensitive
MRM channel, to reduce the signal and prevent detector saturation, counteracting
the high physiological concentrations in urine or cells. Another intervention to
prevent detector saturation took place, namely non-optimal ionization spray voltage
throughout (4.5 kV vs. the optimal 5.5 kV). The application of this method to various
matrices could benefit from tailoring the MS parameters as well as sample handling
to improve the LOD.
Method performance in urine and cells
We applied the quantitative DmPABr method to urine and SUIT-2 cells (Tables 2.3-
2.4). Table 2.3 shows the endogenous concentration of the metabolites measured in
Chapter 2
48
2
urine from healthy males, after normalization to creatinine (measured in the same
method). A total of 57 compounds were detected and quantified in urine. The
compounds that were not detected include some carnitines and medium chain fatty
acids as they do not occur or occur in low concentrations in healthy urine. All of the
amino acids and N-acetylated amino acids that have been studied fall within the
expected concentrations curated in HMDB3. Urine was assessed for intra-day and
inter-day variability. Amino acids such as Ala, Ile, Trp had very low intra- and inter-
day variability (all below 10%) and N-acetylated amino acids including NA-Asp,
which is crucial for neurological studies, had an intra-day and inter-day variability of
2.2% and 5.4%, respectively. Creatinine had an intra-day and inter-day variability of
4.5% and 7.4%, respectively, which provides consistent normalization factor, if
desired. Overall, the amino acids had a higher derivatization variability than other
classes, which is probably due to the second step of derivatization on the 2° amine
requiring more energy, compared to the single reaction with the carboxylic acid
group.

Absolute quantitative measurement of the energy metabolism
49
2
Analyte
Urine
Concentration
(μmol/mmol
creatinine)
Intraday
precision
(%)
Interday
precision
(%)
Matrix
effect
(%)
Analyte
Urine
Concentration
(μmol/mmol
creatinine)
Intra-
Day
precision
(%)
Inter-
Day
precision
(%)
Matrix
effect
(%)
Ala 3.81 4.7 5.1 92.3
NA-Met 0.03 2.3 4 37.7
Arg 0.32 5.2 9.5 68.45
NA-Phe 0.05 3.1 4.2 51.7
Asn 1.11 4.9 7 74
NA-Pro 1.31 29.3 23.5 31
Asp 0.04 18.9 16.5 95
NA-Ser 0.25 2.4 4.1 66.5
Cys 11.5 12.9 21 91.2
NA-Thr 1.7 3.2 3.6 53.9
Gln 3.67 22.8 18.5 83.5
NA-Trp 0.2 3.6 3.7 45.5
Glu 0.12 5.5 6.4 81
NA-Tyr 0.047 5 9.8 36.8
Gly 136 1.4 4.2 67
NA-Val 2.07 3.7 13.2 16.6
His 76.3 5.2 5.7 42.7
AKG 0.5 10.6 12.8 71.3
Ile 0.23 6.7 7.7 80.3
CITS 7.47 13.1 11.5 73.9
Leu 0.52 6.4 7 85
FUM 0.13 6.7 7.7 144.4
Lys 1.22 23.1 28 42.2
LAC 0.89 3.3 8.9 43.5
Met 0.11 7.7 11.9 78.2
MAL 0.13 7.1 7.4 42.8
Phe 1.35 4.1 9.2 80.2
OXA 0.3 3.9 6.6 57.2
Pro 0.11 6.4 6.7 129.5
PYR 0.17 11.5 10.2 50.3
Ser 4.43 7.3 15.5 72.1
SUCC 5.31 2.7 3.4 39.4
Thr 1.21 6.3 16.1 70.2
AC 1.93 4.2 5 83.38
Trp 1.27 7.7 7.6 77.3
DC 0.001 9.5 7.8 93.1
Tyr 1.33 5.4 6.8 85
HC ND N/A N/A 77.9
Val 0.62 5 7.3 78.9
LC ND N/A N/A 83.6
NA-Ala 0.54 3.6 6.7 43.4
MC ND N/A N/A 91.9
NA-Arg 0.67 1.3 1.5 67.5
OC 0.007 5.3 5 58.2
NA-Asn 2.01 7.7 7.4 54.8
PC ND N/A N/A 96.3
NA-Asp 2.29 2.2 5.4 55.1
PPC 0.07 2.2 2.8 88.7
NA-Cys 1.45 4.1 10.4 27.4
SC ND N/A N/A 95.4
NA-Gln 1.26 5.5 6.4 34.7
AA 0.02 9.4 13.5 103.6
NA-Glu 0.67 3.6 3 62.3
OCA ND N/A N/A 66.7
NA-Gly 0.13 3.6 7.1 33.3
DCA ND N/A N/A 90.7
NA-His 1.28 3 4.8 63.9
DDA 0.008 10.9 24.1 83.2
NA-Ile 0.14 11.5 10.3 46.7
OLA 0.006 11.2 16.3 95.8
NA-Leu 0.13 4.9 6.4 47.6
UDA 0.004 21.4 39.1 98.3
NA-Lys 0.3 24 22 60 CR* N/A 4.5 7.4 38.1
* Creatinine was used for normalization

Chapter 2
50
2
Table 2.3. Method performance in urine of healthy men aged 18-30 to calculate
concentration, intraday and interday precision calculated as %RSD. ND = Not Detected,
N/A= Not Applicable
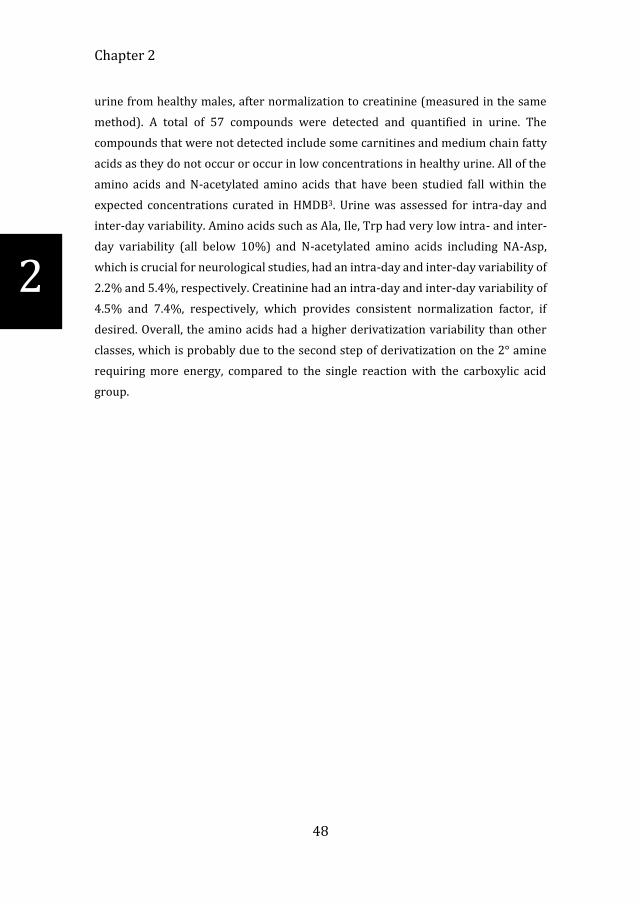
The application of the method to cells was conducted by measuring untreated SUIT-
2 cells. The cells were assessed for intra-day variability and not inter-day due to
practical considerations (Table 2.4). All 64 metabolites were detected from the intra-
cellular environment in cell lysate. This provided an excellent readout on the energy
state of the cells using metabolites involved in the TCA cycle (i.e., CITS, FUM & SUCC)
and glycolysis (PYR & LAC).
Analyte SUIT-2 Conc.
(fmol/mg)
Intra-Day
precision (%)
Matrix
effect (%) Analyte
SUIT-2 Conc.
(fmol/mg)
Intra-Day
precision (%)
Matrix
effect (%)
Ala 408 4.9 121.1
NA-Met 0.022 1.8 77.6
Arg 243 10.3 75.8
NA-Phe 0.063 10 78.3
Asn 173 6.7 40.7
NA-Pro 0.111 9.6 78.6
Asp 56.8 5.7 75.1
NA-Ser 13.1 7.2 73.8
Cys 166 30.8 98.6
NA-Thr 5.66 5.7 74.2
Gln 2360 10.1 75.3
NA-Trp 0.034 10.8 52.7
Glu 474 16.8 83.3
NA-Tyr 0.126 6.5 87
Gly 2970 3.4 87.4
NA-Val 0.034 11.7 86.3
His 467 3.7 62.5
AKG 7.75 10 93.7
Ile 277 8.7 90.7
CITS 214 9.8 97
Leu 333 9.7 72.1
FUM 245 12.7 131.8
Lys 130 28.5 78.4
LAC 846 2.4 72.5
Met 127 18.7 87.9
MAL 114 3.8 75.1
Phe 309 9 70.2
OXA 18.2 13.6 75.4
Pro 206 10.3 114.5
PYR 191 1.4 78.1
Ser 270 24.9 105.1
SUCC 249 13.8 60.6
Thr 401 31.1 74.1
AC 12.1 13.8 86.4
Trp 59.7 10.7 97.8
DC 0.006 23.3 109.5
Tyr 284 7.7 66
HC 0.033 18.6 81.5
Val 307 10.8 76.4
LC 0.01 9.7 85.6
NA-Ala 3.05 3.7 82.1
MC 0.099 8 94.1
NA-Arg 0.699 8.6 74.2
OC 0.011 19.9 68
NA-Asn 159 9.8 64.8
PC 0.195 11.9 98.4
Absolute quantitative measurement of the energy metabolism
51
2
Analyte SUIT-2 Conc.
(fmol/mg)
Intra-Day
precision (%)
Matrix
effect (%) Analyte
SUIT-2 Conc.
(fmol/mg)
Intra-Day
precision (%)
Matrix
effect (%)
NA-Asp 56.6 2 76.7
PPC 0.379 7.4 91.2
NA-Cys 50.5 12 54.4
SC 0.067 9.4 96.5
NA-Gln 8.55 8.6 81.1
AA 0.457 19.5 98.2
NA-Glu 0.964 2.1 71
OCA 2.57 24.8 67
NA-Gly 3.75 5.6 53.3
DCA 1.16 27.3 93.7
NA-His 0.318 19.6 81.1
DDA 1.64 13 83
NA-Ile 0.126 8 56.1
OLA 6.84 14.7 88.1
NA-Leu 0.217 14 55
UDA 0.669 25.6 88.9
NA-Lys 0.045 31.5 84.2 CR 305 11.6 81.7
Table 2.4. Method performance in SUIT-2 cell to calculate concentration per mg and
intra-day variability
Matrix effect was calculated for both urine and cell samples. The matrix effect was
significant during the early eluting peaks such as the N-acetylated amino acids in
urine. However, the matrix interferences were not as high during the analysis of cells.
The presence of a matrix effect shows the importance of using the ICD technique to
provide an internal standard for all metabolites.

Chapter 2
52
2
Method application in cells to reflect energy metabolism
Exposing cells to rotenone is a well-established method to induce mitochondrial
dysfunction by blocking complex I of the electron transport chain. This allows us to
simulate disorders such as Parkinson’s disease and Leigh’s syndrome. Application of
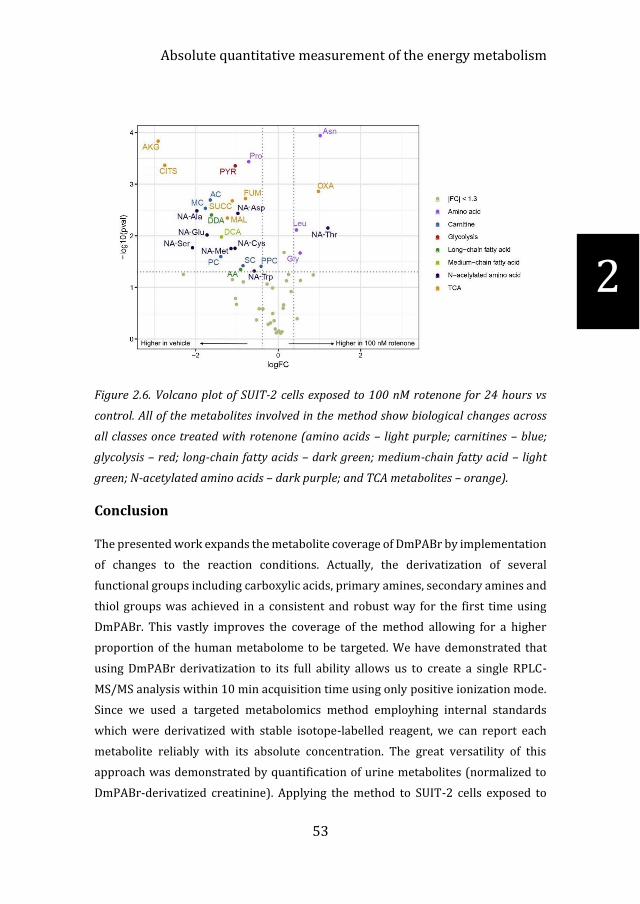
the method to SUIT-2 cells exposed to 100 nM rotenone showed the most changes in
the central metabolism when compared to 1 nM and 10 nM (data shown in
supplementary Figures S4 & S5 for 8 and 3 hour rotenone exposure). Out of the 64
metabolites, 28 showed significant changes including metabolites from all of the 7
classes (additional data shown in supplementary Table S3). The top ten most
distinguishing metabolites were: Asn (p = 0.0001); AKG (p = 0.0001); Pro (p =
0.0004); CITS (p = 0.0004); PYR (p = 0.0004); OXA (p = 0.001); FUM (p= 0.002); AC
(p = 0.002); SUCC (p = 0.002) and MC (p = 0.003) as shown in Figure 2.6. The two
metabolites with the largest fold change, CITS and AKG, coincide with the shutdown
of the TCA cycle by rotenone inhibition of complex I of the electron transport chain
36. The same reduction was seen in SUCC and FUM but to a lesser extent. Interestingly,
we also identified changes in the N-acetylated amino acids such as NA-Glu (p = 0.01),
NA-Ala (p = 0.003). N-acetylation of amino acids has been documented in
mitochondrial dysfunction but has not been extensively studied due to difficulty with
analysis27,37,38. The results obtained with our novel method demonstrate its potential
in studying the role of central carbon and energy metabolism such as mitochondrial
dysfunction and Parkinson’s disease39.
Absolute quantitative measurement of the energy metabolism
53
2
Figure 2.6. Volcano plot of SUIT-2 cells exposed to 100 nM rotenone for 24 hours vs
control. All of the metabolites involved in the method show biological changes across
all classes once treated with rotenone (amino acids – light purple; carnitines – blue;
glycolysis – red; long-chain fatty acids – dark green; medium-chain fatty acid – light
green; N-acetylated amino acids – dark purple; and TCA metabolites – orange).
Conclusion
The presented work expands the metabolite coverage of DmPABr by implementation
of changes to the reaction conditions. Actually, the derivatization of several
functional groups including carboxylic acids, primary amines, secondary amines and
thiol groups was achieved in a consistent and robust way for the first time using
DmPABr. This vastly improves the coverage of the method allowing for a higher
proportion of the human metabolome to be targeted. We have demonstrated that
using DmPABr derivatization to its full ability allows us to create a single RPLC-
MS/MS analysis within 10 min acquisition time using only positive ionization mode.
Since we used a targeted metabolomics method employhing internal standards
which were derivatized with stable isotope-labelled reagent, we can report each
metabolite reliably with its absolute concentration. The great versatility of this
approach was demonstrated by quantification of urine metabolites (normalized to
DmPABr-derivatized creatinine). Applying the method to SUIT-2 cells exposed to
Chapter 2
54
2
rotenone showed significant changes in almost 50% of the metabolites covered in
this method, including common TCA and glycolysis metabolites and not-so-
commonly studied N-acetylated amino acids. Understanding and documenting these
biological and biochemical changes in the brain could prove invaluable for future
research into neurodegenerative diseases, and requires investigation with a precise
and robust quantitative analytical approach. A computational approach towards the
prediction of derivatization of metabolites, and the prediction of retention for new
metabolites, will further support the method application to cover a wider range of
metabolites in complex matrices.
Acknowledgements
The author expresses thanks to: Jaco van Veldhoven for support during the synthesis
of DmPABr-D6; Alisa L. Willacey for advice and guidance during the finalization of the
study and Alida Kindt for statistical support. This project was supported by the
SysMedPD project, which has received funding from the European Union's Horizon
2020 research and innovation programme under grant agreement no, 668738.

Absolute quantitative measurement of the energy metabolism
55
2
References
1. Bayona LM, Videnova M, Choi YH. Increasing Metabolic Diversity in Marine
Sponges Extracts by Controlling Extraction Parameters. Marine drugs.
2018;16(10).
2. Karu N, Deng L, Slae M, et al. A review on human fecal metabolomics:
Methods, applications and the human fecal metabolome database. Anal
Chim Acta. 2018;1030:1-24.
3. Wishart DS, Feunang YD, Marcu A, et al. HMDB 4.0: the human metabolome
database for 2018. Nucleic acids research. 2018;46(D1):D608-d617.
4. Li T, Li E, Suo Y, et al. Energy metabolism and metabolomics response of
Pacific white shrimp Litopenaeus vannamei to sulfide toxicity. Aquatic
toxicology (Amsterdam, Netherlands). 2017;183:28-37.
5. Karu N, Wilson R, Hamede R, et al. Discovery of Biomarkers for Tasmanian
Devil Cancer (DFTD) by Metabolic Profiling of Serum. J Proteome Res.
2016;15(10):3827-3840.
6. Goldansaz SA, Guo AC, Sajed T, Steele MA, Plastow GS, Wishart DS.
Livestock metabolomics and the livestock metabolome: A systematic
review. PLoS One. 2017;12(5):e0177675.
7. Sumner LW, Lei Z, Nikolau BJ, Saito K. Modern plant metabolomics:
advanced natural product gene discoveries, improved technologies, and
future prospects. Natural product reports. 2015;32(2):212-229.
8. Ramirez-Gaona M, Marcu A, Pon A, et al. YMDB 2.0: a significantly
expanded version of the yeast metabolome database. Nucleic acids
research. 2017;45(D1):D440-d445.
9. Kantae V, Ogino S, Noga M, et al. Quantitative profiling of
endocannabinoids and related N-acylethanolamines in human CSF using
nano LC-MS/MS. J Lipid Res. 2017;58(3):615-624.
10. Zhou B, Xiao JF, Tuli L, Ressom HW. LC-MS-based metabolomics. Molecular
bioSystems. 2012;8(2):470-481.
11. Lopes AS, Cruz EC, Sussulini A, Klassen A. Metabolomic Strategies
Involving Mass Spectrometry Combined with Liquid and Gas
Chromatography. Advances in experimental medicine and biology.
2017;965:77-98.
Chapter 2
56
2
12. Song P, Mabrouk OS, Hershey ND, Kennedy RT. In vivo neurochemical
monitoring using benzoyl chloride derivatization and liquid
chromatography-mass spectrometry. Anal Chem. 2012;84(1):412-419.
13. Higashi T, Ogawa S. Isotope-coded ESI-enhancing derivatization reagents
for differential analysis, quantification and profiling of metabolites in
biological samples by LC/MS: A review. J Pharm Biomed Anal.
2016;130:181-193.
14. Wong JM, Malec PA, Mabrouk OS, Ro J, Dus M, Kennedy RT. Benzoyl
chloride derivatization with liquid chromatography-mass spectrometry for
targeted metabolomics of neurochemicals in biological samples. J
Chromatogr A. 2016;1446:78-90.
15. Guo K, Li L. Differential 12C-/13C-isotope dansylation labeling and fast
liquid chromatography/mass spectrometry for absolute and relative
quantification of the metabolome. Anal Chem. 2009;81(10):3919-3932.
16. Guo K, Li L. High-Performance Isotope Labeling for Profiling Carboxylic
Acid-Containing Metabolites in Biofluids by Mass Spectrometry. Analytical
Chemistry. 2010;82(21):8789-8793.
17. Peng J, Li L. Liquid-liquid extraction combined with differential isotope
dimethylaminophenacyl labeling for improved metabolomic profiling of
organic acids. Anal Chim Acta. 2013;803:97-105.
18. Sun Y, Chen D, Liu J, et al. Metabolic profiling associated with autophagy of
human placenta-derived mesenchymal stem cells by chemical isotope
labeling LC-MS. Experimental cell research. 2018;372(1):52-60.
19. Egorov M, Delpech B, Aubert G, et al. A concise formation of N-substituted
3,4-diarylpyrroles – synthesis and cytotoxic activity. Organic &
Biomolecular Chemistry. 2014;12(9):1518-1524.
20. Hu Q, Zhang Z, Liu Y, Imamoto T, Zhang W. ZnCl2-Promoted Asymmetric
Hydrogenation of β-Secondary-Amino Ketones Catalyzed by a P-Chiral Rh–
Bisphosphine Complex. Angewandte Chemie International Edition.
2015;54(7):2260-2264.
21. He J, Shi L, Liu S, Jia P, Wang J, Hu R. Ultrasound-mediated synthesis of N,N-
bis(phenacyl)aniline under solvent-free conditions. Monatshefte für Chemie
- Chemical Monthly. 2014;145(1):213-216.

Absolute quantitative measurement of the energy metabolism
57
2
22. Yousaf TI, Lewis ES. Group transfers. 1. Enolate structures contributing to
the transition state for nucleophilic substitution on .alpha.-substituted
carbonyl compounds. Journal of the American Chemical Society.
1987;109(20):6137-6142.
23. Loghmani-Khouzani H, Poorheravi MR, Sadeghi MMM, Caggiano L, Jackson
RFW. α-Fluorination of β-ketosulfones by Selectfluor™ F–TEDA–BF4.
Tetrahedron. 2008;64(30):7419-7425.
24. Stanislaus A, Guo K, Li L. Development of an isotope labeling ultra-high
performance liquid chromatography mass spectrometric method for
quantification of acylglycines in human urine. Analytica Chimica Acta.
2012;750:161-172.
25. Shah VP, Midha KK, Findlay JW, et al. Bioanalytical method validation--a
revisit with a decade of progress. Pharmaceutical research.
2000;17(12):1551-1557.
26. Hallan S, Afkarian M, Zelnick LR, et al. Metabolomics and Gene Expression
Analysis Reveal Down-regulation of the Citric Acid (TCA) Cycle in Non-
diabetic CKD Patients. EBioMedicine. 2017;26:68-77.
27. Thompson Legault J, Strittmatter L, Tardif J, et al. A Metabolic Signature of
Mitochondrial Dysfunction Revealed through a Monogenic Form of Leigh
Syndrome. Cell Rep. 2015;13(5):981-989.
28. Mardinoglu A, Shoaie S, Bergentall M, et al. The gut microbiota modulates
host amino acid and glutathione metabolism in mice. Mol Syst Biol.
2015;11(10):834.
29. Schoeman JC, Hou J, Harms AC, et al. Metabolic characterization of the
natural progression of chronic hepatitis B. Genome Med. 2016;8(1):64.
30. Celardo I, Martins LM, Gandhi S. Unravelling mitochondrial pathways to
Parkinson's disease. British Journal of Pharmacology. 2014;171(8):1943-
1957.
31. Adams SH. Emerging perspectives on essential amino acid metabolism in
obesity and the insulin-resistant state. Adv Nutr. 2011;2(6):445-456.
32. Wu Z, Gao W, Phelps MA, Wu D, Miller DD, Dalton JT. Favorable effects of
weak acids on negative-ion electrospray ionization mass spectrometry.
Analytical chemistry. 2004;76(3):839-847.

Chapter 2
58
2
33. Nallu M, Subramanian M, Vembu N, Akber Hussain A. Effect of binary
aqueous-organic solvents on the reaction of phenacyl bromide with
nitrobenzoic acid(s) in the presence of triethylamine. International Journal
of Chemical Kinetics. 2004;36(7):401-409.
34. Knobel RB, Smith JM. Laboratory blood tests useful in monitoring renal
function in neonates. Neonatal network : NN. 2014;33(1):35-40.
35. Kawase T, Nagasawa M, Ikeda H, Yasuo S, Koga Y, Furuse M. Gut microbiota
of mice putatively modifies amino acid metabolism in the host brain. Br J
Nutr. 2017;117(6):775-783.
36. Garmier M, Carroll AJ, Delannoy E, et al. Complex I dysfunction redirects
cellular and mitochondrial metabolism in Arabidopsis. Plant Physiol.
2008;148(3):1324-1341.
37. de Tommaso M, Ceci E, Pica C, et al. Serum levels of N-acetyl-aspartate in
migraine and tension-type headache. J Headache Pain. 2012;13(5):389-
394.
38. Gerlo E, Van Coster R, Lissens W, Winckelmans G, De Meirleir L, Wevers R.
Gas chromatographic-mass spectrometric analysis of N-acetylated amino
acids: the first case of aminoacylase I deficiency. Anal Chim Acta.
2006;571(2):191-199.
39. Lewitt PA, Li J, Lu M, Beach TG, Adler CH, Guo L. 3-hydroxykynurenine and
other Parkinson's disease biomarkers discovered by metabolomic analysis.
Mov Disord. 2013;28(12):1653-1660.

Absolute quantitative measurement of the energy metabolism
59
2
Supplementary information
Table S1: List of abbreviations
Metabolite Abbreviation Metabolite Abbreviation
Alanine Ala
N-acetylmethionine NA-Met
Arginine Arg
N-acetylphenylalanine NA-Phe
Asparagine Asn
N-acetylproline NA-Pro
Aspartic acid Asp
N-acetylserine NA-Ser
Cysteine Cys
N-acetylthreonine NA-Thr
Glutamine Gln
N-acetyltryptophan NA-Trp
Glutamic acid Glu
N-acetyltyrosine NA-Tyr
Glycine Gly
N-acetylvaline NA-Val
Histidine His
Alpha-Ketoglutaric acid AKG
Isoleucine Ile
Citric acids CITS
Leucine Leu
Fumaric acid FUM
Lysine Lys
Lactic acid LAC
Methionine Met
Malic acid MAL
Phenylalanine Phe
Oxaloacetic acid OXA
Proline Pro
Pyruvic acid PYR
Serine Ser
Succinic acid SUCC
Threonine Thr
Acetylcarnitine AC
Tryptophan Trp
Decanoylcarnitine DC
Tyrosine Tyr
Hexanoylcarnitine HC
Valine Val
Lauroylcarnitine LC
N-acetylalanine NA-Ala
Myristoylcarnitine MC
N-acetylarginine NA-Arg
Octanoylcarnitine OC
N-acetylasparagine NA-Asn
Palmitoylcarnitine PC
N-acetylaspartic acid NA-Asp
Propionylcarnitine PPC
N-acetylcysteine NA-Cys
Stearoylcarnitine SC
N-acetylglutamine NA-Gln
Arachidic acid AA
N-acetylglutamic acid NA-Glu
Capric acid DCA
N-acetylglycine NA-Gly
Caprylic acid OCA
N-acetylhistidine NA-His
Dodecanoic acid DDA
N-acetylisoleucine NA-Ile
Oleic acid OLA
N-acetylleucine NA-Leu
Undecanoic acid UDA
N-acetyllysine NA-Lys Creatinine CR

Chapter 2
60
2
Table S2. Target analyte list with MRM parameters for the AB Sciex Qtrap 6500 and
labelling pattern including the number of DmPA-tags per class.
Metabolites Rentention
time (mins)
Precusor
(m/z)
Product
(m/z)
Collision
Energy
(eV)
Labelling pattern
1°
Am
ine
2°
Am
ine
Th
iol
Aci
d
CR 2.12 275.1 134.1 40 1 0 0 0
NA-Arg 2.35 378.2 180 30 0 0 0 1
NA-Asn 2.46 336.2 134.1 25 0 0 0 1
NA-Gln 2.54 350.2 134.1 25 0 0 0 1
NA-Ser 2.62 309.1 180 20 0 0 0 1
AC 2.64 365.1 134.1 35 0 0 0 1
NA-Gly 2.74 279.1 180 15 0 0 0 1
NA-Thr 2.82 323.2 180 20 0 0 0 1
PPC 2.94 379.2 134.1 35 0 0 0 1
NA-Ala 2.99 293.1 180 15 0 0 0 1
LAC 2.99 252.0 180 5 0 0 0 1
NA-Lys 3.3 511.2 134.1 25 2 0 0 1
NA-Pro 3.35 319.2 70 30 0 0 0 1
NA-Tyr 3.41 385.2 180 15 0 0 0 1
NA-His 3.42 520.2 271.2 45 0 0 0 1
OXA 3.46 455.0 134 35 0 0 0 2
NA-Met 3.65 353.3 180 15 0 0 0 1
NA-Val 3.68 321.2 180 15 0 0 0 1
Pro 3.8 438.1 289.1 25 0 1 0 1
FUM 3.8 439.1 134 30 0 0 0 2
HC 3.95 421.4 140.1 35 0 0 0 1
NA-Leu 4.04 335.2 180 15 0 0 0 1
NA-Trp 4.07 408.3 180 15 0 0 0 1

Absolute quantitative measurement of the energy metabolism
61
2
Metabolites Rentention
time (mins)
Precusor
(m/z)
Product
(m/z)
Collision
Energy
(eV)
Labelling pattern
1°
Am
ine
2°
Am
ine
Th
iol
Aci
d
NA-Ile 4.08 335.2 180 15 0 0 0 1
NA-Phe 4.12 369.2 180 15 0 0 0 1
NA-Asp 4.23 498.1 180 30 0 0 0 2
PYR 4.28 250.1 180 15 0 0 0 1
MAL 4.31 457.1 134.1 35 0 0 0 2
NA-Cys 4.34 486.2 134.1 35 0 0 1 1
NA-Glu 4.35 512.2 134.1 35 0 0 0 2
His 4.38 639.2 244.2 15 2 0 0 1
OC 4.6 449.1 134.1 35 0 0 0 1
SUCC 4.68 441.1 134 30 0 0 0 2
Arg 4.71 658.2 319.2 35 2 0 0 1
Gln 4.91 630.2 340.2 30 2 0 0 1
Asn 4.94 616.2 339.2 30 2 0 0 1
AKG 5.1 469.2 180 30 0 0 0 2
CITS 5.1 676.1 180 10 0 0 0 3
DC 5.11 477.5 140.1 35 0 0 0 1
Ser 5.15 589.2 408.2 10 2 0 0 1
Gly 5.2 559.2 134.1 10 2 0 0 1
Ala 5.23 573.2 366.2 20 2 0 0 1
Tyr 5.28 665.2 458.2 30 2 0 0 1
Thr 5.31 603.2 422.2 25 2 0 0 1
Cys 5.4 766.2 470.2 25 2 0 1 1
LC 5.54 505.5 140.1 35 0 0 0 1
Lys 5.56 476.6 134.1 30 4 0 0 1
Trp 5.56 688.2 340.2 30 2 0 0 1
Asp 5.6 778.2 392.2 30 2 0 0 2
Met 5.62 633.2 426.2 25 2 0 0 1

Chapter 2
62
2
Metabolites Rentention
time (mins)
Precusor
(m/z)
Product
(m/z)
Collision
Energy
(eV)
Labelling pattern
1°
Am
ine
2°
Am
ine
Th
iol
Aci
d
OCA 5.65 306.2 180 20 0 0 0 1
Glu 5.68 792.2 585.2 35 2 0 0 2
Val 5.75 601.2 394.2 30 2 0 0 1
Phe 5.77 649.2 442.2 30 2 0 0 1
Leu 5.83 615.2 408.2 30 2 0 0 1
Ile 5.87 615.2 408.2 30 2 0 0 1
MC 5.92 533.6 140.1 35 0 0 0 1
DCA 6.08 334.3 180 20 0 0 0 1
PC 6.26 561.6 140.1 35 0 0 0 1
UDA 6.27 348.3 180 20 0 0 0 1
DDA 6.44 362.3 180 20 0 0 0 1
SC 6.55 589.6 140.1 35 0 0 0 1
OLA 7.34 444.5 180 20 0 0 0 1
AA 8.58 474.5 180 20 0 0 0 1
CR-IS 2.11 281.1 140.1 40 1 0 0 0
NA-Arg-IS 2.35 384.2 186 30 0 0 0 1
NA-Asn-IS 2.4 342.2 140.1 25 0 0 0 1
NA-Gln-IS 2.48 356.2 140.1 25 0 0 0 1
NA-Ser-IS 2.56 315.1 186 20 0 0 0 1
AC-IS 2.64 371.1 140.1 35 0 0 0 1
NA-Gly-IS 2.7 285.1 186 15 0 0 0 1
NA-Thr-IS 2.79 329.2 186 20 0 0 0 1
NA-Ala-IS 2.94 299.1 186 15 0 0 0 1
PPC-IS 2.94 385.2 140.1 35 0 0 0 1
LAC-IS 2.95 258.1 186 15 0 0 0 1
NA-Pro-IS 3.3 325.2 76 30 0 0 0 1
NA-Lys-IS 3.3 523.2 140.1 25 2 0 0 1

Absolute quantitative measurement of the energy metabolism
63
2
Metabolites Rentention
time (mins)
Precusor
(m/z)
Product
(m/z)
Collision
Energy
(eV)
Labelling pattern
1°
Am
ine
2°
Am
ine
Th
iol
Aci
d
NA-Tyr-IS 3.36 391.2 186 15 0 0 0 1
NA-His-IS 3.4 365.2 140.1 45 0 0 0 1
OXA-IS 3.43 467.1 140 35 0 0 0 2
NA-Met-IS 3.6 359.3 186 15 0 0 0 1
NA-Val-IS 3.61 327.2 186 15 0 0 0 1
Pro-IS 3.78 450.1 295.1 25 0 1 0 1
FUM-IS 3.78 451.1 140 30 0 0 0 2
HC-IS 3.95 427.4 140.1 35 0 0 0 1
NA-Leu-IS 3.96 341.2 186 15 0 0 0 1
NA-Ile-IS 4 341.2 186 15 0 0 0 1
NA-Trp-IS 4.03 414.3 186 15 0 0 0 1
NA-Phe-IS 4.08 375.2 186 15 0 0 0 1
NA-Asp-IS 4.2 510.1 186 30 0 0 0 2
PYR-IS 4.24 256.1 186 15 0 0 0 1
MAL-IS 4.24 469.1 140 35 0 0 0 2
NA-Glu-IS 4.29 524.2 140.1 35 0 0 0 2
His-IS 4.34 657.2 250.2 40 2 0 0 1
OC-IS 4.6 455.0 140.1 35 0 0 0 1
NA-Cys-IS 4.65 498.2 140.1 35 0 0 1 1
SUCC-IS 4.65 453.1 140 30 0 0 0 2
Arg-IS 4.7 676.2 331.2 35 2 0 0 1
Asn-IS 4.86 634.2 351.2 30 2 0 0 1
Gln-IS 4.87 648.2 352.2 30 2 0 0 1
AKG-IS 5.07 481.2 186 30 0 0 0 2
CITS-IS 5.07 694.1 186 40 0 0 0 3
Ser-IS 5.08 607.2 420.2 25 2 0 0 1
DC-IS 5.11 483.5 140.1 35 0 0 0 1

Chapter 2
64
2
Metabolites Rentention
time (mins)
Precusor
(m/z)
Product
(m/z)
Collision
Energy
(eV)
Labelling pattern
1°
Am
ine
2°
Am
ine
Th
iol
Aci
d
Gly-IS 5.13 577.2 140.1 30 2 0 0 1
Ala-IS 5.18 591.2 378.2 25 2 0 0 1
Tyr-IS 5.23 683.2 470.2 30 2 0 0 1
Thr-IS 5.25 621.2 434.2 25 2 0 0 1
Cys-IS 5.4 395.6 154.2 25 2 0 1 1
Lys-IS 5.5 491.6 140.1 30 4 0 0 1
Trp-IS 5.51 706.2 352.2 30 2 0 0 1
Asp-IS 5.54 802.2 410.2 30 2 0 0 2
LC-IS 5.54 511.5 140.1 35 0 0 0 1
Met-IS 5.56 651.2 438.2 25 2 0 0 1
Glu-IS 5.6 810.2 597.2 35 2 0 0 2
OCA-IS 5.65 312.21 186 20 0 0 0 1
Val-IS 5.69 619.2 406.2 30 2 0 0 1
Phe-IS 5.72 667.2 454.2 30 2 0 0 1
Leu-IS 5.76 633.2 420.2 30 2 0 0 1
Ile-IS 5.82 633.2 420.2 30 2 0 0 1
MC-IS 5.92 539.6 140.1 35 0 0 0 1
DCA-IS 6.08 340.3 186 20 0 0 0 1
PC-IS 6.26 567.6 140.1 35 0 0 0 1
UDA-IS 6.27 354.3 186 20 0 0 0 1
DDA-IS 6.44 368.3 186 20 0 0 0 1
SC-IS 6.55 596.7 140.1 35 0 0 0 1
OA-IS 7.34 450.5 186 20 0 0 0 1
AA-IS 8.58 480.5 186 20 0 0 0 1

Absolute quantitative measurement of the energy metabolism
65
2
Table S3. Concentration changes between the SUIT-2 cell vehicle control and cells
exposed to 100 nM rotenone. The values were used to create the volcano plot shown in
figure 6.
Metabolites
Vehicle
mean
conc.
100 nM
Rotenone
mean
LogFC pval
Asn 6.61 7.63 1.02 0.0001
AKG 3.44 0.535 -2.91 0.0001
Pro 12.5 11.8 -0.713 0.0004
CITS -0.209 -2.96 -2.75 0.0004
PYR 8.44 7.40 -1.04 0.0004
OXA 4.17 5.15 0.979 0.001
FUM 12.8 12.0 -0.789 0.002
AC 1.64 -0.00632 -1.65 0.002
SUCC 6.63 5.52 -1.11 0.002
MC -5.87 -7.64 -1.76 0.003
NA.Ala 4.41 2.44 -1.97 0.003
NA.Asp 6.74 5.77 -0.98 0.004
DDA 11.3 9.70 -1.62 0.004
MAL 8.29 7.06 -1.23 0.005
NA-Thr 1.24 2.45 1.21 0.007
Leu 10.2 10.7 0.444 0.008
NA-Glu 6.03 4.31 -1.72 0.01
DCA 9.46 8.09 -1.37 0.01
NA-Ser 7.01 4.93 -2.08 0.02
NA-Cys 9.13 8.08 -1.04 0.02
NA-Met -1.75 -2.90 -1.14 0.02
Tyr 8.44 8.59 0.145 0.02
Gly -2.37 -1.84 0.535 0.02
PC -4.16 -5.55 -1.39 0.03
SC -1.60 -2.45 -0.852 0.04
PPC 0.822 0.408 -0.412 0.04
AA -0.645 -1.56 -0.91 0.045

Chapter 2
66
2
Metabolites
Vehicle
mean
conc.
100 nM
Rotenone
mean
LogFC pval
NA-Trp 1.39 0.811 -0.580 0.048

Absolute quantitative measurement of the energy metabolism
67
2
Figure S4. SUIT-2 cells exposed to rotenone for 8 hours. The plots show four metabolites
(A: PYR, B: MAL, C: PC, and D: SUCC), at four conditions: vehicle control, 1 nM rotenone,
10 nM rotenone and 100 nM rotenone. ns = not significant.
Chapter 2
68
2
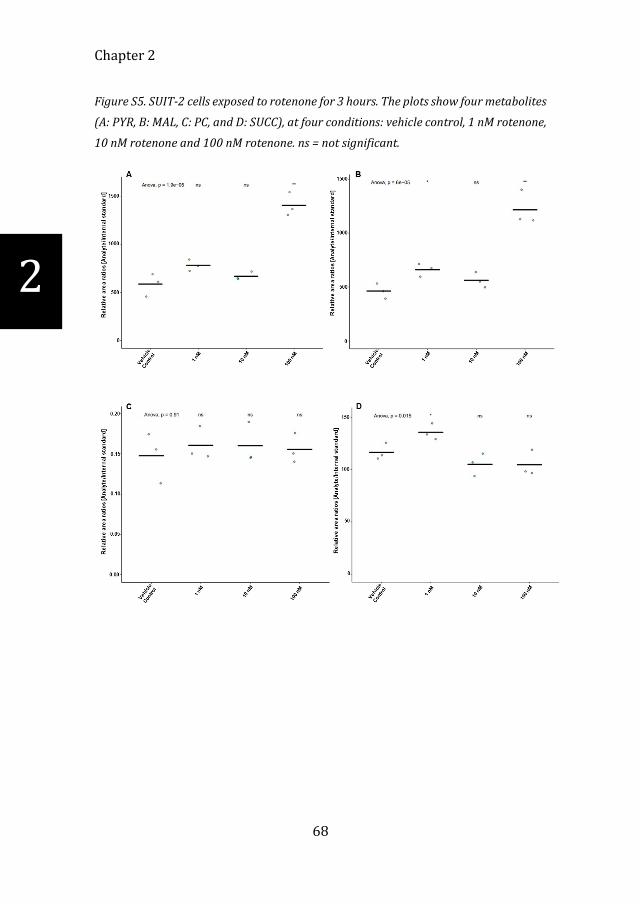
Figure S5. SUIT-2 cells exposed to rotenone for 3 hours. The plots show four metabolites
(A: PYR, B: MAL, C: PC, and D: SUCC), at four conditions: vehicle control, 1 nM rotenone,
10 nM rotenone and 100 nM rotenone. ns = not significant.

Absolute quantitative measurement of the energy metabolism
69
2
Table S6. Metabolite standard concentrations (µM), utilized for calibration plots. *
concentration of the internal standard.
Metabolites Cal 1 Cal 2 Cal 3* Cal 4 Cal5 Cal 6 Cal 7
Ala 9.29 18.57 37.14 74.29 148.57 297.14 594.29
Arg 1.16 2.32 4.64 9.29 18.57 37.14 74.29
Asn 4.18 8.36 16.71 33.43 66.86 133.71 267.43
Asp 2.32 4.64 9.29 18.57 37.14 74.29 148.57
Cys 13.93 27.86 55.71 111.43 222.86 445.71 891.43
Gln 13.93 27.86 55.71 111.43 222.86 445.71 891.43
Glu 0.93 1.86 3.71 7.43 14.86 29.71 59.43
Gly 69.64 139.29 278.57 557.14 1114.29 2228.57 4457.14
Ile 0.93 1.86 3.71 7.43 14.86 29.71 59.43
Leu 1.39 2.79 5.57 11.14 22.29 44.57 89.14
Lys 6.96 13.93 27.86 55.71 111.43 222.86 445.71
Met 0.46 0.93 1.86 3.71 7.43 14.86 29.71
Phe 2.79 5.57 11.14 22.29 44.57 89.14 178.29
Pro 0.23 0.46 0.93 1.86 3.71 7.43 14.86
Ser 13.93 27.86 55.71 111.43 222.86 445.71 891.43
Thr 5.57 11.14 22.29 44.57 89.14 178.29 356.57
Trp 2.79 5.57 11.14 22.29 44.57 89.14 178.29
Tyr 3.71 7.43 14.86 29.71 59.43 118.86 237.71
Val 1.86 3.71 7.43 14.86 29.71 59.43 118.86
His 27.86 55.71 111.43 222.86 445.71 891.43 1782.86
NA-Ala 0.31 0.62 1.23 2.46 4.93 9.86 19.71
NA-Gly 0.15 0.29 0.58 1.16 2.32 4.65 9.3
NA-Ile 0.07 0.15 0.3 0.6 1.2 2.39 4.79
NA-Leu 0.07 0.15 0.29 0.58 1.16 2.33 4.66
NA-Pro 0.04 0.07 0.14 0.28 0.57 1.13 2.26
NA-Val 0.14 0.27 0.55 1.1 2.19 4.38 8.76
NA-Phe 0.03 0.06 0.13 0.25 0.5 1.01 2.01
NA-Trp 0.05 0.11 0.22 0.44 0.87 1.74 3.49
NA-Tyr 0.03 0.06 0.11 0.22 0.45 0.9 1.79
NA-Asp 0.74 1.49 2.97 5.94 11.89 23.78 47.56
NA-Glu 0.25 0.51 1.01 2.03 4.06 8.11 16.23
NA-Arg 0.27 0.53 1.07 2.14 4.28 8.55 17.11

Chapter 2
70
2
Metabolites Cal 1 Cal 2 Cal 3* Cal 4 Cal5 Cal 6 Cal 7
NA-His 0.07 0.14 0.27 0.55 1.1 2.19 4.39
NA-Lys 0.14 0.27 0.54 1.09 2.18 4.36 8.72
NA-Ser 0.12 0.23 0.47 0.94 1.87 3.74 7.49
NA-Thr 0.31 0.62 1.23 2.46 4.93 9.86 19.71
NA-Cys 0.4 0.81 1.61 3.22 6.45 12.9 25.79
NA-Met 1.44 2.89 5.78 11.55 23.11 46.22 92.43
NA-Asn 1.03 2.05 4.1 8.21 16.42 32.83 65.66
NA-Gln 0.51 1.01 2.03 4.05 8.1 16.2 32.4
PYR 0.7 1.39 2.79 5.57 11.14 22.29 44.57
AKG 2.32 4.64 9.29 18.57 37.14 74.29 148.57
MAL
LAC
0.46
4.64
0.93
9.29
1.86
18.57
3.71
37.14
7.43
74.29
14.86
148.57
29.71
297.14
CIT/ICIT 58.04 116.07 232.14 464.29 928.57 1857.14 3714.29
SUCC 1.86 3.71 7.43 14.86 29.71 59.43 118.86
FUM 0.23 0.46 0.93 1.86 3.71 7.43 14.86
OXA 0.46 0.93 1.86 3.71 7.43 14.86 29.71
AC 0.93 1.86 3.71 7.43 14.86 29.71 59.43
OC 0.02 0.05 0.09 0.19 0.37 0.74 1.49
PPC 0.22 0.45 0.89 1.79 3.57 7.14 14.29
OCA 0.46 0.93 1.86 3.71 7.43 14.86 29.71
DCA 0.46 0.93 1.86 3.71 7.43 14.86 29.71
DDA 0.01 0.03 0.06 0.11 0.22 0.45 0.89
UDA 0.05 0.09 0.19 0.37 0.74 1.49 2.97
DC 0.22 0.45 0.89 1.79 3.57 7.14 14.29
HC 0.22 0.45 0.89 1.79 3.57 7.14 14.29
LC 0.22 0.45 0.89 1.79 3.57 7.14 14.29
MC 0.22 0.45 0.89 1.79 3.57 7.14 14.29
PC 0.22 0.45 0.89 1.79 3.57 7.14 14.29
SC 0.22 0.45 0.89 1.79 3.57 7.14 14.29
OLA 0.23 0.46 0.93 1.86 3.71 7.43 14.86
AA 0.05 0.09 0.19 0.37 0.74 1.49 2.97
CR 29.02 58.04 116.07 232.14 464.29 928.57 1857.14

Absolute quantitative measurement of the energy metabolism
71
2

72