31? - digital library/67531/metadc278149/... · subjects were 41 third grade african american...
TRANSCRIPT
31?
MO, Vsrss
STEREOTYPE VULNERABILITY IN ELEMENTARY
AGED AFRICAN AMERICAN STUDENTS
DISSERTATION
Presented to the Graduate Council of the
University of North Texas in Partial
Fulfillment of the Requirements
For the Degree of
DOCTOR OF EDUCATION
By
Sarah K. Jandrucko, B.S., M.Ed.
Denton, Texas
December, 1997

Jandrucko, Sarah K., Stereotype Vulnerability in
Elementary Acred African American Students. Doctor Of
Education (Educational Administration), December, 1997,
138 pp., 16 tables, references, 53 titles.
This study explores a link between "stereotype
vulnerability" and the documented under performance of
African American students on standardized tests. The
subjects were 41 third grade African American students
matched according to language arts grades with 41 third
grade Anglo students. The students were from predominately
middle class suburban schools, with similar educational
experiences.
There were three tests given to the matched pairs.
Forty-one matched pairs completed Test 1 and Test 2. The
data from 39 matched pairs was used to tabulate results from
Test 3. Each activity was administered by the students'
homeroom teachers in the natural environment of the
classroom. Test 1 was purported to be non-diagnostic of
student ability; Test 2 was non-diagnostic with challenge;
and Test 3 was diagnostic of student reading ability. In
addition, 24 students were interviewed and asked questions
about the year end, statewide test. They were also
encouraged to reveal knowledge of any stereotypical phrases
they may have heard in relationship to various ethnic
groups.
Although the selection process matched African American
and Anglo students according to language arts grades, the
quantitative results examined the mean score difference
between the two groups using ethnicity to determine student
grouping. The results of the quantitative portion showed no
significant difference between African American and Anglo
students in any of the various situations. The open-ended
interview yielded answers from both ethnic groups showing
confidence in their academic ability and minimal awareness
of negative stereotypical phrases, often used to
characterize African American intellect.
The data suggest that third grade African American and
Anglo students from predominately middle class schools, with
approximately equivalent language arts grades and similar
educational experiences, will score comparably to one
another regardless of testing conditions. The data also
suggest that this sample of third grade students are
confident in their academic ability and are not affected by
negative stereotyping.

31?
MO, Vsrss
STEREOTYPE VULNERABILITY IN ELEMENTARY
AGED AFRICAN AMERICAN STUDENTS
DISSERTATION
Presented to the Graduate Council of the
University of North Texas in Partial
Fulfillment of the Requirements
For the Degree of
DOCTOR OF EDUCATION
By
Sarah K. Jandrucko, B.S., M.Ed.
Denton, Texas
December, 1997
TABLE OF CONTENTS
Page
LIST OF TABLES v
Chapter
1. INTRODUCTION TO THE STUDY 1
Historical Background Statement of the Problem Theoretical Justification Research Questions Basic Assumptions Limitations Definitions Organization of the Remainder of the Study
2. REVIEW OF THE LITERATURE 23
Stereotyping of African Americans in Contemporary American Society
Awareness of Ethnicity in Children Stereotype Formation and Cognitive Associations The Effects of Negative Stereotyping Summary
3. PROCEDURES FOR COLLECTION AND TREATMENT OF DATA . . . 57
Statement of the Problem Selection of Sample Research Questions Procedures Used in Collection of Data Instrumentation Analysis of Data
4. PRESENTATION AND ANALYSIS OF DATA 77
Statistical Hypotheses Reporting of Data Qualitative Results Research Questions Investigation
iii

Chapter Page
Reporting of Qualitative Data Conclusion
5. SUMMARY, FINDINGS, CONCLUSIONS, DISCUSSION, RECOMMENDATIONS AND IMPLICATIONS 108
Summary-Findings
Hypothesis Findings Research Questions Findings
Conclusions Discussion of Conclusions Recommendations for Future Study Implications for Educators
APPENDIX 123
A. Texas Assessment of Academic Skills Student Performance
B. Letter to Parents
C. Student Data
REFERENCES 133
IV
LIST OF TABLES
Table Page
1. Pearson Product-Moment Correlation Coefficient of Student Populations Under Varying Conditions 80
2. Mean Scores and Standard Deviations of Student Groups Under Varying Conditions 81-82
3. Homegeneity of Variance 83
4. Skewness of Scores for Combined Group, African American, and Anglo Students Under Varying Conditions 84
5. Wilcoxon Matched-pairs Signed Rank Test of Results for African American and Anglo Students Under Varying Conditions 8 6
6. Comparative Responses to the Question-Why Did You Have to Take the Test? 88
7. Comparative Responses to the Question -What Will Your Teacher Do With the Scores When She Receives Them? 8 9-90
8. Comparative Responses to the Question -What Will the Principal Do With TAAS Scores 91
9. Comparative Responses to the Question -What Do You Think Will Happen If You Don't Do Well on the Test? 92-93
10. Comparative Responses to the Question -How Well Do You Think You Did on the Test? . . . 94
11. Comparative Responses to the Question -How Did You Feel Before You Took the Test? How Did You Feel During the Test? 95-96
v

12. Comparative Responses to the Question -If I Ask You Are You Black, White, Asian, or Hispanic, What Would You Say? 98
13. Comparative Responses to the Question -What Have You Heard People Say About White Students and How Well They Do in School? . . . 99-100
14. Comparative Responses to the Question -What Have You Heard People Say About Asian Students and How Well They Do in School? . . . 101-102
15. Comparative Responses to the Question -What Have You Heard People Say About Black Students and How Well They Do in School? . . . 103-104
16. Comparative Responses to the Question -What Have You Heard People Say About Hispanic Students and How Well They Do in School? . . . 105-106
VI
CHAPTER 1
INTRODUCTION TO THE STUDY
The interest in educational testing has increased
dramatically over the last fifty years in many areas. These
areas include: the volume of tests given, the dollars spent
for testing material and testing services, and the number of
articles pertaining to measurement or evaluation appearing
in educational journals (Ladson-Billings & Tate, 1995).
Specifically, in the area of standardized testing,
African American students, Hispanic students, and students
identified as economically disadvantaged have consistently
underscored their Anglo counterparts (Steele, 1992, Texas
Education Agency 1992-1993, 1993-1994, 1994-1995, 1996) .
Recent research suggests even when socioeconomic status is
held constant, middle-class African American students do not
achieve at the same level as their Anglo peers (Ladson-
Billings & Tate, 1995). This lack of school success results
in lower grade point averages, poor standardized test
scores, less representation in gifted and talented programs,
and disproportionately higher dropout rates for African
American students. Consequently, a negative stereotype
1

about African American academic performance exists in the
minds or perceptions of contemporary American society. This
stereotype presents a threat to African American students
and increases their vulnerability to failure (Steele &
Aronson, 1995).
In order to comprehend the magnitude of this situation,
it is necessary to examine briefly the growth of educational
testing in this country. In 1960 only one state required a
mandated assessment program. By 1985 thirty-two states had
a specific requirement for some form of standardized student
assessment. Statewide minimum competency tests, generally
considered criterion referenced tests, have also increased
significantly: from one state requirement in 1975 to thirty-
four state competency testing programs in 1985. By 1990,
every state had some type of mandated student assessment
program. At the beginning of this decade, the National
Commission on Testing and Public Policy estimated that
annually public school students take an average of 127
million separate tests. These tests are part of the
standardized battery of tests regulated by district and
state mandates (National Commission on Testing and Public
Policy [NCTPP], 1990).
Additional evidence that educational testing has

increased, can be found in the significant rise in the
reported dollar amount spent on tests and educational
testing services at all levels. Adjusting for inflation,
real dollar volume in test material and services has
increased approximately 400%. Sales have risen from $30
million in 1955 to over $100 million by the beginning of
this decade (Ladson-Billings & Tate, 1995). This increase
in revenue is due primarily to the rise in volume of sales
and services and not to an increase in the cost of testing
material or services. Educational testing is big business.
Not only has educational testing increased in volume
and dollars spent but the interest by researchers and the
general public has grown. This is evidenced by the increase
in the number of column inches appearing in educational
journals devoted to testing information as compared to
curriculum topics. Education Index reports that
approximately 100 column inches are currently devoted to
curriculum issues while over 300 inches are devoted to
issues of testing and measurement. Educational Leadership
printed 103 articles pertaining to student evaluation,
student testing, or measurement from 1980 to 1991. In
comparison only five articles were printed from 1940 through
1949 (NCTPP, 1990). The concern over student achievement
and performance evaluation continues to dominate
professional educational journals.
This growth is only part of the issue. The use of data
gathered from state mandated tests has changed since 1960.
The current trend by educational practitioners is toward
greater reliance on test results to make critical decisions
about children. These decisions include but are not limited
to:
• Entry to and exit from kindergarten
Promotion from grade to grade
• Placement in remedial programs
• Graduation from high school (Madaus & Tan, 1993,
p.65) .
In addition to individual student decisions, statewide
tests are used to hold school systems, individual campuses,
administrators, and teachers accountable for student
achievement. The test results are purported to inform
students, parents, and educators about student progress
toward minimum academic standards. Group scores by
ethnicity and socioeconomic status are reported to school
boards, school professionals, parents, the community, and
the media.
These statewide, standardized assessment instruments of
students' academic ability have had a disproportionately
negative impact on minority students, mainly African
American and Hispanic students, and students from low income
families. Tests of this nature often sort children for
differing educational opportunities. This sorting process
limits the type of school experiences in which the students
are engaged. While African American children as a group
are consistently outperformed by Anglo children on national
assessments of mathematics achievement, they are also less
likely to have taken the necessary college preparatory
mathematics courses (Tate, 1993, p.17).
Standardized testing and the accompanying results shape
the school curriculum, providing some students with
enrichment opportunities while other students are exposed to
continual remediation. The continued emphasis on
standardized and minimum skills competency tests creates a
tendency to ignore higher order thinking skills. At schools
and in classes serving minority or low income students,
drill is the primary form of instruction rather than
investigation or problem solving.
A common response to students' failure to meet minimum
competency levels is retention in grade. Since minority
students are more likely to test at lower levels than Anglo
students they have retention rates three to four times
higher than those of their Anglo peers. The literature
reveals that African American males are particularly at risk
for retention (Garibaldi, 1996, Steele, 1992). Students
retained once have a 4 0% to 50% percent chance of dropping
out of school. The number climbs to 70% plus for those
students who have been retained twice. The United States
Department of Education reports that the high school dropout
rate for African Americans during the 1996 school year was
12.6% compared to an Anglo rate of 7.7% for the same
academic period (Snyder & Shafer, 1996, p.72). The higher
percentage of dropouts results in unemployment rates for
African American students that were correspondingly higher
than for Anglo students (Snyder & Shafer, 1996, p.99).
It is interesting to note that approximately one-third
of African American and Anglo students aspire to attend
college; yet in 1993 African American students accounted for
only "10 percent of the total enrollment at colleges and
universities" (Smith, 1996, p.144). Standardized tests also
play a significant role in determining whether or not
students have an opportunity to attend college, what
colleges they will be able to attend, and the extent of
financial support they can receive. Reliance on this form

of evaluation results in diminished chances for African
American students:
• to gain admission to numerous colleges and
universities,
• to obtain millions of dollars in college tuition aid,
and
• to enter many programs reserved for "gifted and
talented" students.
All of these factors can contribute to less prestigious
jobs, less income, and fewer leadership opportunities for
African American students.
Historical Background
Similar to many other states, Texas has a statewide
minimum competency test. This criterion referenced test is
currently referred to as the Texas Assessment of Academic
Skills (TAAS). Although the name of the test and the grade
levels tested have changed over the years, the basic concept
of a state directed student evaluation system has been in
place since 1980. Since 1992 the statewide testing program
calls for student assessment of specific objectives in
grades 3 through 8 and grade 10. This test evaluates
students' academic ability in reading and mathematics. At
grades 4, 8, and 10 a student writing sample is required.

8
The tenth grade administration is an exit level examination
and demonstration of minimum competency is necessary for
high school graduation.
Not only are students in Texas tested annually, but
this information is also disseminated to parents, educators,
school boards, and the community. The system for reporting
this information is the Academic Excellence Indicator System
(AEIS). The Texas Education Agency (TEA) requires districts
to share this information with the community in an annual
meeting held on each campus. In addition, the agency
requires that individual campus statistics concerning test
performance be disseminated in written form to the parents
of enrolled students. This written information is the campus
or school report card,.
Since the inception of a statewide test in the 1979-
1980 academic year, significant disparities in performance
are reported to exist among the major ethnic groups in
Texas. Differences in the 1995 performance for African
American students and Anglo students ranged from 19
percentage points in writing to 35 percentage points in
mathematics. Only 38% of the African Americans students
passed the exit level examination on the first attempt,
compared to a 7 5% passing rate for Anglo students.

Examination of the TAAS scores from 1993 through 1995
(Texas Education Agency, 1992-1993, 1993-1994, 1994-1995)
reveals that African American students at every tested grade
level have scored lower than any other ethnic group and
lower than those students considered economically
disadvantaged (Appendix A). Failure by individual students
to master the TAAS objectives may result in placement in
remedial classes, referral to special education, and failure
to receive a high school diploma. During the 1993-94 school
year the dropout rate for African American students remained
higher than the state average of 2.6%. During this time
frame 17.6% of African American students in grades 7 through
12 dropped out of school. As a result of the poor
performance on the statewide assessment instrument,
educational opportunities for African American students are
limited.
Statement of the Problem
The problem addressed in this research was to
determine if "stereotype vulnerability" affects the
performance of third grade African American students on the
reading portion of the Texas Assessment of Academic Skills.
Theoretical Justification
African American and Anglo students often begin school

10
with comparable test scores. Up to third grade, the
performance of African American males and females on
criterion referenced tests in mathematics and reading is
comparable to that of Anglo students (Simmons and Grady,
1990, C. Steele, 1992). However, within a relatively short
period of time African American students score two or more
years behind Anglo students of the same age. Even when
socioeconomic status is not a variable, the standardized
test scores of African American students are significantly
depressed. On a national level, more than half of all
African American students score below the mean on
standardized tests of basic skills (Garibaldi, 1996, p.11).
This situation cannot be solely explained by major financial
disadvantages of African Americans. Even middle
class African American students have grades and achievement
test scores lower than other minority groups (Ladson-
Billings & Tate, 1995, p.6). Neither is the problem
explained by a lack of academic preparation. Even when
combined scores on the Scholastic Aptitude Test ranged in
the 1,200 - 1,500 for both Anglo and African American
students, the African American student had a college dropout
rate of 33% as compared to an 11% rate for Anglo students
(C. Steele, 1992, p.70). African American students

11
consistently underachieve even when they have financial
support, value education, and are well prepared in terms of
knowledge and basic skills.
The specific theoretical base for this study comes from
two areas: the philosophical documentation of racial
vulnerability by Shelby Steele (1990) and the experimental
work of Claude Steele and Joshua Aronson (1995). Shelby
Steele maintains that African Americans cannot be raised in
a society, which for decades supported the concept of Black
inferiority, and not have some doubt about their ability as
an individual and as a member of this race. Claude Steele,
psychology professor, Stanford University, and Joshua
Aronson, education professor, University of Texas, propose
the theory that African American students are negatively
affected by "stereotype vulnerability." They maintain that
the scores of African American students on standardized
tests are lower than Anglo students due to the threat of
confirming the group's negative stereotype concerning
intellectual competence (C. Steele, 1992, Steele & Aronson,
1995). The concept of "stereotype vulnerability" connects
the social-psychological predicament of negative stereotypes
to depressed scores on tests that measure academic ability.
The lowered test scores are a result of a negative self

12
evaluation that has occurred because of widely known
negative stereotypes.
Since the civil rights movement of the sixties, African
Americans have gained in equality and increased
opportunities. However, African Americans remain behind in
many areas including academic achievement as measured on
standardized tests. The depth of Shelby Steele's feelings
can be heard in this statement:
I think there is a specific form of racial anxiety that
all blacks are vulnerable to that can, in situations
where we must engage the mainstream society, increase
our self-doubt and undermine our confidence so that we
often back away from the challenges that, if taken,
would advance us. I believe this hidden racial anxiety
may well now be the strongest barrier to our full
participation in the American mainstream; that it is as
strong or stronger even than the discrimination we
still face (S. Steele, 1990, p.39).
C. Steele and Aronson (1995) narrowed S. Steele's
(1990) philosophical approach to racial anxiety and racial
vulnerability by conducting an experiment using Stanford
undergraduates. They maintain that, whenever African
American students perform difficult intellectual tasks that

13
are established as a measure of their scholastic ability,
they face the risk of confirming the group's negative
stereotype concerning intellectual competence. As a result
of this negative stereotyping, African Americans under
perform Anglos on measures of intellect.
Several theorists and educators believe that over a
period of time African American students may disengage from
the business of school. They may disengage from the
importance or relevance of academic achievement. For many
African American students success in school is not a basis
for self-evaluation or self-esteem. This lack of
identification with school results in lower motivation,
disruptive behavior, and ultimately lower achievement. The
Quality Education for Minorities Project (1990) reported
that nationally, while African American students represented
16% of all students in school, they accounted for 25% of all
suspensions and 35% of students placed in classes for the
educable mentally retarded. The report further states that
only 8% of the students in gifted and talented classes were
African American.
The focus of the Steele and Aronson (1995) study is on
the immediate situational threat to African American
students. It is the threat of being judged, of confirming
14
the group's negative stereotype about intellectual ability.
This threat is present even if the individual does not
believe in the stereotype. African American students only
need to know that it exists.
For African Americans, taking a test that is a measure
of intellectual ability may trigger this threat. When the
diagnostic evaluation instrument is frustrating or
challenging, the allegation of inferiority surfaces.
Because of a long history of negative stereotyping, African
American students may make a connection between their
individual inability to perform and an inability linked to
their race. This threat may cause the individual to divert
his/her attention from the task, to become self—conscious,
to become overly cautious, or to withdraw effort from the
task. A stereotype threat that causes any one of the
previously mentioned situations to occur would be expected
to undermine performance. Other groups not stereotyped in
such a negative fashion would not suffer from this
vulnerability.
Research Questions and Related Hypotheses
This research project focused on the concept of
"stereotype vulnerability" and its effect on third grade
African American students in relationship to the reading

15
portion of the Texas Assessment of Academic Skills. The
study answered the following research questions and related
hypotheses:
1. Is "stereotype vulnerability" reflected in the TAAS
results for a matched sample of third grade African American
and Anglo students? The related hypothesis is as follows:
A. There will be a significant difference between the
mean scores of a matched sample of third grade
African American and Anglo students on the Texas
Assessment of Academic Skills.
2. In a non-diagnostic activity are academically
matched African American students able to perform as well as
Anglo students? The related hypotheses are as follows:
A. There will be no significant difference between the
mean scores of a matched sample of third grade
African American and Anglo students in a non-
diagnostic reading activity.
B. There will be a significant difference between the
mean scores of a matched sample of third grade
African American and Anglo students in a non-
diagnostic reading activity with challenge.
3. Are elementary aged students cognizant of negative
stereotypical phrases often used to describe the
16
intellectual ability and school performance of African
Americans?
4. Are elementary aged students aware of the importance
of the results of the Texas Assessment of Academic Skills?
While Steele and Aronson (1995) focused on "stereotype
vulnerability" in Stanford undergraduate students, this
study focused on the applicability of this phenomenon in
third grade African American students as indicated by their
performance on the reading portion of the 1996-97 Texas
Assessment of Academic Skills. Third grade students were
selected because this was the first year they are required
to take the Texas Assessment of Academic Skills and a
pattern of under performance has not been established.
Definitions
Before proceeding, it is essential that definitions be
provided for the terms used in the introduction and the body
of this text. This clarification will assist in the
understanding and interpretation of the information. The
major terms and their definitions follow:
Academic Excellence Indicator System (AEIS) - This report is
published annually by the Texas Education Agency. It
provides information about the performance of 1,044
school districts. The report also provides comparison

17
data between the district, region, and state; between
similar campus groups; between student groups within
the individual campuses; and with previous performance.
African American - "A non-Hispanic person having origins in
any of the Black racial groups of Africa" (Texas
Education Agency, 1997-98, p.4.6). The term Black or
Black American will be used when reflected in the
literature. In all other instances the term
African American will be used.
Anglo - "A non-Hispanic person having origins in any of the
original peoples of Europe, North America, or the
Middle East" (Texas Education Agency, 1997-98, p.4.6).
The term White will be used when reflected in the
literature. In all other instances the term Anglo will
be used.
Economically Disadvantaged - This term is used to identify
students whose parents have been approved for federal
assistance. Economically disadvantaged students are
eligible for free or reduced meals under the National
School Lunch and Child Nutrition Program.
Public Education Information Management System (PEIMS) - The
Texas Education Agency requires submission of pertinent
data by all school districts and educational agencies.

18
This data collection system is used to gather
performance and profile information. The PEIMS data is
composed of five categories. These categories contain
information about district organization, district
finances, staff, students, and dropout students.
School Report Card - This Texas Education Agency document is
disseminated annually by individual campuses. It
contains information about the performance of Native
Americans, Asians, African Americans, Hispanics,
Whites, and economically disadvantaged students.
Stereotype - "A conventional, formulaic, and oversimplified
conception, opinion, or image"(Microsoft Bookshelf,
1994).
Stereotype vulnerability - The concept that "whenever
African American students perform an explicitly
scholastic or intellectual task, they face the threat
of confirming or being judged by a negative societal
stereotype - a suspicion - about their group's
intellectual ability and competence" ( Steele &
Aronson, 1995, p.797).
Texas Education Acrencv (TEA) - The state agency responsible
for education. Responsibilities include disbursing
funds to the local education agencies, interpretation

19
and enforcement of state and federal laws and
guidelines concerning education, coordination of
curriculum, accreditation of school districts, and
other functions and duties as specified by the Tgx^g
Education Code.
Texas Assessment of Academic Skills (TAAS) - The state-
mandated test of specific objectives in reading,
writing, and mathematics. The test is given annually
to students in grades 3 through 8 and grade 10.
Basic Assumptions
It was assumed that third grade African American and
Anglo students with equivalent or nearly equivalent first
semester language arts grades would have the same comparable
reading skill. If this assumption was valid, then the two
groups of participants should be capable of scoring equally
as well in all the tested situations. It was also assumed
that the teachers administered the experimental activities
and the TAAS test according to the outlined procedures and
that all students answered the questions to the best of
their ability. In addition, it was assumed that those
parents and students who volunteered to be interviewed did
so because of genuine interest in the study. It was
expected that the students, approximately eight and nine
20
years old, would be reticent in a semi-structured interview
situation.
Limitations
Data compiled and analyzed from this study are limited
in scope and describe only the selected population under
investigation. Participants in this study were selected
based on their ethnic classification as determined by the
Texas Education Agency and their first semester language
arts grade. Because the sample was not random and the
participants came from two suburban elementary schools
located in North Central Texas, the findings and conclusions
may be a result of this particular demographic environment.
The implementation of the experimental activities was
conducted by the participants' teacher in the natural
context of the classroom and not by the researcher.
Although every effort was made to standardize the
procedures, minor variations between classroom teachers and
differing classroom factors may have influenced the results.
The interview of the third grade students by the
researcher posed an additional limitation. The researcher
was also the participants' principal. This situation may
have prevented the students from being completely open and
honest. However, every effort was made to ensure that the
21
participants perceived the interview as non-threatening.
Although the limitations to this study are substantial,
the research questions and related hypotheses are worth
answering. The poor performance of African American
students on standardized tests has serious implications for
this group. Research that investigates possible reasons for
the discrepancy on test scores between ethnic groups can be
of benefit to educators at all levels.
Organization of the Remainder of the Study
Chapter 2 of this dissertation reviews the literature
in the areas of 1) stereotyping of African Americans in
contemporary American society, 2) awareness of ethnicity in
children, 3) stereotype formation and cognitive
associations, and 4) the effects of negative stereotyping.
Chapter 3 provides details of the methodology used in this
study. It includes a description of the participants, the
instrumentation, the procedures, and data analysis
procedures. Chapter 4 is an analysis of the data derived
from the individual student interviews and from the
collection of raw scores provided by the participants in
three distinct situations: non-diagnostic reading activity,
challenging non-diagnostic reading activity, and the 1997
spring administration of the Texas Assessment of Academic
22
Skills. Chapter 5 concludes the study. This chapter
discusses the findings and implications for educators,
connects the findings to the education of elementary
students, and offers suggestions for further study in this
area.
CHAPTER 2
REVIEW OF THE LITERATURE
African American students continue to lag behind their
Anglo counterparts in academic performance, most notably in
the area of standardized testing. This situation occurs
even when socioeconomic status is held constant. A 1995
experimental study by Steele and Aronson demonstrated that
knowledge of negative stereotypes by a stereotyped group
impacted academic performance when the performance was an
assessment of the individual's intellect. The research
revealed that the performance of African American
undergraduates at Stanford University was equivalent to that
of Anglo undergraduates, when the assessment was not
classified as an evaluation of intellect. However, when the
same assessment was given as an evaluation of intellect and
academic ability, the African American students scored
statistically lower than comparable Anglo students.
To provide .a satisfactory review of the background and
significance of this issue, the literature pertaining to the
following four main areas was investigated:
23
1. stereotyping of African Americans in contemporary
American society;
2. awareness of ethnicity in children;
3. stereotype formation and cognitive associations; and
4. the effects of negative stereotyping.
These areas are discussed individually. However,
collectively they focus on and support the concept of
"stereotype vulnerability."
Stereotyping of African Americans in
Contemporary American Society
The term stereotype can be defined as generalizations
about a social or racial class of people that helps an
individual distinguish one group from another group.
Stereotypical attributes have strong associative properties
that link or connect to a specific group. These attributes
become dimensions that differentiate social and racial
groups (McCauley, Stitt, & Segal, 1980, p.197). Through a
socialization process individuals learn a variety of
cultural stereotypes that become part of the associative
network of that individual (Ehrlich, 1973). Stereotypes
influence how we perceive and interpret others behavior
(Bethlehem, 1985), what we remember about others, and how we
behave toward others (S. Steele, 1990).
25
Dramatic shifts in the social and political climate of
this country have taken place over the past fifty years.
Racial discrimination is illegal and overt expressions of
racial prejudice are politically incorrect. In order to
understand if racial stereotyping of African Americans
csxists in contemporary American society it is necessary to
examine early studies relating to the stereotyping of this
ethnic group.
Katz and Braly (1933) developed an adjective checklist
which became the basic stereotype assessment technique used
by social scientists. Respondents, Princeton
undergraduates, were provided with a list of 84 adjectives
and were instructed to select words that characterized the
target group (African Americans). The participants were to
select the words that made up the cultural stereotype of
African Americans, disregarding their personal beliefs.
Ultimately they were asked to narrow their selection of
adjectives to the five words that most typified the target
group. The following figures indicate the percentage of
respondents who selected traits that dealt specifically with
the ambition and intellect of Blacks: 75% considered Blacks
lazy, 38% considered them ignorant, and 22% considered them
stupid. It should be noted that a clear distinction between
26
respondent beliefs and cultural perception is not evident.
Subsequent studies by Gilbert (1951), Karlins, Coffman,
and Walters (1969), and Dovidio and Gaertner (1986) of
Princeton undergraduates indicated that the stereotyping of
African Americans was decreasing. These studies used the
same adjective checklist and the same procedures used in the
1933 study by Katz and Braly. Gilbert's (1951) study showed
only 31% of the respondents choose lazy as an adjective that
was stereotypical of Blacks, 17% choose ignorant, and 10%
choose stupid. The 1969 Karlins, Coffman, and Walters's
research project revealed yet another decrease in the
frequency of negative trait selection for Blacks: 26%
selected lazy, 11% selected ignorant, and 4% selected
stupid. Data from the 1986 Dovidio and.Gaertner project
showed 12% selected lazy, 10% selected ignorant, and 1%
selected stupid to describe Blacks. From this data one
might draw the conclusion that the stereotyping of African
Americans has become progressively less negative over the
years.
However, research over the past ten years supports
different conclusions. Using figures from the 1986 Race and
Politics Survey, Sniderman and Piazza (1993) drew several
conclusions that conflict with earlier findings. Because it

27
is no longer politically and socially correct to speak of
race, little current research is available. Yet, in
situations where Americans do feel free to express their
opinions as few as
. . . . one in five and sometimes as many as one out of
every two - agree with frankly negative
characterizations of blacks, particularly
characterizations of blacks as irresponsible and as
failing to work hard and to make a genuine
effort to deal with their problems on their own (p.12).
Specifically, the study revealed that while only 6% of the
respondents believe Blacks are born with less innate
ability, 43% and 61% respectively believe that Blacks need
to try harder and that Blacks on welfare could find work if
they wanted to do so. The nature of contemporary racial
stereotypes is such that positive traits are more strongly
associated with Anglos and negative traits are more strongly
associated with African Americans (Aboud, 1988, p.29-44;
Dovidio, Evans, & Tyler, 1986, p.22).
Of course, many of the perceptions about African
Americans are based in reality. When directly examining
education, the data reveal that in general terms African
Americans do not do well in school. Even when income is not
28
a factor, African Americans scored only 737 on the 1990 SAT
test as compared to the 993 points scored by Anglos. The
data from the 1994 through 1996 spring administration of the
Texas Assessment of Academic Skills show that at every grade
level from 3rd to 8th grade and 10th grade, African American
students score below every other disaggregated ethnic group
and below those students classified as economically
disadvantaged.
Another rather startling statistic is that African
Americans are at least as likely as Anglos to hold a
negative view of African Americans (Pious and Williams,
1995, p.808; Sniderman and Pizza, 1993, p.45). Recent
research reports that while 34% of Anglos characterize
African Americans as lazy, 39% of African Americans agree
with this stereotypical attribute. Whenever there is a
statistically significant difference between the views of
African Americans and Anglo Americans, it takes the form of
African Americans expressing a more negative evaluation of
other African Americans than Anglos express (Pious and
Williams, 1995, p.810; Sniderman and Pizza, 1993, p.45).
A 1993 random-digit survey of 686 respondents (Pious
and Williams, 1995, p.809) supported earlier findings that
African Americans were more likely than others to endorse
29
racial stereotypes. Thirty-two percent of African Americans
agree with the statement that Anglos have more inborn
abstract thinking ability. Overall, African Americans (7 6%)
were more likely than Anglos to hold at least one negative
stereotype concerning the ability of their race.
Racial stereotyping appears to be more common among
poorly educated individuals. There is an inverse
relationship between education level and the number of
negative stereotypes expressed by participants. Those
individuals without a high school degree are 2 times as
likely to endorse a stereotype than those individuals
holding a graduate degree (Pious and Williams, 1995, p.807).
Stereotyping is also widely diffused among the young adults
of various income levels and educational backgrounds (Pious
and Williams, 1995, p.807; Sniderman and Pizza, 1993, p.53).
This stereotyping is not as prevalent in areas where the
populous is educated and predominately liberal in their
political views.
The majority of research does not distinguish between
high and low prejudice individuals and does not distinguish
between the knowledge of stereotypes of African Americans
and the endorsement of such stereotypes. However, studies
that do make these distinctions, found that low prejudice
30
individuals were as likely to be aware of negative
stereotypical attributes of African Americans as those
individuals rated as highly prejudiced (Devine, 1989, p. 5;
Devine and Elliot, 1995, p.1140). When a clear distinction
is made between knowledge of stereotypes and endorsement of
the stereotypes, low prejudiced individuals do not support
the negative characterizations of African Americans.
However, rejection of stereotypes concerning African
American intellect and ability does not automatically
eliminate them from an individual's associative network
(Devine, 1989, p.6; Devine and Elliot, 1995, p.1140).
Changing beliefs about Africans Americans does not remove
the stereotype from memory. It will remain a well organized
and frequently activated part of an individual's cognitive
system.
The most recent research by Devine and Elliot (1995)
differed from the original research and subsequent studies
that replicated the Katz and Braly (1933) study. The
difference was in the specific procedural requirements and
the addition of ten contemporary stereotypes of African
Americans. These additional characterizations included:
athletic, rhythmic, low in intelligence, poor, criminal,
hostile, and loud. Examination of only those adjectives
31
related to the intellect and ambition of African Americans
revealed that 4 6% of the respondents reported that Blacks
were lower than Whites in intelligence, 45% reported them as
lazy, and 14% choose ignorant as a descriptive adjective.
These statistics reflect the attributes most often selected
by low and high prejudiced respondents to characterize the
current African American stereotype. The divergence between
high and low prejudice respondents comes in their personal
beliefs. Less than 10% of the low prejudiced participants
believed that Blacks were lazy, ignorant, stupid, or low in
intelligence. In fact, 50% of this group rated Blacks as
intelligent (Devine and Elliot, 1995, p.1144). Most low
prejudiced respondents refused to endorse negative
generalizations about African Americans, while the response
of highly prejudiced participants held personal beliefs that
overlapped with their knowledge of stereotypical
generalizations.
The answer to the question, Do stereotypes of African
Americans persist in contemporary American society?, is yes.
Despite broad political and social reform, current research
indicates that consistent and negative racial stereotyping
of African Americans is still prevalent in contemporary
America. It remains very much a part of our cultural

32
fabric.
While personal beliefs about African Americans have
undergone revision, the negative stereotyping remains
constant and persistent.
The open expression of frankly negative
characterizations of blacks, without question, is
frowned on at many times and in some places. But if
one goes out into American society and talks with taxi
drivers or nurses or transportation executives or
school teachers or a host of others about problems of
race in American life, one would have to put blinders
on one's eyes and cotton batten in one's ears not to
see and hear the negative characterizations routinely
expressed about blacks (Sniderman & Piazza, 1993,
p.36).
Awareness of Ethnicity in Children
Recent studies support the statement that adult
Americans are aware of negative characterizations associated
with the African American race and this stereotyping is
still prevalent in our society. However, there are no
studies that directly ask children if they are aware of
stereotypical generalizations about African Americans. The
research involving children has mainly focused on the
33,
childs' awareness of their own and others ethnicity, their
preference or lack of preference for their own group, and
their cognitive development concerning race.
Most typical children become aware of self and ethnic
membership between the ages of three and seven (Allport,
1954, p.29; Bethlehem, 1985, p.213; Branch & Newcombe, 1986,
p.712, Comer, 1989, p.354). They are capable of
understanding that they belong to a specific ethnic group
and it is at this point they can experience the effects of
stereotyping.
Children in this age group have a sense of ethnic
identification but are not able to completely understand
what this membership signifies (Allport, 1954, p.29). They
establish preferences and have definite perceptions about
various ethnic groups. Four-year-olds often hold strong
prejudices toward different racial groups. During this age
span Anglo children express consistently negative attitudes
toward members of other ethnic groups, while African
American children are inconsistent in their expression of
negative attitudes. African American children are just as
likely to express negative attitudes about their own group
as they are about other ethnic groups (Aboud, 1988, p. 29-
44) .
34
Between ages 8 and 12 children's thinking becomes more
complex. They begin to categorize people and view them as
members of specific groups. This occurrence is both a
perceptual process of observation and a cognitive process of
generalization and categorization.
During this age span children begin to place themselves
and their families in the social status structure that
they have begun to observe. They begin to internalize
the attitudes about themselves held by powerful
individuals in their environment-parents, teachers,
others-and they often act on or react to these
expectations in a self-fulfilling manner. . . . Many
minority children have no way to understand the
inequities in the society as anything but deficits
within their own group (Comer, 1989, p.355).
Somewhere between 8 and 10 years old the focus shifts
from groups to individuals. Children become aware of the
unique qualities possessed by individuals. They begin to
understand that ethnicity is unchangeable (Aboud, 1988,
p.24).
Aboud (1988) offers an interesting explanation for the
evidence that indicates that both majority Anglo and half of
the minority African Americans children prefer Anglos.

35
Although his preference is strongly evident in children four
to eight it does continue to a lesser extent in older
children. He suggests that children who live in
heterogeneous societies are aware of social stratification.
Children as young as four years old show some awareness and
sensitivity to the status of Anglos and non-Anglos in their
society. Although children may not be aware of political
and economic status, they may understand that different
ethnic groups have different resources and that different
approval is given to different ethnic groups (Aboud, 1988,
p.100). Young children have a significant need for
approval. This need for approval and awareness of varying
approval between ethnic groups may account for some children
not preferring their own group. If young children are aware
of and sensitive to the varying approval of ethnic groups,
they may be aware of negative stereotyping of specific
ethnic groups.
Marc Elrich (1994), a fourth grade teacher in Maryland,
wrote a compelling essay entitled The Stereotype Within.
This anecdotal account depicts the awareness that some
African American children have concerning the negative
stereotyping surrounding their race. The class of 29, all
but two were African American or Hispanic, viewed a film

36
based on a Langston Hughes story about an African American
youth who tries to steal the purse of an African American
women. The women takes the youth in and showers him with
love and compassion. After viewing the film, Elrich asked
for the students' reactions. The following comments
summarized the students thoughts and received near consensus
among class members:
• Blacks are poor and stay poor because they're
dumber than whites (and Asians).
Black people don't like to work hard.
Black boys expect to die young and unnaturally.
White people are smart and have money.
Asians are smart and have money.
Asians don't like blacks or Hispanics.
Hispanics are more like blacks than whites. They
can't be white so they try to be black.
• Hispanics are poor and don't try hard because,
like blacks, they know it doesn't matter. They
will be like blacks because when you're poor, you
have to be bad to survive (Elrich, 1994, p.12-13).
These students were not only aware of negative stereotypical
attributes, they had internalized them. For these students
this was a portrait of who they were and how they were

37
expected to act.
The disproportionate number of African American and
Hispanic students , the socioeconomic level of these
children, and the small class size may not allow for
generalization to other elementary aged students. However,
it is evident that these 4th grade students were aware of
and were influenced by the negative stereotypical
characterizations of African Americans.
Elrich (1994) noted perceptions of African American
students as they spoke freely in a class discussion. Steele
and Aronson took this negative characterization of African
American students a step further. They noted, in an
experimental study, that African American students may not
believe or internalize these negative stereotypes but it
does impact their academic performance.
Stereotype Formation and Cognitive Associations
Current studies have determined that negative
stereotypical generalizations about African Americans
continues across American society. Although personal
beliefs about African Americans are more favorable, negative
attributes attached to the African American race are
persistent. In order to understand this phenomenon, this
section will examine the formation of stereotypes and the

38
relationship to cognitive functioning.
Stereotypes are forms of information that are applied
to perceptual or judgmental activities (Gilbert & Hixon,
1991, p.509). These attributes are features that are
descriptive of specific groups. Early research defined
stereotypical attributes in terms of the percentage of group
members that possess a given trait. Traditional research
methodology asked respondents to consider a number of
adjectives (attributes) and judge the value of each in
describing a particular ethnic group (Dovidio & Gaertner,
1982; Gilbert, 1951; Karlins, Coffman, & Walters, 1969; Katz
& Braly, 1933). This technique only assessed the
characterizations that were considered to be most
descriptive of the particular social group. This
methodology did not measure the degree or strength of
association between the attribute and cognitive processing.
Recently, social scientists have moved from simply
identifying the attributes used to describe a particular
group to understanding how stereotypes are represented in
cognitive functioning and the importance of this associative
processing. Theorists have established a link between
stereotypical attributes and knowledge structures (Dovidio,
Evans, & Tyler, 1986; Gaertner & McLaughlin, 1983, p.23).
39
"Conceptualizing stereotypes in terms of the attributes
that are relatively strongly associated with social
groups in memory has a particular advantage in that it
provides a theoretical framework . . . for explaining the
.influence of stereotypes on person perception" (Ford &
Stangor, 1992, p.356). Hamilton and Trolier (1986)
articulated the importance of the strength of this
association in defining a group stereotype. They noted that
attributes strongly associated with a particular racial
group form the content of the stereotype about the group.
Stereotyping also implies that generalizations associated
with a target group are ascribed to that group (Gaertner &
McLaughlin, 1983, p.23). This may help explain the
persistence of negative stereotypical attributes in
relationship to African Americans' intellect.
Ford and Stangor (1992) considered stereotypes in terms
of the strength of association between attributes and social
groups. Their study supported the hypothesis that
stereotypes that were strongly associated with a particular
group would come to mind first when one thinks of the group
or encounters a member of that group. This associative
process becomes automatic, unintentional, and spontaneous
(Niemann, Jennings, Rozelle, Baxter, & Sullivan, 1994,

40
p.380). The process does not require a conscious effort and
can be stimulated by clues in the environment (Devine, 1989;
Steele & Aronson, 1995) .
In addition to this automatic associative linking,
group differentiation is another important criterion for
stereotyping individuals. Those attributes that support a
clear differentiation between social or ethnic groups become
most strongly associated with the groups in memory.
Stereotype attributes associated with a particular group of
people grow out of generalizations about the group that
distinguishes it from others (McCauley, Stitt, & Segal,
1980, p.197). Attributes that distinguish members of a
target group from the population as a whole are more likely
to be seen as stereotypical of that group (McCauley & Stitt,
1978, p. 929).
In another study, Gaertner and McLaughlin (1983, p.30)
found that, regardless of prejudice scores, participants
responded more quickly when positive attributes were
associated with Whites (e.g. smart) than when they were
paired with Blacks. It was also noted that negative word
pairs were more rapidly associated with Blacks than positive
word pair associations. Gaertner and McLaughlin (1983) made
the assumption that attributes more swiftly recalled by a

participant were also more highly associated with the target
group. In contrast, those characterizations recalled more
slowly were relatively disassociated with the particular
group.
It is also important to note "that stereotypes in the
general population are quite consensual. Because all
individuals from a given culture presumably form their
stereotypes using a similar set of comparison groups, they
should thus form a similar set of stereotypes" (Ford &
Stangor, 1992, p.365). This supports the notion that the
negative stereotypical attributes associated with African
Americans is relatively consistent across the American
society.
Stereotypes allow individuals to simplify the
processing of interpersonal information. These cognitive
structures contain the perceiver's organized knowledge,
beliefs, and expectations about specific groups. They
influence how we interpret other's behavior (Bethlehem,
1985), what we remember about others, and how we behave
toward others (S. Steele, 1990). Stereotypes help
individuals deal with conflicting information (Ford &
Stangor, 1992, p.356). The most recent research by Steele
and Aronson (1995) reveals that the stereotyping of African

42
Americans may cause a decrease in academic performance when
that performance is a measure of intellectual ability.
Stereotypes are both psychologically fundamental and
socially dangerous (Gilbert & Hixon, 1991, p.515). They not
only affect expectations; they may also affect perception
(Nieman, et al. 1994, p.379). Attributes that are strongly
linked to groups in memory will be highly accessible when
interacting with members of the group and can be expected to
influence a person's perception (Ford & Stangor, 1992, 356).
Although they may ease the burden of perception, they may
also reduce its accuracy.
The Effects of Negative Stereotyping
The literature supports the concept that stereotypical
attributes are those characterizations that come to mind
automatically. In the case of African Americans,
predominately negative attributes form the content of
stereotypical generalizations about their race. This
section will examine the effects of negative stereotyping in
three areas: the relationship between social stigma and
self-esteem, racial anxiety and inferiority, and "stereotype
vulnerability."
It is well documented in the literature that African
Americans are characterized by predominately negative
43
stereotypes and are considered a stigmatized group, devalued
by society in general (Crocker & Major, 1989). This
prejudice, discrimination, and stereotyping have negative
social, economic, political, and psychological consequences.
It would logically follow that numerous psychological
theories have predicted that members of groups stereotyped
with negative attributes, specifically African Americans,
would have lowered global personal self-esteem. However,
empirical research does not support this theory. Two
studies concluded that African Americans have personal self-
esteem that is equal to or higher than Anglos (Crocker &
Major, 1989, p.608; Crocker, Voelkl, Testa, & Major, 1991,
p.219) .
What prevents individuals of stigmatized groups from
having a lowered self-esteem? Members in a stigmatized
group, such as African Americans, may protect their self-
esteem by attributing any negative feedback to prejudice.
.An experimental study by Crocker, et al. (1991) found when
Black college students received negative feedback and could
be seen by their evaluator, they attributed this feedback to
prejudice. Their global personal self-esteem was not
lowered.
The researchers also discovered another interesting
44
phenomenon. African American students discounted positive
feedback from an evaluator when they were aware of the fact
the evaluator knew their race. African American students
were sensitive to the underlying motives that might be
attached to this positive feedback. When the respondent was
aware that the evaluator knew their race they attributed
negative feedback to prejudice and discrimination and they
discounted positive feedback, assuming the evaluator did not
want to appear prejudiced. This ambiguity may lead to
negative consequences. Not knowing whether the negative
feedback is due to prejudice or lack of ability may cause an
inappropriate assessment of skills.
Another result of stereotyping or stigmatizing comes
when the members of this group may only compare themselves
to other group members and not to the advantaged group.
This may occur because of the lack of proximity to other
groups, the lack of information, or it may be a deliberate
act to protect one's self-esteem. The consequence of such
action is a limited frame of reference.
Negatively stereotyped individuals may also selectively
devalue those areas in which their group fares poorly and
value those areas in which their group does well (Crocker &
Major, 1989, p.226-227). African Americans have continually
45
performed below Anglos in school achievement. They
consistently receive negative feedback about this
performance. This has resulted, not in a lowering of the
individual's self-esteem, but in a subtle devaluing of
education by many African American students. People come to
devalue those dimensions on which they know their group
fares poorly (C. Steele, 1992, p.74-75; Tesser & Campbell,
1983.) They resist measuring themselves against the goals
established by the educational system. Many African
American students develop an attitude of not caring. This
is a protective mechanism that makes an individual less
suspectable to negative feedback and ultimately interferes
with intellectual performance (C. Steele, 1992, p.74).
It is, however, difficult for a negatively stereotyped
individual to devalue an area that is so valued by society
in general. Although this process of devaluing a dimension
on which one's group does poorly does not result in a
lowered self-esteem, it may well result in other
psychological problems. The stereotyped individual may well
lack confidence to perform task specific activities. They
may also lower their own performance expectations, resulting
in lowered motivation. "A pattern of devaluing domains or
attributes on which one's group is disadvantaged has the

46
potential to lead eventually to systematic group differences
in aspirations, skills, and achievement, even when
individual capabilities do not warrant these differences"
(Crocker & Major, 1989, p. 622).
Although studies have demonstrated that negative
stereotyping does not necessarily lower global personal
self-esteem, many African Americans fail to take advantage
of opportunities for advancement. Several economic measures
indicate that a significant number of African Americans are
presently further behind Anglos than before the civil rights
movement (S. Steele, 1990, p.15). Conditions for African
Americans have worsened even as prejudice and discrimination
have receded. During the 1980's African American enrollment
in college decreased dramatically while Anglo enrollment
increased. Even once enrolled, about 70% of African
American students drop out prior to graduation (C. Steele,
1992, p.68; S. Steele, 1990, p.16). This is just one
example of a flight from opportunity.
Shelby Steele (1990) suggests that African Americans
suffer a racial anxiety due to past oppression. "You cannot
be raised in a culture that was for centuries committed to
the notion of your inferiority and not have some doubt" (S.
Steele, 1990, p.25). He also suggests, regardless of an
47
individual's personal beliefs, no one is racially "color-
blind." Everyone sees color and makes attributions; some
may be negative.
The notion that African Americans are racially inferior
has resulted in many African Americans believing they are
victims of their society. Race should not be an advantage
or disadvantage for any group. The disadvantaged situation
of African Americans triggered the civil rights movement of
the sixties and African Americans for the first time were
afforded opportunities for real economic and political
power. S. Steele (1990) suggests that this African American
power is now linked to their status as a victim. Because of
this "victimization" attitude the individual member of the
race is demoralized and fails to take individual
responsibility for their actions. Unconsciously, African
Americans make society responsible for change. This results
in a passivity in one's personal life, reduces individual
initiative, and limits opportunities.
An additional consequence of this racial anxiety is the
development of self-doubt, an inferiority complex, due to
membership in the group. With every opportunity comes the
chance for success or failure. The relationship of African
Americans to this racial anxiety makes failure much more
48
devastating. A failure in any area not only triggers a
personal self doubt but triggers an affirmation of racial
inferiority.
When a white fails, he fails alone. His doubt is
strictly personal, which gives him control over the
failure. He can discover his mistakes, learn the
reasons he made them, and try again. But the black,
laboring under the myth of inferiority, will have this
impersonal, culturally determined doubt with which to
contend. This form of doubt robs him of a degree of
control over his failure since he alone cannot
eradicate the cultural myth that stings him. There
will be a degree of impenetrability to his failure that
will constitute an added weight of doubt (S. Steele,
1990, p.50).
Shelby Steele's (1990) philosophical approach to racial
anxiety is supported by the empirical research of Claude
Steele and Joshua Aronson (1995), concerning "stereotype
vulnerability." Steele and Aronson (1995) maintain that a
social-psychological predicament occurs from the persistent
negative stereotypes attributed to the African American
race. This results in a stereotype threat or a self
evaluative threat based on membership in a targeted race and

49
may influence subsequent behavior or performance (Bond,
1982; Steele & Aronson, 1995).
Standardized measures of African American students'
academic achievement remains behind Anglos. This situation
cannot be completely explained by disadvantages in
socioeconomic status or discrimination and prejudice. The
Steele and Aronson (1995) study suggests that whenever
African American students perform scholastic or intellectual
tasks, they face the threat of confirming their group's
negative stereotype concerning intellectual competence.
This vulnerability to racial stereotyping interferes with
the individual's intellectual functioning during difficult
standardized tests. It may also cause students to disengage
from the business of school or diminish the importance of
academic achievement. Success in school does not become a
basis for self-evaluation. This lack of identification with
school results in lower motivation, disruptive behavior, and
ultimately lower achievement.
For African Americans, taking a test that is a measure
of intellectual ability may trigger a situational threat.
If the test is frustrating the subtle allegation of
inferiority derived from negative stereotyping becomes more
plausible. Specifically, this vulnerability may interfere

50
with the thinking and information processing of a African
American student (Dovidio, Evans, & Tyler, 1986, p.23;
Devine, 1989, p.7). The student may become self-conscious
or embarrassed (Bond, 1982, p.1043), overly cautious, thus
spending more time on test items (Steele & Aronson, 1995,
p.102), or they may withdraw effort as a protection to self-
esteem (Crocker & Major, 1989, p.612). All of these factors
would ultimately undermine the performance of African
American students.
Steele and Aronson (1995) conducted four experiments
using psychology undergraduates at Stanford University. In
one situation African American and Anglo students were given
a 30 minute test that was described as diagnostic of
intellectual ability. The intent was to make the racial
stereotype about intellectual ability relevant to African
Americans. In another situation the same test was described
as a problem-solving exercise and was not considered
diagnostic of ability. The results confirmed the
hypothesis. In the non-diagnostic situation, there was no
significant difference between the performance of Anglo
students and African American students. However, in the
diagnostic situation the Anglo students out performed
African American students. In a subsequent study, the level

51
of general anxiety of the student was measured using the
Spielberger State Anxiety Inventory and the rate of response
to each test item was measured. The results showed that
African American students in the diagnostic activity
completed fewer items with less accuracy than Anglo
students.
If test diagnosticity triggers "stereotype
vulnerability," African American participants in this
situation should demonstrate greater cognitive activation of
the stereotype, stronger self-doubts related to ability,
greater disassociation from the stereotype, and greater
performance apprehension. An analysis of the data yielded
the following information: African American participants in
the diagnostic activity finished more race-related
completions than African Americans in the non-diagnostic
condition. African American respondents in the diagnostic
activity generated more self-doubt-related completions than
African Americans in the non-diagnostic activity. In the
diagnostic activity, African American subjects were more
avoidant of conforming to stereotypic images of African
Americans and they expressed an unwillingness to indicate
their race. These respondents also claimed self-
handicapping conditions when confronted with a diagnostic
52
activity. These impediments included lack of sleep, lack of
ability to focus, and verbalization about the unfairness of
the test items. Clearly the diagnostic instructions
associated with the activity caused African American
participants to experience apprehension, a threat to the
persistent negative stereotyping that exists in American
society.
In the final experiment, Steele and Aronson (1995)
manipulated the indication of race on the test form to
determine if signifying an individual's race resulted in
lower performance. African Americans in the race-primed
situation performed worse than any other group. In
contrast, African Americans in the no-race-primed situation
did as well as Anglos when the activity was not a test of
ability. Identifying race depressed the African Americans'
performance. This experiment demonstrates that the
knowledge of, not necessarily the belief in, a negative
racial stereotype is enough to depress African Americans'
scores even when the conditions are non-diagnostic of
intelligence and academic ability.
Summary
Gaps in school achievement and retention rates between
Anglos and African Americans is a concern for educators.
53
This situation continues to be present at all educational
levels and remains persistent in American society. As
emphasis on standardized testing increases, it is critical
that an attempt be made to identify and understand the
variables that depress the scores and academic achievement
of African American students.
Even when socioeconomic differences are not a variable,
something depresses the standardized test scores of African
American students. Steele and Aronson (1995) offer an
explanation for this discrepancy in academic achievement.
They maintain that African Americans students are negatively
impacted by "stereotype vulnerability." The cognitive
activation of this stereotype occurs when an individual
encounters someone in the stigmatized group or when an
individual in this group encounters a difficult task, such
as a standardized test. African American students, in fact,
are fearful of confirming the group stereotype that they are
less intelligent than Anglos. This fear or threat causes a
lack of self confidence and inhibits their performance in
diagnostic situations. The experimental work of Steele and
Aronson (1995) demonstrated that subtle changes in
procedures resulted in no statistically significant
difference between the two groups. When African Americans
54
believed the test was merely a problem-solving activity and
was not a reflection of their intellect, they scored as well
as their Anglo counterparts.
"What causes group stereotypes? We know that many
stereotypes exist and that, once stereotypes are in place,
various perpetuation processes make them disturbingly
resistant to change" (Schaller & O'Brien, 1992, p.776).
Stereotypes are generalizations or characterizations about a
social or racial class of people. These attributes help
individuals distinguish one group from another and are
strongly linked to cognitive functioning (Ehrlich, 1973;
McCauley, Stitt, & Segal, 1980). This information
influences our perception and judgement of others' behavior
(Bethlehem, 1985; Gilbert & Hixon, 1991), what is remembered
about others, and how we behave toward others. In addition,
these stereotypes often influence how the stereotyped group
functions (S. Steele, 1990).
In spite of dramatic changes in the social and
political environment of this country, African Americans are
still characterized by negative stereotypes ( Sniderman &
Piazza, 1993). The literature supports the fact that
positive traits are more strongly associated with Anglos
while negative traits are more often attributed to African
55
Americans (Aboud, 1988; Dovidio, Evans, Tyler, 1986). Both
Anglos and African Americans are aware of and often agree
with negative characterizations of the African American race
(Sniderman & Piazza, 1993).
Cognitive development of children between the ages of
three and seven allows them to become aware of racial
differences. Comer (1989) believes "Positive feelings about
race can enlarge a child's overall desirable sense of self.
Negative feelings about race can plant seeds of self-doubt
even among children who are developing well otherwise"
(p.354). African American children have no basis for
understanding these predominately negative stereotypes about
their race. They come to believe something is wrong with
their group (Comer 1989). Even when children do not believe
these negative characterizations they are negatively
impacted. Just an awareness that African Americans are
characterized negatively depresses the academic performance
of many African Americans (C. Steele, 1992; Steele &
Aronson, 1995). This perceived threat is disruptive enough
to depress intellectual functioning.
In the following chapters an examination of the concept
of "stereotype vulnerability" in 3rd grade African American
students is described. Chapter 3 outlines the procedures

56
and methodology for the study, Chapter 4 analyzes the data,
and Chapter 5 discusses the findings, and lists areas for
further study.

CHAPTER 3
PROCEDURES FOR COLLECTION AND TREATMENT
OF DATA
This chapter contains the following six sections: (a)
statement of the problem, (b) selection of sample, (c)
research questions (d) procedures used in collection of
data, (e) instrumentation, and (f) analysis of data.
Statement of the Problem
The problem of this study was to determine if
"stereotype vulnerability" affects the performance of third
grade African American students on the reading portion of
the Texas Assessment of Academic Skills.
Population
A non-random, purposive sampling technique was
employed. All third grade African American and Anglo
students, at two suburban elementary schools located in
north central Texas, were considered for this study. One
elementary school had ethnic representation as follows:
Anglo - 64%, African American - 17%, Hispanic - 8%, Asian -
8%, and other - 3%. Fifteen percent of the student
population qualified for the federal free and reduced lunch
57

58
program. The other elementary school had an Anglo
population of 8 9%, and an African American population of
10%. The remaining percentage contained students identified
as either Hispanic or Asian. Ten percent of the student body
at this particular elementary was eligible for the federal
free and reduced lunch program.
Further screening procedures eliminated those students
who were receiving special education services and who did
not have a first semester language arts grade of 70% or
better. Gender, socioeconomic status, and family
demographics were not controlled. Since there were far more
Anglo students than African American students, the
researcher attempted to match participants according to
their first semester language arts grade. The following
provides a brief description of the procedure: If an African
American participant had a language arts grade of 88% then
an Anglo student with a language arts grade of 88% was
selected. The selection of Anglo students was random and
based entirely on finding a student with a comparable or
nearly comparable language arts score. The first semester
language arts mean score for African Americans was 85.56%
and 88.72% for the Anglo students. From the available
population it was not possible to identify students with
59
exactly the same averages in every matched pair. However,
when it was impossible to match the grades exactly students
were matched with other students who had grades within two
percentage points of each other. This matching was used
only for selection purposes and was not used in the analysis
of data.
The rationale for this purposive selection of students
was to identify African American and Anglo students that
were capable, according to their academic grade, of passing
the Texas Assessment of Academic Skills. It was assumed
both groups of students had equal reading ability and
individual participants in both groups were equally
motivated to do well. The final sample consisted of 41
African American students and 41 Anglo students.
The identification of a student as either Anglo or
African American was based upon the ethnic information
provided by the parent. This information is managed by the
Texas Education Agency, the local district, and the
students' home campus. The information is available to
school personnel.
Research Questions and Related Hypotheses
This research project focused on the concept of
"stereotype vulnerability" and its effect on third grade
60
African American students in relationship to the reading
portion of the Texas Assessment of Academic Skills. The
study answered the following research questions and related
hypotheses:
1. Is "stereotype vulnerability" reflected in the TAAS
results for a matched sample of third grade African American
and Anglo students? The related hypothesis is as follows:
A. There will be a significant difference between the
mean scores of a matched sample of third grade
African American and Anglo students on the Texas
Assessment of Academic Skills.
2. In a non-diagnostic activity are academically
matched African American students able to perform as well as
Anglo students? The related hypotheses are as follows:
A. There will be no significant difference between the
mean scores of a matched sample of third grade
African American and Anglo students in a non-
diagnostic reading activity.
B. There will be a significant difference between the
mean scores of a matched sample of third grade
African American and Anglo students in a non-
diagnostic reading activity with challenge.
3. Are elementary aged students cognizant of negative
61
stereotypical phrases often used to describe the
intellectual ability and school performance of African
Americans?
4. Are elementary aged students aware of the importance
of the results of the Texas Assessment of Academic Skills?
While Steele and Aronson (1995) focused on "stereotype
vulnerability" in Stanford undergraduate students, this
study focused on the applicability of this phenomenon in
third grade African American students as indicated by their
performance on the reading portion of the 1996-97 Texas
Assessment of Academic Skills. Third grade students were
selected because this is the first year they are required to
take the Texas Assessment of Academic Skills in reading and
mathematics, and a pattern of under performance has not been
established.
Procedures Used in the Collection of Data
In order to examine the research questions and related
hypotheses the study was divided into two separate parts.
The qualitative portion attempts to answer the first two
research questions concerning the TAAS test and student
awareness of negative stereotypical phrases associated with
African American intellect. From the final two research
questions, three hypotheses were developed:

62
1. There will be no significant difference between the
mean scores of African American and Anglo students in a non-
diagnostic reading activity.
2. There will be a significant difference between the
mean scores of African American and Anglo students in a non-
diagnostic reading activity with challenge.
3. There will be a significant difference between the
mean scores of African American and Anglo students on the
third grade reading portion of the Texas Assessment of
Academic Skills. The hypotheses are stated in the direction
that supports the findings of the Steele and Aronson (1995)
study.
Procedures for each part of the study will be discussed
independently.
Qualitative
For this portion of the study a semi-structured
interview technique was employed. Letters were sent to 7 9
of the 82 participants (Appendix B). Three participants did
not have a complete mailing address on file. An addressed,
stamped envelope was included with the letter. One
correspondence was returned for an improper address. Of the
remaining 78 participants, 27 parents and students agreed to
be part of the study. Four parents declined and 48 failed
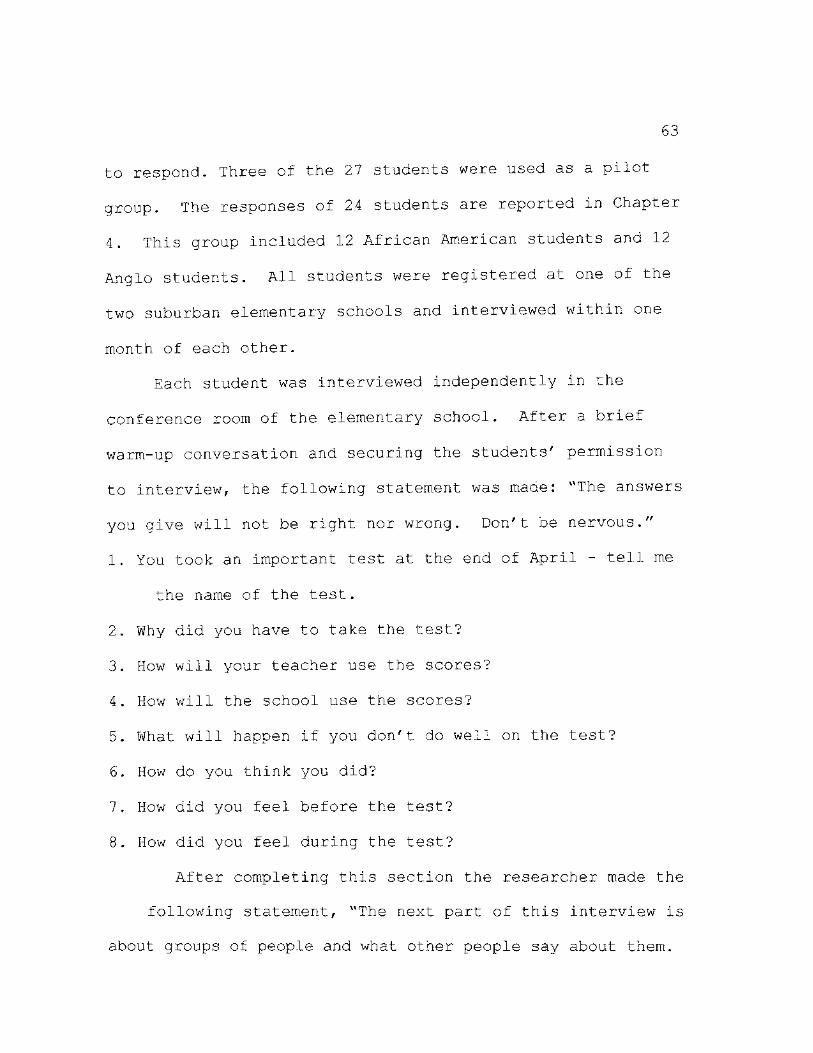
63
to respond. Three of the 27 students were used as a pilot
group. The responses of 24 students are reported in Chapter
4. This group included 12 African American students and 12
Anglo students. All students were registered at one of the
two suburban elementary schools and interviewed within one
month of each other.
Each student was interviewed independently in the
conference room of the elementary school. After a brief
warm-up conversation and securing the students' permission
to interview, the following statement was made: "The answers
you give will not be right nor wrong. Don't be nervous."
1. You took an important test at the end of April - tell me
the name of the test.
2. Why did you have to take the test?
3. How will your teacher use the scores?
4. How will the school use the scores?
5. What will happen if you don't do well on the test?
6. How do you think you did?
7. How did you feel before the test?
8. How did you feel during the test?
After completing this section the researcher made the
following statement, "The next part of this interview is
about groups of people and what other people say about them.
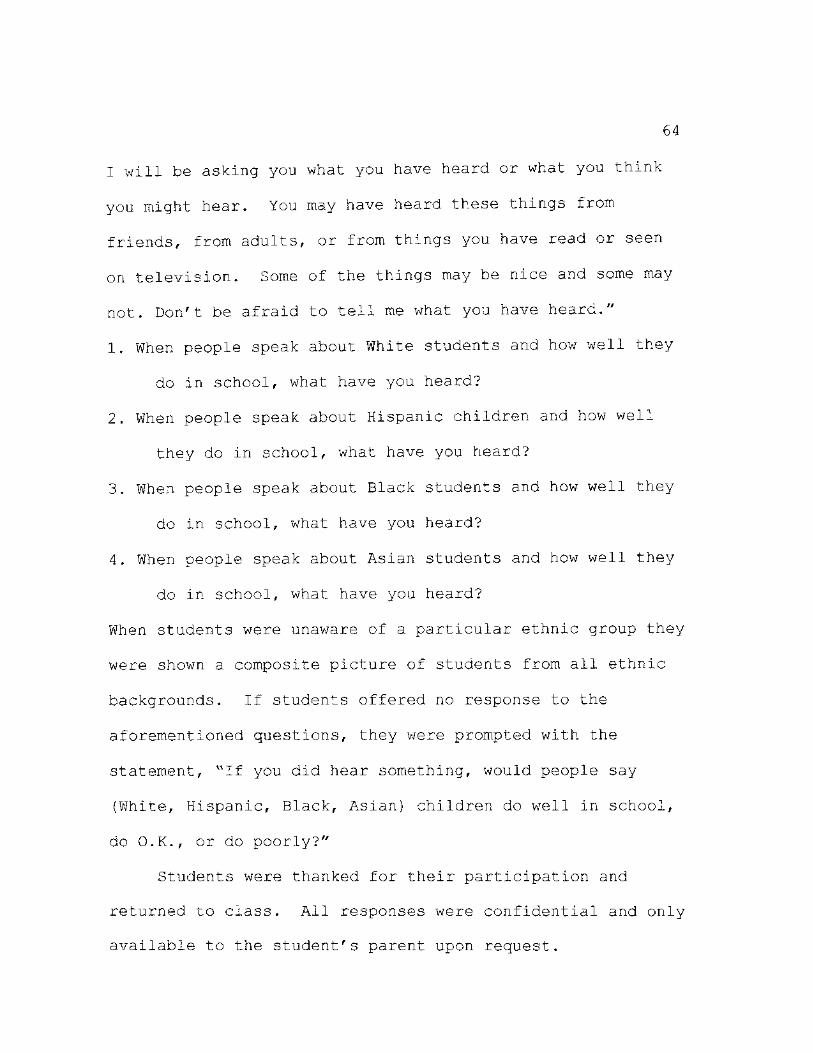
64
I will be asking you what you have heard or what you think
you might hear. You may have heard these things from
friends, from adults, or from things you have read or seen
on television. Some of the things may be nice and some may
not. Don't be afraid to tell me what you have heard."
1. When people speak about White students and how well they
do in school, what have you heard?
2. When people speak about Hispanic children and how well
they do in school, what have you heard?
3. When people speak about Black students and how well they
do in school, what have you heard?
4. When people speak about Asian students and how well they
do in school, what have you heard?
When students were unaware of a particular ethnic group they
were shown a composite picture of students from all ethnic
backgrounds. If students offered no response to the
aforementioned questions, they were prompted with the
statement, "If you did hear something, would people say
(White, Hispanic, Black, Asian) children do well in school,
do O.K., or do poorly?"
Students were thanked for their participation and
returned to class. All responses were confidential and only
available to the student's parent upon request.

65
Quantitative
The quantitative portion of this study consisted of
three independent situations. The first activity was a non-
diagnostic reading activity given to 329 third grade
students at two suburban schools located in north central
Texas. The activity was given in the natural context of the
classroom by the participants' homeroom teachers. There
were 16 teachers involved in administering the activity.
All enrolled students were asked to participate in the
experiment in order to provide a natural environment and
control for bias. Only the scores of the selected 82
students were tabulated and subjected to statistical
analysis. The scores from the remaining 247 students did
not meet the previously established qualifications for
participation in this study nor were they randomly selected.
A complete set of tests was provided for each teacher.
The following procedural statement was included in each
packet:
Administer the activity prior to April 24, 1997.
Allow students as much time as necessary. Encourage them to
do a good job and complete the activity. Please have
students put their name on the top of the packet. After the
students have completed the activity put all papers in the
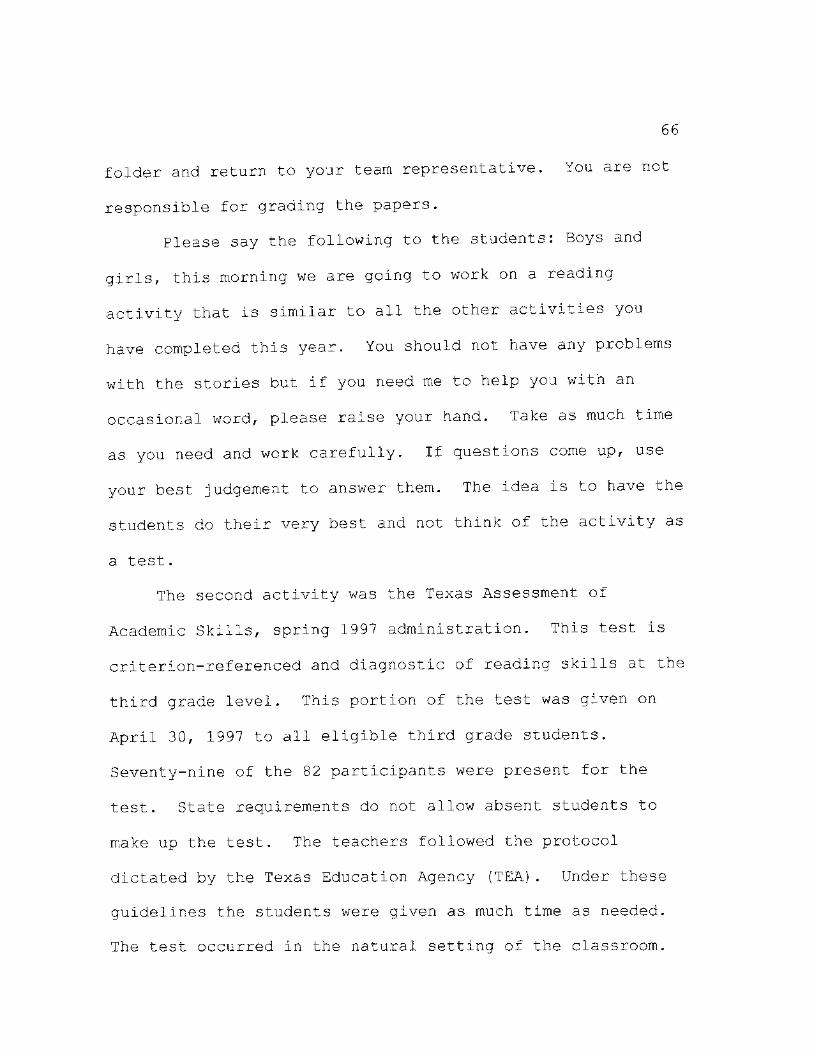
66
folder and return to your team representative. You are not
responsible for grading the papers.
Please say the following to the students: Boys and
girls, this morning we are going to work on a reading
activity that is similar to all the other activities you
have completed this year. You should not have any problems
with the stories but if you need me to help you with an
occasional word, please raise your hand. Take as much time
as you need and work carefully. If questions come up, use
your best judgement to answer them. The idea is to have the
students do their very best and not think of the activity as
a test.
The second activity was the Texas Assessment of
Academic Skills, spring 1997 administration. This test is
criterion-referenced and diagnostic of reading skills at the
third grade level. This portion of the test was given on
April 30, 1997 to all eligible third grade students.
Seventy-nine of the 82 participants were present for the
test. State requirements do not allow absent students to
make up the test. The teachers followed the protocol
dictated by the Texas Education Agency (TEA) . Under these
guidelines the students were given as much time as needed.
The test occurred in the natural setting of the classroom.
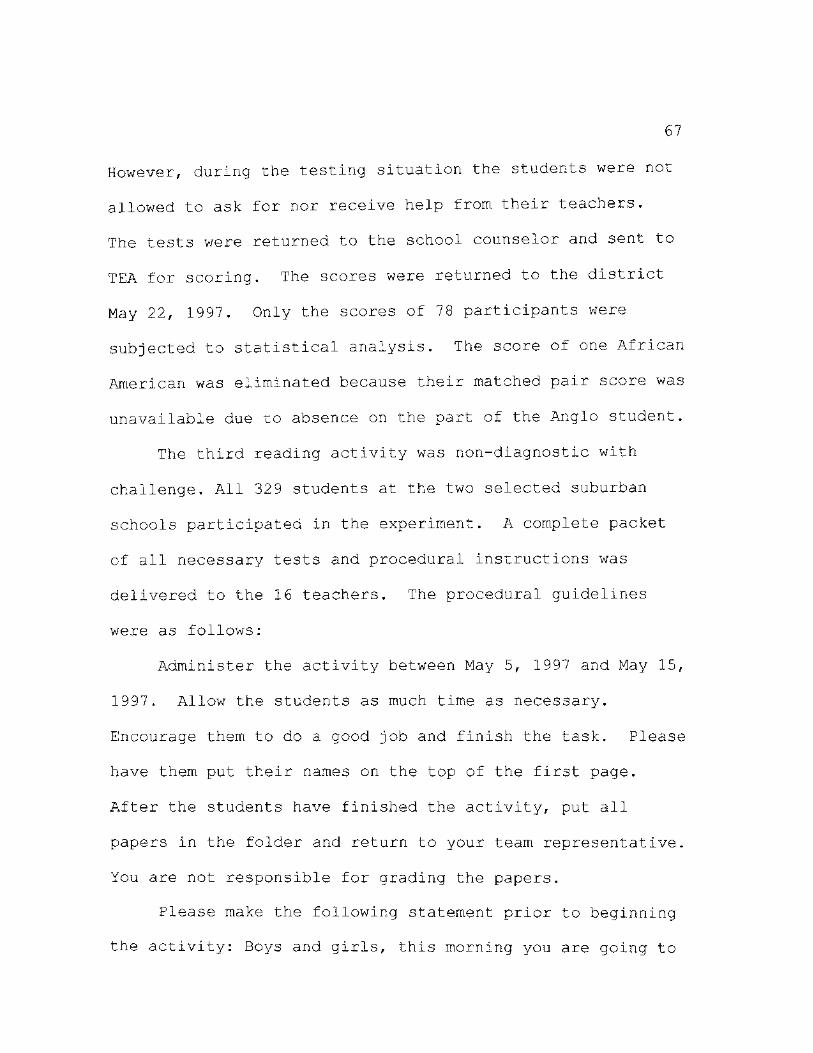
67
However, during the testing situation the students were not
allowed to ask for nor receive help from their teachers.
The tests were returned to the school counselor and sent to
TEA for scoring. The scores were returned to the district
May 22, 1997. Only the scores of 78 participants were
subjected to statistical analysis. The score of one African
American was eliminated because their matched pair score was
unavailable due to absence on the part of the Anglo student.
The third reading activity was non-diagnostic with
challenge. All 329 students at the two selected suburban
schools participated in the experiment. A complete packet
of all necessary tests and procedural instructions was
delivered to the 16 teachers. The procedural guidelines
were as follows:
Administer the activity between May 5, 1997 and May 15,
1997. Allow the students as much time as necessary.
Encourage them to do a good job and finish the task. Please
have them put their names on the top of the first page.
After the students have finished the activity, put all
papers in the folder and return to your team representative.
You are not responsible for grading the papers.
Please make the following statement prior to beginning
the activity: Boys and girls, this morning you are going to

68
work on a reading activity that is more difficult than
anything you have done this year. You will notice that the
print is smaller and the stories are longer. These reading
selections are written on a fourth grade level. Since you
are all going to become fourth graders I thought you could
do this. The information will be used to help the fourth
grade teachers; so please do your best. I want to show them
how smart you all are. If you have trouble with a word
raise your hand and I will help you.
You may need to add more information if the students
ask. Use you best judgement. The idea is to have the
students do their very best and not think of the activity as
a test.
Instrumentation
The interview portion of this study was based on the
research of Branch and Newcombe (1986), Niemann, Jennings,
Rozelle, Baxter, & Sullivan (1194), and Katz (1981).
Information for compiling the participant responses was
based on the text of Bogdan and Biklen, Qualitative Research
for Education, and Glesne and Peshkin's, Becoming
Qualitative Researchers.
In order to maximize the response of third grade
students, the interview was structured to allow an open-
69
ended response. This free response technique was used by
Niemann, Jennings, Rozelle, Baxter, & Sullivan (1994) in an
experiment that examined the stereotypes of eight groups.
The respondents in this study were told that they were
participating in an activity to determine how people are
perceived. The list included 4,578 responses from 259
ethnically diverse University of Houston students in
introductory psychology classes. The responses were then
clustered into 17 categories.
Another study by Branch and Newcombe (1986) assessed
the development of racial attitudes among young African
American children. The researchers asked African American
children several questions about their race, their feelings
about being African American, and their relationships with
Anglo people. The responses were categorized into three
groups.
It was also noted by Katz (1981) that individuals tend
to suppress negative attitudes toward stigmatized groups.
However, these negative feelings are more readily tapped by
allowing for indirect or private responses. Therefore a
semi-structured, open-ended interview was conducted
privately with the 24 students.
The instrumentation used in the non-diagnostic activity

70
(1996 3rd grade TAAS), the Texas Assessment of Academic
Skills (1997 3rd grade TAAS), and the challenging non-
diagnostic activity (1997 4th grade TAAS) was determined to
be valid and reliable. The following information concerning
test validity and reliability was compiled in the Texas
Stvdent Assessment Program Technical Digest for the Academic
Year 1992-93. The information was presented to the Texas
Education Agency as a collaborative effort of the Technical
Digest Group, National Computer Systems, The Psychological
Corporation, and Measurement Incorporated.
The Texas Assessment of Academic Skills is a
criterion-referenced testing program designed to assess
problem-solving and critical thinking. The test was
implemented in October of 1990. The TAAS test originally
assessed academic skills in grades 3,5,7,9, and 11 (exit
level). In its current form the test assesses student
performance at grades 3 through 8 and grade 10 (exit level).
National Computer Systems (NCS), The Psychological
Corporation (TPC) of San Antonio, Texas, and Measurement
Incorporated (MI) of Durham, North Carolina and Austin,
Texas in conjunction with the Texas Education Agency were
the contractors in the development and piloting of the Texas
Assessment of Academic Skills. The items for the TAAS were
71
written by item writers with experience in item development
for standardized achievement tests and criterion-referenced
test instruments. The items were submitted to TPC and
reviewed by testing experts, content experts, and former
teachers. The items were screened for internal bias. This
screening checked for fairness regarding the depiction of
minority and gender groups, the appropriateness and clarity
of language, and the artwork. The Texas Education Agency
performed a final review of the test items examining
content, difficulty, appropriateness, and potential
cultural, ethnic, or gender bias.
After extensive reviews, the items were field tested
using actual student responses from representative samples
of students from across the state. After the field test,
the items were again reviewed by an additional educational
committee. Items that passed all stages of development,
review, field test, and data review are placed in the item
data bank and are eligible for use on future TAA.S test forms
(Texas Education Agency 1992-1993) .
This section provides specific information on the
validity and reliability of the Texas Assessment of Academic
Skills and comes directly from the educational agency.
Content validity describes whether the test objectives,
72
represent what students should be able to do and whether the
items, based on these objectives, measure the intended
behaviors. Construct validity is the extent to which a test
can be said to measure a theoretical construct. In the case
of the Texas Assessment of Academic Skills the
two measures of validity are intertwined. To insure the
highest level of content/construct validity the Texas
Education Agency formed advisory committees to review the
test objectives, instructional targets, specifications, and
test items.
Criterion related validity indicates the relationship
between test performance and performance on some other
measure. The TAAS test scores have been correlated with
other measures in three ways:
TAAS test scores for all grade levels are correlated
with same subject course grades. Validity estimates
were determined using over 12,000 fifth grade students
with approximately four months between measures. The
fall of 1992 validity coefficients were .58 for
writing, .60 for reading, and .60 for mathematics.
• The fall of 1991 TAAS test scores for grades 4, 8, and
exit level were correlated with same subject test
scores from the spring of 1992 Norm-referenced

73
Assessment Program for Texas (NAPT). Correlations
between the two tests range from .56 to .65 for
writing, .68 to .74 for reading, and .67 to .77 for
mathematics.
• The fall of 1991 TAAS test scores for grade 11 students
were correlated with same subject Texas Academic Skills
Program. The TASP is a criterion-referenced test that
is administered statewide to college students (TEA,
1992-1993).
Correlations between scores on the TAAS and TASP were .32
for writing, .62 for reading, and .74 for mathematics.
These low scores may indicate a lack of correlation between
initial testing, student grades, and the Norm—referenced
Assessment Program for Texas.
Test reliability indicates the consistency of
measurement. TAAS test reliabilities are based on internal
consistency measures, specifically on the Kuder-Richardson
Formula Number 20. KR-20 reliabilities range from .75 to
.94, with most being in the high .80 to low .90 range.
Mathematics and reading reliabilities are generally slightly
higher than writing test reliabilities.
The Texas Education Agency supports the validity and
reliability of the items used on the previous assessment

74
instruments.
Analysis of Data
For the purpose of this study, it was assumed the
responses of the third grade students to the three
independent reading activities were normal and variations
were due to comfort level and background experiences. The
number of correct answers were tabulated for each activity
and categorized according to the student's ethnicity
(Appendix C). The responses of African American students
were grouped and compared to the responses of Anglo students
for like testing situations.
Data were analyzed using Statistical Packages for the
Social Sciences (SPSS). Descriptive statistical analysis
yielded the mean and standard deviation for each group under
the three varying conditions. A Pearson product-moment
correlation was calculated to determine the relationship
between the three reading activities.
The selection of subjects was based on ethnicity and
first semester language arts grades. It was assumed student
groups were similar in intellect and educational background.
The difference in ethnicity was the only factor separating
the subjects into categories. Homogeneity of variance was
calculated to support the assumption of like student
75
populations. The null hypothesis assumed the variances in
the population selected were equal. Not rejecting this
hypothesis confirmed homogeneity of variance.
Further analysis of data revealed raw scores at the
upper end of the scale. Skewness of scores was tabulated
for combined group, African American, and Anglo students.
The Wilcoxon matched-pairs signed rank test was
calculated to examine the stated hypotheses under varying
conditions. A .05 level of significance was used to reject
or retain the stated hypotheses.
This statistical analysis is used when the ordinal data
from two sample groups does not meet the parametric
assumptions of normality and variance. In this case, African
American and Anglo third grade students were selected
according to their respective language arts grade. It was
assumed the sample groups were comparable in reading
ability. The only variable being ethnicity. The
purposively selected students represented a subpopulation of
the entire third grade student body at two elementary
schools. The participants were then subjected to three
reading activities under varying conditions.
The qualitative portion of this study interviewed 24
African American and Anglo students. The student responses
76
were categorized according to question answered and
ethnicity. Commonalities and variances in response were
noted.
The results of the statistical analysis of the three
independent reading activities and student interview
responses are interpreted and presented in Chapter 4.
Chapter 5 provides a summarization of the study, findings, a
discussion of the findings, and recommendations for future
study in this area.

CHAPTER 4
PRESENTATION AND ANALYSIS OF DATA
Third grade African American and Anglo students were
given reading activities under three varying conditions to
determine if African American students were adversely
affected by "stereotype vulnerability." Under the first
condition both groups of students were asked to complete a
reading activity on third grade level. The students
understood the activity was non-diagnostic and was not a
reflection of their intellect. Data analysis lists this
activity as Test 1. The second activity remained non-
diagnostic but increased in level of difficulty. The
students were presented a reading activity written at a
fourth grade level. Data analysis lists this activity as
Test A . The third activity was the Texas Assessment of
Academic Skills 1996 -1997 spring administration. The
students understood this activity to be a test of their
basic skill level in reading. Data analysis lists this
activity as Test 3.
Data from the tests were tabulated and analyzed by
computer. Tables reported in this study were constructed
77
78
from computer-generated statistical analyses. Following is
a presentation of the data.
Research Questions and Related Hypotheses
The following research questions and related hypotheses
provided direction for conducting this study:
1. Is "stereotype vulnerability" reflected in the TAAS
results for a matched sample of third grade African American
and Anglo students? The related hypothesis is as follows:
A. There will be a significant difference between the
mean scores of a matched sample of third grade
African American and Anglo students on the Texas
Assessment of Academic Skills (Test 3).
2. In a non-diagnostic activity are academically
matched African American students able to perform as well as
Anglo students? The related hypotheses are as follows:
A. There will be no significant difference between the
mean scores of a matched sample of third grade
African American and Anglo students in a non-
diagnostic reading activity (Test 1).
B. There will be a significant difference between the
mean scores of a matched sample of third grade
African American and Anglo students in a non-
diagnostic reading activity with challenge
79
(Test 2).
3. Are elementary aged students cognizant of
negative stereotypical phrases often used to describe the
intellectual ability and school performance of African
Americans?
4. Are elementary aged students aware of the importance
of the results of the Texas Assessment of Academic Skills?
Reporting of Statistical Data
The following narrative addresses research questions 1
and 2 and the related hypotheses with regards to group and
varying conditions. Research questions 3 and 4 are
addressed in the following section - Qualitative Results.
A review of the relationship between Test 1, Test 2,
and Test 3, shown in Table 1, indicates a significant
positive correlation between the activities. Those students
who scored high on Test 1 also scored high on Test 2 and
Test 3. In general, student performance remained consistent
across the activities regardless of teacher instructions and
testing conditions.

80
Table 1
Pearson Product-Moment Correlation Coefficient of Student
Populations Under Varying Conditions
Combined Groups Activity Test 1 Test 2 Test 3
Test 1 .7244 .8130
Test 2 — .7555
Test 3 X 30.963 27.354 31.671
S 5.015 7.107 4.787
African American
Test 1 .7520 .7979
Test 2 — .7723
Test 3 —
X 31.049 27.780 31.775
S 4.785 6.777 4.594
Anglo
Test 1 .7025 .8270
Test 2 — .7408
Test 3 —
X 30.878 26.972 31.564
S 5.292 7.481 5.036
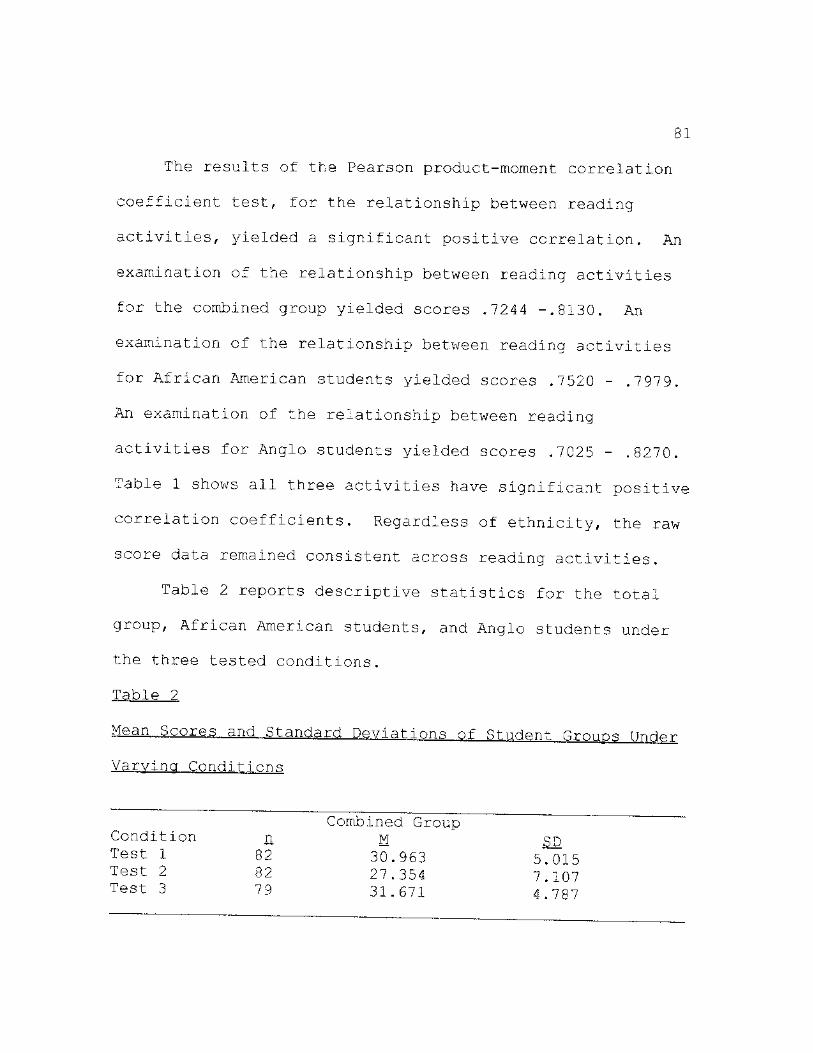
81
The results of the Pearson product-moment correlation
coefficient test, for the relationship between reading
activities, yielded a significant positive correlation. An
examination of the relationship between reading activities
for the combined group yielded scores .7244 -.8130. An
examination of the relationship between reading activities
for African American students yielded scores .7520 - .7979.
An examination of the relationship between reading
activities for Anglo students yielded scores .7025 - .8270.
Table 1 shows all three activities have significant positive
correlation coefficients. Regardless of ethnicity, the raw
score data remained consistent across reading activities.
Table 2 reports descriptive statistics for the total
group, African American students, and Anglo students under
the three tested conditions.
Table 2
Mean Scores and Standard Deviations of Student Rronns Under
Varying Conditions
Combined Group Condition n M SD T e s t 1 82 30.963 5.015 T e s t 2 82 27.354 7.107 T e st 3 79 31.671 4.787
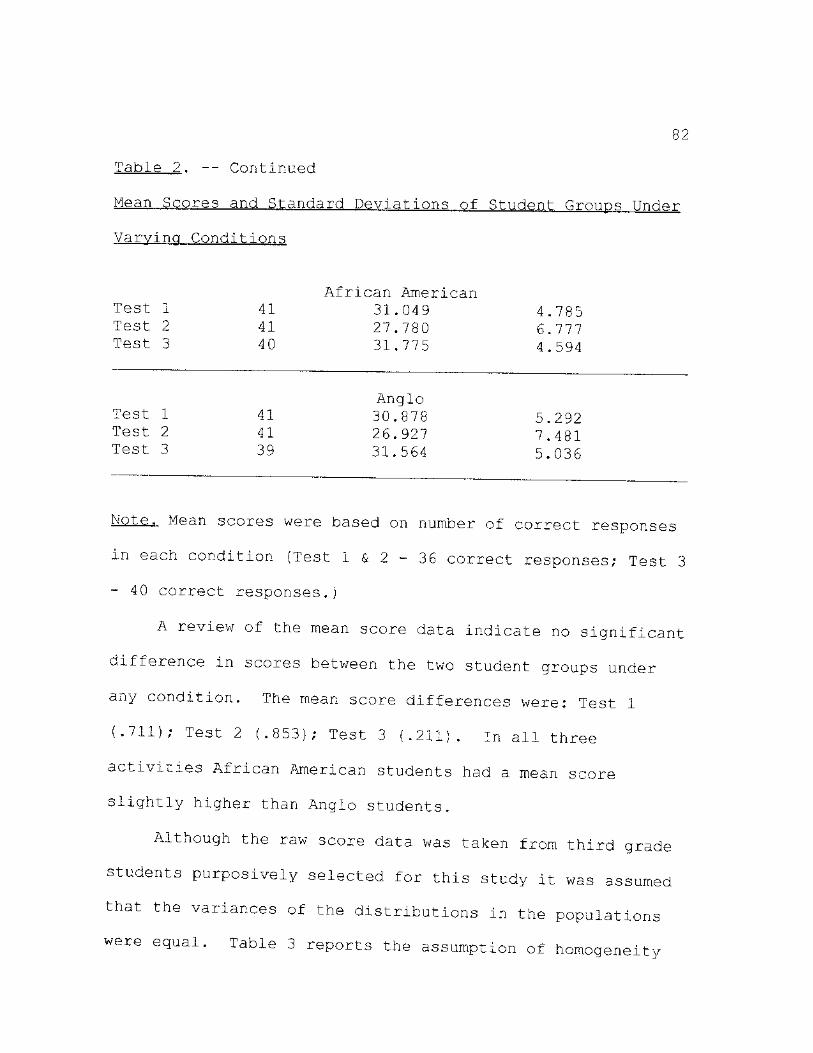
82
Table 2. — Continued
Varvina Conditions
African American Test 1 41 31.049 4.785 Test 2 41 27.780 6.777 Test 3 40 31.775 4.594
Anglo Test 1 41 30.878 5.292 Test 2 41 26.927 7.481 Test 3 39 31.564 5.036
Note. Mean scores were based on number of correct responses
in each condition (Test 1 & 2 - 36 correct responses; Test 3
- 40 correct responses.)
A review of the mean score data indicate no significant
difference in scores between the two student groups under
any condition. The mean score differences were: Test 1
(.711); Test 2 (.853); Test 3 (.211). in all three
activities African American students had a mean score
slightly higher than Anglo students.
Although the raw score data was taken from third grade
students purposively selected for this study it was assumed
that the variances of the distributions in the populations
were equal. Table 3 reports the assumption of homogeneity
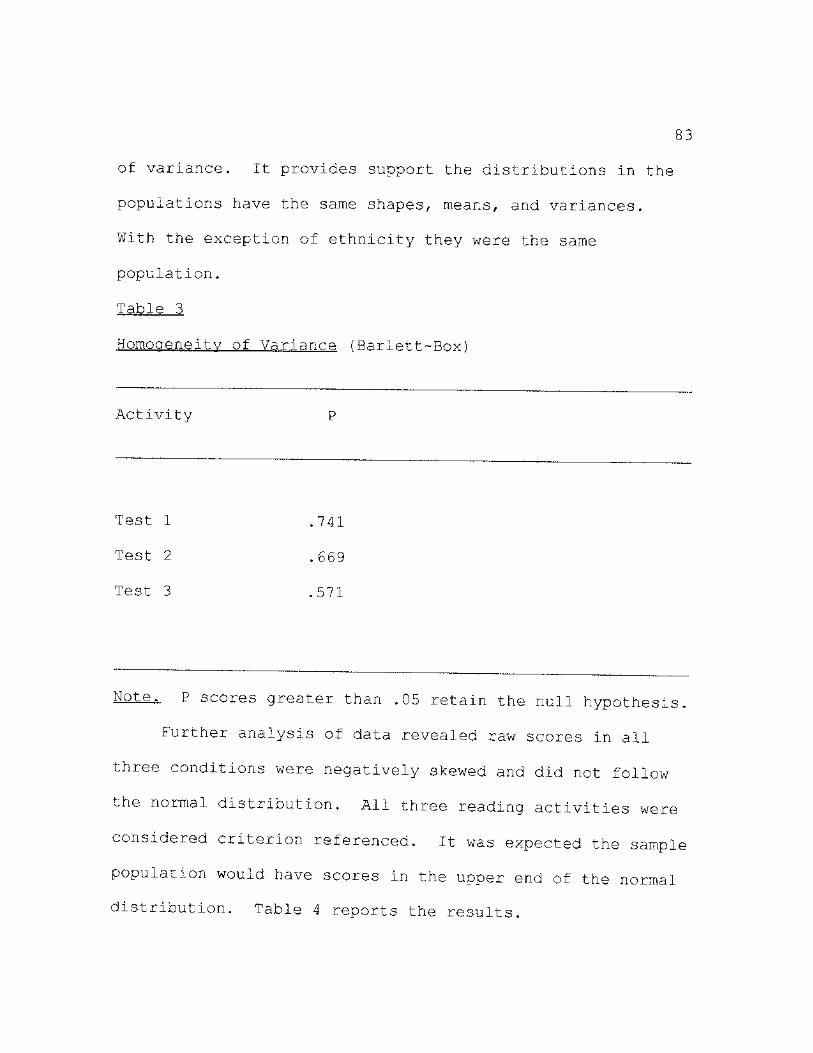
83
of variance. It provides support the distributions in the
populations have the same shapes, means, and variances.
With the exception of ethnicity they were the same
population.
Table 3
Homogeneity of Variance (Barlett-Box)
Activity p
Test 1 .741
Test 2 .669
Test 3 .571
Note. P scores greater than .05 retain the null hypothesis.
Further analysis of data revealed raw scores in all
three conditions were negatively skewed and did not follow
the normal distribution. All three reading activities were
considered criterion referenced. It was expected the sample
population would have scores in the upper end of the normal
distribution. Table 4 reports the results.

84
Table 4
Skewness of Scores for Combined Group. African American, and
Anglo Students Under Varying Conditions
Activity Skewness Minimum Maximum
Combined Group
Test 1 -1.697 12.00 36.00
Test 2 - .666 7.00 40.00
Test 3 -1.629 17.00 36.00
African American
Test 1 -1.668 15.00 36.00
Test 2 - .423 10.00 30.00
Test 3 -1.791 18.00 36.00
Anglo
Test 1 -1.757 12.00 36.00
Test 2 -. 839 7.00 31.00
Test 3 -1.542 17.00 36.00
Parametric tests assumed the normal distribution of
scores. Table 4 yielded scores located at the higher end of
the distribution.
The Wilcoxon matched—pairs signed rank test for
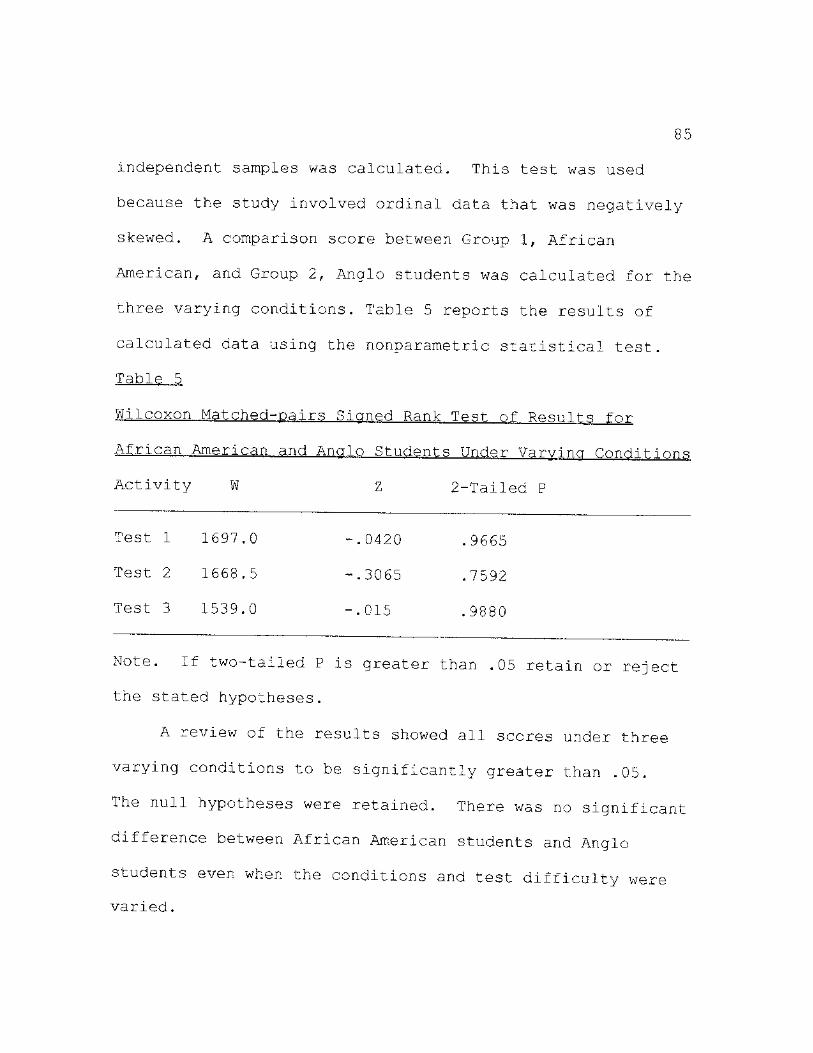
85
independent samples was calculated. This test was used
because the study involved ordinal data that was negatively
skewed. A comparison score between Group 1, African
American, and Group 2, Anglo students was calculated for the
three varying conditions. Table 5 reports the results of
calculated data using the nonparametric statistical test.
Table 5
Wilcoxon Matched-pairs Signed Rank Test of Results for
African American and Analo Students Under Varying Conditions
Activity W z 2-Tailed P
Test 1 1697.0 -.0420 .9665
Test 2 1668.5 -.3065 .7592
Test 3 1539.0 -.015 .9880
Note. If two-tailed P is greater than .05 retain or reject
the stated hypotheses.
A review of the results showed all scores under three
varying conditions to be significantly greater than .05.
The null hypotheses were retained. There was no significant
difference between African American students and Anglo
students even when the conditions and test difficulty were
varied.
Qualitative Results
The following narrative addresses the qualitative
portion of the study. Letters requesting permission to
interview children were sent to the parents of the 79
students selected to participate in the study. The two
additional students selected for participation in the study
did not have a correct address on file with the school.
Student selection was based on ethnicity and first semester
language arts grade. A total of 24 parents and students
responded positively. Twelve African American students and
12 Anglo students agreed to be interviewed. The interviews
were conducted individually on the participants' school
campus.
Research Questions Investigation
This research project focused on the concept of
"stereotype vulnerability" and its effect on third grade
African American students in relationship to the reading
portion of the Texas Assessment of Academic Skills. The
following research questions provided direction for
conducting the qualitative portion of this study:
Research Question 3. Are elementary aged students
cognizant of negative stereotypical phrases often used to
describe the intellectual ability and school performance of

87
African Americans?
Research Question 4. Are elementary aged students aware
of the importance of the results of the Texas Assessment of
Academic Skills (TAAS)?
Reporting of Qualitative Data
The following narrative addresses these two research
questions with regards to student responses during the
interview. The first question asked each student to name
the important test taken approximately one month prior to
the interview. All 24 participants responded by saying,
"TAAS test." None of the students needed prompting, nor
were confused nor hesitant to answer the question. The TAAS
test is the statewide third assessment of reading and math
given in the spring of each school year.
The second question asked the student to identify
reasons for taking the TAAS test. Table 6 shows a
comparison of responses between the African American and
Anglo students. Again, students needed no prompting to
respond to the question. The phrases listed in Table 6
indicate the responses of the interviewed students.
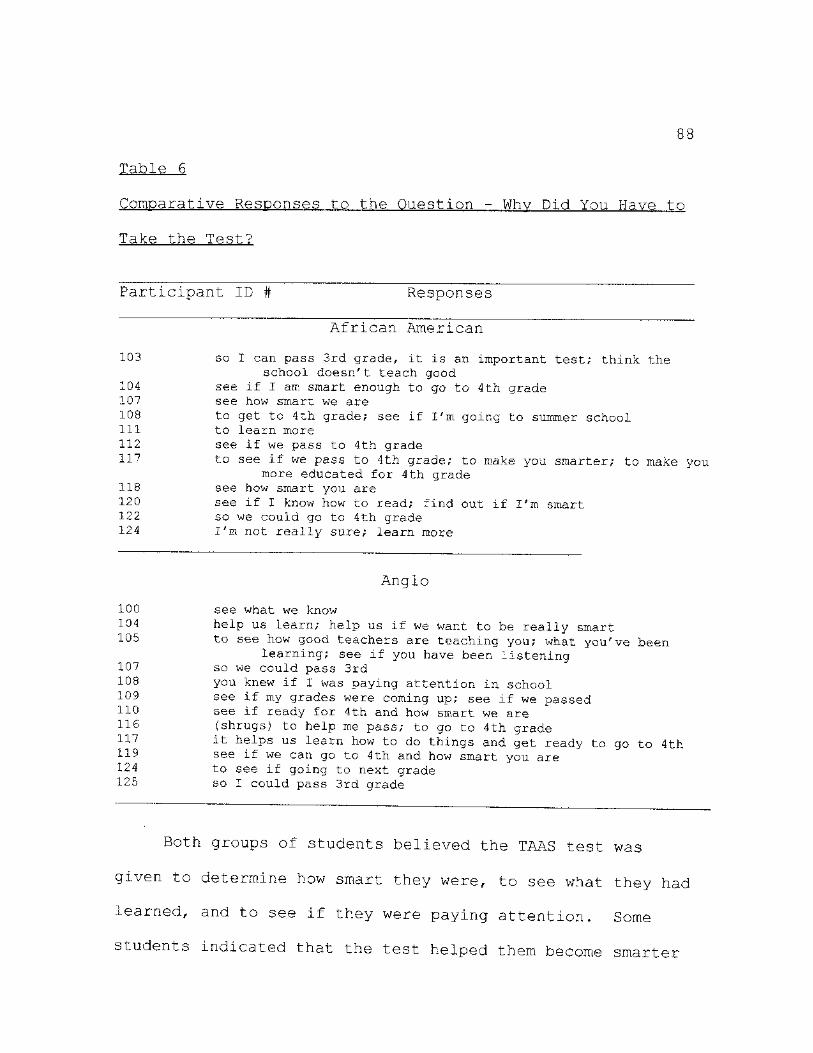
88
Table 6
Comparative Responses to the Question - Why Did You Have to
Take the Test?
Participant ID # Responses
African American
103 so I can pass 3rd grade, it is an important test; think the school doesn't teach good
104 see if I am smart enough to go to 4th grade 107 see how smart we are 108 to get to 4th grade; see if I'm going to summer school 111 to learn more 112 see if we pass to 4th grade 117 to see if we pass to 4th grade; to make you smarter; to make you
more educated for 4th grade make you
118 see how smart you are 120 see if I know how to read; find out if I'm smart 122 so we could go to 4th grade 124 I'm not really sure; learn more
100 104 105
107 108 109 110 116 '117 119 124 '125
Anglo
see what we know help us learn; help us if we want to be really smart to see how good teachers are teaching you; what you've been
learning; see if you have been listening so we could pass 3rd you knew if I was paying attention in school see if my grades were coming up; see if we passed see if ready for 4th and how smart we are (shrugs) to help me pass; to go to 4th grade it helps us learn how to do things and get ready to go to 4th see if we can go to 4th and how smart you are to see if going to next grade so I could pass 3rd grade
Both groups of students believed the TAAS test was
given to determine how smart they were, to see what they had
learned, and to see if they were paying attention. Some
students indicated that the test helped them become smarter

89
and helped them pass to the next grade. One Anglo student
believed the test measured the ability of the teachers to
teacher and one African American student felt if the
students didn't do well "people will think the school
doesn't teach good (#103 A.A.) . Overall, these 3rd grade
students indicated the test measured their ability and
determined if they were ready for 4th grade.
The third question asked each student what teachers
would do with the scores when they received them. Table 7
indicates the students responses by ethnic group.
Table 7
Comparative Responses to the Question - What Will Your
Teacher Do With the Scores When She Receives Them?
Participant ID # Responses
African American
103 tell the students; she will see how well we do in school 104 send them to our parents 107 don't know; check 'em 108 she will probably tell us 111 add them up 112 tell us
look them over; see if I went over my work; see if I go to 4th grade
show to the summer school teacher so they can see how good you
117
118 are
120 show my mom 122 show them to the whole class; show the principal 123 tell us what we made 124 pass out to people who took the TAAS

90
Table 7. — Continued
Comparative Responses to the Question - What Will Your
Teacher Do With the Scores When She Receives Them?
Participant ID # Responses
Anglo
100 might tell us 104 put them in the report card 105 call our mom and tell her 107 talk to our mom 108 check them over three times 109 keep until instructed to give to the students 110 look at grades 116 don't know 117 don't know (shrugs) 1 1 9 send them home; she will use them to get me to 4th grade 124 probably look at them and show us 125 send them home
There was no significant difference in responses
between the two groups. Most children believed the teacher
would share their individual score with them or their mom.
Two students thought the 4th grade teachers would see the
scores and one student believed the teacher would show the
scores to the principal. Another student thought the summer
school teacher might see them. Only two students indicated
not knowing anything about what the teacher would do with
the scores. All students appeared comfortable answering
this question.
The fourth question asked each student what the
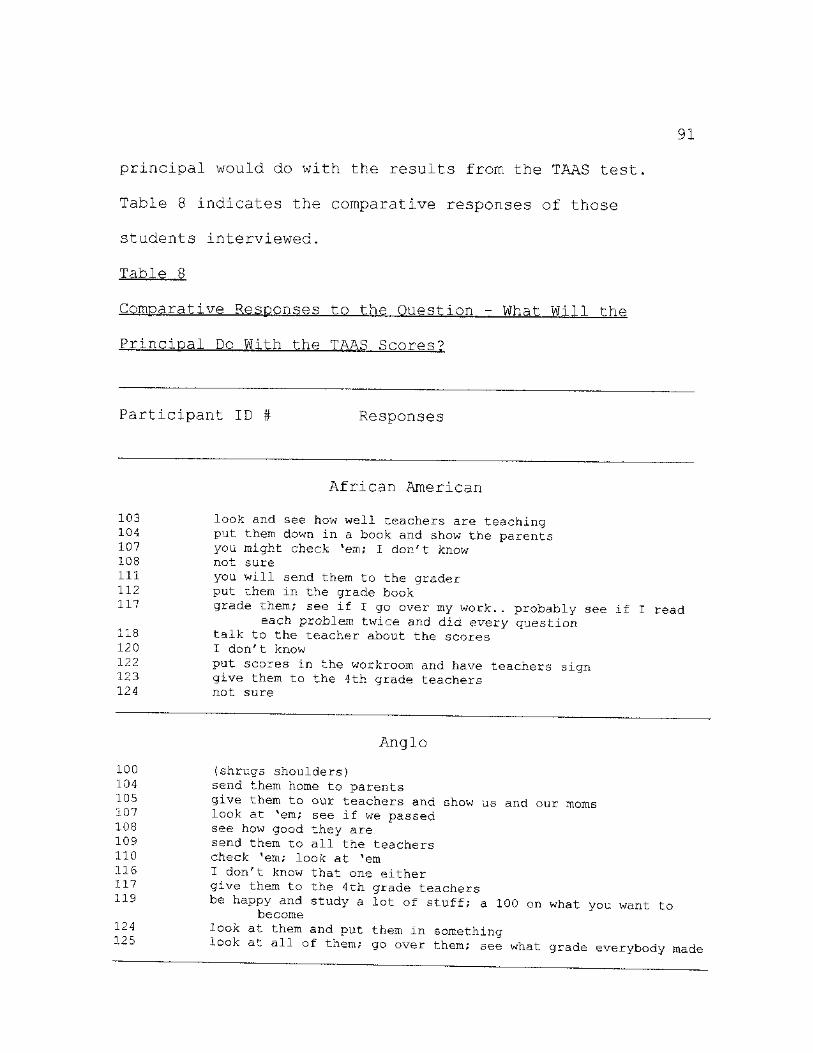
91
principal would do with the results from the TAAS test.
Table 8 indicates the comparative responses of those
students interviewed.
Table 8
Comparative Responses to the Question - What Will the
Principal Do With the TAAS Scores?
Participant ID # Responses
African American
look arid see how well teachers are teaching 104 107 108 not sure 111
put them down in a book and show the parents you might check 'em; I don't know
you will send them to the grader 112 put them in the grade book 1 1 7 grade them; see if I go over my work.. probably see if I read
each problem twice and did every question H 8 talk to the teacher about the scores 120 I don't know 1 2 2 Put scores in the workroom and have teachers sign 123 give them to the 4th grade teachers 124 not sure
Anglo
100 (shrugs shoulders) 104 send them home to parents -'-OS give them to our teachers and show us and our moms 1 0 7 look at 'em; see if we passed 108 see how good they are 1 0 9 send them to all the teachers H O check *em; look at 'em
I don't know that one either give them to the 4th grade teachers be happy and study a lot of stuff; a 100 on what you want to
become look at them and put them in something look at all of them; go over them; see what grade everybody made
117 119
124 125
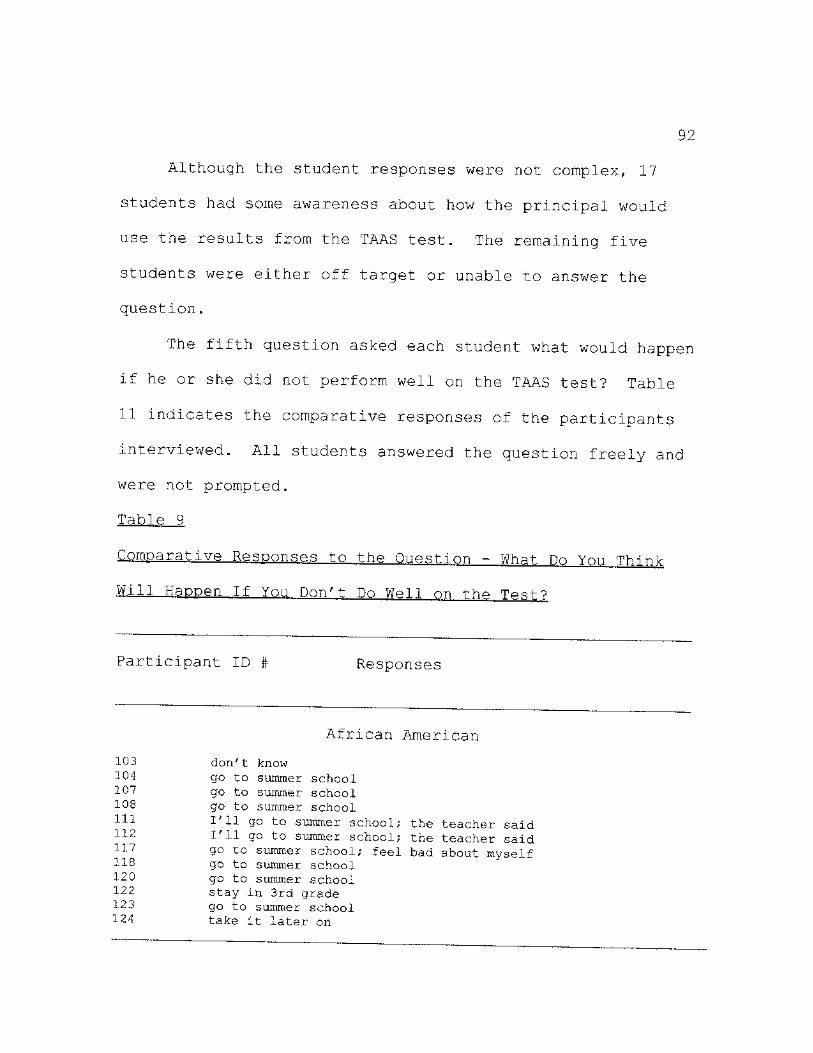
92
Although the student responses were not complex, 17
students had some awareness about how the principal would
use the results from the TAAS test. The remaining five
students were either off target or unable to answer the
question.
The fifth question asked each student what would happen
if he or she did not perform well on the TAAS test? Table
11 indicates the comparative responses of the participants
interviewed. All students answered the question freely and
were not prompted.
Table 9
Comparative Responses to the Question - What Do You Think
Will Happen If You Don't Do Well on the TP.gf?
Participant ID # Responses
African American
103 don't know 1 0 4 go to summer school 107 go to simmer school 1°8 go to summer school 1 1 1 1 , 1 1 go to summer school; the teacher said 112 117
I'll go to summer school; the teacher said go to summer school; feel bad about myself
118 go to summer school 120 go to summer school 1 2 2 stay in 3rd grade 123 go to summer school 124 take it later on
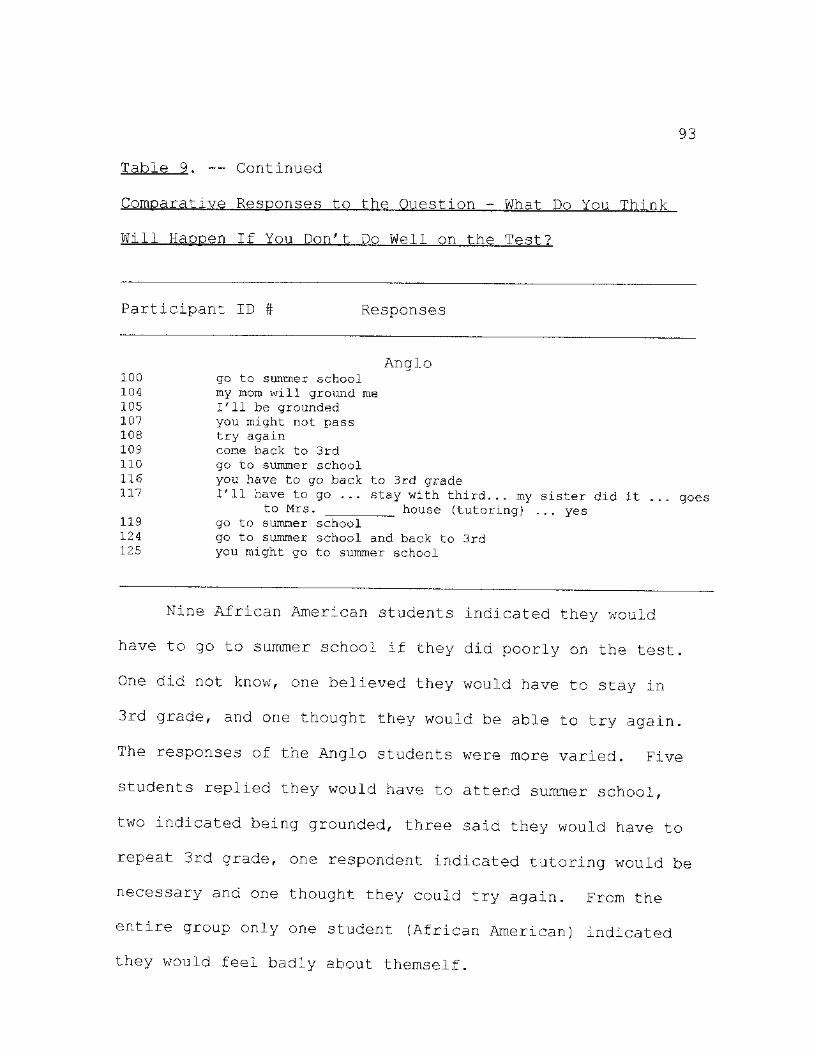
93
Table 9. — Continued
Comparative Responses to the Question - What Do You Think
Will Happen If You Don't Do Weil on the Test?
Participant ID # Responses
Anglo 100 go to summer school 104 my mom will ground me 105 I'll be grounded 107 you might not pass 108 try again 109 come back to 3rd 110 go to summer school 116 you have to go back to 3rd grade 1 1 7 I'll have to go ... stay with third... my sister did it ... goes
to Mrs. house (tutoring) . . . yes 119 go to summer school 124 go to summer school and back to 3rd 125 you might go to summer school
Nine African American students indicated they would
have to go to summer school if they did poorly on the test.
One did not know, one believed they would have to stay in
3rd grade, and one thought they would be able to try again.
The responses of the Anglo students were more varied. Five
students replied they would have to attend summer school,
two indicated being grounded, three said they would have to
repeat 3rd grade, one respondent indicated tutoring would be
necessary and one thought they could try again. From the
entire group only one student (African American) indicated
they would feel badly about themself.
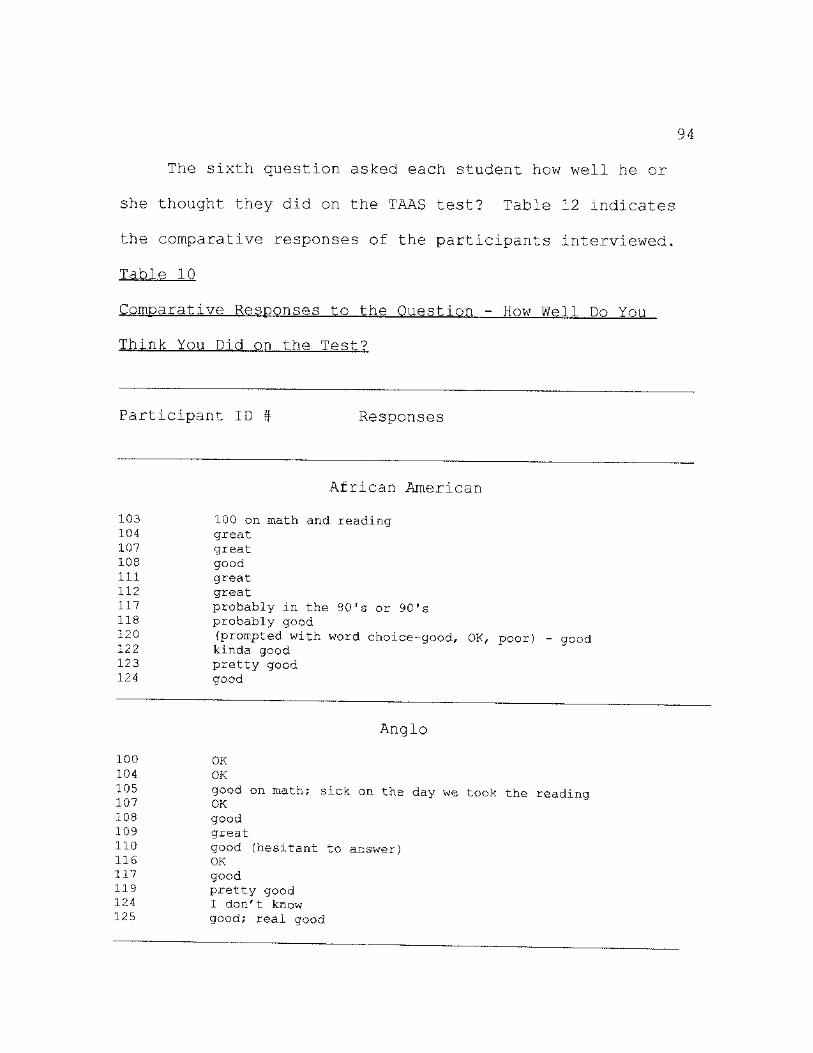
94
The sixth question asked each student how well he or
she thought they did on the TAAS test? Table 12 indicates
the comparative responses of the participants interviewed.
Table 10
Comparative Responses to the Question - How Well Do You
Think You Did on the Test?
Participant ID # Responses
African American
103 100 on math and reading 104 great 107 great 108 good 111 great 112 great 117 probably in the 801s or 90fs 118 probably good 1 2 0 (prompted with word choice-good, OK, poor) - good 122 kinda good 123 pretty good 124 good
Anglo
100 OK 104 OK 105 107 OK 108 good 109 great 110
good on math; sick on the day we took the reading
good (hesitant to answer) 116 OK 117 good 119 pretty good 124 I don't know 125 good; real good

95
The majority of students were positive in their
responses. Four African American students used the word
great while only one Anglo student used that term. The
Anglo students more often used the term good or OK. Overall
the African American students' responses may indicate more
confidence in the test results than the Anglo students.
The seventh question asked each student to indicate how
he or she felt prior to the test and how they felt during
the test. Table 11 indicates the comparative responses of
interviewed students.
Table 11
Comparative Responses to the Question - How Did You Feel
Before You Took the Test? How Did You Feel Purina the Tpst?
Participant ID # Responses
African American
103
107
108
nervous ... need to read stories; answer the questions; get a 100 and not get a 0 on a question
104 nervous ... great
scared ... I told myself it was just a test; I felt better; it was like the other ones I took
sort of nervous ... not nervous anymore I 1 1 nervous . . . normal work that we'd done
;L12 nervous . . . like I was a genius because I thought I would pass ^ n e r v o u s ••- real excited; if my brother can pass it I can; I
felt like a rookie in the NBA or the first time you are wiping the floor on the Knicks and everybody is watching
1 1 8 a J-ittle excited . . . thinking I wasn't going to do a good job on it
1 2 0 nervous ... (prompted with word choice - nervous, OK) OK

96
Table 11. -- Continued
Comparative Responses to the Question - How Did Yon Feel
Before You Took the Test? How Did You Feel Purina the Test?
Participant ID # Responses
African American
122 OK ... OK
123 nervous ... just felt like this is the time I would read carefully
124 excited ... nervous kinda; but I didn't make a mistake on it
Anglo
100 good ... sorta bad 104 nervous ...good 105 nervous *.. calm; not that hard; relaxed 107 scared . .. don't know; felt a little bit scared 108 nervous ... happy 109 excited ... nervous 110 scared . .. scared 116 nervous ... afraid 117 nervous ... it was easy 119 nervous ... I'm going to take my time and read each answer
124 carefully
124 good; excited not nervous ... nervous at first then I felt aood 125 nervous ..» I didn't really feel that nervous and it wasn't as
Both groups of students indicated some nervousness or
excitement before taking the TAAS test. During the test
most of the students appeared to relax and not find the test
as difficult as they expected. One African American student
compared the test to being a rookie in the NBA (# 117 AA).
The next part of the interview focused on the students'
ethnicity and what they might have heard about other ethnic
97
groups. Although, the intent was to explore what children
may have heard versus what they believed, a clear
distinction may not be evident.
The following statement was made prior to asking
additional questions: "The next part of this interview is
about groups of people and what other people say about them.
I will not be asking you what you think about different
groups but what you have heard others say about these
groups. You may have heard things on the playground from
your friends, from adults, and/or from things you have read
or seen on TV."
The eighth question asked each student to respond to
the question, "If I asked you if you are Black, White,
Asian, or Hispanic, what would you say?" The majority of
students responded promptly to this question. However, if
students had difficulty answering this question they were
shown a picture containing elementary aged students from
various ethnic backgrounds. They were asked to select the
student most like them. Table 12 indicates each student
response.
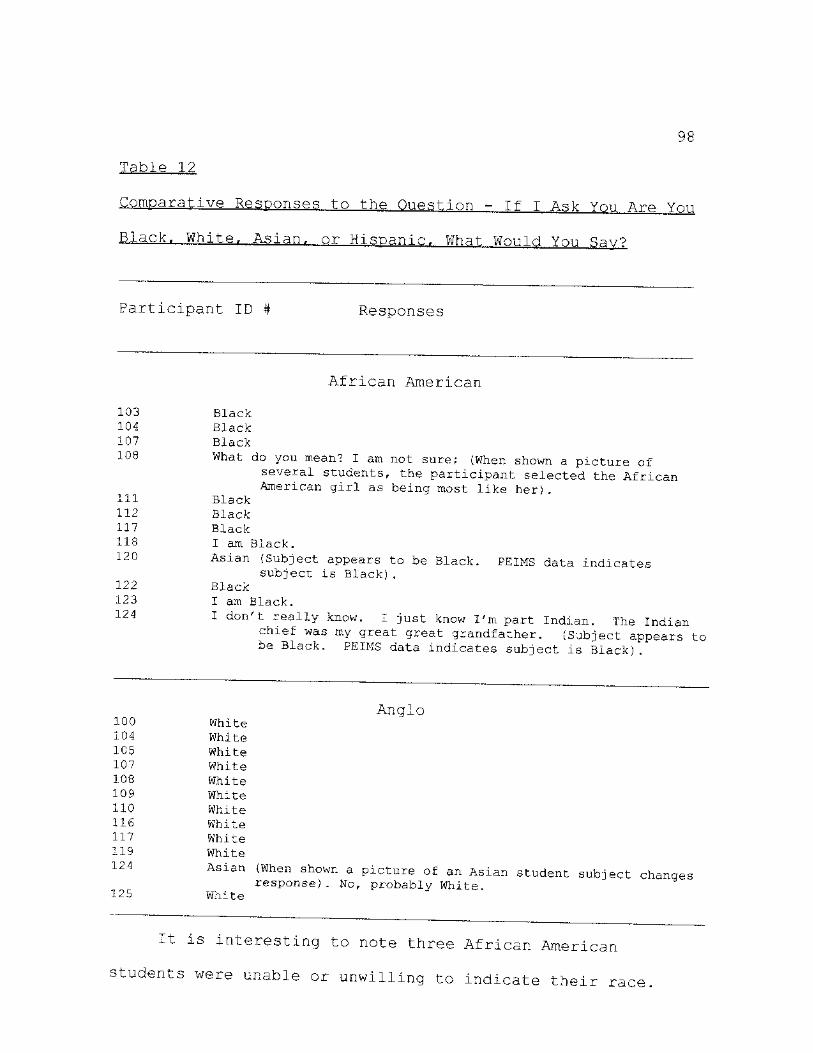
98
Table 12
Comparative Responses to the Question - If I Ask You Arp Yon
Black, White, Asian, or Hispanic:, What Would You Say?
Participant ID # Responses
103 104 107 108
111 112 117 118 120
122 123 124
African American
Black Black Black What do you mean? I am not sure; (When, shown a picture of
several students, the participant selected the African American girl as being most like her).
Black Black Black I am Black. Asian (Subject appears to be Black. PEIMS data indicates
subject is Black), Black 1 am Black. I don't really know. I just know I'm part Indian. The Indian
chiet was my great great grandfather. (Subject appears to be Black. PEIMS data indicates subject is Black).
100 White 104 White 105 White 107 White 108 White 109 White 110 White 116 White 117 White 119 White 124 Asian
125 White
Anglo
(When shown a picture of an Asian student subject changes response). No, probably White.
It is interesting to note three African American
students were unable or unwilling to indicate their race.
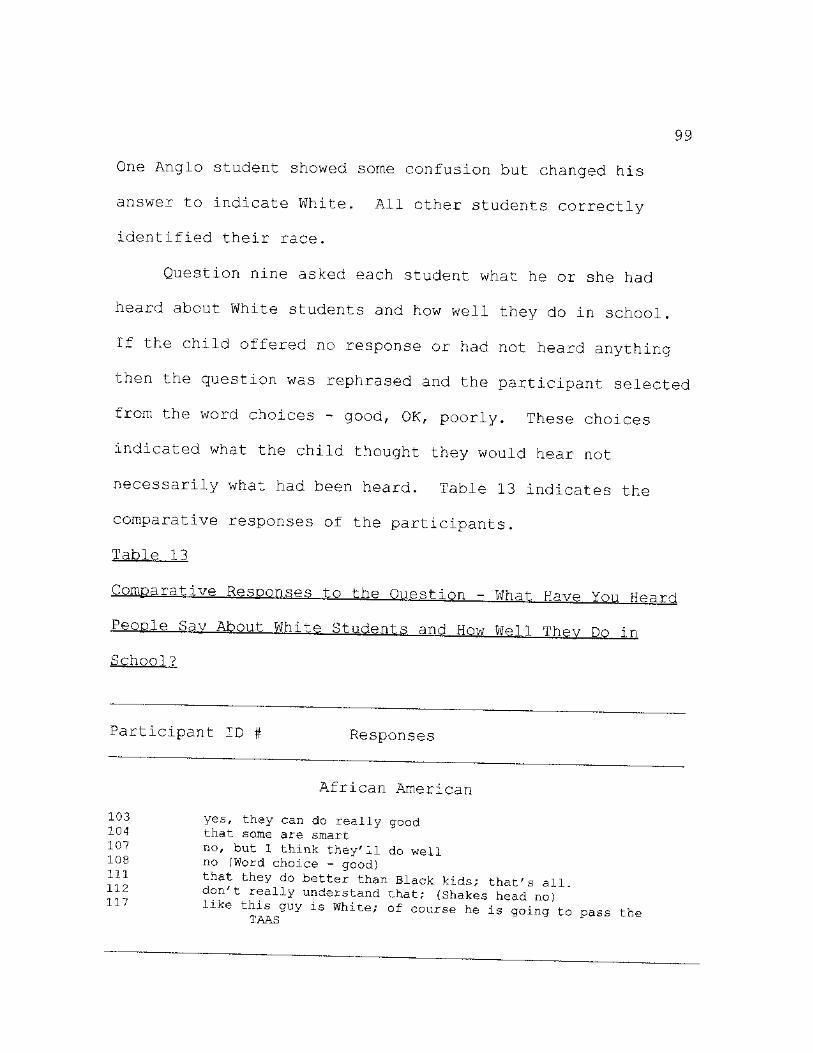
99
One Anglo student showed some confusion but changed his
answer to indicate White, All other students correctly
identified their race.
Question nine asked each student what he or she had
heard about White students and how well they do in school.
If the child offered no response or had not heard anything
then the question was rephrased and the participant selected
from the word choices - good, OK, poorly. These choices
indicated what the child thought they would hear not
necessarily what had been heard. Table 13 indicates the
comparative responses of the participants.
T a b l e 1.3
C o m p a r a t i v e R e s p o n s e s to the Question - What Have Yon Heard
People Say A b o u t W h i t e S t u d e n t s and How Well T h e v no in
S c h o o l ?
Participant ID # Responses
African American
yes, they can do really good 103 1 0 4 that some are smart 107 108 111 112 117
no, but I think they'll do well no (Word choice - good)
that they do better than Black kids; that's all. don't really understand that; (Shakes head no) iike this guy is White; of course he is going to pass the
i. A/Yo

100
Table 13. -- Continued
Comparative Responses to the Question - What Have Yon He^rd
People Say About White Students and How Well Thev Do i ri
School?
Participant ID # Responses
African American
1 1 8 nope; well, when I walk around people talk about how nice they are; can be smart or not smart
120 no (word choice - well, OK, probably; subject responded smart)
122 no (word choice - OK) 123 no (word choice - good)
they think they are going to do very good instead of Black kids but they re not; Black kids are bad kids but they're not; don't do well in school; they should not be in school
124
Anglo
100 no (word choice - good) 1 0 4 I don't know; (word choice - good) 105 1 v e heard how I do; like she brags; Black kids, if racist
they would say whites do bad 107 (word choice - OK) 108 same as all kids; good 109 no (word choice - OK) H ° (hesitant; word choice - good) 116 I don't know 1 1 7 I haven't heard anything II9 n o t really; (word choice - OK in school) 124 that kid does good stuff 125 ' no (word choice - good)
Four African American participants had not heard people
speak about White students and how well they do in school.
Each of the four students needed prompting. After

101
prompting, their word selection was either positive or
neutral. Two of the students had heard positive comments
about White students in comparison to Black students. In
contrast, seven Anglo students needed prompting. They
appeared unable or less willing to verbalize. Two of the
students were resistant to promoting.
Question ten asked each student what he or she had
heard about Asian students and how well they do in school.
In all cases students needed a picture prompt to identify an
Asian student. Table 14 indicates the comparative responses
of the participants.
Table 14
Comparative Responses to the Question - What Have You Heard
People Say About Asian Students and How Well They Do in
School?
Participant ID # Responses
African American
103 (word choice- probably good) 104 (word choice - OK) 107 (word choice - OK) 108 (word choice - OK) 111 that they don't do as well as Black kids 112 No 117 Rockies smart; I haven't heard how they do though
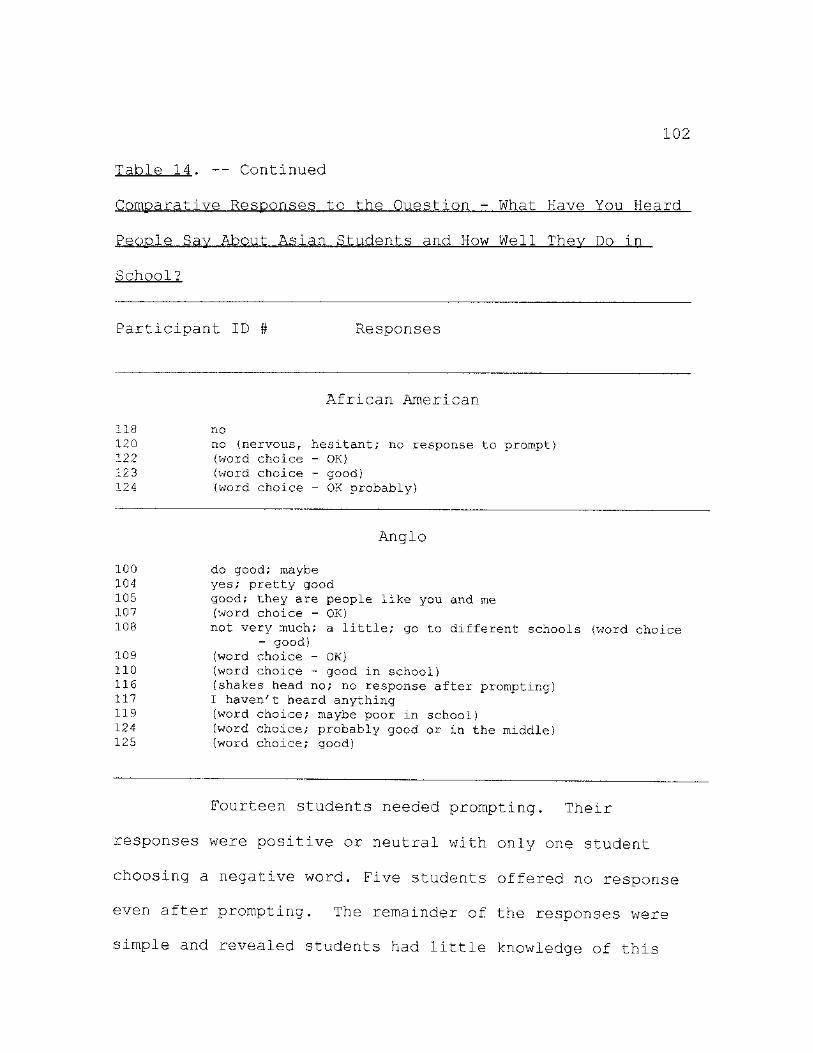
102
Table 14. — Continued
Comparative Responses to the Question - What Have You Heard
People Sav About Asian Students and How Well They Do in
School?
Participant ID # Responses
African American
118 no 120 no (nervous, hesitant; no response to prompt) 122 (word choice - OK) 123 (word choice - good) 124 (word choice - OK probably)
Anglo
100 do good; maybe 104 yes; pretty good 105 good; they are people like you and me 107 (word choice - OK) 108 not very much; a little; go to different schools (word choice
- good) 109 (word choice - OK) 110 (word choice - good in school) 116 (shakes head no; no response after prompting) 117 I haven't heard anything 119 (word choice; maybe poor in school) 124 (word choice; probably good or in the middle) 125 (word choice; good)
Fourteen students needed prompting. Their
responses were positive or neutral with only one student
choosing a negative word. Five students offered no response
even after prompting. The remainder of the responses were
simple and revealed students had little knowledge of this

103
ethnic group. Question eleven asked each student what he or
she had heard about Black students and how well they do in
school. Table 15 indicates the comparative responses of the
participants.
Table 15
Comparative Responses to the Question - What Have You Heard
People Sav About Black Students and How Well Thev no in
School?
Participant ID # Responses
103
African American
yes, they can do good; my mom says I can do good in school; I'm a smart kid
1Q4 yes, they're great and OK in school 107
111 112 117
that they'll do good on TAAS; it doesn't matter if they're Black or any kind of person; it's what's in their brain
108 (word choice - good) they don't do very well I haven't heard anything about Black students some people say some Black people (stutters) some do really bad;
I say, oh right! 1 1 8 s o m e people say mean things; dark skin, light skin, shut-up
stupid; they say it after school so the teachers don't know
120 smart 122 (word choice - OK) ^23 yes, I've heard a lot of people say they were good; like
everybody is smart (Subject gave negative comments about Black students when asked
about White students. The question was not repeated. See response Table 14)
124
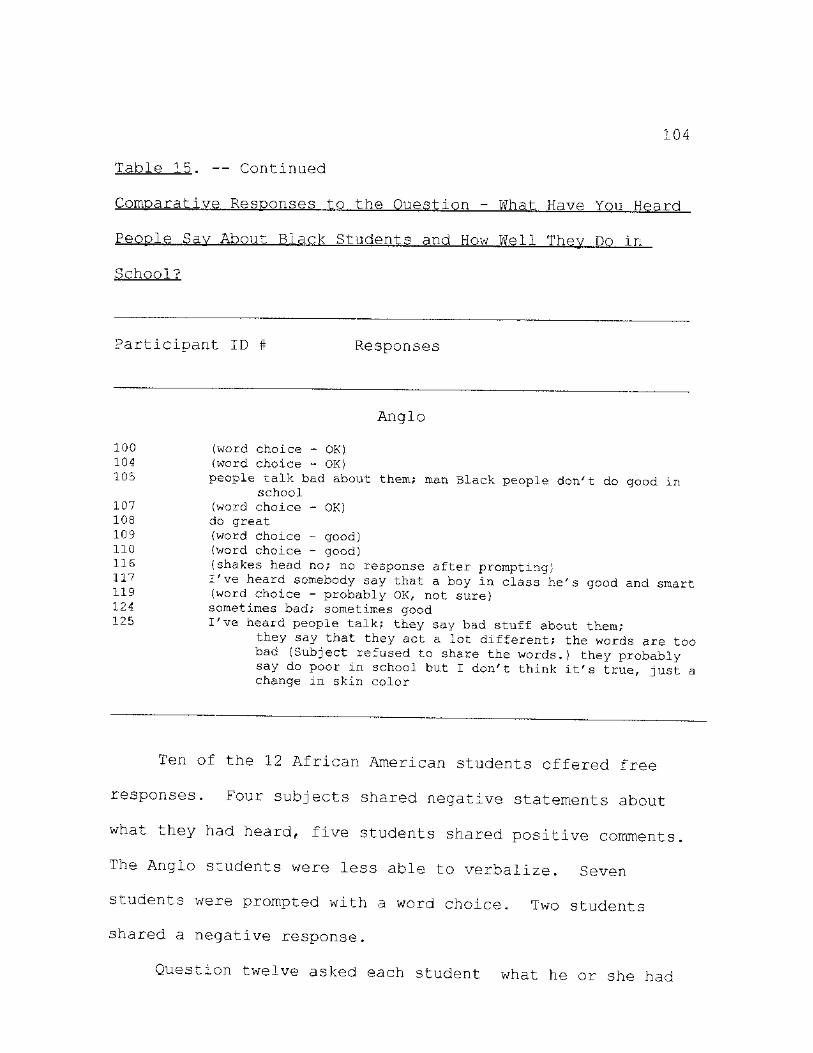
104
Table 15. — Continued
Comparative Responses to the Question - What Have You Heard
People Say About Black Students and How Well Thev Do in
School?
Participant ID # Responses
Anglo
100 (word choice - OK) 104 (word choice - OK) 10^ people talk bad about them; man Black people don't do good in
school 107 (word choice - OK) 108 do great 109 (word choice - good) 110 (word choice - good) 116 (shakes head no; no response after prompting) 117 I've heard somebody say that a boy in class he's good and smart 119 (word choice - probably OK, not sure) 124 sometimes bad; sometimes good 125 I've heard people talk; they say bad stuff about them;
they say that they act a lot different; the words are too bad (Subject refused to share the words.) they probably say do poor in school but I don't think it's true, just a change in skin color
Ten of the 12 African American students offered free
responses. Four subjects shared negative statements about
what they had heard, five students shared positive comments
The Anglo students were less able to verbalize. Seven
students were prompted with a word choice. Two students
shared a negative response.
Question twelve asked each student what he or she had
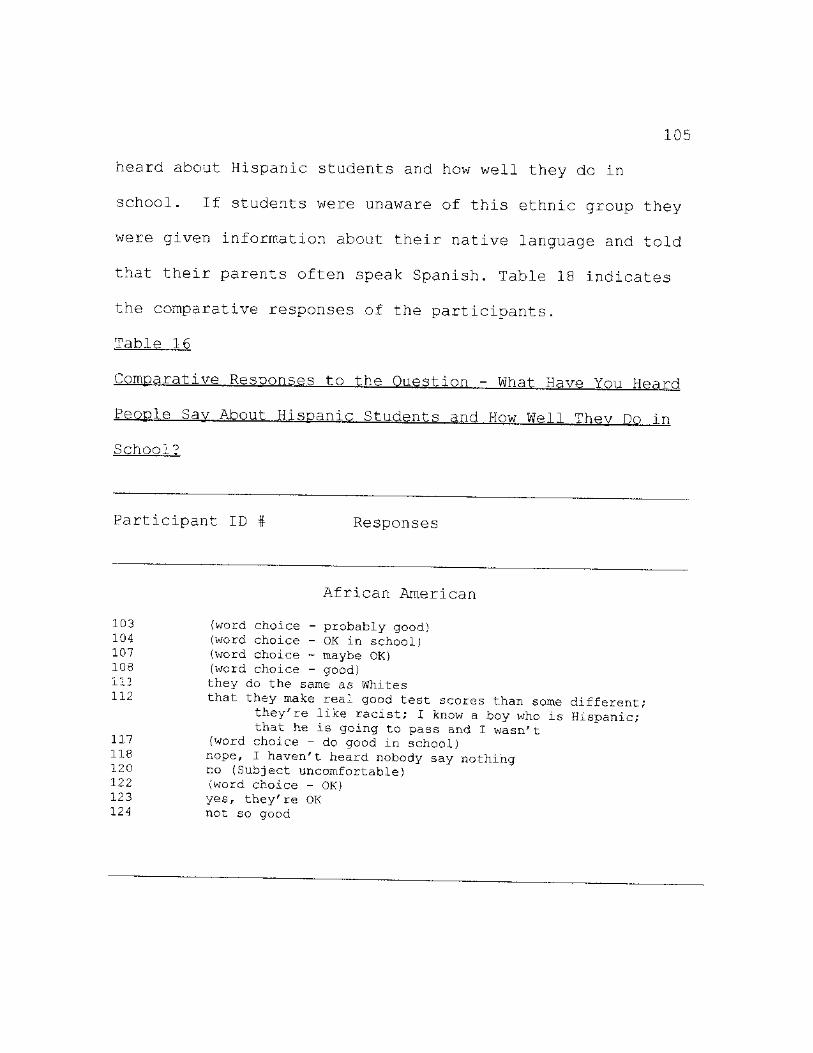
105
heard about Hispanic students and how well they do in
school. If students were unaware of this ethnic group they
were given information about their native language and told
that their parents often speak Spanish. Table 18 indicates
the comparative responses of the participants.
Table 16
Comparative Responses to the Question - What Have Yon Hparri
People Sav About Hispanic Students and How Wall Thev Do in
School?
Participant ID # Responses
African American
1 0 3 {word choice - probably good) 104 (word choice - OK in school) 107 (word choice - maybe OK) 108 (word choice - good) H I they do the same as Whites 1 1 2 t h a t t h e Y make real good test scores than some different;
they're like racist; I know a boy who is Hispanic; that he is going to pass and I wasn't
1 1 7 (word choice - do good in school) 118 nope, I haven't heard nobody say nothing 120 no (Subject uncomfortable) 122 (word choice - OK) 123 yes, they're OK 124 not so good
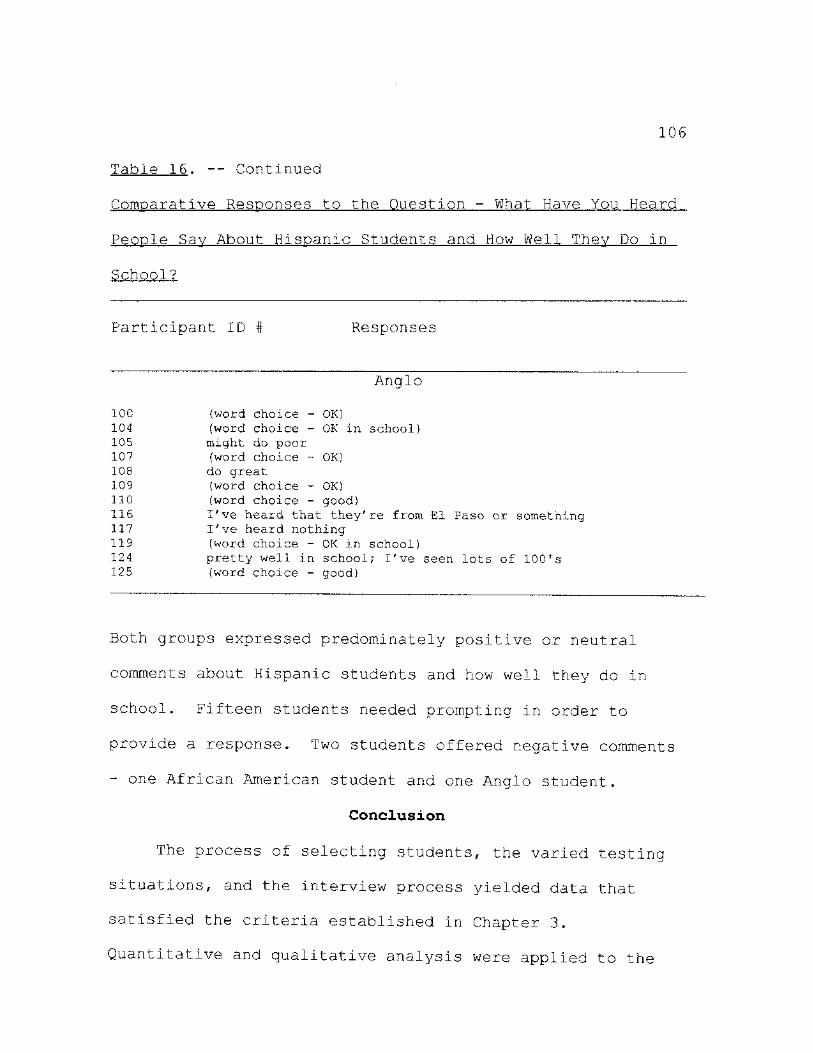
106
Table 16. — Continued
Comparative Responses to the Question - What Have You Heard
People Say About Hispanic Students and How Well Thev Do in
School?
Participant ID # Responses
Anglo
100 (word choice - OK) 104 (word choice - OK in school) 105 might do poor 107 (word choice - OK) 108 do great 109 (word choice - OK) 110 (word choice - good) 116 I've heard that they're from El Paso or something 117 I've heard nothing 119 (word choice - OK in school) 124 pretty well in school; I've seen lots of 100Ts 125 (word choice - good)
Both groups expressed predominately positive or neutral
comments about Hispanic students and how well they do in
school. Fifteen students needed prompting in order to
provide a response. Two students offered negative comments
- one African American student and one Anglo student.
Conclusion
The process of selecting students, the varied testing
situations, and the interview process yielded data that
satisfied the criteria established in Chapter 3.
Quantitative and qualitative analysis were applied to the
107
data in order to support or reject the stated hypotheses and
research questions. Summarization, findings, discussion of
findings, recommendations for future study, and implications
for educators follow in Chapter 5.
CHAPTER 5
SUMMARY, FINDINGS, DISCUSSION,
RECOMMENDATIONS AND IMPLICATIONS
Summary
Gaps in school achievement, standardized test scores,
and retention rates between African American and Anglo
students have been persistent at all levels of schooling.
Texas is no exception. The performance of African American
students on the Texas Assessment of Academic Skills
continues to lag behind Anglo students. Retention rates and
drop out rates continue to be higher for this ethnic group.
In general, African American students do not do as well as
Anglo students in the school setting.
"Stereotype vulnerability," proposed by Steele and
Aronson(1995), suggests African American students' test
scores are lowered because of the stereotyping of the
African American race. Steele and Aronson(1995) conducted
an experimental study involving Stanford undergraduates.
These psychology students were tested under varying
conditions. When the African American and Anglo students
were tested in a non-diagnostic environment, there was no
108
109
statistical difference in the scores. However, when the
conditions were varied and the students thought the test was
diagnostic of intellectual ability, the African American
students did not score as well as the Anglo students. There
was a statistically significant difference in the mean
scores. Steele and Aronson (1995) concluded African
American students were affected by the negative stereotyping
of African American intellect.
This study focused on the applicability of "stereotype
vulnerability" in African American third grade students.
The sample population consisted of all third grade African
American and Anglo students enrolled in two suburban schools
meeting the following criteria: (1) the students were not
receiving special education services, and (2) the students
had first semester language arts grades of 7 0% or above.
Since there were far more Anglo students than African
American students, the Anglo students were randomly selected
matching the language arts scores to that of the African
American students.
The final sample population consisted of 41 African
American students and 41 Anglo students. No control was
established for gender, socioeconomic background, nor family
demographics. It was assumed these were like populations
110
except for ethnicity.
The students were given three independent tests under
varying conditions. Test 1 was described as non-diagnostic
of student reading ability. This test was written at a
third grade level. Test 2 was described as non-diagnostic
with challenge. This reading test was written at a fourth
grade level. Test 3 was the Texas Assessment of Academic
Skills (reading section) written at a third grade level.
Collected data were processed and analyzed using the
Statistical Package for Social Sciences.
In addition to the three varying testing conditions, 24
students consented to be interviewed. These students were
asked a variety of questions concerning the TAAS test and
the stereotyping of four major ethnic groups. Student
responses were recorded and summary statements were written.
Findings
Research Questions and Related Hypotheses
The three quantitative findings were the direct
products of the varying testing environments utilized in
providing direction for this study.
1. Is "stereotype vulnerability" reflected in the TAAS
results for a matched sample of third grade African American
and Anglo students?
Ill
Hypothesis A predicted: There will be a significant
difference between the mean scores of a matched
sample of third grade African American and Anglo
students on the Texas Assessment of Academic
Skills (Test 3).
There was no significant difference between the mean
score of a matched sample of third grade African American
and Anglo students on the Texas Assessment of Academic
Skills. Therefore, Hypothesis A was rejected.
2. In a non-diagnostic activity are academically
matched African American students able to perform as well as
Anglo students?
Hypothesis A predicted: There will be no significant
difference between the mean scores of a matched
sample of third grade African American and Anglo
students in a non-diagnostic reading activity
(Test 1) .
There was no significant difference between the mean
score of a matched sample of third grade African American
and Anglo students on a non-diagnostic reading activity.
Therefore, Hypothesis A was retained.
Hypothesis B predicted: There will be a significant
difference between the mean scores of a matched sample of

112
third grade African American and Anglo students in a non-
diagnostic reading activity with challenge (Test 2).
There was no significant difference between the mean
score of a matched sample of third grade African American
and Anglo students on a non-diagnostic reading activity with
challenge. Therefore, Hypothesis B was rejected.
Qualitative Research Questions
Research Question 3 asked: Are elementary aged students
cognizant of negative stereotypical phrases often used to
describe the intellectual ability and school performance of
African Americans?
Interview questions 8, 9, 10, and 11 addressed Research
question 3. A list of questions asked and discussion of
each follow:
9. When people speak about White students and how well
they do in school, what do you hear?
10. When people speak about Asian students and how
well they do in school, what do you hear?
11. When people speak about Black students and how well
they do in school, what have you heard?
12. When people speak about Hispanic students and how
well they do in school, what have you heard?
Responses to question 9 showed 100% of the African

113
American students had heard positive comments about White
students or believed they would hear positive statements.
All the Anglo students had either heard positive comments
about other White students or thought they would hear
positive statements.
Responses to question 10 showed students had little
knowledge of this ethnic group. All students needed a
picture prompt to identify students as Asian. Fourteen
students (14%) needed a verbal prompt. Five students (21%)
remained unresponsive and indicted no knowledge of
stereotypical phrases in relationship to Asian students.
Two students (8%) offered positive responses while one
student (4%) believed Asian students would not do as well as
Black students.
Responses to question 11 showed six African American
students (50%) had heard or believed they would hear
positive comments about the performance of their ethnic
group. Four students (17%) stated they believed the phrases
about African American students would be negative. In
contrast, only two Anglo students (8%) had heard or believed
they would hear positive statements about African American
students. Three (25%) of the Anglo students expressed
negative comments and the remaining seven needed prompting
114
to respond. Five (42%) of these students selected the term
OK and two (17%) selected the term good.
Responses to question 12 showed 16 (66%) students were
not familiar with the Hispanic population. All interviewed
students acknowledged recognition when told "many of these
students or their parents speak Spanish." When prompted 66%
chose good or OK as a descriptor for student performance.
Only two students (8%) offered negative responses.
In general, third grade students appeared to be
positive in their comments about their own and other ethnic
groups. Many of the students were hesitant in their
response and wanted to appear politically correct. The old
adage, "If you can't say something nice about someone, don't
say anything at all," seemed to apply. General observation
indicated African American males appeared the most
uncomfortable with this section of the interview. Four
ofthe six African American males did not make eye contact
with the interviewer, looked at the ceiling, and had their
hands in their pockets.
Research Question 4 asked: Are elementary aged students
aware of the importance of the results of the Texas
Assessment of Academic Skills (TAAS)?
Interview questions 1, 2, 3, 4, 5, 6, and 7 addressed
115
Research question 4. A list of questions asked and
discussion of each follow:
1. Tell me the name of the important test you took
several weeks ago.
2. Why did you have to take the test?
3. What will your teacher do with the scores when she
receives them?
4. What will the principal do with the TAAS scores?
5. What do you think will happen if you don't do well
on the test?
6. How well do you think you did on the test?
7. How did you feel before the you took the test? How
did you feel during the test?
Responses to question 1 indicated 100% of the students
knew the name of the test given at the end of April, 1997.
There was no significant difference in responses between
student groups.
Responses to question 2 showed African American and
Anglo students responded similarly to this question.
Thirteen students (54%) believed the test helped determine
if they were ready for the fourth grade. The remaining
students indicated the test was a measure of how smart they
were and helped them learn. One student indicated the test
116
was a measure of the teacher's ability to teach and one
student responded by saying "if the students don't do well
people will think the school doesn't teach good" (103 A.A.)
Both were insightful answers and on target considering the
new appraisal system for professional educators.
Responses to question 3 indicated 22 (92%) believed the
teacher would check over the scores, inform them of their
individual score, and send the information to their parents.
Two students (8%) indicated no response. No significant
differences existed between the responses of African
American and Anglo students.
Responses to question 4 showed three students (13%) had
no concept of what the principal would do with the TAAS
scores. The remainder of the students (87%) offered simple
statements. They were aware the administrator would check
them over, show teachers and parents, and "put them down in
a book" (#104 A.A.). Responses from both student groups
were similar.
Responses to question 5 showed 14 students ((58%)
believed they would go to summer school if they did not do
well on the test. Of those 14 students, nine were African
American. The remainder of the students believed they would
be grounded or would have to stay in third grade. The
117
responses between student groups differed slightly. African
American students reported the necessity of going to summer
school, while Anglo students reported the possibility of
being grounded or not passing to fourth grade.
Responses to question 6 showed some variation between
student groups. Eleven African American students (92%)
responded with a positive answer to the question, "How well
do you think you did on the test?" They used the terms good
or great. In contrast, 6 Anglo students (50%) used the same
terms. The remainder of Anglo students used the neutral
term OK or I don't know. Overall, African American students
appeared more confident in their performance on the TAAS
than Anglo students.
Responses to question 7 showed 19 students (79%)
indicated they were nervous prior to taking the test. The
remainder were excited or felt good before the test. After
the test began, most of the students responded that they
calmed down and the test was easier than they originally
thought. There was no significant difference in the
.responses of student groups.
Question number 8 did not directly address either
research question. Question 8 asked, "If I were to ask you
if you are Black, White, Asian, or Hispanic, what would you

118
say?" It is interesting to note, three African American
students (25%) did not respond with the phrase Black. Each
offered other responses. Only one Anglo student (8%)
indicated an initial response other than White. He quickly
changed his response to White. This question was asked to
see if these third grade students were aware of their race.
Discussion of Findings
The intent of this study was to support Steele and
Aronson's (1995) concept of "stereotype vulnerability."
However, when using subjects approximately 10 years younger
than the subjects used in the Steele and Aronson study, the
results varied. The findings from the experimental portion
of this study did not support the Steele and Aronson (1995)
study. Additional studies on the phenomenon of "stereotype
vulnerability" are unavailable. The following are offered as
possible explanations for the difference:
1. The subjects were ten years apart in age. In terms
of educational and cultural experiences it is assumed there
was significant difference between the two experimental
populations.
2. The current literature reveals negative stereotyping
of African Americans is still persistent. It may be the
younger population has yet to be affected by this

119
stereotyping. it may be African American parents are doing
more to counteract the negative stereotyping of their race.
3. The positive comments by African American students
about their performance on the TAAS test seemed to indicate
a high level of self confidence. The African American
students in this study may have had some awareness of the
negative stereotyping of their group but may be unaffected
by the comments.
4. Texas educators have specifically targeted minority
populations. Much time and effort has been devoted to
closing the performance gap between ethnic groups. Schools
across the state are offering extended day and extended year
programs to minority students at risk of failure.
6. Some research has shown the performance difference
between African American and Anglo students does not appear
until after third grade (Simmons and Grady, 1990, C. Steele,
1992).
General Recommendations for Future Study
This study did not find evidence that "stereotype
vulnerability" affects the performance of third grade
African American students. However, the Steele and Aronson
study found that "stereotype vulnerability" affected the
performance of Stanford undergraduates. Subsequent research
120
is needed to explore the issue of student age. If
stereotype vulnerability" is a factor in the performance of
African American students on standardized testing then at
what age is it first apparent. To continue to explore this
concept the following general recommendations are proposed:
1. Future study is recommended to determine if
differences between African American and Anglo students on
the mathematical portion of the TAAS test are due to
"stereotype vulnerability."
2. Future study is recommended to determine the age
African American students may first be affected by
"stereotype vulnerability."
3. Future study is recommended to determine the
presence of "stereotype vulnerability" in students from low
socioeconomic backgrounds.
4. Future study is recommended to determine the
presence of "stereotype vulnerability" in rural educational
systems in the southern states.
5. Future study is recommended to determine if the
concept of "stereotype vulnerability" can be supported in
European nations with significant Black populations
(specifically Great Britain and France).
6. Recent research examined third grade and
121
undergraduate students, future study might examine the non-
traditional African American student (40 years and above) to
determine the presence of "stereotype vulnerability."
Implication for Educators
Schools can have a significant impact on children's
growth and development (Comer, 1996). Teachers help
students acquire cognitive, social, and emotional skills
needed to realize their full potential. Educators have
tremendous opportunities to make a difference in the
academic success of all students. Specifically, educators
can help African American students overcome the effects of
negative stereotypes and the accompanying vulnerability.
Teachers must remain unbiased, maintain high expectations
for all students, and encourage parent involvement. It is
essential that an open, honest relationship, built on mutual
respect and trust be established between the home and the
school.
Payne states, "No significant learning occurs without a
significant relationship" (1995, p.212). Strong
relationships become a catalyst for growth and learning.
The establishment of teacher-student bonds are required for
effective schooling (Comer, 1996; Payne, 1995). To develop
healthy, productive citizens, schools must provide an
122
environment that is nurturing, challenging, and supportive
of individuality. Strong student/teacher relationships will
help African American students engage in the educational
process, thus reducing the vulnerability to negative
stereotyping present in contemporary American society.

APPENDIX A
TEXAS ASSESSMENT OF ACADEMIC SKILLS STUDENT PERFORMANCE
123
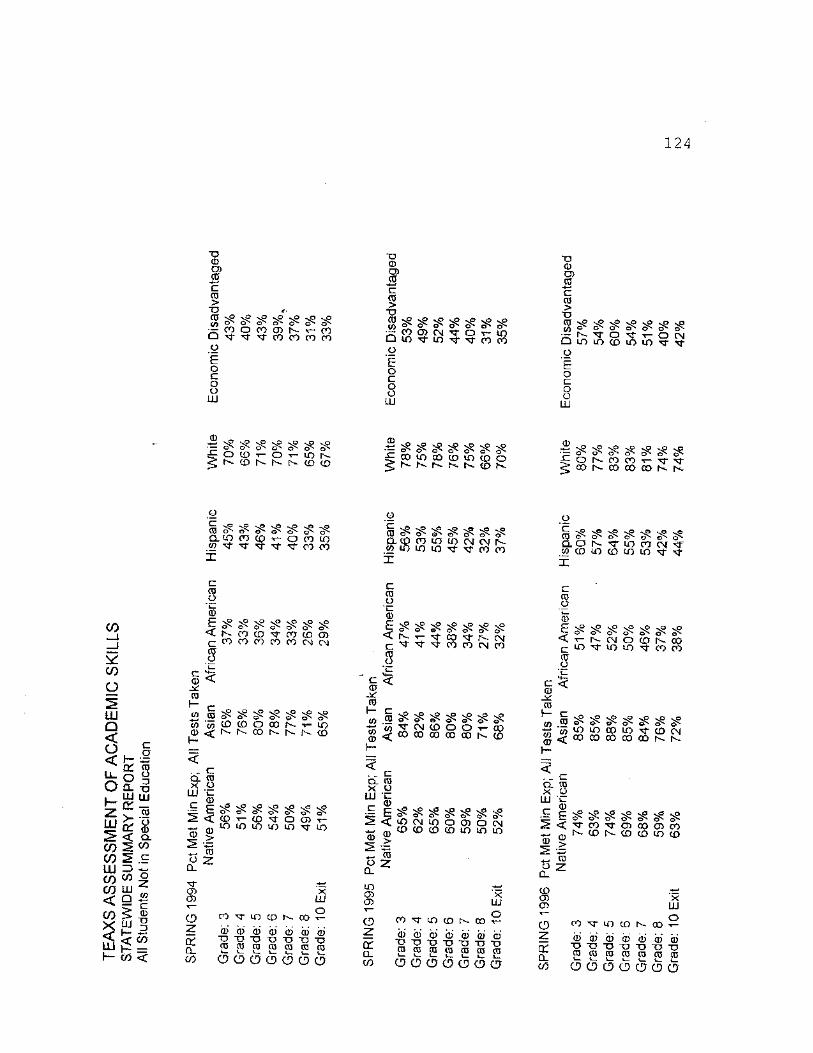
124
"O CD O)
-*-*
c CD > "O CD 00 CO O CO (D N V CO
xr co co co co g
"E o c o o LU
"O © CD
-2 c CD > *U <0 to
NP SP Np VP NP NP 0s 0s 0s 0s 0s ^ CO CD CM o
• to xr ̂ r Q u) g
E o c o o LU
NP 0s
T— tO CO CO
~o ©
C CD > *u CD CO
N.O «sP xO vP sP sp Np O** O"* 0s* ̂ p**
N ^ O r- o CN tO to CO to to ^ xf
o
"E o c o o LU
^ O t D r - O r - i O N ^ N ( 0 N N h - ( 0 C O
•| sP £ £ ss' £ ^ £ ^ CO to 00 CD to CO O ^ O N C O C O t - ^ ^ T
^ C O N C O C D C X > S K
o
£ ^ tO 0s 0s
Q. tO CO GQ Ttf" X
T- o CO to ^ ^ CO CO
g
"s ̂ CD
*Np Np V? sP sp ._ - 0s oN oS 0s* 0s
CLCOOOlOtOCNCNr^ W to to i f ) rt xr CO CO
o £ "sP sP SP SP SO VP SP CD 0s" 0s o"** 0s 0s
a o N ^ r t o c o c M ^ W C D t O C D u O t O ^ x J -X
CO —J dt
( f )
o
c CD g u. © C sP \P SO vO sO >Q vO On ^ ^ ^ 0s 0s
< n co © rf co co cn C C O C O C O C O C O C M C M
$ c © J*: CD H
^ N P N P N P V P S P n P V P 'co to CD O 00 N t- lO ^ N N C O N N N ( D
C CD O ©
P N P S O N P S P N P V P ^ P
C ^ ^ ^ C O C O C N C O s C < © CD f~ C
£ • -CO ©
* « 3 C ^ 5 S 9 ° , r " o c > <;cococooocor^co
c CD g "t— ©
E <
c
8 £ < © JscT CD S— c CO .5 <o « © <
to
Nr v V v° \0 ^ ^ 0s ^ 0s
N CM O 0 N CO tO U) ̂ CO CO
X ^ ^9 Np Np \P sP ^ 9s ^ ^ ^ ^ tO tO CO to xj* CD CM CO CO CO CO 00 K N
t |S <
f— « ^
Q_ X LU
©
C
8 © E < <D >
nP nP nP Np Np %P Np 0s- <3̂ 0s* cfN oN 0s" 0s-(D T- (£) t O O) T-to to to to to ^ to
^ CD
£ z
CD CD
o 2 cr Q_ GO
X LU
CO lO CO N CO
CD "O CD
© © "O X? CD CD
CD "O CD
o o o o o e> o
c CD g i_ ©
E <
Q. X LU C C ^ ^ Np Sp vp vO v<5 ~ C0s*0^$N$n$S.N!s^n
iG &! ̂ 2 ° o> o cm CD CD CD CD to to to ©
^ CD
£ z
tO O CT>
X LU
0 CO IX) (D N CO
fX OL 00
© © © © © 0) © "D TJ "D "U "U T3 "U {D CD 5 ® CO CD CO
O (D O 6 O O Q
Q. X LU
©
c CD g "u_ ©
£ < © >
CD 2 cc CL C/5
NP »SP >NP NP Np NP sP tfN oN pN 0s*
xr co xr cn co cd co N CD N CD (D lO CD
^ CD o 2: a.
CD (J) CD
CO ^ U) CD N CO
© © © © © D "D "D D D CD CD CD CD CD
X LU
O
© "O CD
o o o o o o a

APPENDIX B
LETTER TO PARENTS
125
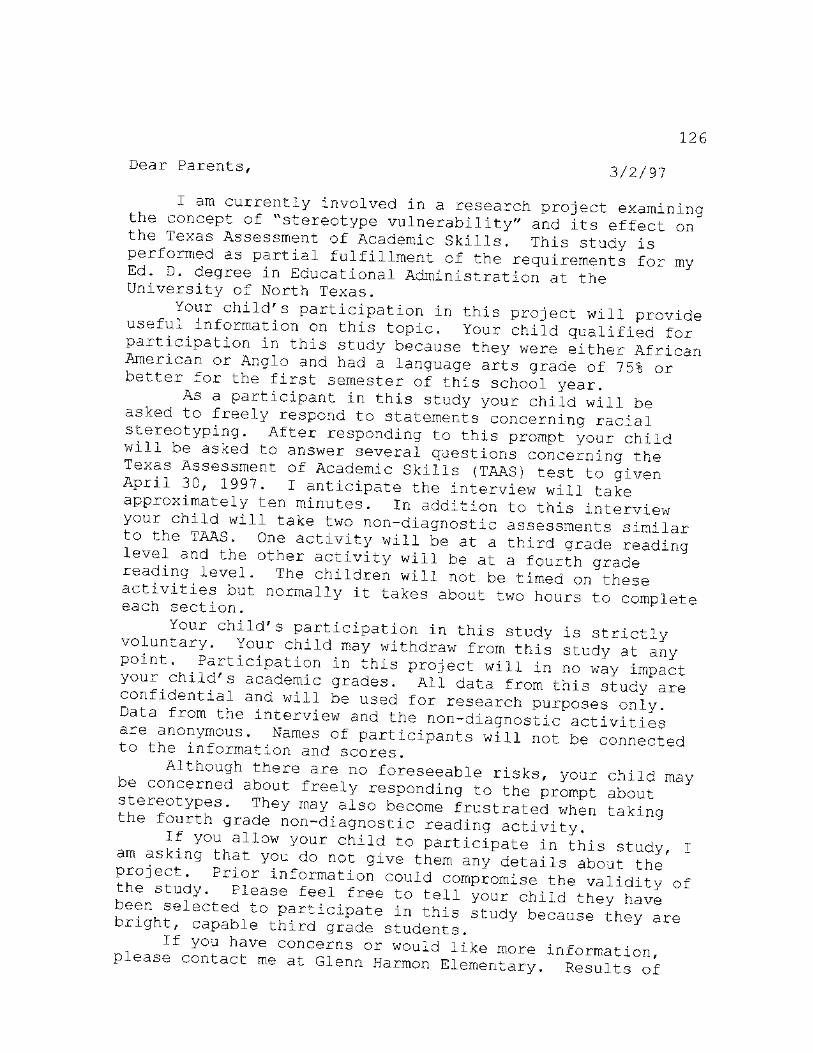
126
Dear Parents, 3/2/97
I am currently involved in a research project examining the concept of "stereotype vulnerability" and its effect on the Texas Assessment of Academic Skills. This study is performed as partial fulfillment of the requirements for my Ed. D. degree in Educational Administration at the University of North Texas.
Your child's participation in this project will provide useful information on this topic. Your child qualified for participation in this study because they were either African American or Anglo and had a language arts grade of 75% or better for the first semester of this school year.
As a participant in this study your child will be asked to freely respond to statements concerning racial stereotyping. After responding to this prompt your child will be asked to answer several questions concerning the Texas Assessment of Academic Skills (TAAS) test to qiven April 30, 1997. I anticipate the interview will take approximately ten minutes. In addition to this interview your child will take two non-diagnostic assessments similar to the TAAS. One activity will be at a third grade reading level and the other activity will be at a fourth grade reading^level. The children will not be timed on these activities but normally it takes about two hours to complete 63ch section.
Your child's participation in this study is strictly voluntary. Your child may withdraw from this study at any
f ^ i n t \ - ^ f t i C i p a t i ° n i n t h i s Pr°3ect will in no way impact child s academic grades. All data from this study are
confidential and will be used for research purposes only. from the interview and the non-diagnostic activities
are anonymous. Names of participants will not be connected to the information and scores.
Although there are no foreseeable risks, your child may be concerned about freely responding to the prompt about stereotypes. They may also become frustrated when taking
e f o u rth grade non-diagnostic reading activity.
am askfna°^h^l0W Y2 U r c h i l d t o Participate in this study, I Droi^S" p Y° U
r n o t g i v e t h e m a ny details about the
?he studv j°n C° U l d c o m P r o m i s e the validity of the study. Please feel free to tell your child thev have
brlShf capable°tMrriiClPfe " t h ± S 3 t U d y b e c a u s e t h ^ urignt, capable third grade students.
If you have concerns or would like more information please contact me at Glenn Harmon Elementary. Results of
127
the study will be available. I have enclosed a self addressed stamped envelope for
your ̂ convenience. If you would like your child to participate in this study, I am asking that both you and your child sign the consent form. Your signature and your child s signature indicates a willingness of both parties to participate in this study. This project has been reviewed and approved by the University of North Texas Committee for the Protection of Human Subjects.
Yours in the interest of children,
Sarah K. Jandrucko, Glenn Harmon Elementary 472-3225
Signed^ Date (Parent's signature)
Signed D a t e
(Child's signature)

APPENDIX C
STUDENT DATA
128
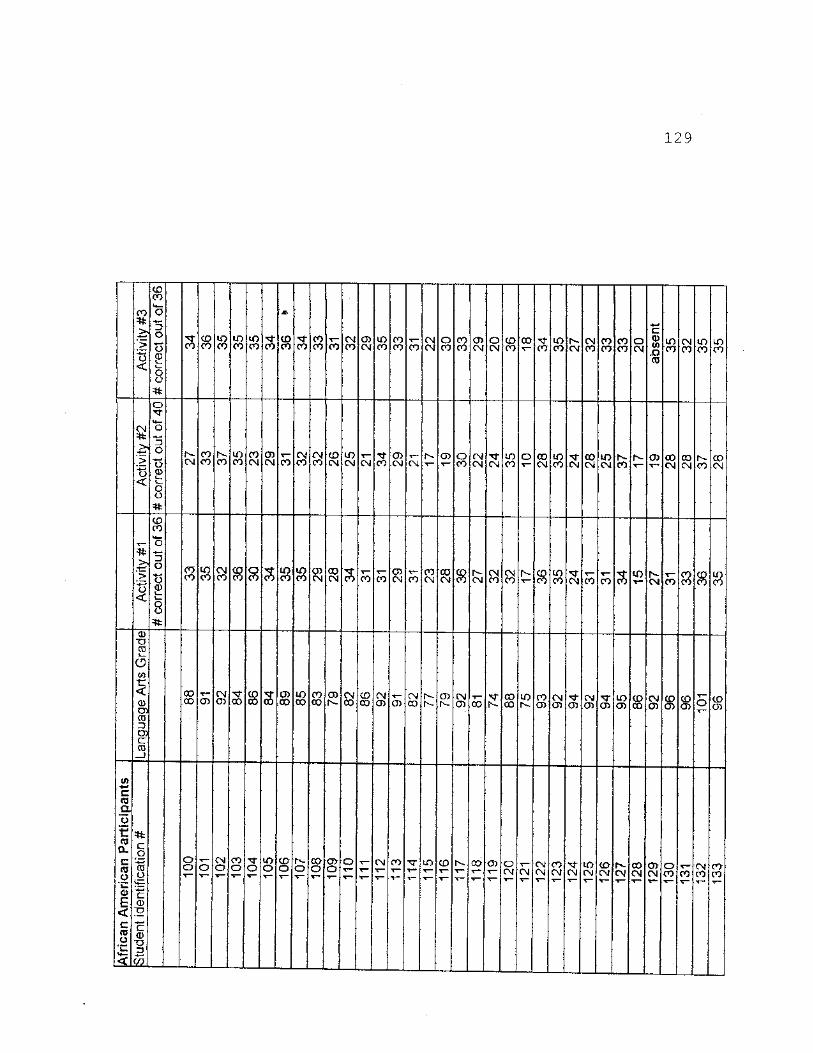
129
CO CO CO
CO CM CM 0) o>
%
8 8 3 $ 8 8 3 CO CO 8 CO 8 8 CO CO lo
CO 8 • » 8
cr> s cr> CO
CM CO to CD 00 o> CM CO

130
CO CO
8 8 CO
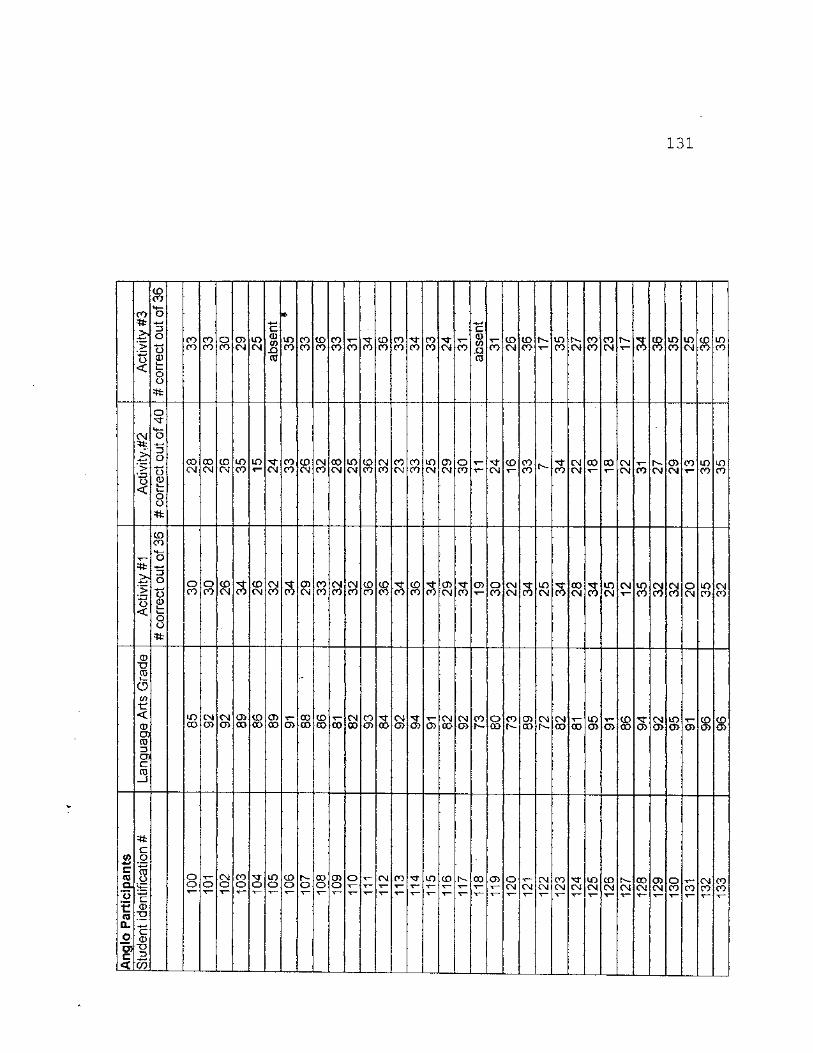
131
CO CO CO •S
LO CD 00 00 CO
CO
5 a s CD 3 3
CM 3 a a
CD "U i_
o to •c <
cu a* C& 3 a4 c CD
0> CO a> CD o> a>
a> •+*
c m CL a
r CO CL
o orf"S
CM CO CD oo a> CM CO
CO

132
CO
CO
3 8 8

REFERENCES
Aboud, F.E. (1988). Children and prejudice. New York, NY: Basil Blackwell Inc.
Allport, G.W. (1954). The nature of prejudice. Reading, MA: Addison-Wesley.
Bethlehem, D.W. (1985). A social psychology of prejudice. New York, NY: St. Martin's Press.
Bogdan, R.C., & Biklen, S.K. (1992). Qualitative research for education. Needham Heights, MA: Allyn and Bacon.
Bond, C.F. Jr. (1982). Social facilitation: A self-presentational view. Journal of Personality and Social Psychology, 42(6). 1042-1050.
Branch, C.W., & Newcombe, N. (1986). Racial attitude development among young black children as a function of parental attitudes:A longitudinal and cross-sectional study. Child Development, 57. 712-721.
Comer, J.P. (1989). Racism and the education of young children. Teachers College Record. 90(3), 352-361.
Comer, J.P., Haynes, N.M., Joyner, E.T., & Ben-Avie, M. (1996)• Rallying the whole village - the Comer process for reforming education. New York, NY: Teachjers College Press.
Crocker, J., & Major, B. (1989). Social stigma and self-esteem:The self-protective properties of stigma. Psychological Review. 96(4). 608-630.
Crocker, J., Voelkl, K., Testa, M., & Major, B. (1991). Social stigma:The affective consequences of attributional ambiguity. Journal of Personality and Social Psychology. 60(?\ r 218-228.
133
134
Devine, P.G. (1989). Stereotypes and prejudice:Their automatic and controlled components, Journal of Personality and Social Psychology, 56(1), 5-18.
Devine, P.G., & Elliot, A.J. (1995). Are racial stereotypes really fading? The Princeton trilogy revisted. Personality and Social Psychology Bulletin.21(11), 1139-1150.
Dovidio, J.F., Evans, N., & Tyler, R.B. (1986). Racial stereotypes:The contents of their cognitive representations. Journal of Experimental Social Psychology, 22, 22-37.
Dovidio, J.F., & Gaertner, S.L. (1986). Prejudice, discrimination, and race: Historical trends and contemporary approaches. In J.F. Dovidio & S.L. Gaertner (Eds.), Prejudice, discrimination, and racisim. (pp. 1-34). New York, NY: Academic Press.
Hamilton, D.L., & Trolier, T.K. (1986). Stereotypes and stereotyping:An overview of the cognitive approach. In J.F. Dovidio & S.L. Gaertner (Eds.), Prejudice, discrimination, and racism.(p. 127-158). New York, NY: Academic Press.
Ehrlich, H.J.(1973). The social psychology of prejudice. New York, NY: Wiley.
Elrich, M. (1994). The stereotype within. Educational Leadership, 51(8). 12-15.
Ford, T.E., & Stangor, C.(1992). The role of diagnosticity in stereotype formation:Perceiving group means and variances. Journal of Personality and Social Psychology. 63(3). 356-367.
Gaertner, S.L., & Mclaughlin, J.P.(1983). Racial stereotypes:Ascriptions of positive and negative characteristics. Social Psychology Quarterly. 46(1). 23-30.
Garibaldi, A.M. (1996, March). Addressing the challenges of urban schools with prescriptions for success. Speech given at the annual convention of The Association for Supervision and Curriculum Dvelopment, New Orleans, LA.
135
Gilbert, G.M.(1951). Stereotype persistence and change among college students. Journal of Abnormal and Social Psychology. 46. 245-254.
Gilbert, D.T., & Hixon, J.G. (1991). The trouble of thinking:Activation and Application of Stereotypic Beliefs. Journal of Personality and Social Psychology. M(4), 509-517.
Glesne, C., & Peshkin, A. (1992). Becoming qualitative researchers. White Plains,NY: Longman Publishing Group.
Johnson-Tournas, A.I., (1990). Prejudice and psychological maturity:Is there a relationship? (Doctoral dissertation, Boston College, 1990). UMI Dissertation Services. 9119366.
Karlins, M., Coffman, T.I., & Walters, G.(1969). On the fading of social stereotypes:Studies in three generations of college students. Journal of Personality and SocialPsychology, 13.(9) 1-16.
Katz, D., & Braly, K.(1933). Racial stereotypes in one hundred college students. Journal of Abnormal Psychology. 28. 280-290.
Katz, I. (1981). Stigma:A social psychological analysis.Hillsdale.NJ:Lawrence Erlbaum Associates.
Ladson-Billings, G., & Tate, W. F. (1995). Toward a critical race theory of education. Teachers College Record. j££L(l) 47-68.
Madaus, G.F. and Tan, G.A. (1993). The growth of asssessment. In G. Cawelti (Ed.), Challenges and achievements of American Education (pp. 55-79). Alexandria, VA: Association for Supervision and Curriculum Development.
McCauley, C., & Stitt, C.L. (1978). An individual and qualitative measure of stereotypes. Journal of Personality and Social Psychology. 36f4i. 929-940.
McCauley, C., Stitt, C.L., & Segel, M. (1980). Stereotyping: From prejudice to prediction. Psvcholonv Bulientin. 87. 195-215.
136
Microsoft Bookshelf. [Computer software].(1994). Microsoft Corporation.
National Commission on Testing and Public Policy.(1990). From gatekeeper to gateway: transforming testing in America. Chestnut Hill, Mass.: NCTPP, Boston College.
Niemann, Y.F., Jennings, L., Rozelle, R.M., Baxter, J.C., & Sullivan, E.(1994). Use of free responses and cluster analysis to determine stereotypes of eight groups. Personality and Social Psychology Bulletin, 20(4), 379-390.
Packer, J.(1997, April 22). More students statewide pass high school exit test. Arlington Star-Telegram, p. A9.
Payne, R.K.(1995). A framework: understanding and working with students and adults from poverty. Baytown,Texas: RFT Publishing.
Pious, S., & Williams, T.{1995). Racial stereotypes from the days of American slavery:A continuing legacy. Journal of Applied Social Psychology. 25(9). 795-817.
Quality Education for Minorities Project.(1990). Education that works:An action plan for the education of minorities. Cambridge, MA: Massachusetts Institute of Technology.
Simons, W., & Grady, M.(1990). Black male achievement: from peril to promise. (Report of the Superintendent's Advisory Committee on Black Male Achievement). Prince George County, MD: Prince Georges County Schools,
Smith, T. M. (1996). The condition of education 1996. National center for education statistics (NCES 96-304, p. 144). Washington, DC: U.S. Department of Education.
Sniderman, P.M., & Piazza, T.(1993). The scar of race. Cambridge, MA: Belknap Press of Harvard University Press.
137
Snyder, T., & Shafer, L.(1996). Youth indicators, 1996. National center for education statistics (NCES 960027, pp.72 & 138). Washington, DC: U.S. Department of Education.
Steele, C.M.(1992, April). Race and the schooling of Black Americans. The Atlantic Monthly, 68-7 6.
Steele, C.M., & Aronson, J.(1995). Stereotype threat and the intellectual test performance of African Americans. Journal of Personality and Social Psychology. 69,(5), 797-811.
Steele, S. (1990). The content of our character. New York, NY: St. Martin's Press.
Tate, W. F.(1993) . Advocacy versus economics: a critical race analysis of the proposed national assessment in mathematics. Thresholds in Education, 19(1-2), 16-22.
Tesser, A., & Campbell, J. (1983). Self-definition and self-evaluation maintenance. In J.Suls & A. G. Greenwald (eds.), Psychological perspectives on the self (Vol. 2, pp. 1-31), Hillsdale, NJ: Erlbaum.
Texas Business and Education Coalition.(1995-96). Evaluating the performance of Texas public schools (Texas Business and Education Coalition). Austin, TX: Author.
Texas Education Agency.(1992-1993). Texas student assessment program:Technical Digest for the academic year 1992-1993. (Presented as a collaborative Effort of the Technical Digest Work Group, National Computer Systems, The Psychological Corporation, and Measurement Incorporated).
Texas Education Agency.(1993-1994). Texas assessment of academic skills:Student performance results 1992-1993 and 1993-1994. (Compiled by the Texas Education Agency, Austin,TX).
Texas Education Agency.(1994-1995) . Texas student-assessment program:Student performance results 1994-1995. (Compiled by the Texas Education Agency,Austin, TX) .
138
Texas Education Agency.(1996, Spring). Texas $igsessmQnt pf academic skills:Summary report. (Compiled by the Texas Education Agency, Austin, TX).
Texas Education Agency. (1997-98). Public education information management system - data standards. (Compiled by the Texas Education Agency, Austin, TX).