3-hydroxykynurenine and clinical symptoms in first-episode neuroleptic-naive patients with...
TRANSCRIPT
The International Journal of Neuropsychopharmacologyhttp://journals.cambridge.org/PNP
Additional services for The International Journal of Neuropsychopharmacology:
Email alerts: Click hereSubscriptions: Click hereCommercial reprints: Click hereTerms of use : Click here
3Hydroxykynurenine and clinical symptoms in firstepisode neurolepticnaive patients with schizophrenia
Ruth Condray, George G. Dougherty, Matcheri S. Keshavan, Ravinder D. Reddy, Gretchen L. Haas, Debra M. Montrose, Wayne R. Matson, Joseph McEvoy, Rima KaddurahDaouk and Jeffrey K. Yao
The International Journal of Neuropsychopharmacology / Volume 14 / Issue 06 / July 2011, pp 756 767DOI: 10.1017/S1461145710001689, Published online: 28 January 2011
Link to this article: http://journals.cambridge.org/abstract_S1461145710001689
How to cite this article:Ruth Condray, George G. Dougherty, Matcheri S. Keshavan, Ravinder D. Reddy, Gretchen L. Haas, Debra M. Montrose, Wayne R. Matson, Joseph McEvoy, Rima KaddurahDaouk and Jeffrey K. Yao (2011). 3Hydroxykynurenine and clinical symptoms in firstepisode neurolepticnaive patients with schizophrenia. The International Journal of Neuropsychopharmacology, 14, pp 756767 doi:10.1017/S1461145710001689
Request Permissions : Click here
Downloaded from http://journals.cambridge.org/PNP, IP address: 128.119.168.112 on 25 Sep 2012

3-Hydroxykynurenine and clinical symptomsin first-episode neuroleptic-naive patientswith schizophrenia
Ruth Condray1,2, George G. Dougherty Jr.1,2, Matcheri S. Keshavan2,3, Ravinder D. Reddy1,2,
Gretchen L. Haas1,2, Debra M. Montrose2, Wayne R. Matson4, Joseph McEvoy5,6,
Rima Kaddurah-Daouk6 and Jeffrey K. Yao1,2,7
1 VA Pittsburgh Healthcare System, Medical Research Service, Pittsburgh, PA, USA2 University of Pittsburgh Medical Center, Department of Psychiatry, Pittsburgh, PA, USA3 Beth Israel Deaconess Medical Center and Harvard University, Department of Psychiatry, Boston, MA, USA4 Bedford VA Medical Center, Medical Research Service, Bedford, MA, USA5 John Umstead Hospital, Department of Psychiatry, Butner, NC, USA6 Department of Psychiatry and Behavioral Sciences, Duke University, Durham, NC, USA7 University of Pittsburgh School of Pharmacy, Department of Pharmaceutical Sciences, Pittsburgh, PA, USA
Abstract
One branch of the tryptophan catabolic cascade is the kynurenine pathway, which produces neurotoxic
[3-hydroxykynurenine (3-OHKY), quinolinic acid] and neuroinhibitory (kynurenic acid) compounds.
Kynurenic acid acts as a competitive antagonist at the glycine site ofN-methyl-D-asparate receptors at high
concentrations and as a non-competitive antagonist on the a7-nicotinic acetylcholine receptor at low
concentrations. Kynurenine compounds also influence cognitive functions known to be disrupted in
schizophrenia. Alterations in tryptophan metabolism are therefore of potential significance for the
pathophysiology of this disorder. In this paper, tryptophanmetabolites were measured from plasma using
high-pressure liquid chromatography coupled with electrochemical coulometric array detection, and re-
lationships were tested between these metabolic signatures and clinical symptoms for 25 first-episode
neuroleptic-naive schizophrenia patients. Blood samples were collected and clinical and neurological
symptomswere rated at baseline and again at 4 wk following initiation of treatment. Level of 3-OHKY and
total clinical symptom scores were correlated when patients were unmedicated and neuroleptic-naive,
and this relationship differed significantly from the correlation observed for patients 4 wk after beginning
treatment. Baseline psychosis symptoms were predicted only by neurological symptoms. Moreover,
baseline 3-OHKY predicted clinical change at 4 wk, with the lowest concentrations of 3-OHKY being
associated with the greatest improvement in symptoms. Taken together, our findings suggest a neurotoxic
product of tryptophan metabolism, 3-OHKY, predicts severity of clinical symptoms during the early
phase of illness and before exposure to antipsychotic drugs. Baseline level of 3-OHKYmay also predict the
degree of clinical improvement following brief treatment with antipsychotics.
Received 21 September 2010 ; Reviewed 10 November 2010 ; Revised 1 December 2010 ; Accepted 21 December 2010 ;
First published online 28 January 2011
Key words : Cognition, first-episode psychosis, 3-hydroxykynurenine, neuroleptic-naive, neurological
symptoms, schizophrenia, tryptophan.
Introduction
Schizophrenia is associated with a wide range of
biological and behavioural perturbations and
compromises to social and life functioning. The
pathophysiology underlying these diverse dis-
turbances has not been confirmed as either a single,
fundamental pathology or, conversely, multiple ab-
normalities involving independent biological pro-
cesses. It is also not known which of the candidate
biological processes are linked to symptom formation
and clinical course, or whether treatment may modify
such relationships. Hypotheses have included altered
neurotransmission and signal transduction, and
abnormalities in neuropeptides and autoimmune
Address for correspondence : J. K. Yao, Ph.D., Neurochemistry and
Psychopharmacology Laboratory (Bldg 13), VA Pittsburgh Healthcare
System 151U-H, 7180 Highland Drive, Pittsburgh, PA 15206, USA.
Tel. : +1-412-954-5787 Fax : +1-412954-5786
Email : [email protected]
International Journal of Neuropsychopharmacology (2011), 14, 756–767. f CINP 2011doi:10.1017/S1461145710001689
ARTICLE

dysfunction (as reviewed by Javitt & Laruelle 2006 ;
Lieberman & Koreen 1993; Tandon et al. 2008).
Evidence from studies of neurotransmitter (dopami-
nergic, serontonergic, glutamatergic, noradrenergic)
systems implicates a number of alterations, but how
to interpret these findings has been uncertain due
to the important fact that neurotransmitter systems
are linked with one another, as well as with signal
transduction systems and a diverse range of mem-
brane-bound and cellular systems. Viewing biological
processes as integrated systems of genetic, protein,
metabolic, cellular, and pathway cascades provides a
new paradigm (Clish et al. 2004) that has the potential
to transform knowledge about the major psychiatric
disorders, including schizophrenia and mood dis-
orders (Kaddurah-Daouk et al. 2007, 2008, 2009 ; Yao &
Reddy, 2005). This newperspective can increase under-
standing about how psychiatric disorders are shaped
by biological systems that behave in dynamic and in-
terdependent ways. Comprehensive study of one such
system, the metabolome, concerns the repertoire of
biochemicals present in cells, tissue, and body fluids.
Identification of metabolic signatures for pathways of
interest can provide enhanced understanding about
complex disorders at the molecular level, which is
now technically possible through novel high-resol-
ution multidimensional separation and characteriza-
tion methods.
While the dopamine hypothesis of schizophrenia
has retained prominence for over four decades
(Carlsson & Lindqvist, 1963 ; Howes & Kapur, 2009),
progress in the field has stimulated alternate views
that recognize complex relationships among multiple
neurotransmitter systems and include a renewed in-
terest in the importance of serotonin for schizophrenia
(Geyer & Vollenweider, 2008). Results from early
studies showed that both hyperserotonaemia (Garelis
et al. 1975 ; Muck-Seler et al. 1988 ; Stahl et al. 1983)
and serotonin deficiency (Aschcroft et al. 1966 ;
Manowitz et al. 1973 ; Reddy et al. 2007) were associated
with schizophrenia, suggesting a disturbance in central
serotonin function. Because serotonin is produced dur-
ing tryptophan metabolism, these collective findings
implicate a dysregulation of tryptophan metabolism
for schizophrenia. Tryptophan is catabolized primarily
through the kynurenine pathway (Stone, 1993), which
is functionally related to the glutamatergic system
and neurodegenerative disease. In view of the ac-
cumulating evidence that supports an important
role for glutamatergic dysfunction in the pathophys-
iology of schizophrenia (Javitt, 2007 ; Olney et al.
1999 ; Tamminga, 1998), determining how metabolism
within the kynurenine pathway may influence its
clinical profile could advance knowledge about the
molecular underpinnings of this severe psychiatric
disorder.
Tryptophan is either transaminated to kynurenate,
which acts as an endogenous glutamate receptor
antagonist, or hydroxylated to 3-hydroxykynurenine
(3-OHKY), which is then further degraded to the
excitotoxic N-methyl-D-aspartate (NMDA) agonist,
quinolinate. Kynurenic acid appears to be neuropro-
tective, while 3-OHKY and quinolinic acid are neuro-
toxic (Foster et al. 1983 ; Guidetti & Schwarcz, 1999 ;
Stone, 1993). The nature of the influence of kynurenic
acid on glutamatergic neurotransmission is generally
believed dependent on level or concentration, al-
though the parameters are continuing to be defined.
Kynurenic acid at high concentrations acts as a
competitive antagonist of the glycine site of NMDA
receptors (Stone, 1993), and at low concentrations func-
tions as a non-competitive antagonist of a7-nicotinic
acetylcholine receptors (Alkondon et al. 2004 ; Hilmas
et al. 2001). However, even low concentrations of
endogenous kynurenic acid have been shown to in-
fluence physiological responding reflected in the
amplitude of evoked responses in CA1 pyramidal cells
(Scharfman et al. 2000).
Converging lines of evidence provide support for
the recent proposal of kynurenine pathway metab-
olism as a unique and novel target for the treatment of
schizophrenia (Wonodi & Schwarcz, 2010). Increased
degradation of tryptophan through the kynurenine
pathway has been observed in patients diagnosedwith
psychotic disorder (Barry et al. 2009), and elevated
levels of kynurenic acid have been found in cerebro-
spinal fluid (CSF) of schizophrenia patients at first
episode and prior to treatment with antipsychotics
(Erhardt et al. 2001). Increased levels of kynurenine
have also been identified in the post-mortem tissue of
schizophrenia patients within Brodmann areas 9 and
19 (Schwarcz et al. 2001), brain regions that have been
implicated in schizophrenia. Importantly, linkages
have been demonstrated between the products of
kynurenine pathway and clinical status and cognitive
dysfunction. CSF levels of 3-OHKY in unmedicated
chronic schizophrenia patients predicted their clini-
cal improvement following 6 wk of treatment with
antipsychotic medication (Issa et al. 1994). Moreover,
findings from animal studies show that kynurenine
compounds influence cognitive functions that are
known to be disrupted in schizophrenia : 7-chloro-
kynurenic acid, an NMDA receptor antagonist, re-
duced acquisition of spatial memory in rats and
inhibited induction of long-term potentiation (LTP) in
rat hippocampal slices (Watanabe et al. 1992) ; while
3-OHKY and schizophrenia 757

elevated level of kynurenic acid in rats reduced spatial
working memory performance (Chess et al. 2007),
and altered sensory processing (Erhardt et al. 2004;
Shepard et al. 2003) and conditioned learning (Chess &
Bucci, 2006). As candidate influences for the patho-
physiology underlying schizophrenia, the products
of tryptophan metabolism may therefore play an im-
portant role in the hallmark symptoms of schizo-
phrenia.
Understanding of these molecular processes can be
increased using the novel powerful and rapid multi-
dimensional separation and characterization method
of high-pressure liquid chromatography coupled with
electrochemical coulometric array detection (LCECA)
(Kristal et al. 2007 ; Mannelli et al. 2009 ; Patkar et al.
2009 ; Rozen et al. 2005; Shi et al. 2002 ; Yao & Cheng,
2004), which provides resolving power that is superior
to one-dimensional approaches. In an earlier report,
our group documented altered interactions of trypto-
phan metabolites, measured with LCECA, for first-
episode neuroleptic-naive schizophrenia patients
at baseline (FENNS-BL) and at 4 wk (FENNS-4w) after
initiating treatment with antipsychotic drugs (Yao
et al. 2010a). Healthy controls and both patient groups
(FENNS-BL, FENNS-4w) showed correlations between
tryptophan and its metabolites melatonin, kynurenine,
3-OHKY, and tryptamine. However, certain interac-
tions of tryptophan metabolites appeared only in
healthy controls. In healthy controls, but in neither of
the FENNS groups, serontonin was highly correlated
with tryptophan, melatonin, kynurenine, and trypt-
amine. Also in healthy controls, but in neither of the
FENNS groups, 5-hydroxyindoleacetic acid (5-HIAA)
was highly correlated with tryptophan, melatonin,
kynurenine, and 3-OHKY. In the present report, rela-
tionships are detailed between these metabolic sig-
natures of tryptophan-degraded products and clinical
symptoms in the same sample of FENNS. The main
research questions concerned whether tryptophan
metabolites are associated with clinical symptoms
in FENNS at baseline when neuroleptic-naive and
drug-free and/or at 4 wk after beginning pharmaco-
logical treatment, and, if present, whether these re-
lationships differ significantly between the two time
periods. The primary hypothesis concerned the po-
tential influence of kynurenine pathway metabolism
on clinical symptomatology. Based on recent empirical
and conceptual advances that suggest a coupling of
kynurenine metabolism and glutamatergic neuro-
transmission, kynurenine and its metabolite 3-OHKY
were expected to be associatedwith the cardinal symp-
toms of schizophrenia, including positive and nega-
tive symptoms.
The secondary hypothesis concerned the role of anti-
psychotic treatment regimen on glutamatergic neuro-
transmission. Classes of drugs known to reverse
NMDA antagonism, and presumably glutamatergic
hypofunction, include GABAA agonists, muscarinic
antagonists, non-NMDA glutamate antagonists, and
atypical antipsychotics such as clozapine and olanza-
pine (Olney et al. 1999). The predicted influence of
kynurenine pathway on symptom severity and profile
was therefore expected to manifest primarily at base-
line when patients were unmedicated; treatment with
antipsychotics was expected to reduce or eliminate the
relationship between kynurenine pathway metabolites
and clinical symptoms. As a final consideration, the
relative importance of tryptophan metabolism and
neurological function for the clinical profile of schizo-
phrenia is unknown. The latter has a demonstrated
relationship to psychiatric symptoms and cognition in
schizophrenia (Sanders et al. 2000, 2004) and to neuro-
anatomical regions (Keshavan et al. 2003) relevant for
some of the cognitive deficits associated with this dis-
order. Tryptophan metabolites and neurological func-
tion were expected to exert independent effects on
clinical symptoms.
Methods and materials
Clinical design
Twenty-five patients were recruited during their first
episode of psychosis after they provisionally met
DSM-IV criteria for schizophrenia, schizophreniform,
or schizoaffective disorder based on the Structured
Clinical Interview for DSM Disorders (SCID). Diag-
nostic assessments and ratings of clinical and neuro-
logical symptoms were performed by experienced
research clinicians. Initial and follow-up diagnoses
were confirmed at diagnostic conferences attended by
research faculty and staff, and chaired by an experi-
enced psychiatrist (M.S.K.). Sample characteristics
(mean¡S.D.) included: age=22.6¡7.2 yr ; education=12¡3.3 yr ; parental socioeconomic status=36.1¡
14.3 (Hollingshead, 1975) ; weight=146.4¡38.4 lb ;
height=67.3¡3.4 in. ; body mass index=22.4¡4.8.
The ethnicity composition of the sample comprised 15
Caucasian, eight African-American, one Asian Pacific,
and one other/unknown. Plasma and clinical data
were available at both baseline and 4-wk follow-up for
24 patients. Blood samples were collected and clinical
symptoms were evaluated prior to initiation of clin-
icians’ choice of antipsychotic agents. A second set of
blood samples and clinical ratings were obtained for
the same patients y4 wk after treatment was initiated
758 R. Condray et al.

with one or more of the following antipsychotic drugs:
risperidone (n=17), olanzapine (n=5), quetiapine
(n=2), aripiprazole (n=1), haloperidol (n=1). The
number equals more than 24 due to polypharmacy.
One patient was unmedicated. The mean and S.D.
dosage of antipsychotics (chlorpromazine equivalents)
(Woods, 2003) was 221.4¡171.1 mg/d (median 150,
range 100–900). Clinical and neurological symptoms
were rated by experienced research clinicians at both
time-points using standard rating scales : Brief Psy-
chiatric Rating Scale (BPRS; Overall & Gorham, 1962),
Scale for Assessment of Negative Symptoms (SANS)
and Scale for Assessment of Positive Symptoms
(SAPS; Andreasen, 1983 ; 1984), Global Assessment
Scale (GAS; Endicott et al. 1976), Clinical Global Im-
pression (CGI; Guy, 1976), Neurological Evaluation
Scale (NES; Buchanan & Heinrichs, 1989). Following a
complete description of the study to each individual,
written informed consent was obtained in accordance
to the study protocol that was approved by the
Institutional Review Board at the University of
Pittsburgh and the VA Pittsburgh Healthcare System.
Laboratory assays
All blood samples were collected in the morning after
overnight fasting. Samples were prepared for analysis
by extraction in acidified acetonitrile and analysed by
LCECA. Complete details of this methodology are
provided in Yao et al. (2010a, b).
Data analyses
Clinical symptom ratings and concentrations of tryp-
tophanmetabolitesmeasured fromplasmawere exam-
ined for the first-episode neuroleptic-naive patients
with schizophrenia. The focus of analyses concerned
thosemetabolites that previously showed altered inter-
actions within the tryptophan pathway in this sample
of schizophrenia patients, including tryptophan, sero-
tonin, 5-HIAA, melatonin, kynurenine, 3-OHKY,
and tryptamine (Yao et al. 2010a). All analytes are ex-
pressed as ng/ml of plasma. Two groups of clinical
ratings and metabolite variables were analysed:
25 FENNS at baseline and 24 of those same patients
4 wk after beginning treatment with antipsychotic
drugs (n=24 at 4 wk due to one patient missing some
clinical ratings). Descriptive statistics were computed
for the 24 patients for whom clinical symptom ratings
were available at both time-points (Table 1). For these
analyses, individual items from the BPRS were com-
bined to form symptom clusters as follows: Total score
(items 1–18) ; Psychosis (items 4, 7, 8, 10, 11, 12, 14, 15) ;
Mood (items 1, 2, 5, 6, 9, 13). Additional BPRS clusters
enabled a more fine-grained examination of psychosis-
related symptomatology, including Thought Disturb-
ance (items 4, 8, 11, 12, 15, 18) and Paranoia (items 10,
11, 14). Control of type I error was achieved for these
multiple comparisons using Bonferroni correction.
Table 2 presents descriptive statistics for the set of
tryptophan metabolites included in this report, as well
Table 1. Clinical symptom ratings for first-episode schizophrenia patients at baseline and 4 wk
Clinical symptom
Baseline
(neuroleptic
naive),
mean¡S.D.
4 wk
(medicated),
mean¡S.D. ta d.f.a p valueb
BPRS total score 52.58¡8.9 42.91¡7.5 4.13 23 <0.001b
BPRS symptom clusters
Psychosis 24.46¡4.6 19.00¡4.5 7.06 23 <0.001b
Thought disturbance 18.87¡3.7 14.04¡3.5 5.80 23 <0.001b
Paranoia 9.71¡3.2 7.54¡2.9 4.28 23 <0.001b
Mood (anxiety-depression) 18.50¡6.2 14.71¡3.9 2.56 23 0.017
Positive symptoms (SAPS) 24.29¡11.0 14.21¡12.1 4.91 23 <0.001b
Negative symptoms (SANS) 45.46¡10.3 42.17¡8.2 1.48 23 0.156
Neurological symptoms – Totalc 6.95¡3.5 5.35¡2.9 2.31 19 0.032
BPRS, Brief Psychiatric Rating Scale ; SAPS, Schedule for the Assessment of Positive Symptoms; SANS, Schedule for the
Assessment of Negative Symptoms.a t test, paired samples ; two-tailed ; d.f., degrees of freedom.b Bonferroni correction of standard af0.05f0.00625 ; pf0.10f0.0125.c NES Total Subscale (Sanders et al. 2000) from Neurological Evaluation Scale (NES; Buchanan & Heinrichs, 1989).
3-OHKY and schizophrenia 759

as p values from the tests of differences between
baseline and 4 wk for patients, and between the age-
matched healthy volunteers and patients at each time-
point (data adapted from Yao et al. 2010a).
The relationship between analytes within the tryp-
tophan pathway and clinical symptom ratings was
examined for both time-points. Most of the analytes
within the tryptophan pathway and the clinical symp-
tom ratings either were, or were able to be transformed
to, approximate univariate and multivariate normality
using natural log (ln), square root (sqrt), quartic root,
negative inverse, negative inverse square root, and/or
negative inverse quartic root transformations.
A correlation test (Johnson & Wichern, 1998) and
Henze & Zirkler’s test (1990) were used to assess ap-
proximate univariate and multivariate normality, re-
spectively, requiring p<0.10 for rejection of normality.
Following normality determination and, if necessary,
transformations, both groupings of data had the hy-
pothesis of complete independence of all metabolite
and clinical symptom variables tested, and each
hypothesis was rejected with p<10x8.
Simultaneous tests of the hypotheses that multiple
correlation coefficients were equal to zero were com-
puted separately for the data at baseline and for the
data at 4 wk (Drton & Perlman, 2004). Simultaneous
tests of the hypotheses that correlations at baseline and
at 4 wk were equal were additionally computed using
the Larntz & Perlman (1988) procedure to screen for
any baseline to 4-wk between-group correlation differ-
ences. Both methods use Sidak simultaneous confi-
dence intervals (or pvalues) to correct formultiple tests.
p value results obtained from the Drton & Perlman
(2004) and the Larntz & Perlman (1988) procedures
were additionally verified by Monte Carlo simulation
using 10 000 randomly generated datasets. The test
statistics and Monte Carlo p values did not differ
greatly, but the Monte Carlo p values were considered
to be more accurate. Significant effects were confirmed
using a repeated-measures model to estimate clinical
symptom(s) under different levels of metabolite at
each time-point.
Finally, any significant relationship obtained be-
tween metabolite and clinical symptom based on the
above procedures was examined further using linear
regression analysis. Included in this approach was an
evaluation of the relative contributions of metabolite(s)
showing a significant relation to clinical symptoms and
of neurological symptoms that have a demonstrated
relationship to clinical symptoms, cognitive per-
formance, and neuroanatomical regions of interest for
schizophrenia. The model included metabolite and
neurological symptoms [total score for themodified 13-
item version of the NES (Buchanan & Heinrichs, 1989)
from Sanders et al. (2000)] as independent or predictor
factors using a forward selection procedure. The joint
(or interaction) effects of these twovariable classeswere
also examined, as well as the effects of control variables
(age, education, body mass index). Collinearity was
evaluated using correlation coefficients for the pre-
dictor or independent variables and tests of tolerance,
variance inflation factor, and condition indices
(Pedhazur, 1997). Unstandardized betas are reported.
Bonferroni correction was used to control type I error.
Table 2. Descriptive statistics for metabolites in tryptophan pathway
Metabolites
HC
(n=30)
FENNS-BL
(n=25)
FENNS-4w
(n=25)
p values
HC vs. BL HC vs. 4w BL vs. 4w
TRP 7628¡3043a 6426¡3493 5469¡2977 0.069 0.007b 0.133
5-HT 200¡145 238¡152 182¡147 0.301 0.562 0.020
5-HIAA 18¡11 19¡16 17¡21 0.496 0.014 0.263
MEL 1.03¡0.44 0.80¡0.39 0.70¡0.34 0.073 0.003b 0.156
KYN 161¡86 125¡79 111¡75 0.077 0.013 0.287
3-OHKY 10¡8 8.17¡8.10 7.73¡8.75 0.176 0.071 0.751
TRPA 19¡7 17¡9 16¡6 0.144 0.175 0.791
HC, Healthy controls ; FENNS, first-episode neuroleptic-naive patients with schizophrenia ; BL, baseline ; 4w, 4-wk treatment
with antipsychotic drugs ; TRP, tryptophan; 5-HT, serotonin ; 5-HIAA, 5-hydroxyindoleacetic acid ; MEL, melatonin ; KYN,
kynurenine ; 3-OHKY, 3-hydroxykynurenine ; TRPA, tryptamine.a Each value (ng/ml) represents mean and standard deviation. All data were adapted from Yao et al. (2010a).b Because the parametric assumptions for the Student’s t test are not met, a non-parametric test, the Wilcoxon Rank Sum test
was used to compare the locations of samples from disparate groups, and the Wilcoxon Signed Rank test was done to compare
paired samples (i.e. BL vs. 4w). Significant difference after Bonferroni correction of an a of 0.05–0.0038, or 0.10–0.0077.
760 R. Condray et al.
Results
Most clinical symptom scores improved significantly
from baseline levels after following initiation of treat-
ment with antipsychotic drugs (Table 1). Exceptions
were the mood and negative symptom scores, and the
total neurological symptoms score. Within-group cor-
relations for tryptophan pathway metabolites and
clinical symptoms for FENNS at baseline and 4-wk
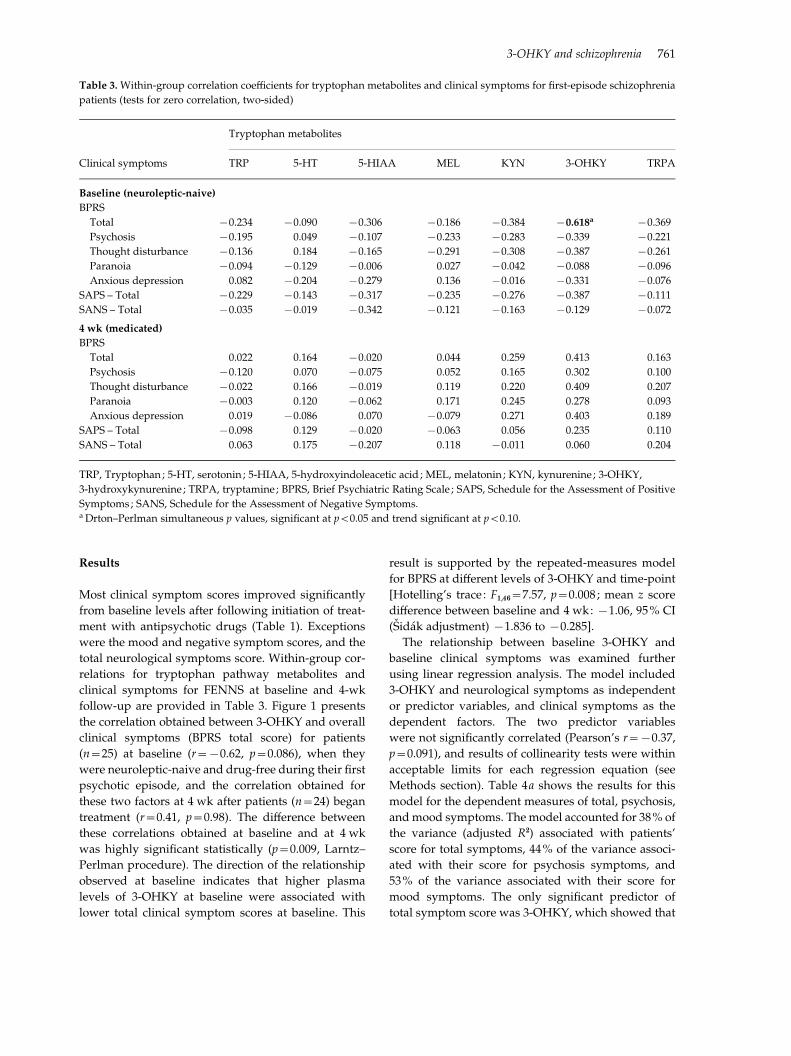
follow-up are provided in Table 3. Figure 1 presents
the correlation obtained between 3-OHKY and overall
clinical symptoms (BPRS total score) for patients
(n=25) at baseline (r=x0.62, p=0.086), when they
were neuroleptic-naive and drug-free during their first
psychotic episode, and the correlation obtained for
these two factors at 4 wk after patients (n=24) began
treatment (r=0.41, p=0.98). The difference between
these correlations obtained at baseline and at 4 wk
was highly significant statistically (p=0.009, Larntz–
Perlman procedure). The direction of the relationship
observed at baseline indicates that higher plasma
levels of 3-OHKY at baseline were associated with
lower total clinical symptom scores at baseline. This
result is supported by the repeated-measures model
for BPRS at different levels of 3-OHKY and time-point
[Hotelling’s trace : F1,46=7.57, p=0.008 ; mean z score
difference between baseline and 4 wk: x1.06, 95% CI
(Sidak adjustment) x1.836 to x0.285].
The relationship between baseline 3-OHKY and
baseline clinical symptoms was examined further
using linear regression analysis. The model included
3-OHKY and neurological symptoms as independent
or predictor variables, and clinical symptoms as the
dependent factors. The two predictor variables
were not significantly correlated (Pearson’s r=x0.37,
p=0.091), and results of collinearity tests were within
acceptable limits for each regression equation (see
Methods section). Table 4a shows the results for this
model for the dependent measures of total, psychosis,
andmood symptoms. Themodel accounted for 38% of
the variance (adjusted R2) associated with patients’
score for total symptoms, 44% of the variance associ-
ated with their score for psychosis symptoms, and
53% of the variance associated with their score for
mood symptoms. The only significant predictor of
total symptom score was 3-OHKY, which showed that
Table 3. Within-group correlation coefficients for tryptophan metabolites and clinical symptoms for first-episode schizophrenia
patients (tests for zero correlation, two-sided)
Clinical symptoms
Tryptophan metabolites
TRP 5-HT 5-HIAA MEL KYN 3-OHKY TRPA
Baseline (neuroleptic-naive)
BPRS
Total x0.234 x0.090 x0.306 x0.186 x0.384 x0.618a x0.369
Psychosis x0.195 0.049 x0.107 x0.233 x0.283 x0.339 x0.221
Thought disturbance x0.136 0.184 x0.165 x0.291 x0.308 x0.387 x0.261
Paranoia x0.094 x0.129 x0.006 0.027 x0.042 x0.088 x0.096
Anxious depression 0.082 x0.204 x0.279 0.136 x0.016 x0.331 x0.076
SAPS – Total x0.229 x0.143 x0.317 x0.235 x0.276 x0.387 x0.111
SANS – Total x0.035 x0.019 x0.342 x0.121 x0.163 x0.129 x0.072
4 wk (medicated)
BPRS
Total 0.022 0.164 x0.020 0.044 0.259 0.413 0.163
Psychosis x0.120 0.070 x0.075 0.052 0.165 0.302 0.100
Thought disturbance x0.022 0.166 x0.019 0.119 0.220 0.409 0.207
Paranoia x0.003 0.120 x0.062 0.171 0.245 0.278 0.093
Anxious depression 0.019 x0.086 0.070 x0.079 0.271 0.403 0.189
SAPS – Total x0.098 0.129 x0.020 x0.063 0.056 0.235 0.110
SANS – Total 0.063 0.175 x0.207 0.118 x0.011 0.060 0.204
TRP, Tryptophan ; 5-HT, serotonin ; 5-HIAA, 5-hydroxyindoleacetic acid ; MEL, melatonin ; KYN, kynurenine ; 3-OHKY,
3-hydroxykynurenine ; TRPA, tryptamine; BPRS, Brief Psychiatric Rating Scale ; SAPS, Schedule for the Assessment of Positive
Symptoms; SANS, Schedule for the Assessment of Negative Symptoms.a Drton–Perlman simultaneous p values, significant at p<0.05 and trend significant at p<0.10.
3-OHKY and schizophrenia 761
higher plasma levels of this metabolite were associ-
ated with lower total clinical symptom scores.
Interestingly, the only significant predictor of psy-
chosis symptoms was the neurological symptoms fac-
tor, and the direction of this relationship indicated
increases in patients’ neurological symptoms to be as-
sociated with increases in their psychosis symptoms.
In contrast, both 3-OHKY and neurological symptoms
were significant predictors of patients’ mood symp-
tom score. The directions of these relationships show
that increases in metabolite concentration and neuro-
logical symptoms were associated with decreases in
symptoms of anxiety and depression.
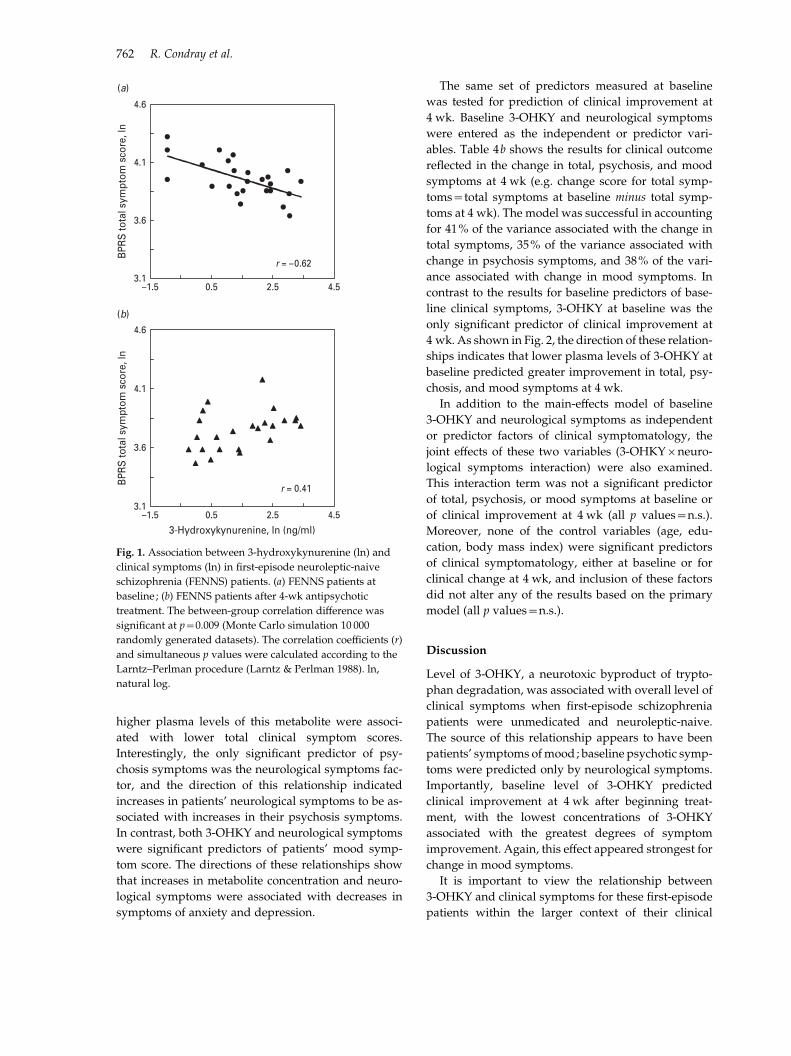
The same set of predictors measured at baseline
was tested for prediction of clinical improvement at
4 wk. Baseline 3-OHKY and neurological symptoms
were entered as the independent or predictor vari-
ables. Table 4b shows the results for clinical outcome
reflected in the change in total, psychosis, and mood
symptoms at 4 wk (e.g. change score for total symp-
toms=total symptoms at baseline minus total symp-
toms at 4 wk). The model was successful in accounting
for 41% of the variance associated with the change in
total symptoms, 35% of the variance associated with
change in psychosis symptoms, and 38% of the vari-
ance associated with change in mood symptoms. In
contrast to the results for baseline predictors of base-
line clinical symptoms, 3-OHKY at baseline was the
only significant predictor of clinical improvement at
4 wk. As shown in Fig. 2, the direction of these relation-
ships indicates that lower plasma levels of 3-OHKY at
baseline predicted greater improvement in total, psy-
chosis, and mood symptoms at 4 wk.
In addition to the main-effects model of baseline
3-OHKY and neurological symptoms as independent
or predictor factors of clinical symptomatology, the
joint effects of these two variables (3-OHKYrneuro-
logical symptoms interaction) were also examined.
This interaction term was not a significant predictor
of total, psychosis, or mood symptoms at baseline or
of clinical improvement at 4 wk (all p values=n.s.).
Moreover, none of the control variables (age, edu-
cation, body mass index) were significant predictors
of clinical symptomatology, either at baseline or for
clinical change at 4 wk, and inclusion of these factors
did not alter any of the results based on the primary
model (all p values=n.s.).
Discussion
Level of 3-OHKY, a neurotoxic byproduct of trypto-
phan degradation, was associated with overall level of
clinical symptoms when first-episode schizophrenia
patients were unmedicated and neuroleptic-naive.
The source of this relationship appears to have been
patients’ symptoms ofmood; baseline psychotic symp-
toms were predicted only by neurological symptoms.
Importantly, baseline level of 3-OHKY predicted
clinical improvement at 4 wk after beginning treat-
ment, with the lowest concentrations of 3-OHKY
associated with the greatest degrees of symptom
improvement. Again, this effect appeared strongest for
change in mood symptoms.
It is important to view the relationship between
3-OHKY and clinical symptoms for these first-episode
patients within the larger context of their clinical
4.6
4.1
3.6
3.1–1.5 0.5 2.5 4.5
4.6
4.1
3.6
3.1–1.5 0.5 2.5 4.5
BPR
S to
tal s
ympt
om s
core
, ln
BPR
S to
tal s
ympt
om s
core
, ln
3-Hydroxykynurenine, ln (ng/ml)
r = –0.62
r = 0.41
(a)
(b)
Fig. 1. Association between 3-hydroxykynurenine (ln) and
clinical symptoms (ln) in first-episode neuroleptic-naive
schizophrenia (FENNS) patients. (a) FENNS patients at
baseline ; (b) FENNS patients after 4-wk antipsychotic
treatment. The between-group correlation difference was
significant at p=0.009 (Monte Carlo simulation 10 000
randomly generated datasets). The correlation coefficients (r)
and simultaneous p values were calculated according to the
Larntz–Perlman procedure (Larntz & Perlman 1988). ln,
natural log.
762 R. Condray et al.

status and tryptophan metabolism at the baseline and
1-month time-points. First, these patients showed sig-
nificant clinical improvement after 4 wk of treatment
with antipsychotic drugs. Improvement occurred pri-
marily in the domain of positive symptoms, including
symptoms of psychosis, thought disturbance, and
paranoia. Changes in mood, negative, and neurologi-
cal symptoms did not reach statistical significance.
Regarding the latter, however, it is possible that the
conservative nature of our correction against type I
error may be concealing real improvement in these
clinical domains. In contrast, their absolute levels of
tryptophan metabolites in plasma did not differ sig-
nificantly between the assessments at baseline and
4 wk, nor did the levels of kynurenine and its meta-
bolic compounds differ between healthy volunteers
and patients at either time-point (reported in Yao et al.
2010a). Second, both patients and healthy controls
showed highly significant correlations between tryp-
tophan and kynurenine, 3-OHKY, and tryptamine,
which is suggestive of tight control over relative
metabolite ratios along the tryptophan pathways (Yao
et al. 2010a). The findings for 3-OHKY revealed in the
present report may therefore be due to effects outside
the stream ofmetabolic linkageswithin the kynurenine
pathway, with a strong candidate being the known
influence of kynurenine compounds on the gluta-
matergic system (for details see Introduction). An
additional, potentially important implication of the
present data is that 3-OHKY and its downstream ef-
fects may influence the degree of clinical improvement
that can be achieved through brief treatment with
pharmacological agents.
Alterations in cortical kynurenic acid have been
reported for schizophrenia, and, although plasma
kynurenic acid was not examined in the present study,
the relationship observed between 3-OHKY and
clinical symptoms is generally consistent with those
previously reported alterations. Importantly, the di-
rections of the relationships obtained between metab-
olite and psychological disturbance suggest this
relationship is not straightforward. Baseline concen-
tration of metabolite was inversely related to baseline
clinical symptoms, with lower concentrations of
3-OHKY associated with greater psychological dis-
turbance when patients were unmedicated and neuro-
leptic-naive. In contrast, baseline level of metabolite
showed the opposite relationship to clinical improve-
ment at 4 wk, with lower baseline concentrations of
3-OHKY predicting greater improvement in patients’
clinical symptoms 1 month after beginning treatment
with antipsychotics. As noted, patients did not differ
from controls for absolute levels of tryptophan,
kynurenine, or 3-OHKY at either time-point, and all
groups were characterized by a tight coupling between
tryptophan and kynurenine and between tryptophan
Table 4. 3-Hydroxykynurenine (3-OHKY) and neurological symptoms predict clinical symptoms for first-episode schizophrenia
patients
R Adj. R2 F ratio d.f. pf b S.E. b t test pf 95% CI
(a) Baseline metabolite and neurological factors predict baseline clinical symptomsa
(1) BPRS Total symptoms 0.64 0.38 14.17 1, 20 0.001b
3-OHKY x4.418 1.174 x3.76 0.001b x6.866 to x1.97
(2) BPRS Psychosis symptoms 0.68 0.44 17.66 1, 20 0.001b
Neurological symptoms, Total 5.849 1.392 4.20 0.001b 2.946 to 8.753
(3) BPRS Mood symptoms 0.76 0.53 12.78 2, 19 0.001b
3-OHKY x3.319 0.746 x4.45 0.001b x4.880 to x1.758
Neurological symptoms, Total x7.318 2.191 x3.34 0.003b x11.904 to x2.733
(b) Baseline metabolite predicts clinical change at 4 wk
(1) BPRS Total symptom change 0.66 0.41 15.68 1, 20 0.001b
3-OHKY x0.733 0.185 x3.96 0.001b x1.120 to x0.347
(2) BPRS Psychosis symptom change 0.62 0.35 12.58 1, 20 0.002b
3-OHKY x0.252 0.071 x3.55 0.002b x0.401 to x0.104
(3) BPRS Mood symptom change 0.64 0.38 14.15 1, 20 0.001b
3-OHKY x0.502 0.134 x3.76 0.001b x0.781 to x0.224
R, Multiple correlation coefficient ; F ratio, test of significance of R ; d.f., degrees of freedom; b, regression coefficient or slope ; S.E.,
standard error ; CI, confidence interval for regression coefficient ; BPRS, Brief Psychiatric Rating Scale.a Predictors : 3-hydroxykynurenine and neurological symptoms – Total.b Bonferroni correction of standard af0.05f0.0083 ; pf0.10f0.016.
3-OHKY and schizophrenia 763
and 3-OHKY (Yao et al. 2010a). Thus, the pattern in the
present data cannot be accounted for by elevated
levels of kynurenine metabolites, or by alterations in
metabolic linkages along this pathway.
One mechanism that may account for the pattern of
associations that was observed in the present study
concerns the relationship between tryptophan catab-
olism and transmitter dynamics, including the pre-
viously mentioned modulatory action of kynurenic
acid on glutamatergic transmission. Moreover, the in-
dication in the present data that antipsychotic agents
modify these dynamics receives support from recent
work. First, Issa et al. (1994) found an association be-
tween the amount of change in CSF 3-OHKY and
change in clinical symptoms following 6 wk of treat-
ment with haloperidol in unmedicated chronic schizo-
phrenia patients who were judged to be treatment
resistant. Second, Schwieler et al. (2008) administered
clozapine to rodents, which increased activation of
dopamine neurons in the ventral tegmental area (VTA).
However, pretreatment with agents that either pro-
duced elevated or decreased brain levels of kynurenic
acid resulted in inhibition or potentiation, respect-
ively, of the excitatory effect of clozapine on dopamine
neurons in VTA. The kynurenine pathway may
therefore influence dopaminergic as well as glutama-
tergic transmission.
The relationship between tryptophan metabolism
and clinical symptoms appeared strongest for mood
symptoms in this sample of first-episode patients.
Due to the growing understanding that symptoms of
depression are present even in the prodrome as well as
during the first episode of schizophrenia (Hafner et al.
2005 ; Iyer et al. 2008; Owens et al. 2005 ; Romm et al.
2010), this metabolite–clinical symptom linkage has
implications for early identification and intervention
strategies. In contrast, symptoms of psychosis in these
patients showed a different pattern at baseline and
4 wk; baseline neurological symptoms predicted base-
line psychosis symptoms, while baseline metabolites
predicted change in psychosis symptoms at 4 wk.
This former relationship, which showed increases in
neurological symptoms to be associated with increases
in psychotic symptoms, is generally consistent with
earlier findings for unmedicated chronic patients
(Mittal et al. 2007; Sanders et al. 2000).
In summary, biochemical–clinical relationships
were examined for first-episode schizophrenia pa-
tients at baseline when they were unmedicated and
neuroleptic-naıve, and again at 1 month after begin-
ning treatment. Key biochemical variables within the
tryptophan metabolic pathway and clinical symptoms
relevant to schizophrenia were targeted. Results sug-
gest this metabolic pathway may play a role in clinical
presentation and outcome during the early course of
schizophrenia illness.
Acknowledgements
This material is based on work supported by grants
from the Department of Veterans Affairs, Veterans
Health Administration, Office of Research and
Development, Biomedical Laboratory R & D [Merit
Reviews (J.K.Y.) and Senior Research Career Scientist
Award (J.K.Y.)], VA Pittsburgh Healthcare System
8
6
4
2
0
BPR
S to
tal c
hang
e, s
qrt
–2 0 2 4
8
6
4
2
0BPR
S p
sych
osis
cha
nge,
sqr
t
–2 0 2 4
8
6
4
2
0
BPR
S m
ood
chan
ge, s
qrt
–2 0 2 4
(a)
(b)
(c)
β = –0.733p = 0.001
β = –0.252p = 0.002
β = –0.502p = 0.001
Baseline 3-hydroxykynurenine, ln (ng/ml)
Fig. 2. Baseline 3-hydroxykynurenine (3-OHKY) (ln) predicts
clinical change at 4 wk for (a) total symptoms (sqrt) ;
(b) psychosis symptoms (sqrt) ; (c) mood symptoms (sqrt).
The regression coefficient or slope (b) and p values were
calculated by multiple regression analyses. ln, natural log ;
sqrt, square root.
764 R. Condray et al.
(J.K.Y., G.G.D., R.D.R.), National Institute of
Mental Health [MH58141 (J.K.Y.), MH64118 (R.D.R.),
MH45203 (M.S.K), and MH84941 (R.K.D.)], National
Institute of General Medical Sciences [R24 GM078233
(R.K.D.)]. The authors are grateful to Dr Nina Schooler
and Dr Cameron Carter, and the clinical core staff of
the Center for the Neuroscience of Mental Disorders
(MH45156, David Lewis, M.D., Director) for their as-
sistance in diagnostic and psychopathological assess-
ments, and to P. Cheng, C. Korbanic and J. Haflett for
their technical assistance. The funders had no role in
study design, data collection and analysis, decision to
publish, or preparation of the manuscript. The con-
tents of this article do not represent the views of the
Department of Veterans Affairs or the United States
Government.
Statement of Interest
Dr McEvoy received honoraria from Lilly, and grant
support from GlaxoSmithKline, Pfizer and Dainippon
Sumitomo Pharmaceuticals America. Dr Kaddurah-
Daouk is an equity holder in Metabolon Inc., a bio-
technology company in the metabolomics domain,
and also holds patent in this field.
References
Alkondon M, Pereira EFR, Yu P, Arruda EZ, et al. (2004).
Targeted deletion of the kynurenine aminotransferase II
gene reveals a critical role of endogenous kynurenic acid
in the regulation of synaptic transmission via a7 nicotinic
receptors in the hippocampus. Journal of Neuroscience 24,
4635–4648.
Andreasen NC (1983). Scale for the Assessment of Negative
Symptoms (SANS). Iowa City, IA : University of Iowa.
Andreasen NC (1984). Scale for the Assessment of Positive
Symptoms (SAPS). Iowa City, IA : University of Iowa.
Aschcroft GW, Crawford TBB, Eccleston D, Sharman DF,
et al. (1966). 5-Hydroxyindole compounds in the
cerebrospinal fluid of patients with psychiatric or
neurological disease. Lancet 2, 1049–1052.
Barry S, Clarke G, Scully P, Dinan TG (2009). Kynurenine
pathway in psychosis : evidence of increased tryptophan
degradation. Journal of Psychopharmacology 23, 287–294.
Buchanan RW, Heinrichs DW (1989). The Neurological
Evaluation Scale (NES) : a structured instrument for the
assessment of neurological signs in schizophrenia.
Psychiatry Research 27, 335–350.
Carlsson A, Lindqvist M (1963). Effect of chlorpromazine or
haloperidol on the formation of 3-methoxytyramine and
mormetanephrine in mouse brain. Acta Pharmacologica et
Toxicologica (Copenhagen) 20, 140–144.
Chess AC, Bucci DJ (2006). Increased concentration of
cerebral kynurenic acid alters stimulus processing and
conditioned responding. Behavioural Brain Research 170,
326–332.
Chess AC, Simoni MK, Alling TE, Bucci DJ (2007).
Elevations of endogenous kynurenic acid produce
spatial working memory deficits. Schizophrenia Bulletin
33, 797–804.
Clish CB, Davidov E, Oresic M, Plasterer TN, et al. (2004).
Integrative biological analysis of the APOE*3-leiden
transgenic mouse. OMICS 8, 3–13.
Drton M, Perlman MD (2004). Model selection for Gaussian
concentration graphs. Biometrika 91, 591–602.
Endicott J, Spitzer RL, Fleiss JL, Cohen J (1976). The global
assessment scale. A procedure for measuring overall
severity of psychiatric disturbance. Archives of General
Psychiatry 33, 766–771.
Erhardt S, Blennow K, Nordin C, Skogh E, et al. (2001).
Kynurenic acid levels are elevated in the cerebrospinal
fluid of patients with schizophrenia. Neuroscience Letters
313, 96–98.
Erhardt S, Schwieler L, Emanuelsson C, Geyer M (2004).
Endogenous kynurenic acid disrupts prepulse inhibition.
Biological Psychiatry 56, 255–260.
Foster AC, Collins JF, Schwarcz R (1983). On the excitotoxic
properties of quinolinic acid, 2,3-piperidine dicarboxylic
acids and structurally related compounds.
Neuropharmacology 22, 1331–1342.
Garelis E, Gillin J, Wyatt R, Neff N (1975). Elevated
blood serotonin concentration in unmedicated chronic
schizophrenic patients. American Journal of Psychiatry 132,
184–186.
Geyer MA, Vollenweider FX (2008). Serotonin research :
contributions to understanding psychoses. Trends in
Pharmacological Science 29, 445–453.
Guidetti P, Schwarcz R (1999). 3-Hydroxykynurenine
potentiates quinolinate but not NMDA toxicity in the rat
striatum. European Journal of Neuroscience 11, 3857–3863.
Guy W (1976). Clinical global impressions. In : ECDEU
Assessment Manual for Psychopharmacology (Revised)
(pp. 217–221). Rockville : National Institute of Mental
Health.
Hafner H, Maurer K, Trendler G, an der Heiden W, et al.
(2005). Schizophrenia and depression: challenging the
paradigm of two separate diseases – a controlled study of
schizophrenia, depression and healthy controls.
Schizophrenia Research 77, 11–24.
Henze N, Zirkler B (1990). A class of invariant consistent
tests for multivariate normality. Communications in
Statistics – Theory and Methods 19, 3595–3617.
Hilmas C, Pereira EFR, Alkondon M, Rassoulpour A, et al.
(2001). The brain metabolite kynurenic acid inhibits a7
nicotinic receptor activity and increases non-a7 nicotinic
receptor expression: physiopathological implications.
Journal of Neuroscience 21, 7463–7473.
Hollingshead A (1975). Four Factor Index of Social Status.
New Haven : Department of Sociology, Yale University.
Howes OD, Kapur S (2009). The dopamine hypothesis of
schizophrenia : Version III – the final common pathway.
Schizophrenia Bulletin 35, 549–562.
3-OHKY and schizophrenia 765

Issa F, Kirch DG, Gerhardt GA, Bartko JJ, et al. (1994).
A multidimensional approach to analysis of cerebrospinal
fluid biogenic amines in schizophrenia : II. Correlations
with psychopathology. Psychiatry Research 52, 251–258.
Iyer SN, Boekestyn L, Cassidy CM, King S, et al. (2008).
Signs and symptoms in the pre-psychotic phase :
description and implications for diagnostic trajectories.
Psychological Medicine 38, 1147–1156.
Javitt DC (2007). Glutamate and schizophrenia :
phencyclidine, N-methyl-D-aspartate receptors, and
dopamine-glutamate interactions. International Review of
Neurobiology 78, 69–108.
Javitt DC, Laruelle M (2006). Neurochemical theories. In :
Lieberman JA, Stroup TS, Perkins DO (Eds), Textbook of
Schizophrenia (pp. 85–116). Washington, DC: American
Psychiatric Publishing.
Johnson RA, Wichern DS (1998). Applied Multivariate
Statistical Analysis (4th edn). Upper Saddle River : Prentice
Hall.
Kaddurah-Daouk R, Krishnan KR (2009). Metabolomics :
a global biochemical approach to the study of central
nervous system diseases. Neuropsychopharmacology 34,
173–186.
Kaddurah-Daouk R, Kristal BS, Weinshilboum RM (2008).
Metabolomics : a global biochemical approach to drug
response and disease. Annual Review of Pharmacology and
Toxicology 48, 653–683.
Kaddurah-Daouk R, McEvoy J, Baillie RA, Lee D, et al.
(2007). Metabolomic mapping of atypical antipsychotic
effects in schizophrenia. Molecular Psychiatry 12, 934–945.
Keshavan MS, Sanders RD, Sweeney JA, Diwadkar VA,
et al. (2003). Diagnostic specificity and neuroanatomical
validity of neurological abnormalities in first-episode
psychoses. American Journal of Psychiatry 160, 1298–1304.
Kristal BS, Shurubor YI, Kaddurah-Daouk R, Matson WR
(2007). Metabolomics in the study of aging and caloric
restriction. Methods in Molecular Biology 371, 393–409.
Larntz K, Perlman MD (1988). A simple test for the equality
of correlation matrices. In : Gupta SS, Berger JO (Eds),
Statistical Decision Theory and Related Topics IV, vol. 2
(pp. 289–298). New York : Springer.
Lieberman JA, Koreen AR (1993). Neurochemistry and
neuroendocrinology of schizophrenia, a selective review.
Schizophrenia Bulletin 19, 371–429.
Mannelli P, Patkar A, Rozen S, Matson W, et al. (2009).
Opioid use affects antioxidant activity and purine
metabolism: preliminary results. Human
Psychopharmacology 24, 666–675.
Manowitz P, Gilmour DG, Racevskis J (1973). Low plasma
tryptophan levels in recently hospitalized schizophrenics.
Biological Psychiatry 6, 109–118.
Mittal VA, Hasenkamp W, Sanfilipo M, Wieland S, et al.
(2007). Relation of neurological soft signs to psychiatric
symptoms in schizophrenia. Schizophrenia Research 94,
37–44.
Muck-Seler D, Jakovlievie M, Deanovie Z (1988).
Time course of schizophrenia and platelet 5-HT level.
Biological Psychiatry 23, 243–251.
Olney JW, Newcomer JW, Farber NB (1999). NMDA
receptor hypofunction model of schizophrenia. Journal of
Psychiatric Research 33, 523–533.
Overall JE, Gorham DR (1962). The Brief Psychiatric Rating
Scale. Psychological Reports 10, 799–812.
Owens DGC, Miller P, Lawrie SM, Johnstone EC (2005).
Pathogenesis of schizophrenia : a psychopathological
perspective. British Journal of Psychiatry 186, 386–393.
Patkar AA, Rozen S, Mannelli P, Matson W, et al. (2009).
Alterations in tryptophan and purine metabolism in
cocaine addiction : a metabolomic study.
Psychopharmacology 206, 479–489.
Pedhazur EJ (1997). Multiple Regression in Behavioral Research
(3rd edn). Belmont : Wadsworth.
Reddy R, Keshavan M, Yao JK (2007). Blunted serotonergic
responsivity in neuroleptic-naive patients at first-episode
of schizophrenia. Schizophrenia Research 90, 81–85.
Romm KL, Rossberg JI, Berg AO, Barrett EA, et al.
(2010). Depression and depressive symptoms in first
episode psychosis. Journal of Nervous and Mental Disease
198, 67–71.
Rozen S, Cudkowicz ME, Bogdanov M, Matson WR, et al.
(2005). Metabolomic analysis and signatures in motor
neuron disease. Metabolomics 1, 101–108.
Sanders RD, Keshavan MS, Forman SD, Pieri JN, et al.
(2000). Factor structure of neurological examination
abnormalities in unmedicated schizophrenia. Psychiatry
Research 95, 237–243.
Sanders RD, Schuepbach D, Goldstein G, Haas GL, et al.
(2004). Relationships between cognitive and neurological
performance in neuroleptic-naive psychosis. Journal of
Neuropsychiatry and Clinical Neurosciences 16, 480–487.
Scharfman HE, Goodman JH, Schwarcz R (2000).
Electrophysiological effects of exogenous and
endogenous kynurenic acid in the rat brain : studies
in vivo and in vitro. Amino Acids 19, 283–297.
Schwarcz R, Rassoulpour A, Wu H-Q, Medoff D, et al.
(2001). Increased cortical kynurenate content in
schizophrenia. Biological Psychiatry 50, 521–530.
Schwieler L, Linderholm KR, Nilsson-Todd LK, Erhardt S,
et al. (2008). Clozapine interacts with the glysine site of
the NMDA receptor : electrophysiological studies of
dopamine neurons in the rat ventral tegmental area. Life
Sciences 83, 170–175.
Shepard PD, Joy B, Clerkin L, Schwarcz R (2003).
Micromolar brain levels of kynurenic acid are associated
with a disruption in auditory sensory gating in the rat.
Neuropsychopharmacology 28, 1454–1462.
Shi H, Vigneau-Callahan KE, Matson WR, Kristal BS
(2002). Attention to relative response across sequential
electrodes improves quantitation of coulemetric array.
Analytical Biochemistry 302, 239–245.
Stahl SM, Wood DJ, Mefford IN, Berger PA, et al. (1983).
Hyperserotonemia and platelet serotonin uptake and
release in schizophrenia and affective disorders.
American Journal of Psychiatry 140, 26–30.
Stone TW (1993). Neuropharmacology of quinolinic and
kynurenic acids. Pharmacological Reviews 45, 309–379.
766 R. Condray et al.
Tamminga CA (1998). Schizophrenia and gluatmatergic
transmission. Critical Review Neurobiology 12, 21–36.
Tandon R, Keshavan MS, Nasrallah HA (2008).
Schizophrenia, ‘Just the facts’ : what we know in 2008.
Part 1 : overview. Schizophrenia Research 100, 4–19.
Watanabe Y, Himi T, Saito H, Abe K (1992). Involvement
of glycine site associated with NMDA receptor in
hippocampal long-term potentiation and acquisition of
spatial memory in rats. Brain Research 582, 58–64.
Wonodi I, Schwarcz R (2010). Cortical kynurenine pathway
metabolism: a novel target for cognitive enhancement in
schizophrenia. Schizophrenia Bulletin 36, 211–218.
Woods SW (2003). Chlorpromazine equivalent doses for the
newer atypical antipsychotics. Journal of Clinical Psychiatry
64, 663–667.
Yao JK, Cheng P (2004). Determination of multiple
redox-active compounds by high-performance liquid
chromatography with coulometric multi-electrode array
system. Journal of Chromatography B810, 93–100.
Yao JK, Dougherty Jr. GG, Reddy RD, Keshavan MS,
et al. (2010a). Altered interactions of tryptophan
metabolites in first-episode neuroleptic-naive
patients with schizophrenia. Molecular Psychiatry 15,
938–953.
Yao JK, Dougherty Jr. GG, Reddy RD, Keshavan MS, et al.
(2010b). Homeostatic imbalance of purine catabolism in
first-episode neuroleptic-naive patients with
schizophrenia. PLoS One 5, e9508.
Yao JK, Reddy RD (2005). Metabolic investigation in
psychiatric disorders. Molecular Neurobiology 31, 193–203.
3-OHKY and schizophrenia 767