2nd quarter 2008 results - listed companyaxiata.listedcompany.com/misc/tmi_presentation_2q08.pdf ·...
TRANSCRIPT

2nd QUARTER 2008 RESULTSAnalyst and Investor Briefing
26 August 2008

-1-COMPANY CONFIDENTIAL
Agenda
TMI Group Performance Overview
Malaysia – Celcom
Indonesia – Excelcomindo
Sri Lanka – Dialog
Bangladesh – TMIB
Other Regional Mobile Assets
Moving Forward
-2-COMPANY CONFIDENTIAL
Group Performance Highlights for 1H 2008
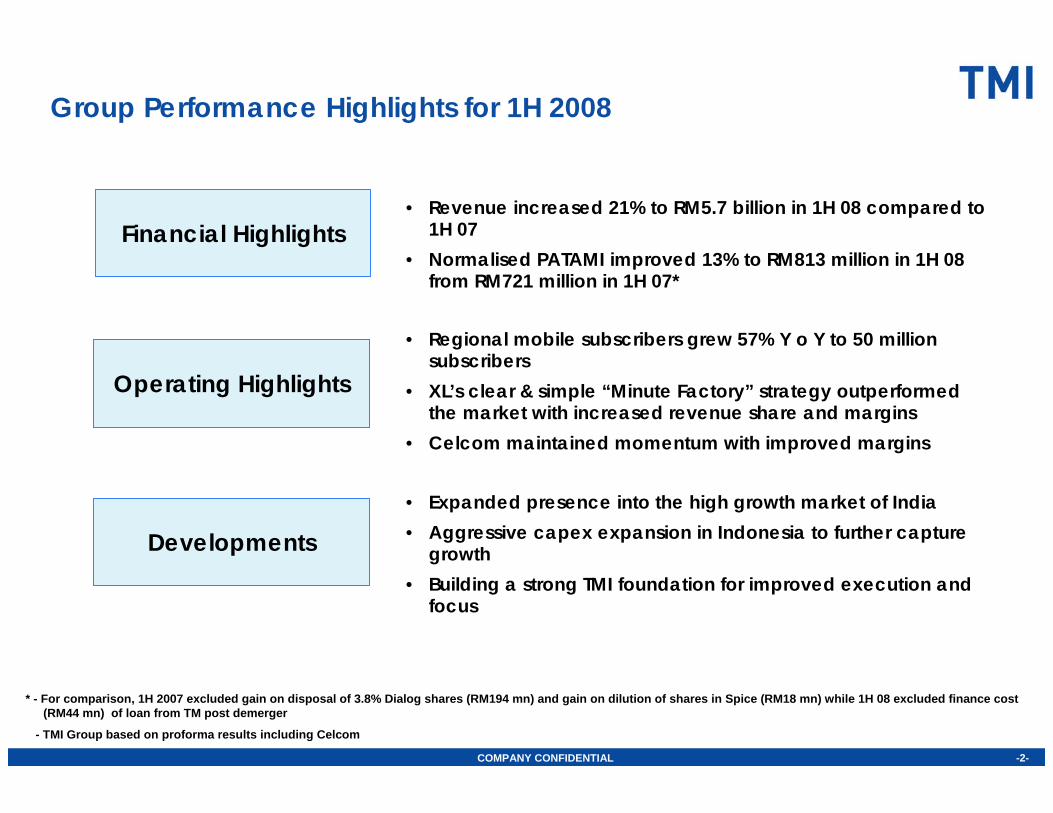
* - For comparison, 1H 2007 excluded gain on disposal of 3.8% Dialog shares (RM194 mn) and gain on dilution of shares in Spice (RM18 mn) while 1H 08 excluded finance cost (RM44 mn) of loan from TM post demerger
- TMI Group based on proforma results including Celcom
Financial Highlights• Revenue increased 21% to RM5.7 billion in 1H 08 compared to
1H 07• Normalised PATAMI improved 13% to RM813 million in 1H 08
from RM721 million in 1H 07*
Operating Highlights
• Regional mobile subscribers grew 57% Y o Y to 50 million subscribers
• XL’s clear & simple “Minute Factory” strategy outperformed the market with increased revenue share and margins
• Celcom maintained momentum with improved margins
Developments• Expanded presence into the high growth market of India • Aggressive capex expansion in Indonesia to further capture
growth• Building a strong TMI foundation for improved execution and
focus

-3-COMPANY CONFIDENTIAL
Highlights in Key Markets
Sri Lanka
Bangladesh
INDUSTRYKEY MARKETS COMPANY
Indonesia
Malaysia• Increased competition in certain
segments; new entrant• Increasing emphasis for subscriber
retention and acquisition in anticipation of MNP
• Continued momentum with improved EBITDA margin
• 9 consecutive qtrs. of positive revenue growth• Greater push for mobile broadband and
“underperformed” segments
• Low Price and high MoU market environment. Competitive landscape move from coverage to affordability
• Potential revision of interconnect scheme
• Revenue growth of industry growth with margin improvements of 3%.
• 2Q 08 results above market average with total outgoing MoU minutes rose more than 10 times YoY, despite Voice Revenue per Minute dropped 86% (2Q 08 vs 2Q 07)
• Increased price pressure from competitors and expected new players by year end
• Country inflation rate surpassed 28%
• Continued growth in mobile subscribers 31% Y o Y and achievement of 100,000+ CDMA and Pay TV subscribers
• High inflationary environment impacting margins
• Intense price competition and high inflation rate.
• Increasingly stringent regulatory landscape.
• New business/expansion incl. additional spectrum and 3G licensing
• Encouraging results from promotions despite industry issues.
• Improved visibility and presence in market from increased marketing and promotional activities
• Strengthened management with New CEO and CCO

-4-COMPANY CONFIDENTIAL
Group Financial PerformanceContinued top line growth from all key markets
Revenue (RM mn)
+23% +21%
• 1H 08 revenue growth of 21% largely from XL, Celcom and Dialog
• Growth was driven by higher subscriber additions and usage
+8%
2,373 2,554 2,750 2,722 2,930
4,6865,652
2Q07 3Q07 4Q07 1Q08 2Q08 YTD 07 YTD 08
Translation loss ( using average exchange rate 2Q 07 and YTD June 07 )
2Q 08 – RM 107 mn , 1Q 08 - RM 112 mn, YTD June 08 – RM 238mn
Revenue growth
Q on Q : 7%
Y on Y : 28%
1H 08 vs 1H 07 : 26%

-5-COMPANY CONFIDENTIAL
Group Financial PerformanceGrowth in EBITDA though margins contracted due to competition and externalities
EBITDA (RM mn) & Margins (%)
1,023 960 1,116 1,118 1,216
2,0472,333
2Q07 3Q07 4Q07 1Q08 2Q08 YT D 07
YT D 08
43.7%
+19% +14%
41.3%43.1% 37.6%
+9%
40.6% 41.1% 41.5%
• EBITDA increased by 14% with higher revenue contribution from operations.
• Escalation of cost from inflationary and competitive pressure in Sri Lanka and Bangladesh compressed the EBITDA margin for 1H 08
Translation loss ( using average exchange rate 2Q 07 and YTD June 07 )
2Q 08 – RM 45 mn , 1Q 08 - RM 45 mn, YTD June 08 – RM 97 mn
Revenue growth
Q on Q : 8%
Y on Y : 23%
1H 08 vs 1H 07 : 19%

-6-COMPANY CONFIDENTIAL
Group Financial Performance
PATAMI (RM mn) - Actual
• Higher consolidated finance cost from recognition of impact of TM Loan post demergerand greater interest expense in Bangladesh in 1H 08
• Forex loss of RM 11.5 mn in 2Q 08 and RM1.7 mnin 2Q 07. Forex gain of RM42 mn in 1Q 08
• 1H 08 vs 1H 07 : Forex gain of RM31 mn vs Forexloss of RM3 mn
• On a normalised basis PATAMI improved 13% in 1H 08
Normalisation (not including forex gain /loss):
2Q 07 and YTD June 07 – Gain on disposal of 3.82% of Dialog Shares (RM194m) and Gain on dilution of shares in Spice (RM18m)
4Q 07 – Gain on Sale of Towers in Spice (RM129m)
2Q 08 and YTD June 2007 – Finance cost of amount owing to TM post demerger for (RM44m)
Normalised profits improved as compared to 1H 07
-37% -18%
-9%
588
293
516402 367
934769
2Q07 3Q07 4Q07 1Q08 2Q08 YTD 07 YTD 08
376293
387 402 411
721813
2Q07 3Q07 4Q07 1Q08 2Q08 YTD 07 YTD 08
PATAMI (RM mn) - Normalised
+9% +13%
+2%
Translation loss ( using average exchange rate 2Q 07 and YTD June 07 )
2Q 08 – RM 3 mn , 1Q 08 - RM 8 mn, YTD June 08 – RM 13 mn
Revenue growth
Q on Q : 1%
Y on Y : 10%
1H 08 vs 1H 07 : 15%
-7-COMPANY CONFIDENTIAL
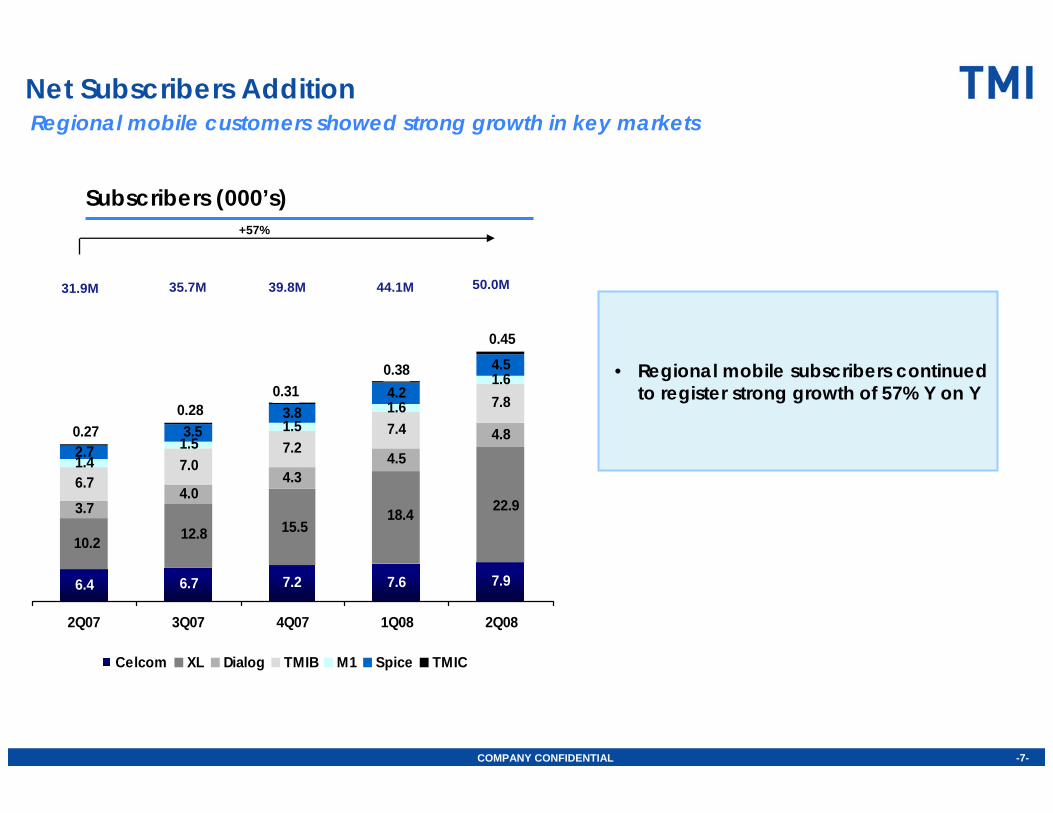
Net Subscribers AdditionRegional mobile customers showed strong growth in key markets
Subscribers (000’s)
• Regional mobile subscribers continued to register strong growth of 57% Y on Y
6.4 6.7 7.2 7.6 7.9
3.74.0
4.34.5
4.8
6.77.0
7.27.4
7.8
1.41.5
1.51.6
1.6
2.7
3.84.2
4.5
22.918.415.512.810.2
3.5
0.45
0.380.31
0.280.27
2Q07 3Q07 4Q07 1Q08 2Q08
Celcom XL Dialog TMIB M1 Spice TMIC
+57%
31.9M 35.7M 39.8M 44.1M 50.0M

-8-COMPANY CONFIDENTIAL
Group Revenue and EBITDA Composition
YTD June 08 EBITDA Breakdown (%)YTD June 08 Revenue Breakdown (%)
Celcom, XL contributed to 82% Group’s Revenue and 87% Group’s EBITDA margin
Celcom47%
XL35%
Others0.2%
Dialog10%
TMIC2%TMIB
6%
Celcom50%
XL37%
Dialog7%
TMIC1%
TMIB5%
EBITDA exclusive of Others (-ve RM22 million)

-9-COMPANY CONFIDENTIAL
2,972
YTD June 08
39%2,141RM’Million
YoYYTD June 07Capex
XL63%
Celcom12%
Multinet2%
Dialog18%
TMIC2%TMIB
3%
^ Annualised EBITDA
YTD June 07 (%) YTD June 08 (%)
XL52%
Celcom14%
Multinet3%
Dialog12%
TMIC0.5%
TMIB19%
Group Capex and Financial LeverageIncreased Capex from XL to capture market growth
94.1%87.9%Gross debt / equity (%)
3.26
2.47^
12,254
8,923
2,603
YTD June 08YTD Dec 07RM’ Million
2.23Gross debt / EBITDA (x)
2.90Net assets per share (sen)
1,928Cash & Bank
10,380Net Assets
7,191Net Debt

-10-COMPANY CONFIDENTIAL
TMI Group Performance Overview
Malaysia – Celcom
Indonesia – Excelcomindo
Sri Lanka – Dialog
Bangladesh – TMIB
Other Regional mobile assets
Moving Forward
Agenda

-11-COMPANY CONFIDENTIAL
256 262 300 310 321
489
631
2Q 07 3Q 07 4Q 07 1Q 08 2Q 08 YTD 07 YTD 08
1,331 1,346 1,374
2,4722,719
1,2901,255
2Q 07 3Q 07 4Q 07 1Q 08 2Q 08 YTD 07 YTD 08
+ 10%+ 2%
+ 10%
Revenue* (RM mn)
563 585 610 614 622
1,1051,237
2Q 07 3Q 07 4Q 07 1Q 08 2Q 08 YTD 07 YTD 08
+ 10%
+ 1% + 12%
EBITDA (RM mn) & Margins (%)
45%44%
45%45%45%44%
+ 25%
+ 4% + 29%
PATAMI (RM mn)
Maintaining growth momentum despite a highly competitive environment
Recovery of postpaid has led to continuous revenue growth
Margins sustainable with continuous drive for cost control
Celcom : Financial Performance
45%
*Fibercomm excluded due to demerger (for comparison purpose)

-12-COMPANY CONFIDENTIAL
19%303.6362.8Capex
net cashnet cashNet debt / EBITDA*(x)
net cashnet cashNet debt / equity (%)
25%1,468.71,830.8Cash & Cash Equivalents
15%3,100.93,559.7Net Assets
48%1,235.9net cashNet Debt
Y on YYTD June 07YTD June 08
% of Revenue 2Q 07 1Q 08 2Q 08 YTD June 07 YTD June 08Direct Expenses 22.0% 21.8% 21.7% 22.4% 21.8%Sales & Marketing 9.4% 9.9% 10.7% 9.1% 10.3%Network Costs 13.3% 13.2% 10.7% 13.4% 11.9%Staff Costs 5.6% 5.8% 7.0% 5.4% 6.4%Bad Debts 0.8% 0.6% 0.6% 1.0% 0.6%Others 4.5% 3.6% 3.9% 4.6% 3.8%Total Expenses 55.7% 54.9% 54.7% 55.8% 54.8%
EBITDA Margin 44.3% 45.1% 45.3% 44.2% 45.2%100.0% 100.0% 100.0% 100.0% 100.0%
D & A 16.6% 13.8% 14.5% 16.9% 14.1%
Operating Expenses
Financial Position (RM mn)
Celcom : Financial Performance
*Annualised EBITDA
# Lower network costs due to reversal of provision on site rental after finalisation of rates with TM. Normalisedrate is 12.5% for 2Q08 and 12.9% for 1H08
* Staff costs included cumulative ESOS cost (since Jan) which was provided in 2Q. Normalised staff cost is 5.4% for 2Q08 and 5.6% for YTD08
* *##

-13-COMPANY CONFIDENTIAL
117 120113 111 106
115108
53 48474953 53 52
2Q07 3Q07 4Q07 1Q08 2Q08 YTD 07 YTD 08Postpaid Prepaid
1,144 1,211 1,282 1,372 1,465
5,260 5,518 5,920 6,199 6,429
2Q 07 3Q 07 4Q 07 1Q 08 2Q 08Postpaid Prepaid
6 404 7 202
+23%
Subscribers(000’s)
+4%
ARPU(RM)
403 397 378399 415 396 404
139 151149152140 156 160
2Q 07 3Q 07 4Q 07 1Q 08 2Q 08 YTD 07 YTD 08Postpaid Prepaid
MOUs (min)
Continuously gaining market share in a competitive market environment
Increasing postpaid usage though lower ARPU from promotional packages. Prepaid segment
however remain fairly stable
Celcom : Operational PerformanceNet Add
7,8946,404 7,2026,728 7,571
163 324 474 369 322
+229k
+93k
+257k +402k
+67k
+279k
+90k+72k
Total Subs

-14-COMPANY CONFIDENTIAL
TMI Group Performance Overview
Malaysia – Celcom
Indonesia – Excelcomindo
Sri Lanka – Dialog
Bangladesh – TMIB
Other Regional mobile assets
Moving Forward
Agenda
-15-COMPANY CONFIDENTIAL
(135)
155
55
368
264
41
631
332156
114
123
215
244
459
2Q07 3Q07 4Q07 1Q08 2Q08 1H07* 1H08*
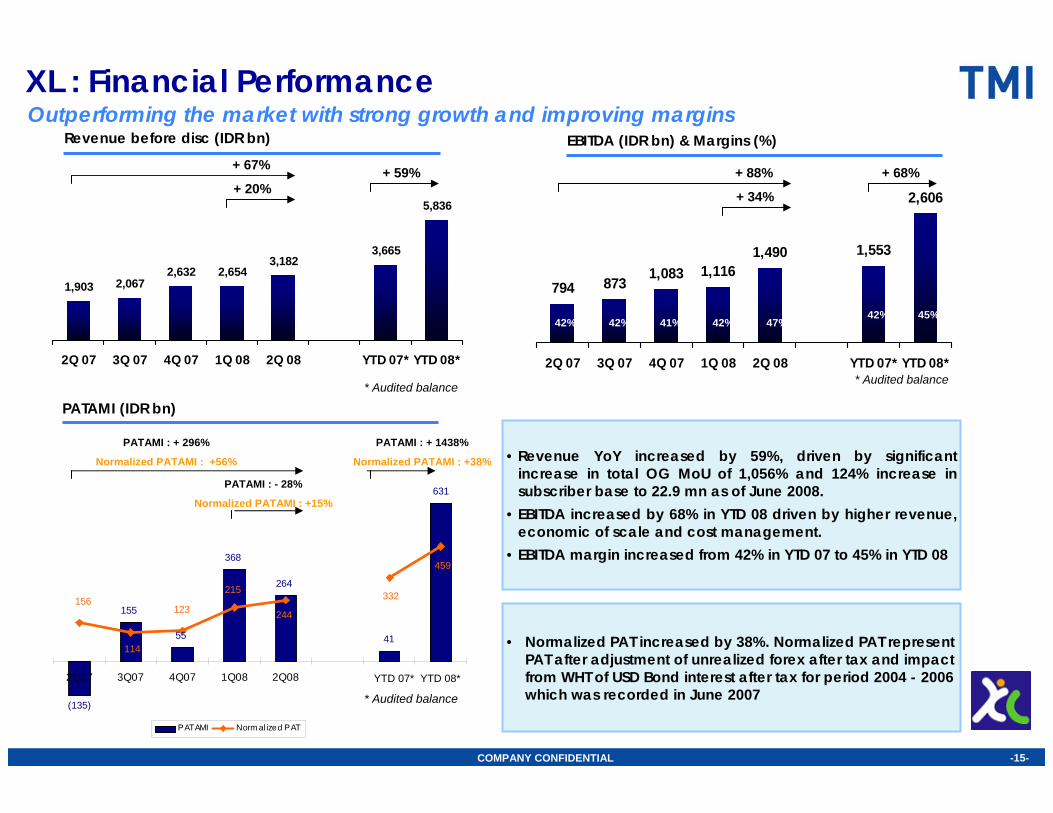
XL : Financial PerformanceRevenue before disc (IDR bn) EBITDA (IDR bn) & Margins (%)
PATAMI (IDR bn)
Outperforming the market with strong growth and improving margins
• Revenue YoY increased by 59%, driven by significant increase in total OG MoU of 1,056% and 124% increase in subscriber base to 22.9 mn as of June 2008.
• EBITDA increased by 68% in YTD 08 driven by higher revenue, economic of scale and cost management.
• EBITDA margin increased from 42% in YTD 07 to 45% in YTD 08
• Normalized PAT increased by 38%. Normalized PAT represent PAT after adjustment of unrealized forex after tax and impact from WHT of USD Bond interest after tax for period 2004 - 2006 which was recorded in June 2007
1,903 2,0672,632 2,654
3,1823,665
5,836
2Q 07 3Q 07 4Q 07 1Q 08 2Q 08 YTD 07* YTD 08*
+ 67%
+ 20%+ 59%
794 8731,083 1,116
1,490 1,553
2,606
2Q 07 3Q 07 4Q 07 1Q 08 2Q 08 YTD 07* YTD 08*
+ 88%
+ 34%
+ 68%
45%42%47%42%41%42%42%
PATAMI : + 296%
Normalized PATAMI : +56%
PATAMI : + 1438%
Normalized PATAMI : +38%
PATAMI : - 28%
Normalized PATAMI : +15%
* Audited balance* Audited balance
* Audited balance
PATAMI Norm al ized PAT
YTD 07* YTD 08*

-16-COMPANY CONFIDENTIAL
XL : Financial PerformanceOperating Expenses
Financial Position (IDR bn)
% of Revenue 2Q 07 1Q 08 2Q 08 YTD June 07 YTD June 08Direct Expenses 14.7% 17.6% 15.8% 14.3% 16.6%Sales & Marketing 10.5% 11.3% 11.2% 10.0% 11.2%Network Costs 11.8% 14.2% 13.3% 13.2% 13.7%Staff Costs 5.2% 5.4% 4.3% 5.3% 4.8%Bad Debts 0.9% 0.7% 0.5% 0.9% 0.6%Others 11.6% 1.5% 11.1% 9.3% 6.7%Total Expenses 54.7% 50.5% 56.3% 53.0% 53.7%
EBITDA Margin 41.7% 42.0% 46.8% 42.4% 44.7%
D & A 21.9% 20.6% 23.7% 22.3% 22.3%
61%5,2843,283Capex
2.62.3Net debt / EBITDA* (x)
236.5156.9Net debt / equity (%)
-68%3821,186Cash & Cash Equivalents
16%4,9544,255Net Assets
75%11,7186,678Net Debt
Y on YYTD June 08YTD June 07
*Annualised EBITDA

-17-COMPANY CONFIDENTIAL
2746
83110
216
28
169
2Q07 3Q07 4Q07 1Q08 2Q08 YTD 07 YTD 08Blended
475487481442457
9,74312,369
22,423
17,911
14,988
2Q07 3Q07 4Q07 1Q08 2Q08
Postpaid Prepaid
10,200
18,398
12,81015,469
22,899
+124%
XL: Operational PerformanceSubscribers(000’s)
+24%
ARPU(IDR 000s)
OG MoU/subs/month ( min)
• 1H08 postpaid, prepaid ARPU were Rp. 38 thousand, Rp. 157 thousand respectively, were comparable to 1Q08 i.e. Rp. 39 thousand, Rp. 159 thousand.
• Significant increase in outgoing MoU/subs/month by 508% and subscribers base by 124% YoY was driven by strategy which offers best value through a combination of comparable quality and affordable pricing.
150 152163 159 154 151 157
41 38383944 42 45
2Q07 3Q07 4Q07 1Q08 2Q08 YTD 07* YTD 08*
Postpaid Prepaid * Audited balance

-18-COMPANY CONFIDENTIAL
TMI Group Performance Overview
Malaysia – Celcom
Indonesia – Excelcomindo
Sri Lanka – Dialog
Bangladesh – TMIB
Other Regional mobile assets
Moving Forward
Agenda

-19-COMPANY CONFIDENTIAL
2,442 2,4351,663
1,105538
4,868
1,643
2Q07 3Q07 4Q07 1Q08 2Q08 YTD07 YTD08
Dialog Group : Financial Performance
8,225 8,991 9,048 8,977 9,292
16,13718,269
2Q07 3Q07 4Q07 1Q08 2Q08 YTD07 YTD08
+13%
+4% +13%
Revenue (SLR mn)
3,682 3,6262,878 2,736 2,598
7,237
5,334
2Q07 3Q07 4Q07 1Q08 2Q08 YTD07 YTD08
- 29%
- 5% - 26%
EBITDA (SLR mn) & Margins (%)
29%45%28%30%32%
40%45%
- 78%
-51% - 66%
PATAMI (SLR mn) • Revenue increased by 13% compared to 2Q 07 mainly attributable to increased call revenues from the robust growth in mobile subscriber base by 31% in 1H 08 vis a vis 1H 07.
• Revenue growth was mitigated mainly due to tariff reductions and other affordability enhancement strategies adopted by the company during 4Q 07 on the backdrop of suppressed price-usage elasticity levels arising from inflation related pressures on consumer spending power.
• The period under review is characterised by cost expansion driven in the main by general inflation (28%), energy derived costs, and expansion of the company’s network infrastructure.
Revenue growth affected due to competition and externalities

-20-COMPANY CONFIDENTIAL
Dialog : Financial Performance
% of Revenue 2Q 07 1Q 08 2Q 08 YTD 07 YTD 08Direct Expenses 6.4% 6.1% 6.6% 6.7% 6.3%Sales & Marketing 11.4% 17.7% 15.9% 11.9% 16.8%Network Costs 20.7% 28.5% 29.3% 20.8% 29.2%Staff Costs 7.8% 10.0% 10.9% 7.7% 10.5%Bad Debts 3.2% -1.5% 2.0% 2.8% 0.2%Others 3.7% 8.2% 6.4% 3.8% 7.1%Total Expenses 53.2% 68.9% 71.2% 53.7% 70.1%
EBITDA Margin 46.8% 31.1% 28.8% 46.3% 29.9%100.0% 100.0% 100.0% 100.0% 100.0%
D & A 11.9% 16.9% 18.3% 11.6% 17.6%
Operating Expenses
Financial Position (SLR mn)
*Capex includes CWIP additions + direct additions
YTD June 08 YTD June 07 Y o Y
Capex* 12,233 8,139 50%
Cash & Cash Equivalents 2,807 12,858
Net Debt 18,844 618
Net Assets 46,802 41,165 14%
Net debt / equity (%) 40% 2%
Net debt / EBITDA (x) 1.72 0.04

-21-COMPANY CONFIDENTIAL
590579569522519
4,2163,9683,6903,4413,137
2Q07 3Q07 4Q07 1Q08 2Q08
Series1 Series2
4,8063,657 3,963 4,260 4,547
+31%
Dialog: Operational PerformanceSubscribers(000’s)
+6%
1730 17671570
1463 15001709
1481
414 350340359405 427 395
2Q07 3Q07 4Q07 1Q08 Q2 08 YTD07 YTD08
Postpaid Prepaid
ARPU(SLR)
628 641 647690
745
604
718
125 149154145130 134 135
2Q07 3Q07 4Q07 1Q08 2Q08 YTD07 YTD08
Postpaid Prepaid
MOUs (min)
• Downward revision in tariffs in December 2007. Increase in MOU in response to price change has been inadequate to deliver a recovery of revenue growth resulting in lower ARPUs
• De-escalation of the Minimum Cost of Ownership (MCO) has resulted in higher penetration at the bottom of the pyramid resulting in lower ARPUs.
• Recorded 31% Mobile Subscriber Growth (4.81 Mn. Subscribers)

-22-COMPANY CONFIDENTIAL
TMI Group Performance Overview
Malaysia – Celcom
Indonesia – Excelcomindo
Sri Lanka – Dialog
Bangladesh – TMIB
Other Regional mobile assets
Moving Forward
Agenda

-23-COMPANY CONFIDENTIAL
178
-1,625
1,073
-192-214
22
-682Q 07 3Q 07 4Q 07 1Q 08 2Q 08 YTD 07 YTD 08
TMIB : Financial Performance
3,525 3,557 3,518 3,609 3,629
7,315 7,238
2Q 07 3Q 07 4Q 07 1Q 08 2Q 08 YTD 07 YTD 08
+ 3%
+ 1%- 1%
Revenue (BDT mn)
1,140 1,0851,396
1,063
2,797 2,459
-3432Q 07 3Q 07 4Q 07 1Q 08 2Q 08 YTD 07 YTD 08
- 7%
- 24% - 12%
EBITDA (BDT mn) & Margins (%)
34%38%39%
31%32%
- 220%
- 1073% - 118%
PATAMI (BDT mn)
Tough competition and macroeconomic factors
• Revenue adversely affected from 2Q07, due to reduction in tariffs with intense competition
• Higher costs from increased SAC and A&P costs with increased subscriber acquisition. Further impact on cost items from inflationary pressure
• PATAMI is further adversely affected due to high borrowing costs from high interest bearing short term loans
-175
Adjusting for Govt Compensation
1,107
31% 29%

-24-COMPANY CONFIDENTIAL
TMIB : Financial Performance
% of Revenue 2Q 07 1Q 08 2Q 08 YTD Jun 07 YTD Jun 08Direct Expenses 40.9% 39.5% 44.7% 36.4% 42.1%Sales & Marketing 5.5% 2.0% 4.0% 6.3% 3.0%Network Costs 7.5% 9.1% 10.6% 6.8% 9.9%Staff Costs 6.4% 6.2% 6.2% 6.3% 6.2%Bad Debts 0.6% 0.2% 0.1% 0.5% 0.2%Others 6.8% 4.3% 5.0% 5.4% 4.6%Total Expenses 67.7% 61.3% 70.7% 61.8% 66.0%
EBITDA Margin 32.3% 38.7% 29.3% 38.2% 34.0%100.0% 100.0% 100.0% 100.0% 100.0%
D & A 20.8% 24.4% 25.3% 19.1% 24.9%
Operating Expenses
Financial Position (BDT mn)
YTD June 08 YTD June 07 Y on Y
Capex 1,951 4,489 - 43%
Cash & Cash Equivalents 223 67 + 231%
Net Debt 17,840 16,022 + 10 %
Net Assets (Equity) 10,268 13,738 - 23 %
Net debt / equity (%) 1.70 1.17
Net debt / EBITDA* (x) 3.63 2.86*Annualised EBITDA
-25-COMPANY CONFIDENTIAL
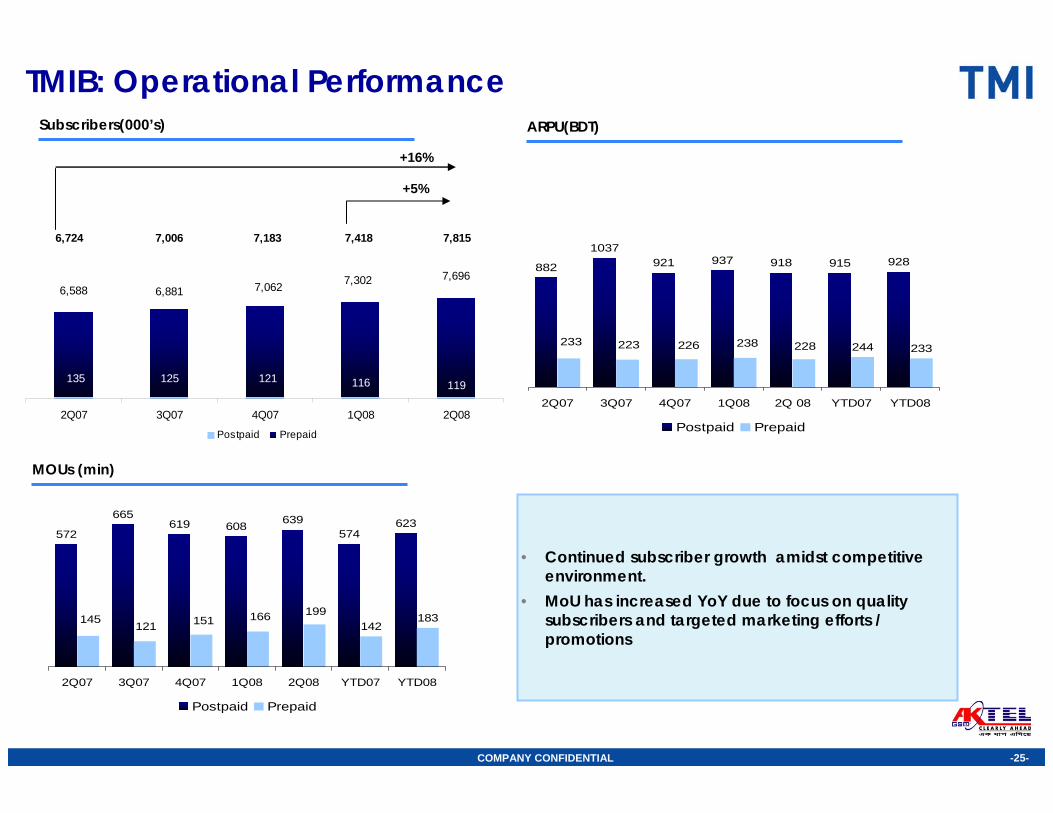
135 125 121 116 119
6,588 6,881 7,062 7,302 7,696
2Q07 3Q07 4Q07 1Q08 2Q08
Postpaid Prepaid
7,8156,724 7,006 7,183 7,418
+16%
TMIB: Operational PerformanceSubscribers(000’s)
+5%
882
1037921 937 918 915 928
244 233228238233 223 226
2Q07 3Q07 4Q07 1Q08 2Q 08 YTD07 YTD08
Postpaid Prepaid
ARPU(BDT)
572
665619 608 639
574623
142183199166145
121 151
2Q07 3Q07 4Q07 1Q08 2Q08 YTD07 YTD08
Postpaid Prepaid
MOUs (min)
• Continued subscriber growth amidst competitive environment.
• MoU has increased YoY due to focus on quality subscribers and targeted marketing efforts / promotions

-26-COMPANY CONFIDENTIAL
TMI Group Performance Overview
Malaysia – Celcom
Indonesia – Excelcomindo
Sri Lanka – Dialog
Bangladesh – TMIB
Other Regional mobile assets
Moving Forward
Agenda
-27-COMPANY CONFIDENTIAL
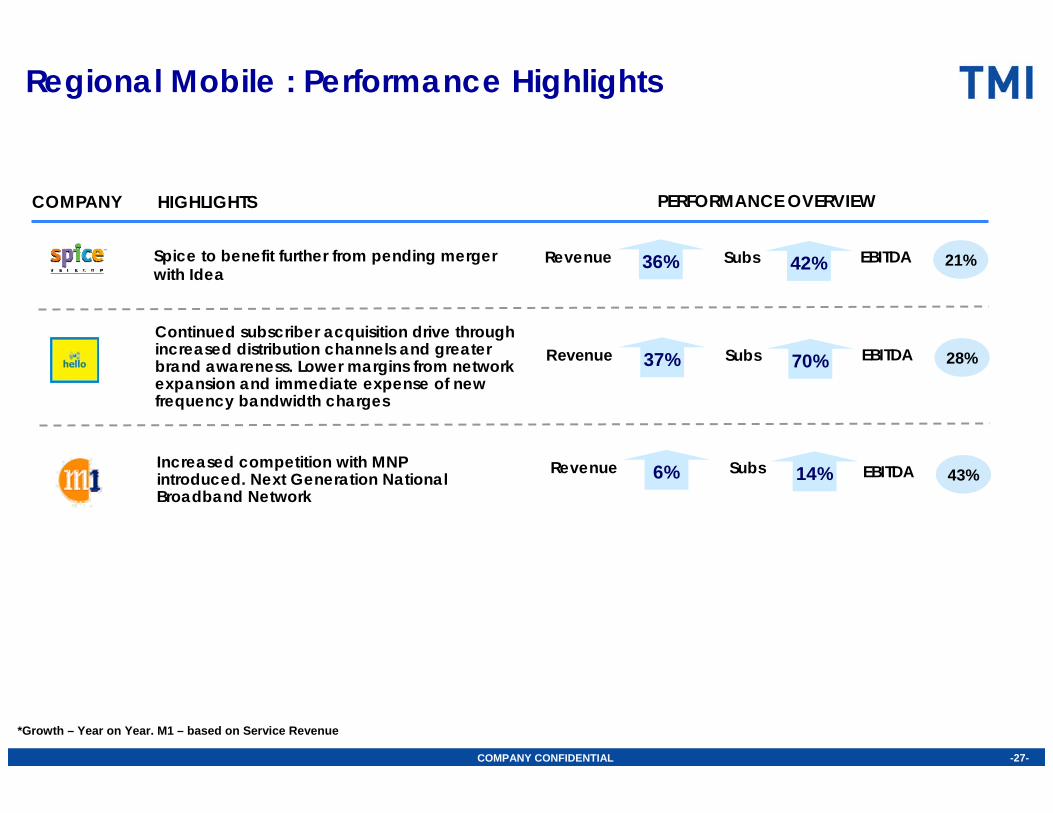
HIGHLIGHTSCOMPANY
36% 42% Spice to benefit further from pending merger with Idea
Revenue Subs
Regional Mobile : Performance Highlights
*Growth – Year on Year. M1 – based on Service Revenue
Increased competition with MNP introduced. Next Generation National Broadband Network
6% 14% Revenue Subs
EBITDA 21%
PERFORMANCE OVERVIEW
EBITDA 43%
37% 70% Continued subscriber acquisition drive through increased distribution channels and greater brand awareness. Lower margins from network expansion and immediate expense of new frequency bandwidth charges
Revenue Subs EBITDA 28%

-28-COMPANY CONFIDENTIAL
TMI Group Performance Overview
Malaysia – Celcom
Indonesia – Excelcomindo
Sri Lanka – Dialog
Bangladesh – TMIB
Other Regional mobile assets
Moving Forward
Agenda

-29-COMPANY CONFIDENTIAL
Moving Forward
• Twin engines of growth- Unlocking Opcos value and portfolio synergies- Selective M & As
• Institution Building through people and process improvements
TMI
Accelerating momentum and execution amidst competition and externalities. Focus on strengthening operations
• Gearing up for MNP implementation with strategic and operationalpreparations
• Segment focus through improved product, services and reach• Continued improvements in IT / billing to enhance go to market strategy
• Revenue mitigation through affordability enhancement strategy and cost management initiatives
• Measured approach in quad-play strategy for diversified revenue streams
• Effective cost management in amidst competitive and external pressures• Improving distribution channels and brand positioning• Finalisation of Shareholder Agreement with NTT Docomo
• Continue momentum to grow revenue profitably with operational efficiency and capital productivity in order to create value and return
• Leverage value from passive infrastructure while focusing on core operating business

-30-COMPANY CONFIDENTIAL
FY 2008 Guidance
RM4.6 billion
14%
42%
16%
FY 08 GuidanceHeadline KPIs
on track ROE (%)
~RM6.5 billionCapex*
on trackRevenue growth
on trackEBITDA Margin (%)
* Capex is not a Headline KPI
Headline KPIs not including impact recent India acquisition. Lower guidance on ROE due to expectations of increase in borrowing costs for India acquisition. Revised
Capex reflects increased guidance of XL’s capex

-31-COMPANY CONFIDENTIAL
Disclaimer
No representation or warranty, express or implied, is made as to the fairness, accuracy, completeness or correctness of the information, opinions and conclusions contained in this presentation. TM International Berhad (the “Company”), it subsidiaries, affiliates and related bodies corporate (the “TMI Group”), and their respective officers, directors, employees and agents disclaim any liability (including, without limitation, any liability arising from fault or negligence and consequential damages) for any loss arising from any use of this presentation or its contents or otherwise arising in connection with it.
This presentation contains projections and “forward-looking statements” relating to the Company’s businesses and the sectors in which the Company operates. These forward-looking statements include statements relating to the TMI Group’s performance. These statements reflect the current views of the Company with respect to future events and are subject to certain risks, uncertainties and assumptions. It is important to note that actual results could differ materially from those anticipated in these forward looking statements. The Company does not undertake to inform you of any matters or information which may come to light or be brought to the Company’s attention after the date hereof.
The forecasts and other forward-looking statements set out in this presentation are based on a number of estimates and assumptions that are subject to business, economic and competitive uncertainties and contingencies, with respect to future business decisions, which are subject to change, known and unknown risks and in many cases outside the control of the Company or the TMI Group. The directors and officers of the Company believe that they have prepared the forecasts with due care and attention and consider all best estimates and assumptions when taken as a whole to be reasonable at the time of preparing the presentation. However, the Company’s forecasts presented in this presentation may vary from actual financial results, and these variations may be material and, accordingly, neither the Company, any member of the TMI Group nor its directors or officers can give any assurance that the forecast performance in the forecasts or any forward-looking statement contained in this presentation will be achieved. Details of the forecasts and the assumptions on which they are based are set out in the presentation.
-32-COMPANY CONFIDENTIAL
THANK YOUwww.tmigroup.com