2020 texas st-elevation myocardial infarction (stemi) …
TRANSCRIPT

2020 TEXAS ST-ELEVATION
MYOCARDIAL INFARCTION
(STEMI) AND HEART ATTACK
SYSTEM OF CARE REPORT

1
Acknowledgement
A number of people played key roles in coordinating meetings, facilitating planning,
writing, reviewing, and editing this report.
From the Department of State Health Services:
Melissa Freeland, MPH
Epidemiologist II
Chronic Disease Epidemiology Branch
Karen Nunley, PhD
Epidemiologist III / Epi Team Lead
Chronic Disease Epidemiology Branch
Yassiel Caballero
Program Coordinator, Heart Attack and Stroke Data Collection Initiative
Chronic Disease Branch
Maria Cooper, PhD
Manager
Chronic Disease Epidemiology Branch
Nimisha Bhakta, MPH Director
Health Promotion & Chronic Disease Prevention Section
Kelly Fegan-Bohm, MD, MPH
Medical Director
Community Health Improvement Division
We are grateful to the members of the Texas Council on Cardiovascular Disease and
Stroke and the members of the Texas Heart Attack and Stroke Data Collaborative who
contributed their time and expertise. We are also thankful to the hospitals that
participated in the data collection initiative.
2
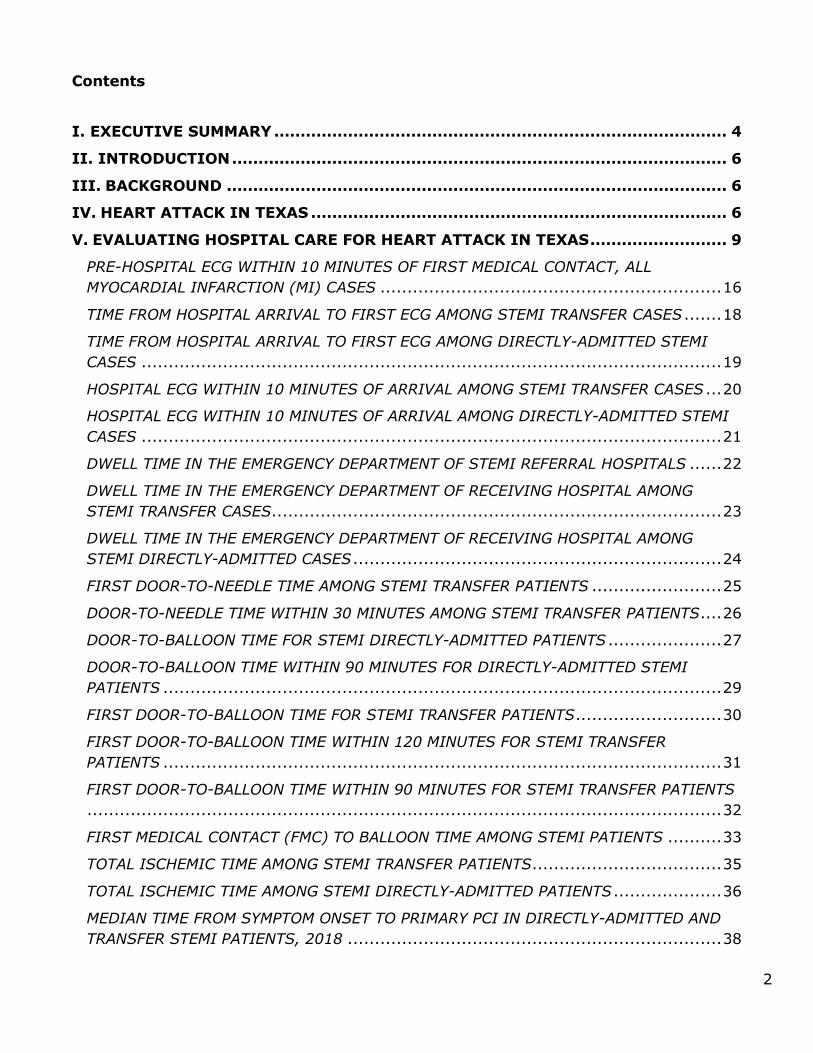
Contents
I. EXECUTIVE SUMMARY ...................................................................................... 4
II. INTRODUCTION .............................................................................................. 6
III. BACKGROUND ............................................................................................... 6
IV. HEART ATTACK IN TEXAS ............................................................................... 6
V. EVALUATING HOSPITAL CARE FOR HEART ATTACK IN TEXAS .......................... 9
PRE-HOSPITAL ECG WITHIN 10 MINUTES OF FIRST MEDICAL CONTACT, ALL
MYOCARDIAL INFARCTION (MI) CASES ............................................................... 16
TIME FROM HOSPITAL ARRIVAL TO FIRST ECG AMONG STEMI TRANSFER CASES ....... 18
TIME FROM HOSPITAL ARRIVAL TO FIRST ECG AMONG DIRECTLY-ADMITTED STEMI
CASES ........................................................................................................... 19
HOSPITAL ECG WITHIN 10 MINUTES OF ARRIVAL AMONG STEMI TRANSFER CASES ... 20
HOSPITAL ECG WITHIN 10 MINUTES OF ARRIVAL AMONG DIRECTLY-ADMITTED STEMI
CASES ........................................................................................................... 21
DWELL TIME IN THE EMERGENCY DEPARTMENT OF STEMI REFERRAL HOSPITALS ...... 22
DWELL TIME IN THE EMERGENCY DEPARTMENT OF RECEIVING HOSPITAL AMONG
STEMI TRANSFER CASES ................................................................................... 23
DWELL TIME IN THE EMERGENCY DEPARTMENT OF RECEIVING HOSPITAL AMONG
STEMI DIRECTLY-ADMITTED CASES .................................................................... 24
FIRST DOOR-TO-NEEDLE TIME AMONG STEMI TRANSFER PATIENTS ........................ 25
DOOR-TO-NEEDLE TIME WITHIN 30 MINUTES AMONG STEMI TRANSFER PATIENTS .... 26
DOOR-TO-BALLOON TIME FOR STEMI DIRECTLY-ADMITTED PATIENTS ..................... 27
DOOR-TO-BALLOON TIME WITHIN 90 MINUTES FOR DIRECTLY-ADMITTED STEMI
PATIENTS ....................................................................................................... 29
FIRST DOOR-TO-BALLOON TIME FOR STEMI TRANSFER PATIENTS ........................... 30
FIRST DOOR-TO-BALLOON TIME WITHIN 120 MINUTES FOR STEMI TRANSFER
PATIENTS ....................................................................................................... 31
FIRST DOOR-TO-BALLOON TIME WITHIN 90 MINUTES FOR STEMI TRANSFER PATIENTS
..................................................................................................................... 32
FIRST MEDICAL CONTACT (FMC) TO BALLOON TIME AMONG STEMI PATIENTS .......... 33
TOTAL ISCHEMIC TIME AMONG STEMI TRANSFER PATIENTS ................................... 35
TOTAL ISCHEMIC TIME AMONG STEMI DIRECTLY-ADMITTED PATIENTS .................... 36
MEDIAN TIME FROM SYMPTOM ONSET TO PRIMARY PCI IN DIRECTLY-ADMITTED AND
TRANSFER STEMI PATIENTS, 2018 ..................................................................... 38

3
ACTIVATION OF CATHETERIZATION LAB PRIOR TO ARRIVAL AMONG STEMI TRANSFER
PATIENTS ....................................................................................................... 39
ACTIVATION OF CATHETERIZATION LAB PRIOR TO ARRIVAL AMONG DIRECTLY-
ADMITTED STEMI PATIENTS .............................................................................. 41
CARDIAC REHABILITATION REFERRAL AMONG STEMI PATIENTS ............................. 42
VI. COMORBIDITIES AMONG MI PATIENTS ........................................................ 43
SMOKING CESSATION ADVICE UPON DISCHARGE AMONG MI PATIENTS ................... 45
PRIOR DIABETES TREATMENT UPON ADMISSION AMONG MI PATIENTS .................... 46
EVALUATION OF TRIGLYCERIDE LEVELS AMONG MI PATIENTS ................................ 47
ASPIRIN ADMINISTERED WITHIN FIRST 24 HOURS OF EITHER FMC OR HOSPITAL
ARRIVAL ......................................................................................................... 48
PRESCRIBING ASPIRIN AT DISCHARGE ............................................................... 49
PRESCRIBING BETA-BLOCKERS AT DISCHARGE .................................................... 50
PRESCRIBING STATINS AT DISCHARGE FOR LOW DENSITY LIPOPROTEIN
CHOLESTEROL (LDLc) >= 100 MG/DL ................................................................. 51
ACE INHIBITORS OR ARB AT DISCHARGE (EJECTION FRACTION, EF, < 40%) ............ 52
TOTAL LIPID ASSESSMENT ................................................................................ 54
VII. UNADJUSTED IN-HOSPITAL MORTALITY RATES ......................................... 54
VIII. APPENDIX – DATA SOURCES AND DEFINITIONS ....................................... 56
References......................................................................................................... 67

4
I. EXECUTIVE SUMMARY
The prevalence of heart attack in Texas has remained steady over the last few years,
affecting about 4% of the adult resident population each year, from 2011 to 2018 (Table
1). In order to advance heart attack reduction efforts, it is important to analyze the system
of care, specifically for ST-Elevation Myocardial Infarction (STEMI), by collecting and
analyzing data. During the 83rd Regular Texas Legislative Session, funds were appropriated
to advance heart attack and stroke reduction efforts throughout Texas. To inform such
efforts, the Texas Department of State Health Services (DSHS) has launched a Heart Attack
and Stroke Data Collection Initiative.
Utilizing the time to treatment goals for primary percutaneous coronary intervention (PCI)
and standards of care, percentages and medians were calculated using data collected from
a group of hospitals that agreed to voluntarily participate in this data collection initiative.
The data were collected by the Chest Pain MI Registry (formerly the ACTION Registry), a
program of the American College of Cardiology in partnership with the American Heart
Association and other societies, from September 1, 2008 through December 31, 2019.
Currently, 134 PCI-capable hospitals are participating in the Chest Pain MI Registry in Texas.
In 2016-2019, when the highest number of hospitals were reporting for each measure, at
most 43 out of these 134 PCI-capable hospitals were included (32.1%).
Substantial findings from the 2008-2019 Chest Pain MI Registry data are as
follows:
• 43 hospitals, distributed across 30 cities in Texas, provided data on individual
episodes of care for heart attack. Most participating hospitals were located in urban
or suburban communities; only seven were located in rural communities (pgs. 13).
• 69,502 individual episodes of care for heart attack occurred among 68,736 patients
at participating hospitals (pg. 13).
• Of the 69,502 episodes of care for heart attack that occurred:
• 61.3% involved patients who either transported themselves or were
transported by family to the hospital where they were first evaluated (pg. 13);
• 37.7% arrived to the hospital by an ambulance (pg. 13);
▪ More females (40.9%) than males (36.1%) were transported via
ambulance (pg. 13);
▪ More males (65.8%) than females (59.3%) received an
electrocardiogram (ECG) prior to hospital arrival (pg. 13); and
▪ Fewer White or Hispanic cases arrived by ambulance as compared with
Black cases (36.5%, 33.3%, and 44.7%, respectively) (pg. 14);
• 29.0% involved care for STEMI (pg. 12).
• The median length of hospital stay each year between 2008 and 2019 was three
days. The mean length of hospital stay in 2019 was three days (pg. 13).
• Among patients who arrived by an ambulance between 2008 and 2019, only 63.0%
had a pre-hospital electrocardiogram (ECG) performed. In 2019, among those who
had pre-hospital ECG performed, 74.5% had their pre-hospital ECG performed within
10 minutes of first medical contact (pgs. 17-22)

5
• Between October 2008 and December 2019, the median time spent awaiting transfer
from the STEMI referral hospital to the STEMI receiving hospital for PCI was 49
minutes for those who arrived by personal vehicle and 41 minutes for those who
arrived by ambulance (pg. 23).
• Among directly-admitted STEMI cases, the annual median dwell time in the
Emergency Department (ED) was, on average, 10-15 minutes longer for those
arriving via personal vehicle than via ambulance (pg. 26).
• From 2011 to 2019, the median time from arrival at the referral hospital to primary
PCI among STEMI transfer cases transported via private vehicle has increased by four
minutes (99 minutes to 103 minutes). Among STEMI transfer cases transported via
ambulance, the median time increased by 49 minutes over the same time period,
from 70 minutes to 119 minutes (pgs. 28-32).
• In 2019, the median time from first medical contact to balloon was 82 minutes for
directly-admitted cases and 138 minutes for transfer cases (pg. 34-35).
• Total ischemic time among STEMI transfer cases was calculated for 2011-2019:
• Among those who arrived by ambulance at the first hospital, 17.3% had a total
ischemic time of less than 120 minutes, while among those who arrived at the
first hospital by personal vehicle, 11.6% had a total ischemic time of less than
120 minutes (pg. 36).
• Among directly-admitted cases arriving by ambulance in 2019, 37.1% had a
total ischemic time of less than 120 minutes, as compared with 21.9% who
arrived by personal vehicle (pg. 39).
• In 2019, among 209 STEMI transfer cases who arrived at the first hospital either by
a personal vehicle or by an ambulance, the catheterization lab was activated prior to
arrival for 74.2% of cases (pg. 40).
• In 2019, among 550 directly-admitted STEMI cases who arrived at the hospital by
ambulance, pre-catheterization lab activation occurred for 52.0% of cases (pg. 41-
42).
• Between 2008 and 2019, the percentage of comorbidities among Myocardial
Infarction (MI) cases was evaluated. Of the 69,502 MI cases having information on
comorbidities, 78.0% were hypertensive, 59.2% were dyslipidemic, 42.0% were
obese, 40.6% were diabetic, and 32.4% were current or recent smokers (pg. 45).
• Of 69,502 MI cases reported between 2008 and 2019, 95.0% were prescribed aspirin
within the first 24 hours of either first medical contact or hospital arrival, 3.0% were
not prescribed aspirin, and 2.0% had contraindications to aspirin use (pg. 50).
• Of 66,685 cases of MI alive upon discharge between 2008 and 2019, beta-blockers
were prescribed for 82.2% at discharge, not prescribed for 4.8%, contraindicated for
5.5%, and data were missing for 7.5% of cases (pg. 52).
• Between 2008 and 2019, the unadjusted in-hospital mortality rates in STEMI
patients ranged from as low as 5.2% in 2008 to as high as 7.4% in 2013; mortality
rates for STEMI patients are consistently double those of non-STEMI patients (pg.
55).

6
II. INTRODUCTION
When blood flow through the heart’s arteries is blocked, the heart is starved of oxygen and
heart cells die. This is called a myocardial infarction (MI) or heart attack. [1] A STEMI is a
serious type of heart attack that occurs when a heart’s artery is completely blocked and a
large part of the heart muscle is unable to receive blood. [1] This type of heart attack
requires immediate treatment to restore blood flow to the heart.
III. BACKGROUND
In order to advance heart attack reduction efforts, it is important to analyze the system of
care, specifically for STEMI, by collecting and analyzing data. During the 83rd Regular Texas
Legislative Session, funds were appropriated to advance heart attack and stroke reduction
efforts throughout Texas. To inform such efforts, the Texas Department of State Health
Services (DSHS) has launched a Heart Attack and Stroke Data Collection Initiative. Through
this initiative, hospitals are recruited to voluntarily share their data that focuses on pre-
hospital and hospital data elements. This report includes de-identified, aggregate data for
hospitals that have agreed to share Chest Pain MI Registry (formerly the ACTION Registry)
data with DSHS. All data are intended to inform stakeholders about opportunities for
collaboration and system enhancement. No hospital level data will be distributed, nor will
any hospital name be identified in the report.
The objectives of the data collection are to gain an understanding of the prevalence of heart
attack in Texas, to evaluate pre-hospital components of the systems of care, and assess
treatment of heart attack patients. The findings will be used to assess policies and practices
regarding delivery of care across the state and to identify areas of opportunity for quality
improvement.
IV. HEART ATTACK IN TEXAS
The prevalence of heart attack in Texas has remained steady over the last few years,
affecting about four in 100 adult residents each year from 2011 to 2018 (Table 1). In 2018,
the prevalence of heart attack was significantly higher among non-Hispanic Black (5.7%;
95% CI: 3.3-9.7) and White (5.4%; 95% CI 4.3-6.7) adults as compared to Hispanic adults
(1.9%; 95% CI: 1.4-2.8).
7
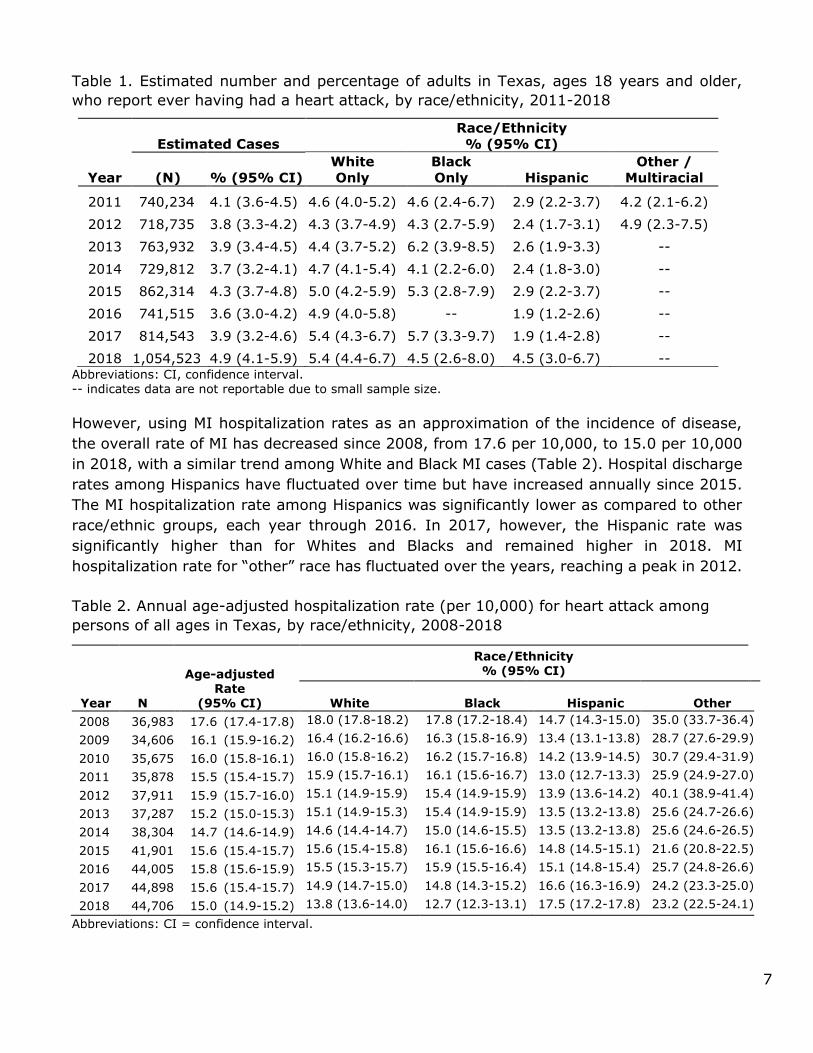
Table 1. Estimated number and percentage of adults in Texas, ages 18 years and older,
who report ever having had a heart attack, by race/ethnicity, 2011-2018
Estimated Cases
Race/Ethnicity
% (95% CI)
Year (N)
% (95% CI)
White
Only
Black
Only Hispanic
Other /
Multiracial
2011 740,234 4.1 (3.6-4.5) 4.6 (4.0-5.2) 4.6 (2.4-6.7) 2.9 (2.2-3.7) 4.2 (2.1-6.2)
2012 718,735 3.8 (3.3-4.2) 4.3 (3.7-4.9) 4.3 (2.7-5.9) 2.4 (1.7-3.1) 4.9 (2.3-7.5)
2013 763,932 3.9 (3.4-4.5) 4.4 (3.7-5.2) 6.2 (3.9-8.5) 2.6 (1.9-3.3) --
2014 729,812 3.7 (3.2-4.1) 4.7 (4.1-5.4) 4.1 (2.2-6.0) 2.4 (1.8-3.0) --
2015 862,314 4.3 (3.7-4.8) 5.0 (4.2-5.9) 5.3 (2.8-7.9) 2.9 (2.2-3.7) --
2016 741,515 3.6 (3.0-4.2) 4.9 (4.0-5.8) -- 1.9 (1.2-2.6) --
2017 814,543 3.9 (3.2-4.6) 5.4 (4.3-6.7) 5.7 (3.3-9.7) 1.9 (1.4-2.8) --
2018 1,054,523 4.9 (4.1-5.9) 5.4 (4.4-6.7) 4.5 (2.6-8.0) 4.5 (3.0-6.7) -- Abbreviations: CI, confidence interval. -- indicates data are not reportable due to small sample size.
However, using MI hospitalization rates as an approximation of the incidence of disease,
the overall rate of MI has decreased since 2008, from 17.6 per 10,000, to 15.0 per 10,000
in 2018, with a similar trend among White and Black MI cases (Table 2). Hospital discharge
rates among Hispanics have fluctuated over time but have increased annually since 2015.
The MI hospitalization rate among Hispanics was significantly lower as compared to other
race/ethnic groups, each year through 2016. In 2017, however, the Hispanic rate was
significantly higher than for Whites and Blacks and remained higher in 2018. MI
hospitalization rate for “other” race has fluctuated over the years, reaching a peak in 2012.
Table 2. Annual age-adjusted hospitalization rate (per 10,000) for heart attack among
persons of all ages in Texas, by race/ethnicity, 2008-2018
Abbreviations: CI = confidence interval.
Year N
Age-adjusted Rate
(95% CI)
Race/Ethnicity % (95% CI)
White Black Hispanic Other
2008 36,983 17.6 (17.4-17.8) 18.0 (17.8-18.2) 17.8 (17.2-18.4) 14.7 (14.3-15.0) 35.0 (33.7-36.4)
2009 34,606 16.1 (15.9-16.2) 16.4 (16.2-16.6) 16.3 (15.8-16.9) 13.4 (13.1-13.8) 28.7 (27.6-29.9)
2010 35,675 16.0 (15.8-16.1) 16.0 (15.8-16.2) 16.2 (15.7-16.8) 14.2 (13.9-14.5) 30.7 (29.4-31.9)
2011 35,878 15.5 (15.4-15.7) 15.9 (15.7-16.1) 16.1 (15.6-16.7) 13.0 (12.7-13.3) 25.9 (24.9-27.0)
2012 37,911 15.9 (15.7-16.0) 15.1 (14.9-15.9) 15.4 (14.9-15.9) 13.9 (13.6-14.2) 40.1 (38.9-41.4)
2013 37,287 15.2 (15.0-15.3) 15.1 (14.9-15.3) 15.4 (14.9-15.9) 13.5 (13.2-13.8) 25.6 (24.7-26.6)
2014 38,304 14.7 (14.6-14.9) 14.6 (14.4-14.7) 15.0 (14.6-15.5) 13.5 (13.2-13.8) 25.6 (24.6-26.5)
2015 41,901 15.6 (15.4-15.7) 15.6 (15.4-15.8) 16.1 (15.6-16.6) 14.8 (14.5-15.1) 21.6 (20.8-22.5)
2016 44,005 15.8 (15.6-15.9) 15.5 (15.3-15.7) 15.9 (15.5-16.4) 15.1 (14.8-15.4) 25.7 (24.8-26.6)
2017 44,898 15.6 (15.4-15.7) 14.9 (14.7-15.0) 14.8 (14.3-15.2) 16.6 (16.3-16.9) 24.2 (23.3-25.0)
2018 44,706 15.0 (14.9-15.2) 13.8 (13.6-14.0) 12.7 (12.3-13.1) 17.5 (17.2-17.8) 23.2 (22.5-24.1)

8
Figure 1. Age-adjusted average annual number of deaths due to heart attack, per 100,000 people of all ages, by county, Texas, 2011-2017
In 2017, the age-adjusted heart attack mortality rate in Texas was 36.5 per 100,000
(95% CI: 35.8-37.2). Mortality rates were significantly higher among Blacks (39.7; 95% CI: 37.3-42.1) and Whites (38.3; 95% CI: 37.4-39.3) compared with Texas overall, while rates for Hispanics (34.0; 95% CI: 32.6-35.4) and “Other” (21.4; 95% CI: 18.9-23.9)
were significantly lower than for Texas overall. Looking at the geographic distribution of age-adjusted MI death rates over time (2011-2017), the highest rates are dispersed
across the state, with a higher concentration in counties located in east and northeast Texas (Figure 1)

9
V. EVALUATING HOSPITAL CARE FOR HEART ATTACK IN TEXAS
Percutaneous coronary intervention, PCI, is the preferred reperfusion strategy for STEMI
patients. There are approximately 146 PCI-capable hospitals in Texas with a catheterization
lab ready to perform PCI, 24 hours a day, 7 days a week. [2] These are often called “STEMI
receiving hospitals.” Hospitals that do not have this capability are often referred to as
“STEMI referral hospitals”; STEMI patients who initially present at these hospitals must be
transferred to a PCI-capable, STEMI receiving hospital. STEMI patients who first present to
a STEMI receiving hospital are referred to as directly-admitted patients in this report, and
STEMI patients who first report to a STEMI referral hospital and are then transferred to a
STEMI receiving hospital are referred to as transfer patients. Figure 2 illustrates the time to
treatment goals for primary PCI for directly-admitted and for STEMI transfer patients. [3]
Figure 2. Time to treatment goals for primary PCI [3]
Utilizing the time to treatment goals for primary PCI and standards of care, percentages
and medians were calculated using data collected from a group of hospitals that volunteered
to participate in this data collection initiative. The data were collected by the Chest Pain MI
Registry from September 1, 2008 through December 31, 2019. Currently 134 PCI-capable
hospitals are participating in the Chest Pain MI Registry. At the most (2016-2019), 43 out

10
of these 134 PCI-capable hospitals (32.1%) provided information included in this report.
General findings from this report are as follows:
• 43 participating hospitals between years 2008 and 2019, distributed across 30 cities
in Texas, provided data on individual episodes of care for heart attack.
• The majority (n=36; 86.0%) of participating hospitals were located in urban or
suburban communities; only seven participating hospitals (16.3%) were located in
rural communities.
• 69,502 individual episodes of care for heart attack occurred among 68,736 patients
at participating hospitals.
• Of the 69,502 episodes of care for heart attack that occurred:
• 61.3% involved cases who either transported themselves or were transported
by family to the hospital where they were first evaluated;
• 29.0% (n=19,885) involved care for STEMI;
• 86.4% had health insurance;
• 96.0% were alive at discharge.
Table 3 shows the number of participating hospitals and the number of reported MI cases
from 2008 to 2019. The number of participating hospitals ranged from as few as 1 in 2008
to a high of 43 in 2016-2019. The number of reported heart attack cases has increased
from a low of 112 in 2008 to a high of 9,429 in 2019.
Table 3. Participating hospitals and number of reported myocardial infarction (MI) cases,
2008-2019
Year Participating Hospitals (N) Reported MI Cases (N)
2008 1 112
2009 6 807
2010 19 2887
2011 23 4482
2012 30 5656
2013 32 6231
2014 38 7033
2015 41 7609
2016 43 8525
2017 43 8271
2018 43 8460
2019 43 9429
Table 4 displays the distribution of reported MI cases by subtype (STEMI vs non-STEMI).
From 2008-2019, STEMI cases accounted for 29 in every 100 reported MI cases (29.0%).
Among MI cases, indicator of STEMI versus non-STEMI status was missing for 140 cases.

11
Table 4. Distribution of reported MI cases, by subtype, 2008-2019
Heart Attack Type N= 69,362 %
STEMI 19,885 29.0 Non-STEMI 49,477 71.0
Table 5 shows the demographic characteristics of the 69,502 MI cases reported between
2008 and 2019. Median age of all MI cases was 63 years. Almost two-thirds of the cases
(64.3%) in the database were male (n=44,683)
Table 5. Demographic characteristics of heart attack cases in Texas, 2008-2019
Table 6 shows the number of hospitals and MI cases by urban vs. rural setting. With almost
84% of participating hospitals being in an urban setting, it is not surprising that most of the
reported heart attack and STEMI cases were in the urban areas.
Characteristics N (%)
Age (years) Median (Interquartile Range) 63 (18)
Gender
Male 44,683 (64.3) Female 24,819 (35.7)
Race
White 57,280 (82.4)
Black 9,350 (13.5)
Asian 1,858 (2.7)
American Indian 453 (0.7)
Native Hawaiian / Pacific Islander 300 (0.4)
Missing 261 (0.4)
Ethnicity
Hispanic 17,028 (24.5) Non-Hispanic 52,223 (75.1) Missing 251 (0.3)
Health Insurance Status
Health insurance 60,054 (86.4)
No health insurance 9,448 (13.6)

12
Table 6. Number of hospitals and MI cases, urban vs rural settings, 2008-2019
Hospital
setting
Reporting
hospitals N
Overall MI cases STEMI cases
N % N %
Urban 36 59,806 86.0 17,127 86.1
Rural 7 9,696 14.0 2,758 13.9
Total 43 69,502 100.0 19,885 100.0
Table 7 shows the number of heart attack cases by hospitals’ patient bed capacity, by
setting (urban vs. rural). Almost half of MI cases (n=32,475) were admitted to hospitals
with patient beds ‘100-349’. Hospitals having 350 or more patient beds were found only in
urban regions.
Table 7. Number of MI cases by hospital beds, by setting (urban, rural), 2008-2019
Hospital
beds
Overall MI cases
(n)
STEMI cases
(n)
Reporting Hospitals
(n)
< 100 9,848 3,278 7 (6 urban, 1 rural)
100 -349 31,865 8,750 22 (16 urban, 6 rural)
350 -699 24,488 6,790 13 (urban)
≥ 700 3,301 1,067 1 (urban)
Total 69,502 19,885 43
The median length of hospital stay (LOS) was 3 days, each year, between 2008 and 2014.
The mean LOS was 3 days, each year, between 2015 and 2019.
Arrival Method
According to the 2013 Texas Behavioral Risk Factor Surveillance System (BRFSS) survey,
an estimated 86.9% of adults in Texas said they would call 911 if they thought someone
was having a heart attack or stroke. The remaining 13.1% of adults said they would take
other action such as taking the person to the hospital, telling them to call their doctor, call
their spouse or family member, or do something else.
However, per the Chest Pain MI Registry data, 61.3% of heart attack patients transported
themselves, or were transported by family/friend, via private vehicle, to the hospital, while
37.7% were transported by an ambulance. Among those who were transported by
ambulance, only 63.3% had a pre-hospital ECG performed.

13
Figure 3. Modes of hospital arrival among all MI cases, and percentage of cases receiving
an ECG before vs. after hospital arrival, 2008-2019. Bars sum to 100%.
Figure 4. Modes of hospital arrival among heart attack cases, by sex, and among those
transported by ambulance, percentage of cases receiving an ECG before vs. after hospital arrival, 2008-2019. Percentages for each bar total 100%.
Of the 44,431 male heart attack cases reported, 63 in 100 (63.1%) were transported to the
hospital by personal vehicle. Almost four in 10 male heart attack cases (36.1%) arrived by
ambulance, with 65.8% having an ECG performed prior to hospital arrival.
Of the 24,650 female heart attack cases reported, 59 in 100 (58.5%) were transported by
personal vehicle. Roughly four in ten female heart attack cases (40.9%) arrived by
ambulance. While this was similar to the percentage of male cases transported by
ambulance, fewer females (59.3%) had an ECG performed prior to hospital arrival.
Hospital transport by air was uncommon for either gender (0.6% female, .9% male). Mode
of hospital transport was missing for 0.2% of male or female cases.
0% 20% 40% 60% 80% 100%
Missing
Air
Ambulance
Personal Vehice
Percentage
Ho
sp
ital
Arriv
al
Mo
de
Pre-hospital
ECG
ECG after
hospital arrival
61.3
37.7
0.8
0.2
58.5
63.1
24.2
23.7
16.7
12.3
0.6
0.9
0% 20% 40% 60% 80% 100%
Female
Male
Hospital Arrival Mode, by Sex (%)
Personal Vehicle Ambulance, pre-arrival ECG Ambulance, no pre-arrival ECG Air
36.1%
40.9%

14
Figure 5. Modes of hospital arrival among heart attack cases, by race/ethnicity, and among
those transported by ambulance, percentage of cases receiving an ECG before vs. after hospital arrival, 2008-2019. Percentages for each bar total 100%.
When comparing modes of hospital arrival among heart attack cases by race/ethnicity, over
half of all cases arrived by private vehicle (62.0% White only, 54.2% Black only, and 65.7%
Hispanic). Fewer White or Hispanic cases arrived by ambulance as compared with Black
cases (36.5%, 33.3%, and 44.7%, respectively). Heart attack cases transported by
ambulance who received a pre-hospital arrival ECG were overall similar: 62.8% of White,
63.9% of Black, and 60.0% of Hispanic cases. Mode of hospital transport was missing for
0.6% of White, 0.7% of Hispanic cases and 0.8% of Black cases.
The graphs and tables that follow display either numbers (N) and percentages (%) or
median values for specific measures of effective care for heart attack. When presenting data
by mode of hospital arrival, data with more than 100 cases reported for each mode of
hospital arrival are displayed by year, using ten full years of data, from the first quarter of
2009 through the fourth quarter of 2019 (January 2009-December 2019). For measures
with less than 100 cases reported for each mode of hospital arrival, the data are cumulative,
using all available data from the fourth quarter of 2008 through the fourth quarter of 2019
(October 2008-December 2019). Data may also be stratified by patient type, that is,
whether the patient was transferred in from another hospital (STEMI referral) or presented
directly to a PCI-capable hospital (STEMI receiving). The measures include:
1. Pre-hospital ECG within 10 minutes of first medical contact
2. Time from first hospital arrival to first ECG
3. First ECG within 10 minutes of first hospital arrival
4. Dwell time in the emergency department (ED)
a. Dwell time in the ED of referral hospital
62
54.2
65.7
22.9
28.5
20
13.6
16.1
13.3
0.8
0.3
0.2
0% 20% 40% 60% 80% 100%
White
Black
Hispanic
Hospital Arrival Mode, by Race/Ethnicity (%)
Personal Vehicle Ambulance, pre-arrival ECG
Ambulance, no pre-arrival ECG Air
Missing
36.5%
44.7%
33.3%
15
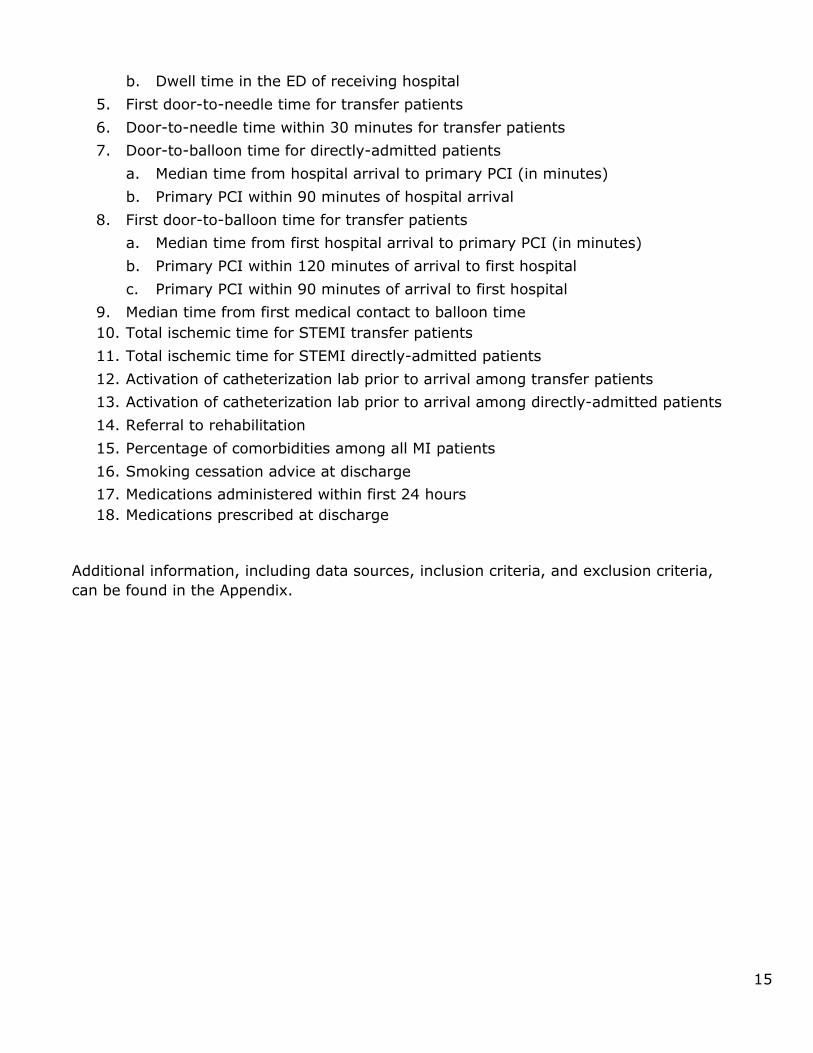
b. Dwell time in the ED of receiving hospital
5. First door-to-needle time for transfer patients
6. Door-to-needle time within 30 minutes for transfer patients
7. Door-to-balloon time for directly-admitted patients
a. Median time from hospital arrival to primary PCI (in minutes)
b. Primary PCI within 90 minutes of hospital arrival
8. First door-to-balloon time for transfer patients
a. Median time from first hospital arrival to primary PCI (in minutes)
b. Primary PCI within 120 minutes of arrival to first hospital
c. Primary PCI within 90 minutes of arrival to first hospital
9. Median time from first medical contact to balloon time
10. Total ischemic time for STEMI transfer patients
11. Total ischemic time for STEMI directly-admitted patients
12. Activation of catheterization lab prior to arrival among transfer patients
13. Activation of catheterization lab prior to arrival among directly-admitted patients
14. Referral to rehabilitation
15. Percentage of comorbidities among all MI patients
16. Smoking cessation advice at discharge
17. Medications administered within first 24 hours
18. Medications prescribed at discharge
Additional information, including data sources, inclusion criteria, and exclusion criteria,
can be found in the Appendix.

16
PRE-HOSPITAL ECG WITHIN 10 MINUTES OF FIRST MEDICAL CONTACT, ALL MI
CASES
The ability to diagnose a STEMI early is an initial, and perhaps most important, step that
impacts MI survival. An Emergency Medical Services (EMS) unit equipped with 12-lead
equipment (i.e., 12-lead ECG capability) can identify a STEMI patient and communicate with
the receiving hospital, leading to activation of the catheterization lab and a more efficient
system of care. In an optimal system of care, a pre-hospital ECG will allow an MI patient to
bypass the emergency department (ED) and advance directly to treatment in the
catheterization lab. The sooner EMS staff can perform an ECG and accurately interpret the
findings, the timelier the communication of results to the receiving hospital, and the more
time the receiving hospital has to prepare for the incoming patient.
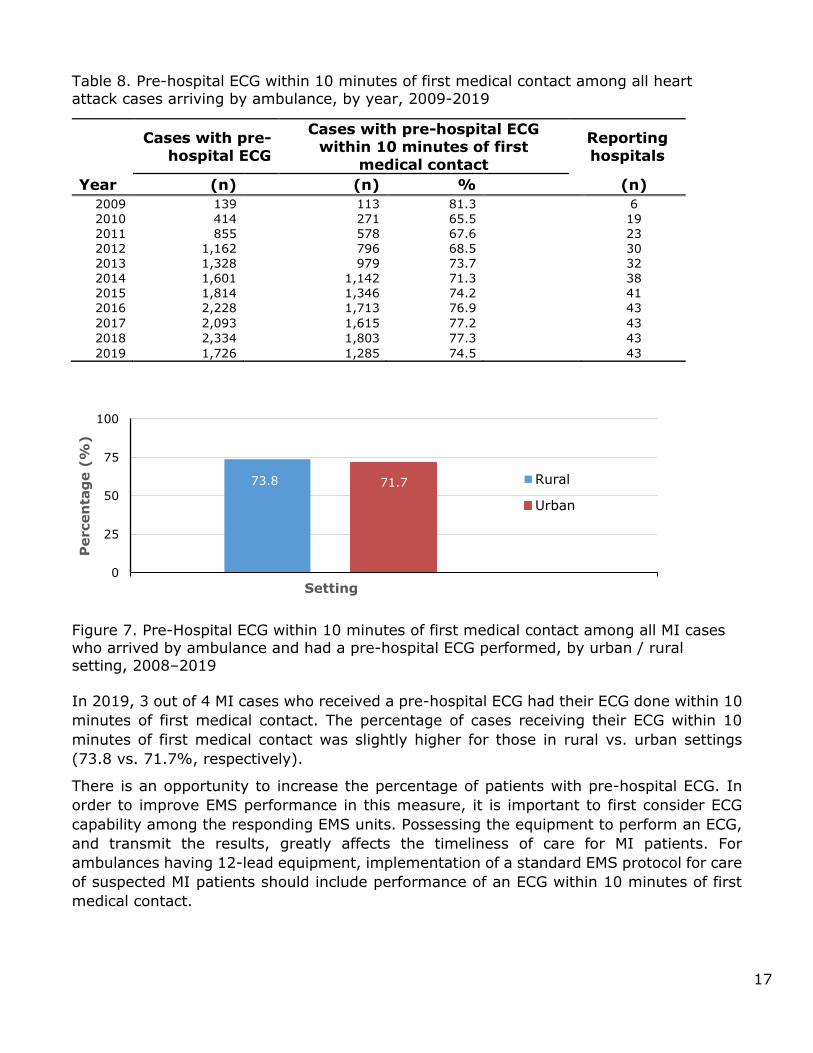
Figure 6 and Table 8, below, display the percentage of eligible episodes of care for heart
attack in which patients received their first ECG within 10 minutes of first medical contact.
The cases included in this measure arrived at the hospital by an ambulance equipped to
perform pre-hospital ECGs.
Figure 6. Pre-Hospital ECG within 10 minutes of first medical contact among all heart
attack cases arriving by ambulance, by year, 2009-2019
81.3
65.5 67.6 67.673.7 71.3
74.276.9 77.2 77.3
74.5
0
10
20
30
40
50
60
70
80
90
100
2009 2010 2011 2012 2013 2014 2015 2016 2017 2018 2019
Perc
enta
ge (
%)
Year
17
Table 8. Pre-hospital ECG within 10 minutes of first medical contact among all heart attack cases arriving by ambulance, by year, 2009-2019
Figure 7. Pre-Hospital ECG within 10 minutes of first medical contact among all MI cases who arrived by ambulance and had a pre-hospital ECG performed, by urban / rural setting, 2008–2019
In 2019, 3 out of 4 MI cases who received a pre-hospital ECG had their ECG done within 10
minutes of first medical contact. The percentage of cases receiving their ECG within 10
minutes of first medical contact was slightly higher for those in rural vs. urban settings
(73.8 vs. 71.7%, respectively).
There is an opportunity to increase the percentage of patients with pre-hospital ECG. In
order to improve EMS performance in this measure, it is important to first consider ECG
capability among the responding EMS units. Possessing the equipment to perform an ECG,
and transmit the results, greatly affects the timeliness of care for MI patients. For
ambulances having 12-lead equipment, implementation of a standard EMS protocol for care
of suspected MI patients should include performance of an ECG within 10 minutes of first
medical contact.
73.8 71.7
0
25
50
75
100
1
Percen
tag
e (
%)
Setting
Rural
Urban
Cases with pre-
hospital ECG
Cases with pre-hospital ECG within 10 minutes of first
medical contact
Reporting
hospitals
Year (n) (n) % (n)
2009 139 113 81.3 6
2010 414 271 65.5 19
2011 855 578 67.6 23
2012 1,162 796 68.5 30
2013 1,328 979 73.7 32
2014 1,601 1,142 71.3 38
2015 1,814 1,346 74.2 41
2016 2,228 1,713 76.9 43
2017 2,093 1,615 77.2 43
2018 2,334 1,803 77.3 43
2019 1,726 1,285 74.5 43

18
TIME FROM HOSPITAL ARRIVAL TO FIRST ECG AMONG TRANSFER CASES
Performing an ECG is the first step in heart attack care within the hospital, and not having
one performed in a timely manner can have a detrimental effect on the patient’s outcome.
The national standard for hospital ECG performance time is within 10 minutes of hospital
arrival. [4] Rapid ECG performance and interpretation can lead to reduced dwell time in the
ED for a heart attack patient, and to timely activation of the catheterization lab.
Figure 8 and Table 9, below, display the median time (in minutes) elapsed from hospital
arrival to performance of first ECG among transfer cases with eligible episodes of care for
heart attack, by mode of arrival to the first hospital, by year. Episodes of care in which a
patient received an ECG prior to arriving at the hospital were excluded.
Figure 8. Median time (minutes) from first hospital arrival to first ECG among transfer cases, by mode of arrival to first hospital, by year, 2009-2019
Table 9. Median time (minutes) from first hospital arrival to first ECG among transfer cases, by mode of arrival to first hospital, by year, 2009-2019
0
2
4
6
8
10
12
2009 2010 2011 2012 2013 2014 2015 2016 2017 2018 2019Med
ian
Tim
e (
Min
ute
s)
Year
Personal Vehicle
Ambulance
Year
Mode of arrival to STEMI referral hospital
Reporting
hospitals (n)
Personal vehicle Ambulance
Cases with ECG (n)
Minutes (Median)
Cases
with ECG (n)
Minutes (Median)
2009 271 6 78 6 6
2010 535 7 174 7 15
2011 768 7 213 9 21
2012 911 8 205 10 27
2013 1,094 7 220 8 30
2014 1,067 6 188 7 36
2015 1,362 7 198 10 39
2016 1,391 7 188 8 40
2017 1,328 6 161 7 40
2018 1,250 6 165 8 41
2019 1,225 6 160 8 41

19
The median time to first ECG for transferred cases who arrived by personal vehicle to the
hospital ranged from a low of six minutes in 2009, 2014, 2017-2019 to a high of eight
minutes in 2012. The median time for those who arrived by ambulance ranged from a low
of six minutes in 2009 to a high of 10 minutes in 2012 and 2015. Each year since 2011, the
median time from first hospital arrival to first ECG was roughly 1-3 minutes longer for those
arriving by ambulance than by personal vehicle.
TIME FROM HOSPITAL ARRIVAL TO FIRST ECG AMONG DIRECTLY-ADMITTED
CASES
Figure 9 and Table 10, below, display the median time (in minutes) elapsed from hospital
arrival to performance of first ECG among directly-admitted cases with eligible episodes of
care for heart attack, by mode of arrival to the hospital, by year. Episodes of care in which
a patient received an ECG prior to arriving at the hospital were excluded.
Figure 9. Median time from first hospital arrival to first ECG among directly-admitted cases, by mode of arrival to hospital, by year, 2009-2019
Table 10. Median time from hospital arrival to first ECG among directly-admitted cases, by
mode of arrival to hospital, by year, 2009-2019
Mode of arrival to first hospital
Year
Personal vehicle Ambulance
Reporting hospitals (n)
Cases with ECG (n)
Minutes (Median)
Cases with
ECG (n) Minutes
(Median)
2009 205 7 85 7 6
2010 1,023 8 479 8 19
2011 1,731 8 689 8 23
2012 2,321 7 840 7 30
2013 2,504 7 1,017 7 32
2014 3,089 7 917 8 38
2015 3,263 7 768 9 41
2016 3,733 7 665 8 43
2017 3,709 6 649 7 43
2018 3,830 6 479 9 43
2019 4,709 7 952 8 43
0
2
4
6
8
10
2009 2010 2011 2012 2013 2014 2015 2016 2017 2018 2019Med
ian
Tim
e (
Min
ute
s)
Year
Personal Vehicle
Ambulance

20
The median time to first ECG for directly-admitted cases who arrived by personal vehicle to
the hospital ranged from a low of six minutes (2016 through 2018) to a high of seven
minutes all other reporting years. The median time for those who arrived by ambulance
ranged from a low of seven minutes to a high of nine minutes in 2018.
HOSPITAL ECG WITHIN 10 MINUTES OF ARRIVAL AMONG TRANSFER CASES
Figure 10 and Table 11, below, display the percentage of eligible episodes of care for heart
attack in which transfer patients received an ECG within 10 minutes of arriving at the first
hospital to which they presented, by mode of arrival to the first hospital, by year. Episodes
of care in which a patient received an ECG prior to arriving at the hospital were excluded.
Figure 10. Hospital ECG within 10 minutes of first hospital arrival among transfer cases,
by mode of arrival to first hospital, by year, 2009-2019 Table 11. Hospital ECG within 10 minutes of first hospital arrival among transfer cases, by
mode of arrival to first hospital, by year, 2009-2019
0
25
50
75
100
2009 2010 2011 2012 2013 2014 2015 2016 2017 2018 2019
Percen
tag
e (
%)
Year
Personal Vehicle
Ambulance
Year
Mode of arrival to first hospital
Personal vehicle Ambulance
Cases with
ECG
Cases with ECG within 10 minutes of
hospital arrival
Cases
with ECG
Cases with ECG within 10 minutes of hospital arrival
Reporting
hospitals
(n) (n) % (n) (n) %
2009 271 209 77.1 78 59 75.6 6
2010 535 354 66.2 174 118 67.8 16
2011 768 512 66.7 213 126 59.2 21
2012 911 567 62.2 205 112 54.6 27
2013 1,094 720 65.8 220 132 60.0 31
2014 1,067 716 67.1 188 119 63.3 37
2015 1,362 891 65.4 198 104 52.5 39
2016 1,391 900 64.7 188 117 62.2 41
2017 1,328 943 71.0 161 96 59.6 43
2018 1,250 856 68.5 165 93 56.4 43 2019 1,225 855 69.8 160 90 56.3 43

21
In 2019, of all MI cases with an ECG performed at a STEMI referral hospital, a greater
percentage of those arriving by personal vehicle had their ECG performed within 10 minutes
of arriving at the hospital as compared with those arriving by ambulance (70 in 100 vs. 56
in 100, respectively). This general trend is seen for the 10-year time period (except 2010).
There is opportunity for improvement in this vital component of care. Implementing
appropriate protocols within the hospital ED can lead to more efficient care and improved
times for first in-hospital ECG.
HOSPITAL ECG WITHIN 10 MINUTES OF ARRIVAL AMONG DIRECTLY-ADMITTED
STEMI CASES
Figure 11 and Table 12 display the percentage of eligible episodes of care for MI in which
directly-admitted patients received an ECG within 10 minutes of arriving at the hospital, by
mode of arrival to the hospital, by year. Episodes of care in which a patient received an ECG
prior to arriving at the hospital were excluded.
Figure 11. Hospital ECG within 10 minutes of arrival among directly-admitted MI cases, by mode of arrival to hospital, by year, 2009-2019
Table 12. Hospital ECG within 10 minutes of arrival among directly-admitted MI cases, by mode of arrival to hospital, by year, 2009-2019
0
25
50
75
100
2009 2010 2011 2012 2013 2014 2015 2016 2017 2018 2019
Percen
tag
e (
%)
Year
Personal Vehicle
Ambulance
Year
Mode of arrival to STEMI receiving hospital
Personal vehicle Ambulance
Cases with ECG
Cases with ECG within 10 minutes
of hospital arrival
Cases with ECG
Cases with ECG within 10 minutes
of hospital arrival
Reporting hospitals
(n) (n) % (n) (n) % (n)
2009 205 157 76.6 85 58 68.2 6
2010 1,023 631 61.7 479 278 58.0 19
2011 1,731 1,062 61.4 689 405 58.8 23
2012 2,321 1,537 66.2 840 525 62.5 30
2013 2,504 1,607 64.2 1,017 671 66.0 32
2014 3,089 2,122 68.7 917 553 60.3 38
2015 3,263 2,267 69.5 768 441 57.4 41

22
In 2019, among directly-admitted cases who received their first ECG at a STEMI receiving
hospital, a greater percentage of those arriving by personal vehicle had their ECG performed
within 10 minutes of arriving at the hospital as compared with those arriving by ambulance.
While there was not much difference in these percentages from 2010-2013, the percentages
have diverged more noticeably as of 2014. Hospital ECG within 10 minutes of arrival is
recommended both in transfer and directly-admitted patients, irrespective of their mode of
arrival. Even though this report shows that a higher number of patients arriving by a
personal vehicle had a hospital ECG within 10 minutes of arrival, it is always recommended
that MI patients arrive by ambulance. This is primarily to allow for recognition of STEMI
when ECG is performed in the ambulance, leading to timely activation of cardiac
catheterization lab. This can decrease the patients’ total ischemic time and improve clinical
outcomes.
DWELL TIME IN THE EMERGENCY DEPARTMENT OF REFERRAL HOSPITAL
The standard of care for time from arrival at first hospital to PCI, including transfer time, is
120 minutes. [3] The transfer process adds another component that must be evaluated as
part of the STEMI system of care. The time spent in the referral facility is critical in this
transfer process. It is an element that can be improved upon through streamlined processes
and protocols, whereas transport time is more difficult to address due to other factors, such
as distance to the nearest STEMI receiving hospital.
Figure 12 and Table 13 display the median time (in minutes) STEMI cases spent awaiting
transfer (from the STEMI referral hospital to the STEMI receiving hospital) for PCI, among
eligible episodes of care, by mode of arrival to the referral hospital.
Figure 12. Median time spent in the emergency department (ED) of the STEMI referral
hospital, by mode of arrival to first hospital, 2008-2019
49.0
41.0
0
10
20
30
40
50
60
Mode of arrival to STEMI referral hospital
Med
ian
Tim
e
(m
inu
tes)
Personal vehicle
Ambulance
2016 3,733 2,677 71.7 665 380 57.1 43
2017 3,709 2,740 73.9 649 427 65.8 43
2018 3,830 2,887 75.4 479 265 55.3 43
2019 4,709 3,396 72.1 952 561 58.9 43

23
Table 13. Median time spent in the emergency department (ED) of the STEMI referral hospital, by mode of arrival to first hospital, 2008-2019
Patient Type
Mode of arrival to first hospital
Reporting
hospitals (n)
Personal vehicle Ambulance
STEMI
cases (n)
Minutes (Median)
STEMI
cases (n)
Minutes (Median)
Transfer from referral hospital 329 49 238 41 11
The median time spent awaiting transfer from the STEMI referral hospital to the STEMI
receiving hospital for PCI was 49.0 minutes among those who arrived by personal vehicle
and 41.0 minutes among those who arrived by ambulance. For referral hospitals, there
should be protocols in place for identifying, transferring, and transporting a STEMI patient
to a receiving hospital. Implementing such a protocol requires rapid performance and
interpretation of ECG as well as communication to the receiving hospital for activation of its
catheterization lab.
DWELL TIME IN THE EMERGENCY DEPARTMENT OF RECEIVING HOSPITAL
AMONG TRANSFER CASES
Figure 13 and Table 14 display the median time (in minutes) STEMI cases spent waiting in
the ED of the STEMI receiving hospital among transfer cases with eligible episodes of care
for STEMI, by mode of arrival to first hospital, by year.
Figure 13. Median time spent in the Emergency Department of the STEMI receiving hospital among transfer cases, by mode of arrival to first hospital, by year, 2009-2019
0
10
20
30
40
50
60
70
80
90
2009 2010 2011 2012 2013 2014 2015 2016 2017 2018 2019Med
ian
Tim
e (
Min
ute
s)
Year
Personal Vehicle
Ambulance

24
Table 14. Median time spent in the Emergency Department of the STEMI receiving hospital among transfer cases, by mode of arrival to first hospital, by year, 2009-2019
STEMI transfer cases arriving via private vehicle spend less time in the STEMI receiving
hospital’s ED as compared with those arriving via ambulance. In 2019, the median dwell
time was 8 minutes longer for those arriving by ambulance than by personal vehicle.
There is opportunity for establishing protocols and improving communication between
STEMI receiving and STEMI referral hospitals that could reduce patients’ dwell time in the
ED of the STEMI receiving hospital.
DWELL TIME IN THE EMERGENCY DEPARTMENT OF RECEIVING HOSPITAL
AMONG DIRECTLY-ADMITTED CASES
Figure 14 and Table 15 display the median time (in minutes) spent waiting in the ED of
STEMI receiving hospital among directly-admitted STEMI cases with eligible episodes of care
for STEMI, by mode of arrival to hospital, by year.
Figure 14. Median time spent in the Emergency Department of STEMI receiving hospitals
among directly-admitted STEMI cases, by mode of arrival to hospital, 2009-2019
0
10
20
30
40
50
60
2009 2010 2011 2012 2013 2014 2015 2016 2017 2018 2019Med
ian
Tim
e (
Min
ute
s)
Year
Personal Vehicle
Ambulance
Year
Mode of arrival to first hospital
Reporting hospitals (n)
Personal vehicle Ambulance
STEMI cases (n)
Minutes STEMI cases (n)
Minutes
(Median) (Median)
2009 23 28 5 29 2
2010 43 24 34 38 10
2011 78 20 20 35 13
2012 81 30 25 50 16
2013 87 28 13 37 17
2014 80 21 22 58 20
2015 93 22 18 36 25
2016 139 19 25 79 27
2017 117 21 23 26 24
2018 126 20 26 34 28
2019 130 24 19 32 28

25
Table 15. Median time spent in the Emergency Department of STEMI receiving hospitals among directly-admitted STEMI cases, by mode of arrival to hospital, 2009-2019
Year
Mode of arrival to STEMI receiving hospital
Personal vehicle Ambulance Reporting hospitals
(n) STEMI Cases (n) Minutes
(Median) STEMI Cases
(n) Minutes
(Median)
2009 67 38 68 35 6
2010 236 47 232 35 19
2011 368 46 420 31 23
2012 473 45 490 31 30
2013 514 45 669 34 32
2014 639 43 686 33 38
2015 670 43 753 28 41
2016 739 43 899 26 43
2017 728 42 901 29 43
2018 700 44 901 29 43
2019 675 50 842 35 43
Among directly-admitted STEMI cases, those arriving via private vehicle spend more time
in the hospital’s ED as compared with those arriving via ambulance. In 2019, the median
dwell time was 15 minutes longer for those arriving by personal vehicle than by ambulance.
This further supports that MI cases should consider transport via ambulance over personal
vehicle, as this could reduce dwell time in the ED of the STEMI receiving hospital.
FIRST DOOR-TO-NEEDLE TIME AMONG TRANSFER PATIENTS
Fibrinolysis, or use of a clot-dissolving drug to restore blood flow, can be used by hospitals
that are not PCI-capable and cannot transfer a patient to receive PCI within the
recommended time. It is also an option for patients who are ineligible for PCI. Fibrinolytic
therapy should be administered within 30 minutes of hospital arrival. [4]
Figure 15 and Table 16 display the median time (in minutes) elapsed from arrival at first
hospital to receipt of fibrinolytic therapy as the primary reperfusion treatment at the same
hospital, among eligible episodes of care for STEMI, by mode of arrival to first hospital. The
patients included in this measure were later transferred to another hospital. It is important
to note the number of eligible patients for this measure was less than 110.

26
Figure 15. Median time from arrival to primary fibrinolysis at first hospital among STEMI
transfer patients, by mode of arrival to first hospital, from 2008 -2019
Table 16. Median time from arrival at first hospital to primary fibrinolysis among STEMI
transfer patients, by mode of arrival to first hospital, from 2008 -2019
Patient
Type
Mode of arrival to first hospital
Personal Vehicle Ambulance
Cases receiving
fibrinolysis at
first hospital
(N)
Minutes
(Median)
Cases receiving
fibrinolysis at
first hospital
(N)
Minutes
(Median)
Reporting
hospitals
(N)
Transfer 85 38 31 41 16
Among patients who arrived at the first hospital by personal vehicle, the median time from
hospital arrival to fibrinolytic therapy was 38 minutes, compared to a median time of 41
minutes for those arriving to the first hospital by ambulance.
DOOR-TO-NEEDLE TIME WITHIN 30 MINUTES AMONG TRANSFER PATIENTS
Figure 16 and Table 17 display the percentage of eligible STEMI cases receiving primary
fibrinolysis as the primary reperfusion strategy within 30 minutes of arrival at first hospital,
by mode of arrival to first hospital. The patients included in this measure were later
transferred to another hospital. It is important to note the number of eligible patients for
this measure was less than 150.
3841
0
10
20
30
40
50
Mode of Arrival to First Hospital
Tim
e t
o T
reatm
en
t
(m
inu
tes)
Personal Vehicle Ambulance

27
Figure 16. Fibrinolysis within 30 minutes of first hospital arrival among transfer patients,
by mode of arrival to first hospital, from 2008-2019
Table 17. Fibrinolysis within 30 minutes of first hospital arrival among transfer patients,
by mode of arrival to first hospital, from 2008 -2019
Mode of arrival to STEMI referral hospital
Personal vehicle Ambulance
Cases receiving
fibrinolysis at STEMI referral hospital
Cases receiving fibrinolysis within
30 minutes of arrival at STEMI referral hospital
Cases receiving
fibrinolysis at STEMI referral hospital
Cases receiving fibrinolysis within
30 minutes of arrival at STEMI referral hospital
Reporting
hospitals Patient
Type N n % N n % N
Transfer 85 29 34.1 31 11 35.5 16
The recommended door-to-needle time in STEMI referral hospitals is no more than 30
minutes. [5] In Texas, between 2008 and 2019, less than four out of every ten STEMI
cases who arrived to the referral hospital by personal vehicle (34.1%) or by ambulance
(35.5%) were treated to this standard of care. More rapid performance of ECG and
protocols to reduce dwell times in the ED of the referral hospitals can improve this
measure.
DOOR-TO-BALLOON TIME FOR DIRECTLY-ADMITTED PATIENTS
The standard of care for time from hospital arrival to PCI (or “device activation”) is
commonly referred to as “door-to-balloon time”, and should be no more than 90 minutes.
[5] Figure 17 and Table 18 display the median time (in minutes) elapsed among directly-
admitted cases from time of arriving at a STEMI receiving hospital to primary PCI among
eligible episodes of care for STEMI, by mode of arrival, by year. This measure is significant
because it encompasses all the previous steps that are required for care of STEMI patients,
from their arrival at the hospital, their time in the ED, their arrival in the catheterization
lab, and device activation.
34.1 35.5
0
10
20
30
40
50
Mode of Arrival to First Hospital
Percen
tag
e (
%)
Personal Vehicle Ambulance

28
Figure 17. Median time (minutes) from hospital arrival to primary PCI among directly-
admitted STEMI patients, by mode of arrival, by year, 2009-2018
Table 18. Median time (minutes) from hospital arrival to primary PCI among directly-
admitted STEMI patients, by mode of arrival, by year, 2009-2019
Each year, directly-admitted cases who arrived by ambulance had a lower median time to
PCI than did those who arrived by personal vehicle. In order to further improve the
median time to PCI, hospitals can evaluate their protocol for activation of the
catheterization lab and aim to have catheterization lab staff arrive within 30 minutes of
the activation call.
0
10
20
30
40
50
60
70
2009 2010 2011 2012 2013 2014 2015 2016 2017 2018 2019
Med
ian
Tim
e
(M
inu
tes)
Year
Personal Vehicle
Ambulance
Mode of Arrival to hospital
Personal vehicle Ambulance
Year
Cases
receiving
primary PCI at
hospital (n)
Minutes
(Median)
Cases
receiving
primary PCI at
hospital (n)
Minutes
(Median)
Reporting
hospitals
(n)
2009 -- -- -- -- --
2010 -- -- -- -- --
2011 477 52 418 46 23
2012 516 58 451 47 30
2013 568 59 560 51 32
2014 655 57 556 51 38
2015 725 56 600 47 41
2016 781 58 699 47 43
2017 788 57 686 49 43
2018 733 59 690 49 43
2019 687 62 603 53 43
-- No data available

29
DOOR-TO-BALLOON TIME WITHIN 90 MINUTES FOR DIRECTLY-ADMITTED
PATIENTS
Figure 18 and Table 19 display the percentage of eligible episodes of care for STEMI cases
who received primary PCI within 90 minutes of direct presentation to a STEMI receiving
hospital, by mode of arrival, by year. Data on this measure are not available prior to 2011.
Figure 18. Primary PCI within 90 minutes of hospital arrival among directly-admitted
STEMI patients, by mode of arrival, by year, 2009-2018
Table 19. Primary PCI within 90 minutes of hospital arrival among directly-admitted
patients, by mode of arrival, by year, 2009-2019
Mode of Arrival to STEMI receiving hospital Personal vehicle Ambulance
Year
Cases
receiving
primary PCI
at STEMI
receiving
hospital
Cases receiving
primary PCI
within 90
minutes of first
hospital arrival
Cases
receiving
primary PCI
at STEMI
receiving
hospital
Cases receiving
primary PCI
within 90
minutes of first
hospital arrival Reporting
hospitals
(n) (n) (n) % (n) (n) %
2009 -- -- -- -- --
2010 -- -- -- -- -- 2011 477 442 92.7 418 407 97.4 23
2012 516 476 92.3 451 436 96.7 30 2013 568 519 91.4 560 551 98.4 32 2014 655 617 94.2 556 540 97.1 38
2015 725 686 94.6 600 589 98.2 41 2016 781 732 93.7 699 684 97.9 43 2017 788 753 95.6 686 670 97.7 43
2018 733 694 94.7 690 673 97.5 43
2019 687 560 81.5 603 551 91.4 43
-- No data available
Over all years, a higher percentage of directly-admitted STEMI patients who arrived by
ambulance received primary PCI within 90 minutes of hospital arrival than did those who
arrived by personal vehicle. In 2019, this difference was 9.9%.
0
25
50
75
100
2009 2010 2011 2012 2013 2014 2015 2016 2017 2018 2019
Percen
tag
e (
%)
Year
Personal Vehicle
Ambulance

30
FIRST DOOR-TO-BALLOON TIME FOR TRANSFER PATIENTS
STEMI patients who arrive at a STEMI referral hospital who are eligible for and in need of
PCI must be transferred to a STEMI receiving hospital to receive appropriate care and
treatment. The standard of care for time from arrival at first hospital to PCI, including
transfer time, is 120 minutes. [3] Figure 19 and Table 20, below, display the median time
(in minutes) elapsed from arrival at a STEMI referral hospital to time of primary PCI at a
STEMI receiving hospital among eligible episodes of care for STEMI, by mode of arrival to
the STEMI referral hospital.
Figure 19. Median time (minutes) from first hospital arrival to primary PCI for STEMI
transfer patients, by mode of arrival to first hospital, by year, 2009-2019
Table 20. Median time from first hospital arrival to primary PCI for transfer patients by
mode of arrival to first hospital and year, 2009-2019
0
20
40
60
80
100
120
140
160
2009 2010 2011 2012 2013 2014 2015 2016 2017 2018 2019
Med
ian
Tim
e (
Min
ute
s)
Year
Personal Vehicle
Ambulance
Mode of Arrival to first hospital
Personal vehicle Ambulance
Year
Cases receiving
primary PCI at
STEMI receiving
hospital (n)
Minutes
(Median)
Cases receiving
primary PCI at
STEMI receiving
hospital (n)
Minutes
(Median)
Reporting
hospitals
(n)
2009 -- -- -- -- --
2010 -- -- -- -- --
2011 200 99 98 70 17
2012 179 95 86 70 20
2013 193 94 74 68 23
2014 196 96 36 100 27
2015 256 99 39 93 29
2016 239 99 22 133 32
2017 236 99 18 145 30

31
In 2019, transfer cases who arrived at a STEMI referral hospital by ambulance had a higher
median time to primary PCI than those who arriving by personal vehicle; this trend has
been seen since 2014, whereas prior to 2014, those arriving by ambulance had a lower
median time from arrival to PCI. Identifying and addressing the causes of this difference
may lead to improved time to primary PCI and potentially better health outcomes.
FIRST DOOR-TO-BALLOON TIME WITHIN 120 MINUTES FOR TRANSFER
PATIENTS
Figure 20 and Table 21, below, display the percentage of eligible episodes of care for STEMI
cases who received primary PCI at a STEMI receiving hospital within 120 minutes of arriving
at a STEMI referral hospital, by mode of arrival to the referral hospital, by year.
Figure 20. Primary PCI within 120 minutes of first hospital arrival among STEMI transfer
patients, by mode of arrival to first hospital, by year, 2009-2019
0
25
50
75
100
2009 2010 2011 2012 2013 2014 2015 2016 2017 2018 2019
Percen
tag
e (
%)
Year
Personal Vehicle
Ambulance
2018 238 103 28 120 34
2019 203 103 23 119 34
-- No data available

32
Table 21. Primary PCI within 120 minutes of first hospital arrival among STEMI transfer
patients, by mode of arrival to first hospital, by year, 2009-2019
In 2018, 68 out of 100 STEMI transfer cases who arrived at a STEMI referral hospital by
private vehicle received primary PCI within 120 minutes of arrival at the STEMI referral
hospital, compared to only 56 out of 100 who arrived at the referral hospital by ambulance.
FIRST DOOR-TO-BALLOON TIME WITHIN 90 MINUTES FOR TRANSFER PATIENTS
According to American Heart Association’s (AHA) STEMI systems of care recommendations,
the door to balloon time for transfer patients, including transport time, should be within 90
minutes. [5] Figure 21 and Table 22 display the percentage of eligible episodes of care for
STEMI cases who received primary PCI at a STEMI receiving hospital within 90 minutes of
arriving at a STEMI referral hospital, by mode of arrival to STEMI referral hospital, by year.
Figure 21. Primary PCI within 90 minutes of first hospital arrival among STEMI transfer
patients, by mode of arrival to first hospital, by year, 2009-2019
0
25
50
75
100
2009 2010 2011 2012 2013 2014 2015 2016 2017 2018 2019
Percen
tag
e (
%)
Year
Personal Vehicle
Ambulance
Mode of Arrival to first hospital Personal vehicle Ambulance
Year
Cases receiving primary PCI at STEMI
receiving
hospital
Cases receiving primary PCI within 120 minutes of first
hospital arrival
Cases receiving primary PCI at STEMI
receiving
hospital
Cases receiving primary PCI within 120 minutes of first
hospital arrival Reporting hospitals
(n) (n) (n) % (n) (n) %
2009 -- -- -- -- -- 2010 -- -- -- -- --
2011 200 134 67.0 98 83 84.7 17 2012 179 124 69.3 86 73 84.9 20 2013 193 127 65.8 74 64 86.5 23
2014 196 137 69.9 36 24 66.7 27 2015 256 165 64.5 39 30 76.9 29 2016 239 170 71.1 22 9 40.9 32
2017 236 167 70.8 18 5 27.8 30
2018 238 160 67.2 28 14 50.0 34
2019 203 121 59.6 28 12 52.2 34
-- No data available

33
Table 22. Primary PCI within 90 minutes of first hospital arrival among STEMI transfer
patients, by mode of arrival to first hospital, by year, 2009-2019
In 2019, more patients arriving at a STEMI referral hospital by personal vehicle received
primary PCI within 90 minutes than did those who arrived by ambulance (30.1% vs. 17.4%,
respectively).
The number of cases arriving via ambulance to STEMI referral hospitals has been decreasing
since 2013. One reason for this may be that ambulances are bypassing STEMI referral
hospitals and transporting cases directly to STEMI receiving hospitals in efforts to decrease
ischemic times and improve outcomes. [6]
FIRST MEDICAL CONTACT (FMC) TO BALLOON TIME
According to both the 2013 American College of Cardiology Foundation and the AHA STEMI
guidelines, in order to improve STEMI outcomes, the focus and emphasis has shifted to
targeting first medical contact (FMC) to balloon time rather than door-to-balloon time. [7]
Figure 22 and Table 23, below, display the median time from FMC to balloon time, by year,
for STEMI patients who arrived by an ambulance to the first hospital. Both transfers and
directly-admitted patients were included.
Mode of Arrival to first hospital Personal vehicle Ambulance
Year
Cases receiving primary PCI at STEMI
receiving hospital
Cases receiving primary PCI within 90 minutes of first
hospital arrival
Cases receiving primary PCI at STEMI
receiving hospital
Cases receiving primary PCI within 90 minutes of first
hospital arrival Reporting hospitals
(n) (n) (n) % (n) (n) %
2009 -- -- -- -- -- 2010 -- -- -- -- --
2011 200 82 41.0 98 72 73.5 17 2012 179 77 43.0 86 66 76.7 20 2013 193 84 43.5 74 54 73.0 23 2014 196 86 43.9 36 14 38.9 27 2015 256 105 41.0 39 19 48.7 29 2016 239 90 37.7 22 3 13.6 32 2017 236 86 36.4 18 1 5.6 30
2018 238 85 35.7 28 6 21.4 34 2019 203 61 30.1 23 4 17.4 34
-- No data available

34
Figure 22. Median time from first medical contact to balloon time among STEMI patients
who arrived at the first hospital by ambulance, by patient type, by year, 2009-2019
Table 23. Median time from first medical contact to balloon time among STEMI cases who
arrived at the first hospital by ambulance, by patient type, by year, 2009-2019
Patient Type Directly-admitted Transfer
Year
Cases
receiving primary PCI
at STEMI receiving
hospital (n)
Minutes
(Median)
Reporting Hospitals
(n)
Cases receiving primary PCI at
STEMI receiving
hospital (n)
Minutes
(Median)
Reporting hospitals
(n)
2009 -- -- -- -- -- --
2010 -- -- -- -- -- --
2011 321 84 22 98 101 10
2012 370 82 27 86 96 12
2013 496 83 31 74 103 11
2014 518 80 36 33 125 13
2015 562 77 39 32 115 10
2016 681 75 42 17 156 8
2017 668 75 43 10 185 6
2018 656 78 43 17 169 6
2019 550 82 43 17 138 6
-- No data available
Among those arriving to the hospital via ambulance, the median time from FMC to primary
PCI was higher for transfer patients compared to directly-admitted patients.
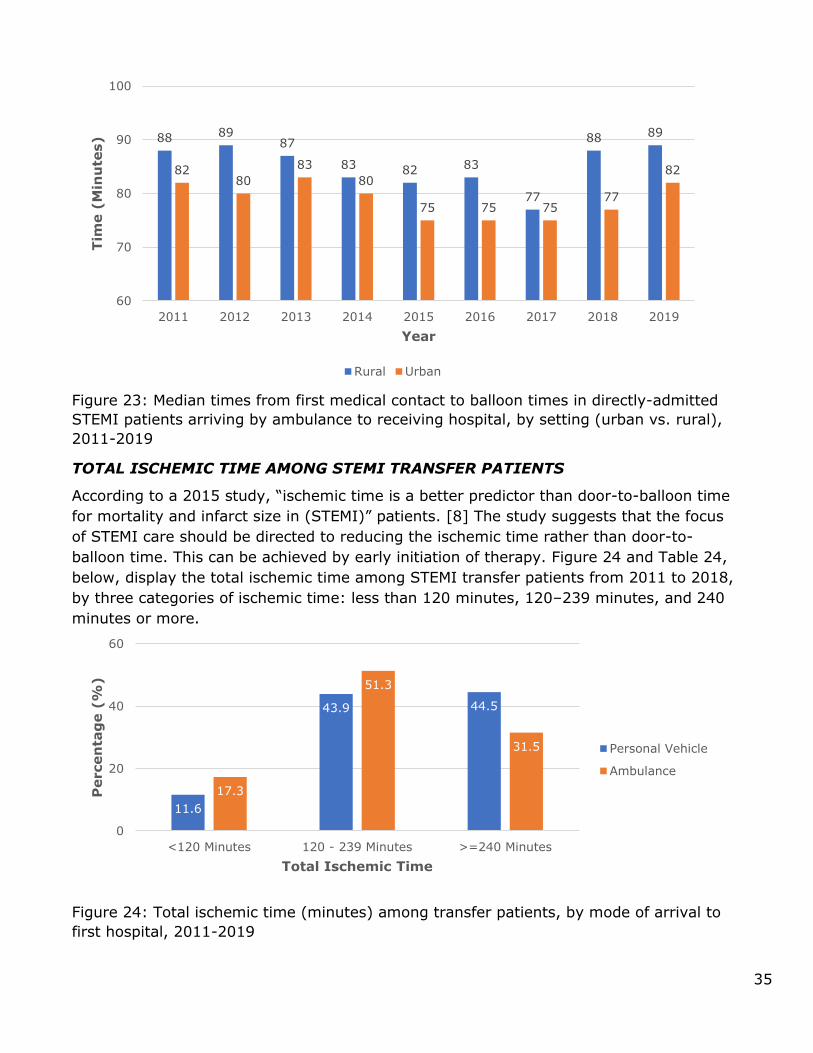
Figure 23 shows the median time from FMC to balloon time for directly-admitted patients
arriving by ambulance to a STEMI receiving hospital, by setting (urban/rural). Rural areas
had a higher median time from FMC to primary PCI as compared to urban areas.
0
50
100
150
200
2009 2010 2011 2012 2013 2014 2015 2016 2017 2018 2019
Med
ian
Tim
e
(M
inu
tes)
Year
Personal Vehicle
Ambulance
35
Figure 23: Median times from first medical contact to balloon times in directly-admitted
STEMI patients arriving by ambulance to receiving hospital, by setting (urban vs. rural),
2011-2019
TOTAL ISCHEMIC TIME AMONG STEMI TRANSFER PATIENTS
According to a 2015 study, “ischemic time is a better predictor than door-to-balloon time
for mortality and infarct size in (STEMI)” patients. [8] The study suggests that the focus
of STEMI care should be directed to reducing the ischemic time rather than door-to-
balloon time. This can be achieved by early initiation of therapy. Figure 24 and Table 24,
below, display the total ischemic time among STEMI transfer patients from 2011 to 2018,
by three categories of ischemic time: less than 120 minutes, 120–239 minutes, and 240
minutes or more.
Figure 24: Total ischemic time (minutes) among transfer patients, by mode of arrival to
first hospital, 2011-2019
88 8987
83 82 83
77
88 89
8280
83
80
75 75 7577
82
60
70
80
90
100
2011 2012 2013 2014 2015 2016 2017 2018 2019
Tim
e (
Min
ute
s)
Year
Rural Urban
11.6
43.9 44.5
17.3
51.3
31.5
0
20
40
60
<120 Minutes 120 - 239 Minutes >=240 Minutes
Percen
tag
e (
%)
Total Ischemic Time
Personal Vehicle
Ambulance
36
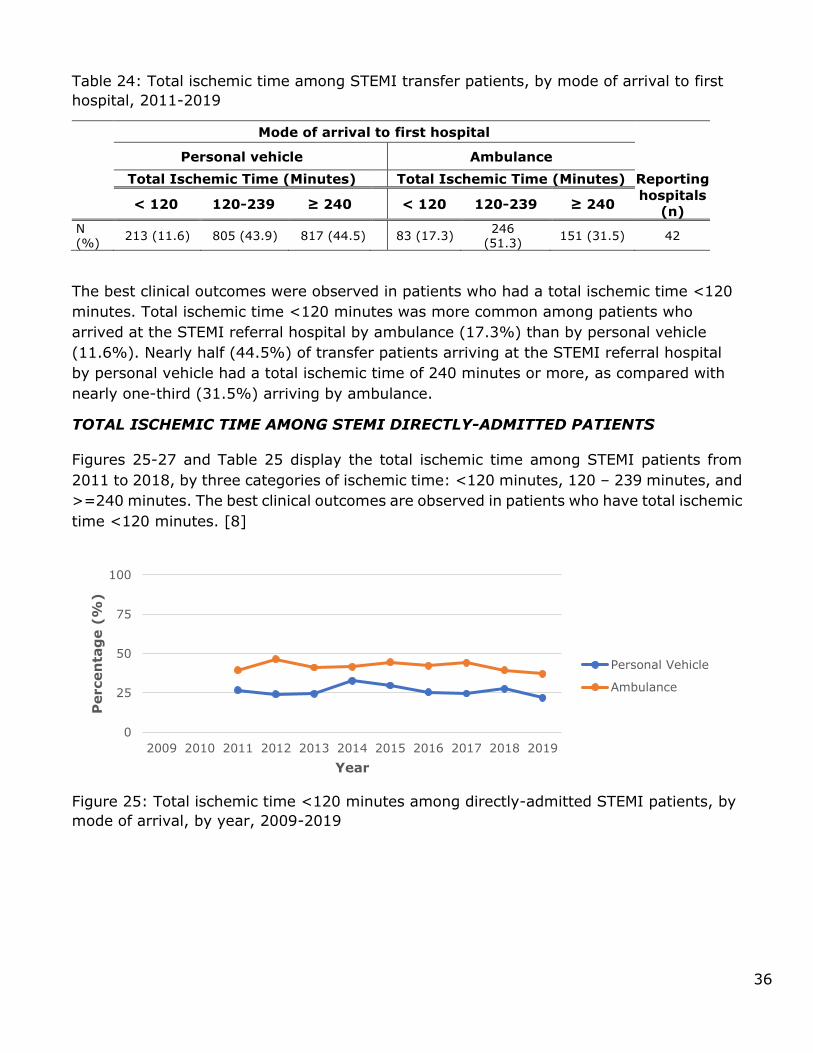
Table 24: Total ischemic time among STEMI transfer patients, by mode of arrival to first
hospital, 2011-2019
Mode of arrival to first hospital
Personal vehicle Ambulance
Total Ischemic Time (Minutes) Total Ischemic Time (Minutes) Reporting
hospitals
(n) < 120 120-239 ≥ 240 < 120 120-239 ≥ 240
N (%)
213 (11.6) 805 (43.9) 817 (44.5)
83 (17.3) 246
(51.3) 151 (31.5) 42
The best clinical outcomes were observed in patients who had a total ischemic time <120
minutes. Total ischemic time <120 minutes was more common among patients who
arrived at the STEMI referral hospital by ambulance (17.3%) than by personal vehicle
(11.6%). Nearly half (44.5%) of transfer patients arriving at the STEMI referral hospital
by personal vehicle had a total ischemic time of 240 minutes or more, as compared with
nearly one-third (31.5%) arriving by ambulance.
TOTAL ISCHEMIC TIME AMONG STEMI DIRECTLY-ADMITTED PATIENTS
Figures 25-27 and Table 25 display the total ischemic time among STEMI patients from
2011 to 2018, by three categories of ischemic time: <120 minutes, 120 – 239 minutes, and
>=240 minutes. The best clinical outcomes are observed in patients who have total ischemic
time <120 minutes. [8]
Figure 25: Total ischemic time <120 minutes among directly-admitted STEMI patients, by
mode of arrival, by year, 2009-2019
0
25
50
75
100
2009 2010 2011 2012 2013 2014 2015 2016 2017 2018 2019
Percen
tag
e (
%)
Year
Personal Vehicle
Ambulance

37
Figure 26: Total ischemic time 120 - 239 minutes among directly-admitted STEMI
patients, by mode of arrival, by year, 2009-2019
Figure 27: Total ischemic time ≥ 240 minutes among directly-admitted STEMI patients, by
mode of arrival, by year, 2009-2019
Figure 25 shows that, from 2011 to 2019, total ischemic time <120 minutes was more
common among directly-admitted STEMI patients who arrived at the receiving hospital by
ambulance than by personal vehicle. Figure 26 shows that there is very little difference in
the number of directly-admitted STEMI patients with an ischemic time of 120-239 minutes
by mode of hospital arrival. Figure 27 shows that, from 2011 to 2019, total ischemic time
>=240 minutes was more common among directly-admitted STEMI patients arriving by
personal vehicle than by ambulance.
0
25
50
75
100
2009 2010 2011 2012 2013 2014 2015 2016 2017 2018 2019
Percen
tag
e (
%)
Year
Personal Vehicle
Ambulance
0
25
50
75
100
2009 2010 2011 2012 2013 2014 2015 2016 2017 2018 2019
Percen
tag
e (
%)
Year
Personal Vehicle
Ambulance

38
Table 25: Total ischemic time among directly-admitted STEMI patients, by mode of
arrival, by year, 2009-2019
In 2019, 21.9% of directly-admitted STEMI patients who arrived at the hospital by personal
vehicle and 37.1% of those arriving by ambulance had total ischemic time of <120 minutes
(Table 25). Conversely, for 2019, more patients who arrived at the hospital by personal
vehicle had a total ischemic time >=240 minutes as compared with those arriving by
ambulance (39.9% vs 24.0%, respectively).
MEDIAN TIME FROM SYMPTOM ONSET TO PRIMARY PCI IN DIRECTLY-ADMITTED
AND TRANSFER STEMI PATIENTS, 2018
The shorter the time from symptom onset to treatment, the better the patient outcome.
Figure 28 shows the median time STEMI cases spent in each stage of the treatment
process, from onset of symptoms to time of PCI, comparing directly-admitted and transfer
patients in 2018.
Year
Mode of arrival to first hospital
Reporting Hospitals
(n)
Personal vehicle Ambulance
Total Ischemic Time Total Ischemic Time
< 120 Minutes,
120-239 Minutes,
≥ 240 Minutes,
< 120 Minutes,
120-239 Minutes,
≥ 240 Minutes,
n (%) n (%) n (%) n (%) n (%) n (%)
2009 -- -- -- -- -- -- -- 2010 -- -- -- -- -- -- -- 2011 65 (26.8) 103 (42.4) 75 (30.9) 118 (39.5) 136 (45.5) 45 (15.1) 23
2012 72 (24.2) 145 (48.7) 81 (27.2) 157 (46.5) 130 (38.5) 51 (15.1) 27
2013 77 (24.5) 132 (42.0) 105 (33.4) 194 (41.2) 191 (40.6) 86 (18.3) 31 2014 128 (32.7) 151 (38.5) 113 (28.8) 187 (41.5) 173 (38.4) 91 (20.2) 36 2015 123 (29.8) 146 (35.4) 144 (34.9) 226 (44.5) 202 (39.8) 80 (15.8) 40 2016 126 (25.4) 197 (39.6) 174 (35.0) 270 (42.3) 247 (38.7) 121 (19.0) 43 2017 124 (24.6) 212 (42.0) 169 (33.5) 265 (44.2) 243 (40.6) 91 (15.2) 43
2018 124 (27.6) 165 (36.7) 161 (35.8) 246 (39.4) 255 (40.8) 124 (19.8) 43
2019 92 (21.9) 161 (38.2) 168 (39.9) 204 (37.1) 214 (38.9) 132 (24.0) 43
-- No data available

39
Figure 28: Median time (in minutes) from symptom onset to primary PCI, directly-admitted vs. transfer STEMI cases, 2018
Time from symptom onset to PCI was dramatically shorter for directly-admitted vs
transfer cases (median minutes of 162 vs 199, respectively). This is primarily due to dwell
time in the referral hospitals’ ED, and transfer time to the STEMI-receiving hospital
required for transfer, but not directly-admitted patients. It should be noted that the
number of STEMI cases vary for each measure in the above chart. This is due to different
missing values for each variable used in calculating the measures. There were fewer than
20 cases among STEMI transfer patients for the measures “Symptom onset to EMS
dispatch time” and “EMS dispatch to hospital arrival.” There were more than 20 STEMI
cases for all the other measures.
ACTIVATION OF CATHETERIZATION LAB PRIOR TO ARRIVAL AMONG TRANSFER
PATIENTS
Figure 29 and Table 26 show data on activation of the cardiac catheterization lab prior to
patients’ hospital arrival, known as “pre-cath lab activation”, among STEMI transfer patients
who arrived at the first hospital by personal vehicle or ambulance.
48
37
28 26
34 36
61
32
13
26
0
20
40
60
80
Sym
pto
m o
nset
to E
MS
dis
patc
h
EM
S d
ispatc
h t
ohospital arr
ival
Dw
ell t
ime in r
efe
rral
ED
Tra
nsfe
r tim
e
Dw
ell t
ime in r
ecevin
g
ED
ED
to P
CI
Med
ian
Tim
e (
Min
ute
s)
Direct
Transfer

40
Figure 29: Percentage of pre-catheterization lab activation among STEMI transfer patients
arriving to the first hospital by personal vehicle or ambulance, 2015- 2019
Table 26: Pre-catheterization lab activation among STEMI transfer patients arriving to the
first hospital by personal vehicle or ambulance, 2015-2019
Year
Total STEMI
cases
Pre-Cath lab
activation
No Pre-Cath lab
activation
Missing Reporting
Hospitals
n n (%) n (%) n (%) n
2015 247 125 (50.6) 12 (4.9) 110 (44.5) 26
2016 225 104 (46.2) 8 (3.6) 113 (50.2) 31
2017 205 99 (48.3) 6 (2.9) 100 (48.8) 27
2018 223 102 (45.7) 8 (3.6) 113 (50.7) 31
2019 209 155 (74.2) 17 (8.1) 37 (17.7) 31
For the past four years, pre-cath lab activation has occurred for approximately half to three-
quarters of STEMI transfer patients. In 2019, the catheterization lab was activated prior to
arrival at the STEMI receiving hospital for nearly 3 in 4 (74.2%) cases, and not activated
for 8 in 100 cases (8.1%) of cases (data was missing for 17.7% of cases). Implementing
appropriate protocols for “pre-cath lab activation” at STEMI receiving hospitals for transfer
patients could reduce total ischemic time among these patients and improve outcomes.
50.6
46.2
48.3
45.7
74.2
4.9
3.6
2.9
3.6
8.1
44.5
50.2
48.8
50.7
17.7
0% 10% 20% 30% 40% 50% 60% 70% 80% 90% 100%
2015
2016
2017
2018
2019
Percentage of STEMI Cases
Pre-Cath Lab Activation No Pre-Cath Lab Activation Missing

41
ACTIVATION OF CATHETERIZATION LAB PRIOR TO ARRIVAL AMONG DIRECTLY-
ADMITTED PATIENTS
Figure 30 and Table 27 show data on pre-cath lab activation among directly-admitted STEMI
patients who arrived at the hospital by an ambulance; only cases arriving by ambulance
were included because pre-cath lab activation requires notification by the EMS team.
Figure 30: Pre-catheterization lab activation arrival among directly-admitted STEMI
patients arriving by ambulance, 2015-2019
Table 27: Pre-catheterization lab activation among directly-admitted STEMI patients
arriving by ambulance, 2015-2019
Year
Total STEMI
cases
Pre-Cath lab
activation
No Pre-Cath lab
activation
Missing Reporting
Hospitals
n n (%) n (%) n (%) n
2015 508 282 (55.5) 171 (33.7) 55 (10.8) 37
2016 638 346 (54.2) 168 (26.3) 124 (19.4) 42
2017 599 347 (57.9) 120 (20.0) 132 (22.0) 41
2018 625 344 (55.0) 124 (19.8) 157 (25.1) 41
2019 550 286 (52.0) 752 (30.6) 96 (17.5) 41
55.5
54.2
57.9
55.0
52.0
33.7
26.3
20.0
19.8
30.6
10.8
19.4
22.0
25.1
17.5
0% 10% 20% 30% 40% 50% 60% 70% 80% 90% 100%
2015
2016
2017
2018
2019
Percentage of STEMI Cases
Pre-Cath Lab Activation No Pre-Cath Lab Activation Missing

42
Over the past four years, pre-cath lab activation has occurred for slightly more than half of
directly-admitted STEMI patients arriving by ambulance. In 2019, pre-cath lab activation
occurred for just over half (52.0%), but not for 30.6%, of directly-admitted STEMI patients
arriving by ambulance. Pre-hospital ECG within 10 minutes of FMC and accurate diagnoses
of STEMI cases, when communicated to the STEMI receiving hospital, lead to greater pre-
cath lab activation. Implementing standard protocols for pre-cath lab activation at STEMI
receiving hospitals for patients arriving by ambulance can reduce total ischemic time and
improve outcomes for these patients. Collaborative efforts between EMS providers, nursing
staff, and physicians can increase pre-cath lab activation in Texas.
CARDIAC REHABILITATION REFERRAL AMONG STEMI PATIENTS
A cardiac rehabilitation referral is defined as an official communication between the
healthcare provider and the patient to recommend and carry out a referral order to an
outpatient cardiac-rehabilitation program. As stated in the CDC Cardiac Rehabilitation Facts,
“Comprehensive cardiac rehabilitation has been shown to reduce re-hospitalization rates,
reduce recurrent sudden cardiac death, lessen the need for cardiac medications, and
increase the rate of persons returning to work”. [9] Figure 31 and Table 28 display 2008-
2019 cardiac rehabilitation referrals among STEMI cases at time of discharge; analyses
exclude deceased MI cases (N=2,817).
Figure 31: Cardiac rehabilitation referral among STEMI cases, 2008-2019
Table 28: Cardiac rehabilitation referral among STEMI cases, 2008-2019
No Referral;
4,875; 25%
Referral;
12,779; 64%
Ineligible;
987; 5%
Missing; 1,139;
6%
No Referral
Referral
Ineligible
Missing
Cardiac Rehabilitation Referral
Yes No Ineligible Missing
Reporting
Hospitals
N 12,779 4,875 987 1,139 43
% 64.6 24.7 5.0 5.8
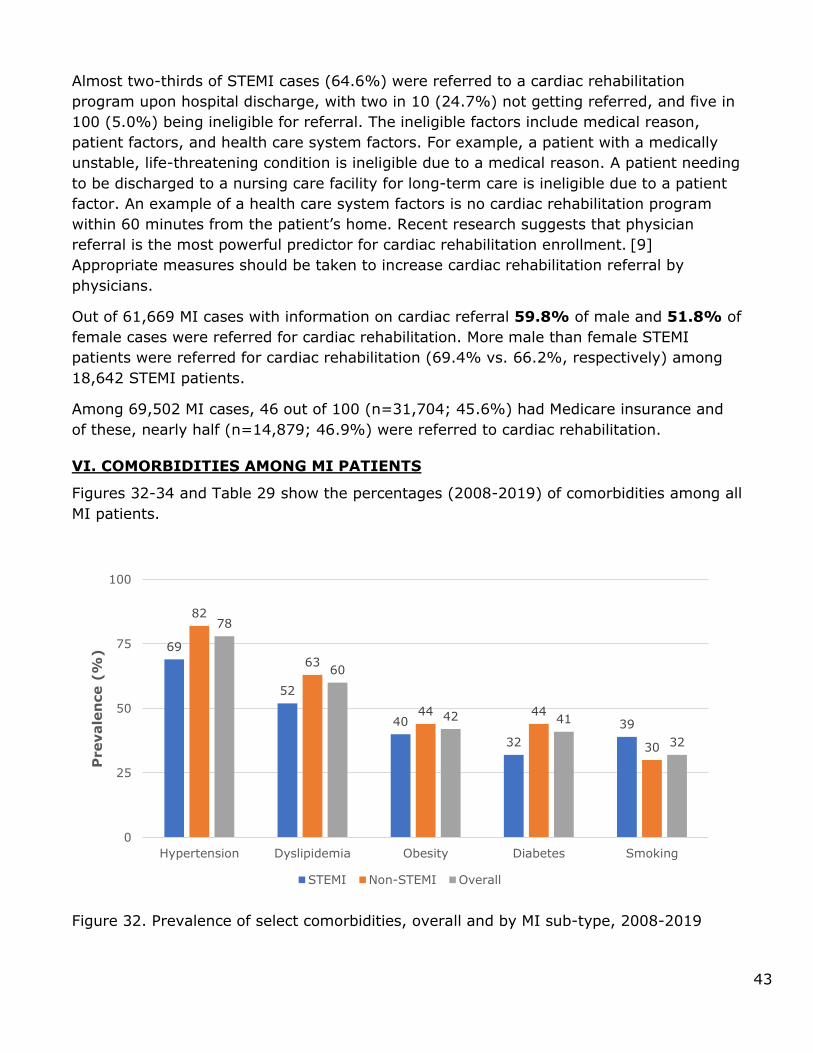
43
Almost two-thirds of STEMI cases (64.6%) were referred to a cardiac rehabilitation
program upon hospital discharge, with two in 10 (24.7%) not getting referred, and five in
100 (5.0%) being ineligible for referral. The ineligible factors include medical reason,
patient factors, and health care system factors. For example, a patient with a medically
unstable, life-threatening condition is ineligible due to a medical reason. A patient needing
to be discharged to a nursing care facility for long-term care is ineligible due to a patient
factor. An example of a health care system factors is no cardiac rehabilitation program
within 60 minutes from the patient’s home. Recent research suggests that physician
referral is the most powerful predictor for cardiac rehabilitation enrollment. [9]
Appropriate measures should be taken to increase cardiac rehabilitation referral by
physicians.
Out of 61,669 MI cases with information on cardiac referral 59.8% of male and 51.8% of
female cases were referred for cardiac rehabilitation. More male than female STEMI
patients were referred for cardiac rehabilitation (69.4% vs. 66.2%, respectively) among
18,642 STEMI patients.
Among 69,502 MI cases, 46 out of 100 (n=31,704; 45.6%) had Medicare insurance and
of these, nearly half (n=14,879; 46.9%) were referred to cardiac rehabilitation.
VI. COMORBIDITIES AMONG MI PATIENTS
Figures 32-34 and Table 29 show the percentages (2008-2019) of comorbidities among all
MI patients.
Figure 32. Prevalence of select comorbidities, overall and by MI sub-type, 2008-2019
69
52
40
32
39
82
63
44 44
30
78
60
42 41
32
0
25
50
75
100
Hypertension Dyslipidemia Obesity Diabetes Smoking
Prevale
nce (
%)
STEMI Non-STEMI Overall

44
Table 29. Prevalence of select comorbidities among MI patients, 2008-2019
Out of 69,502 MI patients, eight in 10 (78.0%) were hypertensive, six in 10 (59.2%) had
dyslipidemia (defined as total cholesterol > 200 mg/dL, low density lipoprotein [LDL] >=
130 mg/dL, or high density lipoprotein [HDL] < 40 mg/dL), four in 10 (42.0%) were
obese or had diabetes (40.6%), three in 10 (32.4%) were current or recent smokers
(within the past year), and almost three in 10 (26.9%) were anemic. Missing values for
each comorbidity were excluded from further analysis. Hypertension is a very common
and important risk factor for MI, and efforts should be taken to reduce the prevalence of
hypertension.
Figure 33. Prevalence of select comorbidities among MI patients, by race and ethnicity
groups, 2008-2019
Comorbidities were examined by race and ethnicity. Of White MI patients, almost eight in
10 (76%) were hypertensive, six in ten (60%) had dyslipidemia, four in 10 (42%) were
obese, one-third (34%) had diabetes or were current / recent smokers (34%), and two in
10 (23%) were anemic. Of Black MI patients, almost nine in 10 (86%) were hypertensive,
75.8
60.2
41.9
34.0 34.1
85.6
56.9
47.0
43.1 41.1
80.2
61.6
44.6
54.9
25.0
69.7
59.6
22.7
42.2
22.6
0
25
50
75
100
Hypertension Dyslipidemia Obese Diabetes Smoking
Prevale
nce (
%)
White Black Hispanic Other
N (%)
Yes No Missing
Hypertension 54,198 (78.0) 15,280 (21.9) 24 (<0.1)
Dyslipidemia 41,173 (59.2) 27,445 (39.5) 884 (1.3)
Obese 29,176 (42.0) 38,822 (55.9) 1,506 (2.2)
Diabetes 28,187 (40.6) 41,273 (59.4) 44 (<0.1)
Smoker 22,532 (32.4) 46,783 (67.3) 187 (0.3)

45
six in 10 (57%) had dyslipidemia, 47% were obese, 43% had diabetes, 41% were current
or recent smokers, and 37% were anemic. Of Hispanic MI patients, three in four (80%)
were hypertensive, six in 10 (62%) had dyslipidemia, five in 10 had diabetes (55%), or
were obese (45%), one in four (25%) were current or recent smokers, and almost three
in 10 (32%) were anemic. Hypertension, obesity, smoking, and anemia were more
prevalent among Black than White or Hispanic cases, while diabetes was more prevalent
among Hispanic than among Black or White cases.
Figure 34. Prevalence of comorbidities among MI patients, by sex, 2008-2019
Comorbidities are more prevalent among female than male MI cases with the exception of
smoking (more common among males), and dyslipidemia (same for either sex).
SMOKING CESSATION ADVICE UPON DISCHARGE AMONG MI PATIENTS
Smoking is a major modifiable risk factor for heart attack. Smoking increases the risk of
atherosclerosis, increases the levels of triglycerides, and decreases the levels of beneficial
high–density lipoprotein cholesterol (HDLc). All of these negatively impact the heart’s blood
flow and can thereby increase the risk of MI. [10] Smoking causes one of every three deaths
from cardiovascular disease. [10] According to the World Health Organization’s Tobacco
Free Initiative, MI patients who quit smoking after an episode of heart attack reduce their
chance of having another heart attack by 50%. [11]
76.0
60.6
41.937.9
35.5
81.7
59.9
44.3
45.4
27.2
0
25
50
75
100
Hypertension Dyslipidemia Obesity Diabetes Smoking
Prevale
nce (
%)
Male Female

46
Figure 35. Smoking cessation advice given upon discharge among MI patients who were current or recent smokers, 2008-2018
From 2008-2018, of the total MI cases reported, almost a third (32.4%) were smokers. At
time of hospital discharge, more than nine in 10 (94.0%) MI patients who reported being
smokers were advised for smoking cessation. Three in 100 (2.7%) were not advised, and
data were missing for 3.3%. Note that this data element was no longer collected in 2019
as most hospitals were performing near 100%.
PRIOR DIABETES TREATMENT UPON ADMISSION AMONG MI PATIENTS
Diabetes mellitus is a major public health problem, affecting an estimated 10.5% of the
US population in 2017, [12] and is related to an increased risk of MI. [13] Studies show
that people with diabetes are not only more likely to have an MI than someone without
diabetes, but are also twice as likely to die from their MI than someone without diabetes.
[14] According to some studies, the renin-angiotensin system is activated in those with
diabetes, and angiotensin II inhibition has proved to be more beneficial at improving
mortality rates after MI in people with vs without diabetes. [14] Along with angiotensin II
antagonists, anti-hyperglycemic therapy may also improve mortality after MI in people
with diabetes. [14]
Figure 36. Diabetes treatment methods upon admission among MI patients, 2008-2018
16,922
94.0%
487
2.7%594
3.3%
Yes
No
Missing
2,865
11.8%
973
4.0%
10,577
43.6%
9,175
37.8%
114
0.5%576
2.4%
No treatment
Diet therapy
Oral hypoglycemic agents
Insulin therapy
Other treatment
Missing

47
Between 2008 and 2018, four in ten MI cases (n=28,187, 40.6%) had a diabetes diagnosis
prior to their MI. Of these, just over one in ten (11.8%) were not on a plan to control their
diabetes; four in 100 (4.0%) were on diet only treatment; four in 10 (43.6%) were on oral
anti-hyperglycemic agents; and almost four in 10 (37.8%) were on insulin therapy. Data
on this measure were missing for 2.4% of cases. In 2019, data collection procedures
changed, and diet therapy and other treatment were no longer collected as measures for
diabetes control. However, in 2019, among patients with diabetes, one-third (33.4%) were
on insulin therapy and half (50.0%) were on oral anti-hyperglycemic agents.
EVALUATION OF TRIGLYCERIDE LEVELS AMONG MI PATIENTS
Hypertriglyceridemia may substantially increase cardiovascular disease risk. [15] It is
recommended that patients with primary hypertriglyceridemia be evaluated for other
cardiovascular risk factors such as central obesity, hypertension, liver dysfunction, and
glucose metabolism abnormalities such as diabetes. [15] Normal triglyceride levels are
below 150 mg/dl; levels between 150 - 199 mg/dl are considered as borderline high; levels
between 200 - 499 mg/dl are considered high; and levels of 500 mg/dl or more are
considered very high.
Figure 37: Triglyceride levels among MI patients, 2008-2019
Between 2008 and 2019, out of 54,481 MI cases with information on triglycerides at episode
of care, six in 10 (62.0%) had triglyceride levels within normal limits (i.e., below 150
mg/dL). Of the remaining cases, sixteen in 100 (15.8%) had triglyceride levels between
150 - 199 mg/dL, twenty in 100 (19.7%) had triglycerides between 200 - 500 mg/dL, and
three in 100 (2.5%) had triglyceride levels of 500 or more.
30,023
62.0%
8,613
15.8%
10,734
19.7%
1,341
2.5%
< 150 mg/dl
150-199
mg/dl200-499
mg/dl≥ 500 mg/dl

48
ASPIRIN ADMINISTERED WITHIN FIRST 24 HOURS OF EITHER FMC OR
HOSPITAL ARRIVAL
Aspirin inhibits the enzyme cyclooxygenase I in the platelets and thereby reduces platelet
aggregation. Daily aspirin therapy for the first five weeks after MI has been well
established to reduce early mortality. [16]
Figure 38: Aspirin administered within 24 hours of either FMC or hospital arrival, by MI type, 2008–2019
Table 30. Aspirin administered within 24 hours of either FMC or hospital arrival, by MI
type, 2008-2019
Aspirin administered with 24 hours of hospital arrival or First Medical Contact N (%)
Cases n Yes
No
Contraindicated
Missing
All MI 69,502 66,000 (95.0) 2,103 (3.0) 1,360 (2.0) 39 (0.1)
STEMI 19,885 19,204 (96.6) 390 (2.0) 279 (1.4) 12 (0.1)
Non-STEMI 49,477 46,690 (94.4) 1,682 (3.4) 1,078 (2.2) 27 (0.1)
Out of 69,502 MI cases reported between 2008 and 2019, almost all (95.0%) were
prescribed aspirin within 24 hours of either FMC or hospital arrival. Only 3.0% did not
receive this therapy, and 2.0% had contraindications to aspirin use. The administration of
aspirin within 24 hours of either FMC or hospital arrival among MI cases did not differ by
sub-type (STEMI or non-STEMI). Out of 19,885 STEMI cases reported from 2008-2019,
aspirin was prescribed within the first 24 hours of either FMC or hospital arrival for 96.6%,
not prescribed for 2.0%, and contraindicated in 1.4%.
3.0 2.0 3.4
95.0 96.6 94.4
2.01.4 2.2
0
25
50
75
100
All MI STEMI non-STEMI
Percen
tag
e(%
)
Contraindicated
Yes
No
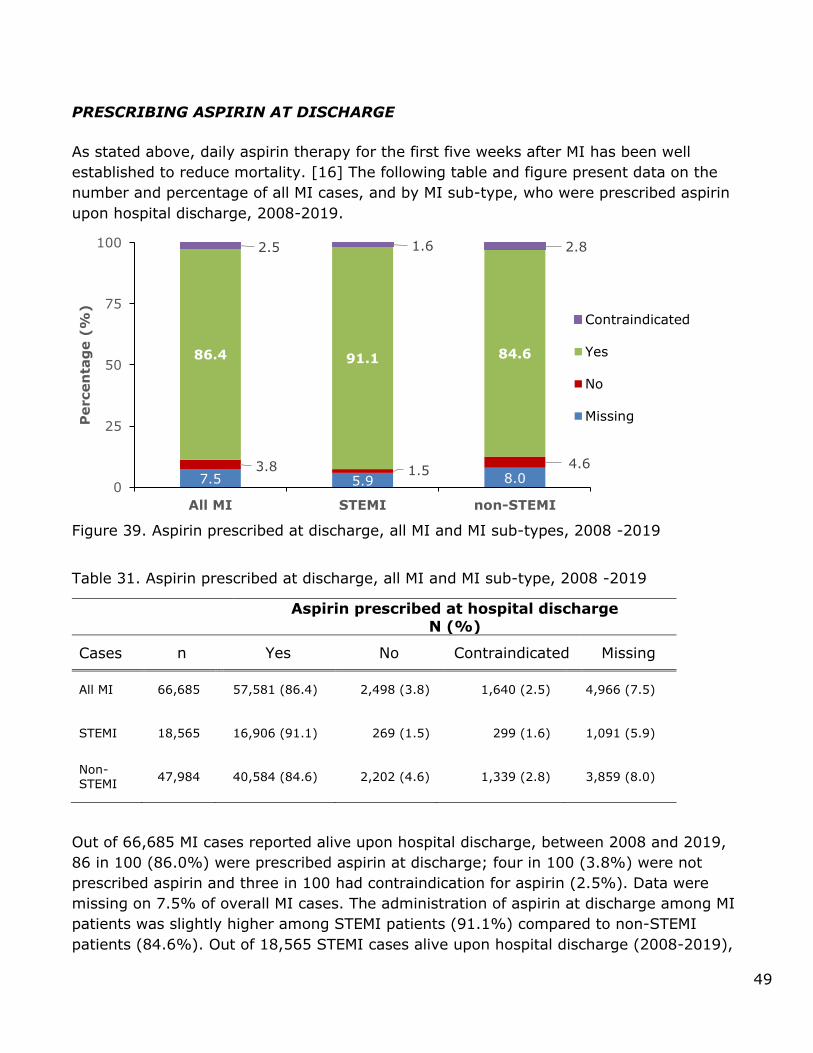
49
PRESCRIBING ASPIRIN AT DISCHARGE
As stated above, daily aspirin therapy for the first five weeks after MI has been well
established to reduce mortality. [16] The following table and figure present data on the
number and percentage of all MI cases, and by MI sub-type, who were prescribed aspirin
upon hospital discharge, 2008-2019.
Figure 39. Aspirin prescribed at discharge, all MI and MI sub-types, 2008 -2019
Table 31. Aspirin prescribed at discharge, all MI and MI sub-type, 2008 -2019
Aspirin prescribed at hospital discharge
N (%)
Cases n Yes No Contraindicated Missing
All MI 66,685 57,581 (86.4) 2,498 (3.8) 1,640 (2.5) 4,966 (7.5)
STEMI 18,565 16,906 (91.1) 269 (1.5) 299 (1.6) 1,091 (5.9)
Non-STEMI
47,984 40,584 (84.6) 2,202 (4.6) 1,339 (2.8) 3,859 (8.0)
Out of 66,685 MI cases reported alive upon hospital discharge, between 2008 and 2019,
86 in 100 (86.0%) were prescribed aspirin at discharge; four in 100 (3.8%) were not
prescribed aspirin and three in 100 had contraindication for aspirin (2.5%). Data were
missing on 7.5% of overall MI cases. The administration of aspirin at discharge among MI
patients was slightly higher among STEMI patients (91.1%) compared to non-STEMI
patients (84.6%). Out of 18,565 STEMI cases alive upon hospital discharge (2008-2019),
7.5 5.9 8.03.8 1.5
4.6
86.4 91.1 84.6
2.5 1.6 2.8
0
25
50
75
100
All MI STEMI non-STEMI
Percen
tag
e(%
)
Contraindicated
Yes
No
Missing

50
nine in 10 (91.1%) were prescribed aspirin at discharge, nearly two in 100 (1.5%) were
not, and two in 100 (1.6%) had contraindications. Data are missing for 5.9% of STEMI
cases.
PRESCRIBING BETA-BLOCKERS AT DISCHARGE
Beta-blockers may reduce mortality in MI patients. [17] These medications effectively
reduce resting and exercise-induced heart rate, blood pressure, and myocardial
contractility, and hence myocardial oxygen demand. They are also associated with fewer
dysrhythmias, limitation of infarct size, and lower incidence of ventricular septal rupture
when given to MI patients. [17]
Figure 40. Beta-blockers prescribed at discharge, all MI and sub-types, 2008 -2019
Table 32. Beta-blockers prescribed at discharge, all MI and sub-types, 2008 -2019
Beta-Blocker prescribed at hospital discharge N (%)
Cases n Yes No Contraindicated Missing
All MI 66,685 54,835 (82.2) 3,196 (4.8) 3,686 (5.5) 4,968 (7.5)
STEMI 18,565 16,078 (86.6) 383 (2.1) 1,012 (5.5) 1,092 (5.9)
Non-STEMI
47,984 38,677 (80.6) 2,778 (5.8) 2,669 (5.6) 3,860 (8.0)
Out of 66,685 cases of MI alive upon hospital discharge, 82 in 100 (82.2%) were
prescribed beta-blockers upon hospital discharge, five in 100 (4.8%) were not prescribed
beta-blockers, and six in 100 (5.5%) had contraindications for beta-blockers. Data on this
measure were missing for 7.5% of cases. Prescribing beta-blockers at discharge among
MI patients was slightly higher for STEMI (86.6%) vs. non-STEMI (80.6%) patients. Out
7.4 5.6 8.22.7
1.93.0
84.2 87.083.0
5.5 5.5 5.6
0
25
50
75
100
All MI STEMI non-STEMI
Percen
tag
e(%
)
Contraindicated
Yes
No
Missing

51
of 18,565 STEMI cases alive at hospital discharge, 86.6% were prescribed beta-blockers
upon hospital discharge, 2.1% were not prescribed beta-blockers, and 5.5% had
contraindications for beta-blockers. Data on this measure were missing values for 5.9% of
cases.
PRESCRIBING STATINS AT DISCHARGE FOR LOW DENSITY LIPOPROTEIN
CHOLESTEROL (LDLc) >= 100 MG/DL
There is strong evidence that statin therapy confers survival benefits for post MI patients.
The literature shows that from 2007 to 2016, there have been improvements in statin
use, adherence and adverse outcomes in patients with cardiovascular disease. During the
same time period, out-of-pocket costs associated with statin use decreased, likely due to
the availability of generic versions. [16].
Figure 41. Statin prescribed at hospital discharge for MI cases with LDLc ≥100 mg/dl,
2008-2019
Table 33. Statin prescribed at hospital discharge for MI cases with LDLc ≥100 mg/dl,
2008-2019
Statin prescribed at hospital discharge
N (%)
Cases n Yes No Contraindicated Missing
All MI 23,911 21,202 (88.7)
786 (3.3)
724 (3.0)
1,199 (5.0)
STEMI 7,904 7,434 (94.1)
94 (1.2)
155 (2.0)
221 (2.8)
Non-STEMI
15,907 13,739 (86.0)
687 (4.3)
568 (3.6)
976 (6.1)
Out of 23,911 reported cases of MI with LDLc ≥ 100 mg/dl alive upon hospital discharge,
89 in 100 (88.7%) were prescribed a statin upon hospital discharge, one in 100 were not
5.0 2.8 6.13.3
1.24.3
88.7 94.1 86.0
3.0 2.0 3.6
0
25
50
75
100
All MI STEMI non-STEMI
Percen
tag
e(%
)
Contraindicated
Yes
No
Missing

52
(1.2%), and three in 100 (2.8%) had a contraindication for statins. Slightly more STEMI
vs. non-STEMI cases were prescribed statins upon hospital discharge. Out of 7,904
reported STEMI cases with LDLc ≥ 100mg/dl, 94.1% were prescribed a statin upon
hospital discharge, 1.2% were not prescribed a statin, and 2.0% had contraindications for
statins.
ACE INHIBITORS OR ARB AT DISCHARGE (EJECTION FRACTION, EF, < 40%)
Many studies have examined the role of Angiotensin converting enzyme (ACE) inhibitors
or Angiotensin II receptor blockers (ARB) in post MI patients with reduced left ventricular
function (decreased left ventricular ejection fraction, LVEF) and have found modest
treatment benefits with these drugs. [15] ACE inhibitors competitively antagonize the
conversion of the enzyme angiotensin I to angiotensin II and hence reduce systemic
vascular resistance and cardiac afterload. [15] These drugs also reduce cardiac preload by
decreasing aldosterone release and hence a reduction of circulating fluid overload. [15]
They have been shown to decrease mortality rates in MI patients, and recent MI patients
with left ventricular (LV) systolic dysfunction, patients with diabetes mellitus and with LV
dysfunction, and also patients with normal LV function. [7] ARBs are prescribed for
patients who have adverse effects with ACE inhibitors.
Figure 42. ACE Inhibitors prescribed at hospital discharge for MI cases with LVEF <40%, 2008-2019
14.6 14.3 14.7
24.415.5
27.6
48.057.9
44.4
12.9 12.2 13.2
0
25
50
75
100
MI STEMI non-STEMI
Percen
tag
e(%
)
Contraindicated
Yes
No
Missing

53
Figure 43. ARB prescribed at hospital discharge for MI cases with LVEF <40%, 2008-2019
Table 34. ACE inhibitor or ARB prescribed at hospital discharge for MI cases with LVEF
<40%, 2008-2019
ACE Inhibitor (ACEI) or ARB prescribed
at hospital discharge
Cases
n
Yes
n (%)
No
n (%)
Contraindicated
n (%)
Missing
n (%)
ACEI ARB ACEI ARB ACEI ARB ACEI ARB ALL MI 17,801 8,549
(48.0) 3,582 (20.1)
4,344 (24.4)
9,693 (54.5)
2,302 (12.9)
1,906 (10.7)
2,606 (14.6)
2,620 (14.7)
STEMI 4,860 2,813 (57.9)
939 (19.3)
755 (15.5)
2,710 (55.8)
595 (12.2)
509 (10.5)
697 (14.3)
702 (14.4)
Non-STEMI
12,890 5,726 (44.4)
2,637 (20.5)
3,563 (27.6)
6,952 (53.9)
1,704 (13.2)
1,395 (10.8)
1,897 (14.7)
1,906 (14.8)
Out of 17,801 reported MI cases with LVEF <40 % who were alive at hospital discharge,
nearly half (48.0%) were prescribed ACE inhibitors upon hospital discharge, 24 in 100
(24.4%) were not prescribed ACE inhibitors, and 13 in 100 (12.9%) had a
contraindication. Data on this measure were missing for 14.6% of cases. The prescription
of ACE inhibitors at discharge among MI cases varied slightly by STEMI or non-STEMI
type, with more STEMI cases being prescribed ACE inhibitors than non-STEMI cases. Out
of 4,860 reported STEMI cases with LVEF <40 %, more than half (57.9%) were prescribed
an ACE inhibitor upon hospital discharge, 16 in 100 (15.5%) were not prescribed an ACE
inhibitor, and 12 in 100 (12.2%) had a contraindication for ACE inhibitors. Data on this
measure were missing for 14.3% of cases.
At time of hospital discharge, ARBs were prescribed to 20 in 100 (20.1%) of the 17,801
MI cases with LVEF <40%, and to nine in 100 (8.5%) of the STEMI cases. The
prescription of ARBs at discharge among MI cases was similar by STEMI or non-STEMI
type, with ARBs prescribed with similar frequency to non-STEMI than to STEMI cases
14.7 14.4 15.1
54.555.8
53.9
20.1 19.3 20.5
10.7 10.5 10.8
0
25
50
75
100
MI STEMI non-STEMI
Percen
tag
e(%
)
Contraindicated
Yes
No
Missing

54
(20.5% and 19.3%, respectively). Combined together, 68 in 100 (68.1%) of all MI cases,
including 77 in 100 (77.2%) STEMI cases and 65 in 100 (64.9%) non-STEMI cases, were
prescribed any treatment for reduced left ventricular function at discharge.
TOTAL LIPID ASSESSMENT
Figure 44: Total lipid assessment among MI patients, 2008-2019
Of the 69,502 reported MI cases between 2008 and 2019, eight in ten (79.8%) had a lipid
(total lipids and LDLc) panel assessment, but this was not performed in the remaining
20.2%. Among STEMI cases reported over the same period, lipid assessment was done in
a similar number of patients (82.9%).
VII. UNADJUSTED IN-HOSPITAL MORTALITY RATES
The table and figure shown below display the unadjusted in-hospital mortality rates for MI
cases (overall and by sub-type), between 2008 and 2019. Out of the 69,502 MIs reported,
more than nine in 10 (96.0%) were alive upon hospital discharge.
Figure 45. Unadjusted in-hospital mortality rates among STEMI, non-STEMI and all MI
cases, 2008-2019
n=55,457;
79.8%
n=14,006;
20.2%
n=41; 0.1%
Performed
Not
Performed
5.2 5.4 5.55.8
6.87.4
6.4 6.3 6.2
6.9 7.0 7.1
0.0
2.0
3.83.2
3.5 3.5 3.4 3.22.9 3.1
2.8
1.8
2.73.2
4.44.1
4.54.8
4.3 4.1 3.94.3 4.1
3.0
0
1
2
3
4
5
6
7
8
2008 2009 2010 2011 2012 2013 2014 2015 2016 2017 2018 2019
Percen
tag
e (
%)
YEAR
Unadjusted Mortality Rates (STEMI) Unadjusted Mortality Rates (non-STEMI)
Unadjusted Mortality Rates (All MI)

55
Table 35. Unadjusted in-hospital mortality rates among STEMI, non-STEMI and all MI cases, 2008 – 2019
The in-hospital mortality rates range from a low of 5.2% in 2008 to a high of 7.4% in
2013 among STEMI patients. Rates then declined slowly each year until 2016, and have
increased annually since then. Among non-STEMI patients, the mortality rates range from
a low of 0% in 2008 to a high of 3.8% in 2010, with a general downward trend since then.
Across all years, twice as many STEMI than non-STEMI cases died during their episode of
care: nearly seven in 100 STEMI cases (6.6%) as compared with three in 100 non-STEMI
cases (3.0%). Note: Care should be taken when interpreting rates from 2008, which are
reported only from the fourth quarter.
Year STEMI
In-
hospital deaths
Non-
STEMI
In-
hospital deaths
All MI
In-
hospital deaths
n n (%) n n (%) n n
(%)
2008 58 3 (5.2) 54 0 (0.0) 112 3 (2.7)
2009 294 16 (5.4) 513 10 (2.0) 807 26 (3.2)
2010 1,007 55 (5.5) 1,880 71 (3.8) 2,887 126 (4.4)
2011 1,566 91 (5.8) 2,916 93 (3.2) 4,482 184 (4.1)
2012 1,776 120 (6.8) 3,880 134 (3.5) 5,656 254 (4.5)
2013 2,019 149 (7.4) 4,212 148 (3.5) 6,231 297 (4.8)
2014 2,171 139 (6.4) 4,862 164 (3.4) 7,033 303 (4.3)
2015 2,368 148 (6.3) 5,241 165 (3.2) 7,609 313 (4.1)
2016 2,651 164 (6.2) 5,874 169 (2.9) 8,525 333 (3.9)
2017 2,579 179 (6.9) 5,692 176 (3.1) 8,271 355 (4.3)
2018 2,584 180 (7.0) 5,876 164 (2.8) 8,460 344 (4.1)
2019 2,110 150 (7.1) 7,319 129 (1.8) 9,429 279 (3.0)

56
VIII. APPENDIX – DATA SOURCES AND DEFINITIONS
Glossary
• First hospital refers to the facility where a patient is initially seen.
• STEMI referral hospital refers to a facility where a patient is initially seen and from which the patient is transferred to a STEMI receiving facility. All STEMI referral hospitals are considered first hospitals.
• STEMI receiving hospital refers to a facility to which a patient is transferred after being initially seen at a non-PCI-capable hospital or STEMI referral hospital.
• Directly-admitted patient refers to a STEMI patient first presents to a STEMI receiving hospital or PCI-capable hospital, bypassing a STEMI referral hospital.
• Transfer patient refers to a STEMI patient who first presents at a STEMI referral
hospital and requires transfer to a STEMI receiving hospital.
Table 1
Data Source: Texas Behavioral Risk Factor Surveillance System Public Use Data File, 2011-18. Texas Department of State Health Services, Center for Health Statistics, Austin, Texas.
Table 2
Data Sources: Texas Hospital Inpatient Discharge Public Use Data File, 2008-18. Texas Department of State Health Services, Center for Health Statistics, Austin, Texas; and
County-Level Population Data, 2008-18. Texas Department of State Health Services, Center for Health Statistics, Austin, Texas.
Prior to September 2015, hospitalization rates were based on hospital records for which
acute myocardial infarction was coded as the principal diagnosis, using International Classification of Diseases, Ninth Revision, Clinical Modification (ICD-9-CM) codes 410.00-
410.01, 410.10-410.11, 410.20-410.21, 410.30-410.31, 410.40-410.41, 410-.50-410.51, 410.60-410.61, 410.70-410.71, 410.80-410.81, 410.90-410.91, a classification defined in
the Specifications Manual for National Hospital Inpatient Quality Measures. Records from September 2015 forward are based on ICD-10 codes I21-22. Excludes records for HIV and drug/alcohol use patients and non-residents hospitalized in-state. Population estimates
were generated using the 2000 Projected U.S. Standard Population for age-adjustment and the following age-adjustment groups: 0-4, 5-9, 10-14, 15-34, 35-64, 65+.
Figure 1
Data Sources: County-Level Mortality Data, 2010-17. Texas Department of State Health Services, Center for Health Statistics, Austin, Texas; and County-Level Population Data,
2009-17. Texas Department of State Health Services, Center for Health Statistics, Austin, Texas.
Mortality rates were based on death records for which heart attack was coded as the underlying cause of death, using International Classification of Diseases, Tenth Revision (ICD-10) codes I21-I22; and generated using the 2000 U.S. Standard Population for age-
adjustment and the following age-adjustment groups: 0, 1-4, 5-14, 15-24, 25-34, 35-44, 45-54, 55-64, 65-74,75+

57
Figure 2
Source: Bates, E.R. and Jacobs, A.K. (2013). Time to treatment in patients with STEMI. The
New England Journal of Medicine, 369 (10), 889-892.
PRE-HOSPITAL ECG WITHIN 10 MINUTES OF FIRST MEDICAL CONTACT
Definition
Time to pre-hospital ECG was estimated by measuring the time elapsed from first medical contact (when the patient was first evaluated by either emergency medical services or another healthcare provider prior to arrival at the hospital) to receipt of first ECG among
patients arriving at the hospital by ambulance and receiving their first ECG prior to arrival
at the hospital.
Population excludes patients:
• <18 years old • Arriving at STEMI receiving hospital via personal vehicle, mobile ICU, or air • Received as transfer from STEMI referral hospital to STEMI receiving hospital
• Receiving first ECG after arrival at STEMI receiving hospital • Receiving first ECG>24 hours after first medical contact
• With incomplete records—i.e., records with missing data for any variable used to define the population
TIME FROM HOSPITAL ARRIVAL TO FIRST ECG AMONG TRANSFER CASES
Definition
Time to ECG was estimated by measuring the time elapsed from arrival at a STEMI referral
hospital to receipt of first ECG. Thus, for episodes of care involving patients received as transfers at the STEMI receiving hospital, the date and time of arrival at the STEMI referral
hospital, as documented by the STEMI receiving hospital, was used to clock time to ECG.
Population excludes patients:
• <18 years old • Arriving at STEMI referral hospital via mobile ICU or air
• Directly admitted to STEMI receiving hospital • Receiving first ECG before arrival at STEMI referral hospital, e.g., while in transit in
an ambulance • Receiving first ECG>24 hours after arrival at STEMI referral hospital • With incomplete records—i.e., records with missing data for any variable used to
define the population
TIME FROM HOSPITAL ARRIVAL TO FIRST ECG AMONG DIRECTLY-ADMITTED
CASES
Definition
Time to ECG was estimated by measuring the time elapsed from arrival at the STEMI
receiving hospital to receipt of first ECG.
Population excludes patients:
• <18 years old
58
• Arriving at STEMI receiving hospital via mobile ICU or air • Received as transfer from STEMI referral hospital to STEMI receiving hospital
• Receiving first ECG before arrival at STEMI receiving hospital, e.g., while in transit in an ambulance
• Receiving first ECG>24 hours after arrival at STEMI receiving hospital • With incomplete records—i.e., records with missing data for any variable used to
define the population
HOSPITAL ECG WITHIN 10 MINUTES OF ARRIVAL AMONG TRANSFER CASES
Definition
Time to ECG was estimated by measuring the time elapsed from arrival at the STEMI referral hospital to receipt of first ECG. Thus, for episodes of care involving patients received as transfers at a STEMI receiving hospital, the date and time of arrival at the transferring
hospital, as documented by the STEMI receiving hospital, was used to clock time to ECG.
Population excludes patients:
• <18 years old • Arriving at STEMI referral hospital via mobile ICU or air • Directly admitted to STEMI receiving hospital
• Receiving first ECG before arrival at STEMI referral hospital, e.g., while in transit in an ambulance
• Receiving first ECG>24 hours after arrival at STEMI referral hospital • With incomplete records—i.e., records with missing data for any variable used to
define the population
HOSPITAL ECG WITHIN 10 MINUTES OF ARRIVAL AMONG DIRECTLY-ADMITTED CASES
Definition
Time to ECG was estimated by measuring the time elapsed from arrival at the STEMI
receiving hospital to receipt of first ECG.
Population excludes patients:
• <18 years old • Arriving at STEMI receiving hospital via mobile ICU or air • Received as transfer from STEMI referral hospital to STEMI receiving hospital
• Receiving first ECG before arrival at STEMI receiving hospital, e.g., while in transit in an ambulance
• Receiving first ECG>24 hours after arrival at STEMI receiving hospital • With incomplete records—i.e., records with missing data for any variable used to
define the population
DWELL TIME IN THE EMERGENCY DEPARTMENT OF REFERRAL HOSPITAL
Definition
Dwell time in the emergency department was estimated by measuring the time elapsed
from arrival at the STEMI referral hospital to discharge at the STEMI referral hospital.
Population excludes patients:
• <18 years old

59
• Diagnosed with non-STEMI heart attack • Arriving at STEMI referral hospital via mobile ICU or air
• Directly admitted to STEMI receiving hospital • Not first evaluated in the emergency department of STEMI referral hospital
• Not discharged and transferred to another hospital for PCI • Transferred >24 hours after arrival at STEMI referral hospital • With incomplete records—i.e., records with missing data for any variable used to
define the population
DWELL TIME IN THE EMERGENCY DEPARTMENT OF RECEIVING HOSPITAL AMONG
TRANSFER CASES
Definition
Time spent in the emergency department was estimated by measuring the time elapsed
from arrival at the STEMI receiving hospital to transfer out of the emergency department of the STEMI receiving hospital. Thus, for episodes of care involving patients received as
transfers at the STEMI receiving hospital, the time elapsed reflects wait time at the subsequent hospital and not at the STEMI referral hospital.
Population excludes patients:
• <18 years old • Diagnosed with non-STEMI heart attack
• Diagnosed with STEMI heart attack on subsequent ECG • Arriving at STEMI referral hospital via mobile ICU or air
• Directly admitted to STEMI receiving hospital • Not first evaluated in the emergency department of STEMI receiving hospital • Spending >24 hours in the emergency department of STEMI receiving hospital
• With incomplete records—i.e., records with missing data for any variable used to define the population
DWELL TIME IN THE EMERGENCY DEPARTMENT OF RECEIVING HOSPITAL AMONG DIRECTLY-ADMITTED CASES
Definition
Time spent in the emergency department was estimated by measuring the time elapsed from arrival at the STEMI receiving hospital to transfer out of the emergency department
of the STEMI receiving hospital.
Population excludes patients:
• <18 years old • Diagnosed with non-STEMI heart attack
• Diagnosed with STEMI heart attack on subsequent ECG • Arriving at STEMI receiving hospital via mobile ICU or air • Received as transfer from STEMI referral hospital to STEMI receiving hospital
• Not first evaluated in the emergency department of STEMI receiving hospital • Spending >24 hours in the emergency department of STEMI receiving hospital
• With incomplete records—i.e., records with missing data for any variable used to define the population

60
FIRST DOOR-TO-NEEDLE TIME
Definition
Door to needle time was estimated by measuring the time elapsed from arrival at the STEMI
referral hospital to receipt of fibrinolytic therapy at the STEMI referral hospital. For episodes of care involving patients received as transfers at the STEMI receiving hospital, the date and time of arrival at the STEMI referral hospital, as documented by the STEMI receiving
hospital, was used to clock door to needle time.
Population excludes patients:
• <18 years old • Diagnosed with non-STEMI heart attack • Diagnosed with STEMI heart attack on subsequent ECG
• Arriving at STEMI referral hospital via mobile ICU or air • Directly admitted to STEMI receiving hospital
• Receiving percutaneous coronary intervention for reperfusion therapy • With a non-system reason for delay of fibrinolysis • Receiving fibrinolysis >6 hours after arrival at STEMI referral hospital
• With incomplete records—i.e., records with missing data for any variable used to define the population
DOOR-TO-NEEDLE TIME WITHIN 30 MINUTES AMONG TRANSFER CASES
Definition
Door to needle time was estimated by measuring the time elapsed from arrival at the STEMI referral hospital to receipt of fibrinolytic therapy at the STEMI referral hospital. For episodes of care involving patients received as transfers at the STEMI receiving hospital, the date
and time of arrival at the STEMI referral hospital, as documented by the STEMI receiving hospital, was used to clock door to needle time.
Population excludes patients:
• <18 years old
• Diagnosed with non-STEMI heart attack • Diagnosed with STEMI heart attack on subsequent ECG • Arriving at STEMI referral hospital via mobile ICU or air
• Directly admitted to STEMI receiving hospital • Receiving percutaneous coronary intervention for reperfusion therapy
• With a non-system reason for delay of fibrinolysis • Receiving fibrinolysis >6 hours after arrival at STEMI referral hospital
• With incomplete records—i.e., records with missing data for any variable used to define the population
DOOR-TO-BALLOON TIME FOR DIRECTLY-ADMITTED CASES
Definition
Door to balloon time was estimated by measuring the time elapsed from arrival at the
hospital to receipt of primary percutaneous coronary intervention.
Population excludes patients:

61
• <18 years old • Diagnosed with non-STEMI heart attack
• Diagnosed with STEMI heart attack on subsequent ECG • Arriving at STEMI receiving hospital via mobile ICU or air
• Received as transfer from STEMI referral hospital to STEMI receiving hospital • Not receiving percutaneous coronary intervention as primary reperfusion therapy • With a non-system reason for delay of percutaneous coronary intervention
• Receiving percutaneous coronary intervention >24 hours after arrival at STEMI receiving hospital
• With incomplete records—i.e., records with missing data for any variable used to define the population
DOOR-TO-BALLOON TIME WITHIN 90 MINUTES FOR DIRECTLY-ADMITTED CASES
Definition
Door to balloon time was estimated by measuring the time elapsed from arrival at the STEMI
receiving hospital to receipt of primary percutaneous coronary intervention.
Population excludes patients:
• <18 years old
• Diagnosed with non-STEMI heart attack • Diagnosed with STEMI heart attack on subsequent ECG • Arriving at STEMI receiving hospital via mobile ICU or air
• Received as transfer from STEMI referral hospital to STEMI receiving hospital • Not receiving percutaneous coronary intervention as primary reperfusion therapy
• With a non-system reason for delay of percutaneous coronary intervention • Receiving percutaneous coronary intervention >24 hours after hospital arrival at
STEMI receiving hospital
• With incomplete records—i.e., records with missing data for any variable used to define the population
FIRST DOOR-TO-BALLOON TIME FOR TRANSFER CASES
Definition
Time from first door to balloon was estimated by measuring the time elapsed from arrival
at the STEMI referral hospital to receipt of primary percutaneous coronary intervention at the STEMI receiving hospital. For episodes of care involving patients received as transfers
at the STEMI receiving hospital, the date and time of arrival at the STEMI referral hospital, as documented by the STEMI receiving hospital, was used to clock first door to balloon time.
Population excludes patients:
• <18 years old
• Diagnosed with non-STEMI heart attack • Diagnosed with STEMI heart attack on subsequent ECG • Arriving at STEMI referral hospital via mobile ICU or air
• Directly admitted to STEMI receiving hospital • Not receiving percutaneous coronary intervention as primary reperfusion therapy
• With a non-system reason for delay of percutaneous coronary intervention • Receiving percutaneous coronary intervention >24 hours after arrival at STEMI
referral hospital

62
• With incomplete records—i.e., records with missing data for any variable used to define the population
FIRST DOOR-TO-BALLOON TIME WITHIN 120 MINUTES FOR TRANSFER CASES
Definition
Time from first door to balloon was estimated by measuring the time elapsed from arrival at the STEMI referral hospital to receipt of primary percutaneous coronary intervention at the STEMI receiving hospital. For episodes of care involving patients received as transfers
at the STEMI receiving hospital, the date and time of arrival at the STEMI referral hospital,
as documented by the STEMI receiving hospital, was used to clock first door to balloon time.
Population excludes patients:
• <18 years old • Diagnosed with non-STEMI heart attack
• Diagnosed with STEMI heart attack on subsequent ECG • Arriving at STEMI referral hospital via mobile ICU or air • Directly admitted to STEMI receiving hospital
• Not receiving percutaneous coronary intervention as primary reperfusion therapy • With a non-system reason for delay of percutaneous coronary intervention
• Receiving percutaneous coronary intervention >24 hours after arrival at STEMI referral hospital
• With incomplete records – i.e., records with missing data for any variable used to
define the population.
FIRST DOOR-TO-BALLOON TIME WITHIN 90 MINUTES FOR TRANSFER CASES
Definition
Time from first door to balloon was estimated by measuring the time elapsed from arrival at the STEMI referral hospital to receipt of primary percutaneous coronary intervention at
the STEMI receiving hospital.
Population excludes patients:
• <18 years old
• Diagnosed with non-STEMI heart attack • Diagnosed with STEMI heart attack on subsequent ECG • Arriving at STEMI referral hospital via mobile ICU or air
• Directly admitted to STEMI receiving hospital • Not receiving percutaneous coronary intervention as primary reperfusion therapy
• With a non-system reason for delay of percutaneous coronary intervention • Receiving percutaneous coronary intervention >24 hours after arrival at STEMI
referral hospital • With incomplete records – i.e., records with missing data for any variable used to
define the population.
FIRST MEDICAL CONTACT TO BALLOON TIME
Definition
Time from the first medical contact by EMS to the primary percutaneous coronary intervention in both transfer and directly admitted patients is referred as first medical contact to balloon time.

63
Population excludes patients:
• <18 years old
• Diagnosed with non-STEMI heart attack • Diagnosed with STEMI heart attack on subsequent ECG • Arriving at STEMI referral hospital via mobile ICU or air
• Not receiving percutaneous coronary intervention as primary reperfusion therapy • With a non-system reason for delay of percutaneous coronary intervention
• Receiving percutaneous coronary intervention >24 hours after arrival at STEMI referral hospital
• With incomplete records – i.e., records with missing data for any variable used to
define the population.
TOTAL ISCHEMIC TIME AMONG STEMI TRANSFER CASES
Definition
Ischemic Time was estimated by measuring the time from symptom onset to receipt of
primary percutaneous coronary intervention at the STEMI receiving hospital.
Population excludes patients:
• <18 years old
• Diagnosed with non-STEMI heart attack • Diagnosed with STEMI heart attack on subsequent ECG
• Arriving at STEMI receiving hospital via mobile ICU or air • Directly admitted to STEMI receiving hospital • Not receiving percutaneous coronary intervention as primary reperfusion therapy
• With a non-system reason for delay of percutaneous coronary intervention • Receiving percutaneous coronary intervention >24 hours after hospital arrival at
STEMI receiving hospital • With incomplete records—i.e., records with missing data for any variable used to
define the population
TOTAL ISCHEMIC TIME AMONG STEMI DIRECTLY-ADMITTED CASES
Definition
Ischemic Time was estimated by measuring the time from symptom onset to receipt of primary percutaneous coronary intervention at the STEMI receiving hospital.
Population excludes patients:
• <18 years old • Diagnosed with non-STEMI heart attack
• Diagnosed with STEMI heart attack on subsequent ECG • Arriving at STEMI receiving hospital via mobile ICU or air • Not receiving percutaneous coronary intervention as primary reperfusion therapy
• With a non-system reason for delay of percutaneous coronary intervention • Received as transfer from STEMI referral hospital to STEMI receiving hospital
• Receiving percutaneous coronary intervention >24 hours after hospital arrival at STEMI receiving hospital
64
• With incomplete records—i.e., records with missing data for any variable used to define the population
MEDIAN TIMES FROM SYMPTOM ONSET TO PRIMARY PCI IN DIRECTLY-ADMITTED AND TRANSFER STEMI CASES
Definition
The median times from the symptom onset to the primary percutaneous coronary intervention in both transfer and directly admitted patients are calculated.
Population excludes patients:
• <18 years old • Diagnosed with non-STEMI heart attack • Diagnosed with STEMI heart attack on subsequent ECG
• Arriving at STEMI referral hospital via mobile ICU or air • Not receiving percutaneous coronary intervention as primary reperfusion therapy
• With a non-system reason for delay of percutaneous coronary intervention • Receiving percutaneous coronary intervention >24 hours after arrival at STEMI
referral hospital
• With incomplete records – i.e., records with missing data for any variable used to define the population.
ACTIVATION OF CATHETERIZATION LAB PRIOR TO ARRIVAL AMONG TRANSFER CASES
Definition
Prehospital activation of the cardiac catheterization lab prior to arrival of transfer patients.
Population excludes patients:
• <18 years old • Diagnosed with non-STEMI heart attack • Directly-admitted to STEMI receiving hospital
• Diagnosed with STEMI heart attack on subsequent ECG • Arriving at STEMI receiving hospital via mobile ICU or air
• Not receiving percutaneous coronary intervention as primary reperfusion therapy • With a non-system reason for delay of percutaneous coronary intervention
ACTIVATION OF CATHETERIZATION LAB PRIOR TO ARRIVAL AMONG DIRECTLY-
ADMITTED CASES
Definition
Prehospital activation of the cardiac catheterization lab prior to arrival of directly-admitted patients. Prehospital EKG identifies STEMI patients and assists in cardiac lab activation prior
to arrival of the patients at the hospital.
Population excludes patients:
• <18 years old
• Diagnosed with non-STEMI heart attack • Directly-admitted to STEMI receiving hospital
• Diagnosed with STEMI heart attack on subsequent ECG • Arriving at STEMI receiving hospital via mobile ICU or air

65
• Received as transfer from STEMI referral hospital to STEMI receiving hospital • Not receiving percutaneous coronary intervention as primary reperfusion therapy
• With a non-system reason for delay of percutaneous coronary intervention
CARDIAC REHABILITATION REFERRAL
Definition
A referral is defined as an official communication between the healthcare provider and the patient to recommend and carry out a referral order to an outpatient cardiac rehabilitation
program. Many people with heart disease can benefit from cardiac rehabilitation. The purpose of cardiac rehabilitation is to reduce morbidity and mortality associated with
cardiovascular illness by modifying the patient’s coronary risk factors.
Population excludes patients:
• <18 years old
• With incomplete records—i.e., records with missing data for any variable used to define the population
• Deceased at discharge • Diagnosed with non-STEMI heart attack
COMORBIDITIES AMONG MI CASES
Definition
The simultaneous presence of two chronic diseases or conditions in a patient. For example,
the simultaneous presence of hypertension or diabetes or obesity or dyslipidemia or smoking history in a heart attack patient. According to the World Health Organization (WHO)
definition, anemia is defined as a hemoglobin value <12g/dl in women and <13g/dl in men.
Population excludes patients:
• <18 years old
• With incomplete records – i.e., records with missing data for comorbidities.
SMOKING CESSATION ADVICE UPON DISCHARGE
Definition
Smoking cessation advice or counseling given during discharge among patients who smoked cigarettes any time in the year prior to hospital arrival.
Population excludes patients:
• <18 years old
• Not reporting cigarette smoking at any time in the year prior to hospital arrival • Deceased at discharge
PRIOR DIABETES TREATMENT UPON ADMISSION
Definition
Prior anti-diabetic treatment for admitted diabetes patients of Acute Myocardial Infarction.
The treatment includes diet therapy, insulin therapy or any other oral hypoglycemic drugs.
Population excludes patients:
• <18 years old

66
EVALUATION OF TRIGLYCERIDE LEVELS AMONG MI CASES
Population excludes patients:
• <18 years old
ASPIRIN ADMINISTERED WITHIN FIRST 24 HOURS
Population excludes patients:
• <18 years old
ASPIRIN AT DISCHARGE
Population excludes patients:
• <18 years old
BETA-BLOCKERS AT DISCHARGE
Population excludes patients:
• <18 years old
STATIN AT DISCHARGE FOR LDL >= 100 MG/DL
Population excludes patients:
• <18 years old • With LDL < 100 mg/dl
ACE INHIBITORS OR ARB AT DISCHARGE (LVEF <40%)
Population excludes patients:
• <18 years old
• With LVEF ≥ 40%
67
References
[1] American Heart Association, "About Heart Attacks," 2016. [Online]. Available:
www.heart.org/HEARTORG/Conditions/HeartAttack/AboutHeartAttacks/About-
Heart_attacks_UCM_002038_Article.jsp.. [Accessed 2018].
[2] American Hospital Association, Annual Survey Database, FY 2017.
[3] E.R. Jacobs and A.K. Bates, "Time to Treatment in Patients with STEMI," NEJM, vol.
369, no. 10, pp. 889-892, 2013.
[4] P. T. O'Gara, F. G. Kushner, D. D. Ascheim and et al., "ACCF/AHA Guideline for the
Management of ST-Elevation Myocardial Infarction: Executive Summary,"
Circulation, vol. 127, no. 4, pp. 529-555, 2013.
[5] American Heart Association, "Recommendations for criteria for STEMI systems of
care," 2018. [Online]. Available:
www.heart.org/HEARTORG/HealthcareResearch/MissionLifelineHomePage/EMS/Reco
mmendations-for-Criteria-for_STEMI-Systems-of-Care_UCM_312070_Atricle.jsp..
[Accessed July 2018].
[6] E.L. Fosbol, C.B. Granger, J.G. Jollis and et al., "The impact of a statewide pre-
hospital STEMI strategy to bypass hospitals without percutaneous coronary
intervention capability on treatment times," Circulation, vol. 127, no. 5, pp. 604-
612, 2013.
[7] J. L. Anderson, C. D. Adams, E. M. Antman and et al., "2011 ACCF/AHA Focused
Update Incorporated into the ACC/AHA 2007 Guidelines for the Management of
Patients with Unstable Angina/Non-ST-Elevation Myocardial Infarction," Circulation,
vol. 123, pp. e426-e579, 2011.
[8] A. Solhpour, K. W. Chang, S. A. Arain and et al., "Ischemic Time is a Better
Predictor than Door-to-Balloon Time for Mortality and Infarct Size in ST-Elevation
Myocardial Infarction," Cathether Cardiovasc Interv, vol. 87, no. 7, pp. 1194-1200,
2016.
[9] Centers for Disease Control and Prevention, "State Heart Disease abd Stroke
Prevention Program Addresses Cardiac Rehabilitation," 2014. [Online]. Available:
https://www.cdc.gov/dhdsp/data_statistics/fact_sheets/fx_state_cardiacrehab.htm.
[Accessed Oct 2018].
[10] Centers for Disease Control and Prevention, "Smoking and Heart Disease and
Stroke," 2018. [Online]. Available:

68
https://www.cdc.gov/tobacco/campaign/tips/diseases/heart-disease-stroke.html.
[Accessed Oct 2018].
[11] World Health Organization, "Tobacco Free Initiative (TFI)," [Online]. Available:
http://www.who.int/tobacco/quitting/benefits/en/. [Accessed Oct 2018].
[12] Centers for Disease Control and Prevention, National Center for Chronic Disease
Prevention and Health Promotion, Division of Population Health. BRFSS Prevalence
& Trends Data [online]. [accessed Jul 29, 2019]. URL:
https://www.cdc.gov/brfss/brfssprevalence/
[13] T. M. Oleon and B. M. Maddox, "Diabetes and Cardiovascular Disease:
Epidemiology, biological mechanisms, treatment recommendations and future
research," World J Diabetes, vol. 6, no. 13, pp. 1246-1258, 2015.
[14] M. Luo, X. Guan, E. D. Luczak and et al., "Diabetes Increases Mortality after
Myocardial Infarction by Oxidizing CaMKII," J Clin Invest, vol. 123, no. 3, pp. 1262-
1274, 2013.
[15] L. Berglund, J. Brunzell, A. Goldberg and et al., "Evaluation and Treatment of
Hypertriglyceridemia: An Endocrine Society clinical practice guideline," J Clin
Endocrinol Metab, vol. 97, pp. 2969-2989, 2012.
[16] X. Yao, N.D. Shah, B.J. Gersh and et al., "Assessment of trends in statin therapy for
secondary prevention of atherosclerotic cardiovascular disease in US adults from
2007 to 2016." JAMA network open, vol. 3, no. 11, pp. e2025505-e2025505, 2020.
[17] S. Maxwell and W.S. Waring, "Drugs used in Secondary Prevention after
Myocardial Infarction: Case presentation," Br J Clin Pharmacol, vol. 50, no.
5, pp. 405-417, 2000.