2020 income limits - maryland
TRANSCRIPT
1
For informational purposes:
Calculations for 5%, 10%, 15%, 20%, 25% available upon request
Limits less <= 65% are based on 50% limits, =>70% are based on 80% limits.
For properties that have Low Income Tax Housing Tax Credits (LIHTC) included please refer to Low Income Housing Tax Credit Limits Source: DHCD – Housing Economic Research Office, U.S. Department of HUD
2020 INCOME LIMITS
DEPARTMENT OF HOUSING AND COMMUNITY DEVELOPMENT
HOUSING AND ECONOMIC RESEARCH OFFICE
7800 HARKINS ROAD
LANHAM, MD 20706
2
For informational purposes:
Calculations for 5%, 10%, 15%, 20%, 25% available upon request
Limits less <= 65% are based on 50% limits, =>70% are based on 80% limits.
For properties that have Low Income Tax Housing Tax Credits (LIHTC) included please refer to Low Income Housing Tax Credit Limits Source: DHCD – Housing Economic Research Office, U.S. Department of HUD
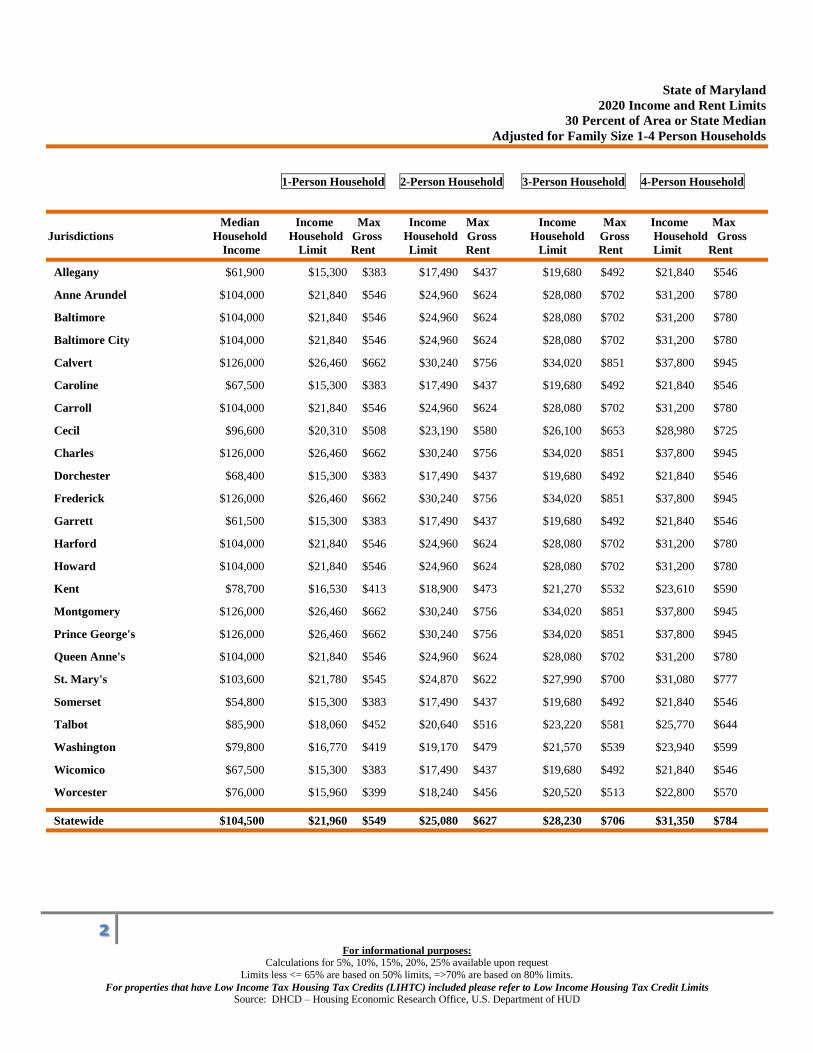
State of Maryland
2020 Income and Rent Limits
30 Percent of Area or State Median
Adjusted for Family Size 1-4 Person Households
1-Person Household 2-Person Household 3-Person Household 4-Person Household
Median Income Max Income Max Income Max Income Max
Jurisdictions Household Household Gross Household Gross Household Gross Household Gross
Income Limit Rent Limit Rent Limit Rent Limit Rent
Allegany $61,900 $15,300 $383 $17,490 $437 $19,680 $492 $21,840 $546
Anne Arundel $104,000 $21,840 $546 $24,960 $624 $28,080 $702 $31,200 $780
Baltimore $104,000 $21,840 $546 $24,960 $624 $28,080 $702 $31,200 $780
Baltimore City $104,000 $21,840 $546 $24,960 $624 $28,080 $702 $31,200 $780
Calvert $126,000 $26,460 $662 $30,240 $756 $34,020 $851 $37,800 $945
Caroline $67,500 $15,300 $383 $17,490 $437 $19,680 $492 $21,840 $546
Carroll $104,000 $21,840 $546 $24,960 $624 $28,080 $702 $31,200 $780
Cecil $96,600 $20,310 $508 $23,190 $580 $26,100 $653 $28,980 $725
Charles $126,000 $26,460 $662 $30,240 $756 $34,020 $851 $37,800 $945
Dorchester $68,400 $15,300 $383 $17,490 $437 $19,680 $492 $21,840 $546
Frederick $126,000 $26,460 $662 $30,240 $756 $34,020 $851 $37,800 $945
Garrett $61,500 $15,300 $383 $17,490 $437 $19,680 $492 $21,840 $546
Harford $104,000 $21,840 $546 $24,960 $624 $28,080 $702 $31,200 $780
Howard $104,000 $21,840 $546 $24,960 $624 $28,080 $702 $31,200 $780
Kent $78,700 $16,530 $413 $18,900 $473 $21,270 $532 $23,610 $590
Montgomery $126,000 $26,460 $662 $30,240 $756 $34,020 $851 $37,800 $945
Prince George's $126,000 $26,460 $662 $30,240 $756 $34,020 $851 $37,800 $945
Queen Anne's $104,000 $21,840 $546 $24,960 $624 $28,080 $702 $31,200 $780
St. Mary's $103,600 $21,780 $545 $24,870 $622 $27,990 $700 $31,080 $777
Somerset $54,800 $15,300 $383 $17,490 $437 $19,680 $492 $21,840 $546
Talbot $85,900 $18,060 $452 $20,640 $516 $23,220 $581 $25,770 $644
Washington $79,800 $16,770 $419 $19,170 $479 $21,570 $539 $23,940 $599
Wicomico $67,500 $15,300 $383 $17,490 $437 $19,680 $492 $21,840 $546
Worcester $76,000 $15,960 $399 $18,240 $456 $20,520 $513 $22,800 $570
Statewide $104,500 $21,960 $549 $25,080 $627 $28,230 $706 $31,350 $784

3
For informational purposes:
Calculations for 5%, 10%, 15%, 20%, 25% available upon request
Limits less <= 65% are based on 50% limits, =>70% are based on 80% limits.
For properties that have Low Income Tax Housing Tax Credits (LIHTC) included please refer to Low Income Housing Tax Credit Limits Source: DHCD – Housing Economic Research Office, U.S. Department of HUD
State of Maryland
2020 Income and Rent Limits
30 Percent of Area or State Median
Adjusted for Family Size 5-8 Person Households
5-Person Household 6-Person Household 7-Person Household 8-Person Household
Median Income Max Income Max Income Max Income Max
Jurisdictions Household Household Gross Household Gross Household Gross Household Gross
Income Limit Rent Limit Rent Limit Rent Limit Rent
Allegany $61,900 $23,610 $590 $25,350 $634 $27,090 $677 $28,830 $721
Anne Arundel $104,000 $33,720 $843 $36,210 $905 $38,700 $968 $41,190 $1,030
Baltimore $104,000 $33,720 $843 $36,210 $905 $38,700 $968 $41,190 $1,030
Baltimore City $104,000 $33,720 $843 $36,210 $905 $38,700 $968 $41,190 $1,030
Calvert $126,000 $40,830 $1,021 $43,860 $1,097 $46,890 $1,172 $49,920 $1,248
Caroline $67,500 $23,610 $590 $25,350 $634 $27,090 $677 $28,830 $721
Carroll $104,000 $33,720 $843 $36,210 $905 $38,700 $968 $41,190 $1,030
Cecil $96,600 $31,320 $783 $33,630 $841 $35,940 $899 $38,280 $957
Charles $126,000 $40,830 $1,021 $43,860 $1,097 $46,890 $1,172 $49,920 $1,248
Dorchester $68,400 $23,610 $590 $25,350 $634 $27,090 $677 $28,830 $721
Frederick $126,000 $40,830 $1,021 $43,860 $1,097 $46,890 $1,172 $49,920 $1,248
Garrett $61,500 $23,610 $590 $25,350 $634 $27,090 $677 $28,830 $721
Harford $104,000 $33,720 $843 $36,210 $905 $38,700 $968 $41,190 $1,030
Howard $104,000 $33,720 $843 $36,210 $905 $38,700 $968 $41,190 $1,030
Kent $78,700 $25,500 $638 $27,390 $685 $29,280 $732 $31,170 $779
Montgomery $126,000 $40,830 $1,021 $43,860 $1,097 $46,890 $1,172 $49,920 $1,248
Prince George's $126,000 $40,830 $1,021 $43,860 $1,097 $46,890 $1,172 $49,920 $1,248
Queen Anne's $104,000 $33,720 $843 $36,210 $905 $38,700 $968 $41,190 $1,030
St. Mary's $103,600 $33,570 $839 $36,060 $902 $38,550 $964 $41,040 $1,026
Somerset $54,800 $23,610 $590 $25,350 $634 $27,090 $677 $28,830 $721
Talbot $85,900 $27,840 $696 $29,910 $748 $31,980 $800 $34,020 $851
Washington $79,800 $25,860 $647 $27,780 $695 $29,700 $743 $31,620 $791
Wicomico $67,500 $23,610 $590 $25,350 $634 $27,090 $677 $28,830 $721
Worcester $76,000 $24,630 $616 $26,460 $662 $28,290 $707 $30,120 $753
Statewide $104,500 $33,870 $847 $36,360 $909 $38,880 $972 $41,370 $1,034

4
For informational purposes:
Calculations for 5%, 10%, 15%, 20%, 25% available upon request
Limits less <= 65% are based on 50% limits, =>70% are based on 80% limits.
For properties that have Low Income Tax Housing Tax Credits (LIHTC) included please refer to Low Income Housing Tax Credit Limits Source: DHCD – Housing Economic Research Office, U.S. Department of HUD
State of Maryland
2020 Income and Rent Limits
40 Percent of Area or State Median
Adjusted for Family Size 1-4 Person Households
1-Person Household 2-Person Household 3-Person Household 4-Person Household
Median Income Max Income Max Income Max Income Max
Jurisdictions Household Household Gross Household Gross Household Gross Household Gross
Income Limit Rent Limit Rent Limit Rent Limit Rent
Allegany $61,900 $20,400 $510 $23,320 $583 $26,240 $656 $29,120 $728
Anne Arundel $104,000 $29,120 $728 $33,280 $832 $37,440 $936 $41,600 $1,040
Baltimore $104,000 $29,120 $728 $33,280 $832 $37,440 $936 $41,600 $1,040
Baltimore City $104,000 $29,120 $728 $33,280 $832 $37,440 $936 $41,600 $1,040
Calvert $126,000 $35,280 $882 $40,320 $1,008 $45,360 $1,134 $50,400 $1,260
Caroline $67,500 $20,400 $510 $23,320 $583 $26,240 $656 $29,120 $728
Carroll $104,000 $29,120 $728 $33,280 $832 $37,440 $936 $41,600 $1,040
Cecil $96,600 $27,080 $677 $30,920 $773 $34,800 $870 $38,640 $966
Charles $126,000 $35,280 $882 $40,320 $1,008 $45,360 $1,134 $50,400 $1,260
Dorchester $68,400 $20,400 $510 $23,320 $583 $26,240 $656 $29,120 $728
Frederick $126,000 $35,280 $882 $40,320 $1,008 $45,360 $1,134 $50,400 $1,260
Garrett $61,500 $20,400 $510 $23,320 $583 $26,240 $656 $29,120 $728
Harford $104,000 $29,120 $728 $33,280 $832 $37,440 $936 $41,600 $1,040
Howard $104,000 $29,120 $728 $33,280 $832 $37,440 $936 $41,600 $1,040
Kent $78,700 $22,040 $551 $25,200 $630 $28,360 $709 $31,480 $787
Montgomery $126,000 $35,280 $882 $40,320 $1,008 $45,360 $1,134 $50,400 $1,260
Prince George's $126,000 $35,280 $882 $40,320 $1,008 $45,360 $1,134 $50,400 $1,260
Queen Anne's $104,000 $29,120 $728 $33,280 $832 $37,440 $936 $41,600 $1,040
St. Mary's $103,600 $29,040 $726 $33,160 $829 $37,320 $933 $41,440 $1,036
Somerset $54,800 $20,400 $510 $23,320 $583 $26,240 $656 $29,120 $728
Talbot $85,900 $24,080 $602 $27,520 $688 $30,960 $774 $34,360 $859
Washington $79,800 $22,360 $559 $25,560 $639 $28,760 $719 $31,920 $798
Wicomico $67,500 $20,400 $510 $23,320 $583 $26,240 $656 $29,120 $728
Worcester $76,000 $21,280 $532 $24,320 $608 $27,360 $684 $30,400 $760
Statewide $104,500 $29,280 $732 $33,440 $836 $37,640 $941 $41,800 $1,045

5
For informational purposes:
Calculations for 5%, 10%, 15%, 20%, 25% available upon request
Limits less <= 65% are based on 50% limits, =>70% are based on 80% limits.
For properties that have Low Income Tax Housing Tax Credits (LIHTC) included please refer to Low Income Housing Tax Credit Limits Source: DHCD – Housing Economic Research Office, U.S. Department of HUD
State of Maryland
2020 Income and Rent Limits
40 Percent of Area or State Median
Adjusted for Family Size 5-8 Person Households
5-Person Household 6-Person Household 7-Person Household 8-Person Household
Median Income Max Income Max Income Max Income Max
Jurisdictions Household Household Gross Household Gross Household Gross Household Gross
Income Limit Rent Limit Rent Limit Rent Limit Rent
Allegany $61,900 $31,480 $787 $33,800 $845 $36,120 $903 $38,440 $961
Anne Arundel $104,000 $44,960 $1,124 $48,280 $1,207 $51,600 $1,290 $54,920 $1,373
Baltimore $104,000 $44,960 $1,124 $48,280 $1,207 $51,600 $1,290 $54,920 $1,373
Baltimore City $104,000 $44,960 $1,124 $48,280 $1,207 $51,600 $1,290 $54,920 $1,373
Calvert $126,000 $54,440 $1,361 $58,480 $1,462 $62,520 $1,563 $66,560 $1,664
Caroline $67,500 $31,480 $787 $33,800 $845 $36,120 $903 $38,440 $961
Carroll $104,000 $44,960 $1,124 $48,280 $1,207 $51,600 $1,290 $54,920 $1,373
Cecil $96,600 $41,760 $1,044 $44,840 $1,121 $47,920 $1,198 $51,040 $1,276
Charles $126,000 $54,440 $1,361 $58,480 $1,462 $62,520 $1,563 $66,560 $1,664
Dorchester $68,400 $31,480 $787 $33,800 $845 $36,120 $903 $38,440 $961
Frederick $126,000 $54,440 $1,361 $58,480 $1,462 $62,520 $1,563 $66,560 $1,664
Garrett $61,500 $31,480 $787 $33,800 $845 $36,120 $903 $38,440 $961
Harford $104,000 $44,960 $1,124 $48,280 $1,207 $51,600 $1,290 $54,920 $1,373
Howard $104,000 $44,960 $1,124 $48,280 $1,207 $51,600 $1,290 $54,920 $1,373
Kent $78,700 $34,000 $850 $36,520 $913 $39,040 $976 $41,560 $1,039
Montgomery $126,000 $54,440 $1,361 $58,480 $1,462 $62,520 $1,563 $66,560 $1,664
Prince George's $126,000 $54,440 $1,361 $58,480 $1,462 $62,520 $1,563 $66,560 $1,664
Queen Anne's $104,000 $44,960 $1,124 $48,280 $1,207 $51,600 $1,290 $54,920 $1,373
St. Mary's $103,600 $44,760 $1,119 $48,080 $1,202 $51,400 $1,285 $54,720 $1,368
Somerset $54,800 $31,480 $787 $33,800 $845 $36,120 $903 $38,440 $961
Talbot $85,900 $37,120 $928 $39,880 $997 $42,640 $1,066 $45,360 $1,134
Washington $79,800 $34,480 $862 $37,040 $926 $39,600 $990 $42,160 $1,054
Wicomico $67,500 $31,480 $787 $33,800 $845 $36,120 $903 $38,440 $961
Worcester $76,000 $32,840 $821 $35,280 $882 $37,720 $943 $40,160 $1,004
Statewide $104,500 $45,160 $1,129 $48,480 $1,212 $51,840 $1,296 $55,160 $1,379
6
For informational purposes:
Calculations for 5%, 10%, 15%, 20%, 25% available upon request
Limits less <= 65% are based on 50% limits, =>70% are based on 80% limits.
For properties that have Low Income Tax Housing Tax Credits (LIHTC) included please refer to Low Income Housing Tax Credit Limits Source: DHCD – Housing Economic Research Office, U.S. Department of HUD
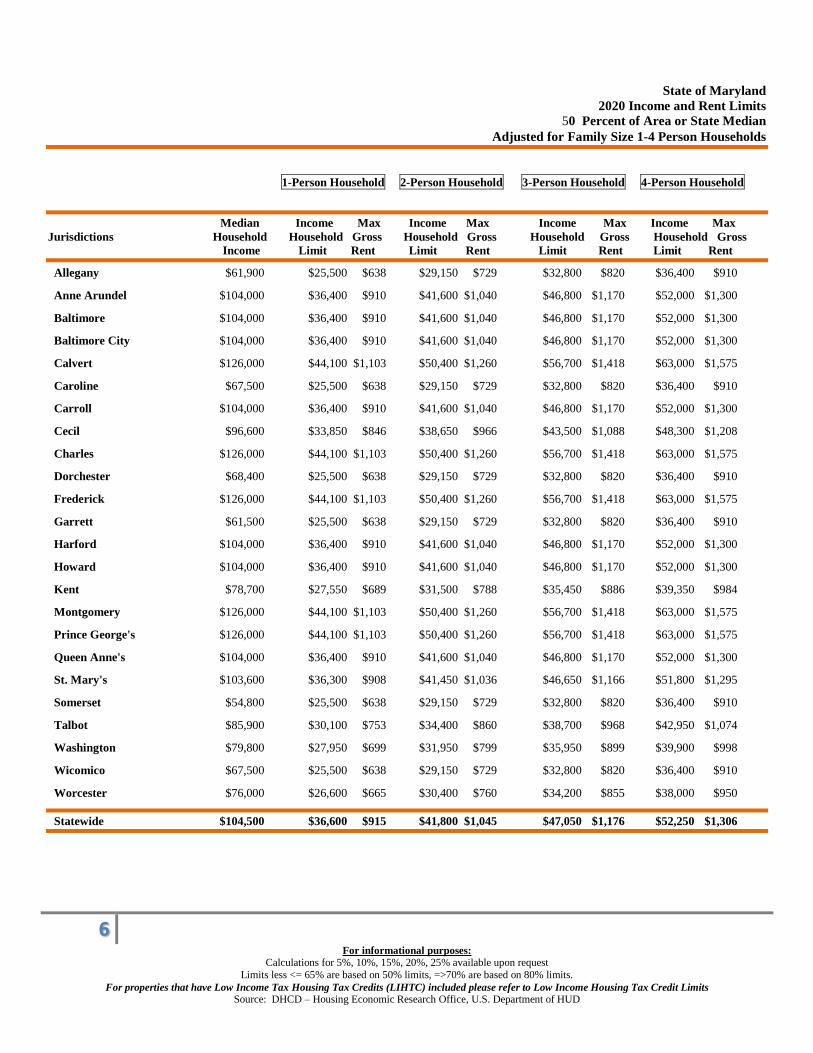
State of Maryland
2020 Income and Rent Limits
50 Percent of Area or State Median
Adjusted for Family Size 1-4 Person Households
1-Person Household 2-Person Household 3-Person Household 4-Person Household
Median Income Max Income Max Income Max Income Max
Jurisdictions Household Household Gross Household Gross Household Gross Household Gross
Income Limit Rent Limit Rent Limit Rent Limit Rent
Allegany $61,900 $25,500 $638 $29,150 $729 $32,800 $820 $36,400 $910
Anne Arundel $104,000 $36,400 $910 $41,600 $1,040 $46,800 $1,170 $52,000 $1,300
Baltimore $104,000 $36,400 $910 $41,600 $1,040 $46,800 $1,170 $52,000 $1,300
Baltimore City $104,000 $36,400 $910 $41,600 $1,040 $46,800 $1,170 $52,000 $1,300
Calvert $126,000 $44,100 $1,103 $50,400 $1,260 $56,700 $1,418 $63,000 $1,575
Caroline $67,500 $25,500 $638 $29,150 $729 $32,800 $820 $36,400 $910
Carroll $104,000 $36,400 $910 $41,600 $1,040 $46,800 $1,170 $52,000 $1,300
Cecil $96,600 $33,850 $846 $38,650 $966 $43,500 $1,088 $48,300 $1,208
Charles $126,000 $44,100 $1,103 $50,400 $1,260 $56,700 $1,418 $63,000 $1,575
Dorchester $68,400 $25,500 $638 $29,150 $729 $32,800 $820 $36,400 $910
Frederick $126,000 $44,100 $1,103 $50,400 $1,260 $56,700 $1,418 $63,000 $1,575
Garrett $61,500 $25,500 $638 $29,150 $729 $32,800 $820 $36,400 $910
Harford $104,000 $36,400 $910 $41,600 $1,040 $46,800 $1,170 $52,000 $1,300
Howard $104,000 $36,400 $910 $41,600 $1,040 $46,800 $1,170 $52,000 $1,300
Kent $78,700 $27,550 $689 $31,500 $788 $35,450 $886 $39,350 $984
Montgomery $126,000 $44,100 $1,103 $50,400 $1,260 $56,700 $1,418 $63,000 $1,575
Prince George's $126,000 $44,100 $1,103 $50,400 $1,260 $56,700 $1,418 $63,000 $1,575
Queen Anne's $104,000 $36,400 $910 $41,600 $1,040 $46,800 $1,170 $52,000 $1,300
St. Mary's $103,600 $36,300 $908 $41,450 $1,036 $46,650 $1,166 $51,800 $1,295
Somerset $54,800 $25,500 $638 $29,150 $729 $32,800 $820 $36,400 $910
Talbot $85,900 $30,100 $753 $34,400 $860 $38,700 $968 $42,950 $1,074
Washington $79,800 $27,950 $699 $31,950 $799 $35,950 $899 $39,900 $998
Wicomico $67,500 $25,500 $638 $29,150 $729 $32,800 $820 $36,400 $910
Worcester $76,000 $26,600 $665 $30,400 $760 $34,200 $855 $38,000 $950
Statewide $104,500 $36,600 $915 $41,800 $1,045 $47,050 $1,176 $52,250 $1,306

7
For informational purposes:
Calculations for 5%, 10%, 15%, 20%, 25% available upon request
Limits less <= 65% are based on 50% limits, =>70% are based on 80% limits.
For properties that have Low Income Tax Housing Tax Credits (LIHTC) included please refer to Low Income Housing Tax Credit Limits Source: DHCD – Housing Economic Research Office, U.S. Department of HUD
State of Maryland
2020 Income and Rent Limits
50 Percent of Area or State Median
Adjusted for Family Size 5-8 Person Households
5-Person Household 6-Person Household 7-Person Household 8-Person Household
Median Income Max Income Max Income Max Income Max
Jurisdictions Household Household Gross Household Gross Household Gross Household Gross
Income Limit Rent Limit Rent Limit Rent Limit Rent
Allegany $61,900 $39,350 $984 $42,250 $1,056 $45,150 $1,129 $48,050 $1,201
Anne Arundel $104,000 $56,200 $1,405 $60,350 $1,509 $64,500 $1,613 $68,650 $1,716
Baltimore $104,000 $56,200 $1,405 $60,350 $1,509 $64,500 $1,613 $68,650 $1,716
Baltimore City $104,000 $56,200 $1,405 $60,350 $1,509 $64,500 $1,613 $68,650 $1,716
Calvert $126,000 $68,050 $1,701 $73,100 $1,828 $78,150 $1,954 $83,200 $2,080
Caroline $67,500 $39,350 $984 $42,250 $1,056 $45,150 $1,129 $48,050 $1,201
Carroll $104,000 $56,200 $1,405 $60,350 $1,509 $64,500 $1,613 $68,650 $1,716
Cecil $96,600 $52,200 $1,305 $56,050 $1,401 $59,900 $1,498 $63,800 $1,595
Charles $126,000 $68,050 $1,701 $73,100 $1,828 $78,150 $1,954 $83,200 $2,080
Dorchester $68,400 $39,350 $984 $42,250 $1,056 $45,150 $1,129 $48,050 $1,201
Frederick $126,000 $68,050 $1,701 $73,100 $1,828 $78,150 $1,954 $83,200 $2,080
Garrett $61,500 $39,350 $984 $42,250 $1,056 $45,150 $1,129 $48,050 $1,201
Harford $104,000 $56,200 $1,405 $60,350 $1,509 $64,500 $1,613 $68,650 $1,716
Howard $104,000 $56,200 $1,405 $60,350 $1,509 $64,500 $1,613 $68,650 $1,716
Kent $78,700 $42,500 $1,063 $45,650 $1,141 $48,800 $1,220 $51,950 $1,299
Montgomery $126,000 $68,050 $1,701 $73,100 $1,828 $78,150 $1,954 $83,200 $2,080
Prince George's $126,000 $68,050 $1,701 $73,100 $1,828 $78,150 $1,954 $83,200 $2,080
Queen Anne's $104,000 $56,200 $1,405 $60,350 $1,509 $64,500 $1,613 $68,650 $1,716
St. Mary's $103,600 $55,950 $1,399 $60,100 $1,503 $64,250 $1,606 $68,400 $1,710
Somerset $54,800 $39,350 $984 $42,250 $1,056 $45,150 $1,129 $48,050 $1,201
Talbot $85,900 $46,400 $1,160 $49,850 $1,246 $53,300 $1,333 $56,700 $1,418
Washington $79,800 $43,100 $1,078 $46,300 $1,158 $49,500 $1,238 $52,700 $1,318
Wicomico $67,500 $39,350 $984 $42,250 $1,056 $45,150 $1,129 $48,050 $1,201
Worcester $76,000 $41,050 $1,026 $44,100 $1,103 $47,150 $1,179 $50,200 $1,255
Statewide $104,500 $56,450 $1,411 $60,600 $1,515 $64,800 $1,620 $68,950 $1,724
8
For informational purposes:
Calculations for 5%, 10%, 15%, 20%, 25% available upon request
Limits less <= 65% are based on 50% limits, =>70% are based on 80% limits.
For properties that have Low Income Tax Housing Tax Credits (LIHTC) included please refer to Low Income Housing Tax Credit Limits Source: DHCD – Housing Economic Research Office, U.S. Department of HUD
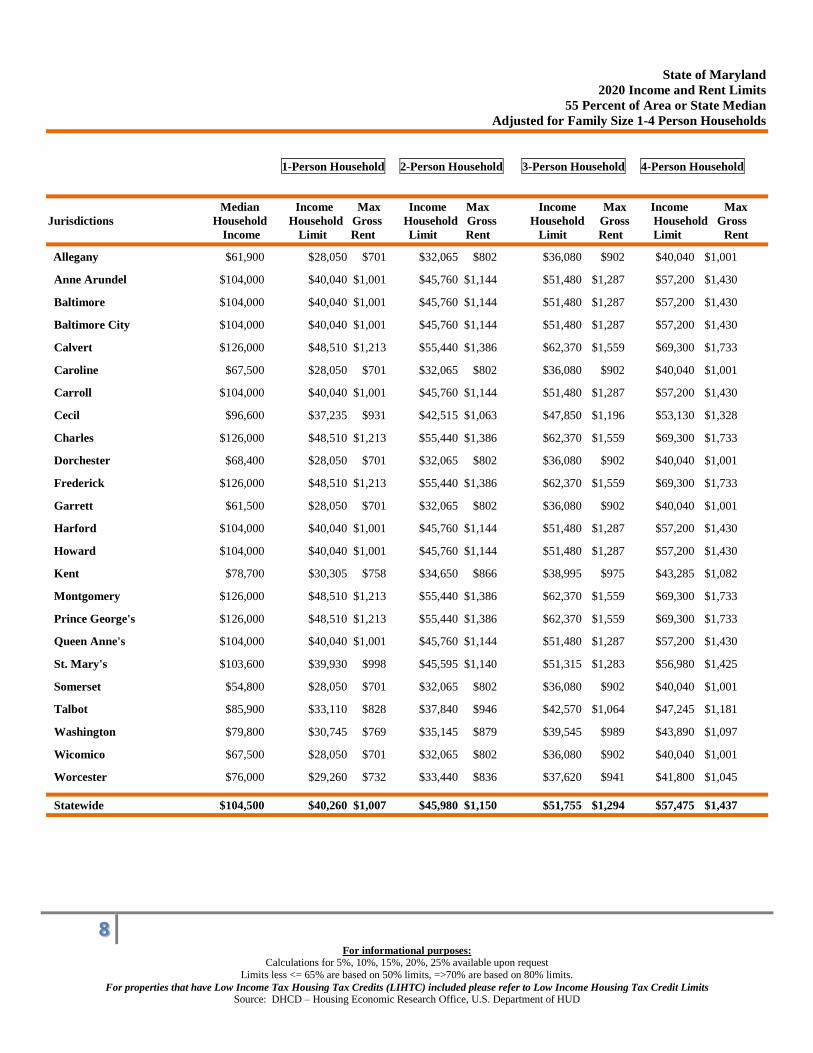
State of Maryland
2020 Income and Rent Limits
55 Percent of Area or State Median
Adjusted for Family Size 1-4 Person Households
1-Person Household 2-Person Household 3-Person Household 4-Person Household
Median Income Max Income Max Income Max Income Max
Jurisdictions Household Household Gross Household Gross Household Gross Household Gross
Income Limit Rent Limit Rent Limit Rent Limit Rent
Allegany $61,900 $28,050 $701 $32,065 $802 $36,080 $902 $40,040 $1,001
Anne Arundel $104,000 $40,040 $1,001 $45,760 $1,144 $51,480 $1,287 $57,200 $1,430
Baltimore $104,000 $40,040 $1,001 $45,760 $1,144 $51,480 $1,287 $57,200 $1,430
Baltimore City $104,000 $40,040 $1,001 $45,760 $1,144 $51,480 $1,287 $57,200 $1,430
Calvert $126,000 $48,510 $1,213 $55,440 $1,386 $62,370 $1,559 $69,300 $1,733
Caroline $67,500 $28,050 $701 $32,065 $802 $36,080 $902 $40,040 $1,001
Carroll $104,000 $40,040 $1,001 $45,760 $1,144 $51,480 $1,287 $57,200 $1,430
Cecil $96,600 $37,235 $931 $42,515 $1,063 $47,850 $1,196 $53,130 $1,328
Charles $126,000 $48,510 $1,213 $55,440 $1,386 $62,370 $1,559 $69,300 $1,733
Dorchester $68,400 $28,050 $701 $32,065 $802 $36,080 $902 $40,040 $1,001
Frederick $126,000 $48,510 $1,213 $55,440 $1,386 $62,370 $1,559 $69,300 $1,733
Garrett $61,500 $28,050 $701 $32,065 $802 $36,080 $902 $40,040 $1,001
Harford $104,000 $40,040 $1,001 $45,760 $1,144 $51,480 $1,287 $57,200 $1,430
Howard $104,000 $40,040 $1,001 $45,760 $1,144 $51,480 $1,287 $57,200 $1,430
Kent $78,700 $30,305 $758 $34,650 $866 $38,995 $975 $43,285 $1,082
Montgomery $126,000 $48,510 $1,213 $55,440 $1,386 $62,370 $1,559 $69,300 $1,733
Prince George's $126,000 $48,510 $1,213 $55,440 $1,386 $62,370 $1,559 $69,300 $1,733
Queen Anne's $104,000 $40,040 $1,001 $45,760 $1,144 $51,480 $1,287 $57,200 $1,430
St. Mary's $103,600 $39,930 $998 $45,595 $1,140 $51,315 $1,283 $56,980 $1,425
Somerset $54,800 $28,050 $701 $32,065 $802 $36,080 $902 $40,040 $1,001
Talbot $85,900 $33,110 $828 $37,840 $946 $42,570 $1,064 $47,245 $1,181
Washington $79,800 $30,745 $769 $35,145 $879 $39,545 $989 $43,890 $1,097
Wicomico $67,500 $28,050 $701 $32,065 $802 $36,080 $902 $40,040 $1,001
Worcester $76,000 $29,260 $732 $33,440 $836 $37,620 $941 $41,800 $1,045
Statewide $104,500 $40,260 $1,007 $45,980 $1,150 $51,755 $1,294 $57,475 $1,437

9
For informational purposes:
Calculations for 5%, 10%, 15%, 20%, 25% available upon request
Limits less <= 65% are based on 50% limits, =>70% are based on 80% limits.
For properties that have Low Income Tax Housing Tax Credits (LIHTC) included please refer to Low Income Housing Tax Credit Limits Source: DHCD – Housing Economic Research Office, U.S. Department of HUD
State of Maryland
2020 Income and Rent Limits
55 Percent of Area or State Median
Adjusted for Family Size 5-8 Person Households
5-Person Household 6-Person Household 7-Person Household 8-Person Household
Median Income Max Income Max Income Max Income Max
Jurisdictions Household Household Gross Household Gross Household Gross Household Gross
Income Limit Rent Limit Rent Limit Rent Limit Rent
Allegany $61,900 $43,285 $1,082 $46,475 $1,162 $49,665 $1,242 $52,855 $1,321
Anne Arundel $104,000 $61,820 $1,546 $66,385 $1,660 $70,950 $1,774 $75,515 $1,888
Baltimore $104,000 $61,820 $1,546 $66,385 $1,660 $70,950 $1,774 $75,515 $1,888
Baltimore City $104,000 $61,820 $1,546 $66,385 $1,660 $70,950 $1,774 $75,515 $1,888
Calvert $126,000 $74,855 $1,871 $80,410 $2,010 $85,965 $2,149 $91,520 $2,288
Caroline $67,500 $43,285 $1,082 $46,475 $1,162 $49,665 $1,242 $52,855 $1,321
Carroll $104,000 $61,820 $1,546 $66,385 $1,660 $70,950 $1,774 $75,515 $1,888
Cecil $96,600 $57,420 $1,436 $61,655 $1,541 $65,890 $1,647 $70,180 $1,755
Charles $126,000 $74,855 $1,871 $80,410 $2,010 $85,965 $2,149 $91,520 $2,288
Dorchester $68,400 $43,285 $1,082 $46,475 $1,162 $49,665 $1,242 $52,855 $1,321
Frederick $126,000 $74,855 $1,871 $80,410 $2,010 $85,965 $2,149 $91,520 $2,288
Garrett $61,500 $43,285 $1,082 $46,475 $1,162 $49,665 $1,242 $52,855 $1,321
Harford $104,000 $61,820 $1,546 $66,385 $1,660 $70,950 $1,774 $75,515 $1,888
Howard $104,000 $61,820 $1,546 $66,385 $1,660 $70,950 $1,774 $75,515 $1,888
Kent $78,700 $46,750 $1,169 $50,215 $1,255 $53,680 $1,342 $57,145 $1,429
Montgomery $126,000 $74,855 $1,871 $80,410 $2,010 $85,965 $2,149 $91,520 $2,288
Prince George's $126,000 $74,855 $1,871 $80,410 $2,010 $85,965 $2,149 $91,520 $2,288
Queen Anne's $104,000 $61,820 $1,546 $66,385 $1,660 $70,950 $1,774 $75,515 $1,888
St. Mary's $103,600 $61,545 $1,539 $66,110 $1,653 $70,675 $1,767 $75,240 $1,881
Somerset $54,800 $43,285 $1,082 $46,475 $1,162 $49,665 $1,242 $52,855 $1,321
Talbot $85,900 $51,040 $1,276 $54,835 $1,371 $58,630 $1,466 $62,370 $1,559
Washington $79,800 $47,410 $1,185 $50,930 $1,273 $54,450 $1,361 $57,970 $1,449
Wicomico $67,500 $43,285 $1,082 $46,475 $1,162 $49,665 $1,242 $52,855 $1,321
Worcester $76,000 $45,155 $1,129 $48,510 $1,213 $51,865 $1,297 $55,220 $1,381
Statewide $104,500 $62,095 $1,552 $66,660 $1,667 $71,280 $1,782 $75,845 $1,896
10
For informational purposes:
Calculations for 5%, 10%, 15%, 20%, 25% available upon request
Limits less <= 65% are based on 50% limits, =>70% are based on 80% limits.
For properties that have Low Income Tax Housing Tax Credits (LIHTC) included please refer to Low Income Housing Tax Credit Limits Source: DHCD – Housing Economic Research Office, U.S. Department of HUD
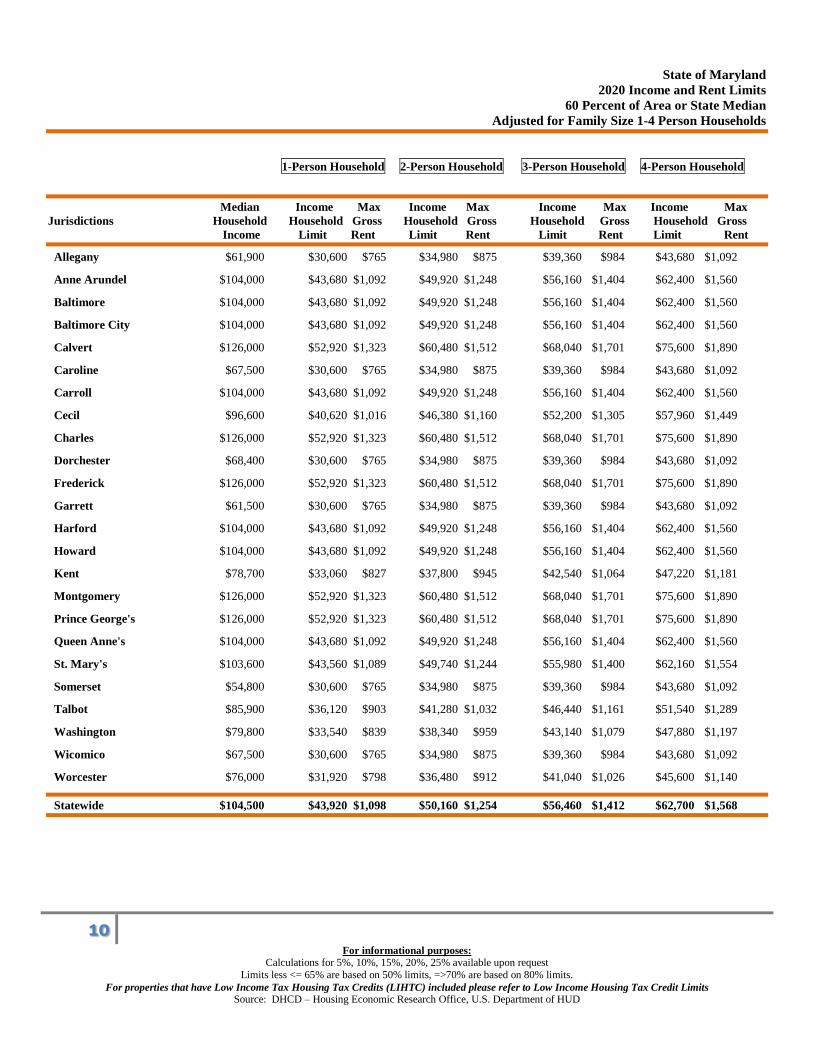
State of Maryland
2020 Income and Rent Limits
60 Percent of Area or State Median
Adjusted for Family Size 1-4 Person Households
1-Person Household 2-Person Household 3-Person Household 4-Person Household
Median Income Max Income Max Income Max Income Max
Jurisdictions Household Household Gross Household Gross Household Gross Household Gross
Income Limit Rent Limit Rent Limit Rent Limit Rent
Allegany $61,900 $30,600 $765 $34,980 $875 $39,360 $984 $43,680 $1,092
Anne Arundel $104,000 $43,680 $1,092 $49,920 $1,248 $56,160 $1,404 $62,400 $1,560
Baltimore $104,000 $43,680 $1,092 $49,920 $1,248 $56,160 $1,404 $62,400 $1,560
Baltimore City $104,000 $43,680 $1,092 $49,920 $1,248 $56,160 $1,404 $62,400 $1,560
Calvert $126,000 $52,920 $1,323 $60,480 $1,512 $68,040 $1,701 $75,600 $1,890
Caroline $67,500 $30,600 $765 $34,980 $875 $39,360 $984 $43,680 $1,092
Carroll $104,000 $43,680 $1,092 $49,920 $1,248 $56,160 $1,404 $62,400 $1,560
Cecil $96,600 $40,620 $1,016 $46,380 $1,160 $52,200 $1,305 $57,960 $1,449
Charles $126,000 $52,920 $1,323 $60,480 $1,512 $68,040 $1,701 $75,600 $1,890
Dorchester $68,400 $30,600 $765 $34,980 $875 $39,360 $984 $43,680 $1,092
Frederick $126,000 $52,920 $1,323 $60,480 $1,512 $68,040 $1,701 $75,600 $1,890
Garrett $61,500 $30,600 $765 $34,980 $875 $39,360 $984 $43,680 $1,092
Harford $104,000 $43,680 $1,092 $49,920 $1,248 $56,160 $1,404 $62,400 $1,560
Howard $104,000 $43,680 $1,092 $49,920 $1,248 $56,160 $1,404 $62,400 $1,560
Kent $78,700 $33,060 $827 $37,800 $945 $42,540 $1,064 $47,220 $1,181
Montgomery $126,000 $52,920 $1,323 $60,480 $1,512 $68,040 $1,701 $75,600 $1,890
Prince George's $126,000 $52,920 $1,323 $60,480 $1,512 $68,040 $1,701 $75,600 $1,890
Queen Anne's $104,000 $43,680 $1,092 $49,920 $1,248 $56,160 $1,404 $62,400 $1,560
St. Mary's $103,600 $43,560 $1,089 $49,740 $1,244 $55,980 $1,400 $62,160 $1,554
Somerset $54,800 $30,600 $765 $34,980 $875 $39,360 $984 $43,680 $1,092
Talbot $85,900 $36,120 $903 $41,280 $1,032 $46,440 $1,161 $51,540 $1,289
Washington $79,800 $33,540 $839 $38,340 $959 $43,140 $1,079 $47,880 $1,197
Wicomico $67,500 $30,600 $765 $34,980 $875 $39,360 $984 $43,680 $1,092
Worcester $76,000 $31,920 $798 $36,480 $912 $41,040 $1,026 $45,600 $1,140
Statewide $104,500 $43,920 $1,098 $50,160 $1,254 $56,460 $1,412 $62,700 $1,568

11
For informational purposes:
Calculations for 5%, 10%, 15%, 20%, 25% available upon request
Limits less <= 65% are based on 50% limits, =>70% are based on 80% limits.
For properties that have Low Income Tax Housing Tax Credits (LIHTC) included please refer to Low Income Housing Tax Credit Limits Source: DHCD – Housing Economic Research Office, U.S. Department of HUD
State of Maryland
2020 Income and Rent Limits
60 Percent of Area or State Median
Adjusted for Family Size 5-8 Person Households
5-Person Household 6-Person Household 7-Person Household 8-Person Household
Median Income Max Income Max Income Max Income Max
Jurisdictions Household Household Gross Household Gross Household Gross Household Gross
Income Limit Rent Limit Rent Limit Rent Limit Rent
Allegany $61,900 $47,220 $1,181 $50,700 $1,268 $54,180 $1,355 $57,660 $1,442
Anne Arundel $104,000 $67,440 $1,686 $72,420 $1,811 $77,400 $1,935 $82,380 $2,060
Baltimore $104,000 $67,440 $1,686 $72,420 $1,811 $77,400 $1,935 $82,380 $2,060
Baltimore City $104,000 $67,440 $1,686 $72,420 $1,811 $77,400 $1,935 $82,380 $2,060
Calvert $126,000 $81,660 $2,042 $87,720 $2,193 $93,780 $2,345 $99,840 $2,496
Caroline $67,500 $47,220 $1,181 $50,700 $1,268 $54,180 $1,355 $57,660 $1,442
Carroll $104,000 $67,440 $1,686 $72,420 $1,811 $77,400 $1,935 $82,380 $2,060
Cecil $96,600 $62,640 $1,566 $67,260 $1,682 $71,880 $1,797 $76,560 $1,914
Charles $126,000 $81,660 $2,042 $87,720 $2,193 $93,780 $2,345 $99,840 $2,496
Dorchester $68,400 $47,220 $1,181 $50,700 $1,268 $54,180 $1,355 $57,660 $1,442
Frederick $126,000 $81,660 $2,042 $87,720 $2,193 $93,780 $2,345 $99,840 $2,496
Garrett $61,500 $47,220 $1,181 $50,700 $1,268 $54,180 $1,355 $57,660 $1,442
Harford $104,000 $67,440 $1,686 $72,420 $1,811 $77,400 $1,935 $82,380 $2,060
Howard $104,000 $67,440 $1,686 $72,420 $1,811 $77,400 $1,935 $82,380 $2,060
Kent $78,700 $51,000 $1,275 $54,780 $1,370 $58,560 $1,464 $62,340 $1,559
Montgomery $126,000 $81,660 $2,042 $87,720 $2,193 $93,780 $2,345 $99,840 $2,496
Prince George's $126,000 $81,660 $2,042 $87,720 $2,193 $93,780 $2,345 $99,840 $2,496
Queen Anne's $104,000 $67,440 $1,686 $72,420 $1,811 $77,400 $1,935 $82,380 $2,060
St. Mary's $103,600 $67,140 $1,679 $72,120 $1,803 $77,100 $1,928 $82,080 $2,052
Somerset $54,800 $47,220 $1,181 $50,700 $1,268 $54,180 $1,355 $57,660 $1,442
Talbot $85,900 $55,680 $1,392 $59,820 $1,496 $63,960 $1,599 $68,040 $1,701
Washington $79,800 $51,720 $1,293 $55,560 $1,389 $59,400 $1,485 $63,240 $1,581
Wicomico $67,500 $47,220 $1,181 $50,700 $1,268 $54,180 $1,355 $57,660 $1,442
Worcester $76,000 $49,260 $1,232 $52,920 $1,323 $56,580 $1,415 $60,240 $1,506
Statewide $104,500 $67,740 $1,694 $72,720 $1,818 $77,760 $1,944 $82,740 $2,069

12
For informational purposes:
Calculations for 5%, 10%, 15%, 20%, 25% available upon request
Limits less <= 65% are based on 50% limits, =>70% are based on 80% limits.
For properties that have Low Income Tax Housing Tax Credits (LIHTC) included please refer to Low Income Housing Tax Credit Limits Source: DHCD – Housing Economic Research Office, U.S. Department of HUD
State of Maryland
2020 Income and Rent Limits
65 Percent of Area or State Median
Adjusted for Family Size 1-4 Person Households
1-Person Household 2-Person Household 3-Person Household 4-Person Household
Median Income Max Income Max Income Max Income Max
Jurisdictions Household Household Gross Household Gross Household Gross Household Gross
Income Limit Rent Limit Rent Limit Rent Limit Rent
Allegany $61,900 $33,150 $829 $37,895 $947 $42,640 $1,066 $47,320 $1,183
Anne Arundel $104,000 $47,320 $1,183 $54,080 $1,352 $60,840 $1,521 $67,600 $1,690
Baltimore $104,000 $47,320 $1,183 $54,080 $1,352 $60,840 $1,521 $67,600 $1,690
Baltimore City $104,000 $47,320 $1,183 $54,080 $1,352 $60,840 $1,521 $67,600 $1,690
Calvert $126,000 $57,330 $1,433 $65,520 $1,638 $73,710 $1,843 $81,900 $2,048
Caroline $67,500 $33,150 $829 $37,895 $947 $42,640 $1,066 $47,320 $1,183
Carroll $104,000 $47,320 $1,183 $54,080 $1,352 $60,840 $1,521 $67,600 $1,690
Cecil $96,600 $44,005 $1,100 $50,245 $1,256 $56,550 $1,414 $62,790 $1,570
Charles $126,000 $57,330 $1,433 $65,520 $1,638 $73,710 $1,843 $81,900 $2,048
Dorchester $68,400 $33,150 $829 $37,895 $947 $42,640 $1,066 $47,320 $1,183
Frederick $126,000 $57,330 $1,433 $65,520 $1,638 $73,710 $1,843 $81,900 $2,048
Garrett $61,500 $33,150 $829 $37,895 $947 $42,640 $1,066 $47,320 $1,183
Harford $104,000 $47,320 $1,183 $54,080 $1,352 $60,840 $1,521 $67,600 $1,690
Howard $104,000 $47,320 $1,183 $54,080 $1,352 $60,840 $1,521 $67,600 $1,690
Kent $78,700 $35,815 $895 $40,950 $1,024 $46,085 $1,152 $51,155 $1,279
Montgomery $126,000 $57,330 $1,433 $65,520 $1,638 $73,710 $1,843 $81,900 $2,048
Prince George's $126,000 $57,330 $1,433 $65,520 $1,638 $73,710 $1,843 $81,900 $2,048
Queen Anne's $104,000 $47,320 $1,183 $54,080 $1,352 $60,840 $1,521 $67,600 $1,690
Somerset $54,800 $33,150 $829 $37,895 $947 $42,640 $1,066 $47,320 $1,183
St. Mary's $103,600 $47,190 $1,180 $53,885 $1,347 $60,645 $1,516 $67,340 $1,684
Talbot $85,900 $39,130 $978 $44,720 $1,118 $50,310 $1,258 $55,835 $1,396
Washington $79,800 $36,335 $908 $41,535 $1,038 $46,735 $1,168 $51,870 $1,297
Wicomico $67,500 $33,150 $829 $37,895 $947 $42,640 $1,066 $47,320 $1,183
Worcester $76,000 $34,580 $865 $39,520 $988 $44,460 $1,112 $49,400 $1,235
Statewide $104,500 $47,580 $1,190 $54,340 $1,359 $61,165 $1,529 $67,925 $1,698

13
For informational purposes:
Calculations for 5%, 10%, 15%, 20%, 25% available upon request
Limits less <= 65% are based on 50% limits, =>70% are based on 80% limits.
For properties that have Low Income Tax Housing Tax Credits (LIHTC) included please refer to Low Income Housing Tax Credit Limits Source: DHCD – Housing Economic Research Office, U.S. Department of HUD
State of Maryland
2020 Income and Rent Limits
65 Percent of Area or State Median
Adjusted for Family Size 5-8 Person Households
5-Person Household 6-Person Household 7-Person Household 8-Person Household
Median Income Max Income Max Income Max Income Max
Jurisdictions Household Household Gross Household Gross Household Gross Household Gross
Income Limit Rent Limit Rent Limit Rent Limit Rent
Allegany $61,900 $51,155 $1,279 $54,925 $1,373 $58,695 $1,467 $62,465 $1,562
Anne Arundel $104,000 $73,060 $1,827 $78,455 $1,961 $83,850 $2,096 $89,245 $2,231
Baltimore $104,000 $73,060 $1,827 $78,455 $1,961 $83,850 $2,096 $89,245 $2,231
Baltimore City $104,000 $73,060 $1,827 $78,455 $1,961 $83,850 $2,096 $89,245 $2,231
Calvert $126,000 $88,465 $2,212 $95,030 $2,376 $101,595 $2,540 $108,160 $2,704
Caroline $67,500 $51,155 $1,279 $54,925 $1,373 $58,695 $1,467 $62,465 $1,562
Carroll $104,000 $73,060 $1,827 $78,455 $1,961 $83,850 $2,096 $89,245 $2,231
Cecil $96,600 $67,860 $1,697 $72,865 $1,822 $77,870 $1,947 $82,940 $2,074
Charles $126,000 $88,465 $2,212 $95,030 $2,376 $101,595 $2,540 $108,160 $2,704
Dorchester $68,400 $51,155 $1,279 $54,925 $1,373 $58,695 $1,467 $62,465 $1,562
Frederick $126,000 $88,465 $2,212 $95,030 $2,376 $101,595 $2,540 $108,160 $2,704
Garrett $61,500 $51,155 $1,279 $54,925 $1,373 $58,695 $1,467 $62,465 $1,562
Harford $104,000 $73,060 $1,827 $78,455 $1,961 $83,850 $2,096 $89,245 $2,231
Howard $104,000 $73,060 $1,827 $78,455 $1,961 $83,850 $2,096 $89,245 $2,231
Kent $78,700 $55,250 $1,381 $59,345 $1,484 $63,440 $1,586 $67,535 $1,688
Montgomery $126,000 $88,465 $2,212 $95,030 $2,376 $101,595 $2,540 $108,160 $2,704
Prince George's $126,000 $88,465 $2,212 $95,030 $2,376 $101,595 $2,540 $108,160 $2,704
Queen Anne's $104,000 $73,060 $1,827 $78,455 $1,961 $83,850 $2,096 $89,245 $2,231
Somerset $54,800 $51,155 $1,279 $54,925 $1,373 $58,695 $1,467 $62,465 $1,562
St. Mary's $103,600 $72,735 $1,818 $78,130 $1,953 $83,525 $2,088 $88,920 $2,223
Talbot $85,900 $60,320 $1,508 $64,805 $1,620 $69,290 $1,732 $73,710 $1,843
Washington $79,800 $56,030 $1,401 $60,190 $1,505 $64,350 $1,609 $68,510 $1,713
Wicomico $67,500 $51,155 $1,279 $54,925 $1,373 $58,695 $1,467 $62,465 $1,562
Worcester $76,000 $53,365 $1,334 $57,330 $1,433 $61,295 $1,532 $65,260 $1,632
Statewide $104,500 $73,385 $1,835 $78,780 $1,970 $84,240 $2,106 $89,635 $2,241
14
For informational purposes:
Calculations for 5%, 10%, 15%, 20%, 25% available upon request
Limits less <= 65% are based on 50% limits, =>70% are based on 80% limits.
For properties that have Low Income Tax Housing Tax Credits (LIHTC) included please refer to Low Income Housing Tax Credit Limits Source: DHCD – Housing Economic Research Office, U.S. Department of HUD
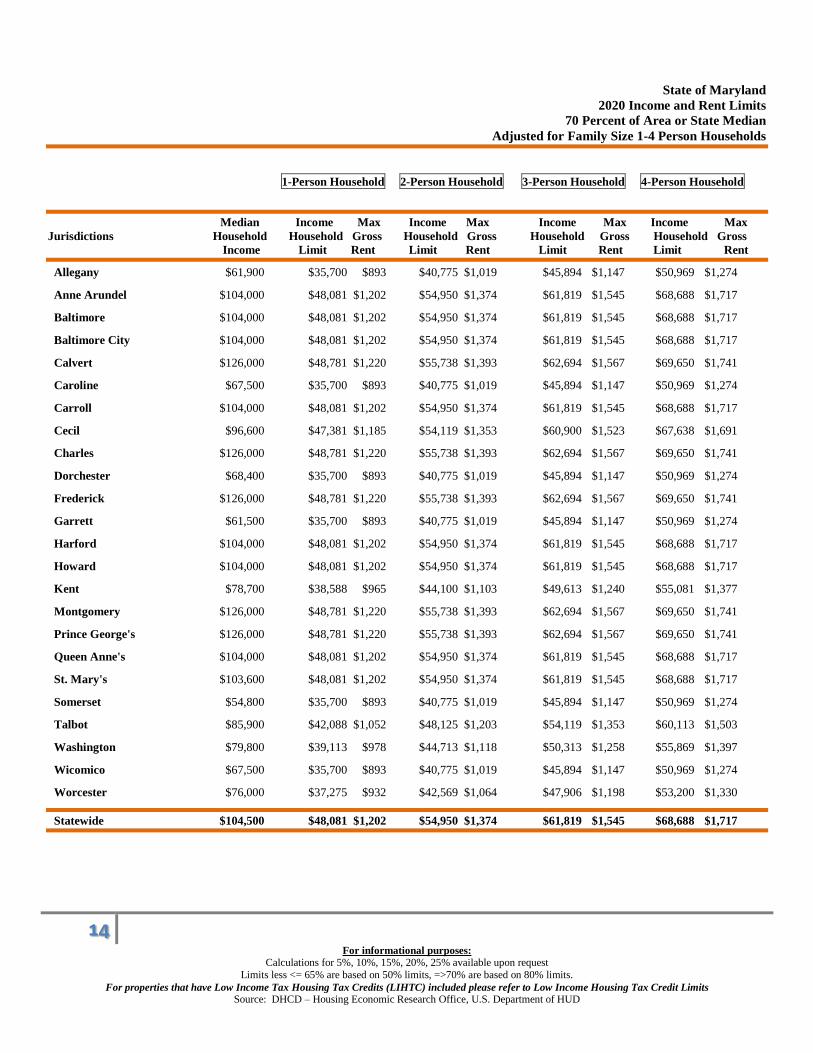
State of Maryland
2020 Income and Rent Limits
70 Percent of Area or State Median
Adjusted for Family Size 1-4 Person Households
1-Person Household 2-Person Household 3-Person Household 4-Person Household
Median Income Max Income Max Income Max Income Max
Jurisdictions Household Household Gross Household Gross Household Gross Household Gross
Income Limit Rent Limit Rent Limit Rent Limit Rent
Allegany $61,900 $35,700 $893 $40,775 $1,019 $45,894 $1,147 $50,969 $1,274
Anne Arundel $104,000 $48,081 $1,202 $54,950 $1,374 $61,819 $1,545 $68,688 $1,717
Baltimore $104,000 $48,081 $1,202 $54,950 $1,374 $61,819 $1,545 $68,688 $1,717
Baltimore City $104,000 $48,081 $1,202 $54,950 $1,374 $61,819 $1,545 $68,688 $1,717
Calvert $126,000 $48,781 $1,220 $55,738 $1,393 $62,694 $1,567 $69,650 $1,741
Caroline $67,500 $35,700 $893 $40,775 $1,019 $45,894 $1,147 $50,969 $1,274
Carroll $104,000 $48,081 $1,202 $54,950 $1,374 $61,819 $1,545 $68,688 $1,717
Cecil $96,600 $47,381 $1,185 $54,119 $1,353 $60,900 $1,523 $67,638 $1,691
Charles $126,000 $48,781 $1,220 $55,738 $1,393 $62,694 $1,567 $69,650 $1,741
Dorchester $68,400 $35,700 $893 $40,775 $1,019 $45,894 $1,147 $50,969 $1,274
Frederick $126,000 $48,781 $1,220 $55,738 $1,393 $62,694 $1,567 $69,650 $1,741
Garrett $61,500 $35,700 $893 $40,775 $1,019 $45,894 $1,147 $50,969 $1,274
Harford $104,000 $48,081 $1,202 $54,950 $1,374 $61,819 $1,545 $68,688 $1,717
Howard $104,000 $48,081 $1,202 $54,950 $1,374 $61,819 $1,545 $68,688 $1,717
Kent $78,700 $38,588 $965 $44,100 $1,103 $49,613 $1,240 $55,081 $1,377
Montgomery $126,000 $48,781 $1,220 $55,738 $1,393 $62,694 $1,567 $69,650 $1,741
Prince George's $126,000 $48,781 $1,220 $55,738 $1,393 $62,694 $1,567 $69,650 $1,741
Queen Anne's $104,000 $48,081 $1,202 $54,950 $1,374 $61,819 $1,545 $68,688 $1,717
St. Mary's $103,600 $48,081 $1,202 $54,950 $1,374 $61,819 $1,545 $68,688 $1,717
Somerset $54,800 $35,700 $893 $40,775 $1,019 $45,894 $1,147 $50,969 $1,274
Talbot $85,900 $42,088 $1,052 $48,125 $1,203 $54,119 $1,353 $60,113 $1,503
Washington $79,800 $39,113 $978 $44,713 $1,118 $50,313 $1,258 $55,869 $1,397
Wicomico $67,500 $35,700 $893 $40,775 $1,019 $45,894 $1,147 $50,969 $1,274
Worcester $76,000 $37,275 $932 $42,569 $1,064 $47,906 $1,198 $53,200 $1,330
Statewide $104,500 $48,081 $1,202 $54,950 $1,374 $61,819 $1,545 $68,688 $1,717

15
For informational purposes:
Calculations for 5%, 10%, 15%, 20%, 25% available upon request
Limits less <= 65% are based on 50% limits, =>70% are based on 80% limits.
For properties that have Low Income Tax Housing Tax Credits (LIHTC) included please refer to Low Income Housing Tax Credit Limits Source: DHCD – Housing Economic Research Office, U.S. Department of HUD
State of Maryland
2020 Income and Rent Limits
70 Percent of Area or State Median
Adjusted for Family Size 5-8 Person Households
5-Person Household 6-Person Household 7-Person Household 8-Person Household
Median Income Max Income Max Income Max Income Max
Jurisdictions Household Household Gross Household Gross Household Gross Household Gross
Income Limit Rent Limit Rent Limit Rent Limit Rent
Allegany $61,900 $55,081 $1,377 $59,150 $1,479 $63,219 $1,580 $67,288 $1,682
Anne Arundel $104,000 $74,200 $1,855 $79,713 $1,993 $85,181 $2,130 $90,694 $2,267
Baltimore $104,000 $74,200 $1,855 $79,713 $1,993 $85,181 $2,130 $90,694 $2,267
Baltimore City $104,000 $74,200 $1,855 $79,713 $1,993 $85,181 $2,130 $90,694 $2,267
Calvert $126,000 $75,250 $1,881 $80,806 $2,020 $86,406 $2,160 $91,963 $2,299
Caroline $67,500 $55,081 $1,377 $59,150 $1,479 $63,219 $1,580 $67,288 $1,682
Carroll $104,000 $74,200 $1,855 $79,713 $1,993 $85,181 $2,130 $90,694 $2,267
Cecil $96,600 $73,063 $1,827 $78,488 $1,962 $83,913 $2,098 $89,294 $2,232
Charles $126,000 $75,250 $1,881 $80,806 $2,020 $86,406 $2,160 $91,963 $2,299
Dorchester $68,400 $55,081 $1,377 $59,150 $1,479 $63,219 $1,580 $67,288 $1,682
Frederick $126,000 $75,250 $1,881 $80,806 $2,020 $86,406 $2,160 $91,963 $2,299
Garrett $61,500 $55,081 $1,377 $59,150 $1,479 $63,219 $1,580 $67,288 $1,682
Harford $104,000 $74,200 $1,855 $79,713 $1,993 $85,181 $2,130 $90,694 $2,267
Howard $104,000 $74,200 $1,855 $79,713 $1,993 $85,181 $2,130 $90,694 $2,267
Kent $78,700 $59,500 $1,488 $63,919 $1,598 $68,338 $1,708 $72,713 $1,818
Montgomery $126,000 $75,250 $1,881 $80,806 $2,020 $86,406 $2,160 $91,963 $2,299
Prince George's $126,000 $75,250 $1,881 $80,806 $2,020 $86,406 $2,160 $91,963 $2,299
Queen Anne's $104,000 $74,200 $1,855 $79,713 $1,993 $85,181 $2,130 $90,694 $2,267
St. Mary's $103,600 $74,200 $1,855 $79,713 $1,993 $85,181 $2,130 $90,694 $2,267
Somerset $54,800 $55,081 $1,377 $59,150 $1,479 $63,219 $1,580 $67,288 $1,682
Talbot $85,900 $64,925 $1,623 $69,738 $1,743 $74,550 $1,864 $79,363 $1,984
Washington $79,800 $60,375 $1,509 $64,838 $1,621 $69,300 $1,733 $73,763 $1,844
Wicomico $67,500 $55,081 $1,377 $59,150 $1,479 $63,219 $1,580 $67,288 $1,682
Worcester $76,000 $57,488 $1,437 $61,731 $1,543 $65,975 $1,649 $70,263 $1,757
Statewide $104,500 $74,200 $1,855 $79,669 $1,992 $85,181 $2,130 $90,650 $2,266

16
For informational purposes:
Calculations for 5%, 10%, 15%, 20%, 25% available upon request
Limits less <= 65% are based on 50% limits, =>70% are based on 80% limits.
For properties that have Low Income Tax Housing Tax Credits (LIHTC) included please refer to Low Income Housing Tax Credit Limits Source: DHCD – Housing Economic Research Office, U.S. Department of HUD
State of Maryland
2020 Income and Rent Limits
75 Percent of Area or State Median
Adjusted for Family Size 1-4 Person Households
1-Person Household 2-Person Household 3-Person Household 4-Person Household
Median Income Max Income Max Income Max Income Max
Jurisdictions Household Household Gross Household Gross Household Gross Household Gross
Income Limit Rent Limit Rent Limit Rent Limit Rent
Allegany $61,900 $38,250 $956 $43,688 $1,092 $49,172 $1,229 $54,609 $1,365
Anne Arundel $104,000 $51,516 $1,288 $58,875 $1,472 $66,234 $1,656 $73,594 $1,840
Baltimore $104,000 $51,516 $1,288 $58,875 $1,472 $66,234 $1,656 $73,594 $1,840
Baltimore City $104,000 $51,516 $1,288 $58,875 $1,472 $66,234 $1,656 $73,594 $1,840
Calvert $126,000 $52,266 $1,307 $59,719 $1,493 $67,172 $1,679 $74,625 $1,866
Caroline $67,500 $38,250 $956 $43,688 $1,092 $49,172 $1,229 $54,609 $1,365
Carroll $104,000 $51,516 $1,288 $58,875 $1,472 $66,234 $1,656 $73,594 $1,840
Cecil $96,600 $50,766 $1,269 $57,984 $1,450 $65,250 $1,631 $72,469 $1,812
Charles $126,000 $52,266 $1,307 $59,719 $1,493 $67,172 $1,679 $74,625 $1,866
Dorchester $68,400 $38,250 $956 $43,688 $1,092 $49,172 $1,229 $54,609 $1,365
Frederick $126,000 $52,266 $1,307 $59,719 $1,493 $67,172 $1,679 $74,625 $1,866
Garrett $61,500 $38,250 $956 $43,688 $1,092 $49,172 $1,229 $54,609 $1,365
Harford $104,000 $51,516 $1,288 $58,875 $1,472 $66,234 $1,656 $73,594 $1,840
Howard $104,000 $51,516 $1,288 $58,875 $1,472 $66,234 $1,656 $73,594 $1,840
Kent $78,700 $41,344 $1,034 $47,250 $1,181 $53,156 $1,329 $59,016 $1,475
Montgomery $126,000 $52,266 $1,307 $59,719 $1,493 $67,172 $1,679 $74,625 $1,866
Prince George's $126,000 $52,266 $1,307 $59,719 $1,493 $67,172 $1,679 $74,625 $1,866
Queen Anne's $104,000 $51,516 $1,288 $58,875 $1,472 $66,234 $1,656 $73,594 $1,840
St. Mary's $103,600 $51,516 $1,288 $58,875 $1,472 $66,234 $1,656 $73,594 $1,840
Somerset $54,800 $38,250 $956 $43,688 $1,092 $49,172 $1,229 $54,609 $1,365
Talbot $85,900 $45,094 $1,127 $51,563 $1,289 $57,984 $1,450 $64,406 $1,610
Washington $79,800 $41,906 $1,048 $47,906 $1,198 $53,906 $1,348 $59,859 $1,496
Wicomico $67,500 $38,250 $956 $43,688 $1,092 $49,172 $1,229 $54,609 $1,365
Worcester $76,000 $39,938 $998 $45,609 $1,140 $51,328 $1,283 $57,000 $1,425
Statewide $104,500 $51,516 $1,288 $58,875 $1,472 $66,234 $1,656 $73,594 $1,840

17
For informational purposes:
Calculations for 5%, 10%, 15%, 20%, 25% available upon request
Limits less <= 65% are based on 50% limits, =>70% are based on 80% limits.
For properties that have Low Income Tax Housing Tax Credits (LIHTC) included please refer to Low Income Housing Tax Credit Limits Source: DHCD – Housing Economic Research Office, U.S. Department of HUD
State of Maryland
2020 Income and Rent Limits
75 Percent of Area or State Median
Adjusted for Family Size 5-8 Person Households
5-Person Household 6-Person Household 7-Person Household 8-Person Household
Median Income Max Income Max Income Max Income Max
Jurisdictions Household Household Gross Household Gross Household Gross Household Gross
Income Limit Rent Limit Rent Limit Rent Limit Rent
Allegany $61,900 $59,016 $1,475 $63,375 $1,584 $67,734 $1,693 $72,094 $1,802
Anne Arundel $104,000 $79,500 $1,988 $85,406 $2,135 $91,266 $2,282 $97,172 $2,429
Baltimore $104,000 $79,500 $1,988 $85,406 $2,135 $91,266 $2,282 $97,172 $2,429
Baltimore City $104,000 $79,500 $1,988 $85,406 $2,135 $91,266 $2,282 $97,172 $2,429
Calvert $126,000 $80,625 $2,016 $86,578 $2,164 $92,578 $2,314 $98,531 $2,463
Caroline $67,500 $59,016 $1,475 $63,375 $1,584 $67,734 $1,693 $72,094 $1,802
Carroll $104,000 $79,500 $1,988 $85,406 $2,135 $91,266 $2,282 $97,172 $2,429
Cecil $96,600 $78,281 $1,957 $84,094 $2,102 $89,906 $2,248 $95,672 $2,392
Charles $126,000 $80,625 $2,016 $86,578 $2,164 $92,578 $2,314 $98,531 $2,463
Dorchester $68,400 $59,016 $1,475 $63,375 $1,584 $67,734 $1,693 $72,094 $1,802
Frederick $126,000 $80,625 $2,016 $86,578 $2,164 $92,578 $2,314 $98,531 $2,463
Garrett $61,500 $59,016 $1,475 $63,375 $1,584 $67,734 $1,693 $72,094 $1,802
Harford $104,000 $79,500 $1,988 $85,406 $2,135 $91,266 $2,282 $97,172 $2,429
Howard $104,000 $79,500 $1,988 $85,406 $2,135 $91,266 $2,282 $97,172 $2,429
Kent $78,700 $63,750 $1,594 $68,484 $1,712 $73,219 $1,830 $77,906 $1,948
Montgomery $126,000 $80,625 $2,016 $86,578 $2,164 $92,578 $2,314 $98,531 $2,463
Prince George's $126,000 $80,625 $2,016 $86,578 $2,164 $92,578 $2,314 $98,531 $2,463
Queen Anne's $104,000 $79,500 $1,988 $85,406 $2,135 $91,266 $2,282 $97,172 $2,429
St. Mary's $103,600 $79,500 $1,988 $85,406 $2,135 $91,266 $2,282 $97,172 $2,429
Somerset $54,800 $59,016 $1,475 $63,375 $1,584 $67,734 $1,693 $72,094 $1,802
Talbot $85,900 $69,563 $1,739 $74,719 $1,868 $79,875 $1,997 $85,031 $2,126
Washington $79,800 $64,688 $1,617 $69,469 $1,737 $74,250 $1,856 $79,031 $1,976
Wicomico $67,500 $59,016 $1,475 $63,375 $1,584 $67,734 $1,693 $72,094 $1,802
Worcester $76,000 $61,594 $1,540 $66,141 $1,654 $70,688 $1,767 $75,281 $1,882
Statewide $104,500 $79,500 $1,988 $85,359 $2,134 $91,266 $2,282 $97,125 $2,428

18
For informational purposes:
Calculations for 5%, 10%, 15%, 20%, 25% available upon request
Limits less <= 65% are based on 50% limits, =>70% are based on 80% limits.
For properties that have Low Income Tax Housing Tax Credits (LIHTC) included please refer to Low Income Housing Tax Credit Limits Source: DHCD – Housing Economic Research Office, U.S. Department of HUD
State of Maryland
2020 Income and Rent Limits
80 Percent of Area or State Median
Adjusted for Family Size 1-4 Person Households
1-Person Household 2-Person Household 3-Person Household 4-Person Household
Median Income Max Income Max Income Max Income Max
Jurisdictions Household Household Gross Household Gross Household Gross Household Gross
Income Limit Rent Limit Rent Limit Rent Limit Rent
Allegany $61,900 $40,800 $1,020 $46,600 $1,165 $52,450 $1,311 $58,250 $1,456
Anne Arundel $104,000 $54,950 $1,374 $62,800 $1,570 $70,650 $1,766 $78,500 $1,963
Baltimore $104,000 $54,950 $1,374 $62,800 $1,570 $70,650 $1,766 $78,500 $1,963
Baltimore City $104,000 $54,950 $1,374 $62,800 $1,570 $70,650 $1,766 $78,500 $1,963
Calvert $126,000 $55,750 $1,394 $63,700 $1,593 $71,650 $1,791 $79,600 $1,990
Caroline $67,500 $40,800 $1,020 $46,600 $1,165 $52,450 $1,311 $58,250 $1,456
Carroll $104,000 $54,950 $1,374 $62,800 $1,570 $70,650 $1,766 $78,500 $1,963
Cecil $96,600 $54,150 $1,354 $61,850 $1,546 $69,600 $1,740 $77,300 $1,933
Charles $126,000 $55,750 $1,394 $63,700 $1,593 $71,650 $1,791 $79,600 $1,990
Dorchester $68,400 $40,800 $1,020 $46,600 $1,165 $52,450 $1,311 $58,250 $1,456
Frederick $126,000 $55,750 $1,394 $63,700 $1,593 $71,650 $1,791 $79,600 $1,990
Garrett $61,500 $40,800 $1,020 $46,600 $1,165 $52,450 $1,311 $58,250 $1,456
Harford $104,000 $54,950 $1,374 $62,800 $1,570 $70,650 $1,766 $78,500 $1,963
Howard $104,000 $54,950 $1,374 $62,800 $1,570 $70,650 $1,766 $78,500 $1,963
Kent $78,700 $44,100 $1,103 $50,400 $1,260 $56,700 $1,418 $62,950 $1,574
Montgomery $126,000 $55,750 $1,394 $63,700 $1,593 $71,650 $1,791 $79,600 $1,990
Prince George's $126,000 $55,750 $1,394 $63,700 $1,593 $71,650 $1,791 $79,600 $1,990
Queen Anne's $104,000 $54,950 $1,374 $62,800 $1,570 $70,650 $1,766 $78,500 $1,963
St. Mary's $103,600 $54,950 $1,374 $62,800 $1,570 $70,650 $1,766 $78,500 $1,963
Somerset $54,800 $40,800 $1,020 $46,600 $1,165 $52,450 $1,311 $58,250 $1,456
Talbot $85,900 $48,100 $1,203 $55,000 $1,375 $61,850 $1,546 $68,700 $1,718
Washington $79,800 $44,700 $1,118 $51,100 $1,278 $57,500 $1,438 $63,850 $1,596
Wicomico $67,500 $40,800 $1,020 $46,600 $1,165 $52,450 $1,311 $58,250 $1,456
Worcester $76,000 $42,600 $1,065 $48,650 $1,216 $54,750 $1,369 $60,800 $1,520
Statewide $104,500 $54,950 $1,374 $62,800 $1,570 $70,650 $1,766 $78,500 $1,963
19
For informational purposes:
Calculations for 5%, 10%, 15%, 20%, 25% available upon request
Limits less <= 65% are based on 50% limits, =>70% are based on 80% limits.
For properties that have Low Income Tax Housing Tax Credits (LIHTC) included please refer to Low Income Housing Tax Credit Limits Source: DHCD – Housing Economic Research Office, U.S. Department of HUD
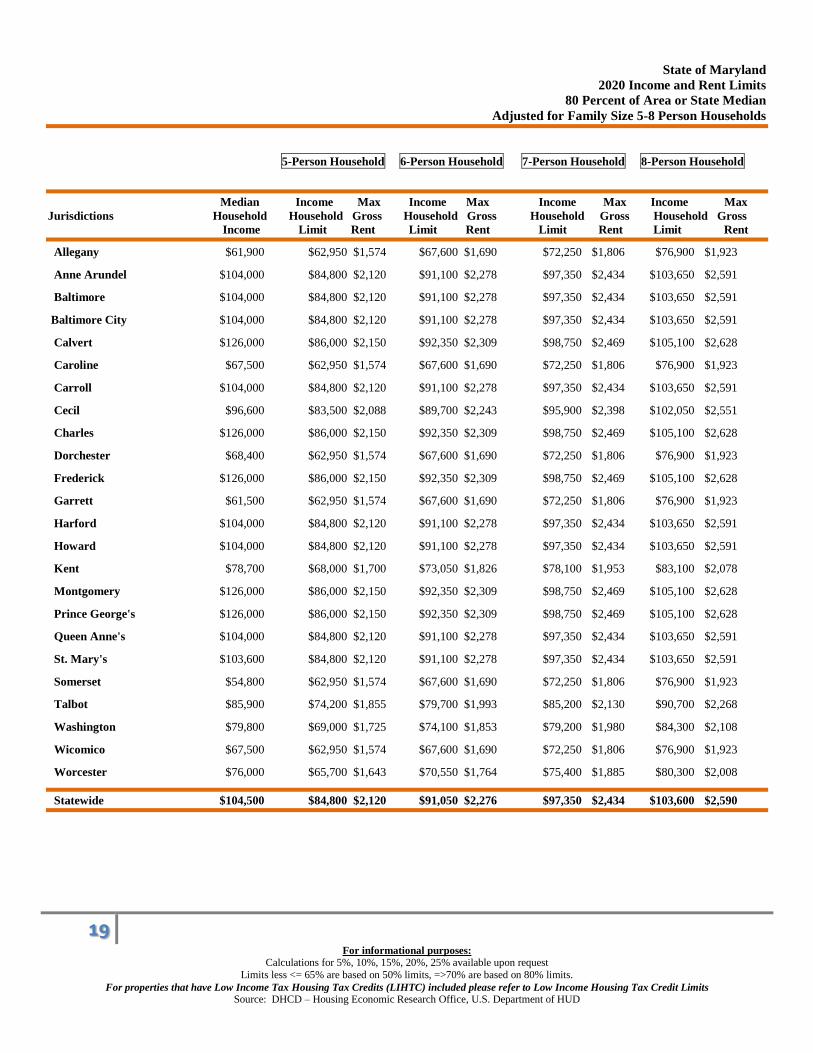
State of Maryland
2020 Income and Rent Limits
80 Percent of Area or State Median
Adjusted for Family Size 5-8 Person Households
5-Person Household 6-Person Household 7-Person Household 8-Person Household
Median Income Max Income Max Income Max Income Max
Jurisdictions Household Household Gross Household Gross Household Gross Household Gross
Income Limit Rent Limit Rent Limit Rent Limit Rent
Allegany $61,900 $62,950 $1,574 $67,600 $1,690 $72,250 $1,806 $76,900 $1,923
Anne Arundel $104,000 $84,800 $2,120 $91,100 $2,278 $97,350 $2,434 $103,650 $2,591
Baltimore $104,000 $84,800 $2,120 $91,100 $2,278 $97,350 $2,434 $103,650 $2,591
Baltimore City $104,000 $84,800 $2,120 $91,100 $2,278 $97,350 $2,434 $103,650 $2,591
Calvert $126,000 $86,000 $2,150 $92,350 $2,309 $98,750 $2,469 $105,100 $2,628
Caroline $67,500 $62,950 $1,574 $67,600 $1,690 $72,250 $1,806 $76,900 $1,923
Carroll $104,000 $84,800 $2,120 $91,100 $2,278 $97,350 $2,434 $103,650 $2,591
Cecil $96,600 $83,500 $2,088 $89,700 $2,243 $95,900 $2,398 $102,050 $2,551
Charles $126,000 $86,000 $2,150 $92,350 $2,309 $98,750 $2,469 $105,100 $2,628
Dorchester $68,400 $62,950 $1,574 $67,600 $1,690 $72,250 $1,806 $76,900 $1,923
Frederick $126,000 $86,000 $2,150 $92,350 $2,309 $98,750 $2,469 $105,100 $2,628
Garrett $61,500 $62,950 $1,574 $67,600 $1,690 $72,250 $1,806 $76,900 $1,923
Harford $104,000 $84,800 $2,120 $91,100 $2,278 $97,350 $2,434 $103,650 $2,591
Howard $104,000 $84,800 $2,120 $91,100 $2,278 $97,350 $2,434 $103,650 $2,591
Kent $78,700 $68,000 $1,700 $73,050 $1,826 $78,100 $1,953 $83,100 $2,078
Montgomery $126,000 $86,000 $2,150 $92,350 $2,309 $98,750 $2,469 $105,100 $2,628
Prince George's $126,000 $86,000 $2,150 $92,350 $2,309 $98,750 $2,469 $105,100 $2,628
Queen Anne's $104,000 $84,800 $2,120 $91,100 $2,278 $97,350 $2,434 $103,650 $2,591
St. Mary's $103,600 $84,800 $2,120 $91,100 $2,278 $97,350 $2,434 $103,650 $2,591
Somerset $54,800 $62,950 $1,574 $67,600 $1,690 $72,250 $1,806 $76,900 $1,923
Talbot $85,900 $74,200 $1,855 $79,700 $1,993 $85,200 $2,130 $90,700 $2,268
Washington $79,800 $69,000 $1,725 $74,100 $1,853 $79,200 $1,980 $84,300 $2,108
Wicomico $67,500 $62,950 $1,574 $67,600 $1,690 $72,250 $1,806 $76,900 $1,923
Worcester $76,000 $65,700 $1,643 $70,550 $1,764 $75,400 $1,885 $80,300 $2,008
Statewide $104,500 $84,800 $2,120 $91,050 $2,276 $97,350 $2,434 $103,600 $2,590

20
For informational purposes:
Calculations for 5%, 10%, 15%, 20%, 25% available upon request
Limits less <= 65% are based on 50% limits, =>70% are based on 80% limits.
For properties that have Low Income Tax Housing Tax Credits (LIHTC) included please refer to Low Income Housing Tax Credit Limits Source: DHCD – Housing Economic Research Office, U.S. Department of HUD
State of Maryland
2020 Income and Rent Limits
85 Percent of Area or State Median
Adjusted for Family Size 1-4 Person Households
1-Person Household 2-Person Household 3-Person Household 4-Person Household
Median Income Max Income Max Income Max Income Max
Jurisdictions Household Household Gross Household Gross Household Gross Household Gross
Income Limit Rent Limit Rent Limit Rent Limit Rent
Allegany $61,900 $43,350 $1,084 $49,513 $1,238 $55,728 $1,393 $61,891 $1,547
Anne Arundel $104,000 $58,384 $1,460 $66,725 $1,668 $75,066 $1,877 $83,406 $2,085
Baltimore $104,000 $58,384 $1,460 $66,725 $1,668 $75,066 $1,877 $83,406 $2,085
Baltimore City $104,000 $58,384 $1,460 $66,725 $1,668 $75,066 $1,877 $83,406 $2,085
Calvert $126,000 $59,234 $1,481 $67,681 $1,692 $76,128 $1,903 $84,575 $2,114
Caroline $67,500 $43,350 $1,084 $49,513 $1,238 $55,728 $1,393 $61,891 $1,547
Carroll $104,000 $58,384 $1,460 $66,725 $1,668 $75,066 $1,877 $83,406 $2,085
Cecil $96,600 $57,534 $1,438 $65,716 $1,643 $73,950 $1,849 $82,131 $2,053
Charles $126,000 $59,234 $1,481 $67,681 $1,692 $76,128 $1,903 $84,575 $2,114
Dorchester $68,400 $43,350 $1,084 $49,513 $1,238 $55,728 $1,393 $61,891 $1,547
Frederick $126,000 $59,234 $1,481 $67,681 $1,692 $76,128 $1,903 $84,575 $2,114
Garrett $61,500 $43,350 $1,084 $49,513 $1,238 $55,728 $1,393 $61,891 $1,547
Harford $104,000 $58,384 $1,460 $66,725 $1,668 $75,066 $1,877 $83,406 $2,085
Howard $104,000 $58,384 $1,460 $66,725 $1,668 $75,066 $1,877 $83,406 $2,085
Kent $78,700 $46,856 $1,171 $53,550 $1,339 $60,244 $1,506 $66,884 $1,672
Montgomery $126,000 $59,234 $1,481 $67,681 $1,692 $76,128 $1,903 $84,575 $2,114
Prince George's $126,000 $59,234 $1,481 $67,681 $1,692 $76,128 $1,903 $84,575 $2,114
Queen Anne's $104,000 $58,384 $1,460 $66,725 $1,668 $75,066 $1,877 $83,406 $2,085
St. Mary's $103,600 $58,384 $1,460 $66,725 $1,668 $75,066 $1,877 $83,406 $2,085
Somerset $54,800 $43,350 $1,084 $49,513 $1,238 $55,728 $1,393 $61,891 $1,547
Talbot $85,900 $51,106 $1,278 $58,438 $1,461 $65,716 $1,643 $72,994 $1,825
Washington $79,800 $47,494 $1,187 $54,294 $1,357 $61,094 $1,527 $67,841 $1,696
Wicomico $67,500 $43,350 $1,084 $49,513 $1,238 $55,728 $1,393 $61,891 $1,547
Worcester $76,000 $45,263 $1,132 $51,691 $1,292 $58,172 $1,454 $64,600 $1,615
Statewide $104,500 $58,384 $1,460 $66,725 $1,668 $75,066 $1,877 $83,406 $2,085

21
For informational purposes:
Calculations for 5%, 10%, 15%, 20%, 25% available upon request
Limits less <= 65% are based on 50% limits, =>70% are based on 80% limits.
For properties that have Low Income Tax Housing Tax Credits (LIHTC) included please refer to Low Income Housing Tax Credit Limits Source: DHCD – Housing Economic Research Office, U.S. Department of HUD
State of Maryland
2020 Income and Rent Limits
85 Percent of Area or State Median
Adjusted for Family Size 5-8 Person Households
5-Person Household 6-Person Household 7-Person Household 8-Person Household
Median Income Max Income Max Income Max Income Max
Jurisdictions Household Household Gross Household Gross Household Gross Household Gross
Income Limit Rent Limit Rent Limit Rent Limit Rent
Allegany $61,900 $66,884 $1,672 $71,825 $1,796 $76,766 $1,919 $81,706 $2,043
Anne Arundel $104,000 $90,100 $2,253 $96,794 $2,420 $103,434 $2,586 $110,128 $2,753
Baltimore $104,000 $90,100 $2,253 $96,794 $2,420 $103,434 $2,586 $110,128 $2,753
Baltimore City $104,000 $90,100 $2,253 $96,794 $2,420 $103,434 $2,586 $110,128 $2,753
Calvert $126,000 $91,375 $2,284 $98,122 $2,453 $104,922 $2,623 $111,669 $2,792
Caroline $67,500 $66,884 $1,672 $71,825 $1,796 $76,766 $1,919 $81,706 $2,043
Carroll $104,000 $90,100 $2,253 $96,794 $2,420 $103,434 $2,586 $110,128 $2,753
Cecil $96,600 $88,719 $2,218 $95,306 $2,383 $101,894 $2,547 $108,428 $2,711
Charles $126,000 $91,375 $2,284 $98,122 $2,453 $104,922 $2,623 $111,669 $2,792
Dorchester $68,400 $66,884 $1,672 $71,825 $1,796 $76,766 $1,919 $81,706 $2,043
Frederick $126,000 $91,375 $2,284 $98,122 $2,453 $104,922 $2,623 $111,669 $2,792
Garrett $61,500 $66,884 $1,672 $71,825 $1,796 $76,766 $1,919 $81,706 $2,043
Harford $104,000 $90,100 $2,253 $96,794 $2,420 $103,434 $2,586 $110,128 $2,753
Howard $104,000 $90,100 $2,253 $96,794 $2,420 $103,434 $2,586 $110,128 $2,753
Kent $78,700 $72,250 $1,806 $77,616 $1,940 $82,981 $2,075 $88,294 $2,207
Montgomery $126,000 $91,375 $2,284 $98,122 $2,453 $104,922 $2,623 $111,669 $2,792
Prince George's $126,000 $91,375 $2,284 $98,122 $2,453 $104,922 $2,623 $111,669 $2,792
Queen Anne's $104,000 $90,100 $2,253 $96,794 $2,420 $103,434 $2,586 $110,128 $2,753
St. Mary's $103,600 $90,100 $2,253 $96,794 $2,420 $103,434 $2,586 $110,128 $2,753
Somerset $54,800 $66,884 $1,672 $71,825 $1,796 $76,766 $1,919 $81,706 $2,043
Talbot $85,900 $78,838 $1,971 $84,681 $2,117 $90,525 $2,263 $96,369 $2,409
Washington $79,800 $73,313 $1,833 $78,731 $1,968 $84,150 $2,104 $89,569 $2,239
Wicomico $67,500 $66,884 $1,672 $71,825 $1,796 $76,766 $1,919 $81,706 $2,043
Worcester $76,000 $69,806 $1,745 $74,959 $1,874 $80,113 $2,003 $85,319 $2,133
Statewide $104,500 $90,100 $2,253 $96,741 $2,419 $103,434 $2,586 $110,075 $2,752

22
For informational purposes:
Calculations for 5%, 10%, 15%, 20%, 25% available upon request
Limits less <= 65% are based on 50% limits, =>70% are based on 80% limits.
For properties that have Low Income Tax Housing Tax Credits (LIHTC) included please refer to Low Income Housing Tax Credit Limits Source: DHCD – Housing Economic Research Office, U.S. Department of HUD
State of Maryland
2020 Income and Rent Limits
90 Percent of Area or State Median
Adjusted for Family Size 1-4 Person Households
1-Person Household 2-Person Household 3-Person Household 4-Person Household
Median Income Max Income Max Income Max Income Max
Jurisdictions Household Household Gross Household Gross Household Gross Household Gross
Income Limit Rent Limit Rent Limit Rent Limit Rent
Allegany $61,900 $45,900 $1,148 $52,425 $1,311 $59,006 $1,475 $65,531 $1,638
Anne Arundel $104,000 $61,819 $1,545 $70,650 $1,766 $79,481 $1,987 $88,313 $2,208
Baltimore $104,000 $61,819 $1,545 $70,650 $1,766 $79,481 $1,987 $88,313 $2,208
Baltimore City $104,000 $61,819 $1,545 $70,650 $1,766 $79,481 $1,987 $88,313 $2,208
Calvert $126,000 $62,719 $1,568 $71,663 $1,792 $80,606 $2,015 $89,550 $2,239
Caroline $67,500 $45,900 $1,148 $52,425 $1,311 $59,006 $1,475 $65,531 $1,638
Carroll $104,000 $61,819 $1,545 $70,650 $1,766 $79,481 $1,987 $88,313 $2,208
Cecil $96,600 $60,919 $1,523 $69,581 $1,740 $78,300 $1,958 $86,963 $2,174
Charles $126,000 $62,719 $1,568 $71,663 $1,792 $80,606 $2,015 $89,550 $2,239
Dorchester $68,400 $45,900 $1,148 $52,425 $1,311 $59,006 $1,475 $65,531 $1,638
Frederick $126,000 $62,719 $1,568 $71,663 $1,792 $80,606 $2,015 $89,550 $2,239
Garrett $61,500 $45,900 $1,148 $52,425 $1,311 $59,006 $1,475 $65,531 $1,638
Harford $104,000 $61,819 $1,545 $70,650 $1,766 $79,481 $1,987 $88,313 $2,208
Howard $104,000 $61,819 $1,545 $70,650 $1,766 $79,481 $1,987 $88,313 $2,208
Kent $78,700 $49,613 $1,240 $56,700 $1,418 $63,788 $1,595 $70,819 $1,770
Montgomery $126,000 $62,719 $1,568 $71,663 $1,792 $80,606 $2,015 $89,550 $2,239
Prince George's $126,000 $62,719 $1,568 $71,663 $1,792 $80,606 $2,015 $89,550 $2,239
Queen Anne's $104,000 $61,819 $1,545 $70,650 $1,766 $79,481 $1,987 $88,313 $2,208
St. Mary's $103,600 $61,819 $1,545 $70,650 $1,766 $79,481 $1,987 $88,313 $2,208
Somerset $54,800 $45,900 $1,148 $52,425 $1,311 $59,006 $1,475 $65,531 $1,638
Talbot $85,900 $54,113 $1,353 $61,875 $1,547 $69,581 $1,740 $77,288 $1,932
Washington $79,800 $50,288 $1,257 $57,488 $1,437 $64,688 $1,617 $71,831 $1,796
Wicomico $67,500 $45,900 $1,148 $52,425 $1,311 $59,006 $1,475 $65,531 $1,638
Worcester $76,000 $47,925 $1,198 $54,731 $1,368 $61,594 $1,540 $68,400 $1,710
Statewide $104,500 $61,819 $1,545 $70,650 $1,766 $79,481 $1,987 $88,313 $2,208
23
For informational purposes:
Calculations for 5%, 10%, 15%, 20%, 25% available upon request
Limits less <= 65% are based on 50% limits, =>70% are based on 80% limits.
For properties that have Low Income Tax Housing Tax Credits (LIHTC) included please refer to Low Income Housing Tax Credit Limits Source: DHCD – Housing Economic Research Office, U.S. Department of HUD
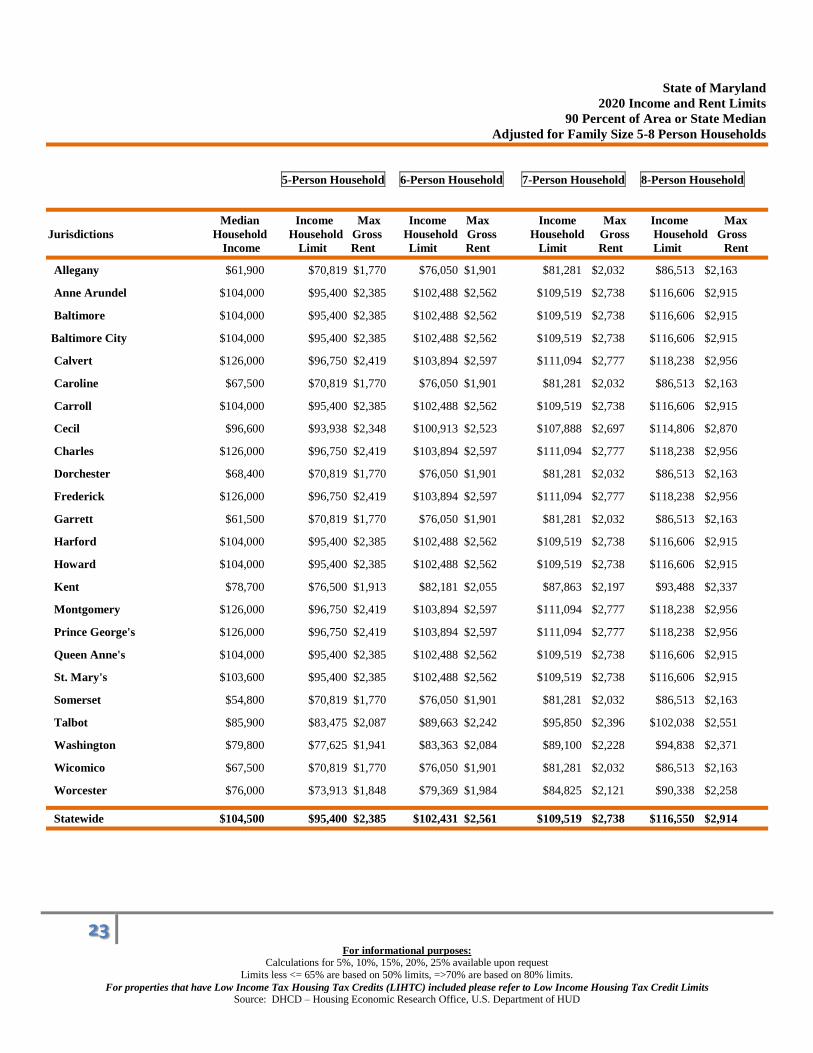
State of Maryland
2020 Income and Rent Limits
90 Percent of Area or State Median
Adjusted for Family Size 5-8 Person Households
5-Person Household 6-Person Household 7-Person Household 8-Person Household
Median Income Max Income Max Income Max Income Max
Jurisdictions Household Household Gross Household Gross Household Gross Household Gross
Income Limit Rent Limit Rent Limit Rent Limit Rent
Allegany $61,900 $70,819 $1,770 $76,050 $1,901 $81,281 $2,032 $86,513 $2,163
Anne Arundel $104,000 $95,400 $2,385 $102,488 $2,562 $109,519 $2,738 $116,606 $2,915
Baltimore $104,000 $95,400 $2,385 $102,488 $2,562 $109,519 $2,738 $116,606 $2,915
Baltimore City $104,000 $95,400 $2,385 $102,488 $2,562 $109,519 $2,738 $116,606 $2,915
Calvert $126,000 $96,750 $2,419 $103,894 $2,597 $111,094 $2,777 $118,238 $2,956
Caroline $67,500 $70,819 $1,770 $76,050 $1,901 $81,281 $2,032 $86,513 $2,163
Carroll $104,000 $95,400 $2,385 $102,488 $2,562 $109,519 $2,738 $116,606 $2,915
Cecil $96,600 $93,938 $2,348 $100,913 $2,523 $107,888 $2,697 $114,806 $2,870
Charles $126,000 $96,750 $2,419 $103,894 $2,597 $111,094 $2,777 $118,238 $2,956
Dorchester $68,400 $70,819 $1,770 $76,050 $1,901 $81,281 $2,032 $86,513 $2,163
Frederick $126,000 $96,750 $2,419 $103,894 $2,597 $111,094 $2,777 $118,238 $2,956
Garrett $61,500 $70,819 $1,770 $76,050 $1,901 $81,281 $2,032 $86,513 $2,163
Harford $104,000 $95,400 $2,385 $102,488 $2,562 $109,519 $2,738 $116,606 $2,915
Howard $104,000 $95,400 $2,385 $102,488 $2,562 $109,519 $2,738 $116,606 $2,915
Kent $78,700 $76,500 $1,913 $82,181 $2,055 $87,863 $2,197 $93,488 $2,337
Montgomery $126,000 $96,750 $2,419 $103,894 $2,597 $111,094 $2,777 $118,238 $2,956
Prince George's $126,000 $96,750 $2,419 $103,894 $2,597 $111,094 $2,777 $118,238 $2,956
Queen Anne's $104,000 $95,400 $2,385 $102,488 $2,562 $109,519 $2,738 $116,606 $2,915
St. Mary's $103,600 $95,400 $2,385 $102,488 $2,562 $109,519 $2,738 $116,606 $2,915
Somerset $54,800 $70,819 $1,770 $76,050 $1,901 $81,281 $2,032 $86,513 $2,163
Talbot $85,900 $83,475 $2,087 $89,663 $2,242 $95,850 $2,396 $102,038 $2,551
Washington $79,800 $77,625 $1,941 $83,363 $2,084 $89,100 $2,228 $94,838 $2,371
Wicomico $67,500 $70,819 $1,770 $76,050 $1,901 $81,281 $2,032 $86,513 $2,163
Worcester $76,000 $73,913 $1,848 $79,369 $1,984 $84,825 $2,121 $90,338 $2,258
Statewide $104,500 $95,400 $2,385 $102,431 $2,561 $109,519 $2,738 $116,550 $2,914
24
For informational purposes:
Calculations for 5%, 10%, 15%, 20%, 25% available upon request
Limits less <= 65% are based on 50% limits, =>70% are based on 80% limits.
For properties that have Low Income Tax Housing Tax Credits (LIHTC) included please refer to Low Income Housing Tax Credit Limits Source: DHCD – Housing Economic Research Office, U.S. Department of HUD
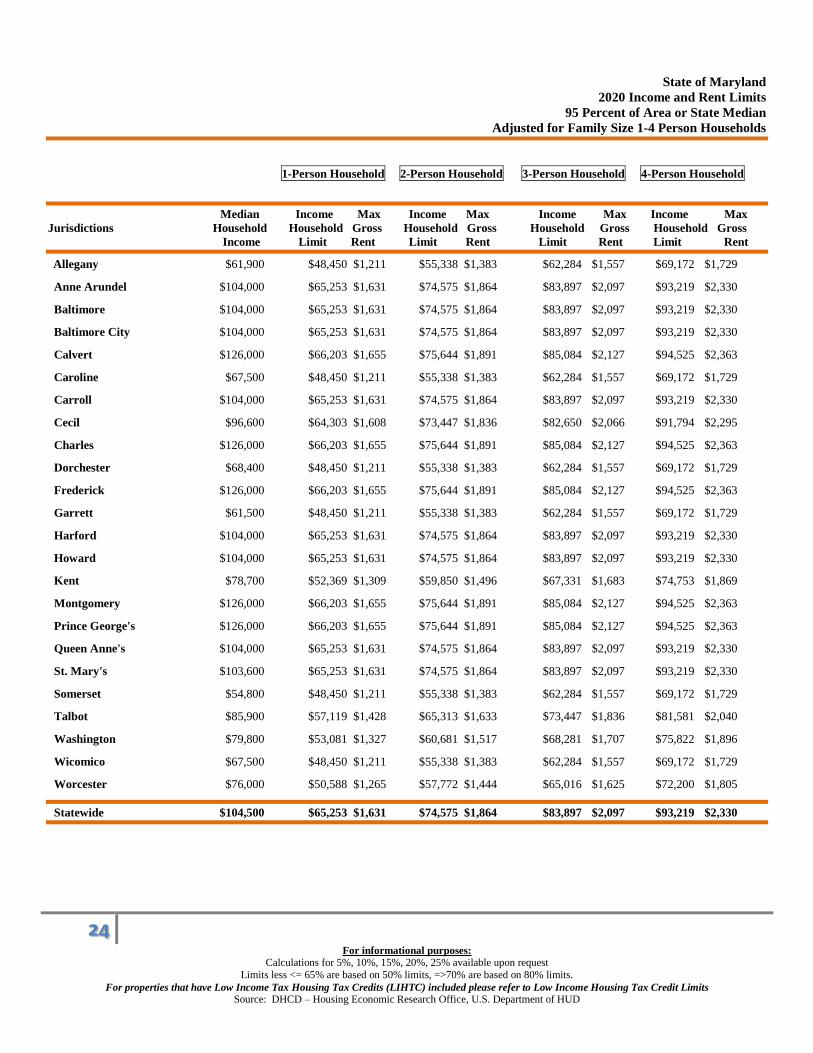
State of Maryland
2020 Income and Rent Limits
95 Percent of Area or State Median
Adjusted for Family Size 1-4 Person Households
1-Person Household 2-Person Household 3-Person Household 4-Person Household
Median Income Max Income Max Income Max Income Max
Jurisdictions Household Household Gross Household Gross Household Gross Household Gross
Income Limit Rent Limit Rent Limit Rent Limit Rent
Allegany $61,900 $48,450 $1,211 $55,338 $1,383 $62,284 $1,557 $69,172 $1,729
Anne Arundel $104,000 $65,253 $1,631 $74,575 $1,864 $83,897 $2,097 $93,219 $2,330
Baltimore $104,000 $65,253 $1,631 $74,575 $1,864 $83,897 $2,097 $93,219 $2,330
Baltimore City $104,000 $65,253 $1,631 $74,575 $1,864 $83,897 $2,097 $93,219 $2,330
Calvert $126,000 $66,203 $1,655 $75,644 $1,891 $85,084 $2,127 $94,525 $2,363
Caroline $67,500 $48,450 $1,211 $55,338 $1,383 $62,284 $1,557 $69,172 $1,729
Carroll $104,000 $65,253 $1,631 $74,575 $1,864 $83,897 $2,097 $93,219 $2,330
Cecil $96,600 $64,303 $1,608 $73,447 $1,836 $82,650 $2,066 $91,794 $2,295
Charles $126,000 $66,203 $1,655 $75,644 $1,891 $85,084 $2,127 $94,525 $2,363
Dorchester $68,400 $48,450 $1,211 $55,338 $1,383 $62,284 $1,557 $69,172 $1,729
Frederick $126,000 $66,203 $1,655 $75,644 $1,891 $85,084 $2,127 $94,525 $2,363
Garrett $61,500 $48,450 $1,211 $55,338 $1,383 $62,284 $1,557 $69,172 $1,729
Harford $104,000 $65,253 $1,631 $74,575 $1,864 $83,897 $2,097 $93,219 $2,330
Howard $104,000 $65,253 $1,631 $74,575 $1,864 $83,897 $2,097 $93,219 $2,330
Kent $78,700 $52,369 $1,309 $59,850 $1,496 $67,331 $1,683 $74,753 $1,869
Montgomery $126,000 $66,203 $1,655 $75,644 $1,891 $85,084 $2,127 $94,525 $2,363
Prince George's $126,000 $66,203 $1,655 $75,644 $1,891 $85,084 $2,127 $94,525 $2,363
Queen Anne's $104,000 $65,253 $1,631 $74,575 $1,864 $83,897 $2,097 $93,219 $2,330
St. Mary's $103,600 $65,253 $1,631 $74,575 $1,864 $83,897 $2,097 $93,219 $2,330
Somerset $54,800 $48,450 $1,211 $55,338 $1,383 $62,284 $1,557 $69,172 $1,729
Talbot $85,900 $57,119 $1,428 $65,313 $1,633 $73,447 $1,836 $81,581 $2,040
Washington $79,800 $53,081 $1,327 $60,681 $1,517 $68,281 $1,707 $75,822 $1,896
Wicomico $67,500 $48,450 $1,211 $55,338 $1,383 $62,284 $1,557 $69,172 $1,729
Worcester $76,000 $50,588 $1,265 $57,772 $1,444 $65,016 $1,625 $72,200 $1,805
Statewide $104,500 $65,253 $1,631 $74,575 $1,864 $83,897 $2,097 $93,219 $2,330

25
For informational purposes:
Calculations for 5%, 10%, 15%, 20%, 25% available upon request
Limits less <= 65% are based on 50% limits, =>70% are based on 80% limits.
For properties that have Low Income Tax Housing Tax Credits (LIHTC) included please refer to Low Income Housing Tax Credit Limits Source: DHCD – Housing Economic Research Office, U.S. Department of HUD
State of Maryland
2020 Income and Rent Limits
95 Percent of Area or State Median
Adjusted for Family Size 5-8 Person Households
5-Person Household 6-Person Household 7-Person Household 8-Person Household
Median Income Max Income Max Income Max Income Max
Jurisdictions Household Household Gross Household Gross Household Gross Household Gross
Income Limit Rent Limit Rent Limit Rent Limit Rent
Allegany $61,900 $74,753 $1,869 $80,275 $2,007 $85,797 $2,145 $91,319 $2,283
Anne Arundel $104,000 $100,700 $2,518 $108,181 $2,705 $115,603 $2,890 $123,084 $3,077
Baltimore $104,000 $100,700 $2,518 $108,181 $2,705 $115,603 $2,890 $123,084 $3,077
Baltimore City $104,000 $100,700 $2,518 $108,181 $2,705 $115,603 $2,890 $123,084 $3,077
Calvert $126,000 $102,125 $2,553 $109,666 $2,742 $117,266 $2,932 $124,806 $3,120
Caroline $67,500 $74,753 $1,869 $80,275 $2,007 $85,797 $2,145 $91,319 $2,283
Carroll $104,000 $100,700 $2,518 $108,181 $2,705 $115,603 $2,890 $123,084 $3,077
Cecil $96,600 $99,156 $2,479 $106,519 $2,663 $113,881 $2,847 $121,184 $3,030
Charles $126,000 $102,125 $2,553 $109,666 $2,742 $117,266 $2,932 $124,806 $3,120
Dorchester $68,400 $74,753 $1,869 $80,275 $2,007 $85,797 $2,145 $91,319 $2,283
Frederick $126,000 $102,125 $2,553 $109,666 $2,742 $117,266 $2,932 $124,806 $3,120
Garrett $61,500 $74,753 $1,869 $80,275 $2,007 $85,797 $2,145 $91,319 $2,283
Harford $104,000 $100,700 $2,518 $108,181 $2,705 $115,603 $2,890 $123,084 $3,077
Howard $104,000 $100,700 $2,518 $108,181 $2,705 $115,603 $2,890 $123,084 $3,077
Kent $78,700 $80,750 $2,019 $86,747 $2,169 $92,744 $2,319 $98,681 $2,467
Montgomery $126,000 $102,125 $2,553 $109,666 $2,742 $117,266 $2,932 $124,806 $3,120
Prince George's $126,000 $102,125 $2,553 $109,666 $2,742 $117,266 $2,932 $124,806 $3,120
Queen Anne's $104,000 $100,700 $2,518 $108,181 $2,705 $115,603 $2,890 $123,084 $3,077
St. Mary's $103,600 $100,700 $2,518 $108,181 $2,705 $115,603 $2,890 $123,084 $3,077
Somerset $54,800 $74,753 $1,869 $80,275 $2,007 $85,797 $2,145 $91,319 $2,283
Talbot $85,900 $88,113 $2,203 $94,644 $2,366 $101,175 $2,529 $107,706 $2,693
Washington $79,800 $81,938 $2,048 $87,994 $2,200 $94,050 $2,351 $100,106 $2,503
Wicomico $67,500 $74,753 $1,869 $80,275 $2,007 $85,797 $2,145 $91,319 $2,283
Worcester $76,000 $78,019 $1,950 $83,778 $2,094 $89,538 $2,238 $95,356 $2,384
Statewide $104,500 $100,700 $2,518 $108,122 $2,703 $115,603 $2,890 $123,025 $3,076
26
For informational purposes:
Calculations for 5%, 10%, 15%, 20%, 25% available upon request
Limits less <= 65% are based on 50% limits, =>70% are based on 80% limits.
For properties that have Low Income Tax Housing Tax Credits (LIHTC) included please refer to Low Income Housing Tax Credit Limits Source: DHCD – Housing Economic Research Office, U.S. Department of HUD
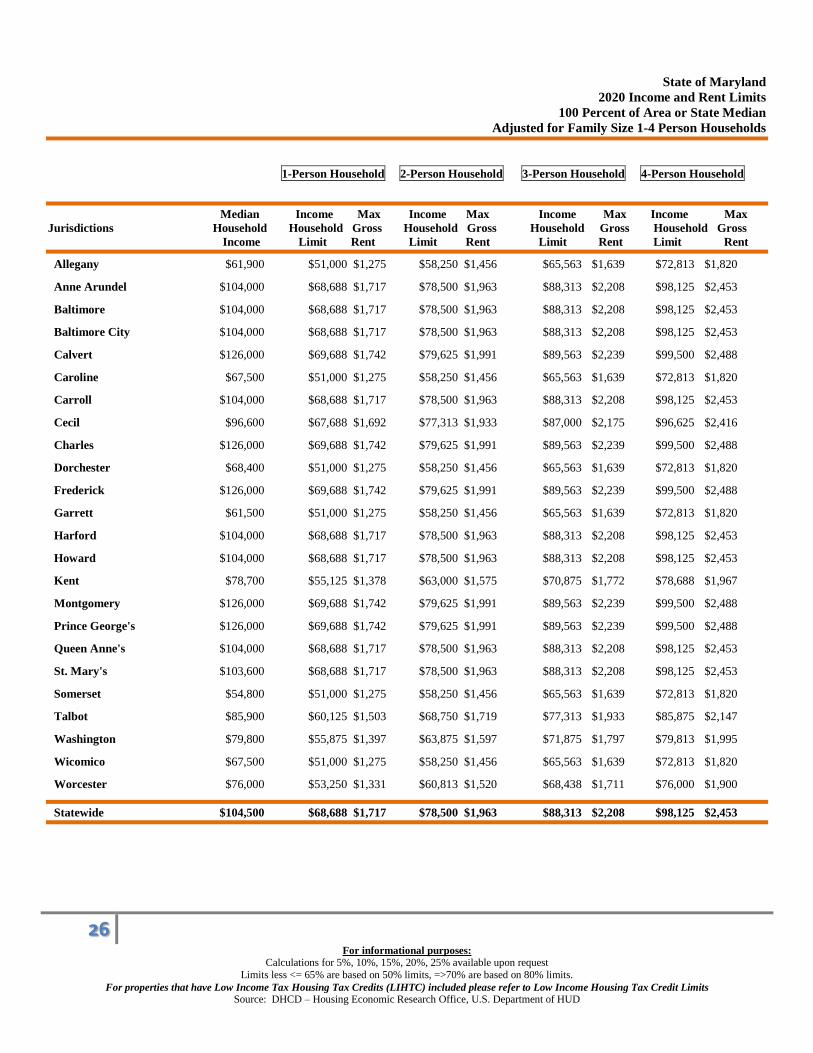
State of Maryland
2020 Income and Rent Limits
100 Percent of Area or State Median
Adjusted for Family Size 1-4 Person Households
1-Person Household 2-Person Household 3-Person Household 4-Person Household
Median Income Max Income Max Income Max Income Max
Jurisdictions Household Household Gross Household Gross Household Gross Household Gross
Income Limit Rent Limit Rent Limit Rent Limit Rent
Allegany $61,900 $51,000 $1,275 $58,250 $1,456 $65,563 $1,639 $72,813 $1,820
Anne Arundel $104,000 $68,688 $1,717 $78,500 $1,963 $88,313 $2,208 $98,125 $2,453
Baltimore $104,000 $68,688 $1,717 $78,500 $1,963 $88,313 $2,208 $98,125 $2,453
Baltimore City $104,000 $68,688 $1,717 $78,500 $1,963 $88,313 $2,208 $98,125 $2,453
Calvert $126,000 $69,688 $1,742 $79,625 $1,991 $89,563 $2,239 $99,500 $2,488
Caroline $67,500 $51,000 $1,275 $58,250 $1,456 $65,563 $1,639 $72,813 $1,820
Carroll $104,000 $68,688 $1,717 $78,500 $1,963 $88,313 $2,208 $98,125 $2,453
Cecil $96,600 $67,688 $1,692 $77,313 $1,933 $87,000 $2,175 $96,625 $2,416
Charles $126,000 $69,688 $1,742 $79,625 $1,991 $89,563 $2,239 $99,500 $2,488
Dorchester $68,400 $51,000 $1,275 $58,250 $1,456 $65,563 $1,639 $72,813 $1,820
Frederick $126,000 $69,688 $1,742 $79,625 $1,991 $89,563 $2,239 $99,500 $2,488
Garrett $61,500 $51,000 $1,275 $58,250 $1,456 $65,563 $1,639 $72,813 $1,820
Harford $104,000 $68,688 $1,717 $78,500 $1,963 $88,313 $2,208 $98,125 $2,453
Howard $104,000 $68,688 $1,717 $78,500 $1,963 $88,313 $2,208 $98,125 $2,453
Kent $78,700 $55,125 $1,378 $63,000 $1,575 $70,875 $1,772 $78,688 $1,967
Montgomery $126,000 $69,688 $1,742 $79,625 $1,991 $89,563 $2,239 $99,500 $2,488
Prince George's $126,000 $69,688 $1,742 $79,625 $1,991 $89,563 $2,239 $99,500 $2,488
Queen Anne's $104,000 $68,688 $1,717 $78,500 $1,963 $88,313 $2,208 $98,125 $2,453
St. Mary's $103,600 $68,688 $1,717 $78,500 $1,963 $88,313 $2,208 $98,125 $2,453
Somerset $54,800 $51,000 $1,275 $58,250 $1,456 $65,563 $1,639 $72,813 $1,820
Talbot $85,900 $60,125 $1,503 $68,750 $1,719 $77,313 $1,933 $85,875 $2,147
Washington $79,800 $55,875 $1,397 $63,875 $1,597 $71,875 $1,797 $79,813 $1,995
Wicomico $67,500 $51,000 $1,275 $58,250 $1,456 $65,563 $1,639 $72,813 $1,820
Worcester $76,000 $53,250 $1,331 $60,813 $1,520 $68,438 $1,711 $76,000 $1,900
Statewide $104,500 $68,688 $1,717 $78,500 $1,963 $88,313 $2,208 $98,125 $2,453

27
For informational purposes:
Calculations for 5%, 10%, 15%, 20%, 25% available upon request
Limits less <= 65% are based on 50% limits, =>70% are based on 80% limits.
For properties that have Low Income Tax Housing Tax Credits (LIHTC) included please refer to Low Income Housing Tax Credit Limits Source: DHCD – Housing Economic Research Office, U.S. Department of HUD
State of Maryland
2020 Income and Rent Limits
100 Percent of Area or State Median
Adjusted for Family Size 5-8 Person Households
5-Person Household 6-Person Household 7-Person Household 8-Person Household
Median Income Max Income Max Income Max Income Max
Jurisdictions Household Household Gross Household Gross Household Gross Household Gross
Income Limit Rent Limit Rent Limit Rent Limit Rent
Allegany $61,900 $78,688 $1,967 $84,500 $2,113 $90,313 $2,258 $96,125 $2,403
Anne Arundel $104,000 $106,000 $2,650 $113,875 $2,847 $121,688 $3,042 $129,563 $3,239
Baltimore $104,000 $106,000 $2,650 $113,875 $2,847 $121,688 $3,042 $129,563 $3,239
Baltimore City $104,000 $106,000 $2,650 $113,875 $2,847 $121,688 $3,042 $129,563 $3,239
Calvert $126,000 $107,500 $2,688 $115,438 $2,886 $123,438 $3,086 $131,375 $3,284
Caroline $67,500 $78,688 $1,967 $84,500 $2,113 $90,313 $2,258 $96,125 $2,403
Carroll $104,000 $106,000 $2,650 $113,875 $2,847 $121,688 $3,042 $129,563 $3,239
Cecil $96,600 $104,375 $2,609 $112,125 $2,803 $119,875 $2,997 $127,563 $3,189
Charles $126,000 $107,500 $2,688 $115,438 $2,886 $123,438 $3,086 $131,375 $3,284
Dorchester $68,400 $78,688 $1,967 $84,500 $2,113 $90,313 $2,258 $96,125 $2,403
Frederick $126,000 $107,500 $2,688 $115,438 $2,886 $123,438 $3,086 $131,375 $3,284
Garrett $61,500 $78,688 $1,967 $84,500 $2,113 $90,313 $2,258 $96,125 $2,403
Harford $104,000 $106,000 $2,650 $113,875 $2,847 $121,688 $3,042 $129,563 $3,239
Howard $104,000 $106,000 $2,650 $113,875 $2,847 $121,688 $3,042 $129,563 $3,239
Kent $78,700 $85,000 $2,125 $91,313 $2,283 $97,625 $2,441 $103,875 $2,597
Montgomery $126,000 $107,500 $2,688 $115,438 $2,886 $123,438 $3,086 $131,375 $3,284
Prince George's $126,000 $107,500 $2,688 $115,438 $2,886 $123,438 $3,086 $131,375 $3,284
Queen Anne's $104,000 $106,000 $2,650 $113,875 $2,847 $121,688 $3,042 $129,563 $3,239
St. Mary's $103,600 $106,000 $2,650 $113,875 $2,847 $121,688 $3,042 $129,563 $3,239
Somerset $54,800 $78,688 $1,967 $84,500 $2,113 $90,313 $2,258 $96,125 $2,403
Talbot $85,900 $92,750 $2,319 $99,625 $2,491 $106,500 $2,663 $113,375 $2,834
Washington $79,800 $86,250 $2,156 $92,625 $2,316 $99,000 $2,475 $105,375 $2,634
Wicomico $67,500 $78,688 $1,967 $84,500 $2,113 $90,313 $2,258 $96,125 $2,403
Worcester $76,000 $82,125 $2,053 $88,188 $2,205 $94,250 $2,356 $100,375 $2,509
Statewide $104,500 $106,000 $2,650 $113,813 $2,845 $121,688 $3,042 $129,500 $3,238