2020-21 budget chart pack
TRANSCRIPT
1|
2020-21 Budget Chart Pack
A graphical summary of the 2020-21 Budget relative to the 2019-20 MYEFO

2|Parliamentary Budget Office
Foreword
These charts provide a visual summary of the key drivers of the changes between the 2019-20 Mid-Year Economic and Fiscal Outlook (MYEFO) and the 2020-21 Budget at an aggregate level and by major area of revenue and spending.
Each chart contains the following elements for a given area of revenue or expenditure:1
• the historical data
• the budget estimates from the 2020-21 Budget, 2019-20 MYEFO and, where available, the 2020-21 MYEFO2
• a decomposition of policy decisions and parameter variations between the 2019-20 MYEFO and the latest Budget
• policy decisions comprise the revisions due to discretionary interventions by the government announced after the 2019-20 MYEFO, up to and including the 2020-21 Budget. Policy changes announced in previous updates are already included in the estimates (the lines in the charts) but not shown as variations (the bars).
• parameter variations incorporates changes for any other reason, including revised economic conditions, revisions to a program’s estimated recipient numbers, and re-profiling of expenditure.3
For an explanation of common budget terms, see the Parliamentary Budget Office’s (PBO) online budget glossaryhttps://www.aph.gov.au/About_Parliament/Parliamentary_Departments/Parliamentary_Budget_Office/Online_Budget_Glossary.
1 The underlying cash balance, total receipts and total payments have been presented on a cash basis. All other charts are presented on an accrual basis.2 ‘Budget estimates’ is an official term used to describe the expected outcomes over the forward estimates period, which for this budget is 2020-21 to
2023-24.3 Parameter variations are only shown to 2022-23 for individual programs and heads of revenue, as this is the latest year for which estimates were
provided in the 2019-20 MYEFO.
3|Parliamentary Budget Office
-80
-40
0
40
80
200
300
400
500
600
2007-08 2009-10 2011-12 2013-14 2015-16 2017-18 2019-20 2021-22 2023-24
$b$b Title
2019-20 MYEFO (LHS)
2020-21 Budget (LHS)
Parameter (RHS)
Policy decisions (RHS)
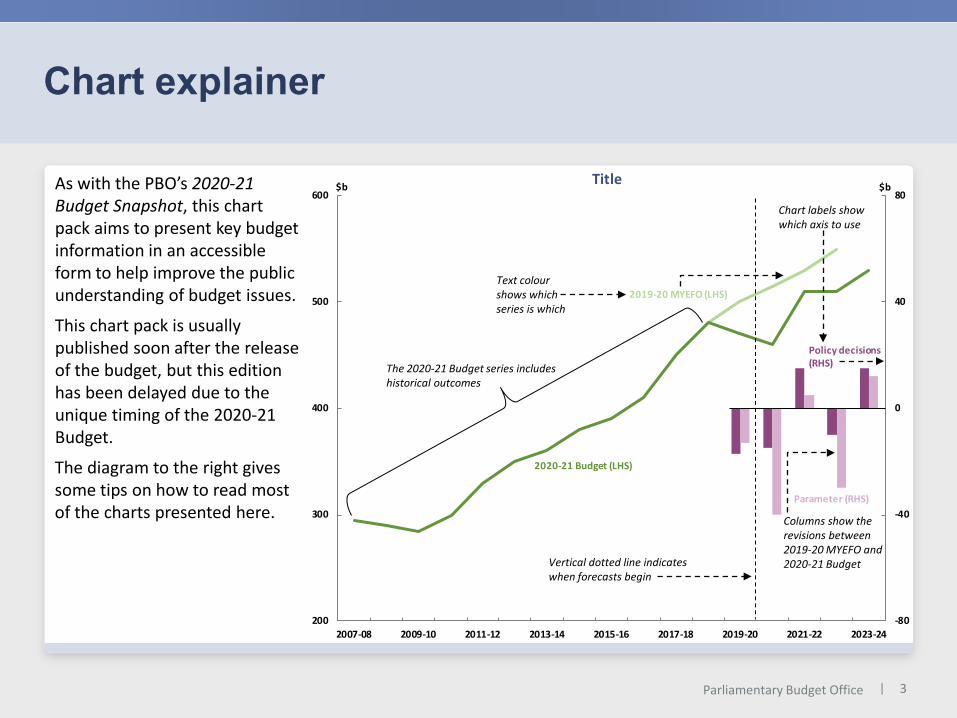
Chart explainer
Chart labels show which axis to use
Vertical dotted line indicates when forecasts begin
As with the PBO’s 2020-21 Budget Snapshot, this chart pack aims to present key budget information in an accessible form to help improve the public understanding of budget issues.
This chart pack is usually published soon after the release of the budget, but this edition has been delayed due to the unique timing of the 2020-21 Budget.
The diagram to the right gives some tips on how to read most of the charts presented here.
Text colour shows which series is which
The 2020-21 Budget series includes historical outcomes
Columns show the revisions between 2019-20 MYEFO and 2020-21 Budget
4|Parliamentary Budget Office
-240
-160
-80
0
80
160
240
-240
-160
-80
0
80
160
240
2007-08 2009-10 2011-12 2013-14 2015-16 2017-18 2019-20 2021-22 2023-24
$b$b Underlying cash balance
2019-20 MYEFO
2020-21 Budget
Revisions to payments
Revisions to receipts2020-21
MYEFO
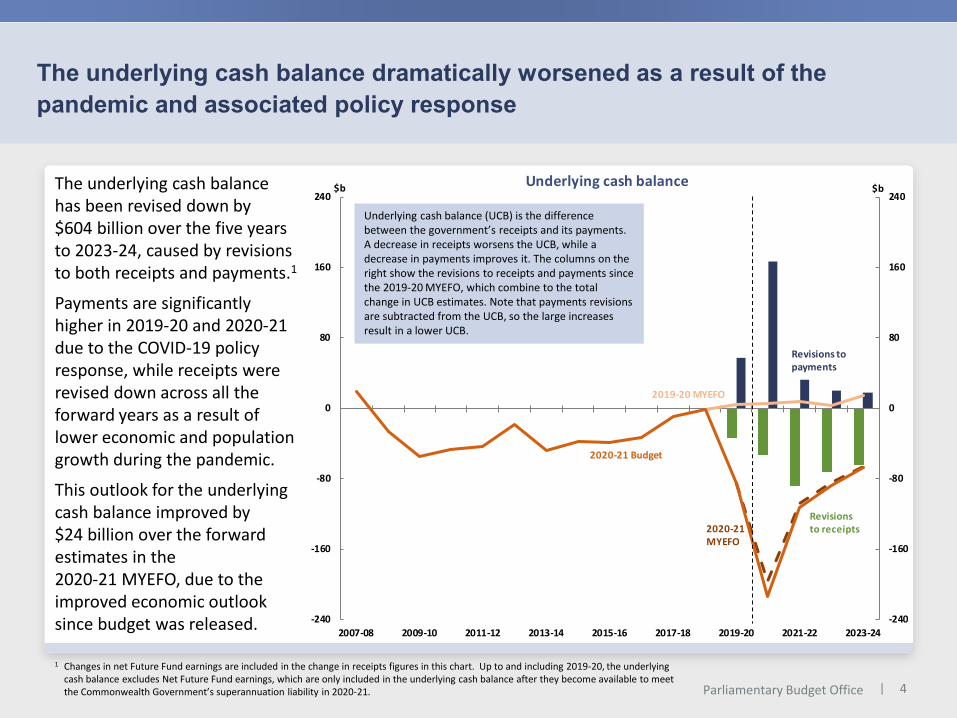
The underlying cash balance dramatically worsened as a result of the pandemic and associated policy response
The underlying cash balance has been revised down by$604 billion over the five years to 2023-24, caused by revisions to both receipts and payments.1
Payments are significantly higher in 2019-20 and 2020-21 due to the COVID-19 policy response, while receipts were revised down across all the forward years as a result of lower economic and population growth during the pandemic.
This outlook for the underlying cash balance improved by$24 billion over the forward estimates in the2020-21 MYEFO, due to the improved economic outlook since budget was released.
1 Changes in net Future Fund earnings are included in the change in receipts figures in this chart. Up to and including 2019-20, the underlying cash balance excludes Net Future Fund earnings, which are only included in the underlying cash balance after they become available to meet the Commonwealth Government’s superannuation liability in 2020-21.
Underlying cash balance (UCB) is the difference between the government’s receipts and its payments. A decrease in receipts worsens the UCB, while a decrease in payments improves it. The columns on the right show the revisions to receipts and payments since the 2019-20 MYEFO, which combine to the total change in UCB estimates. Note that payments revisions are subtracted from the UCB, so the large increases result in a lower UCB.

5|Parliamentary Budget Office
Revisions to fiscal balance were far larger than those caused by the Global Financial Crisis
The fiscal balance is a budget aggregate reflecting the revenue earned and expenses incurred in a financial year, regardless of when the money is actually paid.
This chart shows the estimates of fiscal balance from each budget, starting from the2007-08 Budget up to the2020-21 Budget.
The revisions due to COVID-19 eclipse typical revisions to budget estimates, even those that occurred after the Global Financial Crisis in 2007-08.
-250
-200
-150
-100
-50
0
50
-250
-200
-150
-100
-50
0
50
2007-08 2009-10 2011-12 2013-14 2015-16 2017-18 2019-20 2021-22 2023-24
$b$b Fiscal balance - projections in recent history
2020-21 Budget
Historical forecasts2019-20 Budget

6|Parliamentary Budget Office
Downward revisions to receipts were driven by weaker economic forecasts…
Receipts have been revised down across almost every head of revenue, driven by significant declines in economic parameter forecasts totalling a $233 billion downgrade in estimated receipts over the forward estimates.
Policy decisions, particularly company tax relief and the changes to the personal income tax cuts, result in a downward revision of $44 billion over the forward estimates.
This outlook improved slightly in the 2020-21 MYEFO, as a number of these parameters were revised up due to an improved economic outlook since the budget was released. -80
-40
0
40
80
200
300
400
500
600
2007-08 2009-10 2011-12 2013-14 2015-16 2017-18 2019-20 2021-22 2023-24
$b$b Total receipts
2019-20 MYEFO (LHS)
2020-21 Budget (LHS)
Parameter (RHS)
Policy decisions (RHS)
2020-21 MYEFO(LHS)

7|Parliamentary Budget Office
… most notably for nominal Gross Domestic Product (GDP) growth
The COVID-19 pandemic caused a recession in Australia and across the globe. Nominal GDP growth was revised down significantly, with negative growth forecast for 2020-21.
While the growth rate is expected to recover to historical levels, the level of nominal GDP is forecast to remain substantially lower into the future than was expected at the 2019-20 MYEFO.
Source: Australian National Accounts: National Income, Expenditure and Product
-2
0
2
4
6
8
10
-2
0
2
4
6
8
10
2007-08 2009-10 2011-12 2013-14 2015-16 2017-18 2019-20 2021-22 2023-24
Nominal GDP growth% %
2020-21 Budget
2019-20 MYEFO

8|Parliamentary Budget Office
Lower net overseas migration is a key factor in lower GDP growth
As a result of the pandemic, net overseas migration has been revised down for each year of the forward estimates period. Between 2019-20 and 2022-23, these revisions are equivalent to around 900,000 fewer people migrating to Australia.1
Lower expected net overseas migration leads to a decrease in Australia’s working age population.
A smaller working age population feeds through to lower economic growth. This restricted growth is reflected in downward revisions for every major head of revenue.
Source: ABS Migration Australia1 For the 2016-17 to 2019-20 Budgets, forecasts were produced on a calendar year basis. The historical series and the 2020-21 budget estimates (orange line) were produced on a financial year basis.
-0.4
0.0
0.4
0.8
1.2
1.6
-0.4
0.0
0.4
0.8
1.2
1.6
Jun 2008 Jun 2010 Jun 2012 Jun 2014 Jun 2016 Jun 2018 Jun 2020 Jun 2022 Jun 2024
Net overseas migration as a share of the population
2019-20 Budget
2020-21 Budget
% %
2018-19 Budget2017-18 Budget
2016-17 Budget
9|Parliamentary Budget Office
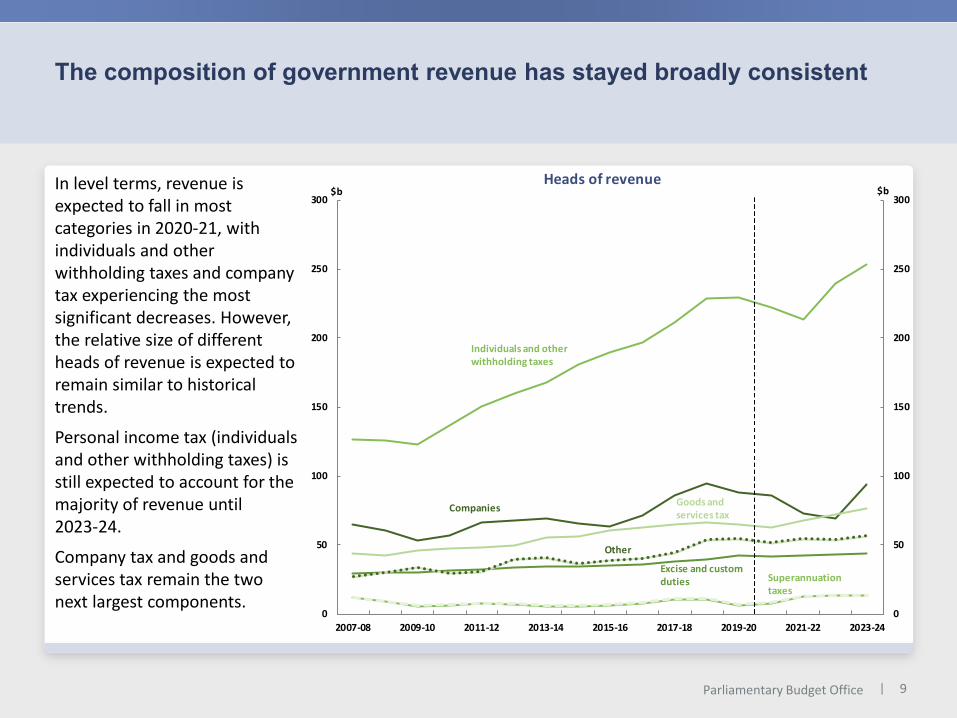
The composition of government revenue has stayed broadly consistent
In level terms, revenue is expected to fall in most categories in 2020-21, with individuals and other withholding taxes and company tax experiencing the most significant decreases. However, the relative size of different heads of revenue is expected to remain similar to historical trends.
Personal income tax (individuals and other withholding taxes) is still expected to account for the majority of revenue until2023-24.
Company tax and goods and services tax remain the two next largest components.
0
50
100
150
200
250
300
0
50
100
150
200
250
300
2007-08 2009-10 2011-12 2013-14 2015-16 2017-18 2019-20 2021-22 2023-24
$b$bHeads of revenue
Individuals and other withholding taxes
Companies Goods and services tax
Other
Excise and custom duties Superannuation
taxes

10|Parliamentary Budget Office
Personal income tax has been revised downward due to both policy decisions and parameter variations…
Wage and population growth have been revised down over the forward estimates, while unemployment has been revised up, peaking at over7 per cent. These are the main drivers for the $84 billion parameter revision to personal income tax revenue between 2019-20 and 2022-23.
Policy decisions, such as bringing forward income tax cuts, also result in a decrease in estimated income tax revenue of $23 billion between 2019-20 and 2022-23.
There was very little change to these estimates in the2020-21 MYEFO.
-40
-20
0
20
40
100
150
200
250
300
2007-08 2009-10 2011-12 2013-14 2015-16 2017-18 2019-20 2021-22 2023-24
$b$b Individuals and other withholding tax
2019-20 MYEFO (LHS)
2020-21 Budget (LHS)
Parameter (RHS)
Policy decisions (RHS)2020-21 MYEFO
(LHS)

11|Parliamentary Budget Office
…as has company tax
Parameter variations account for $35 billion of the downward revisions to company tax revenue across the budget estimates.
Company tax revenue was also revised down as a result of the policy response to the pandemic.
For example, the JobMaker plan provided immediate tax deductions for small businesses acquiring new assets. This measure is the main component of the $54 billion policy revision to company tax revenue over the forward estimates.
-30
-15
0
15
30
25
50
75
100
125
2007-08 2009-10 2011-12 2013-14 2015-16 2017-18 2019-20 2021-22 2023-24
$b$b Company tax
Parameter (RHS)Policy decisions (RHS)
2020-21 Budget (LHS)
2019-20 MYEFO (LHS)
2020-21 MYEFO (LHS)
12|Parliamentary Budget Office
-8
-4
0
4
8
30
45
60
75
90
2007-08 2009-10 2011-12 2013-14 2015-16 2017-18 2019-20 2021-22 2023-24
$b$b Goods and services tax
2019-20 MYEFO (LHS)
2020-21 Budget (LHS)
Parameter (RHS)
Policy decisions (RHS)2020-21 MYEFO(LHS)
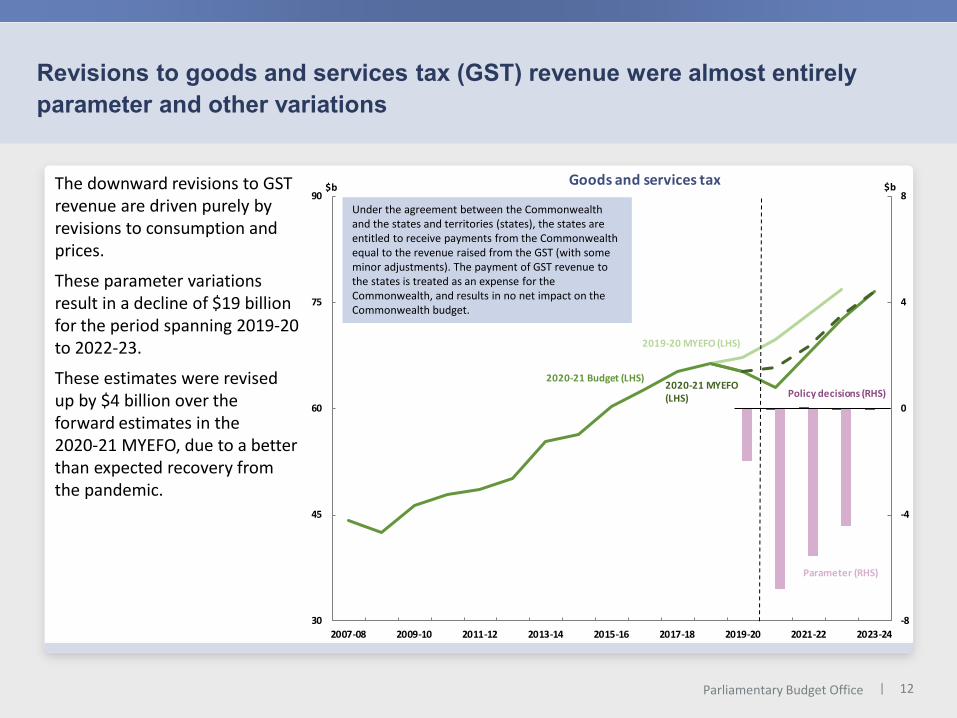
Revisions to goods and services tax (GST) revenue were almost entirely parameter and other variations
The downward revisions to GST revenue are driven purely by revisions to consumption and prices.
These parameter variations result in a decline of $19 billion for the period spanning 2019-20 to 2022-23.
These estimates were revised up by $4 billion over the forward estimates in the2020-21 MYEFO, due to a better than expected recovery from the pandemic.
Under the agreement between the Commonwealth and the states and territories (states), the states are entitled to receive payments from the Commonwealth equal to the revenue raised from the GST (with some minor adjustments). The payment of GST revenue to the states is treated as an expense for the Commonwealth, and results in no net impact on the Commonwealth budget.

13|Parliamentary Budget Office
Payments have been revised up in each year of the forward estimates
Relative to the 2019-20 MYEFO, payments are expected to be $295 billion higher over the five years to 2023-24. Of these revisions, $148 billion occur in 2020-21 due to policy decisions.
Parameter variations accounted for $48 billion of the increase to 2023-24. This includes decreased GST payments to the states due to lower revenue collections.
The government announced a number of policy decisions in response to the pandemic. JobKeeper and the coronavirus supplement were the largest contributors to the spending increase.
-240
-160
-80
0
80
160
240
200
300
400
500
600
700
2007-08 2009-10 2011-12 2013-14 2015-16 2017-18 2019-20 2021-22 2023-24
$b$b Total payments
2019-20 MYEFO (LHS)
2020-21 Budget (LHS)
Parameter - other (RHS)
Policy decisions (RHS)
2020-21 MYEFO (LHS)
Parameter - GST (RHS)

14|Parliamentary Budget Office
Social security and welfare is still the largest category of Commonwealth expenses
Expenses have increased across several categories due to the pandemic.
Estimates of other economic affairs, which incorporates the JobKeeper payment, is expected to peak at over 10 times its historical average in 2020-21.
Excluding other economic affairs, the relative size of other expenses is expected to stay broadly consistent with historical trends.
0
50
100
150
200
250
0
50
100
150
200
250
2007-08 2009-10 2011-12 2013-14 2015-16 2017-18 2019-20 2021-22 2023-24
$b$bExpenses by function
Social security and welfare
DefenceGeneral public servicesEducation
Other economic affairs
Health
15|Parliamentary Budget Office
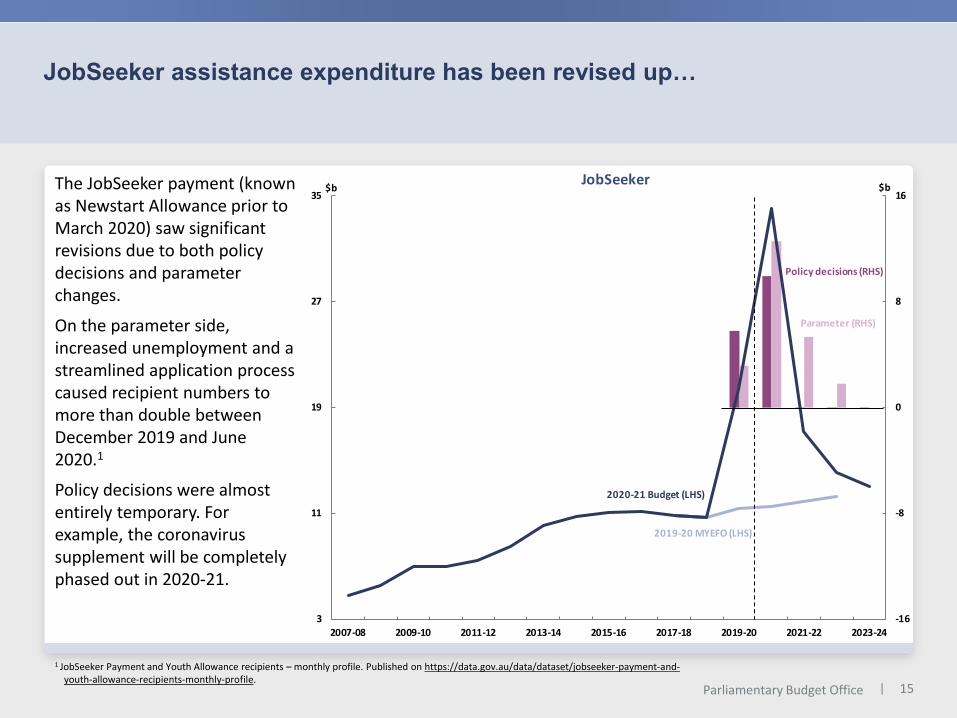
JobSeeker assistance expenditure has been revised up…
The JobSeeker payment (known as Newstart Allowance prior to March 2020) saw significant revisions due to both policy decisions and parameter changes.
On the parameter side, increased unemployment and a streamlined application process caused recipient numbers to more than double between December 2019 and June 2020.1
Policy decisions were almost entirely temporary. For example, the coronavirus supplement will be completely phased out in 2020-21.
1 JobSeeker Payment and Youth Allowance recipients – monthly profile. Published on https://data.gov.au/data/dataset/jobseeker-payment-and-youth-allowance-recipients-monthly-profile.
-16
-8
0
8
16
3
11
19
27
35
2007-08 2009-10 2011-12 2013-14 2015-16 2017-18 2019-20 2021-22 2023-24
$b$bJobSeeker
2019-20 MYEFO (LHS)
2020-21 Budget (LHS)
Parameter (RHS)
Policy decisions (RHS)

16|Parliamentary Budget Office
…and expenditure on other economic affairs has been dramatically increased due to JobKeeper
Other economic affairs includes miscellaneous expenses designed to help economic growth such as tourism, labour market assistance and industrial relations.
A number of the economic policies introduced in response to the pandemic, including JobKeeper, the JobMaker hiring credit, and Boosting Apprenticeships, are in this category.
The pandemic-related programs will be largely phased out by 2021-22, but some changes remain present until the end of the forward estimates.
-80
-40
0
40
80
0
20
40
60
80
100
2007-08 2009-10 2011-12 2013-14 2015-16 2017-18 2019-20 2021-22 2023-24
$b$bOther economic affairs
2019-20 MYEFO (LHS)
2020-21 Budget (LHS)
Parameter (RHS)
Policy decisions (RHS)
2020-21 MYEFO (LHS)

17|Parliamentary Budget Office
New policy measures are offset by lower price and wage growth in the aged care sector
Expenditure on aged care is sensitive to the wages of nurses and carers, as well as the prices of facilities and goods.
These prices and wages had restricted growth in 2019-20, and their growth rate is not expected to recover topre-pandemic levels over the forward estimates, resulting in downward parameter variations in each year.
The effects of lower price and wage growth are offset by new policy measures, including the release of an additional 23,000 home care packages.
-8
-4
0
4
8
8
13
18
23
28
2007-08 2009-10 2011-12 2013-14 2015-16 2017-18 2019-20 2021-22 2023-24
$b$bAged care
2019-20 MYEFO (LHS)
2020-21 Budget (LHS)
Parameter (RHS)
Policy decisions (RHS)

18|Parliamentary Budget Office
Infrastructure expenditure has been revised up due to new initiatives
Expenditure on road and rail infrastructure has been revised up by $7.5 billion over the forward estimates.
Downward revisions resulting from changes to price parameters are overshadowed by new grants to the states and territories introduced since the beginning of the pandemic.
The new grants include the Road Safety Program and additional funding for the Local Roads and Community Infrastructure Program.
-8
-4
0
4
8
2
4
6
8
10
12
14
2007-08 2009-10 2011-12 2013-14 2015-16 2017-18 2019-20 2021-22 2023-24
$b$b Infrastructure
2020-21 Budget (LHS)
2019-20 MYEFO(LHS)
Policy decisions (RHS)
Parameter (RHS)

19|Parliamentary Budget Office
Net debt is expected to more than double between 2018-19 and2023-24…
Given the magnitude of budget deficits over the forward estimates, net debt has been revised upwards significantly.
Net interest expenses, however, remain fairly consistent. Historically low interest rates mean that interest expenses on higher debt levels are relatively stable over the forward estimates.
Prior to COVID-19, net debt was expected to slowly reduce over the forward estimates period as the budget returned to surplus. Net interest expenses were expected to steadily decrease.
-100
100
300
500
700
900
1,100
-100
100
300
500
700
900
1,100$b $bNet debt
2019-20 MYEFO2020-21 Budget
2020-21 MYEFO
-5
10
25
-5
10
25
2007-08 2009-10 2011-12 2013-14 2015-16 2017-18 2019-20 2021-22 2023-24
$b$bNet interest expenses
2020-21 Budget
2019-20 MYEFO
2020-21 MYEFO
20|Parliamentary Budget Office
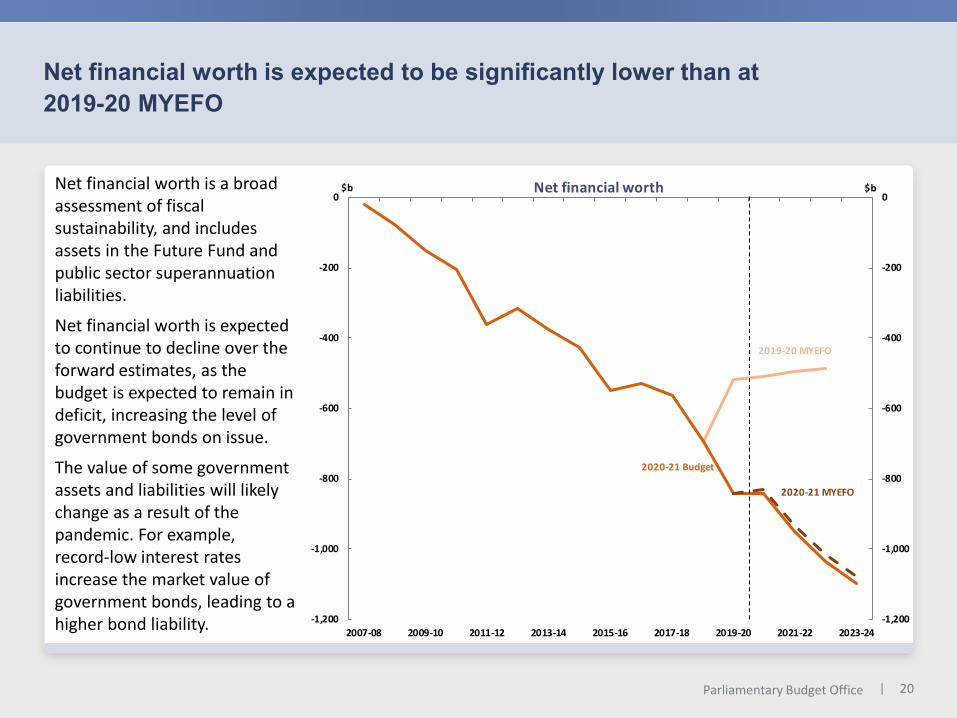
Net financial worth is expected to be significantly lower than at2019-20 MYEFO
Net financial worth is a broad assessment of fiscal sustainability, and includes assets in the Future Fund and public sector superannuation liabilities.
Net financial worth is expected to continue to decline over the forward estimates, as the budget is expected to remain in deficit, increasing the level of government bonds on issue.
The value of some government assets and liabilities will likely change as a result of the pandemic. For example,record-low interest rates increase the market value of government bonds, leading to a higher bond liability. -1,200
-1,000
-800
-600
-400
-200
0
-1,200
-1,000
-800
-600
-400
-200
0
2007-08 2009-10 2011-12 2013-14 2015-16 2017-18 2019-20 2021-22 2023-24
$b$b Net financial worth
2019-20 MYEFO
2020-21 Budget
2020-21 MYEFO

21|Parliamentary Budget Office
Notes
At the aggregate level, the underlying cash balance, total receipts, and total payments charts have been prepared on a cash basis, as the government’s key fiscal aggregates are cash based. Charts on individual elements of revenue and expenditure, including net debt and public debt interest, have been prepared on an accrual basis, consistent with the presentation of decisions in the Budget papers.
Since the 1999-2000 fiscal year, Commonwealth Government financial statements have been reported on both an accrual and cash basis. Under accrual accounting, government income is referred to as ‘revenue’ and costs as ‘expenses’. Under cash accounting, government income is referred to as ‘receipts’ and costs as ‘payments’.
The PBO does not have access to the details of provisions for individual items in the Contingency Reserve. Accordingly, the charts in this report are subject to the qualification that they are prepared in the absence of information on the possible impact of any provisions in the Contingency Reserve.
Data contained in these charts are based on information published in the 2020-21 Budget, the 2019-20 MYEFO, the 2019-20 Final Budget Outcome, the July 2020 Economic and Fiscal Update, the 2020-21 MYEFO and government agency annual reports. Historical estimates and outcomes were taken from previous budget releases. Where additional sources were used, these are listed underneath the relevant chart. Additional information provided by agencies has supplemented the publicly available information in some cases.
The charts show the financial impact of policy decisions from 2019-20 to 2023-24. The charts show movements due to parameter and other variations which are only available for 2019-20 to 2022–23. This is because the last year of the forward estimates at the 2019-20 MYEFO was 2022-23, with the 2023-24 projection being published for the first time at the 2020-21 Budget.
This differs from the reconciliation of the underlying cash balance table in Statement 3 of Budget Paper No. 1, in which the totals exclude the 2019-20 estimate and include the 2023-24 estimate.