2018 demographics report by · into the future as an emerging major world city. this report will...
TRANSCRIPT


2018 Demographics Report by:
Applied Research & AnalyticsNicholas Martinez, AICPUrban Economics & Market Development, Senior Manager
Kathryn AngletonResearch & GIS Coordinator
Miami Downtown Development Authority200 S Biscayne Blvd Suite 2929Miami, FL 33131

Table of Contents
Executive Summary 2
Greater Downtown Miami 3
Population 4
Population Growth 4
Population Distribution 5
Age Composition 6
Households 10
Household Growth 10
Trends 10
Local Context 12
Population and Households 12
Employment and Labor 13
Daytime Population 14
Metropolitan Context 16
Population and Households 17
Employment and Labor 18
Daytime Population 20
Cost of Living 22
Migration 24
Income 25
Educational Attainment 26
Pet Ownership 28
Exercise 29
Appendix 30
Metropolitan Areas 31
Florida Cities 32
Greater Downtown & Surrounding Areas 33
Downtown Miami 34
Sources 35
……………………………………………..
…………………………………..
…………………………………………………………..
…………………………………....
……………………………..
………………………………………............
………………………………………....................
…………………………………....
………………………………………..................
……………………………………….................
……………………….
……………………………..
…………………………………..
………………………………………….
……………………….
……………………………...
…………………………………..
……………………………………………..
……………………………………….......................
………………………………………...........................
……………………………………….
………………………………………................
………………………………………..........................
………………………………………........................
……………………………………
………………………………………........
…..
……………………………………...
………………………………………………………………..
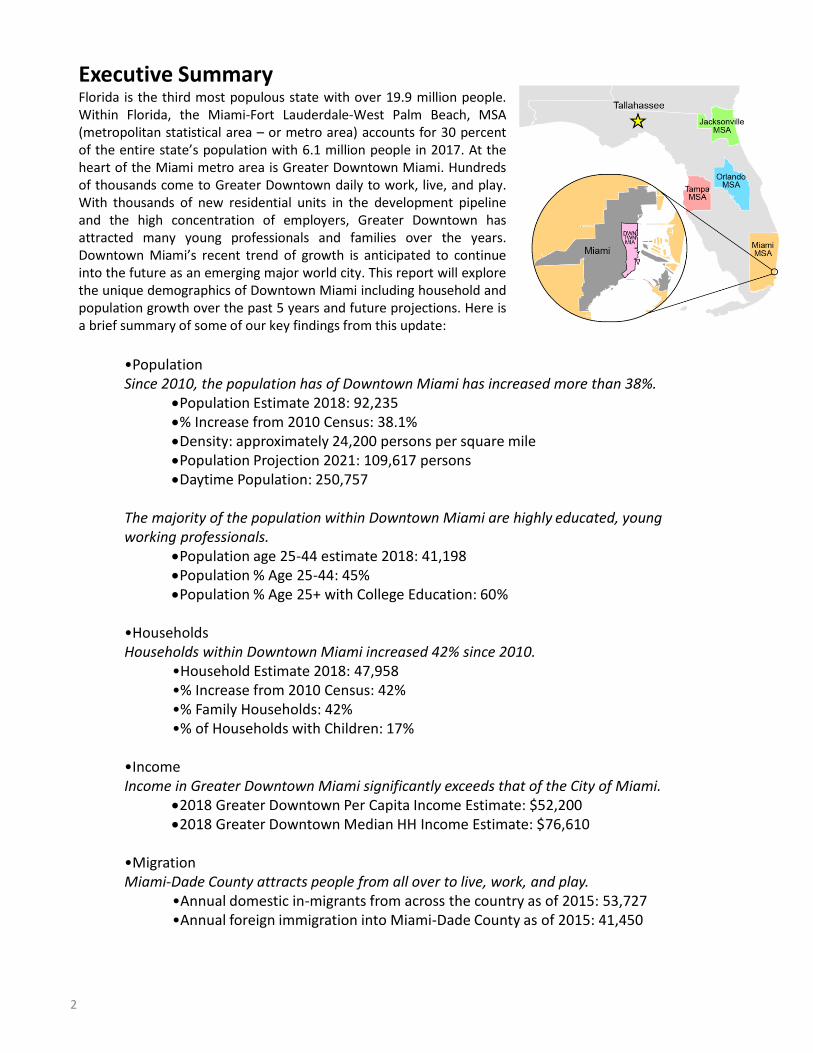
Executive SummaryFlorida is the third most populous state with over 19.9 million people.Within Florida, the Miami-Fort Lauderdale-West Palm Beach, MSA(metropolitan statistical area – or metro area) accounts for 30 percentof the entire state’s population with 6.1 million people in 2017. At theheart of the Miami metro area is Greater Downtown Miami. Hundredsof thousands come to Greater Downtown daily to work, live, and play.With thousands of new residential units in the development pipelineand the high concentration of employers, Greater Downtown hasattracted many young professionals and families over the years.Downtown Miami’s recent trend of growth is anticipated to continueinto the future as an emerging major world city. This report will explorethe unique demographics of Downtown Miami including household andpopulation growth over the past 5 years and future projections. Here isa brief summary of some of our key findings from this update:
•PopulationSince 2010, the population has of Downtown Miami has increased more than 38%.
Population Estimate 2018: 92,235% Increase from 2010 Census: 38.1%Density: approximately 24,200 persons per square milePopulation Projection 2021: 109,617 personsDaytime Population: 250,757
The majority of the population within Downtown Miami are highly educated, young working professionals.
Population age 25-44 estimate 2018: 41,198Population % Age 25-44: 45%Population % Age 25+ with College Education: 60%
•HouseholdsHouseholds within Downtown Miami increased 42% since 2010.
•Household Estimate 2018: 47,958•% Increase from 2010 Census: 42%•% Family Households: 42%•% of Households with Children: 17%
•IncomeIncome in Greater Downtown Miami significantly exceeds that of the City of Miami.
2018 Greater Downtown Per Capita Income Estimate: $52,2002018 Greater Downtown Median HH Income Estimate: $76,610
•MigrationMiami-Dade County attracts people from all over to live, work, and play.
•Annual domestic in-migrants from across the country as of 2015: 53,727•Annual foreign immigration into Miami-Dade County as of 2015: 41,450
Miami-Ft Lauderdale-
W Palm Beach, MSA
Miami
Greater Downtown
Florida
2
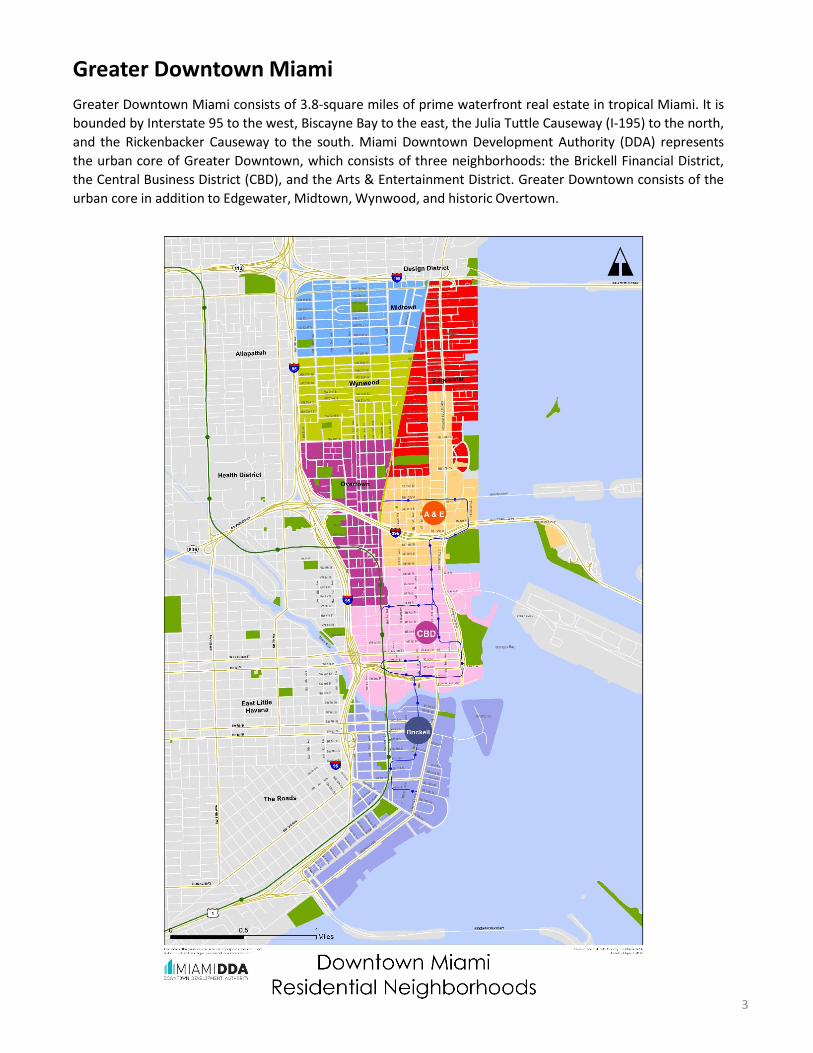
Greater Downtown Miami
Greater Downtown Miami consists of 3.8-square miles of prime waterfront real estate in tropical Miami. It is
bounded by Interstate 95 to the west, Biscayne Bay to the east, the Julia Tuttle Causeway (I-195) to the north,
and the Rickenbacker Causeway to the south. Miami Downtown Development Authority (DDA) represents
the urban core of Greater Downtown, which consists of three neighborhoods: the Brickell Financial District,
the Central Business District (CBD), and the Arts & Entertainment District. Greater Downtown consists of the
urban core in addition to Edgewater, Midtown, Wynwood, and historic Overtown.
3

40,466
66,769
92,235
109,617
0
20,000
40,000
60,000
80,000
100,000
120,000
2000 Census 2010 Census 2018 Estimate 2021Projection
Greater Downtown MiamiPopulation Growth 2000 - 2021
Greater Downtown Population Trends
Area 2000 Census 2010 Census 2018 Estimate 2021 Projection
Arts & Entertainment 4,432 9,079 13,072 15,775
Brickell 12,904 26,472 41,337 51,921
CBD 4,901 11,108 13,856* 15,060
Edgewater 5,841 6,097 6,930 7,580
Midtown 4,175 5,647 8,464 10,003
Overtown 7,000 6,736 7,000* 7,721
Wynwood 1,303 1,630 1,576 1,557
Greater Downtown 40,556 66,769 92,235 109,617
Greater Downtown Population Growth
Area2000-2010 2010-2018 2018-2021
% Change CAGR % Change CAGR % Change CAGR
Arts & Entertainment 104.9% 7.4% 44.0% 4.7% 20.7% 3.8%
Brickell 105.1% 7.4% 56.2% 5.7% 25.6% 4.7%
CBD 126.6% 8.5% 24.7% 2.8% 8.7% 2.8%
Edgewater 4.4% 0.4% 13.7% 1.6% 9.4% 1.8%
Midtown 35.3% 3.1% 49.9% 5.2% 18.2% 3.4%
Overtown -3.8% -0.4% 3.9% 0.5% 10.3% 3.3i%
Wynwood 25.1% 2.3% -3.3% -0.4% -1.2% -0.2%
Greater Downtown 64.6% 5.1% 38.1% 4.1% 18.8% 3.5%
PopulationGreater Downtown’s population is 92,235people in 2018.
Population GrowthPopulation continues to grow steadily inGreater Downtown Miami. We estimate thepopulation has increased by nearly 3,700people since our 2016 estimate, or a 4%growth in two years. This equates to over1,500 people moving to Downtown a year.
Greater Downtown has grown by over 38%since 2010. Most of this growth can beattributed to recent development, which hasadded thousands of housing units to themarket. As more residential units aredelivered, Downtown increases its capacity forpopulation growth. Because of this, weestimate Greater Downtown Miami will reach a population of over 109,000 people by 2021. This equates to a
Table 1: Population Trends in Greater Downtown Miami
Figure 1: Greater Downtown Population Growth
Table 2: Greater Downtown Miami Population Growth Rates
Source: ESRI BAO; Synergos PopStats; Miami DDA
Source: ESRI BAO; Synergos PopStats; Miami DDA
19% change in population, or a 3.5% compounded annual rate of growth (CAGR).
*Numbers were corrected from 2016 report given new information
4

Map 1: Population Distribution
Population Distribution
Over 65% of all Greater Downtown residents live within the urban core with 45% living in Brickell, 15% in the
CBD, and 6% in the A&E District. Outside of the urban core and within Greater Downtown, Edgewater is the
most populated neighborhood with 15% of the population. Wynwood has the smallest portion of residential
population with only 2% of all Greater Downtown residents. Map 1 shows residential density by Census Block
Group and is color-coded by neighborhood for Greater Downtown Miami. The “tallest” block groups can be
found in Midtown, Brickell, and the CBD. In Midtown, the densest block group has a density of 900 people
per square mile. Brickell’s densest block group has a density of 850 people per square mile. The CBD’s
densest block group has a density of 450 people per square mile.
5

Greater Downtown’s population has become slightly younger from 2010 with a noticeable increase in theMillennial and Gen Z cohorts. Figures 2 and 3 show Greater Downtown’s population by age, sex, andgenerational cohort. Tables 5 and 6 show percentages for each age cohort by sex.
We used a variety of sources, including NPR1
and works by Strauss & Howe2
to determine the demarcatingyear ranges for each generation. We have used the following birth years to define the following generations:Greatest Generation (AKA GI): 1901-1925; Silent Generation: 1926-1945; Baby Boomers: 1946-1964; Gen X:1965-1980; Millennials: 1981-1998; Gen Z: 1999-2013; and Gen Alpha: 2014 to present day.
This new piece is important for understanding how Greater Downtown’s population and needs are changing.For example, it is widely believed that Millennials are still in high school when the youngest Millennials areactually 20 years old today. As Millennials have aged, their cohort has become a much larger share of theGreater Downtown Population. In fact, there has been a 104% increase in Millennials since 2010.
The increase in Millennials is attributed to the fact that Greater Downtown’s population has remainedconstant in terms of age. Since 2010, the 25 to 29 and 30 to 34 years old cohorts have always been thelargest. As Millennials continue to age, their share of the population will continue to increase. This is a resultof the recent trend in Millennial migration to urban cores
3.
Figure 2: Greater Downtown Population Pyramid, 2018
Age Composition
Source: ESRI BAO; Synergos PopStats; Miami DDA
1Neil Howe, Forbes, “Are You Born To Be Better Off Than Your Parents? (Part 1 of “Generations in Pursuit of the American Dream”)," Jul 16, 2014,
https://www.forbes.com/sites/neilhowe/2014/07/16/part-1-generations-in-pursuit-of-the-american-dream/#3ada28b65db0 (accessed February 2018)2Samantha Raphelson, NPR, “From GIs To Gen Z (Or Is It iGen?): How Generations Get Nicknames," Jan 12, 2017,
https://www.npr.org/2014/10/06/349316543/don-t-label-me-origins-of-generational-names-and-why-we-use-them (accessed February 2018)3Pete Saunders, Forbes, "Where Educated Millennials Are Moving," Jan 12, 2017, https://www.forbes.com/sites/petesaunders1/2017/01/12/where-
educated-millennials-are-moving/#96cb760d3ccc (accessed February 2018)
6

Figure 3: Greater Downtown Population Pyramid, 2010
According to a 2017 report by Time, the Miami metro area was ranked 10th out of the top 25 major metrosMillennials are moving to
4. This report indicated Miami is receiving more Millennials than Seattle, Houston,
New York City, and Washington, DC.
Some research shows Millennials moving to the suburbs5. Our data shows the continued growth of
Millennials in the Miami urban core. We will continue to track generational cohort changes in GreaterDowntown Miami to see if Millennial migration to Miami’s urban core is a temporary or permanent trend.
Gen Z’s population has increased by 69% since 2010. The Gen Z cohort consists of people between the agesof 5 and 19 years old today. Despite this large increase, we project their share to slightly shrink over the nextfew years as they leave Miami-Dade County for higher education. This phenomena will be explored more inthe Migration section for more details on trends and push and pull factors for migration.
The most notable differences between generations in 2010 and 2018 is the loss of the Greatest Generationand the introduction of Gen Alpha
6. While there are still GI/Greatest Generation individuals still alive, their
share of the Greater Downtown Miami population is negligible in 2018. Most of Downtown’s seniors aremembers of the Silent Generation instead. With the phasing out of the Greatest Generation, room was madefor Gen Alpha. While the oldest of Gen Alpha are only 4 years old today, they are known to be the children ofMillennials. We will continue to track Gen Alpha to see if they are born at rates similar to their parents’generation (Millennials).
Source: ESRI BAO; Synergos PopStats; Miami DDA
7
4David Johnson, Time, “The 25 Cities Where Millennials Are Moving" Jun 13, 2017,http://time.com/4797956/cities-millennials-moving/(accessed February 2018)
5Grace Guarnieri, Newsweek, “Why are people leaving cities? U.S. mayors blame housing costs,” Jan 24, 2018
http://www.newsweek.com/people-moving-out-cities-housing-costs-789891 (accessed February 2018)6
Alex Williams, The New York Times, “Meet Alpha: The Next ‘Next Generation’," Sep 15, 2015, https://www.nytimes.com/2015/09/19/fashion/meet-alpha-the-next-next-generation.html(accessed February 2018)
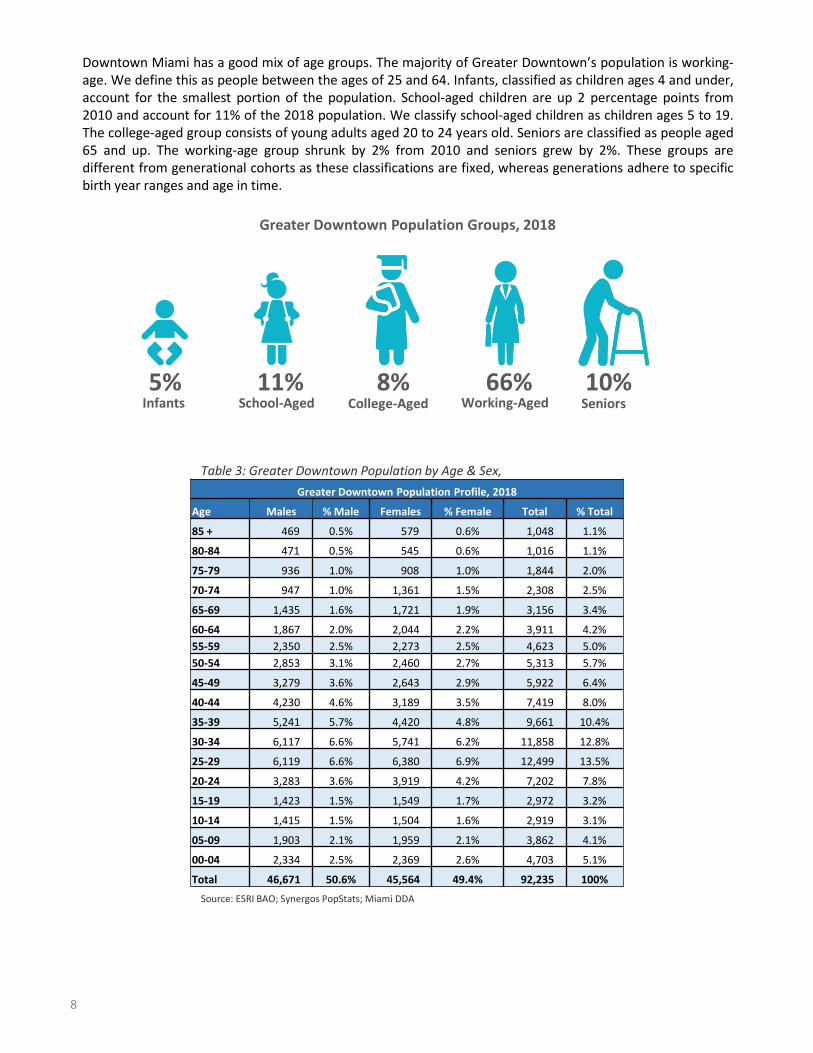
Table 3: Greater Downtown Population by Age & Sex, 2018
Source: ESRI BAO; Synergos PopStats; Miami DDA
Downtown Miami has a good mix of age groups. The majority of Greater Downtown’s population is working-age. We define this as people between the ages of 25 and 64. Infants, classified as children ages 4 and under,account for the smallest portion of the population. School-aged children are up 2 percentage points from2010 and account for 11% of the 2018 population. We classify school-aged children as children ages 5 to 19.The college-aged group consists of young adults aged 20 to 24 years old. Seniors are classified as people aged65 and up. The working-age group shrunk by 2% from 2010 and seniors grew by 2%. These groups aredifferent from generational cohorts as these classifications are fixed, whereas generations adhere to specificbirth year ranges and age in time.
Greater Downtown Population Groups, 2018
5% 11% 8% 66% 10%Infants School-Aged College-Aged Working-Aged Seniors
Greater Downtown Population Profile, 2018
Age Males % Male Females % Female Total % Total
85 + 469 0.5% 579 0.6% 1,048 1.1%
80-84 471 0.5% 545 0.6% 1,016 1.1%
75-79 936 1.0% 908 1.0% 1,844 2.0%
70-74 947 1.0% 1,361 1.5% 2,308 2.5%
65-69 1,435 1.6% 1,721 1.9% 3,156 3.4%
60-64 1,867 2.0% 2,044 2.2% 3,911 4.2%
55-59 2,350 2.5% 2,273 2.5% 4,623 5.0%
50-54 2,853 3.1% 2,460 2.7% 5,313 5.7%
45-49 3,279 3.6% 2,643 2.9% 5,922 6.4%
40-44 4,230 4.6% 3,189 3.5% 7,419 8.0%
35-39 5,241 5.7% 4,420 4.8% 9,661 10.4%
30-34 6,117 6.6% 5,741 6.2% 11,858 12.8%
25-29 6,119 6.6% 6,380 6.9% 12,499 13.5%
20-24 3,283 3.6% 3,919 4.2% 7,202 7.8%
15-19 1,423 1.5% 1,549 1.7% 2,972 3.2%
10-14 1,415 1.5% 1,504 1.6% 2,919 3.1%
05-09 1,903 2.1% 1,959 2.1% 3,862 4.1%
00-04 2,334 2.5% 2,369 2.6% 4,703 5.1%
Total 46,671 50.6% 45,564 49.4% 92,235 100%
8

One of the most notable differences between Greater Downtown’s population in 2010 versus 2018 is thenarrowing of the split between male and female individuals. In 2010, males outnumbered females by nearly3%. In 2018, the split between male and female is nearly even with 49.4% female and 50.6% male. Dataregarding other gender identities or sexual identities were not collected. This group includes, but is notlimited to, non-binary, intersex, and transgender individuals.
Greater DowntownMale-Female Split, 2018
Greater DowntownMale-Female Split, 2010
Table 4: Greater Downtown Population by Age & Sex, 2010
Source: ESRI BAO; Synergos PopStats; Miami DDA
9
Greater Downtown Population Profile, 2010
Age Males % Male Females % Female Total % Total
85 + 194 0.3% 309 0.5% 503 0.8%
80-84 255 0.4% 358 0.5% 613 0.9%
75-79 415 0.6% 474 0.7% 889 1.4%
70-74 647 1.0% 668 1.0% 1,315 2.0%
65-69 832 1.3% 893 1.4% 1,725 2.6%
60-64 1,310 2.0% 1,186 1.8% 2,496 3.8%
55-59 1,560 2.4% 1,504 2.3% 3,064 4.7%
50-54 2,062 3.1% 1,685 2.6% 3,747 5.7%
45-49 2,517 3.8% 1,797 2.7% 4,314 6.6%
40-44 3,095 4.7% 2,020 3.1% 5,115 7.8%
35-39 3,974 6.0% 2,897 4.4% 6,871 10.5%
30-34 4,976 7.6% 4,246 6.5% 9,222 14.0%
25-29 5,041 7.7% 5,023 7.6% 10,064 15.3%
20-24 2,812 4.3% 3,216 4.9% 6,028 9.2%
15-19 1,110 1.7% 1,101 1.7% 2,211 3.4%
10-14 885 1.3% 916 1.4% 1,801 2.7%
05-09 1,079 1.6% 1,018 1.5% 2,097 3.2%
00-04 1,808 2.8% 1,813 2.8% 3,621 5.5%
Total 34,572 52.6% 31,124 47.4% 65,696 100%
17,869
33,888
47,958
57,659
0
10,000
20,000
30,000
40,000
50,000
60,000
70,000
2000 Census 2010 Census 2018Estimate
2021Projection
Greater Downtown MiamiHousehold Growth 2000 - 2021
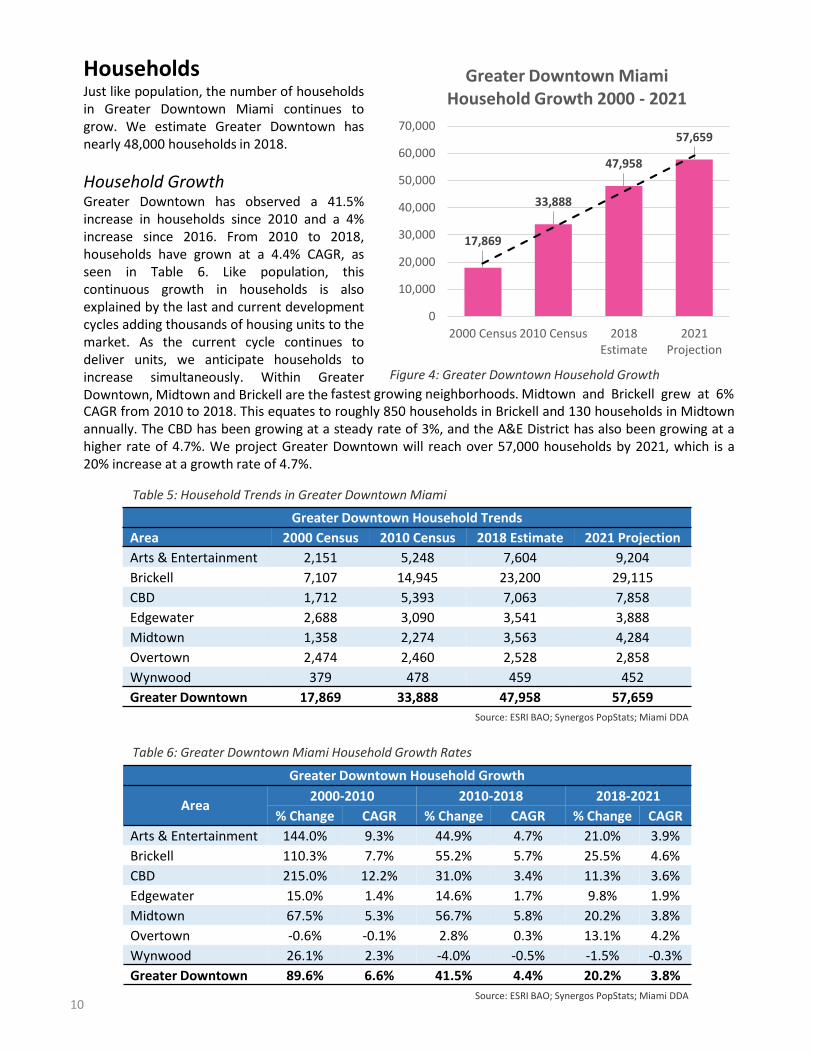
HouseholdsJust like population, the number of householdsin Greater Downtown Miami continues togrow. We estimate Greater Downtown hasnearly 48,000 households in 2018.
Household GrowthGreater Downtown has observed a 41.5%increase in households since 2010 and a 4%increase since 2016. From 2010 to 2018,households have grown at a 4.4% CAGR, asseen in Table 6. Like population, thiscontinuous growth in households is alsoexplained by the last and current developmentcycles adding thousands of housing units to themarket. As the current cycle continues todeliver units, we anticipate households toincrease simultaneously. Within GreaterDowntown, Midtown and Brickell are the
Table 5: Household Trends in Greater Downtown Miami
Figure 4: Greater Downtown Household Growth
Table 6: Greater Downtown Miami Household Growth Rates
Greater Downtown Household Trends
Area 2000 Census 2010 Census 2018 Estimate 2021 Projection
Arts & Entertainment 2,151 5,248 7,604 9,204
Brickell 7,107 14,945 23,200 29,115
CBD 1,712 5,393 7,063 7,858
Edgewater 2,688 3,090 3,541 3,888
Midtown 1,358 2,274 3,563 4,284
Overtown 2,474 2,460 2,528 2,858
Wynwood 379 478 459 452
Greater Downtown 17,869 33,888 47,958 57,659
Greater Downtown Household Growth
Area2000-2010 2010-2018 2018-2021
% Change CAGR % Change CAGR % Change CAGR
Arts & Entertainment 144.0% 9.3% 44.9% 4.7% 21.0% 3.9%
Brickell 110.3% 7.7% 55.2% 5.7% 25.5% 4.6%
CBD 215.0% 12.2% 31.0% 3.4% 11.3% 3.6%
Edgewater 15.0% 1.4% 14.6% 1.7% 9.8% 1.9%
Midtown 67.5% 5.3% 56.7% 5.8% 20.2% 3.8%
Overtown -0.6% -0.1% 2.8% 0.3% 13.1% 4.2%
Wynwood 26.1% 2.3% -4.0% -0.5% -1.5% -0.3%
Greater Downtown 89.6% 6.6% 41.5% 4.4% 20.2% 3.8%
Source: ESRI BAO; Synergos PopStats; Miami DDA
Source: ESRI BAO; Synergos PopStats; Miami DDA
fastest growing neighborhoods. Midtown and Brickell grew at 6%CAGR from 2010 to 2018. This equates to roughly 850 households in Brickell and 130 households in Midtownannually. The CBD has been growing at a steady rate of 3%, and the A&E District has also been growing at ahigher rate of 4.7%. We project Greater Downtown will reach over 57,000 households by 2021, which is a20% increase at a growth rate of 4.7%.
10

In 2018, one person households account for a majority of all households in Greater Downtown with a
47% share. Families without children are the next largest household type with 26%. These characteristics
have changed noticeably from 2014. Non-family households dropped 17% from 2014 to 2018. Family
households without children has grown by 6% simultaneously. Family households consist of people
related by birth, adoption, or marriage, which includes same-sex marriage. Households classified as
“families without children” refers to married couples without children. One person households refers to
single-person households. Non-family households refers to roommates or cohabitating non-married
couples.
Figure 5: Greater Downtown Household Types
Household Trends
48%
18%20%
27%
48%
16%
23%
13%
47%
17%
26%
10%
0%
10%
20%
30%
40%
50%
60%
One Person Family w/ Children Family w/oChildren
Non-Family
Change in Household Types, 2014-20182014
2016
2018

Local Population Trends2010-2018
Population 2010 2018 % Change CAGR
Greater Downtown 66,769 92,235 38% 4%
City of Miami 399,457 449,517 13% 2%
Miami-Dade County 2,496,435 2,702,302 8% 1%
Metro Miami (MSA) 5,564,635 6,027,585 8% 1%
Local Household Trends2010-2018
Households 2010 2018 % Change CAGR
Greater Downtown 33,888 47,958 42% 4%
City of Miami 158,317 181,124 14% 2%
Miami-Dade County 867,352 933,595 8% 1%
Metro Miami (MSA) 2,097,626 2,252,818 7% 1%
Local Context
Downtown Miami is the City of Miami’s urban core and Miami-Dade County’s largest employment center.
Over 20% of the City of Miami’s population resides in Greater Downtown. Just like the entire state, Miami-
Dade County and its municipalities continue to grow at a steady rate. Despite this across-the-board growth,
no place in the County has experienced as much growth as Greater Downtown Miami.
Population and Households
Table 7: Local Population Growth
Similar to population, the number of households also continues to grow at the local level. Households inGreater Downtown Miami have grown at a faster rate than the City of Miami and Miami-Dade County as awhole.
Table 8: Local Household Trends
Source: ESRI BAO; Synergos PopStats; Miami DDA
Source: ESRI BAO; Synergos PopStats; Miami DDA

Employment and LaborDowntown Miami is the County’s largest employment center with 16% of all Miami-Dade County jobs. Thethree largest employment industries in Greater Downtown are educational services, public administration,and professional, scientific, and technical services. Downtown Miami is home to over 60 international banks,eight domestic banks, and numerous other large financial institutions, which accounts for 21% of the entireCounty’s finance and insurance industry. Greater Downtown is also home to several large law firms includingAkerman LLP, Greenburg Traurig, Hogan Lovells, and Lydecker Diaz. Over a dozen Fortune 500 firm’s havelocal offices in Downtown Miami including but not limited to JP Morgan Chase, Wells Fargo, Bank of AmericaCorp., Citigroup, Jones Lang LaSalle, and CBRE Group. Other large firms with a presence in Downtown Miamiinclude Boston Consulting Group, Ernst & Young, Kroll, Y&R, and Aon. These organizations account for nearly22% of all professional, scientific, and technical services jobs in Miami-Dade County.
Table 9: Employment by Industry
Source: US Census Bureau OnTheMap; Miami DDA
13
Greater Downtown Employment by Industry, 2015
NAICS - 2 Digit DWNTWN
Utilities 0.1%
Construction 0.8%
Manufacturing 0.5%
Wholesale Trade 1.5%
Retail Trade 3.4%
Transportation & Warehousing 0.8%
Information 1.2%
Finance and Insurance 6.3%
Real Estate & Rental & Leasing 1.2%
Pro, Scientific, and Tech Services 9.1%
Mgmt of Companies and Enterprises 0.7%
Admin & Support, Waste Mgmt & Rem 3.7%
Educational Services 32.5%
Health Care & Social Assistance 7.1%
Arts, Entertainment, & Recreation 1.2%
Accommodation & Food Services 7.7%
Other Services 1.9%
Public Administration 20.4%
Unclassified 0.01%
Total - All Jobs 100.0%
Greater Downtown Miami’s Top Employment Industries as Shares of Miami-Dade County’s Employment by Industry
22%21%13%
Mgmt of Companies& Enterprises
Finance &Insurance
Pro, Scientific,& Tech Services
11%
Arts, Ent,& Rec

Table 10: Local Employment Growth
Daytime Population
The daytime population of Greater Downtown Miami is 250,757 people. Daytime population combines
residents, workers, and tourists that visit a destination on an average weekday. Downtown Miami has the
densest daytime population of any geography in Miami-Dade County. With over a quarter of a million people
coming to roughly four square-miles of land daily, Downtown Miami’s daytime population has a density of
just under 65,800 people per square mile. Greater Downtown Miami is home to numerous employers,
retailers, museums, and residential buildings making it the most densely populated daytime location in the
entire County. The next densest geography is Aventura with a citywide daytime population of 44,599 people
spanning across 2.65 square miles of land resulting in a density of 16,829 people per square mile.
Alternatively, University Park, where Florida International University is located, has a daytime population of
79,759 people across 4 square miles of land with a density of 19,989 people per square mile. These densities
can be seen in Map 2 on the next page.
Source: US Census Bureau OnTheMap; Miami DDA
Local Employment Trends
NAICS2 - Digit
Employment % Change (2010-2015) CAGR (2010-2015)
DWNTWN County DWNTWN County DWNTWN CountyUtilities 141 2,699 18.5% -13.9% 3.5% -3.0%
Construction 1,322 40,414 -4.3% 30.2% -0.9% 5.4%
Manufacturing 922 38,136 44.5% 8.1% 7.6% 1.6%
Wholesale Trade 2,640 70,383 -11.0% 8.4% -2.3% 1.6%
Retail Trade 5,885 148,756 39.3% 23.6% 6.9% 4.3%
Transportation & Warehousing 1,460 65,929 15.1% 23.8% 2.9% 4.4%
Information 2,073 18,985 38.7% 19.4% 6.8% 3.6%
Finance and Insurance 10,970 52,321 24.2% 24.1% 4.4% 4.4%
Real Estate & Rental & Leasing 2,076 24,826 -5.2% 24.9% -1.1% 4.6%
Pro, Scientific, and Tech Services 16,033 73,794 28.4% 19.5% 5.1% 3.6%
Mgmt of Companies & Enterprises 1,141 10,123 72.4% 4.7% 11.5% 0.9%
Admin & Support, Waste Mgmt & Rem 6,565 77,208 57.6% 25.6% 9.5% 4.7%
Educational Services 57,027 85,367 2.9% 7.4% 0.6% 1.4%
Health Care & Social Assistance 12,435 151,886 296.7% 16.5% 31.7% 3.1%
Arts, Entertainment, & Recreation 2,068 15,841 8.2% 20.8% 1.6% 3.9%
Accommodation & Food Services 13,505 122,099 57.2% 30.3% 9.5% 5.4%
Other Services 3,341 40,480 17.7% 14.8% 3.3% 2.8%
Public Administration 35,851 49,676 -4.1% -13.3% -0.8% -2.8%
Unclassified 23 7,215 109.1% -28.5% 15.9% -6.5%
Total - All Jobs 175,478 1,096,138 17.2% 16.9% 3.2% 3.2%
Overall, employment grew by 17% from 2010 to 2015 in Downtown Miami according to the newest Census
data. Health care & social services grew by nearly 300 percent during that time period, which can be
explained by the opening of Baptist Health Medical Plaza in Brickell. This is important to note when observing
the loss of construction and real estate jobs. We expect to see construction and real estate jobs to grow as
newer data is reported.
14

Ma
p 2
: Lo
cal D
ayt
ime
Po
pu
lati
on
Den
sity
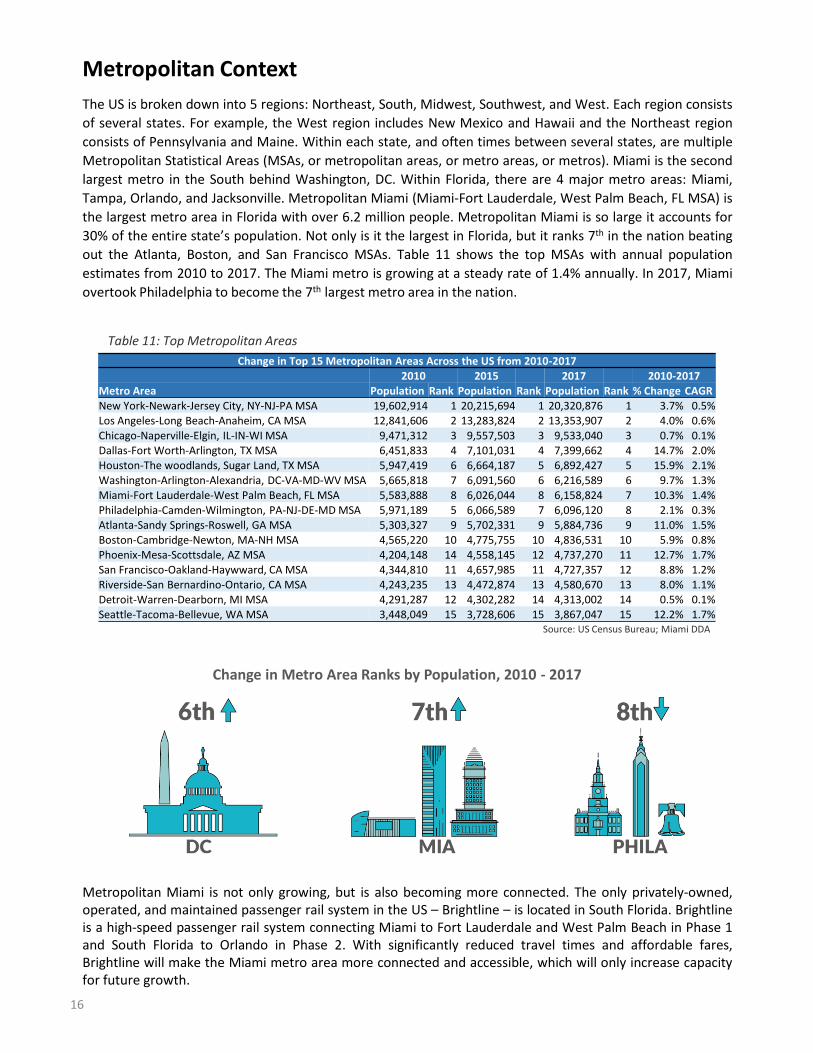
Metropolitan Context
The US is broken down into 5 regions: Northeast, South, Midwest, Southwest, and West. Each region consists
of several states. For example, the West region includes New Mexico and Hawaii and the Northeast region
consists of Pennsylvania and Maine. Within each state, and often times between several states, are multiple
Metropolitan Statistical Areas (MSAs, or metropolitan areas, or metro areas, or metros). Miami is the second
largest metro in the South behind Washington, DC. Within Florida, there are 4 major metro areas: Miami,
Tampa, Orlando, and Jacksonville. Metropolitan Miami (Miami-Fort Lauderdale, West Palm Beach, FL MSA) is
the largest metro area in Florida with over 6.2 million people. Metropolitan Miami is so large it accounts for
30% of the entire state’s population. Not only is it the largest in Florida, but it ranks 7th in the nation beating
out the Atlanta, Boston, and San Francisco MSAs. Table 11 shows the top MSAs with annual population
estimates from 2010 to 2017. The Miami metro is growing at a steady rate of 1.4% annually. In 2017, Miami
overtook Philadelphia to become the 7th largest metro area in the nation.
Table 11: Top Metropolitan Areas
Change in Top 15 Metropolitan Areas Across the US from 2010-20172010 2015 2017 2010-2017
Metro Area Population Rank Population Rank Population Rank % Change CAGRNew York-Newark-Jersey City, NY-NJ-PA MSA 19,602,914 1 20,215,694 1 20,320,876 1 3.7% 0.5%Los Angeles-Long Beach-Anaheim, CA MSA 12,841,606 2 13,283,824 2 13,353,907 2 4.0% 0.6%Chicago-Naperville-Elgin, IL-IN-WI MSA 9,471,312 3 9,557,503 3 9,533,040 3 0.7% 0.1%Dallas-Fort Worth-Arlington, TX MSA 6,451,833 4 7,101,031 4 7,399,662 4 14.7% 2.0%Houston-The woodlands, Sugar Land, TX MSA 5,947,419 6 6,664,187 5 6,892,427 5 15.9% 2.1%Washington-Arlington-Alexandria, DC-VA-MD-WV MSA 5,665,818 7 6,091,560 6 6,216,589 6 9.7% 1.3%Miami-Fort Lauderdale-West Palm Beach, FL MSA 5,583,888 8 6,026,044 8 6,158,824 7 10.3% 1.4%Philadelphia-Camden-Wilmington, PA-NJ-DE-MD MSA 5,971,189 5 6,066,589 7 6,096,120 8 2.1% 0.3%Atlanta-Sandy Springs-Roswell, GA MSA 5,303,327 9 5,702,331 9 5,884,736 9 11.0% 1.5%Boston-Cambridge-Newton, MA-NH MSA 4,565,220 10 4,775,755 10 4,836,531 10 5.9% 0.8%Phoenix-Mesa-Scottsdale, AZ MSA 4,204,148 14 4,558,145 12 4,737,270 11 12.7% 1.7%San Francisco-Oakland-Haywward, CA MSA 4,344,810 11 4,657,985 11 4,727,357 12 8.8% 1.2%Riverside-San Bernardino-Ontario, CA MSA 4,243,235 13 4,472,874 13 4,580,670 13 8.0% 1.1%Detroit-Warren-Dearborn, MI MSA 4,291,287 12 4,302,282 14 4,313,002 14 0.5% 0.1%Seattle-Tacoma-Bellevue, WA MSA 3,448,049 15 3,728,606 15 3,867,047 15 12.2% 1.7%
Source: US Census Bureau; Miami DDA
Change in Metro Area Ranks by Population, 2010 - 2017
16
Metropolitan Miami is not only growing, but is also becoming more connected. The only privately-owned,operated, and maintained passenger rail system in the US – Brightline – is located in South Florida. Brightlineis a high-speed passenger rail system connecting Miami to Fort Lauderdale and West Palm Beach in Phase 1and South Florida to Orlando in Phase 2. With significantly reduced travel times and affordable fares,Brightline will make the Miami metro area more connected and accessible, which will only increase capacityfor future growth.

Regional Population Trends2010-2018
Population 2010 2018 % Change CAGR
DWNTWN 66,769 92,235 38% 4%
FTL DDA 6,074 7,799 28% 4%
WPB DDA 4,382 5,603 28% 4%
Metro Miami (MSA) 5,564,635 6,027,585 8% 1%
Table 12: Regional Population Growth
Downtown Fort Lauderdale and Downtown Miami are both younger relative to Downtown West Palm Beach
and the MSA. With recent development and job growth, Downtown Miami continues to attract young
professionals.
Regional Aging TrendsMedian Age 2010 2018
DWNTWN 34.0 35.1
FTL DDA 34.1 35.7
WPB DDA 41.9 41.4
Metro Miami (MSA) 39.8 41.0
Table 13: Regional Aging Trends
Population and Households
In terms of population, Greater Downtown Miami is over 10 times the size of both Downtown FortLauderdale and Downtown West Palm Beach. While Downtown Miami is significantly larger, all 3 of thedowntowns are growing at the same rate of 4% CAGR. Table 12 shows all 3 downtowns have also grown byover 25% since 2010.
Source: ESRI BAO; Synergos PopStats; Miami DDA
Source: ESRI BAO; Synergos PopStats; Miami DDA
The region has 3 burgeoning downtowns: Downtown Miami, Downtown Fort Lauderdale, and Downtown
West Palm Beach. Each downtown contributes economic output and population growth to the region and the
connection of these three downtowns via Brightline will be a catalyst for increased growth at both the local
and metro levels. With the growing housing stock and connectivity, the capacity to live and work across the
downtowns will increase.
As the center of the 7th largest metropolitan area in the nation, it is important to understand the regional
context of Downtown Miami in comparison to other downtowns of the MSA. This section explores the
demographics of the Fort Lauderdale Downtown Development Authority (FTL DDA) and West Palm Beach
Downtown Development Authority (WPB DDA) and how they compare to Greater Downtown Miami
(DWNTWN).
Employment and Labor
Downtown Miami is a major component of the metropolitan area’s economy in terms of labor and
employment. Roughly 10% of all finance and insurance jobs in the MSA can be found in Downtown Miami.
Over 9% of all professional, scientific, and technical services jobs in the MSA are also in Downtown Miami.
Greater Downtown’s density and amenities lend itself to agglomerating economies, which explains its sizable
shares of specific employment industries such as finance and insurance or public administration. In a regional
economy with a labor force of over 2.4 million, it is no small feat that Downtown Miami’s roughly four-square
miles of land accounts for 7% of all metro area jobs. It is Downtown Miami’s density and agglomerating
economies that makes it the epicenter of South Florida.
10%10%4%
Accommodation& Food Services
Finance &Insurance
Pro, Scientific,& Tech Services
Greater Downtown Miami’s Top Employment Industries as Shares of Miami MSA’s Employment by Industry
5%
Arts, Ent,& Rec
18
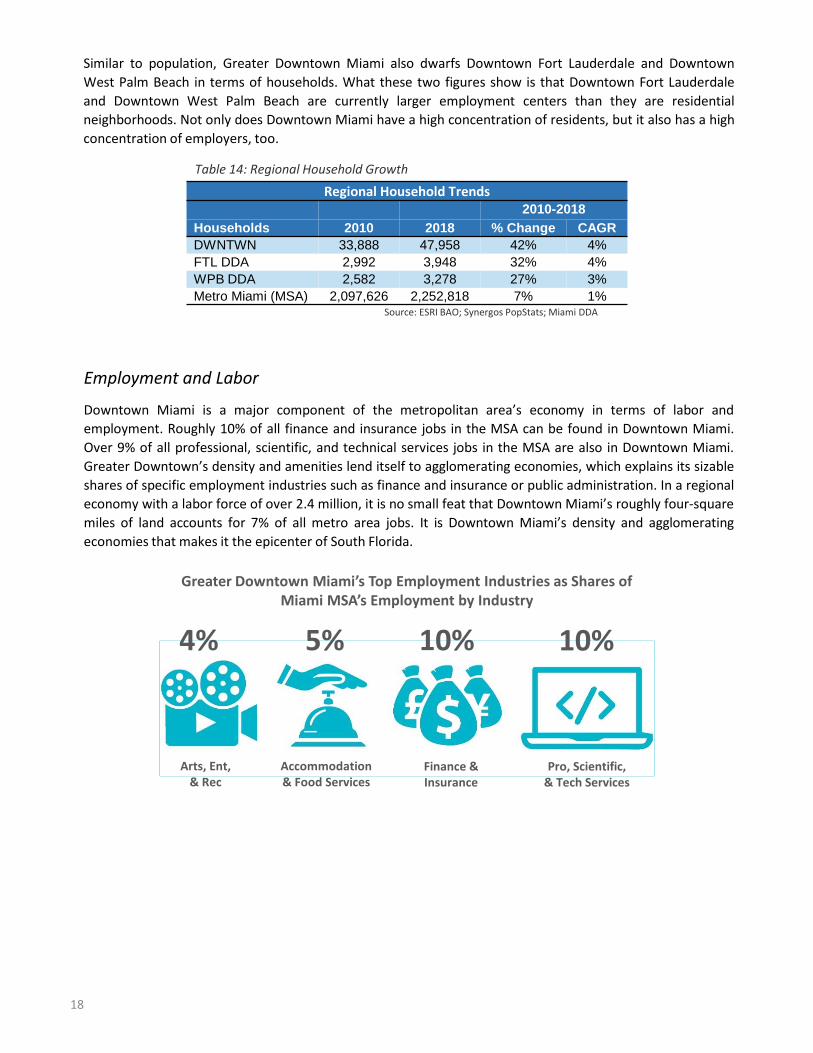
Similar to population, Greater Downtown Miami also dwarfs Downtown Fort Lauderdale and Downtown
West Palm Beach in terms of households. What these two figures show is that Downtown Fort Lauderdale
and Downtown West Palm Beach are currently larger employment centers than they are residential
neighborhoods. Not only does Downtown Miami have a high concentration of residents, but it also has a high
concentration of employers, too.
Regional Household Trends2010-2018
Households 2010 2018 % Change CAGR
DWNTWN 33,888 47,958 42% 4%
FTL DDA 2,992 3,948 32% 4%
WPB DDA 2,582 3,278 27% 3%
Metro Miami (MSA) 2,097,626 2,252,818 7% 1%
Table 14: Regional Household Growth
Source: ESRI BAO; Synergos PopStats; Miami DDA
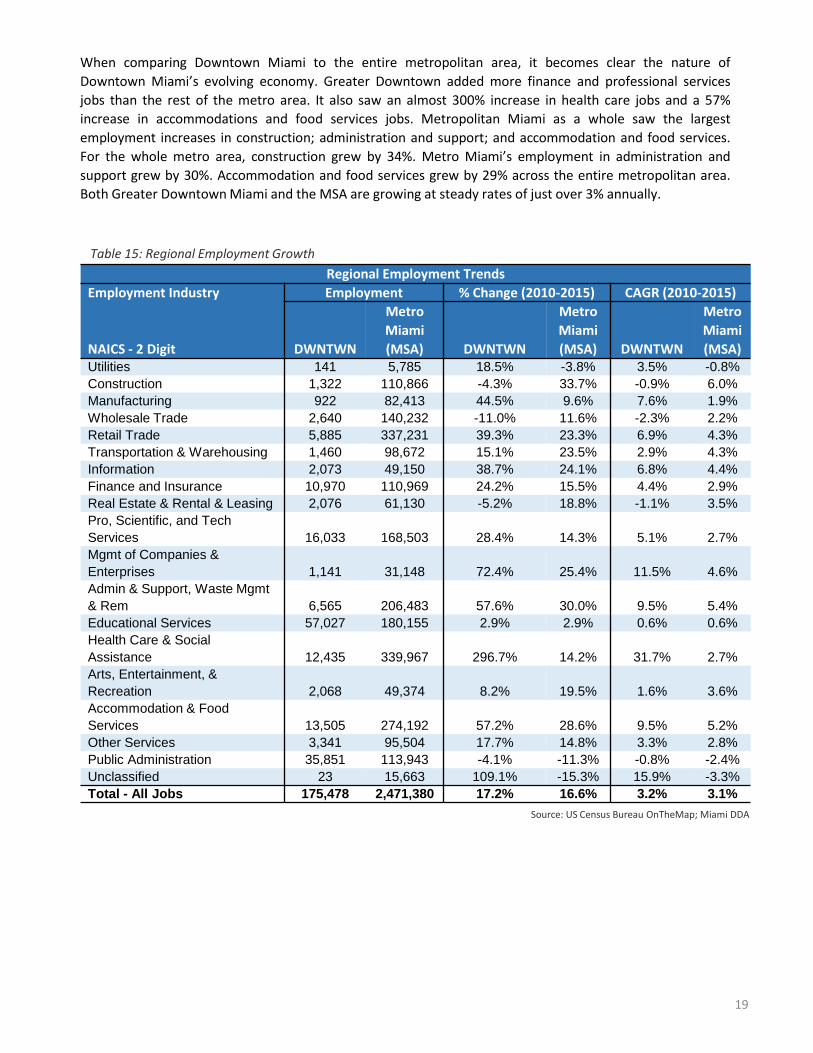
When comparing Downtown Miami to the entire metropolitan area, it becomes clear the nature of
Downtown Miami’s evolving economy. Greater Downtown added more finance and professional services
jobs than the rest of the metro area. It also saw an almost 300% increase in health care jobs and a 57%
increase in accommodations and food services jobs. Metropolitan Miami as a whole saw the largest
employment increases in construction; administration and support; and accommodation and food services.
For the whole metro area, construction grew by 34%. Metro Miami’s employment in administration and
support grew by 30%. Accommodation and food services grew by 29% across the entire metropolitan area.
Both Greater Downtown Miami and the MSA are growing at steady rates of just over 3% annually.
Regional Employment Trends
Employment Industry Employment % Change (2010-2015) CAGR (2010-2015)
NAICS - 2 Digit DWNTWN
Metro
Miami
(MSA) DWNTWN
Metro
Miami
(MSA) DWNTWN
Metro
Miami
(MSA)Utilities 141 5,785 18.5% -3.8% 3.5% -0.8%
Construction 1,322 110,866 -4.3% 33.7% -0.9% 6.0%
Manufacturing 922 82,413 44.5% 9.6% 7.6% 1.9%
Wholesale Trade 2,640 140,232 -11.0% 11.6% -2.3% 2.2%
Retail Trade 5,885 337,231 39.3% 23.3% 6.9% 4.3%
Transportation & Warehousing 1,460 98,672 15.1% 23.5% 2.9% 4.3%
Information 2,073 49,150 38.7% 24.1% 6.8% 4.4%
Finance and Insurance 10,970 110,969 24.2% 15.5% 4.4% 2.9%
Real Estate & Rental & Leasing 2,076 61,130 -5.2% 18.8% -1.1% 3.5%
Pro, Scientific, and Tech
Services 16,033 168,503 28.4% 14.3% 5.1% 2.7%
Mgmt of Companies &
Enterprises 1,141 31,148 72.4% 25.4% 11.5% 4.6%
Admin & Support, Waste Mgmt
& Rem 6,565 206,483 57.6% 30.0% 9.5% 5.4%
Educational Services 57,027 180,155 2.9% 2.9% 0.6% 0.6%
Health Care & Social
Assistance 12,435 339,967 296.7% 14.2% 31.7% 2.7%
Arts, Entertainment, &
Recreation 2,068 49,374 8.2% 19.5% 1.6% 3.6%
Accommodation & Food
Services 13,505 274,192 57.2% 28.6% 9.5% 5.2%
Other Services 3,341 95,504 17.7% 14.8% 3.3% 2.8%
Public Administration 35,851 113,943 -4.1% -11.3% -0.8% -2.4%
Unclassified 23 15,663 109.1% -15.3% 15.9% -3.3%
Total - All Jobs 175,478 2,471,380 17.2% 16.6% 3.2% 3.1%
Table 15: Regional Employment Growth
Source: US Census Bureau OnTheMap; Miami DDA
19
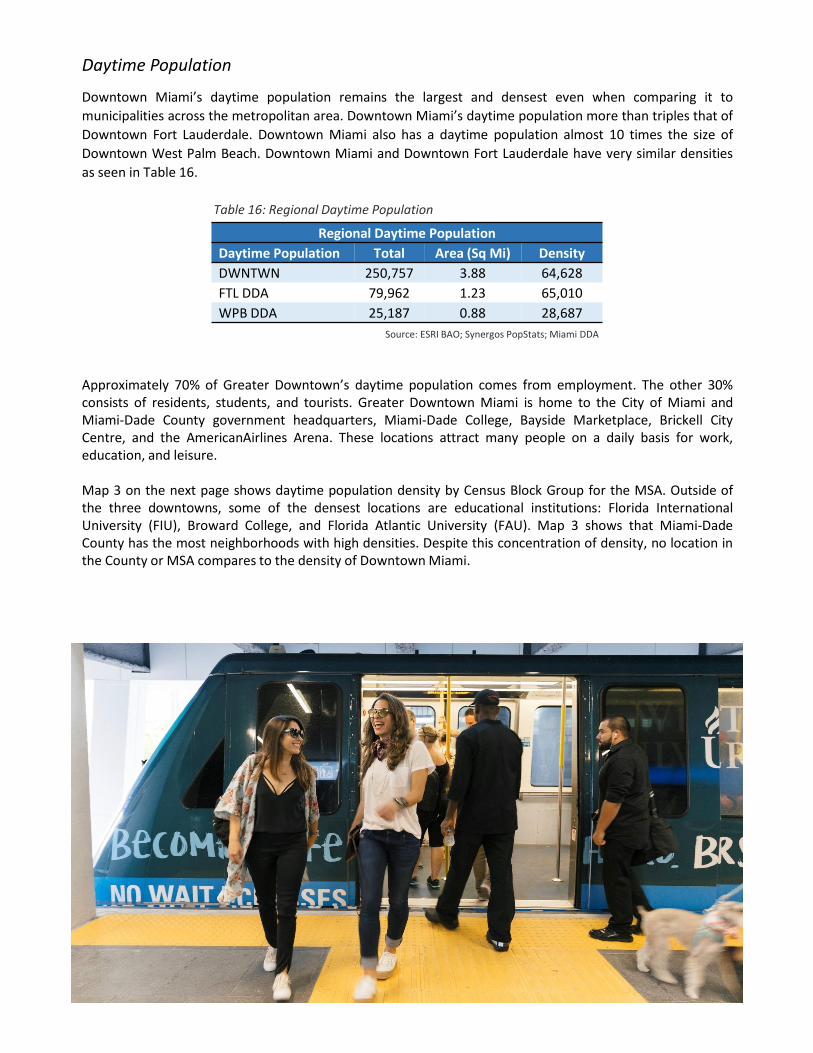
Daytime Population
Downtown Miami’s daytime population remains the largest and densest even when comparing it to
municipalities across the metropolitan area. Downtown Miami’s daytime population more than triples that of
Downtown Fort Lauderdale. Downtown Miami also has a daytime population almost 10 times the size of
Downtown West Palm Beach. Downtown Miami and Downtown Fort Lauderdale have very similar densities
as seen in Table 16.
Regional Daytime Population
Daytime Population Total Area (Sq Mi) Density
DWNTWN 250,757 3.88 64,628
FTL DDA 79,962 1.23 65,010
WPB DDA 25,187 0.88 28,687
Table 16: Regional Daytime Population
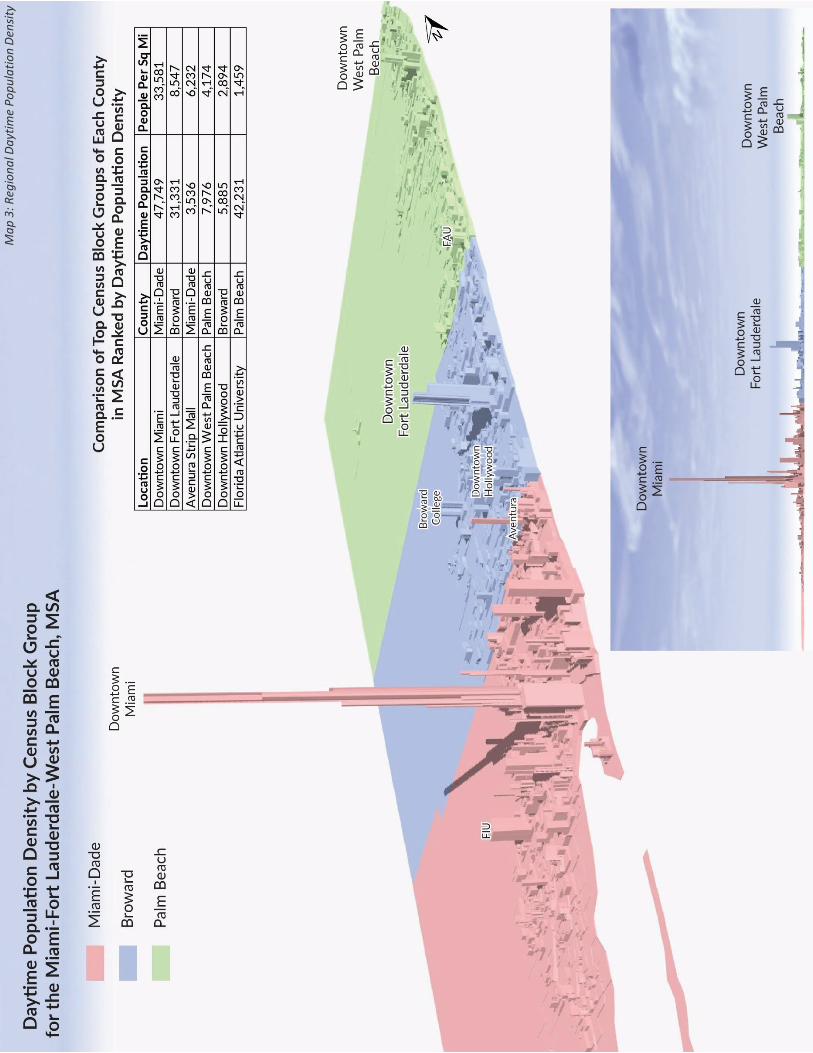
Approximately 70% of Greater Downtown’s daytime population comes from employment. The other 30%consists of residents, students, and tourists. Greater Downtown Miami is home to the City of Miami andMiami-Dade County government headquarters, Miami-Dade College, Bayside Marketplace, Brickell CityCentre, and the AmericanAirlines Arena. These locations attract many people on a daily basis for work,education, and leisure.
Map 3 on the next page shows daytime population density by Census Block Group for the MSA. Outside ofthe three downtowns, some of the densest locations are educational institutions: Florida InternationalUniversity (FIU), Broward College, and Florida Atlantic University (FAU). Map 3 shows that Miami-DadeCounty has the most neighborhoods with high densities. Despite this concentration of density, no location inthe County or MSA compares to the density of Downtown Miami.
Source: ESRI BAO; Synergos PopStats; Miami DDA
Ma
p 3
: Reg
ion
al D
ayt
ime
Po
pu
lati
on
Den
sity
Cost of Living
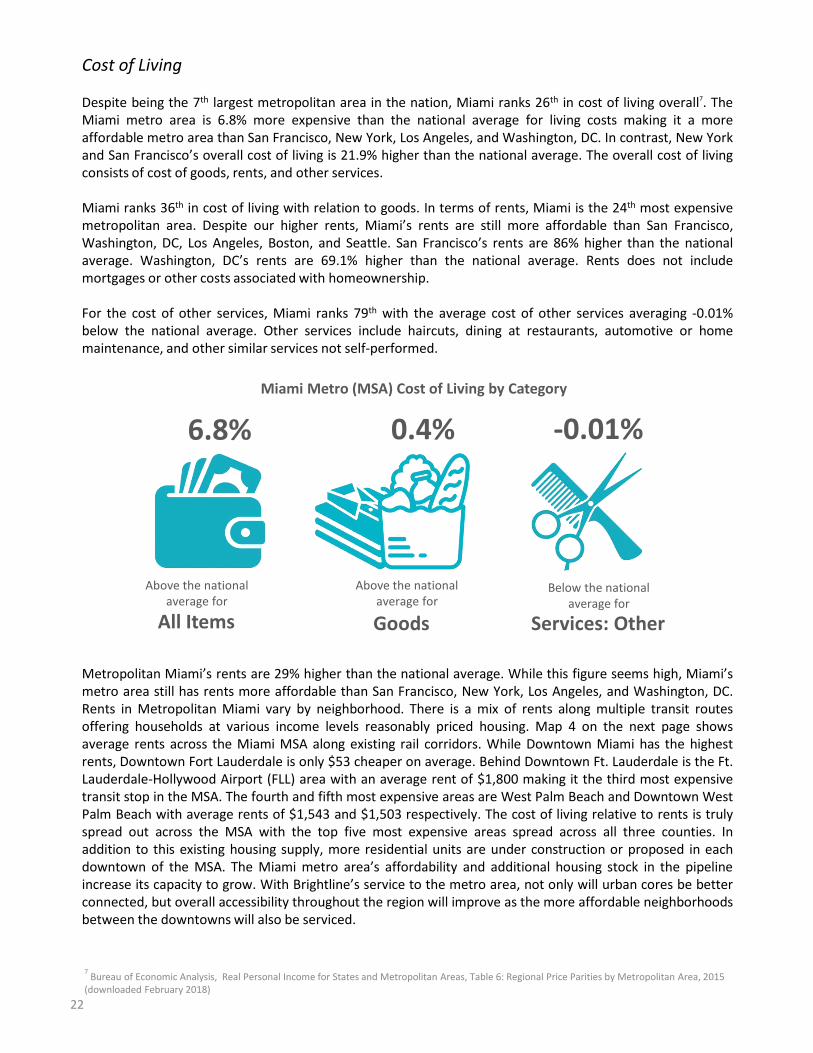
Despite being the 7th largest metropolitan area in the nation, Miami ranks 26th in cost of living overall7. TheMiami metro area is 6.8% more expensive than the national average for living costs making it a moreaffordable metro area than San Francisco, New York, Los Angeles, and Washington, DC. In contrast, New Yorkand San Francisco’s overall cost of living is 21.9% higher than the national average. The overall cost of livingconsists of cost of goods, rents, and other services.
Miami ranks 36th in cost of living with relation to goods. In terms of rents, Miami is the 24th most expensivemetropolitan area. Despite our higher rents, Miami’s rents are still more affordable than San Francisco,Washington, DC, Los Angeles, Boston, and Seattle. San Francisco’s rents are 86% higher than the nationalaverage. Washington, DC’s rents are 69.1% higher than the national average. Rents does not includemortgages or other costs associated with homeownership.
For the cost of other services, Miami ranks 79th with the average cost of other services averaging -0.01%below the national average. Other services include haircuts, dining at restaurants, automotive or homemaintenance, and other similar services not self-performed.
7Bureau of Economic Analysis, Real Personal Income for States and Metropolitan Areas, Table 6: Regional Price Parities by Metropolitan Area, 2015
(downloaded February 2018)
Miami Metro (MSA) Cost of Living by Category
All Items Goods Services: Other
6.8% 0.4% -0.01%
Above the national average for
Above the national average for
Below the national average for
Metropolitan Miami’s rents are 29% higher than the national average. While this figure seems high, Miami’smetro area still has rents more affordable than San Francisco, New York, Los Angeles, and Washington, DC.Rents in Metropolitan Miami vary by neighborhood. There is a mix of rents along multiple transit routesoffering households at various income levels reasonably priced housing. Map 4 on the next page showsaverage rents across the Miami MSA along existing rail corridors. While Downtown Miami has the highestrents, Downtown Fort Lauderdale is only $53 cheaper on average. Behind Downtown Ft. Lauderdale is the Ft.Lauderdale-Hollywood Airport (FLL) area with an average rent of $1,800 making it the third most expensivetransit stop in the MSA. The fourth and fifth most expensive areas are West Palm Beach and Downtown WestPalm Beach with average rents of $1,543 and $1,503 respectively. The cost of living relative to rents is trulyspread out across the MSA with the top five most expensive areas spread across all three counties. Inaddition to this existing housing supply, more residential units are under construction or proposed in eachdowntown of the MSA. The Miami metro area’s affordability and additional housing stock in the pipelineincrease its capacity to grow. With Brightline’s service to the metro area, not only will urban cores be betterconnected, but overall accessibility throughout the region will improve as the more affordable neighborhoodsbetween the downtowns will also be serviced.
22
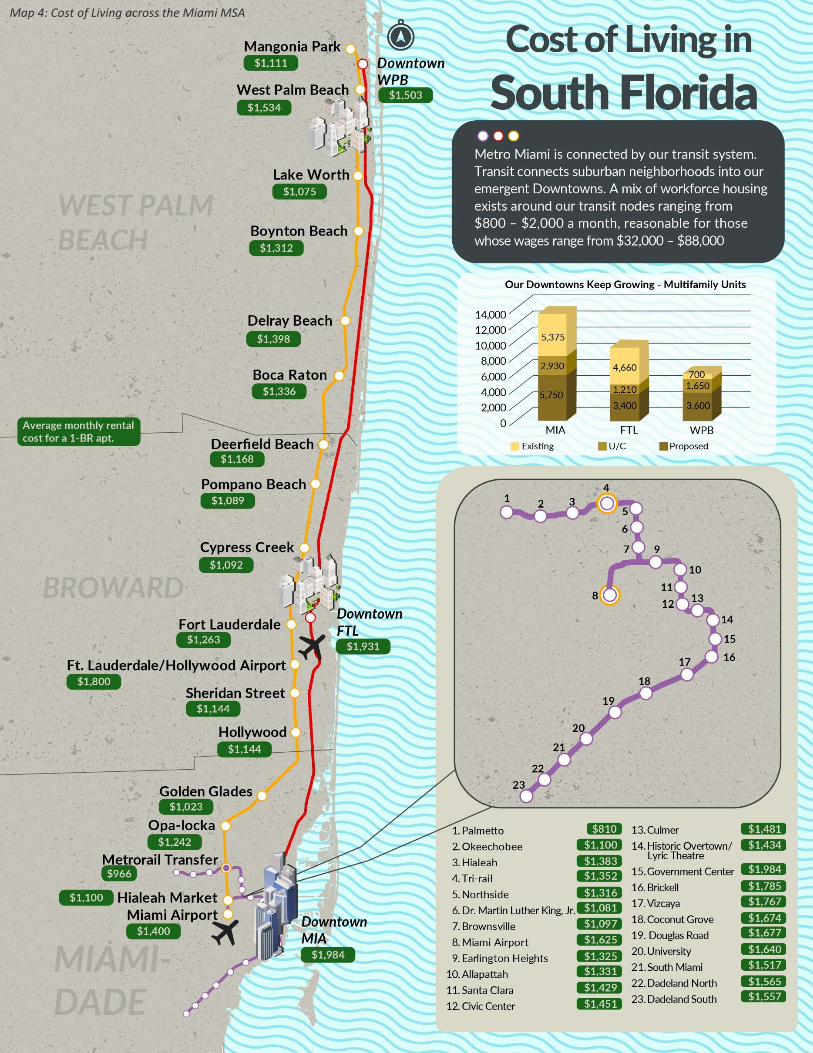
Map 4: Cost of Living across the Miami MSA
Migration
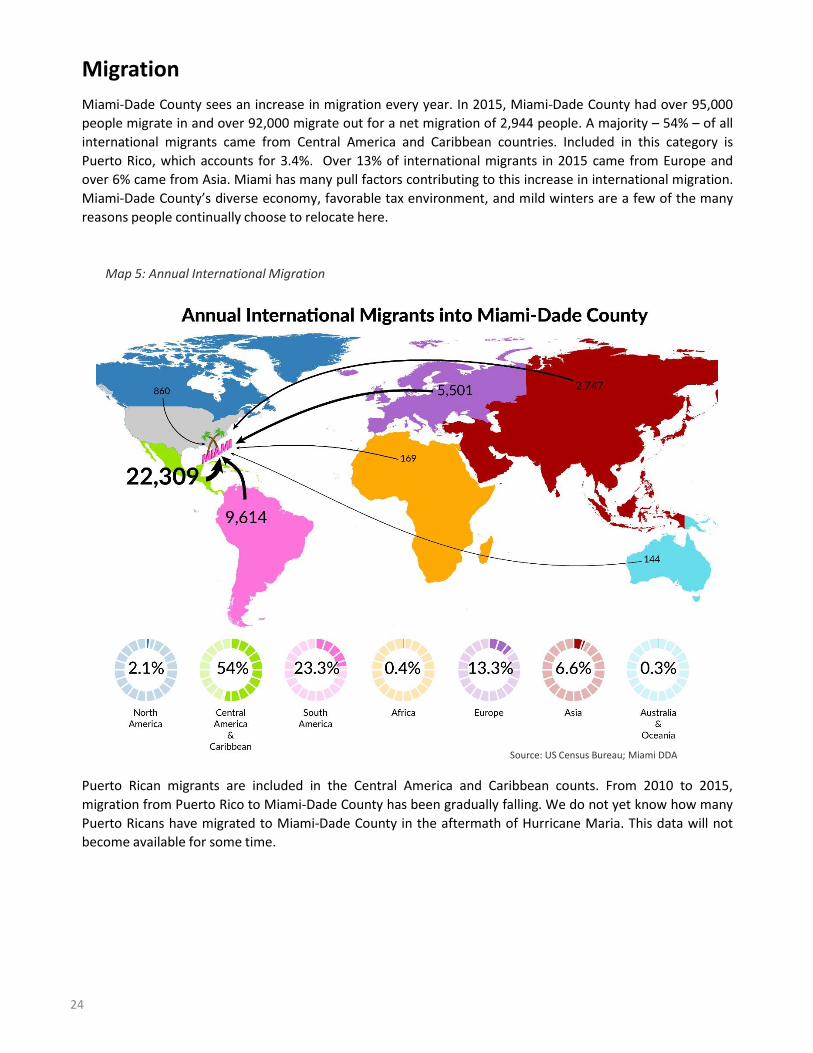
Miami-Dade County sees an increase in migration every year. In 2015, Miami-Dade County had over 95,000
people migrate in and over 92,000 migrate out for a net migration of 2,944 people. A majority – 54% – of all
international migrants came from Central America and Caribbean countries. Included in this category is
Puerto Rico, which accounts for 3.4%. Over 13% of international migrants in 2015 came from Europe and
over 6% came from Asia. Miami has many pull factors contributing to this increase in international migration.
Miami-Dade County’s diverse economy, favorable tax environment, and mild winters are a few of the many
reasons people continually choose to relocate here.
Map 5: Annual International Migration
Puerto Rican migrants are included in the Central America and Caribbean counts. From 2010 to 2015,
migration from Puerto Rico to Miami-Dade County has been gradually falling. We do not yet know how many
Puerto Ricans have migrated to Miami-Dade County in the aftermath of Hurricane Maria. This data will not
become available for some time.
Source: US Census Bureau; Miami DDA
24

Top Counties of Out-Migration from Miami-Dade County
State County # of Annual Out-Migrants
Florida Broward County 24,353
Florida Palm Beach County 4,372
Florida Orange County 4,013
Florida Hillsborough County 1,987
Florida Collier County 1,766
California Los Angeles County 1,683
Texas Harris County 1,624
Florida Alachua County 1,427
Florida Lee County 1,257
Florida Leon County 1,102
Florida Duval County 1,031
New York New York County 934
Florida Volusia County 863
Illinois Cook County 768
Florida St. Lucie County 736
Table 17: Top Sources of Out-Migration, 2015
Table 18 shows the top 15 sources of in-migration for Miami-Dade County residents. Miami-Dade County’s
main source of domestic in-migration is Broward County. Outside of the metropolitan area, residents are
leaving the New York metro area as seen by the number of in-migrants coming from New York County, Kings
County, Bronx County, and Passaic County. Miami’s weather and business-friendly environment are major
pull factors for migration from the northeast region.
Top Counties of In-Migration to Miami-Dade CountyState County # of Annual In-Migrants
Florida Broward County 10,249
Florida Palm Beach County 1,972
Florida Orange County 1,801
New York New York County 1,360
Florida Hillsborough County 1,319
New York Kings County 1,234
Florida Leon County 921
Florida Monroe County 895
Florida Lee County 756
Massachusetts Suffolk County 684
Illinois Cook County 667
California Los Angeles County 660
Florida Marion County 650
New York Bronx County 642
New Jersey Passaic County 628
Table 18: Top Sources of In-Migration, 2015
Out-migration is a factor of every city as people constantly move and relocate. Migration is natural for the
economy to see people move in-and-out. The majority of residents leaving Miami-Dade County migrate to
Broward County. Table 17 shows the top 15 sources of out-migration for Miami-Dade County residents. Many
of the counties below have one thing in common: major universities. We believe Miami-Dade County
residents who leave for Orange, Hillsborough, Collier, Alachua, and Leon County are choosing these places for
major universities, such as Florida State University, University of Florida, and University of Central Florida.
Source: US Census Bureau; Miami DDA
Source: US Census Bureau; Miami DDA
25

Income
Greater Downtown households earn more than the average households of the City of Miami and Miami-Dade
County. Average households in Greater Downtown earn $31,258 more than City of Miami households and
$18,023 more than Miami-Dade County households.
Table 19: Income Levels
In comparison to the City and County, Greater Downtown has seen the largest increase in median household
income with a 55% increase from 2010 to 2018.
Greater Downtown Nominal Income Changes
Income Changes Greater Downtown City of Miami Miami-Dade County
2010 2018 2010 2018 2010 2018
Per Capita Income $39,135 $52,200 $20,886 $28,401 $23,304 $28,694
Median Household Income $49,333 $76,610 $29,762 $32,937 $43,464 $48,499
Average Household Income $77,644 $93,827 $51,107 $62,569 $65,799 $75,804
Table 20: Changes in Income
Greater Downtown Income Growth, 2010-2018
Income Changes Greater Downtown City of Miami Miami-Dade County
% Change CAGR % Change CAGR % Change CAGR
Per Capita Income 33% 4% 36% 4% 23% 3%
Median Household Income 55% 6% 11% 1% 12% 1%
Average Household Income 21% 2% 22% 3% 15% 2%
Table 21: Income Growth
Greater Downtown Income, 2018
Area Per Capita Income Median Household Income Average Household Income
DDA $63,548 $87,194 $110,658
Arts & Ent $64,970 $95,048 $103,005
Brickell $68,043 $89,265 $120,523
CBD $49,191 $78,931 $97,103
Greater Downtown $52,200 $76,610 $93,827
City of Miami $28,401 $32,937 $62,569
Miami-Dade County $28,694 $48,499 $75,804 Source: ESRI BAO; Synergos PopStats; Miami DDA
Source: ESRI BAO; Synergos PopStats; Miami DDA
Source: ESRI BAO; Synergos PopStats; Miami DDA
26
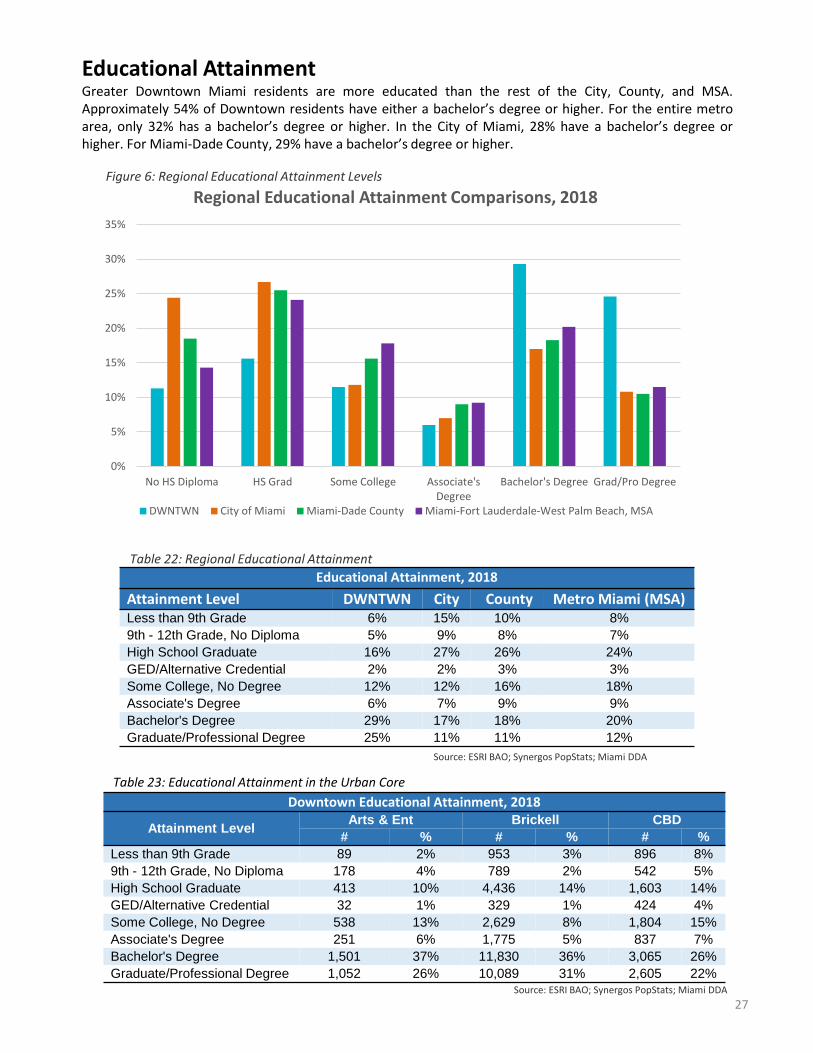
Educational AttainmentGreater Downtown Miami residents are more educated than the rest of the City, County, and MSA.Approximately 54% of Downtown residents have either a bachelor’s degree or higher. For the entire metroarea, only 32% has a bachelor’s degree or higher. In the City of Miami, 28% have a bachelor’s degree orhigher. For Miami-Dade County, 29% have a bachelor’s degree or higher.
0%
5%
10%
15%
20%
25%
30%
35%
No HS Diploma HS Grad Some College Associate'sDegree
Bachelor's Degree Grad/Pro Degree
Regional Educational Attainment Comparisons, 2018
DWNTWN City of Miami Miami-Dade County Miami-Fort Lauderdale-West Palm Beach, MSA
Figure 6: Regional Educational Attainment Levels
Educational Attainment, 2018
Attainment Level DWNTWN City County Metro Miami (MSA)Less than 9th Grade 6% 15% 10% 8%
9th - 12th Grade, No Diploma 5% 9% 8% 7%
High School Graduate 16% 27% 26% 24%
GED/Alternative Credential 2% 2% 3% 3%
Some College, No Degree 12% 12% 16% 18%
Associate's Degree 6% 7% 9% 9%
Bachelor's Degree 29% 17% 18% 20%
Graduate/Professional Degree 25% 11% 11% 12%
Table 23: Educational Attainment in the Urban Core
Downtown Educational Attainment, 2018
Attainment LevelArts & Ent Brickell CBD
# % # % # %
Less than 9th Grade 89 2% 953 3% 896 8%
9th - 12th Grade, No Diploma 178 4% 789 2% 542 5%
High School Graduate 413 10% 4,436 14% 1,603 14%
GED/Alternative Credential 32 1% 329 1% 424 4%
Some College, No Degree 538 13% 2,629 8% 1,804 15%
Associate's Degree 251 6% 1,775 5% 837 7%
Bachelor's Degree 1,501 37% 11,830 36% 3,065 26%
Graduate/Professional Degree 1,052 26% 10,089 31% 2,605 22%
Table 22: Regional Educational Attainment
Source: ESRI BAO; Synergos PopStats; Miami DDA
Source: ESRI BAO; Synergos PopStats; Miami DDA
27

Pet Ownership
Downtown Miami’s urban dwellers love their pets just as much as any family in the suburbs. As of 2018, the
DDA estimates just under 40% of households owns at least one pet. That accounts for an eight percent
growth in households with pets from 2016 alone. Dogs account for 60% of all pet-owning households in
Downtown Miami, 73% in the City of Miami, and 77% in Miami-Dade County.
Greater Downtown Pet Ownership TrendsHH Type 2016 2018 Change
HH owns any pet 17,930 19,285 8%
HH owns any bird 704 742 5%
HH owns any cat 7,863 8,063 3%
HH owns any dog 11,058 12,242 11%
Table 24: Greater Downtown Pet Ownership Growth
Local Pet OwnershipMiami-Dade County City of Miami Greater Downtown
Pet Ownership # % of total # % of total # % of total
HH owns any pet 442,109 47% 71,959 40% 19,285 39%
HH owns any bird 23,751 3% 4,044 2% 742 1%
HH owns any cat 150,610 16% 25,298 14% 8,063 16%
HH owns any dog 341,726 37% 52,491 29% 12,242 25%
Table 25: Local Pet Ownership
Source: ESRI BAO; Miami DDA
Source: ESRI BAO; Miami DDA
28
Local Exercising Trends
Greater Downtown City of Miami Miami-Dade County
Time # % of total # % of total # % of total
1-3 hours 18,057 22% 81,133 22% 487,573 23%
4-6 hours 18,026 22% 65,074 18% 414,285 19%
7+ hours 20,282 25% 73,575 20% 453,754 21%
Total 56,365 69% 219,782 60% 1,355,612 63%
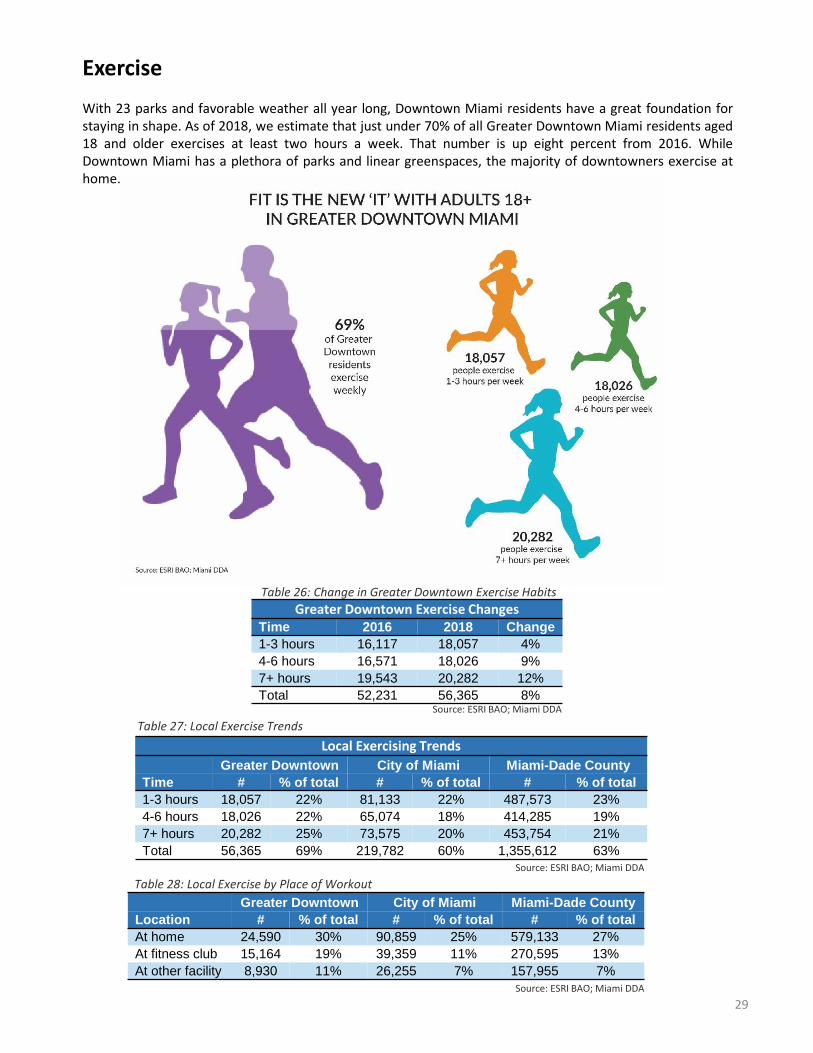
Greater Downtown Exercise ChangesTime 2016 2018 Change
1-3 hours 16,117 18,057 4%
4-6 hours 16,571 18,026 9%
7+ hours 19,543 20,282 12%
Total 52,231 56,365 8%
Greater Downtown City of Miami Miami-Dade County
Location # % of total # % of total # % of total
At home 24,590 30% 90,859 25% 579,133 27%
At fitness club 15,164 19% 39,359 11% 270,595 13%
At other facility 8,930 11% 26,255 7% 157,955 7%
Table 27: Local Exercise Trends
Table 26: Change in Greater Downtown Exercise Habits
Table 28: Local Exercise by Place of Workout
Source: ESRI BAO; Miami DDA
Source: ESRI BAO; Miami DDA
Source: ESRI BAO; Miami DDA
Exercise
With 23 parks and favorable weather all year long, Downtown Miami residents have a great foundation forstaying in shape. As of 2018, we estimate that just under 70% of all Greater Downtown Miami residents aged18 and older exercises at least two hours a week. That number is up eight percent from 2016. WhileDowntown Miami has a plethora of parks and linear greenspaces, the majority of downtowners exercise athome.
29

APPENDIX
Appendix
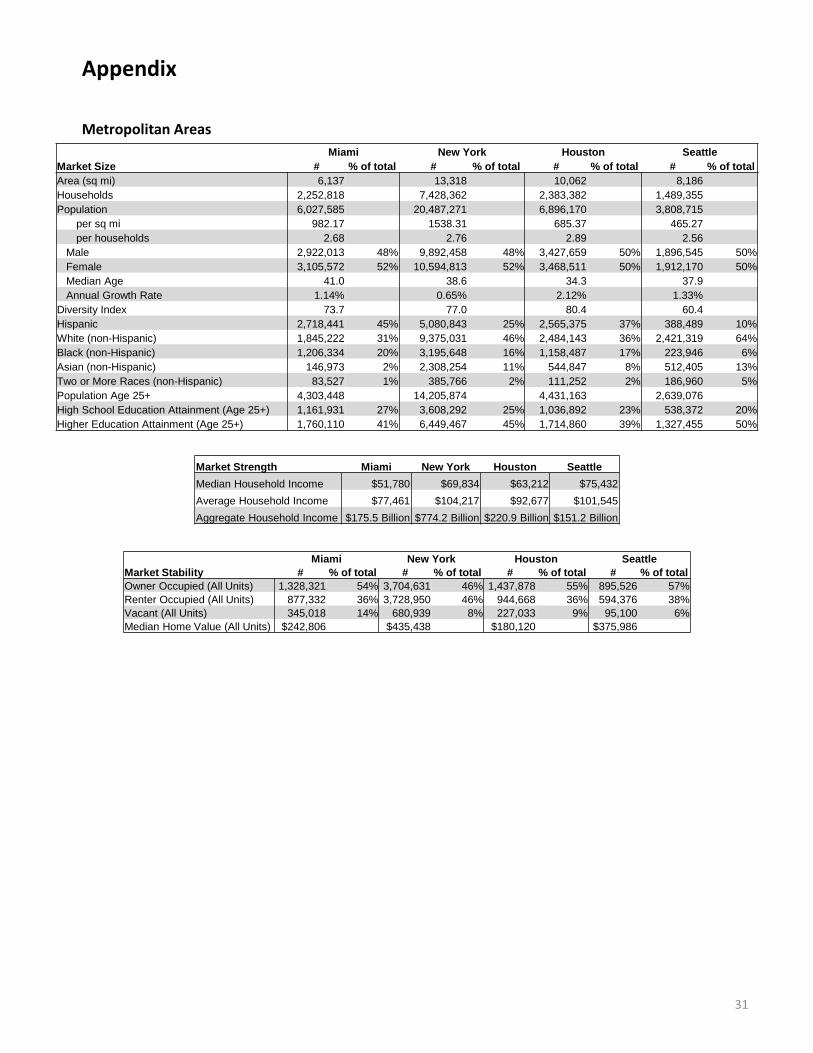
Miami New York Houston Seattle
Market Size # % of total # % of total # % of total # % of total
Area (sq mi) 6,137 13,318 10,062 8,186
Households 2,252,818 7,428,362 2,383,382 1,489,355
Population 6,027,585 20,487,271 6,896,170 3,808,715
per sq mi 982.17 1538.31 685.37 465.27
per households 2.68 2.76 2.89 2.56
Male 2,922,013 48% 9,892,458 48% 3,427,659 50% 1,896,545 50%
Female 3,105,572 52% 10,594,813 52% 3,468,511 50% 1,912,170 50%
Median Age 41.0 38.6 34.3 37.9
Annual Growth Rate 1.14% 0.65% 2.12% 1.33%
Diversity Index 73.7 77.0 80.4 60.4
Hispanic 2,718,441 45% 5,080,843 25% 2,565,375 37% 388,489 10%
White (non-Hispanic) 1,845,222 31% 9,375,031 46% 2,484,143 36% 2,421,319 64%
Black (non-Hispanic) 1,206,334 20% 3,195,648 16% 1,158,487 17% 223,946 6%
Asian (non-Hispanic) 146,973 2% 2,308,254 11% 544,847 8% 512,405 13%
Two or More Races (non-Hispanic) 83,527 1% 385,766 2% 111,252 2% 186,960 5%
Population Age 25+ 4,303,448 14,205,874 4,431,163 2,639,076
High School Education Attainment (Age 25+) 1,161,931 27% 3,608,292 25% 1,036,892 23% 538,372 20%
Higher Education Attainment (Age 25+) 1,760,110 41% 6,449,467 45% 1,714,860 39% 1,327,455 50%
Metropolitan Areas
Market Strength Miami New York Houston Seattle
Median Household Income $51,780 $69,834 $63,212 $75,432
Average Household Income $77,461 $104,217 $92,677 $101,545
Aggregate Household Income $175.5 Billion $774.2 Billion $220.9 Billion $151.2 Billion
Miami New York Houston Seattle
Market Stability # % of total # % of total # % of total # % of total
Owner Occupied (All Units) 1,328,321 54% 3,704,631 46% 1,437,878 55% 895,526 57%
Renter Occupied (All Units) 877,332 36% 3,728,950 46% 944,668 36% 594,376 38%
Vacant (All Units) 345,018 14% 680,939 8% 227,033 9% 95,100 6%
Median Home Value (All Units) $242,806 $435,438 $180,120 $375,986
31

Appendix
Florida Cities
Miami Jacksonville Orlando Tampa
Market Size # % of total # % of total # % of total # % of total
Area (sq mi) 36 747 102 112
Households 181,124 345,890 119,938 149,611
Population 449,517 886,969 283,852 370,224
per sq mi 12486.58 1187.37 2782.86 3305.57
per households 2.48 2.56 2.37 2.47
Male 224,173 50% 430,507 49% 139,604 49% 181,522 49%
Female 225,343 50% 456,459 51% 144,249 51% 188,701 51%
Median Age 39.4 36.7 34.4 35.6
Annual Growth Rate 1.38% 1.11% 2.01% 1.45%
Diversity Index 66.1 64.8 77 72.5
Hispanic 329,946 73% 86,923 10% 84,588 30% 95,518 26%
White (non-Hispanic) 49,986 11% 459,449 52% 105,888 37% 158,501 43%
Black (non-Hispanic) 67,797 15% 267,686 30% 73,507 26% 90,373 24%
Asian (non-Hispanic) 4,719 1% 43,760 5% 11,173 4% 15,577 4%
Two or More Races (non-Hispanic) 3,413 1% 23,530 3% 6,194 2% 8,376 2%
Population Age 25+ 330,742 600,623 193,735 246,697
High School Education Attainment (Age 25+) 95,584 29% 171,778 29% 48,627 25% 63,401 26%
Higher Education Attainment (Age 25+) 115,098 35% 229,438 38% 89,312 46% 110,027 45%
Market Strength Miami Jacksonville Orlando Tampa
Median Household Income $34,975 $50,562 $45,214 $47,219
Average Household Income $59,552 $68,815 $67,935 $75,904
Aggregate Household Income $10.8 Billion $23.8 Billion $8.1 Billion $11.4 Billion
Miami Jacksonville Orlando Tampa
Market Stability # % of total # % of total # % of total # % of total
Owner Occupied (All Units) 51,150 28% 196,271 51% 44,010 32% 69,099 41%
Renter Occupied (All Units) 116,100 63% 149,724 39% 75,980 55% 80,530 47%
Vacant (All Units) 24,287 13% 41,892 11% 18,407 13% 20,986 12%
Median Home Value (All Units) $263,222 $171,638 $207,683 $199,244
32

Appendix
Greater Downtown & Surrounding Areas
Greater Downtown One-Mile Radius Three-Mile Radius Five-Mile Radius
Market Size # % of total # % of total # % of total # % of total
Area (sq mi) 3.8 3.1 31.4 110
Households 47,958 34,075 105,577 208,204
Population 92,235 66,163 243,669 495,543
per sq mi 24,272 21,343 7,760 4,505
per households 1.92 1.94 2.31 2.38
Male 49,215 53% 34,769 53% 124,204 51% 249,253 50%
Female 46,147 50% 31,394 47% 119,464 49% 246,291 50%
Median Age 37.0 35.5 38.0 38.9
Annual Growth Rate 2.66% 2.63% 1.67% 1.36%
Diversity Index 70.9 66.6 60.8 68.7
Hispanic 54,511 59% 43,535 66% 184,944 76% 333,997 67%
White (non-Hispanic) 21,338 23% 13,545 20% 32,358 13% 70,895 14%
Black (non-Hispanic) 12,355 13% 6,553 10% 20,443 8% 79,141 16%
Asian (non-Hispanic) 2,325 3% 1,560 2% 3,365 1% 6,002 1%
Two or More Races (non-Hispanic) 1,287 1% 676 1% 1,865 1% 4,021 1%
Population Age 25+ 72,886 50,874 207,396 365,797
High School Education Attainment (Age 25+) 12,682 17% 13,685 27% 55,790 27% 100,960 28%
Higher Education Attainment (Age 25+) 43,659 60% 27,981 55% 80,884 39% 138,637 38%
Market Strength Greater Downtown One-Mile Radius Three-Mile Radius Five-Mile Radius
Median Household Income $56,437 $51,632 $36,923 $36,762
Average Household Income $85,215 $79,244 $63,872 $63,279
Aggregate Household Income $4.2 Billion $2.7 Billion $6.8 Billion $13.1 Billion
Greater Downtown One-Mile Radius Three-Mile Radius
Market Stability # % of total # % of total # % of total
Owner Occupied (All Units) 10,247 16% 5,516 13% 22,831 18%
Renter Occupied (All Units) 39,531 63% 28,573 66% 82,714 66%
Vacant (All Units) 13,409 21% 9,007 21% 19,213 15%
Median Home Value (All Units) $316,614 $312,911 $283,948
33
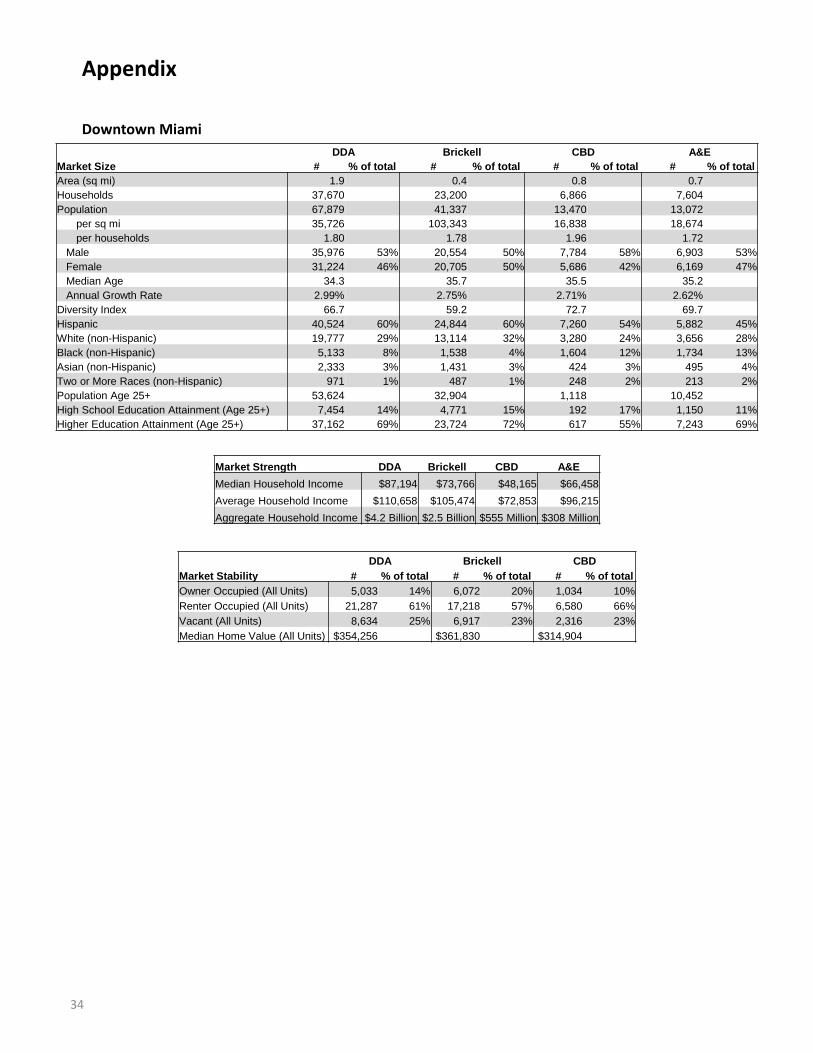
Appendix
Downtown Miami
DDA Brickell CBD A&E
Market Size # % of total # % of total # % of total # % of total
Area (sq mi) 1.9 0.4 0.8 0.7
Households 37,670 23,200 6,866 7,604
Population 67,879 41,337 13,470 13,072
per sq mi 35,726 103,343 16,838 18,674
per households 1.80 1.78 1.96 1.72
Male 35,976 53% 20,554 50% 7,784 58% 6,903 53%
Female 31,224 46% 20,705 50% 5,686 42% 6,169 47%
Median Age 34.3 35.7 35.5 35.2
Annual Growth Rate 2.99% 2.75% 2.71% 2.62%
Diversity Index 66.7 59.2 72.7 69.7
Hispanic 40,524 60% 24,844 60% 7,260 54% 5,882 45%
White (non-Hispanic) 19,777 29% 13,114 32% 3,280 24% 3,656 28%
Black (non-Hispanic) 5,133 8% 1,538 4% 1,604 12% 1,734 13%
Asian (non-Hispanic) 2,333 3% 1,431 3% 424 3% 495 4%
Two or More Races (non-Hispanic) 971 1% 487 1% 248 2% 213 2%
Population Age 25+ 53,624 32,904 1,118 10,452
High School Education Attainment (Age 25+) 7,454 14% 4,771 15% 192 17% 1,150 11%
Higher Education Attainment (Age 25+) 37,162 69% 23,724 72% 617 55% 7,243 69%
Market Strength DDA Brickell CBD A&E
Median Household Income $87,194 $73,766 $48,165 $66,458
Average Household Income $110,658 $105,474 $72,853 $96,215
Aggregate Household Income $4.2 Billion $2.5 Billion $555 Million $308 Million
DDA Brickell CBD
Market Stability # % of total # % of total # % of total
Owner Occupied (All Units) 5,033 14% 6,072 20% 1,034 10%
Renter Occupied (All Units) 21,287 61% 17,218 57% 6,580 66%
Vacant (All Units) 8,634 25% 6,917 23% 2,316 23%
Median Home Value (All Units) $354,256 $361,830 $314,904
34

Sources

Data Sources
Sources Topic
Synergos PopStats; Esri BAO; Miami DDA Population Growth
Synergos PopStats; Miami DDA Population Distribution
Syngergos PopStats; Esri BAO; Miami DDA Age Composition
Synergos PopStats; Esri BAO; Miami DDA Household Growth
Synergos PopStats; Esri BAO; Miami DDA Household Trends
US Census Bureau OnTheMap; Miami DDA Employment & Labor
Synergos WorkStats; Miami DDA Daytime Population
Bureau of Economic Analysis; Miami DDA Cost of Living
US Census Bureau PUMS; Miami DDA Migration
Synergos PopStats; Esri BAO; Miami DDA Income
Esri BAO; Miami DDA Educational Attainment
Esri BAO; Miami DDA Pet Ownership
Esri BAO; Miami DDA Exercise
References
Pete Saunders, Forbes, “Where Educated Millennials Are Moving,” Jan 12, 2017
Joe Cortright, CityLab, “No, Young People Aren’t Fleeing Cities,” Dec 20, 2017
Melody Hahm, Yahoo Finance, “Older millennials are leaving the city for a new kind of suburb,” Aug 7, 2017
William H. Frey, The Brookings Institute, The millennial generation: A demographic bridge to America’s diverse future,” Jan 2018
Melia Robinson, Business Insider, “30 photos show the extreme lengths millennials will go to live in cities instead of the suburbs,” Nov 8, 2017
David Johnson, Time, “The 25 Cities Where Millennials Are Moving,” Jun 13, 2017
Grace Guarnieri, Newsweek, “Why are people leaving cities? U.S. mayors blame housing costs,” Jan 24, 2018
Neil Howe, Forbes, “Are You Born To Be Better Off Than Your Parents? (Part 1 of “Generations in Pursuit of the American Dream”),” Jul 16, 2014
Neil Howe, Forbes, “The Boom Generation, “What a Long Strange Trip” (Part 4 of 7),” Aug 20, 2014
Neil Howe, Forbes, “Generation X: Once Xtreme, Now Exhausted (Part 5 of 7),” Aug 27, 2014
Neil Howe, Forbes, “The Millennial Generation, “Keep Calm and Carry On” (Part 6 of 7),” Sep 4, 2014
Neil Howe, Forbes, “Introducing the Homeland Generation (Part 1 of 2),” Oct 27, 2014
Samantha Raphelson, NPR, “From GIs To Gen Z (Or Is It iGen?): How Generations Get Nicknames,” Oct 6, 2014
Alex Williams, The New York Times, “Meet Alpha: The Next ‘Next Generation’,” Sep 15, 2015
Ann & Robert H. Lurie Children’s Hospital of Chicago Gender & Sex Development Program, Terminology for Discussing Gender, 2018
Sources
36

37
Photo Credits
Name Page of Image
Kathryn Angleton Cover Page
Valerie Lopez Page 9
Kathryn Angleton Page 10
Florida East Coast Industries Page 15
Valerie Lopez Page 18
Generational Demarcations
Generation Years Source Years Source Years Source
GI/Greatest Generation 1883-1900 Strauss-Howe 1901-1924 NPR 1901-1925 DDA
Silent Generation 1925-1945 Strauss-Howe 1925-1942 NPR 1926-1945 DDA
Baby Boomers 1943-1960 Strauss-Howe 1943-1964 NPR 1946-1964 DDA
Gen X 1961-1981 Strauss-Howe 1965-1979 NPR 1965-1980 DDA
Millennials 1982-2004 Strauss-Howe 1980-2000 NPR 1981-1998 DDA
Gen Z 2005- Strauss-Howe 2001-2013 NPR 1999-2013 DDA
Gen Alpha N/A Strauss-Howe N/A NPR 2014- DDA
Sources

Contact Information:200 S. Biscayne Blvd, Suite 2929Miami, Florida 33131
T – 305.579.6675F – 305.371.2423W – MiamiDDA.com